Embed Size (px)
Citation preview
JOURNAL OF BACTERIOLOGY, July 2009, p. 4097–4102 Vol. 191, No. 130021-9193/09/$08.00�0 doi:10.1128/JB.00717-08Copyright © 2009, American Society for Microbiology. All Rights Reserved.
Interactions of DNA with Biofilm-Derived Membrane Vesicles�†Sarah R. Schooling,1,2,3* Amanda Hubley,2 and Terry J. Beveridge2,3
Departments of Physics,1 Molecular & Cellular Biology,2 and Advanced Foods and Materials Network, Networks of Centres ofExcellence,3 College of Biological Science, University of Guelph, Guelph, Ontario N1G 2W1, Canada
Received 21 May 2008/Accepted 24 April 2009
The biofilm matrix contributes to the chemistry, structure, and function of biofilms. Biofilm-derived mem-brane vesicles (MVs) and DNA, both matrix components, demonstrated concentration-, pH-, and cation-dependent interactions. Furthermore, MV-DNA association influenced MV surface properties. This bearsconsequences for the reactivity and availability for interaction of matrix polymers and other constituents.
The biofilm matrix contributes to the chemistry, structure,and function of biofilms and is crucial for the development offundamental biofilm properties (46, 47). Early studies definedpolysaccharides as the matrix component, but proteins, lipids,and nucleic acids are all now acknowledged as important con-tributors (7, 15). Indeed, DNA has emerged as a vital partici-pant, fulfilling structural and functional roles (1, 5, 6, 19, 31, 34,36, 41, 43, 44). The phosphodiester bond of DNA renders thispolyanionic at a physiological pH, undoubtedly contributing tointeractions with cations, humic substances, fine-dispersedminerals, and matrix entities (25, 41, 49).
In addition to particulates such as flagella and pili, mem-brane vesicles (MVs) are also found within the matrices ofgram-negative and mixed biofilms (3, 16, 40). MVs are multi-functional bilayered structures that bleb from the outer mem-branes of gram-negative bacteria (reviewed in references 4, 24,27, 28, and 30) and are chemically heterogeneous, combiningthe known chemistries of the biofilm matrix. Examination ofbiofilm samples by transmission electron microscopy (TEM)has suggested that matrix material interacts with MVs (Fig. 1).Since MVs produced in planktonic culture have associatedDNA (11, 12, 13, 20, 21, 30, 39, 48), could biofilm-derived MVsincorporate DNA (1, 39, 40, 44)?
MATERIALS AND METHODS
Biofilm growth and isolation and purification of matrix and MVs. Pseudomo-nas aeruginosa PAO1 and green fluorescent protein-tagged PAO1 (17) biofilmswere grown using the agar plate model (40). Matrix was isolated (40) andsequentially filtered through 0.22-, 0.45-, and 1.2-�m cellulose acetate filters andthe filtrate collected. Absence of cells was confirmed by plating 100-�l aliquots(18 h at 37°C; trypticase soy agar; n � 3) and TEM of whole-mount preparations(see below). Matrix for characterization was dialyzed (24 h at 4°C; Spectraporregenerated cellulose dialysis membranes [molecular mass cutoff, 3,000 Da];Fisher). Particulate components were harvested by ultracentrifugation(125,000 � g for 1.5 h at 5°C; Beckman Ti45 rotor), the pellets resuspended in30% (vol/vol) Optiprep (Sigma), and the components separated on Optiprepdensity gradients (2) at 0% (1 ml), 18% (1 ml), 20% (1 ml), 22.5% (3 ml), 25%(3 ml), 27.5% (3 ml), 30% (3 ml), and 50% (1 ml) (vol/vol). All Optiprep
solutions contained 10 mM HEPES, 0.85% (wt/vol) NaCl (pH 7.4). Sampleswere centrifuged to equilibrium (100,000 � g for 16 h at 5°C; Beckman SW28.1rotor) and fractionated (200-�l aliquots) and whole mounts assessed by TEM(see below). MV-containing fractions were combined, washed twice in water(125,000 � g for 1.5 h at 5°C; Beckman Ti45 rotor), resuspended in water, andfrozen.
Quantitative and biochemical characterization. Dry samples were obtained byfreeze drying.
Protein was quantified using a micro-bicinchoninic acid protein assay kit(Pierce Bioassay; n � 3).
DNA was quantified by a modified PicoGreen assay (Molecular Probes, In-vitrogen) (23); 1:100 GES (5 M guanidinium thiocyanate, 100 mM EDTA, 0.5%[vol/vol] Sarkosyl) yielded optimal results. Independent samples were assayedusing a Spex fluorescence spectrophotometer (excitation �, 480 nm; emission �,523 nm); the slit widths were 4 and 8 nm, respectively. MVs were treated withDNase I (Roche) to degrade externally associated DNA which was susceptible,establishing internal/external DNA content (12, 13, 20, 23, 39). Fifty microgramsof MV protein (10 ml 50 mM HEPES buffer, pH 6.8, 10 mM MgCl2) wasdigested with 400 �g DNase � ml�1 (2 h at 37°C and 125 rpm), and MVs wereharvested by ultracentrifugation. TEM and sodium dodecyl sulfate-polyacryl-amide gel electrophoresis indicated no gross changes (data not shown). Hence-forth, DNase-treated MVs are referred to as “DNase-treated MVs” and un-treated MVs as “native MVs.”
Zeta potential analysis. The relative surface charges of MVs were estimatedusing a Zetasizer Nano ZS particle analyzer (Malvern Scientific). The micro-electrophoresis cell was filled with 8 �g of MV protein � ml�1 HEPES buffer (10,50, or 100 mM; 4.4 to 9.8 pH units). A voltage difference of 150 V was appliedacross the chamber. Five readings were done on each of three independentsamples.
Titration analysis. Available surface ligands were estimated by titration anal-ysis (37). Three independent wet samples, each equivalent to 40 mg (dry weight),were titrated.
Isolation of DNA. Three grams of biofilm (wet weight) was resuspended in 40ml of lysis buffer (10 mM Tris, 10 mM EDTA, 2% sodium dodecyl sulfate, 150mM NaCl), an equal volume of phenol-chloroform-isoamyl alcohol (25:24:1,vol/vol/vol) was added, and the phases were mixed gently (10 min) and thencentrifuged (12,000 � g for 20 min) (32, 38, 45). A 1/100 volume of 5 M NaCl wasadded to the collected upper aqueous phase, extracted with an equal volume ofchloroform-isoamyl alcohol (24:1, vol/vol), and centrifuged and the aqueousphase collected. Chloroform-isoamyl alcohol extraction was repeated if materialwas present at the interface. DNA was precipitated by adding 2 volumes ofice-cold 100% ethanol, the phases were gently mixed, and DNA was spooledonto a glass rod and dissolved in and dialyzed against nanopure water (24 h at4°C; Spectrapor regenerated cellulose dialysis membranes [molecular mass cut-off, 3,000 Da; Fisher). Solutions having absorbance maximum ratios for nucleicacids/proteins (A260/A280) of �1.8 were considered of adequate purity. Concen-tration was estimated by the PicoGreen assay.
DNA binding studies. MV and exogenous DNA interactions were assessed byincubating aliquots of MVs and DNA together. Difficulties were encounteredisolating DNA from matrix (see Results and Discussion). Since extracellularDNA is similar to whole-genome DNA (1), DNA was isolated from biofilms.MVs were incubated with DNA (1 h at 37°C and 50 rpm) in HEPES buffer (50mM; pH 5.6, 6.0, 6.4, 6.8, 7.2, or 7.6, adjusted with HCl or NaOH), supplementedwith NaCl (0.1 to 100 mM) or MgCl2 (0.1 to 100 mM) where indicated. After
* Corresponding author. Mailing address: Departments of Physics,Molecular & Cellular Biology, and AFMNet-NCE, College of Biolog-ical Science, University of Guelph, Guelph, Ontario N1G 2W1, Can-ada. Phone: (519) 824-4120, ext. 58904. Fax: (519) 837-1802. E-mail:[email protected].
† This paper is dedicated to the late Terry Beveridge, friend andmentor, and a belief of science—“isn’t this fun?”
� Published ahead of print on 8 May 2009.
4097
on February 18, 2020 by guest
http://jb.asm.org/
Dow
nloaded from
incubation, samples were harvested by ultracentrifugation (see above) and re-suspended. Negative controls contained MVs or DNA.
Fluorescence microscopy. Biofilms were carefully excised and stained withthe DNA indicator dye 7-hydroxy-9H-(1,3-dichloro-9,9-dimethylacridin-2-one)(DDAO [1]; 1 mM solution in tetrahydrofuran, diluted 1:1,000 in 50 mM HEPESbuffer, pH 7.0, for 15 min; Molecular Probes, Invitrogen). All images werecollected using a Leica TCS SP2 confocal-scanning-laser microscope (Leica)equipped with Ar-Kr 488-nm and He-Ne 633-nm lasers and a 43� phase contrastlens. Stained and unstained biofilms were excited (488 and 633 nm, respectively)and emission data collected (510 and 659 nm, respectively).
TEM. Negatively stained whole mounts were prepared as detailed elsewhere(40).
Thin-sectioned biofilm samples were prepared by freeze substitution (19). Oncompletion, the medium was replaced with 100% ethanol (30 min) and twochanges of LR White-ethanol (1:1; London Resin Company) over a period of 45min and 100% LR-White (30 min). The sample was polymerized in fresh LRWhite (60°C for 1 h), and sections were prepared and poststained with 2%(wt/vol) uranyl acetate and Reynold’s lead citrate (42).
All samples were examined under standard operating conditions, using aPhilips CM10 TEM (acceleration voltage, 80 kV). Images were archived usingthe iTEM program (version 5.0; Soft Imaging Systems).
RESULTS AND DISCUSSION
DNA is associated with MVs isolated from the matrices ofbiofilms. The selective dye DDAO established the presenceand locality of matrix DNA in biofilms (Fig. 2) (1). In agree-ment with reported double-stranded-DNA (dsDNA) contribu-tions to P. aeruginosa matrix polymers (29, 33, 34), a biochem-ical assay indicated that 6.1% (wt/wt) of the matrix was dsDNA(Table 1).
Biofilm MVs (b-MVs) contained 91 � 1 ng DNA/20 �g MVprotein (mean � standard error of the mean [SEM]; n � 180),much greater than planktonic MVs (p-MVs) (20, 39), possibly
due to higher local concentrations and physical and temporalproximity (31) or the strikingly different chemistry of b-MVs(40). b-MV-associated DNA, however, represented a minuteproportion of matrix DNA (Table 1). DNA is notorious for its
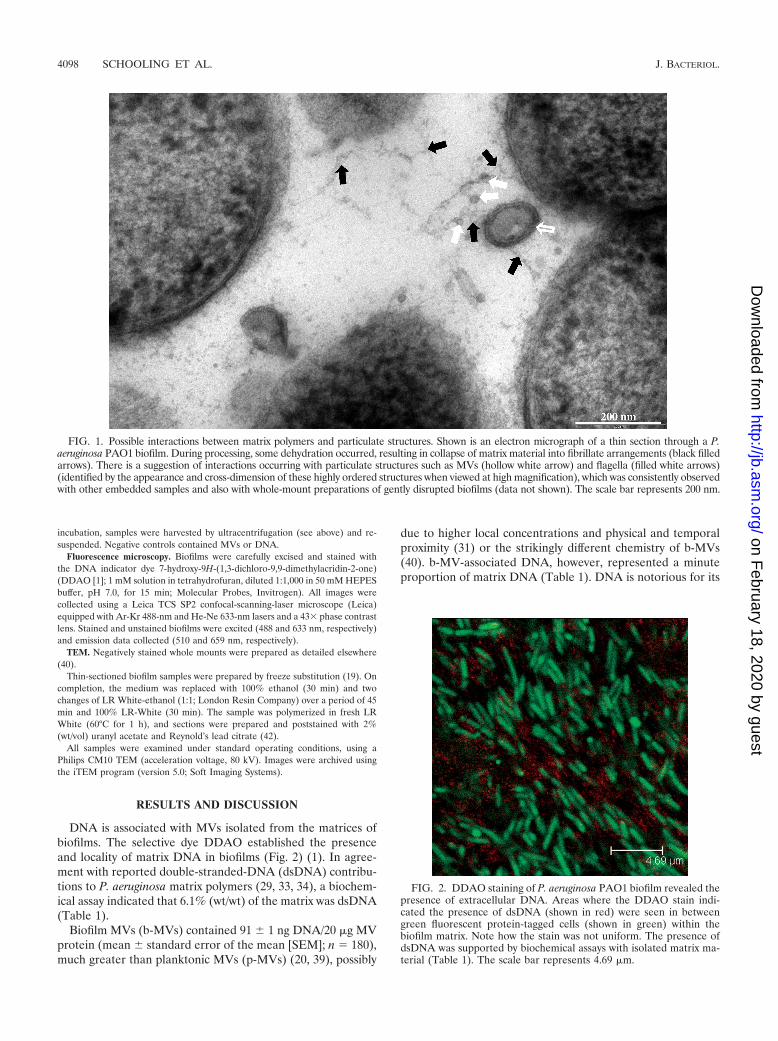
FIG. 1. Possible interactions between matrix polymers and particulate structures. Shown is an electron micrograph of a thin section through a P.aeruginosa PAO1 biofilm. During processing, some dehydration occurred, resulting in collapse of matrix material into fibrillate arrangements (black filledarrows). There is a suggestion of interactions occurring with particulate structures such as MVs (hollow white arrow) and flagella (filled white arrows)(identified by the appearance and cross-dimension of these highly ordered structures when viewed at high magnification), which was consistently observedwith other embedded samples and also with whole-mount preparations of gently disrupted biofilms (data not shown). The scale bar represents 200 nm.
FIG. 2. DDAO staining of P. aeruginosa PAO1 biofilm revealed thepresence of extracellular DNA. Areas where the DDAO stain indi-cated the presence of dsDNA (shown in red) were seen in betweengreen fluorescent protein-tagged cells (shown in green) within thebiofilm matrix. Note how the stain was not uniform. The presence ofdsDNA was supported by biochemical assays with isolated matrix ma-terial (Table 1). The scale bar represents 4.69 �m.
4098 SCHOOLING ET AL. J. BACTERIOL.
on February 18, 2020 by guest
http://jb.asm.org/
Dow
nloaded from

fragility; our values reflect the DNA remaining associated afterisolation. Attempted DNA isolation from matrix yielded nomatter, suggesting that the DNA was sheared or shortstranded; anecdotally, the matrix was more viscous prior tofiltering.
DNA is associated with the lumen and external face of MVs.p-MVs have DNA associated with their lumen, external sur-face, or both (11, 12, 13, 39). Mechanisms for this have beendescribed (12, 13, 20, 39). The distribution is relevant: locationand arrangement affect availability and interactions. Forty-onepercent of b-MV DNA was located at their outer surfaces(PAO1 p-MVs; 25%) (39). The lumen contained 54 � �1 ngDNA/20 �g MV protein (mean � SEM; n � 180), greater thanthe level reported for p-MVs (39), supporting b-MVs as dis-tinct from p-MVs (40).
Exogenous DNA interacts and associates with MVs. b-MVswere incubated with DNA at the ratio at which these occurredwithin the matrix. In agreement with the DNA-retaining prop-erties of p-MVs (11, 12, 21, 39), b-MVs showed a substantialincrease in associated DNA (281 � �1 ng DNA/20 �g MVprotein [mean � SEM; n � 60]). DNase-treated MVs showeda propensity similar to that for native MVs (269 � 1 ngDNA/20 �g MV protein [mean � SEM; n � 60]), suggestingthat, for a given amount of DNA, there is a maximum DNAload per unit MV protein.
MV-DNA interaction is dependent upon physical condi-tions. Microenvironments throughout biofilms mean that di-verse environmental conditions, such as concentration and pH,are at play. DNA and MVs were incubated together at differ-ent ratios; a ratio value of 1 (Fig. 3A, x axis) reflects the relativeamount of DNA to MV protein as it occurred in the matrix.MV protein was kept constant and DNA concentration al-tered. A very strong positive linear correlation relationship wasfound between DNA concentration and DNA association withMVs (y � 2.2084x � 0.6319; R2 � 0.99). Even when the DNAconcentration was increased threefold, the system remainedunsaturated.
pH is another well-established variable within biofilms (8,17). MVs were incubated with DNA at the same ratio as theywere within the matrix, and pH was altered (Fig. 3B). Thebaseline R value of 1 describes the amount of DNA per 20 �gMV protein. Retained DNA increased from pH 5.6 to pH 6.4and dropped at pH 6.8, reaching a maximum at pH 7.6. Dep-rotonation of the main surface groups increases with pH (car-boxyl phosphate amine). As available carboxyl groupsinteract with DNA, diminished electrostatic repulsion pro-motes further binding. As pH further increases, deprotonationof phosphate groups (titration of MVs [see below], pH 6.8 to7.1) renders the surface more negatively charged, repulsing
MV-DNA interactions. The mechanistics from pH 6.8 to 7.6are not clear, although it mirrors the lowering of net negativesurface charge (Fig. 4). pH change may also cause reorganiza-tion of surface components or electrostatic destabilization, ex-posing previously inaccessible functional groups (9).
The third assessed parameter was the presence of monova-lent and divalent cations. MVs were incubated with DNA at
FIG. 3. Assessment of the effect of environmental conditions uponthe interaction between b-MVs and exogenous DNA. MVs were incu-bated with DNA (see Materials and Methods for details), and theeffects of concentration of DNA (f) (A), altered pH (Œ) (B), andconcentration of Na� (E) or Mg2� (F) cations, respectively (C), uponMV-DNA interactions were assessed. Note that for panel A, the ratioon the x axis is equal to the concentration of the assayed DNA/concentration of DNA in the matrix. Quantities of DNA (ng)/20 �gMV protein for R values of 1 were 116 � 3 (DNA concentration; MVsonly), 86 � 3 (pH; MVs only), 275 � 3 (Na�; MVs plus DNA only),and 236 � 6 (Mg2�; MVs plus DNA only) (means � standard devia-tions; n � 60).
TABLE 1. DNA and its contribution to the matrix and matrix-derived MVsa
Isolated fraction Dry wt (mg) Amt of DNA (mg) % DNA/dry wt
Matrix 56.6 � 11.1 3.46 � 0.52 6.11MV 24.5 � 3.9 0.012 � 0.002 0.05
a MV DNA represents 0.35% (wt/wt) of the matrix DNA. Dry weight valuesare averages � standard deviations of results from three independent samples.DNA values are averages � standard errors of the means of results from threeindependent samples assayed in triplicate (n � 180).
VOL. 191, 2009 BIOFILMS, MATRIX, DNA, AND MEMBRANE VESICLES 4099
on February 18, 2020 by guest
http://jb.asm.org/
Dow
nloaded from

the same ratio as they were within the matrix, and cationconcentration was altered (Fig. 3C). The baseline R value of 1describes the amount of DNA per 20 �g MV protein followingincubation with DNA. As the Na� concentration increased,this increase was accompanied by a concomitant gradual in-crease in associated MV-DNA. As the concentration of Na�
increases, electrostatic repulsion is reduced, permitting posi-tively charged surface groups, e.g., amines, to interact morereadily with DNA. The presence of Mg2� ions displayed be-havior similar to that of Na� ions; however, the association wasgreater (Fig. 3C). Polyvalent cations screen negative chargesmore effectively and also facilitate salt bridging of the phos-phate groups on DNA and negatively charged groups on theMV surface.
Collectively, the data indicated that conditions mimickingvariation within biofilm microenvironments altered interac-tions between particulate components (MVs) and matrix poly-mers (DNA).
DNA associated with the external face of MVs influencesMV surface properties. Biofilm-derived MVs and DNA inter-act, but does this alter the apparent surface properties ofMVs? Native and DNase-treated MVs were compared by zetapotentiometry. DNase-treated MVs were generally less nega-tively charged (Fig. 4). Readings within the pH range of 5.2 to7.8, conditions under which phosphate groups deprotonate(pKa, 6.4 to 7.4) (14) and contribute to surface charge, indi-cated that native MVs had a more negative charge. Sources forthis phosphate group include lipopolysaccharide and terminalphosphate groups of DNA; the phosphodiester bond (pKa, 3units) of DNA or other exposed molecules accounts for someof the negative charge at pH values of just over 4 units (Fig. 4).
Titration analysis confirmed the data and yielded informa-tion on the available surface groups. Differences in the abun-dance and distribution of ligands of native or DNase-treatedMVs were obvious (Fig. 5). Analysis of the data (Table 2)showed that DNase-treated MVs had a total ligand concentra-tion 2.5 times (wt/wt) greater than that of the native MVs, i.e.,extravesicular DNA interacted with surface groups masking
them. The assignment of functional group identities (Table 2)(10, 14, 26, 35, 37) revealed increases of 2.5-fold in thedesignated carboxyl and phosphate groups of DNase-treatedMVs but 3.5-fold for amine groups. The data supported thatinteractions between MVs and DNA were occurring via bothsalt-bridging mechanisms and electrostatic interactions. Thegreater increases in the amine groups following DNA digestionindicated that the latter had a greater impact on binding. Thedata also indicated that despite the extremely low-level contri-bution of DNA to MVs (Table 1), this altered the surfacechemistry and clearly has broad implications in terms of thefunctionality and reactivity of MVs.
An additional facet to the MV paradigm. Assessment ofbiofilms by TEM has long hinted at a relationship betweenparticulates and matrix polymers (Fig. 1). MVs, in addition totheir diverse known functionality, are capable of interactingwith matrix polymers. This interaction will be modulated byregions of variable polymer and MV content within biofilms (1,18, 40) and qualitative differences in MVs that will intuitivelyoccur (22). The enmeshment, entanglement, and stiffness ofmatrix polymers will be influenced by the locality, chemical
FIG. 4. Relative surface charges of native and DNase-treated MVs.Suspensions of native MVs (f) or DNase-treated MVs (F; 8 �g of MVprotein � ml�1) were assessed by zeta potentiometry. Data for 10 and100 mM buffer (not shown) yielded the expected concentration-depen-dent effect whereby an increase in buffer concentration causes a sub-sequent lessening of the apparent negative surface charge (mean �SEM; n � 15). A two-tailed Mann-Whitney test was performed usingAnalyze-It for Microsoft Excel (version 2.11) and indicated that alldata, with the exception of that collected at pH 6.8, showed highlysignificant differences (P � 0.01).
FIG. 5. Titration analysis of the available functional groups presenton the native and DNase-treated MVs. pKa spectra for native MVs(A) and DNase-treated MVs (B) composite plot of three spectra. Thesite density (concentration of ligand) is normalized to the dry weight ofthe sample used. The arrows (A, n1 to n3; B, d1 to d3) indicate thegroups that the data cluster in. Please refer to Table 2 for details ofthese.
4100 SCHOOLING ET AL. J. BACTERIOL.
on February 18, 2020 by guest
http://jb.asm.org/
Dow
nloaded from

composition, and relative quantities of participant particulatesand polymers. MVs are also trafficked out of biofilms (40).Surfaces may be preconditioned with a DNA-MV complexaltering subsequent interactions, e.g., cell adhesion, and mo-bile MV-DNA complexes may transfer genetic material be-tween otherwise immobile cell populations. However, MV-DNA transfer of genetic information between cells remainscontroversial (39). Yet, whether the internalized DNA differsfrom that on the MV surface, or even within the matrix, begsto be asked.
In summary, the matrix is central to the chemistry, structure,and function of biofilms. Its very nature is defined by thedynamic interchange between chemical constituents, environ-mental conditions, and cell members of the consortium. Wemust remember that interactions also occur between polymersand particulates. This work confirms the presence of MV-associated DNA within biofilms, the association and interac-tion of b-MVs with matrix components, and the impact ofthese processes on interacting moieties. We reemphasize thematrix as a complex amalgam and not a simple collection ofchemistries. The matrix is a constantly changing entity, in manyways as responsive and reactive as the cells that it enshrouds.
ACKNOWLEDGMENTS
This work was supported by funds to T.J.B. from NSERC andAFMNet-NCE. T.J.B. held a Canada Research Chair. TEM was per-formed in the NSERC Guelph Regional Integrated Imaging Facility(GRIIF), which is partially funded by an NSERC-MFA grant.
We thank Frances Sharom and Milena Corredig (University ofGuelph) for use of the Spex fluorescence spectrophotometer and theZetasizer Nano, respectively; Anuradha Saxena (University ofGuelph) for running titrations; Ryan Hunter (Massachusetts Instituteof Technology) and Michaela Struder-Kypke (University of Guelph)for assistance with freeze substitution and confocal work, respectively;Vernon Phoenix (University of Glasgow) for insightful discussion; andChris Whitfield, Cecil Forsberg, and Anton Korenevski (University ofGuelph) as well as the editor and reviewers for reading the manuscriptand providing useful criticism.
REFERENCES
1. Allesen-Holm, M., K. B. Barken, L. Yang, M. Klausen, J. S. Webb, S.Kjelleberg, S. Molin, M. Givskov, and T. Tolker-Nielsen. 2006. A character-
ization of DNA release in Pseudomonas aeruginosa cultures and biofilms.Mol. Microbiol. 59:1114–1128.
2. Bauman, S. J., and M. J. Kuehn. 2006. Purification of outer membranevesicles from Pseudomonas aeruginosa and their activation of an IL-8 re-sponse. Microbes Infect. 8:2400–2408.
3. Beveridge, T. J., S. A. Makin, J. L. Kadurugamuwa, and Z. Li. 1997. Inter-actions between biofilms and the environment. FEMS Microbiol. Rev. 20:291–303.
4. Beveridge, T. J. 1999. Structures of gram-negative cell walls and their derivedmembrane vesicles. J. Bacteriol. 181:4725–4733.
5. Bockelmann, U., A. Janke, R. Kuhn, T. R. Neu, J. Wecke, J. R. Lawrence,and U. Szewzyk. 2006. Bacterial extracellular DNA forming a defined net-work-like structure. FEMS Microbiol. Lett. 262:31–38.
6. Bockelmann, U., H. Lunsdorf, and U. Szewzyk. 2007. Ultrastructural andelectron energy-loss spectroscopic analysis of an extracellular filamentousmatrix of an environmental bacterial isolate. Environ. Microbiol. 9:2137–2144.
7. Branda, S. S., Å. Vik, L. Friedman, and R. Kolter. 2005. Biofilms: the matrixrevisited. Trends Microbiol. 13:20–26.
8. Caldwell, D. E., D. R. Korber, and J. R. Lawrence. 1992. Confocal lasermicroscopy and digital image analysis in microbial ecology. Adv. Microb.Ecol. 12:1–67.
9. Claessens, J., T. Behrends, and P. V. Cappallen. 2004. What do acid-basetitrations of live bacteria tell us? A preliminary assessment. Aquat. Sci.66:19–26.
10. Cox, J. S., D. S. Smith, L. A. Warren, and F. G. Ferris. 1999. Characterizingheterogeneous bacterial surface functional groups using discrete affinityspectra for proton binding. Environ. Sci. Technol. 33:4514–4521.
11. Deich, R. A., and L. C. Hoyer. 1982. Generation and release of DNA-bindingvesicles by Haemophilus influenzae during induction and loss of competence.J. Bacteriol. 152:855–864.
12. Dorward, D. E., C. F. Garon, and R. C. Judd. 1989. Export and intercellulartransfer of DNA via membrane blebs of Neisseria gonorrhoeae. J. Bacteriol.171:2499–2505.
13. Dorward, D. E., and C. F. Garon. 1990. DNA is packaged within membrane-derived vesicles of gram-negative but not gram-positive bacteria. Appl. En-viron. Microbiol. 56:1960–1962.
14. Fein, J. B., C. J. Daughney, N. Yee, and T. A. Davis. 1997. A chemicalequilibrium model for metal adsorption onto bacterial surfaces. Geochim.Cosmochim. Acta 61:3319–3328.
15. Flemming, H.-C., and J. Wingender. 1999. Relevance of microbial extracel-lular polymeric substances (EPSs)—part I: structural and ecological aspects.Water Sci. Technol. 43(6):1–8.
16. Halhoul, N., and J. R. Colvin. 1975. The ultrastructure of bacterial plaqueattached to the gingiva of man. Arch. Oral Biol. 20:115–118.
17. Hunter, R. C., and T. J. Beveridge. 2005. Application of a pH-sensitivefluoroprobe (C-SNARF-4) for pH microenvironment analysis in Pseudomo-nas aeruginosa biofilms. Appl. Environ. Microbiol. 71:2501–2510.
18. Hunter, R. C., and T. J. Beveridge. 2005. High-resolution visualization ofPseudomonas aeruginosa PAO1 biofilms by freeze-substitution transmissionelectron microscopy. J. Bacteriol. 187:7619–7630.
19. Jurcisek, J. A., and L. O. Bakaletz. 2007. Biofilms formed by nontypeableHaemophilus influenzae in vivo contain both double-stranded DNA and typeIV pilin protein. J. Bacteriol. 189:3868–3875.
20. Kadurugamuwa, J. L., and T. J. Beveridge. 1995. Virulence factors arereleased from Pseudomonas aeruginosa in association with membrane vesi-cles during normal growth and exposure to gentamicin: a novel mechanismof enzyme secretion. J. Bacteriol. 177:3998–4008.
21. Kahn, M., M. Concino, R. Gromkova, and S. Goodgal. 1979. DNA bindingactivity of vesicles produced by competence deficient mutants of Haemophi-lus. Biochem. Biophys. Res. Commun. 87:764–772.
22. Keenan, J. L., and R. A. Allardyce. 2000. Iron influences the expression ofHelicobacter pylori outer membrane vesicle-associated virulence factors. Eur.J. Gastroenterol. Hepatol. 12:1267–1273.
23. Kolling, G. L., and K. R. Matthews. 1999. Export of virulence genes andShiga toxin by membrane vesicles of Escherichia coli O157:H7. Appl. Envi-ron. Microbiol. 65:1843–1848.
24. Kuehn, M. J., and N. C. Kesty. 2005. Bacterial outer membrane vesicles andthe host-pathogen interaction. Genes Dev. 19:2645–2655.
25. Lorenz, M. G., and W. Wackernagel. 1994. Bacterial gene transfer by naturalgenetic transformation in the environment. Microbiol. Rev. 58:563–602.
26. Martinez, R. E., D. S. Smith, E. Kulczycki, and F. G. Ferris. 2002. Deter-mination of intrinsic bacterial surface acidity constants using a Donnan shellmodel and a continuous pKa distribution method. J. Colloid Interface Sci.253:130–139.
27. Mashburn-Warren, L., R. J. Mclean, and M. Whiteley. 2008. Gram-negativeouter membrane vesicles: beyond the cell surface. Geobiology 6:214–219.
28. Mashburn-Warren, L. M., and M. Whiteley. 2006. Special delivery: vesicletrafficking in prokaryotes. Mol. Microbiol. 61:839–846.
29. Matsukawa, M., and E. P. Greenberg. 2004. Putative exopolysaccharidesynthesis genes influence Pseudomonas aeruginosa biofilm development. J.Bacteriol. 186:4449–4456.
TABLE 2. Composite titration data for native andDNase-treated MVsa
Ligandclassb Mean pKa
c Mean LT(�M/mg �dry wt�)d
Proposed functionalgroup
n1 5.48 (4.8–6.0) 0.138 (45) Carboxyln2 6.91 (6.8–7.1) 0.098 (32) Phosphaten3 8.32 (8.2–8.4) 0.070 (23) Amined1 5.18 (4.4–6.1) 0.305 (38.5) Carboxyld2 6.90 (6.5–7.2) 0.242 (30.5) Phosphated3 7.94 (7.8–9.0) 0.246 (31) Amine
a The total available surface ligand concentrations for native and DNase-treated MVs were 0.306 and 0.793 �M/mg (dry weight), respectively (DNase/native ratio of 2.5). A ratiometric comparison of DNase-treated to native MVsindicated values of 2.2 (d1/n1), 2.5 (d2/n2), and 3.5 (d3/n3). Native MVs con-tributed 8% (wt/wt) of the total ligand concentration of the matrix material. Datawere obtained from titration analysis of three independent samples.
b Based on pKa clusters in Fig. 5A and B.c Values in parentheses represent ranges for given pKa clusters. Mean pKa
values were estimated using a weighted mean calculation, with the correspondingavailable surface ligand concentration as the weighting factor.
d LT refers to site density (�M/mg �dry weight�). Values in parentheses rep-resent the percent contribution of any functional group to the sample’s totalligand concentration.
VOL. 191, 2009 BIOFILMS, MATRIX, DNA, AND MEMBRANE VESICLES 4101
on February 18, 2020 by guest
http://jb.asm.org/
Dow
nloaded from

30. Mayrand, D., and D. Grenier. 1989. Biological activities of outer membranevesicles. Can. J. Microbiol. 35:607–613.
31. Molin, S., and T. Tolker-Nielsen. 2003. Gene transfer occurs with enhancedefficiency in biofilms and induces enhanced stabilisation of the biofilm struc-ture. Curr. Opin. Biotechnol. 14:255–261.
32. Moore, D., and D. Dowhan. 2002. Preparation and analysis of DNA,p. 2.1.1–2.1.10. In F. M. Ausubel, R. Brent, R. E. Kingston, D. D. Moore,J. G. Seidman, J. A. Smith, and K. Struhl (ed.), Current protocols in mo-lecular biology. John Wiley & Sons, Inc., New York, NY.
33. Murakawa, T. 1973. Slime production by Pseudomonas aeruginosa. III. Pu-rification of slime and its physicochemical properties. Jpn. J. Microbiol.17:273–281.
34. Nemoto, K., K. Hirota, K. Murakami, K. Taniguti, H. Murata, D. Viduvic,and Y. Miyake. 2003. Effect of varidase (streptodornase) on biofilm formedby Pseudomonas aeruginosa. Chemotherapy 49:121–125.
35. Ngwenya, B. T., I. W. Sutherland, and L. Kennedy. 2003. Comparison of theacid-base behaviour and metal adsorption characteristics of a gram-negativebacterium with other strains. Appl. Geochem. 18:527–538.
36. Petersen, F. C., L. Tao, and A. A. Scheie. 2005. DNA binding-uptake system:a link between cell-to-cell communication and biofilm formation. J. Bacte-riol. 187:4392–4400.
37. Phoenix, V. R., R. E. Martinez, K. Konhauser, and F. G. Ferris. 2002.Characterization and implications of the cell surface reactivity of Calothrixsp. strain KC97. Appl. Environ. Microbiol. 68:4827–4834.
38. Pink, J., T. Smith-Palmer, D. Chisholm, T. J. Beveridge, and D. A. Pink.2005. An FTIR study of Pseudomonas aeruginosa PAO1 biofilm develop-ment: interpretation of ATR-FTIR data in the 1500–1180 cm�1 region.Biofilms 2:165–175.
39. Renelli, M., V. Matias, R. Lo, and T. J. Beveridge. 2004. DNA-containingmembrane vesicles of Pseudomonas aeruginosa PAO1 and their genetic in-formation potential. Microbiology 150:2161–2169.
40. Schooling, S. R., and T. J. Beveridge. 2006. Membrane vesicles: an over-looked component of the matrices of biofilms. J. Bacteriol. 188:5945–5957.
41. van Schaik, E. J., C. L. Giltner, G. F. Audette, D. W. Keizer, D. L. Bautista,C. M. Slupsky, B. D. Sykes, and R. T. Irvin. 2005. DNA binding: a novelfunction of Pseudomonas aeruginosa type IV pili. J. Bacteriol. 187:1455–1464.
42. Venable, J. H., and R. Coggeshall. 1965. A simplified lead citrate stain foruse in electron microscopy. J. Cell Biol. 25:407.
43. Walker, T. S., K. L. Tomlin, G. S. Worthen, K. R. Poch, J. G. Lieber, M. T.Saavedra, M. B. Fessler, K. C. Malcolm, M. L. Vasil, and J. A. Nick. 2005.Enhanced Pseudomonas aeruginosa biofilm development mediated by humanneutrophils. Infect. Immun. 73:3693–3701.
44. Whitchurch, C. B., T. Tolker-Nielsen, P. C. Ragas, and J. S. Mattick. 2002.Extracellular DNA required for biofilm formation. Science 295:1487.
45. Wilson, K. 1997. Preparation and analysis of DNA, p. 2.4.1–2.4.5. In F. M.Ausubel, R. Brent, R. E. Kingston, D. D. Moore, J. G. Seidman, J. A. Smith,and K. Struhl (ed.), Current protocols in molecular biology. John Wiley &Sons, Inc., New York, NY.
46. Wingender, J., T. R. Neu, and H.-C. Flemming (ed.). 1999. Microbial extra-cellular polymeric substances: characterization, structure and function, p.1–19. Springer-Verlag, Berlin, Germany.
47. Wolfaardt, G. M., J. R. Lawrence, and D. R. Korber. 1999. Function of EPS,p. 171–200. In J. Wingender, T. R. Neu, and H.-C. Flemming (ed.), Microbialextracellular polymeric substances: characterization, structure and function.Springer-Verlag, Berlin, Germany.
48. Yaron, S., G. L. Kolling, L. Simon, and K. R. Matthews. 2000. Vesicle-mediated transfer of virulence genes from Escherichia coli O157:H7 to otherenteric bacteria. Appl. Environ. Microbiol. 66:4414–4420.
49. Zhou, S., D. Liang, C. Burger, F. Yeh, and B. Chu. 2004. Nanostructures ofcomplexes formed by calf thymus DNA interacting with cationic substances.Biomacromolecules 5:1256–1261.
4102 SCHOOLING ET AL. J. BACTERIOL.
on February 18, 2020 by guest
http://jb.asm.org/
Dow
nloaded from