Embed Size (px)
Citation preview

Interactions between cancer cell populations in vivo:
cooperation vs competition
Miguel de Almeida Fuzeta
Thesis to obtain the Master of Science Degree in
Biological Engineering
Supervisors: Miguel Jorge Zuzarte de Mendonça Godinho Ferreira, PhD
Nuno Filipe Santos Bernardes, PhD
Examination Committee
Chairperson: Prof. Gabriel António Amaro Monteiro
Supervisor: Miguel Jorge Zuzarte de Mendonça Godinho Ferreira, PhD
Members of the Committee: Prof. Arsénio do Carmo Sales Mendes Fialho
September 2016

Interactions between cancer cell populations in vivo:
cooperation vs competition
Part I – Cooperation between two colorectal cancer cell populations
Part II – Sustaining telomere elongation: Tert+ vs ALT cancer cell
populations
Miguel de Almeida Fuzeta
Thesis to obtain the Master of Science Degree in
Biological Engineering
Experimental work development
Champalimaud Foundation – Champalimaud Centre for the Unknown
Supervisors: Miguel Jorge Zuzarte de Mendonça Godinho Ferreira, PhD
Rita Leonor Álvares Cabral de Figueiredo Fior Sousa Soares, PhD
University affiliation
University of Lisbon – Instituto Superior Técnico
Supervisor: Nuno Filipe Santos Bernardes, PhD
February - September 2016

i
Acknowledgements
I would like to express my deepest gratitude to everyone that contributed for the execution of this
research work:
My supervisors Miguel Godinho Ferreira and Rita Fior for the systematic orientation and fruitful teaching
across the whole work period;
My university supervisor Nuno Bernardes for counseling;
My laboratory group colleagues Vanda Póvoa and Raquel Mendes for the tireless experimental support;
The whole research group from IGC and CCU for scientific discussion and sharing ideas;
João Xavier, from Memorial Sloan Kettering Cancer Center, New York, for scientific discussion and
sharing ideas;
The Champalimaud Fish facility: Catarina Certal, Sandra Martins, Joana Monteiro and Telma Costa, for
the support with zebrafish care and handling;
The Champalimaud Imaging facility: José Rino, for the support in confocal microscopy;
My classmates and friends for the support and sharing ideas;
My Family for the unconditional support.

ii
Abstract
Evidence of intratumor heterogeneity was found in a variety of cancers, shown to be composed of
subclones with different phenotypes. These subclones are able to establish interactions that are barely
understood nowadays and may yield relevant implications for cancer progression.
Here, two colorectal cancer cell lines derived from the same patient, one from the primary tumor
(SW480) and another from a metastatic site (SW620), established a cooperative interaction when both
were injected in zebrafish larvae. This cooperative interaction wasn’t observed in vitro, suggesting that
the interactions are being mediated by the tumor microenvironment. Furthermore, genetic
downregulation of the host innate immune system allowed a SW480 behavior that was positively
correlated with the presence of SW620. This is consistent with the hypothesis that the increased fitness
of SW480 is due to an immune modulation performed by SW620.
All in all, this work alerts for cooperative interactions between tumor subpopulations that may
increase the fitness of the tumor as a whole. Therefore, an “ecologically” driven therapy, disrupting the
crosstalk between cooperative subpopulations may be more successful.
Additionally, another heterogeneous tumor was constructed using one cancer cell line that elongates
telomeres through telomerase overexpression (Tert+) and another through ALT mechanism, in order to
determine if it’s plausible that tumors present both populations, but later, Tert+ becomes the dominant
one. There was no competition nor cooperation in vitro, where Tert+ displayed a higher proliferation than
ALT cells, thus overtaking them. In vivo results were inconclusive, since Tert+ wasn’t able to engraft in
zebrafish.
Keywords: Cancer, intratumor heterogeneity, clonal cooperation/competition, tumor microenvironment,
telomerase overexpression (Tert+), alternative lengthening of telomeres (ALT)

iii
Resumo
Heterogeneidade intra-tumoral foi observada numa variedade de cancros, que revelam ser formados
por subclones com diferentes fenótipos. Estes subclones podem estabelecer interações que atualmente
são pouco compreendidas e podem ter implicações relevantes na progressão de cancro.
Neste trabalho, duas linhas celulares de cancro colo-rectal derivadas do mesmo paciente, uma do
tumor primário (SW480) e outra de uma metástase (SW620), estabeleceram uma interação cooperativa
quando ambas foram injetadas em peixe-zebra. Esta interação cooperativa não foi observada in vitro,
sugerindo que as interações in vivo são mediadas pelo microambiente tumoral. Adicionalmente, uma
sub-regulação do sistema imune-inato do hospedeiro permitiu um comportamento de SW480
positivamente correlacionado com a presença de SW620, sendo consistente com a hipótese do
aumento das aptidões de SW480 se dever a uma modelação imunitária desempenhada por SW620.
Em suma, este trabalho alerta para interações cooperativas entre subpopulações tumorais que
podem aumentar as aptidões do tumor como um todo. Assim sendo, um tratamento orientado
ecologicamente, quebrando a comunicação entre subpopulações cooperativas pode ter mais sucesso.
Adicionalmente, outro tumor heterogéneo foi construído usando uma linha celular cancerígena que
prolonga telómeros através da sobre-expressão de telomerase (Tert+) e outra através do mecanismo
ALT, com o objetivo de determinar se é plausível que um tumor apresente ambas as populações, mas
a população Tert+ se torne a dominante. Não se observou competição nem cooperação in vitro, mas
Tert+ mostrou uma proliferação superior a ALT, ultrapassando esta. Os resultados in vivo foram
inconclusivos, visto que Tert+ não foi capaz de “engraftar” em peixe-zebra.
Palavras-chave: Cancro, heterogeneidade intra-tumoural, cooperação/competição clonal,
microambiente tumoral, sobre-expressão de telomerase (Tert+), prolongamento alternativo de
telómeros (ALT - alternative lengthening of telomeres)

iv
Contents
Acknowledgements ...................................................................................................................................i
Abstract..................................................................................................................................................... ii
Resumo ................................................................................................................................................... iii
Figure index ............................................................................................................................................ vii
Table index ............................................................................................................................................ xvi
Abreviations ......................................................................................................................................... xviii
Part I – Cooperation between two colorectal cancer cell populations ..................................................... 1
Introduction .............................................................................................................................................. 1
Cancer ................................................................................................................................................. 1
Tumor heterogeneity ........................................................................................................................... 1
Cancer dynamics ................................................................................................................................. 3
Tumor microenvironment ..................................................................................................................... 5
Zebrafish model ................................................................................................................................... 7
Studying interactions between cancer populations using a zebrafish model ...................................... 8
Results ................................................................................................................................................... 11
Engraftment of SW480 is enhanced in the presence of SW620. ...................................................... 11
Cell proliferation of SW480 is enhanced by the presence of SW620 in vivo .................................... 15
Apoptosis-associated cell death of SW480 does not change in presence of SW620 in vivo, but
apoptosis of SW620 decreases in the mix ........................................................................................ 15
SW620 is not able to enhance SW480 cell proliferation in vitro........................................................ 18
A downregulation of the host innate immune system increases the engraftment of SW480 ............ 25
Downregulation of the host innate immune system increases the total cell number of SW480, but not
its proliferation ................................................................................................................................... 28
Discussion ............................................................................................................................................. 32
Future Work ........................................................................................................................................... 38
Studying metastasis in mixture .......................................................................................................... 38
Explore the microenvironment players that control the tumor engraftment in the zebrafish host ..... 39
Test potential mechanisms that regulate tumor dynamics and their interplay with the
microenvironment .............................................................................................................................. 40
Part II – Sustaining telomere elongation: Tert+ vs ALT cancer cell populations ................................... 42

v
Introduction ............................................................................................................................................ 42
Results ................................................................................................................................................... 44
QGP1 (Tert+) cells have a higher proliferation than CM (ALT) cells in vitro and this is maintained when
the two cell lines are mixed ............................................................................................................... 44
CM (ALT) has better engraftment in zebrafish than QGP1 (Tert+) and this behavior is apparently
maintained when the two cell lines are mixed ................................................................................... 48
Discussion ............................................................................................................................................. 50
Future work ............................................................................................................................................ 51
Materials and Methods (for Part I and Part II) ....................................................................................... 52
Experiment outline ............................................................................................................................. 52
Cell Culture ........................................................................................................................................ 53
Freeze and thaw cells ................................................................................................................... 53
Cell passage (expansion) ............................................................................................................. 54
Cell staining .................................................................................................................................. 54
Cell counting ................................................................................................................................. 55
Zebrafish care and handling .............................................................................................................. 56
Crossing adult zebrafish, embryo harvesting and housing of adults ............................................ 57
Injections of tumor cells in zebrafish larvae .................................................................................. 58
Injection of PU.1 Morpholino ......................................................................................................... 60
Immunofluorescence assays of in vivo experiments ......................................................................... 60
Confocal Microscopy of zebrafish xenografts .................................................................................... 63
Statistical analysis ............................................................................................................................. 68
In vitro assays .................................................................................................................................... 69
Seeding ......................................................................................................................................... 69
Immuno assay ............................................................................................................................... 71
Analysis ......................................................................................................................................... 73
Technical details ................................................................................................................................ 74
References ............................................................................................................................................ 76
Appendix ................................................................................................................................................ 78
Quantification of cell proliferation and cell apoptosis from individual experiments ........................... 78
Normality tests ................................................................................................................................... 85
Materials ............................................................................................................................................ 88

vi
Embryo Medium (E3) .................................................................................................................... 88
Pronase ......................................................................................................................................... 88
Tricaine ......................................................................................................................................... 88
Batches for SW480 & SW620 in vitro experiment ............................................................................. 89

vii
Figure index
Figure 1: Effects of intratumor heterogeneity on the predictive value of cancer diagnosis. Cancer
diagnosis usually requires sampling the tumor through biopsies, which inevitably capture only a small
fraction of all tumor cells and thus may not be representative of all subclones (represented by cells of
different colors). Treatment decisions are guided by the analysis of these biopsies, which are likely to
sample the predominant clones. If successful, treatment eliminates the dominant clone, but clones
resistant to therapy (represented by yellow cells) are positively selected and drive disease progression.
Cells that disseminated early during tumor development (e.g. before treatment or even diagnosis) may
create distant metastases. Therefore, the clonal composition of metastatic lesions may differ
significantly from that of the primary tumor sample, and consequently, treatments designed according
to analysis of this primary sample may be inefficient to treat metastatic disease. Figure adapted from
[7]. ............................................................................................................................................................ 3
Figure 2: A) Types of ecological interactions that may occur among tumor cell populations.
Cancer cells may be able to engage in a variety of interactions that affect their fitness and survival.
These interactions can be classified into two major groups: negative and positive interactions. The most
relevant negative interaction is competition, which usually arises due to limitations in resources, and it
can cause one cell population to kill or suppress competitor cells (e.g. via secretion of toxic molecules).
Amensalism occurs unidirectionally, through inhibition of one population by another that is not affected.
Other antagonistic relationships include parasitism and predation, which benefit one population by
consuming biomass at the expense of the other, but are unlikely to be seen among cancer cells.
Commensalism is a type of positive interaction by which one population (common gooder) can benefit
another without being affected itself. In synergism, two or more populations give rise to novel
characteristics in the whole system that are absent if either population is present alone (e.g. ability to
metastasize [10]), without necessarily having an effect on the individual population. In mutualism, two
or more populations cooperate and bring in resources that will benefit all of the interacting parties, thus
in cancer it may be capable of increasing the fitness of the tumor as a whole. B) Mechanisms for
crosstalk between tumor cell populations. Exemplification of distinct cellular populations
communicating in a unidirectional manner, which may occur directly through paracrine (i) or juxtacrine
effects (ii) of ligands that are produced by one cell and received by the second. These interactions could
also be indirectly mediated via components of the microenvironment, such as blood vessels, immune
cells and fibroblasts (iii). Figure adapted from [8]. .................................................................................. 4
Figure 3: Improving therapeutic design for heterogeneous tumors. A) Targeted therapies can fail
to prevent tumor growth if the targeted subclone is “selfish” or has no influence on the behavior of other
populations within the tumor. Even if there is an initial reduction in tumor size, the other neutral
populations that are non-responsive to therapy can keep growing and maintain the tumor, leading to
relapse. B) Better understanding of cooperative interactions may allow the identification of non-cell-
autonomous drivers or ‘common gooder’ subclones that promote tumor growth by influencing nearby
populations. If therapeutic interventions can eliminate these populations or stop their interaction
mechanism, the overall growth of the tumor could be stopped. Figure adapted from [8]. ...................... 5

viii
Figure 4: The tumor microenvironment. The tumor microenvironment is composed by a multitude of
components besides cancer cells, including cancer stem cells, cancer-associated fibroblasts and
progenitor cells of the tumor stroma, components of the tumor vasculature such as endothelial cells and
pericytes, as well as immune inflammatory cells, including macrophages, neutrophils, dendritic cells,
natural killer cells, T cells and B cells. Figure adapted from [5]. ............................................................. 7
Figure 5: Layout of the in vivo competition assay between SW480 and SW620 cell lines. A mix of
the CRC cell lines SW480 and SW620 in equal proportion (50-50) was injected in the PVS of 2 dpf
zebrafish larvae. As controls, each cell line was injected separately in different zebrafish. The goal was
to observe if the behavior of any of the two cell lines changes when they are mixed together (when
compared with the controls) which would mean that a certain interaction is taking place between the two
of them. In order to assess the behavior of these cell lines, a set of several readouts was used: the
ability of these cells to engraft in the zebrafish, cell proliferation (total cell number, mitosis and Ki67
staining) and cell death (Caspase 3 staining). These readouts were measured 4 dpi. CRC - Colorectal
cancer, PVS - periviteline space, dpf - days post fertilization, dpi - days post injection.......................... 9
Figure 6: Relevant experimental steps for the determination of the engraftment rate. In day 0,
stained human tumor cell lines were injected in the PVS of 2dpf zebrafish larvae. Approximately 24hpi
all the samples were screened in a fluorescence scope and the ones that did not present a tumor were
considered unsuccessful injections (the tumor was not properly injected by the operator) and discarded.
During the 4 days of the in vivo experiment, the water medium was replaced daily and dead fish were
removed. At the end of the experiment period (4dpi) the zebrafish were sacrificed and the engraftment
rate was scored: using a florescence microscope to detect the fluorescent staining of the cell lines, the
number of samples bearing a tumor and the total number of samples were counted. ......................... 11
Figure 7: Engraftment of SW480 is enhanced in the presence of SW620. A) Representative
fluorescence images of the change of the engraftment behavior of SW480: SW480 injected alone not
engrafted 4dpi (i and ii) and SW480 injected in a 50-50 mix with SW620 engrafted 4dpi (iii and iv). This
figure shows both fluorescence scope images at the moment of sacrificing zebrafish (i and iii), where
only SW480 is visible in red (SW620 had to be stained with infra-red dye, hence it was not visible here),
as well as confocal microscopy images, showing SW480 in red, SW620 in green and nuclei staining
with DAPI in blue (ii and iv). In ii) it is not possible to observe any stained SW480 cells because they
were cleared from the fish during the period of experiment and it is even possible to observe some DAPI
signals that correspond to destroyed nuclei: larger circular signals in the center of the image, formed by
small dots (fragments of nuclei) instead of consistent large circles, typical of nuclei from living cells.
Image pairs i, ii and iii, iv are not from the same zebrafish, but just representative of what can be
observed in both conditions. B) Comparison of the engraftment rate of both cell lines, either alone or in
mix, merging the results from 3 different and independent experiments. C) Comparison of the
engraftment rate of both cell lines, either alone or in mix, from the 3 different experiments performed in
this work as well as previous experiments from the laboratory group, with SW480 and SW620 injected
alone in zebrafish. Each point represents one experiment, knowing that the number of samples (injected
fish) for each of these experiments stands between 10 and 67. See Notes 1 and 2 from Technical details
in the Methods section. Statistical analysis of B was performed using a Z-test and in C using t-tests (see

ix
statistical methods section). The error bars represent the standard error of the mean (SEM). dpi - days
post injection. ......................................................................................................................................... 13
Figure 8: SW480 is cleared in vivo during the first 36hpi, but withstands engraftment 4dpi when
mixed with SW620. .............................................................................................................................. 14
Figure 9: SW620 enhances the cell proliferation ability of SW480 in vivo. Cell apoptosis of SW480
does not change in presence of SW620 in vivo, but the cell apoptosis of SW620 decreases in the
mix. Cell proliferation and apoptosis of SW480 (labelled with vibrant CM-DiI, in red) and SW620
(labelled with Deep Red, in green) cell lines injected in 2dpf zebrafish, alone and mixed in equal parts.
Representative immunofluorescence images of 4dpi zebrafish xenograft sections at the injection site
(PVS) of SW480 (i, iv, vii), SW620 (ii, v, viii) and their mix (iii, vi, ix). Nuclei staining with DAPI in blue.
Representative images of cell number and mitotic figures (i-iii), Ki67 staining in white (iv-vi) and Caspase
3 staining in white (vii-ix). dpf - days post fertilization, dpi - days post injection, PVS - periviteline space.
............................................................................................................................................................... 16
Figure 10: SW620 enhances the cell proliferation ability of SW480 in vivo. Cell apoptosis of SW480
does not change in presence of SW620 in vivo, but the cell apoptosis of SW620 decreases in the
mix. Results from 3 independent experiments focusing on cell proliferation and apoptosis of SW480 and
SW620 cell lines injected in the PVS of 2dpf zebrafish, alone and mixed in equal parts, 4dpi.
Quantification of tumor cell number (controls and mix) total (i) and individual (SW480 and SW620),
normalized (ii). Quantification of the fraction of mitotic cells of each cell line, alone and in mix (iii).
Fraction of SW480 and SW620 cells in the mix (iv). Fraction of the Ki67 positive cells (proliferative cells,
which are not at G0 stage) (v) and Caspase 3 positive cells (apoptotic cells) (vi), comparing SW480 and
SW620 alone and in mix. See Note 3 from Technical details in the Methods section. Results from
statistical analysis comparing the differences between two conditions were performed using two tailed
t-tests (see statistical methods section), which have a P-value output, represented in the following way:
P≤0.0001 (****); 0.0001<P≤0.001 (***); 0.001<P≤0.01 (**); 0.01<P≤0.05 (*); P>0.05 (ns). The error bars
represent the standard error of the mean (SEM). ns - not significant, n - number of analyzed tumors in
the respective condition, dpf - days post fertilization, dpi - days post injection, PVS - periviteline space.
............................................................................................................................................................... 17
Figure 11: Possible interactions in the in vivo system – tumor-autonomous vs. non-tumor-
autonomous. A) Hypothesis 1 (tumor-autonomous): the cause for the behavior change in mix
(SW480+SW620) is mainly due to direct interactions between the two cell lines. B) Hypothesis 2 (non-
tumor-autonomous): the behavior change in mix requires interactions between the tumor and its’ in vivo
host. ....................................................................................................................................................... 19
Figure 12 C: SW480 and SW620 do not show any clear impact on one another, in vitro, regarding
cell death. Cell apoptosis of SW480 (labelled with CM-DiI, in red) and SW620 (labelled with Deep Red,
in green) cell lines seeded on 24 well-plates with glass coverslips, with a final seeding density of 4 ×
104cells/cm2, alone and mixed in equal parts. Representative immunofluorescence images of equivalent
fields from coverslips, 4dps with SW480 (i), SW620 (ii) and their mix (iii). Nuclei staining with DAPI in
blue and Caspase 3 staining in white. dps – days post seeding. .......................................................... 23

x
Figure 13: SW480 and SW620 do not show any clear impact on one another, in vitro, regarding
cell proliferation and death. Quantification from the SW480 & SW620 in vitro experiment, merging the
results from every coverslip analyzed. Cell proliferation and apoptosis of SW480 and SW620 cell lines
seeded on 24 well-plates with glass coverslips, 4dps. Both the mix and the individual seeding of these
cell lines was performed with a final seeding density of 4 × 10⁴cells/cm2. Quantification of tumor cell
number (controls and mix) total (i) and individual (SW480 and SW620), normalized (ii). Quantification of
the fraction of mitotic cells of each cell line, alone and in mix (iii). Fraction of SW480 and SW620 cells
in the mix (iv). Fraction of the Ki67 positive cells (proliferative cells, which are not at G0 stage) (v) and
Caspase 3 positive cells (apoptotic cells) (vi), comparing SW480 and SW620 alone and in mix. Results
from statistical analysis comparing the differences between two conditions were performed using two
tailed t-tests (see statistical methods section), which have a P-value output, represented in the following
way: P≤0.0001 (****); 0.0001<P≤0.001 (***); 0.001<P≤0.01 (**); 0.01<P≤0.05 (*); P>0.05 (ns). The error
bars represent the standard error of the mean (SEM). ns - not significant, n - number of analyzed
coverslips in the respective condition, dps – days post seeding. .......................................................... 24
Figure 14: Experiment layout of the PU.1MO experiment. The same experiment layout for the
previous experiments was duplicated: Each of the two CRC cell lines studied (SW480 and SW620) were
injected separately in the PVS of 2 dpf zebrafish larvae, as well as a mixture of these two cell lines in
equal proportion (50-50). This was performed in zebrafish previously injected with PU.1MO (at one-cell-
stage) as well as in the same number of zebrafish without this compound, which would be the controls
of the experiment. The goal was to observe if the behavior of any of the two cell lines (both alone and
in mix) changed when they were injected in zebrafish with a suppressed innate immune system (due to
inhibition by PU.1MO), when compared with the controls. This would mean that the host immune system
has an impact upon these cell lines. In order to assess the behavior of these cell lines, the same set of
readouts as before were used: ability of these cells to engraft in the zebrafish, cell proliferation
(measured through total cell number, mitosis and Ki67 staining) and cell death (measured through
Caspase 3 staining). These readouts were measured 4 dpi. CRC - Colorectal cancer, PVS - periviteline
space, dpf - days post fertilization, dpi - days post injection. ................................................................ 26
Figure 15: The engraftment of SW480 increases when the host innate immune system is
downregulated. Engraftment rates 4dpi of SW480 (alone and in mix) and SW620 (alone), injected in
controls and PU.1MO injected zebrafish. The engraftment of SW620 in mix was not determined,
because this cell line was stained with Deep Red, which could not be seen in the fluorescence scope
used. However, previous experiments revealed that in the mix, when one of the cell lines was present,
the other was always present as well, so the engraftment rate could be considered equal to SW480 in
mix. Results from statistical analysis comparing the differences between two conditions were performed
using a Z-test (see statistical methods section), which have a P-value output, represented in the
following way: P≤0.0001 (****); 0.0001<P≤0.001 (***); 0.001<P≤0.01 (**); 0.01<P≤0.05 (*); P>0.05 (ns).
Besides the results presented, also SW480-PU1MO vs SW620-PU1MO and SW480-PU1MO vs
SW480@Mix-Control were “ns”. The error bars represent the standard error of the mean (SEM). ns -
not significant, n - number of analyzed tumors in the respective condition, dpi - days post injection,
PU.1MO - PU.1 morpholino. .................................................................................................................. 27

xi
Figure 16: The total cell number of SW480 increases when the host innate immune system is
downregulated, but its proliferation does not. Cell proliferation and apoptosis of SW480 (in red) and
SW620 (in green) cell lines (alone and mixed in equal parts) injected in zebrafish, which was previously
injected with PU.1MO and their respective controls. Representative fluorescence images of cell number
and mitotic figures (A), as well as Caspase 3 immunofluorescence (in white - apoptotic cells) (B) from
4dpi zebrafish xenograft sections at the injection site (PVS) of SW480 (i, ii), SW620 (iii, iv) and their mix
(v, vi). Nuclei staining with DAPI in blue. dpi - days post injection, PVS - periviteline space, PU.1MO -
PU.1 morpholino. ................................................................................................................................... 29
Figure 17: The total cell number of SW480 increases when the host innate immune system is
downregulated, but its proliferation does not. Cell proliferation and apoptosis 4dpi of SW480 and
SW620 cell lines (alone and mixed in equal parts), which were injected in the PVS of 2dpf zebrafish,
previously injected with PU1MO 1mM and its respective control without PU1MO (Experiment with
PU1MO vs. Experiment 3). Quantification of tumor cell number (alone and in mix) total (i) and individual
normalized: SW480 (iii) and SW620 (iv). Fraction of SW480 and SW620 cells in the mix (ii).
Quantification of the fraction of mitotic cells of each cell line, alone and in mix: SW480 (v) and SW620
(vi). Fraction of Caspase 3 positive cells (apoptotic cells) (vii and viii). Results from statistical analysis
comparing the differences between two conditions were performed using two tailed t-tests (see statistical
methods section), which have a P-value output, represented in the following way: P≤0.0001 (****);
0.0001<P≤0.001 (***); 0.001<P≤0.01 (**); 0.01<P≤0.05 (*); P>0.05 (ns). The error bars represent the
standard error of the mean (SEM). ns - not significant, n - number of analyzed tumors in the respective
condition, dpf - days post fertilization, dpi - days post injection, PVS - periviteline space. ................... 31
Figure 18: Experimental procedure to assess metastatic potential in zebrafish xenografts, distinguishing
EMP and LMP. Tumor cell lines are injected only in the PVS of 2dpf zebrafish larvae, or into circulation
as well. Tumor cells that are able to form a colony in the CHT have metastatic potential. This could be
full metastatic potential (EMP+LMP) if the tumor cells were injected only in the PVS and forced to
undergo all the stages of metastasis, or LMP if they were already injected into circulation, thereby
bypassing the first two stages of metastasis. EMP – early metastatic potential, LMP – late metastatic
potential, CHT – caudal hematopoietic tissue, PVS – periviteline space, dpf – days post fertilization. This
figure was adapted from [24]. ................................................................................................................ 39
Figure 19: Layout for the Tert+ vs ALT in vivo experiment. A mix of QGP1 (Tert+) and CM (ALT) cell
lines in equal proportion was injected in the PVS of 2 dpf zebrafish larvae. As controls, each cell line
was injected separately. The goal was to observe if QGP1 consistently dominates over CM, as well as
if the behavior of any of the two cell lines changes when they are mixed together, when compared with
the controls, which would mean that a certain interaction is taking place between the two of them. In
order to assess the behavior of these cell lines, a set of several readouts would be used: the ability of
these cells to engraft in the zebrafish, cell proliferation (total cell number, mitosis and Ki67 staining) and
cell death (Caspase 3 staining). These readouts were measured 4 dpi. PVS - periviteline space, dpf -
days post fertilization, dpi - days post injection. .................................................................................... 43
Figure 20: Tert+ (QGP1) cells showed a higher proliferation than ALT (CM) cells in vitro and this
was maintained when there were mixed. Cell proliferation and apoptosis of QGP1 (in red) and CM (in

xii
green) cell lines seeded on 24 well-plates with glass coverslips, with a final seeding density of 5 ×
104cells/cm2, alone and mixed in equal parts. Representative immunofluorescence images of equivalent
fields from coverslips, 3dps with QGP1 (A-C i) , CM (A-C ii) and their mix (A-C iii). Nuclei staining with
DAPI in blue. Representative images of cell number and mitotic figures (A), Ki67 staining in white (B)
and Caspase 3 staining in white (C). All images were acquired with a 20x zoom. dps – days post seeding.
............................................................................................................................................................... 45
Figure 21: CM (ALT) cell line undergoes cell sorting when it’s co-cultured with QGP1 (Tert+).
Immunofluorescence images of CM (in green) cell clusters over QGP1 (in red) layer, 3dps in vitro. i)
Projection of a z-stack along the z axis, showing a tightly packed CM cell cluster formed on top of a
QGP1 layer. ii) Sideways view of a 3D projection of the same z-stack image, showing that the CM cluster
forms on top of a QGP1 layer. iii) Macroscopic view of a coverslip area, showing several CM cell clusters
over a larger population of QPG-1 cells that spreads throughout the coverslip (this picture was acquired
with a 10x zoom). dps - days post seeding. .......................................................................................... 46
Figure 22: Tert+ (QGP1) cells showed a higher proliferation than ALT (CM) cells in vitro and this
was maintained when they were mixed (quantification). Cell proliferation and apoptosis of QGP1
and CM cell lines seeded on 24 well-plates with glass coverslips, with a final seeding density of 5 ×
104cells/cm2, alone and mixed in equal parts, 3dps. Quantification of tumor cell number (controls and
mix) total (i) and individual (QGP1 and CM), normalized (ii). Quantification of the fraction of mitotic cells
of each cell line, alone and in mix (iii). Fraction of QGP1 and CM cells in the mix (iv). Fraction of the
Ki67 positive cells (proliferative cells, which are not at G0 stage) (v) and Caspase 3 positive cells
(apoptotic cells) (vi), comparing QGP1 and CM alone and in mix. Results from statistical analysis
comparing the differences between two conditions were performed using t-tests (see statistical methods
section), which have a P-value output, represented in the following way: P≤0.0001 (****);
0.0001<P≤0.001 (***); 0.001<P≤0.01 (**); 0.01<P≤0.05 (*); P>0.05 (ns). In this case the sample number
(number of coverslips) was too low to perform a statistical analysis, except for (iv) – see Note 5 from
Technical details in the Methods section. The error bars represent the SEM. n - number of analyzed
coverslips in the respective condition, dps – days post seeding. .......................................................... 47
Figure 23: CM (ALT) is able to engraft in zebrafish but QGP1 (Tert+) is not and the behavior in mix
is similar. Time course of QGP1 (labelled with DiI, in red) and CM (labelled with Deep Red, in green)
injected in the PVS of 2dpf zebrafish, alone and mixed in equal parts (50-50), throughout a period of 4
days (20hpi, 2.5dpi and 4dpi). Images from live zebrafish at 20hpi and 2.5dpi were obtained in a
fluorescence scope (i-vi), which does not allow to observe Deep Red staining from CM cells. However,
the tumor masses can be observed in bright field images and are highlighted with green circles. Confocal
microscopy images from fixed zebrafish xenografts 4dpi, with nuclei staining with DAPI in blue (vii-ix).
The images for each condition are representative of what was observed for that condition and do not
correspond to the same fish. QGP1 injected alone were cleared from the zebrafish between 20hpi and
2.5dpi, while CM was able to successfully engraft 4dpi. In vii) it is not possible to observe any QGP1
cells, but only some DAPI signals that correspond to destroyed nuclei: larger circular signals in the
center of the image, formed by small dots (fragments of nuclei) instead of consistent large circles, typical
of nuclei from living cells. In mix, the behavior was similar, although a very small number of QGP1 cells

xiii
appear to withstand engraftment (ix). dpf - days post fertilization, hpi – hours post injection, dpi - days
post injection, PVS - periviteline space. ................................................................................................ 49
Figure 24: Timeline for the experiment. Preparation of the tumor cells to inject (Top, in red): Thawing
the cells, then expand the cell lines, by cell passage in T-flasks, during 1-2 weeks. On the day of the
injection the cells were stained with a fluorescent dye according to a specific protocol. Preparation of
the zebrafish larvae required for the in vivo injection (Middle, in blue): Cross an appropriate number of
adult zebrafish. The embryos were harvested in the following day and stored in an appropriate water
medium (E3) for 2 days at 28ºC. Main experiment timeline (Bottom, in green): 2dpf the cell lines were
stained and injected in the PVS of the zebrafish larvae (Day 0). 4dpi the zebrafish were sacrificed and
the tissues were fixed with PFA 4%. In the following day the immuno assay may be started, having a
series of steps that span across 3 days. At the end of this assay, the zebrafish were whole-mounted in
coverslips for microcopy observation. The injected tumors were observed by confocal microscopy,
where a series of pictures were acquired along the tumor’s depth (z-stack). These pictures were then
analyzed cell-by-cell, thus obtaining a quantification of the required readouts (the whole process takes
2-3 weeks, depending on the complexity of the analysis). dpf – days post fertilization, dpi – days post
injection.................................................................................................................................................. 53
Figure 25: Left: Hemocytometer grid. Only the cells present at the 4 fields outlined in red (quadrants)
are counted. Right: Zoom of a counting area with guidelines for a correct cell count (cells with a cross
should not be counted). Figure adapted from [40]. ............................................................................... 56
Figure 26: Slopping breeding tanks for adult zebrafish crossing. The sloped perforated part allows the
eggs to fall, while preventing the adults from eating it. The slope helps to mimic the shallow waters
where zebrafish mate in their natural habitat. Figure adapted from [44]. .............................................. 58
Figure 27: Injection of tumor cells into 2dpf zebrafish larvae. A) Anesthetized larvae are aligned in
previously prepared agarose plaques (2% Agarose), along tracks formed with agarose stripes. The
dorsal part of the larvae is oriented towards the agarose stripes. B) Hair-pin-loop, which is a tool
handmade from 1mm thick glass capillaries, human hair and tape that helps to gently manipulate the
larvae without damaging them. C) Aligned larvae already injected with tumor cells fluorescently labeled
with CM-DiI. D) Injection is performed as indicated on the left: the larvae is gently perforated by the
needle in the center of the yolk and the cells are pneumatically injected, through a short air burst into
the periviteline space (PVS), which is a small space between the yolk membrane and the outer fish
membrane. The result is a cell mass indicated in red (right). ................................................................ 59
Figure 28: Zebrafish at one cell stage. Figure adapted from [45]. ........................................................ 60
Figure 29: On top of a glass slide, a coverslip with 10 whole-mounted zebrafish xenografts from an
injection with CM-DiI stained SW480 cells, fixed 4dpi and immunofluorescent labeled Vimentin (from
experiment 1). It is only possible to observe the eyes of the zebrafish in this image (small black dots).
............................................................................................................................................................... 61
Figure 30: The different stages of mitosis in DAPI: Unsynchronized HeLa cells fixed and stained with
DAPI to show the condensed chromosomes at different stages of mitosis. Figure adapted from [46]. 65
Figure 31: Examples of the method used to quantify the images of zebrafish xenografts, obtained
through confocal microscopy. All of the images shown here are z-stack slices of zebrafish xenografts,

xiv
4dpi with SW620 alone. A) Quantification of the total cell number, using DAPI staining (in blue), counted
with a yellow pointer. B) Mitotic figures, counted with a red pointer. C) Ki67 positive cells (in red), counted
with a white pointer. D) Caspase 3 positive cells (in white), counted with a magenta pointer. E) Overlap
of the same Caspase staining from D (in white) with the respective DAPI signal (in blue). F) Projection
of the Caspase 3 staining from every tumor slice along the Z axis. A and B are images from the slice 8
of the same tumor and C from the slice 7. Images D-F belong to the same tumor among themselves,
but different from images A-C. .............................................................................................................. 66
Figure 32: Examples of the method used to quantify the images of zebrafish xenografts, obtained
through confocal microscopy. All of the images shown here are from the same z-stack slice (z=8) of the
same zebrafish xenograft, 4dpi with the mix SW480+SW620 (injected in equal proportion). A)
Quantification of the total cell number, using DAPI staining (in blue), counted with a yellow pointer. B).
Quantification of the number of SW480 cells (in red) from that slice, using a yellow pointer. C)
Quantification of the number of SW620 cells (in green), using a magenta pointer D) Ki67 positive cells
(in white): Ki67 positive SW480 cells counted with a red pointer and Ki67 positive SW620 cells counted
with a blue pointer. ................................................................................................................................ 67
Figure 33: Image acquisition of in vitro experiments by confocal microscopy. A) Schematic view of a
round coverslip used for the in vitro experiment. The area in orange is the center of the coverslip, where
a very high cell confluence is achieved 4dps, resulting in high cell death. In order to avoid this area, the
green area, just outside this necrotic center was chosen for the image acquisition of every coverslip. B)
Schematic view of a tile scan 2x3 from the green area of the image A. Images from this 6 adjacent fields
were acquired using a 40x objective from the confocal microscope. dps – days post seeding. .......... 73
Figure 34: Example of the method used to quantify images of in vitro assays, obtained through confocal
microscopy, using the tile scan tool. Here the DAPI channel of a 2x3 tile scan of a coverslip seeded with
a 50-50 mix of SW480+SW620 is shown. Total cell number was quantified by manual counting of every
DAPI signal (in blue), using a yellow pointer. ........................................................................................ 74
Figure 35: SW480 & SW620 Experiment 1. Cell proliferation of SW480 and SW620 cell lines injected
in the PVS of 2dpf zebrafish, alone and mixed in equal parts, 4dpi. Quantification of tumor cell number
(alone and in mix) total (i) and individual (SW480 and SW620), normalized (ii). Quantification of the
fraction of mitotic cells of each cell line, alone and in mix (iii). Fraction of SW480 and SW620 cells in the
mix (iv). Results from statistical analysis comparing the differences between two conditions were
performed using t tests (see statistical methods section), which have a P-value output, represented in
the following way: P≤0.0001 (****); 0.0001<P≤0.001 (***); 0.001<P≤0.01 (**); 0.01<P≤0.05 (*); P>0.05
(ns). The error bars represent the SEM. ns - not significant, n - number of analyzed tumors in the
respective condition, dpf - days post fertilization, dpi - days post injection, PVS - periviteline space. . 78
Figure 36: SW480 & SW620 Experiment 2. Cell proliferation and apoptosis of SW480 and SW620 cell
lines injected in the PVS of 2dpf zebrafish, alone and mixed in equal parts, 4dpi. Quantification of tumor
cell number (controls and mix) total (i) and individual normalized: SW480 (iii) and SW620 (iv). Fraction
of SW480 and SW620 cells in the mix (ii). Quantification of the fraction of mitotic cells of each cell line,
alone and in mix: SW480 (v) and SW620 (vi). Fraction of the Ki67 positive cells (proliferative cells, which
are not at G0 stage) (vii) and Caspase 3 positive cells (apoptotic cells) (viii), comparing SW480 and

xv
SW620 alone and in mix. Results from statistical analysis comparing the differences between two
conditions were performed using t tests (see statistical methods section), which have a P-value output,
represented in the following way: P≤0.0001 (****); 0.0001<P≤0.001 (***); 0.001<P≤0.01 (**);
0.01<P≤0.05 (*); P>0.05 (ns). The error bars represent the SEM. ns - not significant, n - number of
analyzed tumors in the respective condition, dpf - days post fertilization, dpi - days post injection, PVS -
periviteline space. .................................................................................................................................. 80
Figure 37: SW480 & SW620 Experiment 3 (without PU.1MO). Cell proliferation and apoptosis of
SW480 and SW620 cell lines injected in the PVS of 2dpf zebrafish, alone and mixed in equal parts, 4dpi.
Quantification of tumor cell number (controls and mix) total (i) and individual (SW480 and SW620),
normalized (ii). Quantification of the fraction of mitotic cells of each cell line, alone and in mix (iii).
Fraction of SW480 and SW620 cells in the mix (iv). Fraction of the Ki67 positive cells (proliferative cells,
which are not at G0 stage) (v) and Caspase 3 positive cells (apoptotic cells) (vi), comparing SW480 and
SW620 alone and in mix. Results from statistical analysis comparing the differences between two
conditions were performed using t tests (see statistical methods section), which have a P-value output,
represented in the following way: P≤0.0001 (****); 0.0001<P≤0.001 (***); 0.001<P≤0.01 (**);
0.01<P≤0.05 (*); P>0.05 (ns). The error bars represent the SEM. ns - not significant, n - number of
analyzed tumors in the respective condition, dpf - days post fertilization, dpi - days post injection, PVS -
periviteline space. .................................................................................................................................. 81
Figure 38: SW480 & SW620 Experiment 3 with PU.1MO. Cell proliferation and apoptosis 4dpi of
SW480 and SW620 cell lines (alone and mixed in equal parts), which were injected in the PVS of 2dpf
zebrafish previously injected with PU1MO 1mM (Experiment with PU1MO). Quantification of tumor cell
number (controls and mix) total (i) and individual (SW480 and SW620), normalized (ii). Quantification of
the fraction of mitotic cells of each cell line, alone and in mix (iii). Fraction of SW480 and SW620 cells
in the mix (iv). Fraction of the Caspase 3 positive cells (apoptotic cells) (v), comparing SW480 and
SW620 alone and in mix. Results from statistical analysis comparing the differences between two
conditions were performed using t tests (see statistical methods section), which have a P-value output,
represented in the following way: P≤0.0001 (****); 0.0001<P≤0.001 (***); 0.001<P≤0.01 (**);
0.01<P≤0.05 (*); P>0.05 (ns). The error bars represent the SEM. ns - not significant, n - number of
analyzed tumors in the respective condition, dpf - days post fertilization, dpi - days post injection, PVS -
periviteline space. .................................................................................................................................. 83

xvi
Table index
Table 1: Summary of the results from the quantification of 3 biological replicates of SW480 & SW620 in
vivo. Average and respective SEM of the results obtained in 3 independent experiments, for each
condition (both cell lines alone and in mix), regarding the different readouts that were studied -
engraftment, cell proliferation (total cell number, mitosis and Ki67) and cell death (Caspase 3). ........ 18
Table 2: Summary of the SW480 & SW620 in vitro experiment. Arithmetic means and respective SEM,
of the results obtained for every analyzed coverslip, for each condition (both cell lines alone and in mix),
regarding the different readouts that were studied - cell proliferation (total cell number per tile scan,
mitosis and Ki67) and cell death (Caspase 3). ...................................................................................... 25
Table 3: Concluding results obtained from the 3 independent experiments, 4dpi. Scoring of the change
in the behavior of each cell line, from the condition alone to mix, regarding the different readouts that
were studied - engraftment, cell proliferation (total cell number, mitosis and Ki67) and cell death
(Caspase 3). “+” represents a statistically significant increase in the corresponding readout, “-“ a
significant decrease and “0” a not significantly different change. dpi – days post injection. ................. 33
Table 4: Summary comparing the results obtained from the PU1MO experiment with the respective
control, 4dpi. Scoring of the change in the behavior of each cell line (both alone and in mix), from the
control to PU1MO regarding the different readouts that were studied - engraftment, total cell number,
cell proliferation (mitosis) and cell death (Caspase 3). “+” represents a statistically significant increase
in the corresponding readout, “-“ a significant decrease and “0” a not significantly different change. dpi
– days post injection. ............................................................................................................................. 34
Table 5: Strategies for the identification of the components of the host innate immune system that
regulate engraftment of SW480. MO – morpholino. .............................................................................. 40
Table 6: Specifications of the used fluorescent dyes, used dilution in DPBS 1X and periods of incubation
at 37ºC and on ice. ................................................................................................................................ 55
Table 7: Detailed values from the cell counting step of the cell staining protocol: Cell line and respective
staining, number of cell passages performed before the staining, proportion of dead cells, total number
of live cells harvested and its respective volume, as well as the final volume in which they were re-
suspended for injection in the intended concentration. ......................................................................... 56
Table 8: Specifications of the used primary and secondary antibodies. Some of these labels were not
mentioned in the Results section, because they were used simply as a control (e.g. anti-MHC, anti-PML
and Phalloidin). ...................................................................................................................................... 62
Table 9: Schematic calculation of the volumes of antibody used for each experiment: Volume used per
eppendorf tube with larvae, total number of eppendorf tubes, total volume used (diluted in blocking
solution), dilution factor and antibody stock volume used. Note: some values were rounded up in order
to avoid pipetting volumes bellow the error margin of the micropipettes. ............................................. 62
Table 10: Values used for the seeding of each in vitro experiment: Seeding density, cell number per
well, number of wells seeded per condition and total seeded cell number per condition. .................... 70
Table 11: Detailed values from the cell counting step of the cell staining protocol: Cell line and respective
staining, number of cell passages performed before the staining, proportion of dead cells, total number
xvii
of live cells harvested and its respective volume, as well as the final volume used for seeding the controls
and the mix. ND-not determined. .......................................................................................................... 70
Table 12: Schematic calculation of the volumes of antibody used for each experiment: Volume used per
coverslip, total number of coverslips, total volume used (diluted in blocking solution), dilution factor and
antibody stock volume used. Note: some values were rounded up in order to avoid pipetting volumes
bellow the error margin of the micropipettes. ........................................................................................ 72
Table 13: Summary of the results obtained from the 3 independent experiments, 4dpi. Scoring of the
intrinsic properties of each cell line, comparing the two of them, regarding the different readouts that
were studied - engraftment, cell proliferation (total cell number, mitosis and Ki67) and cell death
(Caspase 3). “+” represents a statistically significant increase in the corresponding readout, “-“ a
significant decrease and “0” a not significantly different change. The level of significance is indicated
with “stars” (*). ND – not determined. .................................................................................................... 82
Table 14: Summary of the results obtained from the 3 independent experiments, 4dpi. Scoring of the
change in the behavior of each cell line, from the condition alone to mix, regarding the different readouts
that were studied - engraftment, cell proliferation (total cell number, mitosis and Ki67) and cell death
(Caspase 3). “+” represents a statistically significant increase in the corresponding readout, “-“ a
significant decrease and “0” a not significantly different change. The level of significance is indicated
with “stars” (*). ND – not determined. .................................................................................................... 82
Table 15: Concluding results obtained from the PU1MO experiment, 4dpi. Scoring of the intrinsic
properties of each cell line, comparing the two of them and scoring of the change in the behavior of each
cell line, from the condition alone to mix, regarding the different readouts that were studied - engraftment,
cell proliferation (total cell number and mitosis) and cell death (Caspase 3). “+” represents a statistically
significant increase in the corresponding readout, “-“ a significant decrease and “0” a not significantly
different change. The level of significance is indicated with “stars” (*). dpi – days post injection. ........ 84
Table 16: Summary of the results from the quantification of the SW480 & SW620 in vivo experiment
with PU.1 morpholino. Arithmetic means and respective SEM obtained for each condition (both cell lines
alone and in mix), regarding the different readouts that were studied - engraftment, cell proliferation
(total cell number, mitosis and Ki67) and cell death (Caspase 3). ........................................................ 84
Table 17: Results of the normality tests applied to each data group (readout, cell line, condition) from
each experiment performed, using the statistics software GraphPad Prism 7. .................................... 85
Table 18: Freezing dates for the batch number of each cell line used in the SW480 & SW620 in vitro
experiment. ............................................................................................................................................ 89

xviii
Abreviations
Abs Absorbance
ALT Alternative Lengthening Of Telomeres
APBs ALT-associated PML bodies
ATCC American Type Culture Collection
𝐴𝑤𝑒𝑙𝑙 Surface area of the bottom of the well
CAFs Cancer-Associated Fibroblasts
Casp3 Caspase 3
CHT Caudal Hematopoietic Tissue
CRC Colorectal Cancer
DAPI 4',6-diamidino-2-phenylindole
DMEM Dulbecco's Modified Eagle Medium
DMSO Dimethyl sulfoxide
DPBS Dulbecco's Phosphate-Buffered Saline
dpf days post fertilization
dpi days post injection
dps days post seeding
ECM Extracellular Matrix
EGF Epidermal Growth Factor
EGFP Enhanced Green Fluorescent Protein
Em Emission
EMP Early Metastatic Potential
eq. equation
ERMS Embryonal Rhabdomyosarcoma
Exp Experiment
FBS Fetal Bovine Serum
FGF Fibroblast Growth Factor
HLA Human Leukocyte Antigen
hpi hours post injection
LMP Late Metastatic Potential
MDSCs Myeloid-Derived Suppressor Cells
MHC Major Histocompatibility Complex
MO morpholino
n number of samples
ND Not Determined
no. number
ns not significant (statistically)
P P-value
PBS Phosphate-Buffered Saline
PET Pancreatic Endocrine Tumor

xix
PFA paraformaldeyde
PML Promyelocytic Leukemia
PVS Periviteline Space
SCLC Small Cell Lung Cancer
SD Standard Deviation
SEM Standard Error of the Mean
STR Short Tandem Repeat
TAMs Tumor-Associated Macrophages
TANs Tumor-Associated Neutrophils
Tert+ Cells with overexpression of telomerase
TERTp telomerase promoter
TGF-β Transforming Growth Factor Beta
TICs Tumor-Initiating Cells
TME Tumor Microenvironment
VEGF Vascular Endothelial Growth Factor

1
Part I – Cooperation between two colorectal cancer cell populations
Introduction
Cancer
Cancer is the generic term for a large group of diseases that can affect any part of the body, thus
existing more than 100 different types of cancer. One defining feature of cancer is the fast generation
of abnormal cells that grow beyond their usual boundaries. These can then invade adjacent parts of the
body and spread to other organs forming metastases, which is the major cause of death from cancer
[1].
Cancer is among the leading causes of mortality worldwide with approximately 14 million new cases
and 8.2 million cancer related deaths in 2012. Alarmingly, the number of new cases is expected to rise
by about 70% over the next 2 decades. The most common sites of cancer diagnosed in 2012 were lung,
breast, prostate, colorectal, stomach and liver [1, 2]. In Portugal, over 27% of the total deaths in 2010
were caused by cancer alone, being the most prevalent cancer types the same ones as in the rest of
the world [3].
There is a group of essential alterations in cell physiology that dictate malignant growth, which are
shared in common by most types of human tumors, named the hallmarks of cancer [4, 5]. The six
hallmarks are:
sustaining proliferative signaling
evading growth suppressors
resisting cell death
enabling replicative immortality
inducing angiogenesis
activating invasion and metastasis
Recent advances in the field led to the proposal of two additional hallmarks: deregulating cellular
energetics and avoiding immune destruction, as well as two enabling characteristics of cancer: genome
instability and mutation and tumor promoting inflammation. Given these hallmarks, cancer therapies
must target each of these cancer characteristics, in order to stop tumor growth and metastasis [4, 5].
In spite of the advances made in cancer therapy, conventional therapies (surgery, chemotherapy
and radiotherapy) are failing to keep up with the increasing cases of cancer worldwide. Some of the
major inabilities in the current use of these approaches lie in their unvarying nature: the same therapy
is applied to every patient bearing the same cancer type, but different results are obtained, since some
patients respond positively and others do not. This is a consequence of tumor heterogeneity.
Tumor heterogeneity
In most cases, the population of cells within a tumor are derived from a single normal cell that suffers
a transformation via spontaneous mutations, thereby forming a homogenous tumor of monoclonal origin.
However, tumor development allows the continual acquisition of new mutant alleles by a fraction of its
cells, through a process called genetic diversification. This easily originates a heterogeneous tumor, a
property of cancer termed intratumor heterogeneity [6, 7].
Genetic instability is in fact one of the previously mentioned hallmarks of cancer and is responsible
for enhancing heterogeneity. Genetic instability of cancer cells result in mutation rates that are much
higher than in normal cells. Some of the acquired mutations are able to confer selective advantage over

2
the other cells and, eventually, clonal descendants of the original mutant cell dominate in a localized
area by displacing the cells that lack these mutations. At a certain point, one of the malignant cells may
suffer a new mutation that offers an even higher selective advantage and the tumor evolves successively
according with this Darwinian selection process, through the preferential outgrowth of clones with higher-
than-average fitness [5-7].
The source of intratumor heterogeneity is, however, not only caused by genetic diversity (that arise
from somatic mutations), but also by non-genetic traits, such as epigenetic abnormalities and stochastic
mechanisms, i.e. the stochastic nature of biochemical processes within cells, such as transcription [7].
The random nature of the Darwinian evolution of cancer causes each tumor to be unique. The
resulting intertumor heterogeneity points towards a personalized cancer therapy approach in the
future, in which personalized screens may help to design the better therapeutic approach for each
patient.
Cell-to-cell intratumor variability is displayed through several phenotypic features that include
activation of signaling pathways, evasion of antitumor immunity, induction of senescence, production of
secreted factors, migration, metastasis, angiogenic capacity, genetic makeup, response to anticancer
agents and activation of metabolic pathways. Furthermore, intratumor heterogeneity applies not only to
tumor cells but also to components of the microenvironment, which will be explored further ahead in this
text [7].
Intratumor heterogeneity poses a challenge for cancer diagnosis and treatment selection. Cancer
diagnosis is usually based on sampling of the tumor through biopsies of a small region of the tumor,
which may not be representative of the tumor as whole, especially regarding the different clones
composing it (Figure 1). Treatment decisions will be made based on the results of such biopsies and
most likely target the predominant clones. If successful, treatment eliminates the dominant clone.
However, clones that are resistant to therapy can be positively selected and drive disease progression,
possibly leading to relapse [7].
Furthermore, metastases may arise from cells that disseminated at an early stage of tumor
development, before treatment or even at diagnosis, or may develop from clones that survived the initial
therapy. Therefore, the clonal composition of metastases may be considerably different from the primary
tumor sample. Consequently, treatments that are designed according to analyses of the initial diagnostic
sample may be inappropriate for treatment of metastatic disease (Figure 1). It is now clear that a
comprehensive analysis of each cancer situation, focusing on its intratumor heterogeneity, is required
in order to choose a treatment that will render a higher chance of success [7].

3
Figure 1: Effects of intratumor heterogeneity on the predictive value of cancer diagnosis. Cancer diagnosis
usually requires sampling the tumor through biopsies, which inevitably capture only a small fraction of all tumor
cells and thus may not be representative of all subclones (represented by cells of different colors). Treatment
decisions are guided by the analysis of these biopsies, which are likely to sample the predominant clones. If
successful, treatment eliminates the dominant clone, but clones resistant to therapy (represented by yellow cells)
are positively selected and drive disease progression. Cells that disseminated early during tumor development (e.g.
before treatment or even diagnosis) may create distant metastases. Therefore, the clonal composition of metastatic
lesions may differ significantly from that of the primary tumor sample, and consequently, treatments designed
according to analysis of this primary sample may be inefficient to treat metastatic disease. Figure adapted from [7].
Cancer dynamics
Although evidence of intratumor heterogeneity has been found in a wide range of cancers, the
dynamics that operate among the heterogeneous subpopulations is far from being understood [8].
There is growing evidence that cancer cells behave as communities interacting with each other on a
regular basis. The majority of subclonal interactions are likely to be neutral, but the majority of
interactions that manifest phenotypically are either negative or positive (Figure 2 A).
Negative interactions are a natural result of Darwinian evolution, where the survival of the fittest
triggers clonal competition. In these kinds of interactions, the fittest population can outcompete other
subclones and take over the tumor landscape. Over time this can result in clonal selections and reduced
heterogeneity within tumors [8].
Positive interactions result in clonal cooperation, arising as a consequence of mutualistic or
synergistic tendencies between tumor subclones that benefit the tumor as a whole (Figure 2 A). Such
cooperation would therefore be sustained throughout tumor evolution and is thus likely to be a major
driver of intratumor heterogeneity. Clonal cooperation supports the idea that, instead of only one clonal
population accumulating all the mutations that enable the acquisition of the hallmarks of cancer, several
cooperating partially transformed subclones may by-pass full transformation by benefiting one another
(e.g. one subclone may be invasive and another one secrete angiogenic factors), driving tumorigenesis
through division of labor, thus accelerating tumor progression [8, 9].
Positive interactions may even allow one of the subpopulations to acquire new characteristics, as it
was studied by Calbo and colleagues [10] using a mouse model of small cell lung cancer (SCLC). Using
this model, tumors showed to be composed by two phenotypically different subclones: one with

4
neuroendocrine profile and another with mesenchymal profile. When both subclones were engrafted in
mouse as a mixed population, the mesenchymal cells enabled the neuroendocrine cells with metastatic
capacity, but no metastasis was ever observed when either of the subclones was engrafted alone.
Positive interactions may include one population giving a benefit to another without being affected
itself (commensalism - Figure 2 A). This would be caused by diffusion of growth factors or other shared
resources, which can be named public goods, allowing the proliferation of “free-rider” or “cheater”
subclones that take advantage of the resources produced by the “common gooder” subclones [8, 9].
Furthermore, the crosstalk between two or more subpopulations may be established through direct
communication via paracrine or juxtacrine effects, considered tumor-autonomous, or may be mediated
through components of the microenvironment in a non-tumor-autonomous manner (Figure 2 B) [8].
Figure 2: A) Types of ecological interactions that may occur among tumor cell populations. Cancer cells may
be able to engage in a variety of interactions that affect their fitness and survival. These interactions can be classified
into two major groups: negative and positive interactions. The most relevant negative interaction is competition,
which usually arises due to limitations in resources, and it can cause one cell population to kill or suppress
competitor cells (e.g. via secretion of toxic molecules). Amensalism occurs unidirectionally, through inhibition of one
population by another that is not affected. Other antagonistic relationships include parasitism and predation, which
benefit one population by consuming biomass at the expense of the other, but are unlikely to be seen among cancer
cells. Commensalism is a type of positive interaction by which one population (common gooder) can benefit another
without being affected itself. In synergism, two or more populations give rise to novel characteristics in the whole
system that are absent if either population is present alone (e.g. ability to metastasize [10]), without necessarily
having an effect on the individual population. In mutualism, two or more populations cooperate and bring in
resources that will benefit all of the interacting parties, thus in cancer it may be capable of increasing the fitness of
the tumor as a whole. B) Mechanisms for crosstalk between tumor cell populations. Exemplification of distinct
cellular populations communicating in a unidirectional manner, which may occur directly through paracrine (i) or
juxtacrine effects (ii) of ligands that are produced by one cell and received by the second. These interactions could
also be indirectly mediated via components of the microenvironment, such as blood vessels, immune cells and
fibroblasts (iii). Figure adapted from [8].
Interactions among tumor cell populations add a layer of complexity to therapeutic interventions in
heterogeneous tumors, possibly leading to a poor prognosis. Besides the complications brought by
intratumor heterogeneity alone, which were already mentioned (previous chapter and Figure 1), clonal
A B
i)
ii)
iii)
Tumor-autonomous
Non-tumor-autonomous

5
dynamics can change in response to therapy to establish new heterogeneous populations that may
confer resistance to treatment [8].
On the bright side, a better understanding of the clonal interactions in cancer may allow the
improvement of the therapeutic design for heterogeneous tumors. Choosing a therapy that targets
specifically a selfish clone may prove ineffective, even if it is the dominant one, since the other
populations that are non-responsive to therapy can keep growing and maintain the tumor (Figure 3 A).
However, if a more ecological thought if put into therapy and the mechanisms of clonal interaction are
targeted, the chance of success will be higher. One approach could be targeting a clone with a positive
influence, such as a “common gooder” clone, so as to remove the paracrine effectors or the public good
upon which the remaining populations rely (Figure 3 B). This could more easily lead to reduction of
tumor growth and a successful therapy [8, 9].
Figure 3: Improving therapeutic design for heterogeneous tumors. A) Targeted therapies can fail to prevent
tumor growth if the targeted subclone is “selfish” or has no influence on the behavior of other populations within the
tumor. Even if there is an initial reduction in tumor size, the other neutral populations that are non-responsive to
therapy can keep growing and maintain the tumor, leading to relapse. B) Better understanding of cooperative
interactions may allow the identification of non-cell-autonomous drivers or ‘common gooder’ subclones that promote
tumor growth by influencing nearby populations. If therapeutic interventions can eliminate these populations or stop
their interaction mechanism, the overall growth of the tumor could be stopped. Figure adapted from [8].
Tumor microenvironment
As it was previously mentioned, the crosstalk between cancer populations may be mediated through
the tumor microenvironment (TME), which therefore plays a relevant role in cancer dynamics. The
tumor microenvironment is composed by several cell types besides the cancer cells, which frequently
undertake heterotypic interactions with them, including endothelial cells, pericytes, cancer-associated
fibroblasts, progenitor cells of the tumor stroma and immune inflammatory cells (Figure 4) [5].
Tumor-associated endothelial cells compose the arteries, veins and capillaries that form the tumor
vasculature. They undergo activation by cancer cells through angiogenic switch, allowing the formation
A
B

6
of new blood vessels that feed the proliferating tumor. Pericytes are specialized mesenchymal cells
(related to smooth muscle cells) that wrap around the endothelial tubing of blood vessels and are known
to provide paracrine support signals to the endothelium [5].
Cancer-associated fibroblasts (CAFs) are in many cases the preponderant cell population of the
tumor stroma and become activated by tumor-derived factors, such as transforming growth factor beta
(TGF-β) and fibroblast growth factor (FGF). CAFs secrete extracellular matrix (ECM) proteins that
regulate differentiation, modulate immune responses and deregulate tissue homeostasis as well as
providing secreted growth factors that support tumorigenesis, such as vascular endothelial growth factor
(VEGF), which induces angiogenesis that sustains tumor growth [5, 11].
The wide variety of cells in the TME is due to immune inflammatory cells, which may include cells
from the innate immune response, such as macrophages, neutrophils and Natural Killer cells as well as
from the adaptive immune response, such as T-cells and B-cells and even cells that link both responses
such as dendritic cells. Immune inflammatory cells act in two opposing ways: they can be either tumor-
antagonizing or tumor-promoting. On one hand, the immune system detects and targets infectious
agents with the adaptive immune response, which is supported by cells of the innate immune system.
On the other hand, the innate immune system is involved in wound healing and clearing of cellular debris
[5, 12].
These tasks are performed by distinct subclasses of inflammatory cells, namely a class of
conventional macrophages and neutrophil, and subclasses of ‘‘alternatively activated’’ macrophages,
neutrophils and myeloid progenitors that are engaged in wound healing. The latter subtypes are able to
release signaling molecules, such as epidermal growth factor (EGF), VEGF, FGF2, chemokines and
cytokines, which work as effectors of tumor-promoting actions. Consistent with their expression of these
diverse effectors, tumor-infiltrating inflammatory cells have been shown to induce and help sustain tumor
angiogenesis, to stimulate cancer cell proliferation, to facilitate tissue invasion and to support the
metastatic dissemination and seeding of cancer cells [5].
Although macrophages are classically regarded as relevant effector cells during immune defense,
tumor-associated macrophages (TAMs) have shown supporting roles in tumor progression.
Macrophages are functionally plastic and are able to alter their polarization state, which ranges from M1
to M2, in response to different tissue microenvironments. Classically activated M1 macrophages secrete
pro-inflammatory cytokines, participate in antigen presentation and have an anti-tumorigenic role,
whereas alternatively activated M2 macrophages promote anti-inflammatory actions and have pro-
tumorigenic functions [11]. Certain TAMs are able to stimulate angiogenesis, enhance tumor cell
migration and invasion and suppress antitumor immunity. Consequently, specialized subpopulations of
TAMs may be important new therapeutic targets [13].
Resembling TAMs, tumor-associated neutrophils (TANs) also have differential states of
activation/differentiation, which can take an anti-tumorigenic N1 phenotype versus a pro-tumorigenic N2
phenotype. The antitumor activities of N1 TANs include expression of more immunoactivating cytokines
and chemokines as well as a higher capacity of killing tumor cells. The blockade of TGF-β favors the
accumulation of N1 TANs meaning that TGF-β is a paramount cytokine within tumors that defines the
TAN phenotype and influences their differentiation towards the N2 pro-tumorigenic phenotype. TANs

7
with a N2 phenotype are capable of supporting tumor growth by producing angiogenic factors and
matrix-degrading enzymes, support the acquisition of a metastatic phenotype, and suppress the anti-
tumor immune response [14, 15].
Evasion and suppression of the host immune system is one of the hallmarks of cancer, allowing the
survival and proliferation of tumors [5]. One of the most common mechanisms of immune evasion is
through the suppressive activity of myeloid-derived suppressor cells (MDSCs), which are immu-
nosuppressive, immature myeloid cells. MDSCs are mobilized during tumorigenesis and infiltrate
developing tumors, where they promote tumor vascularization, invasion (intravasation and extravasation
of cancer cells in circulation, during metastasis) and disrupt key mechanisms of immunosurveillance,
including antigen presentation by dendritic cells (DCs), T cell activation and M1 macrophage polarization
[11, 16].
Figure 4: The tumor microenvironment. The tumor microenvironment is composed by a multitude of components
besides cancer cells, including cancer stem cells, cancer-associated fibroblasts and progenitor cells of the tumor
stroma, components of the tumor vasculature such as endothelial cells and pericytes, as well as immune
inflammatory cells, including macrophages, neutrophils, dendritic cells, natural killer cells, T cells and B cells. Figure
adapted from [5].
Zebrafish model
The present work relied on zebrafish (Danio rerio), which has been increasingly used as an animal
model for human cancer, not only through spontaneously developed cancer, but also through
xenotransplantation of human cancer cells, either into adults or embryos/larvae. Zebrafish provides a
simplified model of the actual conditions of a tumor in a human patient. As an in vivo model it offers
certain advantages that are very relevant in cancer research, such as allowing a three-dimensional
tumor architecture and providing a rich tumor microenvironment encompassing an ECM, immune
system cells, vascular tissue and a multitude of secreted molecules, allowing the study of
microenvironmental regulation in cancer. Providing these factors is critical, as it became clear in this
work through the significantly different results that were obtained in vivo when compared with in vitro
experiments [17, 18].
The zebrafish at the development stage in which it was used (up to 6 days old) does not exhibit an
adaptive immune response yet, but only an innate immune response. Production of T-cell progenitors
begins at 3 days post fertilization (3dpf) in the thymus. However, immunocompetence in zebrafish, as
measured by humoral response to T-dependent and T-independent antigens, is not reached until 4-6
weeks after hatching. Thus, zebrafish are exposed to environmental pathologies up to 4 weeks without

8
a mature adaptive immune system [19]. This prevents a higher immune rejection of the injected cells,
which is very important to take the best advantage of the patient’s tumor sample, in a context of a
personalized medicine assay (the maximum number of engrafted zebrafish, the more reliable are the
results). In the context of this work, this allowed to specifically study the interaction between the tumor
and the innate immune components of its microenvironment (e.g. macrophages and neutrophils).
Published results revealed that knockdown of the myeloid transcription factor PU.1 in recipient
zebrafish led to a dramatic decrease in tumor angiogenesis, indicating that these myeloid cells (mainly
macrophages and neutrophils) are required for angiogenesis and subsequent metastasis [17, 20]. This
study provides an important link between the microenvironment and cancer cell metastasis, and points
the way to future large-scale efforts at dissecting these complex interactions in vivo using zebrafish.
Comparing with other in vivo models, the zebrafish provides valuable benefits. The transparent
embryos allow for in vivo visualization of cancer growth and progression at single-cell resolution,
allowing the study of tumor cell subpopulations [17]. A zebrafish model of embryonal
rhabdomyosarcoma (ERMS) allowed the in vivo visualization of different subpopulations of fluorescently
labelled zebrafish ERMS cells. The animals were imaged with confocal microscopy, which revealed that
late-stage ERMS showed distinct localization of the tumor-initiating cells away from more differentiated
tumor cells. Importantly, the more differentiated tumor cell populations (which are incapable of tumor-
initiating activity) were the most likely to intravasate blood vessels, a key step in metastasis, raising the
hypothesis that tumor-initiating populations, metastatic populations and fully differentiated populations
may all have distinct compartments and molecular identities [21].
Furthermore, xenotransplantation of human cancer cells into zebrafish provides opportunities for
personalized cancer screens, which is the target that the laboratory group is pursuing [22]. It is possible
to obtain a high number of injected samples within a short period of time (1 operator can inject 200
larvae/hour), increasing the reliability and statistical significance of each assay, and the maintenance
costs of zebrafish are lower when compared with mammal models, such as mouse.
Additionally, since the zebrafish larvae is much smaller than mammal models, it requires a smaller
tumor sample for the assay. Moreover, a short time period (i.e. 4 days after injection) is enough to obtain
differential and conclusive results between distinct experimental conditions, allowing a shorter time-
frame to obtain results, when compared with mouse models which take at least couple of months. These
issues are extremely relevant for clinical application in a context of patient derived xenografts, especially
the last one, since it may allow the application of this model to rapidly advise clinicians for the better line
of treatment for a certain patient. Importantly, results obtained by the laboratory group [22] showed that
xenotransplantation of human cancer cells performed using a zebrafish larvae assay (presented in the
next section) were successfully replicated in mouse with equivalent results.
Studying interactions between cancer populations using a zebrafish model
In order to better understand the dynamics that govern cancer evolution in an intratumor
heterogeneity context, the hypothesis of clonal cooperation was tackled: Is it possible that two tumor
populations are capable of interacting with one another, namely in a cooperative way, thus benefiting
cancer progression? Alternatively, would they simply evolve along with the cancer development in an

9
independent fashion? In other words, is it possible that in a tumor, “the whole is greater than the sum of
its parts”, thus attesting the famous Aristotle quote?
For this purpose an experiment was designed, using two colorectal cancer (CRC) cell lines, SW480
and SW620 which were derived from the same patient (isogenic cell lines) in different stages of tumor
progression. SW480 was isolated from the primary tumor (colorectal adenocarcinoma) and SW620 was
derived from the lymph node metastasis of the same cancer patient, six months later [23].
The experiment was performed using the zebrafish in vivo model. A mix of SW480 and SW620 cell
lines in equal proportion (50-50) was injected in zebrafish larvae and, as controls, each cell line was
injected separately (Figure 5; details in the methods section). If these two cell lines do not undergo any
of the aforementioned interactions, then the individual behavior of each one would be the same both in
the mix and in the controls. Otherwise, if they do communicate, then at least one of the cell lines would
endure a behavior alteration in the mix when compared with the control.
It is important to point out that the injections are performed in the periviteline space (PVS) of the
zebrafish, not only because it is close to the intestine of the host, so as to replicate the natural habitat
of the CRC cells (the human intestine), but also because it provides the best place to form a stable and
consistent tumor as well as allowing a feasible injection.
Furthermore, by mixing both clones in xenografts, the aim was to recapitulate the original interactions
that occurred in the primary tumor, possibly reflecting the original selection of the metastatic clone that
colonized the lymph node.
Figure 5: Layout of the in vivo competition assay between SW480 and SW620 cell lines. A mix of the CRC cell
lines SW480 and SW620 in equal proportion (50-50) was injected in the PVS of 2 dpf zebrafish larvae. As controls,
each cell line was injected separately in different zebrafish. The goal was to observe if the behavior of any of the
two cell lines changes when they are mixed together (when compared with the controls) which would mean that a
certain interaction is taking place between the two of them. In order to assess the behavior of these cell lines, a set
of several readouts was used: the ability of these cells to engraft in the zebrafish, cell proliferation (total cell number,
mitosis and Ki67 staining) and cell death (Caspase 3 staining). These readouts were measured 4 dpi. CRC -
Colorectal cancer, PVS - periviteline space, dpf - days post fertilization, dpi - days post injection.
Preliminary results from our group [22] had already showed that SW480 engrafted poorly in zebrafish
(less than 40%), not being able to withstand 4 days in vivo before being cleared. In contrast, SW620
had a high engraftment (around 90%) as well as a higher cell proliferation than SW480, which was
sustained by significantly higher fraction of mitotic cells and Ki67 positive cells. Given the higher
proliferation and engraftment capacity of SW620, when compared to the isogenic cell line SW480, it
Controls
Mixture
SW480 SW620
SW480 + SW620 (50-50)
Does the behavior of any of the 2 cell lines change?

10
would be expected that if both cell lines were to be mixed and injected in zebrafish, SW620 would
outcompete SW480, which would be practically eliminated. Surprisingly, preliminary results showed that
the engraftment of SW480 seemed to increase when it was mixed with SW620, contradicting what was
expected (cell competition) and alerting for the possibility of cooperation between both cell lines.
In order to investigate these results, I set out to repeat the previous experiment so as to confirm the
engraftment results as well as further characterizing this system. The increased number of SW480
xenografts when SW620 is present may be explained through several features:
1. Alteration of SW480 cell proliferation in mix, i.e. an increase in SW480 proliferation may allow
cells to multiply, thus sustaining the tumor and achieve a successful engraftment.
2. Alteration of SW480 cell death in mix, i.e. a decrease in SW480 cell death may allow prolonged
survival of SW480 and enable them to sustain engraftment.
3. Alteration of the interaction between SW480 cells and cells from the host innate immune system,
i.e. SW480 may be cleared by the immune system, but when injected with SW620 they are
somehow able to evade clearing by the immune system.
It is even possible that a combination of some of the previous points is taking place. For example, as
it was previously mentioned, immune inflammatory cells from the tumor microenvironment such as
TAMs, TANs or MDSCs have been described to display pro-tumorigenic behavior, through stimulation
of tumor proliferation and immune evasion.
In order to test the previous hypothetical alterations that SW480 may be experiencing in presence of
SW620, the previously described zebrafish experiment with a mixture of both populations was performed
and several readouts were quantified 4 days post injection (dpi). Cell proliferation was assessed, through
quantification of the total cell number of each cell line, the fraction of mitotic cells and the fraction of Ki67
positive cells. Total cell number was analyzed by quantification of DAPI signal, which stains cell nuclei.
Mitotic cells were analyzed by quantification of DAPI signals characteristic of a cell undergoing division
(see methods section). Immunostaining with anti-Ki67 antibody allowed the assessment of the cells
undergoing in active proliferation, i.e. labels all the cells that are not resting in the cell cycle G0 phase,
allowing the determination of the growth fraction of a given cell population [24]. The cell death for each
cell line was assessed through quantification of the fraction of Caspase 3 positive cells, which marks
apoptotic cells. Immunostaining with anti-Caspase 3 antibody allowed staining of this protein, which is
activated during cell apoptosis and released when the cell membrane integrity becomes compromised
[25]. It is important to notice that although it was used to estimate cell death, cell apoptosis is only one
of the cell death mechanisms, which may be programed cell death (e.g. through apoptosis or autophagy)
or non-programed cell death (e.g. through necrosis) [26].

11
Results
Engraftment of SW480 is enhanced in the presence of SW620.
Engraftment is defined as the incorporation of grafted tissue into the body of the host [27]. In the
context of this work, engraftment is the incorporation/presence of the injected human tumor cells in the
zebrafish (host). Since the experiment lasted 4 days, the engraftment was defined as the capacity of the
injected cells to subsist in the zebrafish PVS at the end of 4 days. The rate of successful engraftment is
therefore the ratio between the number of zebrafish bearing a tumor of a certain cell line at 4dpi and the
number of zebrafish that were successfully injected (equation 1).
Scoring of this engraftment rate was performed 4dpi, when the larvae were sacrificed. All the samples
were observed with a fluorescence scope and both the number of total fish present (denominator of eq.
1) and the number of fish that present a tumor (numerator of eq. 1) were registered.
It is important to notice that the scoring of injected vs non-injected zebrafish was performed
approximately 24 hours post injection (hpi) and the non-injected samples were discarded (see Figure 6
and methods section). Therefore, equation 1 does not take into account samples that do not have a
tumor in the first day post injection (they are considered samples that were not successfully injected
during the injection step of the protocol). Additionally, all dead fish were continually removed during the
experiment period, so they were not considered as well.
𝐸𝑛𝑔𝑟𝑎𝑓𝑡𝑚𝑒𝑛𝑡 % =𝑛𝑜. 𝑓𝑖𝑠ℎ 𝑤𝑖𝑡ℎ 𝑡𝑢𝑚𝑜𝑟 4𝑑𝑝𝑖
𝑛𝑜. 𝑠𝑢𝑐𝑐𝑒𝑠𝑠𝑓𝑢𝑙𝑙𝑦 𝑖𝑛𝑗𝑒𝑐𝑡𝑒𝑑 𝑓𝑖𝑠ℎ (1𝑑𝑝𝑖)× 100 (1)
Figure 6: Relevant experimental steps for the determination of the engraftment rate. In day 0, stained human
tumor cell lines were injected in the PVS of 2dpf zebrafish larvae. Approximately 24hpi all the samples were
screened in a fluorescence scope and the ones that did not present a tumor were considered unsuccessful
injections (the tumor was not properly injected by the operator) and discarded. During the 4 days of the in vivo
experiment, the water medium was replaced daily and dead fish were removed. At the end of the experiment period
(4dpi) the zebrafish were sacrificed and the engraftment rate was scored: using a florescence microscope to detect
the fluorescent staining of the cell lines, the number of samples bearing a tumor and the total number of samples
were counted.
Results from in vivo competition experiments between SW480 and SW620 revealed that, when
injected alone, SW480 was frequently cleared from the host during the experiment period, yielding a
poor engraftment rate of 41±5% (engraftment rate of 3 independent experiments merged and the
respective standard error of the mean (SEM)) (Figure 7 B). In contrast, SW620 alone was able to
withstand in the PVS during the 4 days and obtaining a very high engraftment rate of 84±5%.
Interestingly, it was observed a great increase in the engraftment of SW480 when mixed with SW620,
which rises up to 86±4%. A representative figure of this behavior is shown in Figure 7 A.
Inject cells in
zebrafishDay 0
Remove non-
injected fish
Day 1Remove dead fish
Days 1-4
Score engraftmentDay 4

12
These results were analyzed in two different ways. Firstly, the engraftment results of 3 independent
experiments were merged and the respective differences proved to be significantly different (Figure 7
B). Secondly, the engraftment rate of each of these 3 experiments was calculated separately, as well
as the rates for previous experiments performed by the laboratory group, with both cell lines alone
(Figure 7 C). This allowed to confirm that the previously mentioned differences are maintained even
when multiple independent experiments (more than 3) are analyzed separately.
Furthermore, Figure 7 C shows that engraftment rates of SW480 alone are considerably
heterogeneous, ranging approximately from 20% to 60%. This heterogeneity may be explained through
a probable higher intratumor heterogeneity of SW480 (which was derived from the primary tumor) than
SW620 (which was derived from a metastatic site) (see Figure 1, from Introduction). Due to this higher
heterogeneity of SW480 cells, it is possible that the initial population evolves along different paths when
they are expanded in cell culture, due to the stochastic events (e.g. gene expression). This may result
in selection of clones that are more prone to rejection in the zebrafish (e.g. due to immune recognition)
in one experiment and more prone to engraftment in another.
In order to better understand this change in behavior that SW480 cell line undergoes, the ability of
this tumor cell line to remain in the PVS of injected zebrafish was followed during the 4 days of
experiment. Images from the zebrafish xenografts were captured twice a day, using a fluorescence
scope. A representative time course is presented in Figure 8, which shows that SW480 cells were
progressively cleared from the host during the experiment period, when injected alone. On the other
hand, SW480 mixed with SW620 were not significantly cleared, being able to withstand engraftment
4dpi and actually increasing their cell number during this period (Figure 8 A).
The results from this experiment revealed that, when SW480 cells were injected alone, 71% of the
tumors disappeared during the 4 days and specifically 50% of the tumors decreased mainly in the first
36 hours post injection, practically disappearing at the end of this period (Figure 8 B). This clearance
during the initial hours of experiment is consistent with the time-frame during which the innate immune
cells (neutrophils and macrophages) act during a wound healing response [28], which is triggered in this
situation by the wound performed upon injection of cancer cells.
This analysis led to hypothesizing that SW480 are being highly recognized by one or more
components of the host innate immune system, while SW620 is not, and when both are mixed, SW620
is able to protect SW480 from this immune reaction.

13
SW480+SW620 engrafted 4dpi SW480 not engrafted 4dpi
i) iii)
ii) iv)
A
SW
480
SW
480@
Mix
SW
620
SW
620@
Mix
0
2 0
4 0
6 0
8 0
1 0 0
G lo b a l E n g ra f tm e n t %
Fra
cti
on
of
fis
h w
ith
tu
mo
ur (
%)
n = 7 4n = 1 0 5 n = 6 1 n = 7 4
* * * n s
* * *
SW
480
SW
480@
Mix
SW
620
SW
620@
Mix
0
2 0
4 0
6 0
8 0
1 0 0
E n g ra f tm e n t % p e r e x p e r im e n t
Fra
cti
on
of
fis
h w
ith
tu
mo
ur p
er e
xp
erim
en
t (%
)
* *
n = 3n = 1 1 n = 7 n = 3
* * * *
n s
B C
Figure 7: Engraftment of SW480 is enhanced in the presence of SW620. A) Representative fluorescence images of
the change of the engraftment behavior of SW480: SW480 injected alone not engrafted 4dpi (i and ii) and SW480 injected
in a 50-50 mix with SW620 engrafted 4dpi (iii and iv). This figure shows both fluorescence scope images at the moment
of sacrificing zebrafish (i and iii), where only SW480 is visible in red (SW620 had to be stained with infra-red dye, hence
it was not visible here), as well as confocal microscopy images, showing SW480 in red, SW620 in green and nuclei staining
with DAPI in blue (ii and iv). In ii) it is not possible to observe any stained SW480 cells because they were cleared from
the fish during the period of experiment and it is even possible to observe some DAPI signals that correspond to destroyed
nuclei: larger circular signals in the center of the image, formed by small dots (fragments of nuclei) instead of consistent
large circles, typical of nuclei from living cells. Image pairs i, ii and iii, iv are not from the same zebrafish, but just
representative of what can be observed in both conditions. B) Comparison of the engraftment rate of both cell lines, either
alone or in mix, merging the results from 3 different and independent experiments. C) Comparison of the engraftment rate
of both cell lines, either alone or in mix, from the 3 different experiments performed in this work as well as previous
experiments from the laboratory group, with SW480 and SW620 injected alone in zebrafish. Each point represents one
experiment, knowing that the number of samples (injected fish) for each of these experiments stands between 10 and 67.
See Notes 1 and 2 from Technical details in the Methods section. Statistical analysis of B was performed using a Z-test
and in C using t-tests (see statistical methods section). The error bars represent the standard error of the mean (SEM).
dpi - days post injection.

SW4
80
SW
48
0 +
SW
62
0
0.5 dpi 1 dpi 1.5 dpi 3 dpi 4 dpi
Figure 8: SW480 is cleared in vivo during the first 36hpi, but withstands engraftment 4dpi when mixed with SW620.
A) Time course of SW480 (labelled with CM-DiI, in red) injected in the PVS of 2dpf zebrafish, alone and in a 50-50 mix
with SW620 (labelled with Deep Red, not visible in this figure), throughout a period of 4 days (0.5dpi, 1dpi, 1.5dpi, 3dpi
and 4dpi). SW480 was cleared from the fish, when injected isolated, but it was clearly present 4dpi, when injected along
with SW620. B) Quantification of the fraction of injected zebrafish that contain a tumor, across the experiment period. 71%
of the tumors with SW480 alone showed size reduction throughout the 4 days and 50% decrease mainly in the first 36
hours. dpf - days post fertilization, dpi - days post injection, PVS - periviteline space.
1 d p i 1 .5 h p i 4 d p i
0
2 0
4 0
6 0
8 0
1 0 0
T im e -c o u rs e o f S W 4 8 0 tu m o rs
Fra
cti
on
of
fis
h w
ith
tu
mo
ur (
%)
n = 1 4 n = 1 4n = 1 4
B
A

15
Cell proliferation of SW480 is enhanced by the presence of SW620 in vivo
The increase in the engraftment of SW480, when mixed with SW620, could be explained by an
increase in cell proliferation. To test this, cell proliferation was assessed, both in controls and in mix,
through quantification of several readouts, such as total cell number of each cell line, fraction of mitotic
cells and fraction of Ki67 positive cells.
SW480 showed an extremely lower proliferation than SW620, which was sustained by a lower total
cell number (127±16 vs 1051±121, respectively) as well as a lower fraction of mitotic cells
(0.170±0.060% vs 0.91±0.13%, respectively) (Figure 9 i, ii and Figure 10 i, iii). However, remarkably, in
the mix there was a higher number of SW480 cells than in the control (268±30 vs 64±8, respectively),
while the number of SW620 cells did not change significantly from the control to the mix (Figure 9 i-iii
and Figure 10 ii), except for Experiment 2 in which it actually decreased (see appendix - Figure 36 iv).
In agreement with these results, the fraction of SW480 mitotic cells increased significantly in
presence of SW620, from 0.170±0.060% to 0.79±0.11% (more than a 4 fold increase), whereas the
fraction of SW620 mitotic cells did not change significantly while in presence of SW480 (decreased from
0.91±0.13% to 0.73±0.10% but it was not statistically significant) (Figure 9 i-iii and Figure 10 iii).
In spite of the increased cell proliferation of SW480 in mix, SW620 remained the prevalent population,
comprising 60±1% of the tumor, while SW480 formed the remaining 40±1% (Figure 9 iii and Figure 10
iv).
These results revealed an increased cell proliferation of SW480 in mix. However, when the Ki67
antibody was used (a marker of cellular proliferation), there was no significant difference in the fraction
of Ki67 labeled cells between controls and mix (Figure 9 iv-vi and Figure 10 v). This may be due to the
fact that Ki67 an unspecific proliferation marker that labels all the cells that are not resting in G0 phase.
Therefore, the combination of these results reveals that the fraction of SW480 cells in an active
proliferative stage (Ki67%) is maintained in the mix, but in fact, the rate of cell division (Mitosis %)
increases in presence of SW620.
Apoptosis-associated cell death of SW480 does not change in presence of SW620 in
vivo, but apoptosis of SW620 decreases in the mix
The increase in engraftment of SW480 when it was mixed with SW620 could also be explained by a
decrease in cell death of SW480. To test this, the cell death of each cell line was assessed, both in
controls and in mix, through quantification of the fraction of Caspase 3 positive cells, which marks
apoptotic cells.
The fraction of Caspase 3 positive SW480 cells did not change significantly from controls to mix
(Figure 9 vii, ix and Figure 10 vi). Therefore, no observation indicates that a decrease in the apoptosis
of this cells is the reason behind the increased engraftment in mix.
Interestingly, in SW620, the fraction of Caspase 3 positive cells decreased from control to mix (from
1.78±0.34% to 0.90±0.14%), suggesting that SW620 suffered less apoptosis in presence of SW480
(Figure 9 viii, ix and Figure 10 vi). Looking more closely at the results, it is possible to determine that
this behavior was mainly observed in Experiment 3, in which the fraction of Caspase 3 positive cells in
SW620 decreased from 2.98±0.57% to 0.97±0.10% when mixed with SW480 (Figure 37 vi in appendix).

16
Since this decrease was only observed in one experiment, it would be relevant to perform other
independent experiments in order to validate that SW620 also takes a benefit from the interaction with
SW480.
The net values obtained in the quantifications analyzed so far are presented in Table 1.
SW480 SW480+SW620 SW620
DA
PI
iv) v) vi)
vii) viii) ix)
iii)
Ki6
7
Cas
pas
e 3
ii) i)
Figure 9: SW620 enhances the cell proliferation ability of SW480 in vivo. Cell apoptosis of SW480 does not
change in presence of SW620 in vivo, but the cell apoptosis of SW620 decreases in the mix. Cell proliferation
and apoptosis of SW480 (labelled with vibrant CM-DiI, in red) and SW620 (labelled with Deep Red, in green) cell
lines injected in 2dpf zebrafish, alone and mixed in equal parts. Representative immunofluorescence images of
4dpi zebrafish xenograft sections at the injection site (PVS) of SW480 (i, iv, vii), SW620 (ii, v, viii) and their mix (iii,
vi, ix). Nuclei staining with DAPI in blue. Representative images of cell number and mitotic figures (i-iii), Ki67 staining
in white (iv-vi) and Caspase 3 staining in white (vii-ix). dpf - days post fertilization, dpi - days post injection, PVS -
periviteline space.

17
Figure 10: SW620 enhances the cell proliferation ability of SW480 in vivo. Cell apoptosis of SW480 does
not change in presence of SW620 in vivo, but the cell apoptosis of SW620 decreases in the mix. Results
from 3 independent experiments focusing on cell proliferation and apoptosis of SW480 and SW620 cell lines
injected in the PVS of 2dpf zebrafish, alone and mixed in equal parts, 4dpi. Quantification of tumor cell number
(controls and mix) total (i) and individual (SW480 and SW620), normalized (ii). Quantification of the fraction of
mitotic cells of each cell line, alone and in mix (iii). Fraction of SW480 and SW620 cells in the mix (iv). Fraction
of the Ki67 positive cells (proliferative cells, which are not at G0 stage) (v) and Caspase 3 positive cells (apoptotic
cells) (vi), comparing SW480 and SW620 alone and in mix. See Note 3 from Technical details in the Methods
section. Results from statistical analysis comparing the differences between two conditions were performed using
two tailed t-tests (see statistical methods section), which have a P-value output, represented in the following way:
P≤0.0001 (****); 0.0001<P≤0.001 (***); 0.001<P≤0.01 (**); 0.01<P≤0.05 (*); P>0.05 (ns). The error bars represent
the standard error of the mean (SEM). ns - not significant, n - number of analyzed tumors in the respective
condition, dpf - days post fertilization, dpi - days post injection, PVS - periviteline space.
SW
480
SW
620
Mix
(to
tal)
0
5 0 0
1 0 0 0
1 5 0 0
2 0 0 0
2 5 0 0
3 0 0 0
T o ta l c e lls
To
tal
ce
ll n
um
be
r* * * *
n = 3 8 n = 3 7 n = 5 4
* *
* * * *
SW
480
SW
480@
Mix
SW
620
SW
620@
Mix
0
2 5 0
5 0 0
7 5 0
1 0 0 0
1 2 5 0
1 5 0 0
T o ta l c e lls
To
tal
ce
ll n
um
be
r (
no
rm
ali
ze
d)
* * * *
n = 3 8 n = 3 7n = 5 1 n = 5 1
n s
SW
480
SW
480@
Mix
SW
620
SW
620@
Mix
0 .0
0 .5
1 .0
1 .5
2 .0
2 .5
3 .0
3 .5
M ito s is %
Fra
cti
on
of
mit
oti
c c
ell
s (
%)
n = 3 7 n = 3 7n = 5 1 n = 5 1
* * * *
* * * *
n s
SW
480@
Mix
SW
620@
Mix
0
2 0
4 0
6 0
8 0
1 0 0
C e ll fra c t io n in M ix
Ce
ll n
o.
/ T
ota
l tu
mo
ur c
ell
no
. (%
)
n = 3 8 n = 3 8
* * * *
SW
480
SW
480@
Mix
SW
620
SW
620@
Mix
0
1 0
2 0
3 0
4 0
5 0
6 0
7 0
K i6 7 %
Fra
cti
on
of
Ki6
7 p
os
itiv
e c
ell
s (
%)
n = 1 6 n = 1 0n = 1 6 n = 1 6
n s
n s
n s
SW
480
SW
480@
Mix
SW
620
SW
620@
Mix
0
1
2
3
4
5
6
7
C a s p a s e 3 %
Fra
cti
on
of
ca
sp
as
e 3
po
sit
ive
ce
lls
(%
)
n = 2 5 n = 1 5n = 2 6 n = 2 6
n s
n s
*
i) ii)
iii) iv)
v) vi)

18
Table 1: Summary of the results from the quantification of 3 biological replicates of SW480 & SW620 in vivo.
Average and respective SEM of the results obtained in 3 independent experiments, for each condition (both cell
lines alone and in mix), regarding the different readouts that were studied - engraftment, cell proliferation (total cell
number, mitosis and Ki67) and cell death (Caspase 3).
Readout SW480 SW480@Mix SW620 SW620@Mix
Engraftment % 41±5 86±4 84±5 86±4
Total cell no. (Normalized)
64±8 268±30 526±60 396±44
Mitosis % 0.17±0.06 0.79±0.11 0.91±0.13 0.73±0.10
Ki67 % 35.0±3.5 36.6±3.3 45.2±5.1 49.5±2.5
Caspase 3 % 2.09±0.35 1.75±0.22 1.78±0.34 0.90±0.14
Cell fraction (%) - 39.8±1.1 - 60.2±1.1
SW620 is not able to enhance SW480 cell proliferation in vitro
The previous results show that SW620 increases the ability of SW480 to proliferate in vivo, which is
sustained by data regarding both total cell number and fraction of mitotic cells, 4dpi in zebrafish.
Additionally, the presence of SW480 seemed to decrease the apoptosis of SW620 as well.
However, the reason behind these behavior changes is not clear so far. In order to understand the
cause of these observations, the interaction between the three players of the in vivo system was tackled:
SW480 cells, SW620 cells and the host (zebrafish). The first hypothesis to explain the observation would
be that the sole interaction between the two cell lines is sufficient to trigger these behavior changes
(Figure 11 A). However, a second hypothesis would be that this behavior changes require the host itself,
meaning that at least one of the cell lines has an effect upon the host that in turn allows for a behavior
change on the cancer cells (Figure 11 B).
In order to test these hypothesis, an in vitro assay was performed. A mix of SW480 and SW620 cell
lines, in equal proportion, was seeded on 24 well-plates with glass coverslips, with a total seeding
density of 4 × 10⁴cells/cm2. As controls, each cell line was seeded at the same seeding density. The
cell behavior was observed 4 days post seeding (dps) (see methods section for all the details).
If both cell lines are able to establish a tumor-autonomous interaction, then it is expected some sort
of behavior change from control to mix in at least one of the cell lines. On the other hand, if the two cell
lines interact only in a non-tumor autonomous fashion, then no behavior change should be observed,
since the microenvironment provided by the host would be required for the interaction between both cell
lines.

19
The in vitro experiment was performed using 3 different and independent batches of each cell line
(each batch consisting of a cell vial frozen at different dates – see methods section). Each of these
batches was used for the seeding of several coverslips, from which 3 were analyzed per batch (3
technical replicates per biological replicate), yielding a total of 9 coverslips per condition. These
coverslips were all analyzed together in Figure 13, in order to achieve a more simplified and statistically
relevant analysis.
The goal of this section was to analyze the behavior change of each cell line in vitro, from control to
mix, and compare it with the previous results in vivo, using the same readouts: cell proliferation
(measured through total cell number, mitosis and Ki67 staining) and cell death (measured through
Caspase 3 staining).
The methods used to analyze the readouts in each system were necessarily different. For example,
the total cell number in vivo was assessed through quantification of the total number of cells from each
cell line in the tumor of each injected zebrafish, 4dpi, while in vitro it was measured through quantification
of the cell number in equivalent representative fields of each seeded coverslip, 4dps (see methods
section). Therefore, the total cell numbers (extensive property) cannot be directly compared between in
vivo and in vitro experiments, but the remaining readouts are presented as a ratio (intensive properties),
so they may be compared.
Firstly, SW620 displayed a higher level of proliferation than SW480 both in vivo (Figure 9 i, ii and
Figure 10 i) and in vitro (Figure 12 A i, ii and Figure 13 i), but more noticeable in vivo. This means that
SW620 has an intrinsic higher proliferation capacity than SW480 which was replicated in both systems.
Of more interesting note were the results obtained in the previous in vivo experiments which showed
an increase in the cell number of SW480 4dpi when mixed with SW620, as well as an increase in the
fraction of mitotic figures in the same condition (Figure 9 i-iii). This increased proliferation of SW480 in
the mix was no longer clear in vitro (Figure 12 A and Figure 13 ii, iii).
Figure 11: Possible interactions in the in vivo system – tumor-autonomous vs. non-tumor-autonomous. A)
Hypothesis 1 (tumor-autonomous): the cause for the behavior change in mix (SW480+SW620) is mainly due to
direct interactions between the two cell lines. B) Hypothesis 2 (non-tumor-autonomous): the behavior change in
mix requires interactions between the tumor and its’ in vivo host.
A B

20
The active cellular proliferation was also assessed using Ki67 antibody, labeling all cells which are
not resting in G0 phase. No significant changes were observed in the fraction of Ki67 positive cells from
controls to mix in either cell lines in vitro (Figure 12 B, and Figure 13 v), similarly to what was previously
observed in vivo.
In order to estimate cell death in the tumor cells, Caspase 3 antibody was used again, labelling
apoptotic cells. Interestingly, the apoptosis of SW620 alone was lower than for SW480 alone in vitro
(Figure 12 C and Figure 13 vi), which was not previously observed in vivo. Furthermore, there were no
significant changes in the levels of apoptosis of either cell lines from control to mix in vitro, despite the
decrease of SW620 apoptosis from control to mix that was previously observed in vivo.
Further analysis revealed that the fraction of Caspase 3 positive cells from SW620 cell line alone
was higher in vivo (1.78±0.34%) than in vitro (0.57±0.14%) (P=0.0042), while such difference was not
observed for SW480. This means that SW620 cells suffer an increased apoptosis when they are injected
in zebrafish (when compared to in vivo conditions), while SW480 cells do not. Then, SW620 apoptosis
in vivo is rescued by SW480 when both are injected in mix, since it was previously observed a decrease
in SW620-associated Caspase 3 from control to mix, in vivo (Figure 10 vi). This reasoning gives extra
relevance for the positive effect that SW480 has on SW620 in vivo, which is decreasing SW620
apoptosis.
The net values obtained in the quantification of the in vitro experiment are presented in Table 2.
In summary, the behavior of both cell lines in vitro remained unaltered when they were mixed, so
there was no evidence of interactions between both of them in vitro. Therefore, these results suggest
that an interplay between tumor and host is required to explain the behavior changes in vivo. These
results point to a non-tumor-autonomous interaction as the most likely hypothesis (Figure 11 B), which
would be taking place between both cell lines, but mediated trough the microenvironment that is
provided by the host (as depicted in Figure 2 B iii from Introduction).

21
A
A
SW4
80
DAPI
SW6
20
SW
48
0+S
W6
20
i)
ii)
iii)
Figure 12 A: SW480 and SW620 do not show any clear impact on one another, in vitro, regarding cell
proliferation. Cell proliferation of SW480 (labelled with CM-DiI, in red) and SW620 (labelled with Deep
Red, in green) cell lines seeded on 24 well-plates with glass coverslips, with a final seeding density of 4 ×
104cells/cm2, alone and mixed in equal parts. Representative immunofluorescence images of total cell
number and mitotic figures, from equivalent fields from coverslips, 4dps with SW480 (i), SW620 (ii) and
their mix (iii). Nuclei staining with DAPI in blue. dps – days post seeding.

22
B
A
Ki67
SW4
80
SW
62
0
SW4
80
+SW
62
0
i)
ii)
iii)
Figure 12 B: SW480 and SW620 do not show any clear impact on one another, in vitro, regarding cell
proliferation. Cell proliferation of SW480 (labelled with CM-DiI, in red) and SW620 (labelled with Deep Red, in
green) cell lines seeded on 24 well-plates with glass coverslips, with a final seeding density of 4 × 10⁴cells/cm2,
alone and mixed in equal parts. Representative immunofluorescence images of equivalent fields from coverslips,
4dps with SW480 (i), SW620 (ii) and their mix (iii). Nuclei staining with DAPI in blue and Ki67 staining in white.
dps – days post seeding.

23
C
A
Caspase 3
SW4
80
SW
62
0
SW4
80
+SW
62
0
i)
ii)
iii)
Figure 12 C: SW480 and SW620 do not show any clear impact on one another, in vitro, regarding cell death.
Cell apoptosis of SW480 (labelled with CM-DiI, in red) and SW620 (labelled with Deep Red, in green) cell lines
seeded on 24 well-plates with glass coverslips, with a final seeding density of 4 × 10⁴cells/cm2, alone and mixed in
equal parts. Representative immunofluorescence images of equivalent fields from coverslips, 4dps with SW480 (i),
SW620 (ii) and their mix (iii). Nuclei staining with DAPI in blue and Caspase 3 staining in white. dps – days post
seeding.

24
i)
iii)
ii)
v)
iv)
vi)
Figure 13: SW480 and SW620 do not show any clear impact on one another, in vitro, regarding cell
proliferation and death. Quantification from the SW480 & SW620 in vitro experiment, merging the results from
every coverslip analyzed. Cell proliferation and apoptosis of SW480 and SW620 cell lines seeded on 24 well-
plates with glass coverslips, 4dps. Both the mix and the individual seeding of these cell lines was performed with
a final seeding density of 4 × 10⁴cells/cm2. Quantification of tumor cell number (controls and mix) total (i) and
individual (SW480 and SW620), normalized (ii). Quantification of the fraction of mitotic cells of each cell line, alone
and in mix (iii). Fraction of SW480 and SW620 cells in the mix (iv). Fraction of the Ki67 positive cells (proliferative
cells, which are not at G0 stage) (v) and Caspase 3 positive cells (apoptotic cells) (vi), comparing SW480 and
SW620 alone and in mix. Results from statistical analysis comparing the differences between two conditions were
performed using two tailed t-tests (see statistical methods section), which have a P-value output, represented in
the following way: P≤0.0001 (****); 0.0001<P≤0.001 (***); 0.001<P≤0.01 (**); 0.01<P≤0.05 (*); P>0.05 (ns). The
error bars represent the standard error of the mean (SEM). ns - not significant, n - number of analyzed coverslips
in the respective condition, dps – days post seeding.

25
Table 2: Summary of the SW480 & SW620 in vitro experiment. Arithmetic means and respective SEM, of the results
obtained for every analyzed coverslip, for each condition (both cell lines alone and in mix), regarding the different
readouts that were studied - cell proliferation (total cell number per tile scan, mitosis and Ki67) and cell death
(Caspase 3).
Readout SW480 SW480@Mix SW620 SW620@Mix
Total cell no. / tile scan (Normalized)
176±30 105±26 289±24 262±32
Mitosis % 1.25±0.24 2.78±1.10 2.66±0.28 2.80±0.65
Ki67 % 77±1 79±2 77±1 80±3
Caspase 3 % 1.46±0.35 1.60±0.79 0.57±0.14 1.32±0.50
Cell fraction (%) - 27.6±5.1 - 72.4±5.1
A downregulation of the host innate immune system increases the engraftment of
SW480
Results from the previous section indicated that the host (zebrafish) is very likely involved in the
alteration of behavior of the SW480 cell line when mixed with SW620. Hence, the interaction established
between these two cell lines would be mainly of a non-tumor-autonomous nature. This conclusion was
reached through a comparative analysis of the cell proliferation of SW480 alone and mixed with SW620,
which only increased in vivo. Nonetheless, previous results regarding the engraftment rates for each
cell line may give a hint for the mechanism underlying the dynamics of SW480 behavior. It was observed
that SW480 injected alone had a poor engraftment rate in zebrafish, but the engraftment increased very
significantly when it was injected mixed with SW620, which had a very high engraftment rate by itself.
One hypothesis for this behavior would be the recognition of SW480 by the host immune system and
subsequent elimination of these cells, while SW620 cells would be able to evade from the immune
system and successfully engraft in the host. Then, when both would be mixed, SW620 cells would be
able to actively protect SW480 from being recognized by the host immune system, or in the event of
being recognized, prevent them from being killed.
Previous results from our laboratory group give a hint towards this hypothesis [22]. When SW480
xenografts were randomly distributed to control or chemotherapy groups, an increase in the engraftment
was observed in the treated xenografts (from 26% in controls to 44% in Flofiri treatment and 56% in
Folfox). Bearing in mind that chemotherapy has an immunosuppressive effect, the most likely
explanation for this increase in the engraftment rate is the damage caused by the chemotherapeutic
drugs on the host immune system, thereby allowing SW480 to evade immune surveillance and engraft.
In order to tackle this hypothesis, an in vivo experiment was performed as before, but using zebrafish
previously injected (at one-cell stage) with PU.1 morpholino (PU.1MO). This would inhibit the production
of myeloid cells by the host, thus a much smaller number of innate immune cells would be expected to
be present in the zebrafish (see full details in the methods section). This means that the tumor cells
injected in these fish with PU.1MO would be exposed to a much lower number of innate immune cells
than their controls (without PU.1MO).

26
The engraftment rates were determined and it was confirmed that the controls maintained the same
behavior as described previously: the engraftment of SW620 alone (92±5%) was much higher than
SW480 alone (34.9±7.4%) and the engraftment of SW480 increases significantly to 86±7% when mixed
with SW620 (Figure 15).
Secondly, Figure 15 clearly shows that suppressing the host immune system through PU.1MO
injection enabled a significant increase in the engraftment of SW480 alone, from 34.9±7.4% to 84±7%.
Interestingly, the engraftment obtained for SW480 alone in PU.1MO (84±7%) was within the same range
of the engraftment of SW480 in mix for the control (86±7%). Therefore, inhibiting the host innate immune
system yields a similar result on the engraftment of SW480, as mixing this cell line with SW620,
suggesting a strong correlation between both conditions.
Furthermore, the engraftment of SW480 at mix in PU1MO achieved 100%, being significantly higher
than both the engraftment of SW480 alone in PU1MO and SW480 at mix in control. Thus the
combination of suppressing the host innate immune system with mixing SW480 with SW620 produces
a better engraftment result than just one of this two conditions.
Figure 14: Experiment layout of the PU.1MO experiment. The same experiment layout for the previous
experiments was duplicated: Each of the two CRC cell lines studied (SW480 and SW620) were injected separately
in the PVS of 2 dpf zebrafish larvae, as well as a mixture of these two cell lines in equal proportion (50-50). This
was performed in zebrafish previously injected with PU.1MO (at one-cell-stage) as well as in the same number of
zebrafish without this compound, which would be the controls of the experiment. The goal was to observe if the
behavior of any of the two cell lines (both alone and in mix) changed when they were injected in zebrafish with a
suppressed innate immune system (due to inhibition by PU.1MO), when compared with the controls. This would
mean that the host immune system has an impact upon these cell lines. In order to assess the behavior of these
cell lines, the same set of readouts as before were used: ability of these cells to engraft in the zebrafish, cell
proliferation (measured through total cell number, mitosis and Ki67 staining) and cell death (measured through
Caspase 3 staining). These readouts were measured 4 dpi. CRC - Colorectal cancer, PVS - periviteline space, dpf
- days post fertilization, dpi - days post injection.
Controls
PU.1MO
SW480
SW480
SW620
SW620
SW480 + SW620
SW480 + SW620
Does the behavior of any condition (especially SW480 alone) change in PU.1MO?

27
Figure 15: The engraftment of SW480 increases when the host innate immune system is downregulated.
Engraftment rates 4dpi of SW480 (alone and in mix) and SW620 (alone), injected in controls and PU.1MO injected
zebrafish. The engraftment of SW620 in mix was not determined, because this cell line was stained with Deep Red,
which could not be seen in the fluorescence scope used. However, previous experiments revealed that in the mix,
when one of the cell lines was present, the other was always present as well, so the engraftment rate could be
considered equal to SW480 in mix. Results from statistical analysis comparing the differences between two
conditions were performed using a Z-test (see statistical methods section), which have a P-value output,
represented in the following way: P≤0.0001 (****); 0.0001<P≤0.001 (***); 0.001<P≤0.01 (**); 0.01<P≤0.05 (*);
P>0.05 (ns). Besides the results presented, also SW480-PU1MO vs SW620-PU1MO and SW480-PU1MO vs
SW480@Mix-Control were “ns”. The error bars represent the standard error of the mean (SEM). ns - not significant,
n - number of analyzed tumors in the respective condition, dpi - days post injection, PU.1MO - PU.1 morpholino.
SW
480-C
on
tro
l
SW
480-P
U1M
O
SW
480@
Mix
-Co
ntr
ol
SW
480@
Mix
-PU
1M
O
SW
620-C
on
tro
l
SW
620-P
U1M
O
0
2 0
4 0
6 0
8 0
1 0 0
E n g ra f tm e n t: C o n tro l v s P U 1 M O
Fra
cti
on
of
fis
h w
ith
tu
mo
ur (
%)
n = 4 3 n = 3 2
n = 2 8
n = 1 2n = 2 6
n = 2 7
* * *
* n s* * *
* * *

28
Downregulation of the host innate immune system increases the total cell number of
SW480, but not its proliferation
As it was done in the previous in vivo experiments, cell proliferation (measured through total cell
number and mitosis) and cell death (measured through Caspase 3 staining) were characterized in the
competition assay with PU.1MO (Figure 14).
Comparing the results obtained in controls with the PU.1MO injected zebrafish, it was observed a
significant increase in the total cell number of SW480 cells, injected alone, from controls to PU.1MO
(Figure 16 A i, ii and Figure 17 iii). This observation may be explained by an expected lower number of
immune cells in the vicinity of SW480 cells in PU.1MO. This would result in a lower clearance of SW480
cells by the immune system and thereby a higher number of cells 4dpi. Furthermore, the total cell
number of SW480 alone in PU.1MO is not significantly different from the total cell number of SW480 in
mix without PU.1MO (Figure 17 iii), showing again a correlation between downregulation of the innate
immune system and injecting SW620 together with SW480. Therefore, both results suggest that SW620
offers protection to SW480 from the host innate immune response.
However, the level of mitosis of SW480 cells (injected alone) did not increase from control to
PU.1MO, suggesting that the host innate immune system has no influence on the proliferation of SW480
(Figure 17 v).
Additionally, the level of mitosis of SW620 cells in mix increased significantly in PU.1MO (Figure 16
A v, vi and Figure 17 vi). An explanation for this observation remains elusive, which would require further
experiments in order to increase the low sample number, thereby obtaining more solid results.
The levels of apoptosis (fraction of Caspase 3 immunostained cells) did not change in a statistically
significant fashion, when the cell lines were injected in PU.1MO (Figure 16 B and Figure 17 vii, viii).
However, further experiments could be helpful in order to validate these results, since the number of
samples analyzed in this experiment was small.
None of the remaining readouts changed significantly from controls to PU.1MO. These include the
fraction of each cell line in mix, the number of SW480 cells in mix, the number of SW620 cells alone
and in mix (Figure 17 ii, iii, iv), as well as the mitosis of SW620 alone and the mitosis of SW480 alone
and in mix (Figure 17 v, vi).
It is relevant to point out that this experiment had some technical problems. Although at the moment
when the engraftment rates were scored, a significant number of samples displayed large tumors, in all
the conditions except for SW480 alone in controls (as it was expected), when the same samples were
observed in the confocal microscope a large number of tumors had disappeared. This means that a
certain step of the procedure that follows zebrafish sacrifice - tissue fixation or the immuno assay -
compromised the experiment. This issue is further discussed in Note 3 of technical details in the
Methods section.

29
Control
SW4
80
A DAPI
PU.1MO
SW6
20
SW
48
0+S
W6
20
i) ii)
iii) iv)
v) vi)
Caspase 3
Control PU.1MO
B
SW4
80
SW
62
0
SW4
80
+SW
620
i) ii)
iii) iv)
v) vi)
Figure 16: The total cell number of SW480 increases when the host innate immune system is downregulated, but its proliferation does not. Cell proliferation and apoptosis of
SW480 (in red) and SW620 (in green) cell lines (alone and mixed in equal parts) injected in zebrafish, which was previously injected with PU.1MO and their respective controls.
Representative fluorescence images of cell number and mitotic figures (A), as well as Caspase 3 immunofluorescence (in white - apoptotic cells) (B) from 4dpi zebrafish xenograft sections
at the injection site (PVS) of SW480 (i, ii), SW620 (iii, iv) and their mix (v, vi). Nuclei staining with DAPI in blue. dpi - days post injection, PVS - periviteline space, PU.1MO - PU.1 morpholino.

30
i) ii)
iii) iv)
v) vi)
SW
480-C
on
tro
l
SW
480-P
U1M
O
SW
480@
Mix
-Co
ntr
ol
SW
480@
Mix
-PU
1M
O
0
2 0 0
4 0 0
6 0 0
8 0 0
1 0 0 0
T o ta l c e lls S W 4 8 0 : C o n tro l v s P U 1 M O
To
tal
ce
ll n
um
be
r (
no
rm
ali
ze
d)
n = 1 0
n = 5n = 1 3
n = 5
* *
n sn s
SW
480-C
on
tro
l
SW
480-P
U1M
O
SW
480@
Mix
-Co
ntr
ol
SW
480@
Mix
-PU
1M
O
0
1
2
3
4
M ito s is % S W 4 8 0 : C o n tro l v s P U 1 M O
Fra
cti
on
of
mit
oti
c c
ell
s (
%)
n s
n s
n = 9
n = 4n = 1 1
n = 5
n s
SW
480-C
on
tro
l
SW
620-C
on
tro
l
SW
480-P
U1M
O
SW
620-P
U1M
O
Mix
(to
tal)
-Co
ntr
ol
Mix
(to
tal)
-PU
1M
O
0
5 0 0
1 0 0 0
1 5 0 0
2 0 0 0
2 5 0 0
T o ta l C e lls : C o n tro l v s P U 1 M OT
ota
l c
ell
nu
mb
er
n = 1 0
n = 5n = 1 1
n = 2n = 8 n = 5
n s
* * * *
n s

31
Figure 17: The total cell number of SW480 increases when the host innate immune system is downregulated,
but its proliferation does not. Cell proliferation and apoptosis 4dpi of SW480 and SW620 cell lines (alone and
mixed in equal parts), which were injected in the PVS of 2dpf zebrafish, previously injected with PU1MO 1mM and
its respective control without PU1MO (Experiment with PU1MO vs. Experiment 3). Quantification of tumor cell
number (alone and in mix) total (i) and individual normalized: SW480 (iii) and SW620 (iv). Fraction of SW480 and
SW620 cells in the mix (ii). Quantification of the fraction of mitotic cells of each cell line, alone and in mix: SW480
(v) and SW620 (vi). Fraction of Caspase 3 positive cells (apoptotic cells) (vii and viii). Results from statistical
analysis comparing the differences between two conditions were performed using two tailed t-tests (see statistical
methods section), which have a P-value output, represented in the following way: P≤0.0001 (****); 0.0001<P≤0.001
(***); 0.001<P≤0.01 (**); 0.01<P≤0.05 (*); P>0.05 (ns). The error bars represent the standard error of the mean
(SEM). ns - not significant, n - number of analyzed tumors in the respective condition, dpf - days post fertilization,
dpi - days post injection, PVS - periviteline space.
vii) viii)

32
Discussion
Evidence of intratumor heterogeneity has been found in a wide range of cancers, posing a challenge
for cancer diagnosis and treatment selection. As a result of genetic instability, tumors from monoclonal
origin endure a series of mutations that result in multiple subclones with distinct phenotypic features.
These subclones are able to establish interactions among themselves, which are scarcely understood
nowadays and may yield relevant implications for cancer progression and thereby for cancer therapy.
The goal of this work was to determine whether two tumor cell populations derived from the same
patient, one from the primary tumor (SW480) and the other from a metastatic site six months later
(SW620), were able to establish interactions between each other and specifically if such interactions
were of a competitive or cooperative nature, allowing for the selection of one cell line or the increased
fitness for the tumor as a whole, respectively.
For that purpose, the zebrafish larvae xenograft model was used in order to offer a simplified version
of the actual conditions of a tumor in a human patient, such as a 3D architecture and a rich
microenvironment. This model has been increasingly used to study human cancer, due to its unique
abilities. These include in vivo visualization of cancer growth and progression at single-cell resolution,
thereby enabling the study of tumor cell subpopulations [17, 21], as well as allowing to obtain differential
results between distinct experimental conditions over a short experiment period (e.g. 4 days after
injecting tumor cells) [22].
Preliminary results from our group [22] had already shown that SW480 engrafted poorly in zebrafish,
while SW620 had a high engraftment, as well as a higher cell proliferation than SW480. Surprisingly,
the engraftment of SW480 increased when it was mixed with SW620, contradicting expectations and
alerting for the possibility of cooperation between both cell lines.
Such modification in the engraftment of SW480 may be a consequence of alterations in the behavior
of this cell line when it is mixed with SW620. Firstly, an increase in SW480 proliferation may allow cells
to multiply faster, thus sustaining the tumor and achieve a successful engraftment. Secondly, a decrease
in SW480 cell death may allow prolonged survival and enable these cells to sustain engraftment. Finally,
SW480 cell may be cleared by the immune system when injected alone, but when injected with SW620
they are somehow able to evade the immune system.
In order to test these hypotheses, a mix of SW480 and SW620 cell lines in equal proportion was
injected in zebrafish larvae and, as controls, each cell line was injected separately (see Figure 5). The
cell proliferation was assessed, through quantification of total cell number of each cell line, fraction of
mitotic cells and fraction of Ki67 positive cells. The cell death of each cell line was also assessed,
through quantification of the fraction of Caspase 3 positive cells, which marks apoptotic cells.
The observed alterations in the behavior of each cell line when they were injected in mix are
summarized in Table 3. This reveals that SW620 offers great benefits to SW480, through the increase
of its engraftment in zebrafish, total cell number and cell proliferation (fraction of mitotic cells).
Furthermore, SW620 is able to take its share of benefits from this interaction, through the decrease of
apoptosis-associated cell death. All in all, the cell line derived from the primary tumor undoubtedly

33
benefits from the presence of the metastatic cell line and likewise, the latter apparently benefits as well.
This implies that these two subpopulations of the same tumor are able to establish a cooperative
interaction, which eventually may be described as mutualism [8], since it benefits both parts and
therefore brings a benefit for the tumor as a whole.
However, positive interactions may include one population giving a benefit to another without being
affected itself. This would be caused by diffusion of growth factors or other shared resources, named
public goods, allowing the proliferation of “free-rider” or “cheater” subclones that take advantage of the
resources produced by the “common gooder” subclones [8, 9]. Considering that the benefits that SW620
takes from this interaction are less significant, a second possibility would be that this cell line acts as a
“common gooder”, through the production of some public goods such as ECM molecules, growth factors
or immune suppressors, which allow to increase the fitness of the “cheater” subpopulation SW480.
Table 3: Concluding results obtained from the 3 independent experiments, 4dpi. Scoring of the change in the
behavior of each cell line, from the condition alone to mix, regarding the different readouts that were studied -
engraftment, cell proliferation (total cell number, mitosis and Ki67) and cell death (Caspase 3). “+” represents a
statistically significant increase in the corresponding readout, “-“ a significant decrease and “0” a not significantly
different change. dpi – days post injection.
Readout SW480
(control→mix) SW620
(control→mix)
Engraftment + 0
Total cells + 0
Mitosis + 0
Ki67 0 0
Caspase 3 0 -
The nature of the reported interactions between both cell lines may be tumor-autonomous (e.g.
through paracrine or juxtacrine signaling) or may be mediated by components of the tumor
microenvironment in a non-tumor-autonomous process (see Figure 2 B from Introduction).
In order to test if the interactions established between both cell lines are tumor-autonomous or non-
tumor-autonomous, an in vitro assay was performed, in which both tumor cell lines were seeded in vitro,
either alone or in a mixture of equal proportion, followed by assessing the same readouts as the ones
used in vivo.
The results showed that the behavior of both cell lines in vitro remained unaltered when they were
mixed, so there was no evidence of interactions between both of them in vitro. Therefore, these results
suggest that an interplay between tumor and host is required to explain the behavior changes in vivo,
when the two cell lines are mixed, pointing to a non-tumor-autonomous interaction as the most likely
hypothesis.
Additionally, SW480 cells injected alone in zebrafish had a low engraftment, being cleared mainly in
the first 36 hours post injection, which is consistent with the time-frame of innate immune system action
when a wound-healing response is triggered [28], while SW480 mixed with SW620 had a high
engraftment. These observations, as well as the likely non-tumor-autonomous nature of the interactions
between both cell lines, led to reinforce the hypothesis that SW480 is being recognized by one or more
components of the host innate immune system (at this stage, the zebrafish does not have a mature

34
adaptive immune response). When both are mixed, SW620 would be able to protect SW480 from this
immune reaction.
In order to test this hypothesis, an in vivo experiment was performed using the zebrafish larvae model
with a downregulated innate immune system, accomplished by injection of PU.1 morpholino (PU.1MO).
This means that the tumor cells injected in these fish are expected to be exposed to a much lower
immune reaction than their controls (fish without PU.1MO).
The observed alterations in the behavior of each cell line (both alone and in mix) when they were
injected in PU.1MO are summarized in Table 4, which reveal an increased engraftment and total cell
number of SW480 when the innate immune system was suppressed (PU.1MO). This shows a correlation
between inhibiting the host innate immune system and adding SW620 to SW480. Inhibition of the host
innate immune system with PU.1MO apparently allowed a decreased immune rejection of SW480
injected alone, resulting in a higher engraftment and consequently a higher total cell number, which is
likely due to a lower cell death (which was not happening through apoptosis, since the levels of Caspase
3 did not change - Table 4).
Furthermore, the engraftment of SW480 at mix in PU1MO achieved 100%, being significantly higher
than both the engraftment of SW480 alone in PU1MO and SW480 at mix in control (Figure 15). Thus
the combination of suppressing the host innate immune system with mixing SW480 with SW620
produces a better engraftment result than just one of this two conditions. One possible explanation for
this observation lies in the fact that when SW620 was injected alone in PU.1MO, the engraftment was
already 100%. Consequently, when SW620 mixed with SW480 was injected in PU.1MO, the
engraftment of SW620 was 100% as well 1. As a result, SW480 may be engrafting more when both
conditions are combined, because it is able to withstand engraftment as long as SW620 does. This
would support the hypothesis of SW480 behaving as a “cheater” [8, 9], taking advantage of some “public
good” produced by SW620 in order to engraft better.
Table 4: Summary comparing the results obtained from the PU1MO experiment with the respective control, 4dpi.
Scoring of the change in the behavior of each cell line (both alone and in mix), from the control to PU1MO regarding
the different readouts that were studied - engraftment, total cell number, cell proliferation (mitosis) and cell death
(Caspase 3). “+” represents a statistically significant increase in the corresponding readout, “-“ a significant
decrease and “0” a not significantly different change. dpi – days post injection.
Readout (control→PU1MO)
SW480 SW480@Mix SW620 SW620@Mix
Engraftment + + 0 ND
Total cells + 0 0 0
Mitosis 0 0 0 +
Caspase 3 0 0 0 0
1 This requires assuming that in mix, when one cell line is present, the other one is also present, as it has been
previously observed. Therefore, the 100% engraftment of SW480 at mix in PU1MO can be extended to SW620 in the same condition.

35
The level of mitosis of SW480 cells (injected alone) did not increase from control to PU.1MO,
suggesting that the host innate immune system has no influence on the proliferation of SW480.
Furthermore, when the innate immune system was downregulated by the PU.1MO, the mitosis of
SW480 could still increase in presence of SW620 (Figure 38 iii in Appendix). This is consistent with the
hypothesis that SW480 cell proliferation increases due to interactions established with SW620, but not
mediated by cells of the innate immune system.
There are other cells from the tumor microenvironment that could be mediating the interaction
between SW480 and SW620, allowing increased cell proliferation of SW480. For example, cancer-
associated fibroblasts (CAFs) become activated by tumor-derived factors, such as transforming growth
factor beta (TGF-β) and fibroblast growth factor (FGF). CAFs secrete extracellular matrix (ECM) proteins
that regulate differentiation, modulate immune responses and deregulate tissue homeostasis as well as
providing secreted growth factors that support tumorigenesis, such as vascular endothelial growth factor
(VEGF), which induces angiogenesis that sustains tumor growth [5, 11]. Therefore, SW620 may be able
to activate CAFs through secretion of tumor-derived factors such as TGF-β and FGF. In turn, CAFs
could secrete ECM molecules that would allow an increased cell proliferation of SW480.
However, the innate immune system cannot be fully discarded from playing a role in SW480
proliferation. In theory, PU.1MO only downregulates the synthesis of cells from the innate immune
system and its action is unlikely to withstand until 4dpi (6 days after PU.1MO was injected). Therefore,
it is unlikely that PU.1MO could do a total shutdown of the innate immune system.
There is a potential explanation for the increase in the proliferation of SW480 in presence of SW620,
mediated by cells of the innate immune system. Possibly SW620 is able to change the polarization state
of one or more components of the innate immune system (macrophages and/or neutrophils) from an
anti-tumorigenic phenotype (M1/N1) to a pro-tumorigenic phenotype (M2/N2) that are capable of
releasing signaling molecules such as EGF, FGF, chemokines and cytokines. Some of these molecules
allow, not only to suppress anti-tumor immunity, but also stimulate cancer cell proliferation [5, 11, 13-
15]. Without SW620, the tumor microenvironment could not be modulated in a way that allowed the
increased proliferation of SW480 from control to PU.1MO. Consequently, the mitosis of SW480 injected
alone did not increase from control to PU.1MO (Figure 17 v from Results and Table 4), thus the proposed
explanation is consistent with the obtained results.
Additionally, MDSCs may also be involved in this mechanism: SW620 may have a higher ability to
recruit these immature myeloid cells that allow the tumor to evade the host immune system (e.g. through
polarization of macrophages from M1 to M2) [11, 16].
Zhang and colleagues [29] demonstrated the existence of crosstalk in a mouse model of breast
cancer, between tumor-initiating cells (TICs) (CD29hiCD24hi) and a more differentiated “mesenchymal-
like” population (CD29hiCD24low). They observed that the mesenchymal population enhanced the cell
proliferation of TICs in vitro and in vivo. Furthermore, they observed that a high expression of CXCL12
ligand by the mesenchymal subpopulation and the corresponding receptor CXCR4 by TICs were
involved in this crosstalk. This suggests that these subpopulations are able to establish a tumor-
autonomous cooperation, via the CXCL12/CXCR4 signaling pathway.

36
A similar interaction may be the cause for the increased proliferation of SW480, when in presence of
SW620. Although no interactions were observed in vitro, it is possible that in vitro conditions did not limit
SW480 proliferation in the same way that in vivo. For instance, the rich culture medium used in vitro
may already provide the necessary factors to allow a cell proliferation close to the maximum capacity of
this cell line, while these factors may be absent in vivo. When SW480 was seeded/injected alone, the
average fraction of SW480 mitotic cells in vitro was 1.25±0.24% while in vivo it was much lower
(0.17±0.06%) (P<0.0001). Therefore, SW620 is able to significantly increase the cell proliferation of
SW480 in vivo, but may not be able to do so in vitro, because cell proliferation it is already high.
All in all, there are several hypothesis to explain the increased cell proliferation of SW480 when co-
injected with SW620 in zebrafish. An interaction mediated by the host innate immune system remains
as the most likely hypothesis to explain the increased engraftment and total cell number of SW480 in
presence of SW620. It is even possible that a certain mechanism is responsible for the increased mitosis
and another one for the increased engraftment and cell number. Further work would be required to
determine the potential mechanisms behind the cooperative interactions observed between both cell
lines.
Therapy relevance
As it was demonstrated in this work, SW480 cells benefit from the crosstalk with SW620 cells, not
only increasing their ability to engraft, but also their proliferation and apparently SW620 cells also benefit
from this interaction resulting in a decreased cell death.
Considering that mixing both clones in xenografts may be recapitulating the original interactions that
occurred in the primary tumor, these results might be extrapolated for the early stages of development
of the primary tumor in which there was likely a larger fraction of SW480 progenitors and a smaller
fraction of SW620 progenitors.
Therefore, disrupting the crosstalk between SW480 progenitors and SW620 progenitors would likely
increase the success of treatment in the early stages of tumor development, by preventing the benefits
that the tumor as a whole may obtain from the interplay between these two subpopulations.
This suggestion for an ecologically driven therapy is based on interactions established between two
tumor populations of a specific cancer patient. Based on the known intertumor heterogeneity, there
could be an argument against such reasoning. Nonetheless, it is plausible that a certain set of
characteristics of each of these two cell lines is conserved across a large fraction of CRC patients,
enabling the adaptation of this ecologically driven therapy to each patient, in a context of personalized
therapy that takes into consideration intratumor heterogeneity as well.
In a similar way, Calbo and colleagues [10] studied the crosstalk between two cancer cell
subpopulations using a mouse model of small cell lung cancer (SCLC). This model showed that tumors
were composed by two phenotypically different subclones, one with neuroendocrine profile and another
with mesenchymal profile and that the cells with the mesenchymal profile enabled the cells with
neuroendocrine profile to acquire metastatic capacity. Therefore, disrupting the paracrine signaling
involved in this interaction could be explored as a strategy to prevent tumor progression.

37
Furthermore, given the likely non-tumor-autonomous nature of the interactions established between
SW480 and SW620, the disruption of the crosstalk between their progenitors in a therapy context may
be achieved through blocking of the tumor microenvironment components that mediate that crosstalk.
For example, if the host innate immune system proves to be involved in this mechanism, an
immunotherapy approach may be able to successfully prevent the crosstalk between both
subpopulations and mitigate tumor progression.
Conclusion
In conclusion, two CRC cell lines showed the ability to establish a cooperative interaction in vivo: A
metastatic cell line (SW620) enhanced the fitness of a primary cell line (SW480), which increased its
ability to engraft and proliferate in a zebrafish larvae model when both were injected together.
Additionally, SW480 may enhance the fitness of SW620 as well, through the decrease of its apoptosis-
associated cell death. This cooperative interaction was not observed in vitro, thereby sustaining the
possibility of a non-tumor-autonomous interaction, which is likely mediated through the tumor
microenvironment.
A downregulation of the host innate immune system allowed a behavior of SW480 that is positively
correlated with the presence of SW620, which is consistent with the hypothesis that the increased fitness
of SW480 is due to an immune modulation performed by SW620. However, a relationship between an
immune modulation and the increased proliferation of SW480 could not be observed.
All in all, this work increases the awareness for the relevance of cooperative clonal interactions
between tumor subpopulations that may increase the fitness of the tumor as a whole. Therefore, an
ecologically driven therapy, aiming to disrupt the crosstalk between cooperative subpopulations may be
the path towards a more successful cancer treatment.

38
Future Work
Studying metastasis in mixture
Assessing the metastatic capacity of both cell lines in mix and comparing with the controls would be
a readout that allowed further studying this model of clonal dynamics. As it has been previously
described [10], the cooperative interaction between two cancer subclones may lead to the emergence
of metastatic capacity in one of them, even when neither had such ability.
The process of metastasis involves several steps: i) invasion of surrounding tissues; ii) intravasation
into blood vessels; iii) survival in the circulation; iv) extravasation from the blood vessels and v) survival
and proliferation at a secondary site (i.e. colonization). Different cellular processes are required to
efficiently perform these separate steps [30]. By using the zebrafish xenograft model it is possible to
challenge cells to reveal their in vivo metastatic potential.
When tumor cell lines were injected in the zebrafish larvae it was clear that metastases were
frequently formed at a particular location of the zebrafish larvae, named the caudal hematopoietic tissue
(CHT), which makes this a perfect spot for assessing the metastatic potential. It is even possible to
distinguish between early (stages i-ii) and late (stages iii-v) metastatic potentials. For that purpose,
shortly after injection of the tumor cells, the injected fish are separated into two groups: group a)
zebrafish with tumor cells only in the PVS; group b) zebrafish with tumor cells in the PVS and in
circulation (Figure 18). At 4dpi, the number of xenografts that presented tumor cells in the CHT are
counted.
To achieve successful colonization, tumor cells in group a) have to go through all the metastatic
steps (stages i-v), whereas cells in group b) only have to go through the late ones (stages iii-v). Thus,
considering that maximum colonization is achieved when cells are placed in circulation (b) the reduction
of colonization in group a) reflects the effort to undergo the early metastatic steps. Therefore percentage
of CHT colonization (equation 2) may be converted into late metastatic potential (LMP) and early
metastatic potential (EMP), calculated by equations 3 and 4, respectively.
𝐶𝐻𝑇 % =𝑛𝑜. 𝐶𝐻𝑇 𝑖𝑛 𝑔𝑟𝑜𝑢𝑝 𝑋
𝑛𝑜. 𝑠𝑎𝑚𝑝𝑙𝑒𝑠 𝑖𝑛 𝑔𝑟𝑜𝑢𝑝 𝑋× 100 (2)
𝐿𝑀𝑃 = 𝐶𝐻𝑇% (𝑔𝑟𝑜𝑢𝑝 𝑏) (3)
𝐸𝑀𝑃 =𝐶𝐻𝑇% (𝑔𝑟𝑜𝑢𝑝 𝑎)
𝐶𝐻𝑇% (𝑔𝑟𝑜𝑢𝑝 𝑏) (4)

39
The present work revealed that although both cell lines appear to take benefits from their interaction,
SW480 is taking the most advantage of this cooperative behavior, through a significantly increased
proliferation. One could thereby suppose that in order to maintain this intratumor heterogeneity
successfully, it is likely that SW620 takes a further benefit from such an interaction, besides the apparent
slight decrease in cell apoptosis.
Looking closely at previous results obtained by the laboratory group [22], it was possible to observe
that SW480 has both a relatively high EMP (approximately 60%) and LMP (approximately 55%). On the
other hand, SW620 has a high LMP (approximately 60%), but a low EMP (approximately 25%). When
mixing both cell lines, one possible result would be an increase in the EMP of SW620, which may be
helped in the early stages of invasion by SW480.
This would make sense in terms of cancer evolution: SW620 was derived from a metastatic site, 6
months after SW480 was derived from the primary tumor of the same patient. However, SW620 displays
a low EMP, which would prevent them to successfully reach circulation. A simple explanation would be
that an early stage primary tumor was composed by a majority of SW480 progenitors and a minority of
SW620 progenitors. A fraction of this heterogeneous tumor was able to reach circulation and form a
new colony elsewhere, due to the capacity of SW480 progenitors for both early and late stages of
metastasis. Some SW620 progenitors may have been able to “free-ride” this invasive wave and, due to
a conceivable higher fitness, were able to sustain in the new tumor habitat and overcome the SW480
progenitors, thus becoming the dominant population at the metastatic site.
Explore the microenvironment players that control the tumor engraftment in the
zebrafish host
The present work showed that the engraftment of SW480 cells can be enhanced either by the
presence of SW620 cells or by the suppression of the host innate immune system. One hypothesis is
the ability of SW620 to modulate de host immune system in a way that decreases the immune reaction
(e.g. suppression of anti-tumor immune cells), which would otherwise recognize and kill the SW480
cells, thus allowing a higher engraftment rate of SW480.
Figure 18: Experimental procedure to assess metastatic potential in zebrafish xenografts, distinguishing EMP and
LMP. Tumor cell lines are injected only in the PVS of 2dpf zebrafish larvae, or into circulation as well. Tumor cells
that are able to form a colony in the CHT have metastatic potential. This could be full metastatic potential
(EMP+LMP) if the tumor cells were injected only in the PVS and forced to undergo all the stages of metastasis, or
LMP if they were already injected into circulation, thereby bypassing the first two stages of metastasis. EMP – early
metastatic potential, LMP – late metastatic potential, CHT – caudal hematopoietic tissue, PVS – periviteline space,
dpf – days post fertilization. This figure was adapted from [24].

40
In order to better understand the tumor-host interactions that regulate engraftment it would be useful
to identify the innate immune components that are involved. The injection of morpholinos that inhibit
specific components of the immune system would allow this identification: when the component
responsible for the elimination of SW480 cells and their poor engraftment is inhibited, an increase in the
engraftment would be expected (Table 5). This work already presented data that point towards the
implication of immune cells from the myeloid lineage (suppressed by the PU.1MO), which include a wide
array of innate immune system cells. Using zebrafish mutants may also be advantageous for the same
principle. They could help to identify which population of cells from the innate immune response are
more involved in the increased engraftment and cell number of SW480 (macrophages or neutrophils)
Table 5: Strategies for the identification of the components of the host innate immune system that regulate
engraftment of SW480. MO – morpholino.
Manipulation strategy Consequence for the host
PU.1 MO downregulation of the essential factor for myeloid lineage (macrophages and neutrophils)
C3 MO inactivation of complement cascade
C3 MO + PU.1 MO total elimination of innate immunity
mpeg MO downregulation of macrophages
mpx MO downregulation of neutrophils
PU.1 G242D mutants high level of neutrophils / low level of macrophages
Runx1 W54X mutants low level of neutrophils / high level of macrophages
Test potential mechanisms that regulate tumor dynamics and their interplay with the
microenvironment
In order to unveil the mechanisms responsible for the interactions established between SW480,
SW620 and the host, which result in the differential engraftment and proliferation that were observed in
the present work, a multi-step approach may be taken so as to find which molecules are involved in
such interactions.
Firstly, in silico analysis of published microarray data from SW480 and SW620 may be used in order
to find differentially expressed molecules between both cell lines. For example, molecules
overexpressed in SW620 (when compared with SW480) may be responsible for the postulated immune
suppressive action that allows a high engraftment of both SW620 and SW480 (when mixed), as well as
increasing the proliferation of SW480 in mix.
Further analysis of differential gene expression, comparing the transcriptome (obtained through
RNA-sequencing) of SW480 and SW620 in different experiment conditions: alone and in mix, in vivo
and in vitro could provide further candidates that are responsible for the interactions observed between
both cell lines in zebrafish, as well as the interactions with the host (microenvironment mediated).

41
The candidate genes obtained in the previous experiments could be tested by performing a knock-
down or a downregulation of each gene and assessing if in that condition the interaction is reverted in
vivo.
This approach could allow testing several hypothesis. For example, Zhang and colleagues [29]
observed the existence of crosstalk between two tumor subpopulations in a mouse model of breast
cancer, via the CXCL12/CXCR4 signaling pathway. They observed that a mesenchymal population
increased the expression of CXCR4 in presence of TICs, which secreted the corresponding ligand
CXCL12. Furthermore, TICs increased the proliferation of the mesenchymal population. Hypothetically,
if analysis of differential gene expression revealed that SW480 increased the expression of CXCR4 in
presence of SW620, then this pathway would be a potential mechanism for interaction between both
cell lines. If a downregulation of CXCL12/CXCR4 caused the reversion of one of the interactions
observed here, then this pathway could be the mechanism responsible for that interaction. This
reasoning could be applied to any potential pathways discovered.

42
Part II – Sustaining telomere elongation: Tert+ vs ALT cancer cell
populations
Introduction
Enabling replicative immortality is one of the hallmarks of cancer, which allows cancer cells to
multiply unlimitedly [5]. This capability contrasts with the behavior of most normal cells in the body, which
are able to endure only a limited number of cell divisions, known as the Hayflick limit [5, 31]. Telomeres
constitute the ends of linear chromosomes, comprising DNA repeats and associated proteins and are
directly implicated in the replication limit of cells. Telomeres provide protection against erosion of
chromosome-ends that occurs in each cell division as a result of the “end-replication problem”. Each
cell division requires the replication of its genetic material. Each time DNA replication occurs, the ends
of the chromosomes shorten, but the genetic information is protected by the telomeric repeat sequences
(which shorten instead of genetic information), allowing cells to keep dividing up to a certain limit. When
telomeres become too short they are no longer able to protect chromosome-ends [5, 32-35].
Telomerase is a reverse transcriptase that elongates telomeres, through the action of its catalytic
unit (Tert) and RNA template (Terc), counteracting the chromosome-end shortening. Telomerase
expression is restricted in most human somatic cells, causing telomeres to shorten during lifespan.
However, most cases of cancer (90%) present an overexpression of telomerase (Tert+ cells), allowing
the replicative immortality of cancer cells [5, 32, 33, 35]. Nonetheless, there are alternative methods that
cancer cells may acquire to maintain or increase the length of their telomeres in absence of telomerase
activity (required for the remaining 10% of human cancers), named alternative lengthening of
telomeres (ALT) [36].
Human ALT cells are characterized by great heterogeneity of telomere size (ranging from
undetectable to abnormally long) within individual cells, and presence of ALT-associated PML
(promyelocytic leukemia) bodies (APBs) that contain extrachromosomal telomeric DNA, telomere-
specific binding proteins, and proteins involved in DNA recombination and replication. Telomere length
dynamics in ALT cells suggest that a recombinational mechanism is behind the lengthening of
telomeres. Inter-telomeric copying occurs, consistent with a mechanism in which single-stranded DNA
at the end of one telomere invades another telomere and uses it as a copy template resulting in a net
increase in the telomeric sequence [36].
ALT and telomerase activity can co-exist within cultured cells, and within tumors, and ALT activity is
able to continue, even if there is exogenous telomerase present [36]. This recalls the intratumor
heterogeneity discussed in the previous part of this work (Part I). It is possible that one tumor
subpopulation exhibits telomerase activity (Tert+) while another one undergoes alternative lengthening
of telomeres (ALT) within the same tumor, being both able to maintain replicative immortality by
increasing/maintaining the length of their telomeres. Is it then possible that in an initial stage, all tumors
present both populations (Tert+ and ALT), but later, Tert+ becomes the dominant population (presumably
due to higher genome stability)?
This hypothesis may be addressed through the competition assay from Part I, using the zebrafish in
vivo model. For this purpose an experiment was designed, using two pancreatic endocrine tumor

43
(PET) cell lines, QGP1 and CM. QGP1 harbors a telomerase promoter (TERTp) mutation, which was
recently reported as a novel mechanism for telomerase re-activation/expression in order to maintain
telomere length, and it is ALT negative, representing therefore a Tert+ phenotype. On the other hand,
CM presents a TERTp wild-type and is ALT positive, representing thereby an ALT phenotype [37].
A mix of QGP1 (Tert+) and CM (ALT) cell lines in equal proportion was injected separately in zebrafish
larvae. As controls, each cell line was injected separately (Figure 19). If the Tert+ cell line consistently
dominates over the ALT cell line then the proposed hypothesis is a plausible one.
However, before doing this in vivo experiment, an in vitro experiment was performed, similarly to the
in vitro experiment in Part I. A mix of the two cell lines (QGP1 and CM) was seeded on 24 well-plates
with glass coverslips, with a total seeding density of 5 × 10⁴cells/cm2. As controls, each cell line was
seeded separately at the same seeding density. The cell behavior was observed 3 days post seeding
(dps) (see methods section for all the details). In order to assess the behavior of these cell lines, a set
of several readouts was used: cell proliferation, which was measured through total cell number, mitosis
and Ki67 immunostaining (marks cells undergoing in active proliferation, i.e. labels all the cells that are
not resting in the cell cycle G0 phase [24]) and cell death, which was measured through Caspase 3
immunostaining (marks apoptotic cells [25]).
Figure 19: Layout for the Tert+ vs ALT in vivo experiment. A mix of QGP1 (Tert+) and CM (ALT) cell lines in
equal proportion was injected in the PVS of 2 dpf zebrafish larvae. As controls, each cell line was injected
separately. The goal was to observe if QGP1 consistently dominates over CM, as well as if the behavior of any of
the two cell lines changes when they are mixed together, when compared with the controls, which would mean that
a certain interaction is taking place between the two of them. In order to assess the behavior of these cell lines, a
set of several readouts would be used: the ability of these cells to engraft in the zebrafish, cell proliferation (total
cell number, mitosis and Ki67 staining) and cell death (Caspase 3 staining). These readouts were measured 4 dpi.
PVS - periviteline space, dpf - days post fertilization, dpi - days post injection.
Controls
Mixture
QGP1 (Tert+) CM (ALT)
QGP1 + CM (50-50)
Does QGP1 consistently dominates over CM? Does the behavior of any of the 2 cell lines change?

44
Results
QGP1 (Tert+) cells have a higher proliferation than CM (ALT) cells in vitro and this is
maintained when the two cell lines are mixed
Results from the in vitro assay showed that QGP1 (Tert+) cells displayed a higher proliferation than
CM (ALT), which is sustained by their total cell number (119±36 vs 62±7, per equivalent field,
respectively) and fraction of mitotic cells (2.19±0.57% vs 0.115±0.115%, respectively) (Figure 20 A i,ii
and Figure 22 i, iii), as well as the fraction of Ki67 positive cells (96.7±0.4% vs 76.4±0.5%, respectively)
(Figure 20 B i,ii and Figure 22 v).
This behavior did not change when both cell lines were mixed, since the total cell number and the
fraction of mitotic cells did not change significantly for either cell line (Figure 20 A and Figure 22 ii, iii),
neither did the fraction of Ki67 positive cells (Figure 20 B and Figure 22 v). This resulted in a population
in mix composed by approximately 72±3% of QGP1 and 28±3% of CM (Figure 20 A iii and Figure 22
iv).
The apoptosis-associated cell death, measured by the fraction of Caspase 3 positive cells, was not
significantly different between QGP1 and CM, neither from control to mix for each of the two cell lines
(Figure 20 C and Figure 22 vi).
All in all, the two cell lines seem to behave independently from one another when in co-culture, given
that no change in their behavior was noticed. QGP1 has an intrinsic higher proliferation rate than CM,
sustained by a higher growth fraction (Ki67%) and a higher mitosis. This different proliferation capacity
remains similar when both cell lines were cultured together in direct mix, which resulted in QGP1 clearly
overtaking CM.
Interestingly, the CM cells undergo cell sorting (form groups isolated from the remaining cells) when
cultured together with QGP1 in vitro. In Figure 21 i) CM cells form a tightly packed 3D cluster over a
QGP1 layer (see Figure 21 ii) and in Figure 21 iii) it is possible to observe that these clusters spread
throughout the coverslip.
In conclusion, there is no apparent cell competition nor cooperation between both cell lines after 3
days in culture, in vitro. Tert+ cells simply have higher proliferation than ALT cells, thus overtaking them.

45
A
QG
P1
CM
Q
GP
1 +
CM
DAPI
i)
ii)
iii)
Ki67 B
i)
ii)
iii)
Caspase 3 C
i)
ii)
iii)
Figure 20: Tert+ (QGP1) cells showed a higher proliferation than ALT (CM) cells in vitro and this was maintained when there were mixed. Cell proliferation and apoptosis
of QGP1 (in red) and CM (in green) cell lines seeded on 24 well-plates with glass coverslips, with a final seeding density of 5 × 10⁴cells/cm2, alone and mixed in equal parts.
Representative immunofluorescence images of equivalent fields from coverslips, 3dps with QGP1 (A-C i) , CM (A-C ii) and their mix (A-C iii). Nuclei staining with DAPI in blue.
Representative images of cell number and mitotic figures (A), Ki67 staining in white (B) and Caspase 3 staining in white (C). All images were acquired with a 20x zoom. dps –
days post seeding.

46
Figure 21: CM (ALT) cell line undergoes cell sorting when it’s co-cultured with QGP1 (Tert+).
Immunofluorescence images of CM (in green) cell clusters over QGP1 (in red) layer, 3dps in vitro. i) Projection of
a z-stack along the z axis, showing a tightly packed CM cell cluster formed on top of a QGP1 layer. ii) Sideways
view of a 3D projection of the same z-stack image, showing that the CM cluster forms on top of a QGP1 layer. iii)
Macroscopic view of a coverslip area, showing several CM cell clusters over a larger population of QPG-1 cells that
spreads throughout the coverslip (this picture was acquired with a 10x zoom). dps - days post seeding.
QGP1 layer CM cluster
iii)
i) ii)

47
QG
P1
CM
Mix
(to
tal)
0
2 5
5 0
7 5
1 0 0
1 2 5
1 5 0
1 7 5
T o ta l c e l l n u m b e r
To
tal
ce
ll n
um
be
r
n = 2 n = 2 n = 4
QG
P1
QG
P1@
Mix
CM
CM
@M
ix
0
2 0
4 0
6 0
8 0
1 0 0
1 2 0
T o ta l c e l l n u m b e r
To
tal
ce
ll n
um
be
r (
no
rm
ali
ze
d)
n = 2 n = 4 n = 2 n = 4
QG
P1
QG
P1@
Mix
CM
CM
@M
ix
0
1
2
3
4
5
M ito s is %
Fra
cti
on
of
mit
oti
c c
ell
s (
%)
n = 2 n = 4 n = 2 n = 4
QG
P1@
Mix
CM
@M
ix
0
2 0
4 0
6 0
8 0
1 0 0
C e ll fra c t io n in M ix
Ce
ll n
o.
/ T
ota
l tu
mo
ur c
ell
no
. (%
)
n = 4 n = 4
*
QG
P1
QG
P1@
Mix
CM
CM
@M
ix
0
2 5
5 0
7 5
1 0 0
K i6 7 %
Fra
cti
on
of
Ki6
7 p
os
itiv
e c
ell
s (
%)
n = 2 n = 2 n = 2 n = 2 QG
P1
QG
P1@
Mix
CM
CM
@M
ix
0 .0
0 .5
1 .0
1 .5
2 .0
2 .5
3 .0
C a s p a s e 3 %
Fra
cti
on
of
ca
sp
as
e 3
po
sit
ive
ce
lls
(%
)
n = 2 n = 2 n = 2 n = 2
i)
iii)
ii)
iv)
v) vi)
Figure 22: Tert+ (QGP1) cells showed a higher proliferation than ALT (CM) cells in vitro and this was
maintained when they were mixed (quantification). Cell proliferation and apoptosis of QGP1 and CM cell lines
seeded on 24 well-plates with glass coverslips, with a final seeding density of 5 × 10⁴cells/cm2, alone and mixed in
equal parts, 3dps. Quantification of tumor cell number (controls and mix) total (i) and individual (QGP1 and CM),
normalized (ii). Quantification of the fraction of mitotic cells of each cell line, alone and in mix (iii). Fraction of QGP1
and CM cells in the mix (iv). Fraction of the Ki67 positive cells (proliferative cells, which are not at G0 stage) (v) and
Caspase 3 positive cells (apoptotic cells) (vi), comparing QGP1 and CM alone and in mix. Results from statistical
analysis comparing the differences between two conditions were performed using t-tests (see statistical methods
section), which have a P-value output, represented in the following way: P≤0.0001 (****); 0.0001<P≤0.001 (***);
0.001<P≤0.01 (**); 0.01<P≤0.05 (*); P>0.05 (ns). In this case the sample number (number of coverslips) was too
low to perform a statistical analysis, except for (iv) – see Note 5 from Technical details in the Methods section. The
error bars represent the SEM. n - number of analyzed coverslips in the respective condition, dps – days post
seeding.

48
CM (ALT) has better engraftment in zebrafish than QGP1 (Tert+) and this behavior is
apparently maintained when the two cell lines are mixed
An in vivo competition assay was performed through injection of QGP1 (Tert+) and CM (ALT) cell
lines separately in the periviteline space (PVS) of a 2 days post fertilized (dpf) zebrafish larvae (controls)
as well as a mix of these two cell lines in equal proportion.
When each of the two cell lines were injected in zebrafish, the engraftment rates were very different
(calculated as in previous chapters). QGP1 cells injected alone were cleared from the zebrafish between
20hpi and 2.5dpi, yielding an engraftment of 0% (n=33), while CM cells were able to successfully engraft
4dpi, presenting large tumors, with an engraftment rate of 87% (n=23) (Figure 23). In Figure 23 vii) it is
not possible to observe any QGP1 cells, but only dispersed fluorescent staining that was released from
dead cells. It is possible to observe some DAPI signals that correspond to destroyed nuclei: larger
circular signals in the center of the image, formed by small dots (fragments of nuclei) instead of
consistent large circles, typical of nuclei from living cells.
When both cell lines were injected together in equal proportion, CM was able to maintain a high level
of engraftment 4dpi (95%, n=22) and a large number of cells (Figure 23 iii, vi, ix). However, the
engraftment of QGP1 cells was difficult to assess in this situation. In most tumors it was possible to
observe a very small number of cells that presented an imperceptible staining: they appeared to be
stained with CM staining, but seemed to present a dispersed QGP1 staining as well (see top right corner
of Figure 23 ix). Images from the previous section had already showed that DiI staining in QGP1 was
not consistently clear (Figure 20), thereby a different staining method should be useful for future work
with this cell line. If the mentioned staining really corresponds to QGP1 cells, the engraftment of this
cells in mix may have increased up to 91% (n=22), but presenting a nearly negligible number of QGP1
cells in all the tumors.
All in all, CM cells presented a very good engraftment in zebrafish, forming large tumors, while QGP1
cells did not, and apparently this behavior was maintained when the two cell lines were mixed.

49
QGP1 CM QGP1 + CM 2
0 h
pi
2.5
dp
i 4
dp
i
i) ii) iii)
iv) v) vi)
vii) viii) ix)
Figure 23: CM (ALT) is able to engraft in zebrafish but QGP1 (Tert+) is not and the behavior in mix is similar.
Time course of QGP1 (labelled with DiI, in red) and CM (labelled with Deep Red, in green) injected in the PVS of
2dpf zebrafish, alone and mixed in equal parts (50-50), throughout a period of 4 days (20hpi, 2.5dpi and 4dpi).
Images from live zebrafish at 20hpi and 2.5dpi were obtained in a fluorescence scope (i-vi), which does not allow
to observe Deep Red staining from CM cells. However, the tumor masses can be observed in bright field images
and are highlighted with green circles. Confocal microscopy images from fixed zebrafish xenografts 4dpi, with nuclei
staining with DAPI in blue (vii-ix). The images for each condition are representative of what was observed for that
condition and do not correspond to the same fish. QGP1 injected alone were cleared from the zebrafish between
20hpi and 2.5dpi, while CM was able to successfully engraft 4dpi. In vii) it is not possible to observe any QGP1
cells, but only some DAPI signals that correspond to destroyed nuclei: larger circular signals in the center of the
image, formed by small dots (fragments of nuclei) instead of consistent large circles, typical of nuclei from living
cells. In mix, the behavior was similar, although a very small number of QGP1 cells appear to withstand engraftment
(ix). dpf - days post fertilization, hpi – hours post injection, dpi - days post injection, PVS - periviteline space.

50
Discussion
Enabling replicative immortality is one of the hallmarks required for cancer progression, which
involves the lengthening of telomeres that protect the chromosome-ends. This is achieved in 90% of
cancers through overexpression of telomerase (Tert+ cells), a reverse transcriptase that elongates
telomeres, which has a restricted activity in most normal cells. However, the alternative lengthening of
telomeres (ALT) is another way that cancer cells have to achieve this goal, which involves a
recombinatorial mechanism between two telomeres. Both phenotypes may be present in the same
tumor, composing a form of intratumor heterogeneity, which was explored in Part I.
The goal of this work was to determine if it is plausible that in an initial stage, tumors present both
populations (Tert+ and ALT), but later, Tert+ becomes the dominant population (presumably due to higher
genome stability), as well as determining if there is some interaction between both populations, namely
clonal competition. For this purpose two pancreatic endocrine tumor (PET) cell lines were used: QGP1,
presenting a Tert+ phenotype and CM, presenting an ALT phenotype.
Firstly, both tumor cell lines were characterized through an in vitro assay, in which both cell lines
were seeded, either alone (controls) or in a mixture of equal proportion, followed by assessing their cell
proliferation (measured through total cell number, mitosis and Ki67 staining) and cell death (measured
through Caspase 3 staining), measuring all the readouts 3dps.
Results showed that the two cell lines seem to behave independently from one another when in co-
culture, given that no change in their behavior was noticed from controls to mix. QGP1 has an intrinsic
higher proliferation rate than CM, sustained by a higher growth fraction (Ki67%) and a higher mitosis.
This different proliferation capacity remains similar when both cell lines were cultured together in direct
mix, which resulted in QGP1 clearly overtaking CM.
Interestingly, CM cells undergo cell sorting when cultured together with QGP1 in vitro, forming a
tightly packed 3D cluster over a QGP1 layer, but an explanation for this observation is lacking.
In conclusion, there is no apparent cell competition nor cooperation between both cell lines after 3
days in culture, in vitro. Tert+ cells simply have higher proliferation than ALT cells, thus outcompeting
them.
In order to assess the behavior of these cell lines in vivo and see how they interact with each other
and the microenvironment, an experiment was performed consisting in injections of both tumor cell lines
in a 2dpf zebrafish larvae, either alone (controls) or in a mixture of equal proportion. Then, the ability of
these cells to engraft in zebrafish was followed during 4 days.
Results showed that CM cells have a very good engraftment in zebrafish, forming large tumors. In
contrast, QGP1 cells do not engraft and apparently this behavior is maintained when the two cell lines
are mixed. These results were so dissimilar that further characterization of the behavior of each cell line
(through measurement of total cell number, mitosis, etc) would not be conclusive, given the absence of
engrafted QGP1 cells.
The results obtained in vivo may seem to contradict the in vitro results, where QGP1 presented a
much higher cell proliferation, outcompeting CM cells in mix. However, the combination of both results

51
highlights the difference between proliferation and engraftment, showing that the most proliferating cell
line is not necessarily the one that better engrafts in vivo.
It is likely that in vivo, QGP1 cells are being recognized by the host innate immune system and
consequently cleared, while CM cells are not recognized. When mixed, both cells present the same
behavior, but a very small number of QGP1 cells seems to be able to “free-ride” with the engrafted CM
cells and withstand in the PVS 4dpi.
Future work
Given the low engraftment rate that was obtained for QGP1 cells in zebrafish, it would be interesting
to repeat the in vivo experiment in zebrafish previously injected with PU.1MO (at one-cell-stage), in
order to try to prevent the postulated immune rejection of these cells by the host innate immune system.
Only if both cell lines were able to engraft would it be possible to assess the dynamics between Tert+
and ALT cells in vivo. This would allow to determine if the behavior of these cell lines in vivo is the same
as in vitro, or if a different behavior takes place.
The readouts to assess the behavior of these cell lines in vivo, would be the same as the ones used
for the CRC project: besides the engraftment rate, the cell proliferation (measured through total cell
number, mitosis and Ki67 staining) and cell death (measured through Caspase 3 staining), measuring
all the readouts 4dpi.

52
Materials and Methods (for Part I and Part II)
Experiment outline
This work comprised mainly in vivo experiments, consisting of injections of human cancer cell lines
in the zebrafish larvae in vivo model. This required previous preparation of the cell lines to inject, as well
as preparation of the necessary zebrafish (Figure 24).
Preparation of the tumor cells to inject (Figure 24, Top, in red) started with the cell thawing process,
followed by the expansion the cell lines, which was performed in adherent culture, during a minimum
period of 1-2 weeks. On the day of the injection the cells were stained with a fluorescent dye according
to a specific protocol.
Preparation of the zebrafish larvae required for the in vivo injection (Figure 24, Middle, in blue)
required firstly, to cross an appropriate number of adult zebrafish, which would then mate in the following
morning, originating new zebrafish embryos. The embryos were harvested and stored in an appropriate
water medium (E3 – see Appendix for specifications) for 2 days at 28ºC.
The main part of the experiment (Figure 24, Bottom, in green) starts with the injection of the stained
cell lines into the periviteline space (PVS) of 2 days post fertilized (2dpf) zebrafish larvae (Day 0). Four
days post injection (4dpi) the zebrafish were sacrificed and the tissues were fixed with PFA. In the
following day the immuno assay may be started, having a series of steps that span across 3 days,
including the addition of a primary antibody, followed by the addition of a fluorescently labeled secondary
antibody. At the end of this assay, the larvae were whole-mounted in coverslips for microcopy
observation. The injected tumors were observed by confocal microscopy, where a series of pictures
were acquired along the tumor’s depth (z-stack). These pictures were analyzed cell-by-cell, thus
obtaining a quantification of the required readouts in order to estimate tumor cell proliferation and death.
Each of these steps are detailed in the following sections.

53
Cell Culture
Colon cancer cell lines, SW480 and SW620, were originally from American Type Culture Collection
(ATCC) and authenticated through short tandem repeat (STR) profiling /karyotyping /isoenzyme
analysis.
Pancreatic endocrine tumor (PET) cell lines, QGP1 and CM were used as well. QGP1 harbors a
telomerase promoter (TERTp) mutation, which was recently reported as a novel mechanism for
telomerase re-activation/expression in order to maintain telomere length, and it is ALT negative,
representing therefore a Tert+ phenotype. On the other hand, CM presents a TERTp wild-type and is
ALT positive, representing thereby an ALT phenotype [37].
All cells lines were tested for mycoplasma. All the handling of cell lines was performed in a laminar
flow hood (Heal Force), except for the cell counting in the hemocytometer and the injection into zebrafish
larvae.
Freeze and thaw cells
The thawing process started with the removal of the cryovial from liquid nitrogen, placed in a water
bath for a short period (1-2 minutes). The vials were wiped with a tissue embedded with 70% alcohol
Cell thawing
Cell expansion
1-2 weeks (min)
Cell staining
Day 0
Inject cells in
zebrafish
Day 0 (2dpf)
Sacrifice and fix
fish
Day 4
Immuno assay
Days 5-7
Mount in coverslips
Day 7
Microscopy & analysis
2-3 weeks
Cross fishHarvest embryos
0 dpfStore
embryos at 28ºC
0-2 dpf
Preparation
of cells
Preparation
of Zebrafish
Figure 24: Timeline for the experiment. Preparation of the tumor cells to inject (Top, in red): Thawing the cells, then
expand the cell lines, by cell passage in T-flasks, during 1-2 weeks. On the day of the injection the cells were
stained with a fluorescent dye according to a specific protocol. Preparation of the zebrafish larvae required for the
in vivo injection (Middle, in blue): Cross an appropriate number of adult zebrafish. The embryos were harvested in
the following day and stored in an appropriate water medium (E3) for 2 days at 28ºC. Main experiment timeline
(Bottom, in green): 2dpf the cell lines were stained and injected in the PVS of the zebrafish larvae (Day 0). 4dpi
the zebrafish were sacrificed and the tissues were fixed with PFA 4%. In the following day the immuno assay may
be started, having a series of steps that span across 3 days. At the end of this assay, the zebrafish were whole-
mounted in coverslips for microcopy observation. The injected tumors were observed by confocal microscopy,
where a series of pictures were acquired along the tumor’s depth (z-stack). These pictures were then analyzed
cell-by-cell, thus obtaining a quantification of the required readouts (the whole process takes 2-3 weeks, depending
on the complexity of the analysis). dpf – days post fertilization, dpi – days post injection.

54
and transferred into a laminar flow hood. Then the content of each vial was carefully transferred
separately into a new t-flask, appropriate fresh culture medium is added and the cells are incubated
(see the next section for more details).
When a significant portion of the frozen cell stock had been thawed, it was necessary to freeze the
same cell line, after it had been passaged about 2 times in cell culture. Cell lines were frozen in FBS
with DMSO (10%). Firstly a solution of FBS with 20% DMSO was prepared and placed at 4ºC. The cells
were re-suspended in FBS (with half of the final volume) and placed at 4ºC for 30min (together with
cryovials). The cell suspension was added to the FBS solution with 20% DMSO in equal proportion (1:1).
Then the cryovials were aliquoted and placed in the cryobox, which has isopropanol, allowing for a
progressive cooling in a -80ºC freezer, overnight. In the following day, the cryovials were transferred to
a liquid nitrogen tank, for long term preservation of cell viability at -190ºC.
Cell passage (expansion)
SW480 and SW620 cells were cultured adherently, using plastic T-flasks (Corning), in filtered DMEM
culture medium (Biowest) supplemented with 10% fetal bovine serum (FBS - Biochrom) and 1%
Penicillin-Streptomycin 10,000 Units/mL (Hyclone) in a humidified atmosphere containing 5% CO2 at
37ºC (inCu Safe). QGP1 (Tert+) and CM (ALT) cells were cultured in the same conditions, but using
RPMI 1640 (Biowest) as a culture medium instead of DMEM.
Cell passage was performed when cells achieved a confluence of 70-80% (approximately from 3 to
3 days) using a dilution method. Firstly, the culture medium was removed from the flask and then the
cells were washed with DPBS 1X (Gibco, Life Technologies). TrypLE (Gibco, Life Technologies) was
added to the flask and incubated at 37ºC for 5-15min for cell detachment. Afterwards, in order to obtain
a certain dilution of the cell number, a volume of cells suspended in TrypLE was removed from the flask
and added into a new flask (if an expansion is required) or discarded (if the current number of flasks is
enough) (e.g. if a dilution 1:2 is required, half of the volume of cells suspended in TrypLE is removed).
The dilution factor was adjusted in order to obtain a confluence of 70-80% at the end of about 3 days.
Finally, fresh culture medium was added to the flask and the cells were incubated.
Cell staining
Expanded cells achieving a confluence of approximately 70% in T-75 flasks were used for cell
staining, which was performed in flask. The cells were washed with 4mL DPBS 1X and stained in flask
with 2mL of fluorescent dye (previously diluted in DPBS 1X) incubating firstly at 37ºC and then on ice,
during an appropriate period and protected from light (see Table 6). After this period, cells were washed
with 3mL of DPBS 1X and then incubated with 2mL of DPBS-EDTA (EDTA 2mM, Sigma) for 5min at
37ºC. This enables the cells detachment which was achieved after scrapping the flask with a cell
scrapper. The cells were harvested into eppendorf tubes and centrifuged for 4min at 1200rpm and 4ºC.
Supernatant was discarded and the cell pellet was re-suspended in the corresponding culture medium.
Cell viability was assessed by trypan blue exclusion method (Sigma) (trypan blue is only able to enter
cells with a compromised membrane, which are dead) and cell number was determined by
hemocytometer counting (Blau Brand) (fully described in the next section). Cells were centrifuged again

55
(for 4min at 1200rpm and 4ºC) and re-suspended in DPBS 1X to a final concentration of 0.25 ×
106cells/μL. The eppendorfs containing the cells were kept on ice and protected from light from this
point on.
Table 6: Specifications of the used fluorescent dyes, used dilution in DPBS 1X and periods of incubation at 37ºC
and on ice.
Dye Color (Abs,
Em) Supplier
Dilution factor in DPBS 1X
Incubation period at
37ºC
Period on ice
CM-DiI [38] Red
(549nm,565nm)
Vybrant, Molecular
Probes, Life Technologies
1:200 10min 15min
DiO [38] Green
(484nm,501nm)
Vybrant, Molecular
Probes, Life Technologies
1:200 15min 15min
Deep Red [39]
Infra-red (Cy5) (630nm,660nm)
CellTracker, Molecular
Probes, Life Technologies
1:2000 20min 5min
Cell counting
After re-suspending the cell pellet in culture medium (90μL was generally used), 10μL of the final
volume was removed and diluted 1:100 in trypan blue. A volume of 10μL of this suspension was applied
to the hemocytometer for cell counting. Cell counting was performed as indicated in Figure 25. Each of
the 4 quadrants have a volume of 0.1mm3, so the cell concentration in the eppendorf (cells/mL) was
calculated according to equation 5. The volume of the re-suspended pellet in the eppendorf was then
estimated using a micropipette and the total number of cells was calculated according to equation 6.
Dead cells (stained in blue) were counted separately and the fraction of death cells was estimated
through equation 7.
After the second and final centrifugation, the cell pellet was re-suspended in an appropriate volume
of DPBS in order to obtain the intended final cell concentration (0.25 × 10⁶cells/μL). The final volume of
cell suspension was calculated through equation 8. The volume of DPBS added should take into
consideration the volume that the cell pellet occupies, so as to not overcome the calculated final volume.
For each experiment a mix of the two cell lines in equal proportion (50-50) was prepared using the
same volume from each of the two previously mentioned cell suspensions in DPBS. The final volume of
the mix was adjusted for each experiment, in order to obtain a similar final volume in each of the 3
conditions (2 controls and the mix).
The values obtained for the cell counting of each experiment are presented in Table 7.
𝐶𝑜𝑛𝑐(𝑐𝑒𝑙𝑙𝑠
𝑚𝐿) =
𝑙𝑖𝑣𝑒 𝑐𝑒𝑙𝑙 𝑐𝑜𝑢𝑛𝑡
𝑞𝑢𝑎𝑑𝑟𝑎𝑛𝑡𝑠 𝑛𝑢𝑚𝑏𝑒𝑟× 𝑑𝑖𝑙𝑢𝑡𝑖𝑜𝑛 × 104 𝑚𝑚3
𝑚𝐿=
𝑙𝑖𝑣𝑒 𝑐𝑒𝑙𝑙 𝑐𝑜𝑢𝑛𝑡
4× 10⁶ (5)
𝑇𝑜𝑡𝑎𝑙 𝑐𝑒𝑙𝑙 𝑛𝑜. (𝑐𝑒𝑙𝑙𝑠) = 𝑉𝑜𝑙𝑢𝑚𝑒 (𝑚𝐿) × 𝐶𝑒𝑙𝑙 𝑐𝑜𝑛𝑐 (𝑐𝑒𝑙𝑙𝑠/𝑚𝐿) (6)

56
𝐷𝑒𝑎𝑡ℎ % =𝑐𝑒𝑙𝑙 𝑐𝑜𝑢𝑛𝑡 𝑜𝑓 𝑑𝑒𝑎𝑑 𝑐𝑒𝑙𝑙𝑠
𝑐𝑒𝑙𝑙 𝑐𝑜𝑢𝑛𝑡 𝑜𝑓 𝑑𝑒𝑎𝑑 𝑐𝑒𝑙𝑙𝑠+𝑐𝑒𝑙𝑙 𝑐𝑜𝑢𝑛𝑡 𝑜𝑓 𝑙𝑖𝑣𝑒 𝑐𝑒𝑙𝑙𝑠× 100 (7)
𝐹𝑖𝑛𝑎𝑙 𝑣𝑜𝑙𝑢𝑚𝑒 (𝜇𝐿) =𝑇𝑜𝑡𝑎𝑙 𝑐𝑒𝑙𝑙 𝑛𝑜. (𝑐𝑒𝑙𝑙𝑠)
0.25×10⁶ (𝑐𝑒𝑙𝑙𝑠/𝜇𝐿) (8)
Figure 25: Left: Hemocytometer grid. Only the cells present at the 4 fields outlined in red (quadrants) are counted.
Right: Zoom of a counting area with guidelines for a correct cell count (cells with a cross should not be counted).
Figure adapted from [40].
Table 7: Detailed values from the cell counting step of the cell staining protocol: Cell line and respective staining,
number of cell passages performed before the staining, proportion of dead cells, total number of live cells harvested
and its respective volume, as well as the final volume in which they were re-suspended for injection in the intended
concentration.
Exp Cell line & staining
No. cell passage
Dead cells %
Total live cells (millions)
Intermediate volume (μL)
Final volume (volume used for mix) (μL)
Exp 1 SW480-DiI 10 13.8 46 370 184 (40)
SW620-DiO 11 12.7 24.36 320 97.4 (40)
Exp 2 SW480-DiI 3 19.7 16.7 218 67.6 (20)
SW620-Deep Red 16 14 15.05 200 60.2 (20)
Exp 3 / PU1MO
SW480-DiI 17 7 16.9 270 67.6 (28)
SW480-Deep Red 17 6.5 14.35 200 57.4 (28)
SW620-DiI 18 11 27 320 108 (28)
SW620-Deep Red 18 9 21.2 350 84.8 (28)
QGP-1 & CM in vivo
QGP-1 – DiI 19 17 6 200 30 (15)
CM- DiO 13 9 22.7 360 113.4 (15)
Note: For the QGP-1 & CM in vivo experiment (Table 7) the final cell concentration used for injection
was 0.20 × 10⁶cells/μL, because these cells were larger than the SW480 and SW620 cell lines.
Zebrafish care and handling
All the in vivo experiments were performed using the zebrafish (Danio rerio) in vivo model, which
was handled according to European animal welfare regulations. Three different genetically modified
zebrafish lines were used: Casper, Tg(fli1:EGFP) and Tg(zpu.1:EGFP). The casper line (named for its

57
ghost like appearance) consists of fish that are doubly mutant for nacre and roy (roy-/-, nacre-/-), causing
the complete lack of all melanocytes and iridophores in both embryogenesis and adulthood, thus the
body of the fish is almost entirely transparent, facilitating a lot in vivo observation [41].
The transgenic line Tg(fli1:EGFP) expresses enhanced green fluorescent protein (EGFP) under the
control of the fli1 promoter, which belongs to the ETS (E-twenty six) transcription factor family and is
crucial for vascular development. Therefore, Tg(fli1:EGFP) embryos facilitate the in vivo observation of
both present and forming blood vessels and thus, of blood vessel development, which is relevant for
angiogenesis studies. Although tumor angiogenesis was not assessed in this work, this line is used by
the laboratory group and it was also used in this work in order to provide extra embryos for the
experiments [42].
The transgenic line Tg(zpu.1:EGFP) expresses EGFP under the control of the zebrafish PU.1
promoter. It contains a construct with a 9.0-kb fragment of zebrafish sequences upstream of the
zebrafish pu.1 (zpu.1) initiator codon that is able to drive GFP expression in myeloid cells. PU.1 is an
Ets family transcription factor that plays an essential role in the development of both myeloid
(granulocytes and monocytes/macrophages) and lymphoid cells [43].
Adult zebrafish were fed twice a day: In the morning they were fed the living aquatic crustaceans
Artemia, while in the afternoon they were fed a nutritive dry powder named Gemma Micro 500
(Skretting).
Adult zebrafish were kept in 3.5L tanks with running water, with a maximum population of 30 fish per
tank. Each tank had both male and female fish.
Crossing adult zebrafish, embryo harvesting and housing of adults
The zebrafish used for the injection of tumor cells were 2 days old zebrafish larvae (2dpf). In order
to obtain the larvae, each time an experiment took place, adult zebrafish were crossed. Three days
before the injection day, the adults from each tank were transferred into slopping breeding tanks (Figure
26), which have a sloped perforated part that allows the eggs to fall, while preventing the adults from
eating it. The slope helps to mimic the shallow waters where zebrafish mate in their natural habitat. Each
breeding tank had a total of approximately 10 fish from both genders. Synthetic algae was used in the
breeding tanks in order to maximize fish comfort.
In the morning after the crossing was performed, the adults would mate and the new embryos were
harvested. For that purpose, firstly, the adults were transferred back to their original tank with running
water (this process is called housing). Then the embryos were harvested using a strainer and transferred
into Petri dishes with embryo medium (E3), which were placed in an incubator at 28ºC. The embryos
remained there for the following 2 days, therefore each Petri dish should not have a very high confluence
of embryos, in order to maximize survival.

58
Figure 26: Slopping breeding tanks for adult zebrafish crossing. The sloped perforated part allows the eggs to fall,
while preventing the adults from eating it. The slope helps to mimic the shallow waters where zebrafish mate in their
natural habitat. Figure adapted from [44].
Injections of tumor cells in zebrafish larvae
On the day of injection (day 0), the petri dishes with 2dpf zebrafish larvae on E3 medium were
cleaned by removing all dead embryos. Then pronase (specifications in Appendix), which acts as an
enzymatic digester to help the larvae to exit the chorion (an exterior membrane that protects the embryos
in the first days), was added to each petri dish and left in the incubator for a couple of hours.
Immediately before injection, the zebrafish larvae were anesthetized with tricaine 1X (diluted from
tricaine 25X in E3 medium - specifications in Appendix). Then, the larvae were aligned in previously
prepared agarose plaques (Lonza SeaKem LE Agarose, 2% in water), along tracks formed with agarose
stripes (Figure 27 A), with the help of a hair-pin-loop (Figure 27 B) (aligned larvae - Figure 27 C).
Afterwards, using a micropipette, the fluorescently labelled tumor cells were loaded into needles
previously made from glass capillaries (World Precision Instruments, Borosilicate Glass Capillaries,
1mm thickness), using a Laser-Based Micropipette Puller (Sutter Instrument P-2000). The loaded
needle was attached to the tip of a pneumatic injector (World Precision Instruments, Pneumatic Pico
pump PV820), which was used for the injection of the tumor cells into the periviteline space (PVS) of
2dpf zebrafish larvae (Figure 27 D), assisted by a fluorescence scope (Zeiss Axio Zoom.V16). The
injected larvae were carefully harvested into a petri dish and kept on tricaine 1X for some time
(approximately 30min) in order to keep both the larvae and the tumor stable during the recovery phase
that follows injection. The tricaine 1X medium was then replaced by E3 medium and the larvae were
placed in an incubator at 34ºC (compromise temperature between optimum zebrafish temperature –
28ºC – and optimum human cells temperature – 37ºC).
In the following day (1dpi) the non-injected zebrafish were removed and the injected ones were
scored according to their tumor size in a fluorescence scope: large tumors (scored as +++), which were
approximately the size of the zebrafish eye, medium tumors (scored as ++), which were smaller than
the eye and small tumors (scored as +). The analysis of the quantifications performed in each
experiment, was firstly performed through comparison between samples with the same scoring. This
revealed that overall, the scoring did not affect the general conclusion. Therefore, for the sake of
simplicity, in the Results section all the results were merged, regardless of the tumor size scoring.

59
The zebrafish were kept in the incubator for 4 days and during this period the petri dishes were
cleaned and the E3 medium was changed every day. The fish were sacrificed 4 days post injection
(4dpi), using tricaine 25X, followed by washing with PBS 1X (Fisher, PBS tablets) and finally the tissues
were fixed overnight in eppendorf tubes, at 4ºC with a paraformaldehyde (PFA) solution: PFA 4%
(Thermo Scientific) in PBS 1X with triton 0.075% (Carl Roth). In the following day PFA solution was
removed and the immuno assay was started or the zebrafish were stored in Methanol (VWR Chemical)
at -20ºC, allowing for dehydration and long term preservation until further use.
Figure 27: Injection of tumor cells into 2dpf zebrafish larvae. A) Anesthetized larvae are aligned in previously
prepared agarose plaques (2% Agarose), along tracks formed with agarose stripes. The dorsal part of the larvae
is oriented towards the agarose stripes. B) Hair-pin-loop, which is a tool handmade from 1mm thick glass
capillaries, human hair and tape that helps to gently manipulate the larvae without damaging them. C) Aligned
larvae already injected with tumor cells fluorescently labeled with CM-DiI. D) Injection is performed as indicated on
the left: the larvae is gently perforated by the needle in the center of the yolk and the cells are pneumatically
injected, through a short air burst into the periviteline space (PVS), which is a small space between the yolk
membrane and the outer fish membrane. The result is a cell mass indicated in red (right).
D
A
C B

60
Injection of PU.1 Morpholino
The injection of PU.1 Morpholino (PU.1MO) was performed specifically in one experiment
(Experiment 3/ PU1MO). This compound was injected in the zebrafish embryo in one-cell-stage at a
1mM concentration. This required a specific crossing protocol, in which adults were placed in breeding
tanks (Figure 26), but with a physical separation barrier between males and females. This barrier was
removed in the following morning, to enable mating between adults and the fertilized eggs were
harvested as soon as possible, so that the embryos would still be at one-cell stage (Figure 28). It is
important to inject the morpholino at this stage, so that all the zebrafish cells, which originate from this
first cell, will have this compound suppressing the PU.1 promotor.
The morpholino injection was performed using a filament needle (Harvard apparatus), which is
similar to the standard one used for the tumor injection, with the particularity of having a tungsten
filament inside it in order to allow for the injection of the same volume during several injections. This
needle was also previously calibrated so that each injection (from 1 air burst) had the volume of 1.4nL.
In order to have a control for the morpholino injection, each batch of harvested embryos in one-cell-
stage was divided in two halves: one was injected with PU.1MO and the other one not (control).
Figure 28: Zebrafish at one cell stage. Figure adapted from [45].
Immunofluorescence assays of in vivo experiments
In the first day of the immuno assay, the first step was a rehydration of the larvae with a methanol
series, consisting of washing the fish sequentially with methanol 75%, 50% and 25% in PBS 1X (this
step was used only when the larvae were stored in methanol). Then the larvae were permeabilized
through washing 4x5min with PBS triton (0.1%), followed by washing with sterile water (5min) and
incubated in acetone (Fisher Chemicals) for 7min at -20ºC. The larvae were washed twice in PBS 1X
and blocked for 1h at room temperature in a blocking solution of bovine serum albumin (0.01g/mL, Roth,
Albumin fraction V), DMSO (1vol%, Sigma, dimethyl sulfoxide hybri-max sterile D2650), Triton
(0.05vol%) and goat serum (0.0225vol%, Werfen, Normal Goat Serum) in PBS 1X. Larvae were
incubated with specific primary antibodies (1:100) in blocking solution, 1h at room temperature and then
overnight at 4ºC (antibodies specifications in Table 8). Usually 40-50μL of antibody solution (diluted in
blocking) were used per eppendorf tube. The required volume of antibody stock was calculated through
equations 9 and 10 and the values for each experiment are shown in Table 9.

61
𝐹𝑖𝑛𝑎𝑙 𝑣𝑜𝑙𝑢𝑚𝑒 = 𝑛𝑜. 𝑒𝑝𝑝 × (𝑣𝑜𝑙𝑢𝑚𝑒/𝑒𝑝𝑝) (9)
𝑅𝑒𝑞𝑢𝑖𝑟𝑒𝑑 𝑠𝑡𝑜𝑐𝑘 𝑣𝑜𝑙𝑢𝑚𝑒 =𝐹𝑖𝑛𝑎𝑙 𝑣𝑜𝑙𝑢𝑚𝑒
𝐷𝑖𝑙𝑢𝑡𝑖𝑜𝑛 𝑓𝑎𝑐𝑡𝑜𝑟 (10)
In the second day of the immuno assay, the larvae were washed 2x10min with PBS triton (0.1%) and
3x30min with PBS tween (0.05%, Fisher Scientific) to remove excess of primary antibody and for
permeabilization, after which they were blocked in blocking solution for 30min. Larvae were incubated
with specific secondary antibodies (1:400) and DAPI (nuclei staining, 1:100) in blocking solution, 1h at
room temperature and overnight at 4ºC (see Table 8 for specifications). The required volume of antibody
stock was calculated in the same way as the primary antibodies (Table 9). The used secondary
antibodies were always compatible with the primary antibodies (e.g. fluorescently labeled anti-mouse
secondary antibody was used after a primary antibody from mouse).
In the third day of the immuno assay, the larvae were washed 4x15min in PBS tween (0.05%) to
remove excess of secondary antibody. The immunoassay was fixed with PFA solution (PFA 4% in PBS
1X with triton 0.075%) for 20min and the larvae were washed with PBS tween 0.05%. Finally 1 drop of
mounting media (Dako) was added to each eppendorf and the larvae were carefully mounted into
coverslips (Menzel-Glässer; thickness ref.: 1.5; sizes: 24x50mm, 24x40mm) for microscopy observation
(Figure 29) and stored at 4ºC.
The whole process was performed with the larvae in eppendorf tubes and protected from light as
much as possible.
Figure 29: On top of a glass slide, a coverslip with 10 whole-mounted zebrafish xenografts from an injection with
CM-DiI stained SW480 cells, fixed 4dpi and immunofluorescent labeled Vimentin (from experiment 1). It is only
possible to observe the eyes of the zebrafish in this image (small black dots).

62
Table 8: Specifications of the used primary and secondary antibodies. Some of these labels were not mentioned in
the Results section, because they were used simply as a control (e.g. anti-MHC, anti-PML and Phalloidin).
Antibody (color)
Labels Production animal
Supplier
Primary
anti-Ki67 proliferative cells, which are not at G0 stage
mouse Leica
anti-Caspase 3 apoptotic cells rabbit Cell Signaling
anti-Vimentin vimentin (overexpressed in SW620)
mouse Leica
anti-HLA A (anti-MHC)
HLA A rabbit Abcam
anti-PML PML mouse Santa Cruz
Secondary
anti-mouse (Red, Green, Cy5)
mouse IgG goat DyLight, Thermo Fisher Scientific
anti-rabbit (Green, Cy5)
rabbit IgG goat DyLight, Thermo Fisher Scientific
Direct staining DAPI nuclei - Invitrogen
Phalloidin filamentous actin - Sigma
Table 9: Schematic calculation of the volumes of antibody used for each experiment: Volume used per eppendorf
tube with larvae, total number of eppendorf tubes, total volume used (diluted in blocking solution), dilution factor
and antibody stock volume used. Note: some values were rounded up in order to avoid pipetting volumes bellow
the error margin of the micropipettes.
Exp. Antibody Condition
Final volume/ eppendorf (μL)
no. eppendorf
Total volume (diluted in blocking) (μL)
dilution factor
used stock volume (μL)
SW480 & SW620 Exp 1
anti-vimentin All 40 6 240 0 (ready to use)
240
anti-mouse Cy5
All 50 6 300 1:600 0.5
DAPI All 50 6 300 1:100 3
SW480 & SW620 Exp 2
anti-Ki67 Mix 100 1 100 1:100 1
anti-Caspase 3
Mix 100 1 100 1:100 1
anti-Ki67 + anti-Caspase 3
Controls 50 4 200 1:100 2 + 2
anti-mouse green
Mix 200 1 200 1:400 0.5
anti-rabbit green
Mix 200 1 200 1:400 0.5
anti-mouse Cy5 + anti-rabbit green
SW480 - DiI
100 2 200 1:400 0.5 + 0.5
anti-mouse red + anti-rabbit green
SW620 - Cy5
100 2 200 1:400 0.5 + 0.5
DAPI All 200 (2); 100 (4)
6 800 1:100 8

63
Exp. Antibody Condition
Final volume/ eppendorf (μL)
no. eppendorf
Total volume (diluted in blocking) (μL)
dilution factor
used stock volume (μL)
SW480 & SW620 Exp3 / PU1MO
anti-Ki67 Controls & mix
40 4 160 1:100 1.6
anti-Caspase 3
Controls & mix
40 11 440 1:100 4.4
anti-mouse green
Controls & mix
50 4 200 1:400 0.5
anti-rabbit green
Controls & mix
50 11 600 (50 extra)
1:400 1.5
DAPI All 50 15 800 (50 extra)
1:100 8
QGP-1 & CM in vivo
anti-Ki67 Mix 60 2 120 1:100 1.2
anti-Ki67 + anti-HLA A
Controls 75 2 150 1:100 1.5 + 1.5
anti-mouse green
Mix 100 2 200 1:400 0.5
anti-mouse Cy5 + anti-rabbit green
QGP-1 - DiI
200 1 200 1:400 0.5 + 0.5
anti-mouse red + anti-rabbit green
CM - Cy5 200 1 200 1:400 0.5 + 0.5
DAPI All 100 (2); 200 (2)
4 600 1:100 6
Confocal Microscopy of zebrafish xenografts
All images were obtained in a Zeiss LSM 710 fluorescence confocal microscope, where a series of
images were acquired along the tumor’s depth (z-stack). Since the average diameter of a human tumor
cell is approximately 10μm, z-stack images were acquired with a 5μm interval.
All tumors were analyzed using ImageJ software. This analysis consisted in a quantification of each
of the intended readouts, in a cell-by-cell fashion, meaning that tumor cells and their respective
immunofluorescent labelings were quantified cell-by-cell. The quantifications performed were: total cell
number, number of mitotic figures, number of Ki67 positive cells and number of Caspase 3 positive cells.
Total cell number was quantified by counting DAPI signal (nuclei) according to equation 11. This
method requires manually counting all cells from 3 slices, instead of counting every cell from all the
tumor slices. This was done using the Cell Counter plugin from ImageJ and the 3 slices chosen were
the ones that best represented the whole tumor: one from the top (first slices), one from the middle and
one of the deepest slices that still allowed a good image definition (generally close to slices 3, 8 and 13
- in this case, equation 11 would take the form of equation 12) (Figure 31 A). The factor 1.5 is an
empirical corrective factor that revealed better estimation of the cell number using this method.
𝑇𝑜𝑡𝑎𝑙 𝑐𝑒𝑙𝑙 𝑛𝑜. = 𝐴𝑣𝑒𝑟𝑎𝑔𝑒 𝑐𝑒𝑙𝑙 𝑛𝑜. 3 𝑠𝑙𝑖𝑐𝑒𝑠 × 𝑡𝑜𝑡𝑎𝑙 𝑛𝑢𝑚𝑏𝑒𝑟 𝑜𝑓 𝑠𝑙𝑖𝑐𝑒𝑠 ×1
1.5=
#𝑍𝑡𝑜𝑝+#𝑍𝑚𝑖𝑑𝑑𝑙𝑒+#𝑍𝑏𝑜𝑡𝑡𝑜𝑚
3×
𝑏𝑜𝑡𝑡𝑜𝑚−𝑡𝑜𝑝+1
1.5 (11)
𝑇𝑜𝑡𝑎𝑙 𝑐𝑒𝑙𝑙 𝑛𝑜. =#𝑍3+#𝑍8+#𝑍13
3×
11
1.5 (12)

64
This method was previously developed by the laboratory group and revealed a 3% error compared
to whole manual counting and a 2% error between researchers, opposing to an average error of 20%
between researchers in whole manual counting. In summary they obtained 93% accurate rate and
reproducibility of 98%. They tested several automated methods but all had an error higher than 50%
due to threshold settings [22].
Anti-Ki67 antibody was used to assess the level of active proliferation of the tumor cells, since it
labels all proliferative cells, which are not at G0 stage. The number of Ki67 positive cells was also
counted with the previously mentioned method, using equation 11, but in this case counting only the
cells labeled with this antibody (Figure 31 C).
The number of mitotic figures was counted in every slice. Tumor cells undergoing mitosis can assume
different aspects according to the stage at which they are, so a careful observation was required to
count any cell undergoing any of these stages (Figure 30 and Figure 31 B).
Anti-Caspase 3 antibody was used to assess cell apoptosis within the tumors. The number of
caspase 3 signals was also counted in every tumor slice acquired. This was done both for mitosis and
caspase given the low number of this two readouts per tumor, which makes it more reliable to analyze
every slice. Caspase 3 counting also requires special care, since when undergoing apoptosis, each cell
expels this compound through several bulbs, which although look like distinct signals, all come from the
same dying cell, so they should be counted as 1 (Figure 31 D-F).
In order to obtain an easily comparable quantification between different tumors, each of these
readouts (mitosis, Ki67 and Caspase 3) was divided by the total cell number, resulting in a relative
fraction of each one (in percentage).
Quantification of tumors with a mix of two cell lines is much more complex than tumors formed by
one cell line only, since each signal has to be assigned to the respective cell line. Each cell line was
labeled with a different fluorescent dye, enabling to distinguish them in the confocal microscope. In order
to determine the total cell number of each cell line present in the tumor, each counted DAPI signal was
attributed to the corresponding cell line, according to the color of its labeling (this was also done using
the method represented by equation 11) (Figure 32). The same principle was applied to assign mitotic
figures, Ki67 and Caspase 3 signals to the respective cell line.
Normalization - The number of injected cells per fish was the same in both controls and in the mix,
thus, the number of each cell type injected per fish in the mix was only half of the same cell type injected
per fish in the corresponding control. Therefore, in order to compare the mix with controls, the total cell
numbers were normalized, by dividing the total cell numbers in the controls by the factor 2. This
normalization was performed for the in vitro experiment as well, for the same reason.
Note: in Experiment 1, the SW620 cells were labeled with DiO, which got lost when preserved in
methanol, so anti-vimentin antibody was used to label SW620, since this cells specifically express this
compound, whereas SW480 do not.

65
Figure 30: The different stages of mitosis in DAPI: Unsynchronized HeLa cells fixed and stained with DAPI to show
the condensed chromosomes at different stages of mitosis. Figure adapted from [46].
Prophase Metaphase Anaphase Telophase Prometaphase

66
Figure 31: Examples of the method used to quantify the images of zebrafish xenografts, obtained through confocal
microscopy. All of the images shown here are z-stack slices of zebrafish xenografts, 4dpi with SW620 alone. A)
Quantification of the total cell number, using DAPI staining (in blue), counted with a yellow pointer. B) Mitotic figures,
counted with a red pointer. C) Ki67 positive cells (in red), counted with a white pointer. D) Caspase 3 positive cells
(in white), counted with a magenta pointer. E) Overlap of the same Caspase staining from D (in white) with the
respective DAPI signal (in blue). F) Projection of the Caspase 3 staining from every tumor slice along the Z axis. A
and B are images from the slice 8 of the same tumor and C from the slice 7. Images D-F belong to the same tumor
among themselves, but different from images A-C.
A B
C D
E F

67
Figure 32: Examples of the method used to quantify the images of zebrafish xenografts, obtained through confocal
microscopy. All of the images shown here are from the same z-stack slice (z=8) of the same zebrafish xenograft,
4dpi with the mix SW480+SW620 (injected in equal proportion). A) Quantification of the total cell number, using
DAPI staining (in blue), counted with a yellow pointer. B). Quantification of the number of SW480 cells (in red) from
that slice, using a yellow pointer. C) Quantification of the number of SW620 cells (in green), using a magenta pointer
D) Ki67 positive cells (in white): Ki67 positive SW480 cells counted with a red pointer and Ki67 positive SW620
cells counted with a blue pointer.
C D
B A

68
Statistical analysis
In order to assess the reliability of the obtained results, a statistical analysis was performed using
the GraphPad Prism software [47]. This analysis was made for every experiment with the goal of
determining whether the difference in the results between two conditions, for a certain readout was
significant or not (e.g. Mitosis % of SW480 in control vs. in mix).
Firstly, all data sets (set of results obtained in one experiment, for a certain readout and the
respective condition) were challenged by two normality tests: the D’Agostino & Pearson normality test
and the Shapiro-Wilk normality test (all the results are presented in Table 17, in Appendix). Only the
data sets that passed this two tests were considered to exhibit a normal distribution.
Whenever a direct comparison between two data sets of a certain readout was relevant, a t-test was
performed between both of them. When both data sets exhibited a Gaussian distribution an unpaired t-
test was used. This test considers that the standard deviation of both datasets is the same, therefore
whenever that approximation was incorrect an unpaired t-test with a Welch’s correction was performed.
The software performed a test to determine whether the standard deviations were significantly different,
therefore when the P-value of that test was lower than 0.05, the t-test was replaced by a Welch’s t-test.
When at least one of the two data sets compared did not show a normal distribution, a Man-Whitney
test was used, which first ranks all the values from low to high, and then computes a P-value that
depends on the discrepancy between the mean ranks of the two groups [48].
These t-tests have a P-value output and the difference between two data sets was considered
statistically significant whenever P≤0.05. This P-value was represented in the results graphics through
a “star score” in the following way: P≤0.0001 (****); 0.0001<P≤0.001 (***); 0.001<P≤0.01 (**);
0.01<P≤0.05 (*); P>0.05 (ns), meaning that the higher the number of “stars”, the more significant is the
difference between both data sets, from a statistical point of view.
The graphics presented in the Results section show, for each data set, all the points for the obtained
results, the arithmetic mean of those results and an error bar corresponding to the standard error of the
mean (SEM) of that data set. The SEM quantifies how precisely the true mean of the population is
known. It takes into account both the value of the standard deviation (SD) and the sample size (equation
13) [49]. The average values reported in this document are complemented by the respective SEM.
𝑆𝐸𝑀 =𝑆𝐷
√𝑛𝑜.𝑠𝑎𝑚𝑝𝑙𝑒𝑠 (13)
The results of engraftment rates were analyzed using a different statistical method, described in [50].
This readout allows only two types of results: success (engraftment) or failure (no engraftment),
therefore it consists in a Bernoulli assay. Despite not following a normal distribution, for a high enough
number of samples it is possible to approximate the Bernoulli distribution to the standard normal
distribution as in equation 14, for two independent populations X and Y, with dimensions (number of
samples) m and n (𝜃𝑋 and 𝜃𝑌 are the mean values), respectively.
𝑋−𝜃𝑋
√𝜃𝑋(1−𝜃𝑋)
𝑚
∼ 𝑁(0,1) 𝑌−𝜃𝑌
√𝜃𝑌(1−𝜃𝑌)
𝑛
∼ 𝑁(0,1) (14)

69
In this situation the goal of the statistical analysis was to determine whether two data sets were
significantly different from one another, which can be simplified to determine if the averages are different
from each other. Therefore the goal is to test the following null hypothesis against the given alternative,
𝐻0: 𝜃𝑋 = 𝜃𝑌 vs 𝐻1: 𝜃𝑋 ≠ 𝜃𝑌. This can be done by calculating the value of Z from equation 15, considering
that the most appropriate estimator 𝜃 would be the common average of both populations (equation 16).
𝑍 =𝑋−𝑌
√𝜃(1−𝜃)(1
𝑚+
1
𝑛)
∼ 𝑁(0,1) (15)
𝜃 =𝑚𝑋+𝑛𝑌
𝑚+𝑛 (16)
Finally, a two-tailed P-value can be calculated from the Z-value as P=2Φ(-|Z|), considering that Φ is
the standard normal cumulative distribution function, which can be checked in existing tables [50]. Firstly
Φ(|Z|) was determined from the previous table, then the P-value was determined considering equation
17. The statistical significance of the results was analyzed according to the obtained P-value, using the
“star score” that was previously mentioned.
𝑃 = 2Φ(−|𝑍|) = 2 × (1 − Φ(|Z|)) (17)
In vitro assays
Seeding
In vitro assays were performed in 24 well-plates, with a round coverslip (VWR Borosilicate cover
glass, 13mm diameter, Thickness no.1.5) inserted in each well, where the cell lines were cultured in
appropriated medium for a certain period of time (preferentially 4 days, in order to compare with the in
vivo experiments, which also lasted 4 days).
Firstly, the number of cells to be seeded per well was determined, knowing that for a 24 well plate
the surface area of the bottom of the well is 1.9cm2 (𝐴𝑤𝑒𝑙𝑙) and choosing a certain seeding cell density
(equation 18). This seeding density was determined by a previous test comparing two or more values
and choosing the one that allowed a higher cell confluence at the end of the incubation period, without
being so high that originated necrotic centers (detectable through the observation of cells detached from
the coverslip).
The total cell number required for a certain condition was then determined through multiplication of
the number of seeded cells per well by the number of wells used for that condition (considering a margin
of 1 extra well) (equation 19). For the wells with a 50-50 mix of two cell lines, half of the total cell number
was required from each cell line. The number of wells seeded was the same for every condition.
Afterwards, cell staining was performed in flask, exactly in the same way as for the in vivo
experiments. However, for the in vitro experiments, the last centrifugation step was not required. After
the cell counting (see Table 11), the volume of cells in suspension required for the seeding of each
condition was determined through equation 20 (results also in Table 11). Since the total number of cells
per well was always the same and the mixes were seeded in a 50-50 proportion, half of the previously
calculated volumes were used for the wells with mixed culture, for the same condition.

70
The calculated volumes were re-suspended in a certain volume of appropriate culture medium
(0.5mL for each well, including the extra well). Then 0.5mL of this suspension was added to each well
(with a coverslip previously inserted in it) and the well plates were incubated in a humidified atmosphere
containing 5% CO2 at 37ºC, for the intended period of time (generally 4 days), protected from light.
𝑆𝑒𝑒𝑑𝑖𝑛𝑔 𝑐𝑒𝑙𝑙 𝑛𝑜./𝑤𝑒𝑙𝑙 (𝑐𝑒𝑙𝑙𝑠) = 𝐴𝑤𝑒𝑙𝑙(𝑐𝑚2) × 𝑆𝑒𝑒𝑑𝑖𝑛𝑔 𝑑𝑒𝑛𝑠𝑖𝑡𝑦(𝑐𝑒𝑙𝑙𝑠/𝑐𝑚2) (18)
𝑇𝑜𝑡𝑎𝑙 𝑠𝑒𝑒𝑑𝑖𝑛𝑔 𝑐𝑒𝑙𝑙 𝑛𝑜. = 𝑆𝑒𝑒𝑑𝑖𝑛𝑔 𝑐𝑒𝑙𝑙 𝑛𝑜./𝑤𝑒𝑙𝑙 × (𝑛𝑜. 𝑜𝑓 𝑤𝑒𝑙𝑙𝑠 + 1𝑒𝑥𝑡𝑟𝑎 𝑤𝑒𝑙𝑙) (19)
𝑉𝑜𝑙 𝑟𝑒𝑞𝑢𝑖𝑟𝑒𝑑 =𝑇𝑜𝑡𝑎𝑙 𝑠𝑒𝑒𝑑𝑖𝑛𝑔 𝑐𝑒𝑙𝑙 𝑛𝑜.×𝑆𝑢𝑠𝑝𝑒𝑛𝑠𝑖𝑜𝑛 𝑣𝑜𝑙𝑢𝑚𝑒
𝑇𝑜𝑡𝑎𝑙 𝑐𝑒𝑙𝑙 𝑛𝑜. 𝑖𝑛 𝑠𝑢𝑠𝑝𝑒𝑛𝑠𝑖𝑜𝑛 (20)
Table 10: Values used for the seeding of each in vitro experiment: Seeding density, cell number per well, number
of wells seeded per condition and total seeded cell number per condition.
Experiment Seeding density
(cell/cm2) Cells/well
No. wells (per condition)
Total seeding cell no. (per condition)
SW480 & SW620 in vitro
4 × 10⁴ 7.6 × 10⁴ 6+1extra 53.2 × 10⁴
QGP-1 & CM in vitro
5 × 10⁴ 9.5 × 10⁴ 6+1extra 66.5 × 10⁴
Table 11: Detailed values from the cell counting step of the cell staining protocol: Cell line and respective staining,
number of cell passages performed before the staining, proportion of dead cells, total number of live cells harvested
and its respective volume, as well as the final volume used for seeding the controls and the mix. ND-not determined.
Exp Cell line & staining
No. cell passage
Dead cells %
Total live cells (millions)
Suspension volume (μL)
Final volume used for controls & mix (μL)
SW480 & SW620 in vitro
SW480-DiI (1) 2 15 8.2 150 9.7 & 4.85
SW480-DiI (2) 2 16.5 8.6 159 9.8 & 4.9
SW480-DiI (3) 2 10 7.19 159 11.8 & 5.9
SW620-Deep Red (1)
2 14.6 10.9 166 8 & 4
SW620-Deep Red (2)
2 11.2 7.55 166 11.6 & 5.8
SW620-Deep Red (3)
2 8.9 11.7 168 7.6 & 3.8
QGP-1 & CM in vitro
QGP-1 - DiI 9 ND 4.12
126 – 40 for each staining
54 & 27
QGP-1 - DiO 50 & 25
CM - DiI 7 ND 2.41
130 – 60 for each staining
60.4 & 30.2
CM - DiO 60.4 & 30.2
Note 1: in Table 11, for the SW480 & SW620 experiment, the numbers 1-3 refer to 3 different batches
used for this experiment. Each batch consists of a different freezing date for the respective cell line
(Table 18 in Appendix), therefore 3 biological replicates were performed in this experiment. The mixes
were seeded using cell lines with the same batch number (1+1, 2+2 and 3+3), in order to mix cell lines
with similar freezing dates.

71
Note 2: in Table 11, for the QGP-1 & CM experiment, firstly the cells were counted and only then stained
(due to a low number of cells available in culture). Therefore, a certain volume of each cell suspension
was used for cell staining in eppendorf (with a similar protocol). After staining, the cells were centrifuged
and re-suspended in culture medium until a final volume of 100μL for each condition (total of 4
eppendorfs). From that final volume, the required volume for seeding was calculated using equation
M11 (last row of Table 11) and were re-suspended in a certain volume of appropriate culture medium
(0.5mL for each well, including the extra well) exactly like it was previously described. The rest of the
protocol was performed as previously described.
Immuno assay
At the end of the incubation period, the medium was discarded, the cells were washed with DPBS
1X and then fixed with PFA (4% in DPBS) for 10min at room temperature.
The cells were washed with DPBS, then permeabilized with PBS Triton (0.1%) for 10min at room
temperature and blocked for 1h at room temperature in blocking solution of bovine serum albumin (1%),
Triton (0.05vol%) and goat serum (1vol%) in DPBS 1X.
The coverslips were incubated with specific primary antibodies (1:200) in blocking solution, overnight
at 4ºC (antibodies’ specifications in Table 8). This incubation was performed in a humid chamber,
consisting of a plastic box with the bottom covered in paper towels soaked in water with parafilm strips
on top of them. Drops of antibody solution (diluted in blocking) with 40μL were placed on top of the
parafilm and each coverslip was placed on top of these drops. The box was totally covered with
aluminum paper in order to protect the coverslips from light.
The required volume of antibody stock was calculated through equations 21 and 22 and the values
for each experiment are shown in Table 12.
𝐹𝑖𝑛𝑎𝑙 𝑣𝑜𝑙𝑢𝑚𝑒 = 𝑛𝑜. 𝑐𝑜𝑣𝑒𝑟𝑠𝑙𝑖𝑝𝑠 × (𝑣𝑜𝑙𝑢𝑚𝑒/𝑐𝑜𝑣𝑒𝑟𝑠𝑙𝑖𝑝) (21)
𝑅𝑒𝑞𝑢𝑖𝑟𝑒𝑑 𝑠𝑡𝑜𝑐𝑘 𝑣𝑜𝑙𝑢𝑚𝑒 =𝐹𝑖𝑛𝑎𝑙 𝑣𝑜𝑙𝑢𝑚𝑒
𝐷𝑖𝑙𝑢𝑡𝑖𝑜𝑛 𝑓𝑎𝑐𝑡𝑜𝑟 (22)
In the second day of the immuno assay, the coverslips were inserted in 24 well plates and washed
with blocking solution 3X5min. The coverslips were incubated with specific secondary antibodies (1:500)
in blocking solution (see Table 8 for specifications), for 30min at room temperature with slow shaking
and overnight at 4ºC, always protected from light. The required volume of antibody stock was calculated
in the same way as the primary antibodies and 150μL of antibody solution (diluted in blocking) was
added per well (Table 12). The used secondary antibodies were always compatible with the primary
antibodies (e.g. fluorescently labeled anti-mouse secondary antibody was used after a primary antibody
from mouse).
In the third day of the immuno assay, the coverslips were washed with DPBS 2X5min in slow
shaking, followed by addition of 150μL/well of DAPI solution (15μL of stock DAPI in 10mL H2O) for
10min, plus 5min with slow shaking. Finally the coverslips were mounted on top of glass slides with a
small drop of mounting medium (Dako) and stored at 4ºC.

72
Table 12: Schematic calculation of the volumes of antibody used for each experiment: Volume used per coverslip,
total number of coverslips, total volume used (diluted in blocking solution), dilution factor and antibody stock volume
used. Note: some values were rounded up in order to avoid pipetting volumes bellow the error margin of the
micropipettes.
Exp Antibody Condition
Final volume/ coverslip (μL)
no. coverslips
Total volume (diluted in blocking) (μL)
dilution factor
used stock volume (μL)
SW480 & SW620 in
vitro
anti-Ki67 Mix 40 3 120 1:200 0.6
anti-Caspase 3
Mix 40 6 240 1:200 1.2
anti-Ki67 + anti-Caspase 3
Controls 40 18 720 1:200 3.6 + 3.6
anti-mouse green
Mix 150 3 450 1:500 0.9
anti-rabbit green
Mix 150 6 900 1:500 1.8
anti-mouse infra-red + anti-rabbit green
SW480 control
150 9 1350 1:500 2.7 +2 .7
anti-mouse red + anti-rabbit green
SW620 control
150 9 1350 1:500 2.7 + 2.7
DAPI Al 150 27 - - 4050 of diluted solution
QGP-1 & CM in vitro
anti-Ki67 Mix 50 4 200 1:200 1
anti-Caspase 3
Mix 50 4 200 1:200 1
anti-Ki67 + anti-Caspase 3
Controls 100 2 200 1:200 1 + 1
anti-PML Controls 100 2 200 1:200 1
anti-mouse infra-red (Ki67)
Mix 250 2 500 1:500 1
anti-rabbit infra-red (Casp3)
Mix 250 2 500 1:500 1
anti-mouse green (PML)
Controls (DiI)
200 2 400 1:400 1
anti-mouse infra-red (Ki67) + anti-rabbit green
Controls (DiI)
250 2 500 1:500 1
anti-mouse red (Ki67) + anti-rabbit infra-red
Controls (DiO)
250 2 500 1:500 1
Phalloidin Controls (DiI)
150 2 300 1:100 3
DAPI All 150 12 - - 1800 of diluted solution

73
Analysis
All images were obtained in a Zeiss LSM 710 fluorescence confocal microscope. Each coverslip was
used to acquire microscopy images in the same geometrical area of the coverslip - green area in Figure
33 A. This area was chosen for all the coverslips analyzed, in order to obtain images that could be
reliably comparable between all the tested conditions. After the seeding of the in vitro assay, the center
of the coverslip is more prone to accumulate a larger number of cells than the periphery. This results in
a very high cell confluence in this area, 4dps, which causes a lot of cell necrosis, meaning that this area
is not a suitable one to analyze natural cell proliferation and death in vitro. This was the reason for
choosing an area just outside this necrotic center (see Figure 33 A), where the cells are actively
proliferating 4dps, with a confluence that implicates cell-cell contact, but not necrosis due to excessive
cell density.
In order to acquire images from an area large enough to be representative of the coverslip, a series
of 6 images were acquired using the tile scan functionality of the microscope (Figure 33 B). This consists
of acquiring images from adjacent fields in a 2 by 3 disposition, using a 40x objective.
All coverslips were analyzed using ImageJ software. This analysis was similar to the one performed
for the in vivo experiments: tumor cells and their respective immunofluorescent labelings were quantified
cell-by-cell. The difference from the in vivo lies in the 2D nature of the in vitro experiment, meaning that
there was only one Z-plan to analyze. Therefore, every tile-scan image was quantified through manual
counting, using the Cell Counter plugin from ImageJ. The quantifications performed were also: total cell
number, number of mitotic figures, number of Ki67 positive cells and number of Caspase 3 positive cells.
Figure 34 displays an example of the quantification of an in vitro tile scan.
Statistical analysis of the in vitro assays was exactly the same as for the in vivo experiments and the
results from normality tests are also presented in appendix (Table 17).
Figure 33: Image acquisition of in vitro experiments by confocal microscopy. A) Schematic view of a round
coverslip used for the in vitro experiment. The area in orange is the center of the coverslip, where a very high cell
confluence is achieved 4dps, resulting in high cell death. In order to avoid this area, the green area, just outside
this necrotic center was chosen for the image acquisition of every coverslip. B) Schematic view of a tile scan 2x3
from the green area of the image A. Images from this 6 adjacent fields were acquired using a 40x objective from
the confocal microscope. dps – days post seeding.
B A

74
Figure 34: Example of the method used to quantify images of in vitro assays, obtained through confocal microscopy,
using the tile scan tool. Here the DAPI channel of a 2x3 tile scan of a coverslip seeded with a 50-50 mix of
SW480+SW620 is shown. Total cell number was quantified by manual counting of every DAPI signal (in blue),
using a yellow pointer.
Technical details
Note 1: In Experiment 3 the engraftment of SW620 in mix was not determined, because this cell line
was stained with Deep Red, which could not be seen in the fluorescence scope used. However, previous
experiments revealed that in the mix, when one of the cell lines was present, the other was always
present as well, so this engraftment rate was assumed equal to SW480 in mix, for both Figure 7 B and
C.
Note 2: All the engraftment rates presented in Figure 7 B were confirmed after observation on the
confocal microscope (which has a much higher magnification power than the fluorescence scope). This
allowed to be sure whether there was positive engraftment or not in cases that were doubtful (mainly
cases with low cell numbers - SW480 alone). The exception was for Experiment 3, in which a technical
problem resulted in the loss of several tumors during the steps that anticipated the confocal microscopy,
thus preventing such confirmation (discussed in Note 4).
Note 3: Figure 10 presents a merge of all the results from 3 independent experiments, in order to simplify
the analysis. The individual results obtained in each experiment and their respective statistical analysis
are presented from Figure 35 to Figure 37 (Appendix). Comparing the results obtained in the 3
experiments (Table 13 and Table 14 in Appendix), it is clear that they are in agreement between
themselves as well as with the global results presented in Figure 10: When a readout was determined
to be significantly different between two conditions in the global analysis (Figure 10), this is sustained

75
by the same difference in at least 2 out of the 3 experiments. The only exception was the already
mentioned decrease in the fraction of Caspase 3 positive SW620 cells, from control to mix, which was
observed in 1 out of 2 experiments.
Note 4: The SW480 & SW620 Experiment 3 (PU.1MO experiment) had some technical problems.
Although at the moment when the engraftment rates were scored, a significant number of samples
displayed large tumors, in all the conditions except for SW480 alone in controls (as it was expected),
when the same samples were observed in the confocal microscope a large number of tumors had
disappeared. This means that a certain step of the procedure that follows zebrafish sacrifice - tissue
fixation or the immuno assay - compromised the experiment.
The only two possible explanations that came into mind were: i) the tissue fixation was not performed
quickly enough after the fish were sacrificed and thereby the tumor cells died and were lost before
fixation; ii) during the washing steps of the samples, the agitation of the zebrafish caused the tumors to
physically detach from the fish. However, neither of these explanations were convincing, because the
fixation was performed some minutes after the zebrafish were sacrificed (i) and the washing steps of
the immuno assay were performed with special care, as much as for the previous experiments, therefore
there was no reason for what happened.
Nonetheless, all the analysis of the obtained confocal images was performed as usual and the results
are consistent with the direct observations at the moment of fish sacrifice. The main problem was the
decrease in the sample number, which may have prevented certain differences from being statistically
significant. Additionally Ki67 staining was also performed, but due to this situation the sample numbers
was too small to analyze this readout. In order to be fully sure of the observations from these experiment,
further experiments should be performed in the future, but the conclusions made here remain valid
indications of what may be the mechanism behind the interactions taking place between SW480, SW620
and the host.
Note 5: In the QGP1 & CM in vitro experiment the number of samples (number of coverslips analyzed)
was too low to perform statistical analysis between the results from each condition (Figure 22). However,
a qualitative analysis of the difference between the relevant data sets was possible, by taking in
consideration both the average and the SEM of each data set. The reliability of these comparisons is in
principle good, since data dispersion was small enough to extract conclusions, which were consistent
with macroscopical observation of each coverslip.

76
References
1. Cancer: Facts sheet. 2014 [Retrieved on 28/12/2015]; Available from: http://www.who.int/mediacentre/factsheets/fs297/en/.
2. World Cancer Report. 2014. 3. World Health Organization - Cancer Country Profiles, 2014 - Portugal. 2014, World Health
Organization. 4. Hanahan, D. and R.A. Weinberg, The Hallmarks of Cancer. Cell, 2000. 100: p. 57-70. 5. Hanahan, D. and R.A. Weinberg, Hallmarks of cancer: the next generation. Cell, 2011. 144(5):
p. 646-74. 6. Weinberg, R.A., The Biology of Cancer. 2 ed. 2014: Garland Science. 50-53; 456-470. 7. Almendro, V., A. Marusyk, and K. Polyak, Cellular heterogeneity and molecular evolution in
cancer. Annu Rev Pathol, 2013. 8: p. 277-302. 8. Tabassum, D.P. and K. Polyak, Tumorigenesis: it takes a village. Nat Rev Cancer, 2015. 15(8): p.
473-83. 9. Korolev, K.S., J.B. Xavier, and J. Gore, Turning ecology and evolution against cancer. Nat Rev
Cancer, 2014. 14(5): p. 371-80. 10. Calbo, J., et al., A functional role for tumor cell heterogeneity in a mouse model of small cell
lung cancer. Cancer Cell, 2011. 19(2): p. 244-56. 11. Quail, D.F. and J.A. Joyce, Microenvironmental regulation of tumor progression and metastasis.
Nat Med, 2013. 19(11): p. 1423-37. 12. Abbas, A.K., A.H. Lichtman, and S. Pillai, Cellular and Molecular Immunology. 6 ed. 2007:
Saunders Elsevier. 13. Qian, B.Z. and J.W. Pollard, Macrophage diversity enhances tumor progression and metastasis.
Cell, 2010. 141(1): p. 39-51. 14. Balkwill, F.R., M. Capasso, and T. Hagemann, The tumor microenvironment at a glance. J Cell
Sci, 2012. 125(Pt 23): p. 5591-6. 15. Fridlender, Z.G., et al., Polarization of tumor-associated neutrophil phenotype by TGF-beta:
"N1" versus "N2" TAN. Cancer Cell, 2009. 16(3): p. 183-94. 16. Talmadge, J.E. and D.I. Gabrilovich, History of myeloid-derived suppressor cells. Nat Rev Cancer,
2013. 13(10): p. 739-52. 17. White, R., K. Rose, and L. Zon, Zebrafish cancer: the state of the art and the path forward. Nat
Rev Cancer, 2013. 13(9): p. 624-36. 18. Stoletov, K. and R. Klemke, Catch of the day: zebrafish as a human cancer model. Oncogene,
2008. 27(33): p. 4509-20. 19. Trede, N.S., et al., The Use of Zebrafish to Understand Immunity. Immunity, 2004. 20: p. 367-
379. 20. He, S., et al., Neutrophil-mediated experimental metastasis is enhanced by VEGFR inhibition in
a zebrafish xenograft model. J Pathol, 2012. 227(4): p. 431-45. 21. Ignatius, M.S., et al., In vivo imaging of tumor-propagating cells, regional tumor heterogeneity,
and dynamic cell movements in embryonal rhabdomyosarcoma. Cancer Cell, 2012. 21(5): p. 680-93.
22. Fior, R., et al., Screening international cancer therapy guidelines using short-term human-zebrafish xenografts. (Pending Publication), 2016.
23. Hewitt, R.E., et al., Validation of a model of colon cancer progression. Journal of Pathology, 2000. 192: p. 446-454.
24. Scholzen, T. and J. Gerdes, The Ki-67 protein: From the known and the unknown. Journal of Cellular Physiology, 2000. 182: p. 311–322.
25. Boatright, K.M. and G.S. Salvesen, Mechanisms of caspase activation. Current Opinion in Cell Biology, 2003. 15(6): p. 725-731.
26. Kroemer, G., et al., Classification of cell death: recommendations of the Nomenclature Committee on Cell Death 2009. Cell Death Differ, 2009. 16(1): p. 3-11.

77
27. Miller-Keane and M.T. O'Toole, Miller-Keane Encyclopedia and Dictionary of Medicine, Nursing and Allied Health. 2003: Saunders.
28. Richardson, R., et al., Adult zebrafish as a model system for cutaneous wound-healing research. J Invest Dermatol, 2013. 133(6): p. 1655-65.
29. Zhang, M., et al., Intratumoral heterogeneity in a Trp53-null mouse model of human breast cancer. Cancer Discov, 2015. 5(5): p. 520-33.
30. Valastyan, S. and R.A. Weinberg, Tumor metastasis: molecular insights and evolving paradigms. Cell, 2011. 147(2): p. 275-92.
31. Hayflick, L., The Limited in Vitro Lifetime of Human Diploid Cell Strains. Experimental Cell Research, 1965. 37: p. 614-636.
32. Greider, C.W. and E.H. Blackburn, Identification of a specific telomere terminal transferase activity in Tetrahymena extracts. Cell, 1985. 43: p. 405-413.
33. Greider, C.W. and E.H. Blackburn, A telomeric sequence in the RNA of Tetrahymena telomerase required for telomere repeat synthesis. Nature, 1989. 337: p. 331-337.
34. Levy, M.Z., et al., Telomere end-replication problem and cell aging. J. Mol. Biol., 1992. 225: p. 951-960.
35. Henriques, C.M., et al., Telomerase is required for zebrafish lifespan. PLoS Genet, 2013. 9(1): p. e1003214.
36. Henson, J.D., et al., Alternative lengthening of telomeres in mammalian cells. Oncogene, 2002. 21: p. 598 - 610.
37. Vinagre, J., et al., TERT promoter mutations in pancreatic endocrine tumours are rare and mainly found in tumours from patients with hereditary syndromes. Sci Rep, 2016. 6: p. 29714.
38. Vybrant Cell-Labeling Solutions. 2011, Molecular Probes. 39. CellTracker™ Fluorescent Probes. 2014, Thermo Fisher Scientific, Life Technologies. 40. Performing Cell Counts with a Hemacytometer. [Retrieved on 16/08/2016]; Available from:
http://www.humanimmunologyportal.com/protocols/performing-cell-counts-with-a-hemacytometer/.
41. White, R.M., et al., Transparent adult zebrafish as a tool for in vivo transplantation analysis. Cell Stem Cell, 2008. 2(2): p. 183-9.
42. Delov, V., et al., Transgenic fluorescent zebrafish Tg(fli1:EGFP)y(1) for the identification of vasotoxicity within the zFET. Aquat Toxicol, 2014. 150: p. 189-200.
43. Hsu, K., et al., The pu.1 promoter drives myeloid gene expression in zebrafish. Blood, 2004. 104(5): p. 1291-1297.
44. Sloping breeding tank. [Retrieved on 17/08/2016]; Available from: http://www.tecniplast.it/uk/news/new-17ltr-sloping-breeding-tank-promoting-natural-spawning-behaviour.html.
45. Classroom Explorations: Zebrafish Development. [Retrieved on 22/08/2016]; Available from: https://www.exploratorium.edu/imaging_station/students/zebrafish_dev.html.
46. Leung, A.K., et al., Quantitative kinetic analysis of nucleolar breakdown and reassembly during mitosis in live human cells. J Cell Biol, 2004. 166(6): p. 787-800.
47. GraphPad Prism version 7.00 for Windows, GraphPad Software, La Jolla California USA, www.gaphpad.com.
48. GraphPad Software, I. Choosing a test to compare two columns. [Retrieved on 15/09/2016]; Available from: http://www.graphpad.com/guides/prism/7/statistics/index.htm.
49. GraphPad Software, I. The SD and SEM are not the same. [Retrieved on 15/09/2016]; Available from: http://www.graphpad.com/guides/prism/7/statistics/index.htm?stat_semandsdnotsame.htm.
50. Murteira, B., et al., Introdução à Estatística, ed. E. Editora. 2010. p. 435-439; 677.

78
Appendix
Quantification of cell proliferation and cell apoptosis from individual experiments
The quantification of the results obtained in each experiment are presented from Figure 35 to Figure 38
and a summary of these results are presented from Table 13 to Table 15.
Figure 35: SW480 & SW620 Experiment 1. Cell proliferation of SW480 and SW620 cell lines injected in the PVS
of 2dpf zebrafish, alone and mixed in equal parts, 4dpi. Quantification of tumor cell number (alone and in mix) total
(i) and individual (SW480 and SW620), normalized (ii). Quantification of the fraction of mitotic cells of each cell line,
alone and in mix (iii). Fraction of SW480 and SW620 cells in the mix (iv). Results from statistical analysis comparing
the differences between two conditions were performed using t tests (see statistical methods section), which have
a P-value output, represented in the following way: P≤0.0001 (****); 0.0001<P≤0.001 (***); 0.001<P≤0.01 (**);
0.01<P≤0.05 (*); P>0.05 (ns). The error bars represent the SEM. ns - not significant, n - number of analyzed tumors
in the respective condition, dpf - days post fertilization, dpi - days post injection, PVS - periviteline space.
i) ii)
iii) iv)

79
SW
480
SW
480@
Mix
0 .0
0 .5
1 .0
1 .5
2 .0
2 .5
M ito s is % S W 4 8 0
Fra
cti
on
of
mit
oti
c c
ell
s (
%)
* *
M a n n -W h itn e y
n = 3 3n = 1 6
i) ii)
iii) iv)
v) vi)

80
Figure 36: SW480 & SW620 Experiment 2. Cell proliferation and apoptosis of SW480 and SW620 cell lines injected
in the PVS of 2dpf zebrafish, alone and mixed in equal parts, 4dpi. Quantification of tumor cell number (controls
and mix) total (i) and individual normalized: SW480 (iii) and SW620 (iv). Fraction of SW480 and SW620 cells in the
mix (ii). Quantification of the fraction of mitotic cells of each cell line, alone and in mix: SW480 (v) and SW620 (vi).
Fraction of the Ki67 positive cells (proliferative cells, which are not at G0 stage) (vii) and Caspase 3 positive cells
(apoptotic cells) (viii), comparing SW480 and SW620 alone and in mix. Results from statistical analysis comparing
the differences between two conditions were performed using t tests (see statistical methods section), which have
a P-value output, represented in the following way: P≤0.0001 (****); 0.0001<P≤0.001 (***); 0.001<P≤0.01 (**);
0.01<P≤0.05 (*); P>0.05 (ns). The error bars represent the SEM. ns - not significant, n - number of analyzed tumors
in the respective condition, dpf - days post fertilization, dpi - days post injection, PVS - periviteline space.
vii) viii)

81
Figure 37: SW480 & SW620 Experiment 3 (without PU.1MO). Cell proliferation and apoptosis of SW480 and
SW620 cell lines injected in the PVS of 2dpf zebrafish, alone and mixed in equal parts, 4dpi. Quantification of tumor
cell number (controls and mix) total (i) and individual (SW480 and SW620), normalized (ii). Quantification of the
fraction of mitotic cells of each cell line, alone and in mix (iii). Fraction of SW480 and SW620 cells in the mix (iv).
Fraction of the Ki67 positive cells (proliferative cells, which are not at G0 stage) (v) and Caspase 3 positive cells
(apoptotic cells) (vi), comparing SW480 and SW620 alone and in mix. Results from statistical analysis comparing
the differences between two conditions were performed using t tests (see statistical methods section), which have
a P-value output, represented in the following way: P≤0.0001 (****); 0.0001<P≤0.001 (***); 0.001<P≤0.01 (**);
0.01<P≤0.05 (*); P>0.05 (ns). The error bars represent the SEM. ns - not significant, n - number of analyzed tumors
in the respective condition, dpf - days post fertilization, dpi - days post injection, PVS - periviteline space.
i) ii)
iii) iv)
v) vi)
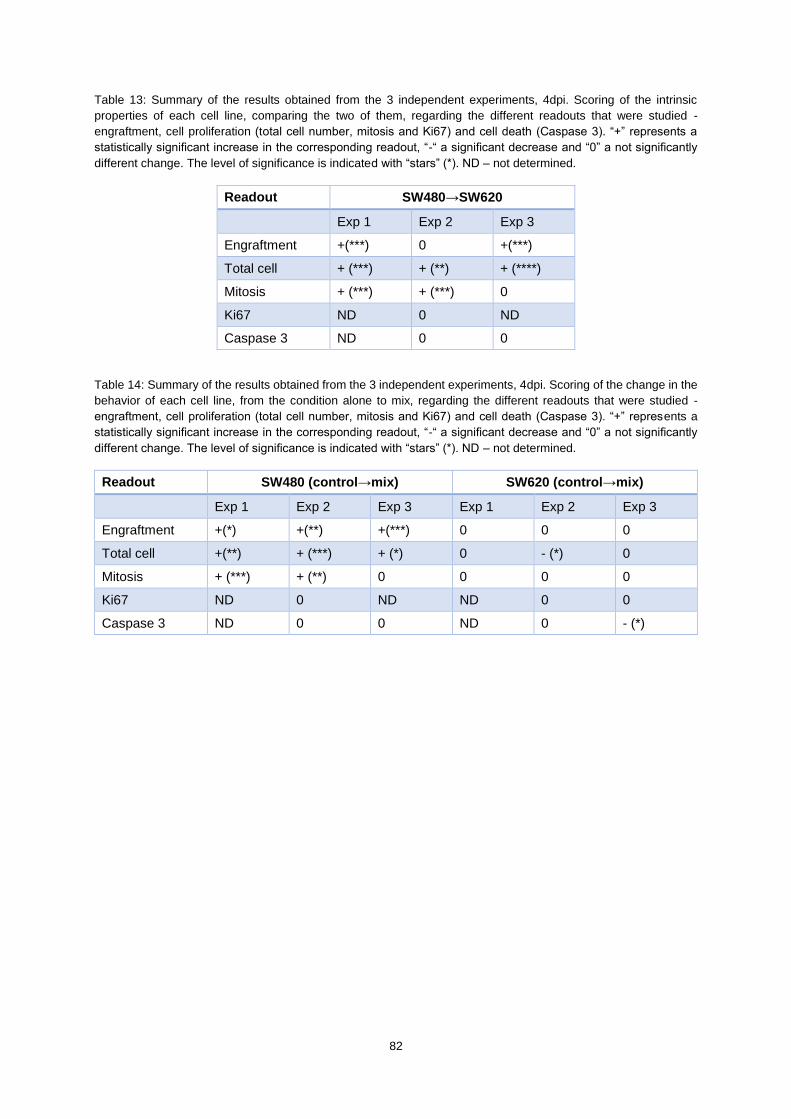
82
Table 13: Summary of the results obtained from the 3 independent experiments, 4dpi. Scoring of the intrinsic
properties of each cell line, comparing the two of them, regarding the different readouts that were studied -
engraftment, cell proliferation (total cell number, mitosis and Ki67) and cell death (Caspase 3). “+” represents a
statistically significant increase in the corresponding readout, “-“ a significant decrease and “0” a not significantly
different change. The level of significance is indicated with “stars” (*). ND – not determined.
Readout SW480→SW620
Exp 1 Exp 2 Exp 3
Engraftment +(***) 0 +(***)
Total cell + (***) + (**) + (****)
Mitosis + (***) + (***) 0
Ki67 ND 0 ND
Caspase 3 ND 0 0
Table 14: Summary of the results obtained from the 3 independent experiments, 4dpi. Scoring of the change in the
behavior of each cell line, from the condition alone to mix, regarding the different readouts that were studied -
engraftment, cell proliferation (total cell number, mitosis and Ki67) and cell death (Caspase 3). “+” represents a
statistically significant increase in the corresponding readout, “-“ a significant decrease and “0” a not significantly
different change. The level of significance is indicated with “stars” (*). ND – not determined.
Readout SW480 (control→mix) SW620 (control→mix)
Exp 1 Exp 2 Exp 3 Exp 1 Exp 2 Exp 3
Engraftment +(*) +(**) +(***) 0 0 0
Total cell +(**) + (***) + (*) 0 - (*) 0
Mitosis + (***) + (**) 0 0 0 0
Ki67 ND 0 ND ND 0 0
Caspase 3 ND 0 0 ND 0 - (*)

83
Figure 38: SW480 & SW620 Experiment 3 with PU.1MO. Cell proliferation and apoptosis 4dpi of SW480 and
SW620 cell lines (alone and mixed in equal parts), which were injected in the PVS of 2dpf zebrafish previously
injected with PU1MO 1mM (Experiment with PU1MO). Quantification of tumor cell number (controls and mix) total
(i) and individual (SW480 and SW620), normalized (ii). Quantification of the fraction of mitotic cells of each cell line,
alone and in mix (iii). Fraction of SW480 and SW620 cells in the mix (iv). Fraction of the Caspase 3 positive cells
(apoptotic cells) (v), comparing SW480 and SW620 alone and in mix. Results from statistical analysis comparing
the differences between two conditions were performed using t tests (see statistical methods section), which have
a P-value output, represented in the following way: P≤0.0001 (****); 0.0001<P≤0.001 (***); 0.001<P≤0.01 (**);
0.01<P≤0.05 (*); P>0.05 (ns). The error bars represent the SEM. ns - not significant, n - number of analyzed tumors
in the respective condition, dpf - days post fertilization, dpi - days post injection, PVS - periviteline space.
i) ii)
iii)
v)
iv)

84
Table 15: Concluding results obtained from the PU1MO experiment, 4dpi. Scoring of the intrinsic properties of each
cell line, comparing the two of them and scoring of the change in the behavior of each cell line, from the condition
alone to mix, regarding the different readouts that were studied - engraftment, cell proliferation (total cell number
and mitosis) and cell death (Caspase 3). “+” represents a statistically significant increase in the corresponding
readout, “-“ a significant decrease and “0” a not significantly different change. The level of significance is indicated
with “stars” (*). dpi – days post injection.
Readout SW480→SW620 SW480
(control→mix) SW620
(control→mix)
Engraftment +(***) +(***) ND
Total cells 0 0 0
Mitosis + (*) + (*) 0
Caspase 3 0 0 0
Table 16: Summary of the results from the quantification of the SW480 & SW620 in vivo experiment with PU.1
morpholino. Arithmetic means and respective SEM obtained for each condition (both cell lines alone and in mix),
regarding the different readouts that were studied - engraftment, cell proliferation (total cell number, mitosis and
Ki67) and cell death (Caspase 3).
Readout SW480 SW480@Mix SW620 SW620@Mix
Engraftment % 84±7 100±0 92±5 (100±0)
Total cell no. (Normalized)
164±25 430±117 330±174 685±149
Mitosis % 0.0442±0.0442 1.68±0.42 0.84±0.44 1.26±0.38
Caspase 3 % 0.498±0.161 0.97±0.28 1.20±0.41 0.66±0.16
Cell fraction (%) - 37.4±2.4 - 62.6±2.4

85
Normality tests
Table 17: Results of the normality tests applied to each data group (readout, cell line, condition) from each
experiment performed, using the statistics software GraphPad Prism 7.
Readouts (4dpi)
Cell line Condition
Number of samples (n)
D’Agostino & Pearson normality test
Shapiro-Wilk normality test
SW
480 &
SW
620
Exp
erim
ent 1
Total cell number
SW480 alone 12 No No
SW480 mix 7 n too small Yes
SW620 alone 19 Yes Yes
SW620 mix 7 n too small Yes
SW480+SW620 - 10 Yes Yes
Fraction of mitotic cells
SW480 alone 12 No No
SW480 mix 7 n too small Yes
SW620 alone 19 Yes Yes
SW620 mix 7 n too small Yes
Cell fraction in mix
SW480 mix 7 n too small Yes
SW620 mix 7 n too small Yes
SW
480 &
SW
620
Exp
erim
ent 2
Total cell number
SW480 alone 16 Yes Yes
SW480 mix 33 Yes No
SW620 alone 10 Yes Yes
SW620 mix 33 Yes No
SW480+SW620 - 33 Yes No
Fraction of mitotic cells
SW480 alone 16 No No
SW480 mix 33 No No
SW620 alone 10 Yes Yes
SW620 mix 33 Yes No
Cell fraction in mix
SW480 mix 33 Yes Yes
SW620 mix 33 Yes Yes
Fraction of Ki67 positive cells
SW480 alone 16 Yes Yes
SW480 mix 16 Yes Yes
SW620 alone 10 Yes Yes
SW620 mix 16 Yes Yes
Fraction of Caspase 3 positive cells
SW480 alone 16 No No
SW480 mix 17 Yes Yes
SW620 alone 10 No Yes
SW620 mix 17 Yes No

86
Readouts (4dpi)
Cell line Condition
Number of samples (n)
D’Agostino & Pearson normality test
Shapiro-Wilk normality test
SW
480 &
SW
620
Exp
erim
ent 3
Total cell number
SW480 alone 10 Yes No
SW480 mix 11 Yes No
SW620 alone 8 Yes Yes
SW620 mix 11 No No
SW480+SW620 - 11 No No
Fraction of mitotic cells
SW480 alone 9 Yes No
SW480 mix 11 No No
SW620 alone 8 Yes Yes
SW620 mix 11 No No
Cell fraction in mix
SW480 mix 11 Yes Yes
SW620 mix 11 Yes Yes
Fraction of Ki67 positive cells
SW480 alone 0 - -
SW480 mix 2 n too small n too small
SW620 alone 3 n too small Yes
SW620 mix 2 n too small n too small
Fraction of Caspase 3 positive cells
SW480 alone 9 Yes Yes
SW480 mix 9 Yes Yes
SW620 alone 5 n too small Yes
SW620 mix 9 No Yes
SW
480 &
SW
620
– M
erg
e o
f th
e 3
Experi
me
nts
Total cell number
SW480 alone 38 No No
SW480 mix 51 No No
SW620 alone 37 Yes Yes
SW620 mix 51 No No
SW480+SW620 - 54 No No
Fraction of mitotic cells
SW480 alone 37 No No
SW480 mix 50 No No
SW620 alone 37 Yes No
SW620 mix 51 No No
Cell fraction in mix
SW480 mix 51 Yes Yes
SW620 mix 51 Yes Yes
Fraction of Ki67 positive cells
SW480 alone 16 Yes Yes
SW480 mix 16 Yes Yes
SW620 alone 10 Yes Yes
SW620 mix 16 Yes Yes
Fraction of Caspase 3 positive cells
SW480 alone 25 Yes Yes
SW480 mix 26 Yes Yes
SW620 alone 15 Yes Yes
SW620 mix 26 No No

87
Readouts (4dpi)
Cell line Condition
Number of samples (n)
D’Agostino & Pearson normality test
Shapiro-Wilk normality test
SW
480 &
SW
620
In v
itro
Experim
ent
Total cell number
SW480 alone 9 Yes No
SW480 mix 9 Yes Yes
SW620 alone 9 Yes Yes
SW620 mix 9 Yes Yes
SW480+SW620 - 9 Yes Yes
Fraction of mitotic cells
SW480 alone 9 Yes Yes
SW480 mix 9 No No
SW620 alone 9 Yes Yes
SW620 mix 9 No No
Cell fraction in mix
SW480 mix 9 Yes Yes
SW620 mix 9 Yes Yes
Fraction of Ki67 positive cells
SW480 alone 9 Yes Yes
SW480 mix 3 n too small Yes
SW620 alone 9 Yes Yes
SW620 mix 3 n too small Yes
Fraction of Caspase 3 positive cells
SW480 alone 9 Yes Yes
SW480 mix 6 n too small Yes
SW620 alone 9 Yes Yes
SW620 mix 6 n too small Yes
SW
480 &
SW
620
PU
1M
O E
xperi
men
t
Total cell number
SW480 alone 10 Yes No
SW480 mix 11
SW620 alone 8 Yes Yes
SW620 mix 11 No No
SW480+SW620 - 11 No No
Fraction of mitotic cells
SW480 alone 9 Yes No
SW480 mix 11 No No
SW620 alone 8 Yes Yes
SW620 mix 11 No No
Cell fraction in mix
SW480 mix 11 Yes Yes
SW620 mix 11 Yes Yes
Fraction of Ki67 positive cells
SW480 alone 0 - -
SW480 mix 2 n too small n too small
SW620 alone 3 n too small Yes
SW620 mix 2 n too small n too small
Fraction of Caspase 3 positive cells
SW480 alone 9 Yes Yes
SW480 mix 9 Yes Yes
SW620 alone 5 n too small Yes
SW620 mix 9 No Yes

88
Readouts (4dpi)
Cell line Condition
Number of samples (n)
D’Agostino & Pearson normality test
Shapiro-Wilk normality test
QG
P-1
& C
M
in v
itro
Cell fraction in mix
QGP-1 mix 4 n too small Yes
CM mix 4 n too small Yes
Materials
The following materials were prepared by the Champalimaud Fish Facility.
Embryo Medium (E3)
50x Embryo Medium (E3) - stock
For 10 liters of MQ water (sterile):
146,9 g NaCl
6,3 g KCl
24,3 g CaCl2.2H2O
40,7 g MgSO4.7H2O
1x Embryo Medium (E3) – ready to use
400 mL 50x Embryo Medium (E3)
60 mL 0.01% Methylene Blue Solution
(0.05 g Methylene Blue powder in 500
mL MQ water)
Fill to 20 L with system water
Pronase
100x Pronase (60 mg/mL) - Stock
1 g Pronase (Roche #10165921001)
16,7 mL MQ water
aliquot to 100 μL
1x Pronase (0,6 mg/mL) – ready to use
dilute 100 μL 100x pronase stock
solution in 9.9 mL 1x Embryo Medium
(E3) without methylene blue
aliquot to 500 μL
Tricaine
25x Tricaine (Stock and Euthanasia)
2 g tricaine powder
500 mL RO (reverse osmosis) water
10 mL 1 M Tris (pH 9) (1 M Tris: 121.14 g Trizma base in 1 L RO water)
adjust pH ~7
1x Tricaine (Anesthesia)
dilute 20 mL 25x Tricaine in 480 mL system water

89
Batches for SW480 & SW620 in vitro experiment
Table 18: Freezing dates for the batch number of each cell line used in the SW480 & SW620 in vitro experiment.
Batch no. SW480 SW620
1 12/01/2015 20/01/2015
2 03/06/2015 03/06/2015
3 13/11/2015 13/11/2015

![Changes in Stem Cell Populations of Rat Trachea ... · [CANCER RESEARCH 45, 3322-3331, July 1985] Changes in Stem Cell Populations of Rat Trachea! Epithelial Cell Cultures at an Early](https://img.pdfslide.us/doc/110x75/5e197ca20d7a627cf1390c8b/changes-in-stem-cell-populations-of-rat-trachea-cancer-research-45-3322-3331.jpg)