Embed Size (px)
Citation preview

INTERACTION OF URBAN FRINGE AND TRANSPORTATION
SYSTEM: ISTANBUL CASE
A Thesis Submitted to The Graduate School of Engineering and Sciences
İzmir Institute of Technology in Partial Fulfillment of the Requirements for the Degree of
MASTER OF SCIENCE
in City Planning
by Emel GÜNAY
October 2007 İZMİR

We approve the thesis of Emel GÜNAY __________________________________ Assist.Prof.Dr. Ömür SAYGIN Supervisor __________________________________ Assist.Prof.Dr. Yavuz DUVARCI Co-supervisor __________________________________ Assoc.Prof.Dr. Semahat ÖZDEMİR Committee Member __________________________________ Assoc.Prof.Dr. Murat GÜNAYDIN Committee Member 22 October 2007
Date __________________________________ _________________________________ Assoc.Prof.Dr. Semahat ÖZDEMİR Prof.Dr. Hasan BÖKE Head of Department of Dean of the Graduate School of City and Regional Planning Engineering and Sciences

iii
ABSTRACT
INTERACTION OF URBAN FRINGE AND TRANSPORTATION
SYSTEM: ISTANBUL CASE
Nowadays, urban sprawl is common problem of all cities. Decentralization of
housing with low density and jobs into urban fringe areas is considerable development.
Sprawl is blamed a wide range of problems likewise wasteful use of land, air pollution,
dependence on car, increased traffic congestion, lengthened travel distance and time,
but it is not clear explaining how urban sprawl affects travel behavior in Turkey?
The aim of the thesis is to identify the influence and importance of urban sprawl
on travel behavior in Turkey. Firstly literature survey on urban sprawl and urban fringe
was examined. Geographic Information System was used to define and map urban
sprawl. Daily trip production in sprawl and urban core was analyzed. In addition daily
travel behavior was inquired. For this study, 2007 İstanbul Master Plan Household and
O-D survey was also used. It allows comparisons travel behavior between sprawl and
urban core area.
The results confirmed that there is no much difference on socio economic
situation between people living in urban sprawl area and people living in urban core
area. However using of private car is higher rate in sprawl area than urban core. In
addition sprawl population drive more time and distance than urban population. The
results provide important insights into the importance of sprawl on transportation and
suggest that transportation system can be adversely affected to the extent that cities
continue to expand to urban sprawl areas as wanton.
As a consequence, sprawl effects İstanbul transportation as negative because
sprawl affects travel behavior. This situation creates increased private car ownerships
and traffic congestion. To solve this problem and many other problems in transportation
related sprawl, studies on transportation and master planning should be considered
sprawl fact.

iv
ÖZET
KENT ÇEPERİ VE ULAŞIM SİSTEMİ İLİŞKİSİ:
İSTANBUL ÖRNEĞİ
Kentsel saçaklanma günümüzde tüm kentlerde yaşanan bir olgudur. Ofis, konut,
ticaret ve rekreasyon alanları olarak metropoliten kentlerin çeperlerinde karşımıza çıkan
bu yeni gelişim süreci birçok problemin kaynağı olarak gösterilmektedir. Üzerinde
tartışılan problemlerden birisi de saçaklanmanın ulaşım üzerinde yarattığı olumsuz
etkilerdir. Özel oto kullanımındaki artış, bunun yarattığı hava kirliliği ve trafik
sıkışıklıkları, daha uzun süreli ve mesafeli olarak yapılan yolculuklar ve bu
yolculukların insanlar üzerinde yarattığı psikolojik etkiler, araştırılan konu başlıkları
arasında yer almaktadır. Fakat tam olarak Türkiye’de saçaklanmanın seyahat
davranışları üzerindeki etkilerinin neler olduğu ve bunun trafiği nasıl etkilediğine
yönelik tanımlayıcı bir çalışma yapılmamıştır.
Bu nedenle bu çalışmada kent çeperinde yaşanan yeni gelişim sürecinin İstanbul
trafiği ve seyahat davranışları üzerindeki etkilerinin araştırılması yapılmıştır. Günlük
olarak yaratılan çeper ile merkez kent arası yolculuklar incelenmiş ve bireylerin seyahat
eğilimleri araştırılmıştır. Ayrıca kent ve çeper arasındaki farklar karşılaştırmalı olarak
incelenmiştir.
Çalışmanın sonucu olarak kent çeperinde yaşayan bireyler ile kent merkezinde
yaşayanların sosyo-ekonomik yapıları arasında çok büyük bir farkın olmadığı
gözlemlenmiştir. Fakat buna rağmen kent çeperinde özel oto kullanımın kent merkez
alanına göre daha yüksek oranda olduğu tespit edilmiştir. Bu da kent çeperinde özel oto
bağımlılığının daha yüksek olduğunu göstermektedir ve bu durumun trafik
sıkışıklıklarına neden olduğu bilinen bir gerçektir. Ayrıca çalışmada çeperde yaşayan
bireylerin kent merkezine oranla daha uzun mesafe ve süreyi kapsayan yolculuklar
yaptıkları belirlenmiştir.
Özetle saçaklanmanın zaten sorunlu olan İstanbul trafiğine olumsuz olarak etki
ettiği belirlenmiştir. Bu sorunun çözümü için ulaşım ve planlama çalışmalarının
saçaklanma olgusunu da göz önünde bulundurarak gerçekleştirilmesi gerekliliği ortaya
çıkartılmıştır.

v
TABLE OF CONTENTS
LIST OF FIGURES ........................................................................................................vii
LIST OF TABLES.........................................................................................................viii
LIST OF MAPS............................................................................................................... ix
CHAPTER 1 INTRODUCTION ...................................................................................... 1
1.1. Aim of the Study................................................................................... 2
1.2. Methodology and Data ......................................................................... 4
1.3. Structure of the Thesis.......................................................................... 6
CHAPTER 2 NEW DEVELOPMENT AND GROWTH PROCESS IN
METROPOLITAN CITIES ..................................................................... 8
2.1. Defining Urban Fringe and Its General Characteristics ....................... 9
2.2. Definition of Sprawl ........................................................................... 13
2.2.1. Driving Forces for Urban Sprawl................................................. 15
2.2.2. Alternative Development Strategies against Sprawl.................... 17
2.3. Summary............................................................................................. 18
CHAPTER 3 URBAN FRINGE AND TRANSPORTATION SYSTEM...................... 20
3.1. Development and Transformation Process of Urban Fringe
in Developed Countries....................................................................... 21
3.2. Development and Transformation Process of Urban Fringe
in Developing Countries ..................................................................... 23
3.3. Development of Urban Fringe in Turkey ........................................... 24
3.4. Urban Sprawl and Transportation System.......................................... 26
CHAPTER 4 ANALYSIS OF URBAN FRINGE AND
TRANSPORTATION SYSTEM IN İSTANBUL
METROPOLITAN AREA..................................................................... 29
4.1.Development and Transformation Process of İstanbul
Metropolitan Area............................................................................... 29
4.1.1. General Growth and Development Process of İstanbul ............... 30
4.1.2. The Urban Fringe as Part of İstanbul Metropolitan
Area ............................................................................................. 37

vi
4.1.3. Population Development .............................................................. 38
4.1.4. Effects of Industrial Zones’ Development on Urban
Fringe........................................................................................... 41
4.1.5. Development of Residence Areas ............................................... 46
4.2. General Characteristic of Transportation in İstanbul
Metropolitan Area............................................................................... 49
CHAPTER 5 FINDINGS AND ANALYSIS ................................................................. 57
5.1. Evaluation of Survey Results ............................................................. 60
5.2. Trip Distribution................................................................................. 65
5.3. Comparison of Travel Behavior in Urban Fringe and
Urban Core.......................................................................................... 69
CHAPTER 6 CONCLUSION ........................................................................................ 73
REFERENCES ............................................................................................................... 77

vii
LIST OF FIGURES
Figure Page
Figure 1. Comparison of Growth Rate in Turkey and İstanbul .................................. 39
Figure 2. Distribution of Trip Mode in Transportation System ................................ 49
Figure 3. Distribution of Mode in Road Transportation ........................................... 50
Figure 4. İETT Route Length ................................................................................... 53
Figure 5. Distribution of Length ................................................................................. 54
Figure 6. Age Pattern of Urban Fringe and Urban Core Areas .................................. 61
Figure 7. Distribution of House Ownership in Fringe Area ..................................... 64
Figure 8. Trip Distribution per Purpose ..................................................................... 66
Figure 9. Trip Distribution from Fringe to Urban Per Trip Purpose .......................... 66

viii
LIST OF TABLES
Table Page
Table 1. Population Growth of Turkey and İstanbul ................................................. 39
Tablo 2. Industrial Zones in 1980 İstanbul Master Plan (ha)..................................... 43
Table 3. Distribution of Length.................................................................................. 54
Table 4. Number of Vehicle and Daily Passenger in Sea Transportation
System.......................................................................................................... 55
Table 5. Sampling Rate of Fringe Areas.................................................................... 60
Table 6. Average Income of Fringe per Household................................................... 62
Table 7. Car Ownership in Fringe Area..................................................................... 63
Table 8. Number of Worker in Fringe Area............................................................... 64
Table 9. Number of Trip Distribution for Urban Core and Urban Fringe ................. 65
Table 10. Purpose of Trip between Fringe and Urban................................................. 67
Table 11. Trip Distribution per Mode.......................................................................... 67
Table 12. Trip Distribution According to Purpose and Mode ..................................... 68
Table 13. Trip Distance per Mode (meter) .................................................................. 68
Table 14. Average Trip Time per Mode ...................................................................... 69
Table 15. Comparison of Urban Core and Urban Fringe Areas .................................. 70

ix
LIST OF MAPS
Map Page Map 1. İstanbul Metropolitan Area Development Plan (1995) .............................. 33
Map 2. İstanbul Metropolitan Area Development Plan (2006) ............................... 36
Map 3. 1980 İstanbul Development Plan Industry Zones ....................................... 43
Map 4. 1995 İstanbul Development Plan Industry Zones ....................................... 44
Map 5. Comparison of Industrial Areas in 1980, 1995 and 2006 İstanbul
Development Plans ..................................................................................... 45
Map 6. Development Process of Residential Areas in İstanbul .............................. 48
Map 7. 1. and 2. Bridge and Main Roads ................................................................ 52
Map 8. Existing Minibus Routes ............................................................................ 53
Map 9. Existing Railway System ............................................................................ 55
Map 10. Boundaries of Urban Core and Urban Fringe Areas ................................... 58
Map 11. Urban Core and Urban Fringe Areas in İstanbul ........................................ 58
Map 12. Case Area .................................................................................................... 59

1
CHAPTER 1
INTRODUCTION
The effect of industrialization concept which surrounded whole world after 18th
century on people and cities is an undeniable fact. From that date on, people started to
migrate to cities intensively. The process of urbanization gave rise to rapid enlargement
of cities. Especially, along with the progress in the areas of production technology,
communication and transportation, vast changes occurred both in economic and spatial
structures. With time, population accumulating in cities caused the cities to expand into
the surrounding areas. This continual expansion of cities has affected settlements of
urban fringe areas. Now a new process of development occurring rapidly and
continuously in urban fringe areas has appeared. This condition is usually termed as
urban sprawl. Studies on this new process of development have appeared densely after
1940s. The sprawl which has different character as to location and time has been tried to
explain with different definitions. At the present day, a common definition still does not
exist. The studies on urban sprawl are directed toward the definition of this
development, the negative effects it created and the relationship between the city and
the fringe.
Of the relations between city and urban fringe, transportation is an important
subject which we face, because it directs the sprawl of the city. Progress in the field of
transportation has both directed and triggered the development of urban fringe. Because
of the rapid development of transportation substructure and the increase in car
ownership, people began to move away from the city and even to show a leaping
development by having big gaps with the city center.
Firstly, this outward dispersion accelerated with becoming widespread of
railroad. Suburban villages sprang up along the rail lines. The suburban expansions of
the late 19th century, however, did not totally encircle the city. Being rail-based, the
overall pattern was one of a few routes radiating out from the city center (where
commerce and industry was still located), with residential development focused within a
few blocks of either side of the transit line. This left huge swaths of open space between
the rail lines (Planning Commissioners Journal 2006).

2
“The concentration of population into ever-expanding urban centers was the
most important development in population distribution in the first half of the 20th
century. While rural people moved into metropolitan areas, the dense populations of
central cities emptied out into the surrounding countryside. The automobile helped
trigger both a rural-to-urban migration, and a city-to suburb relocation, resulting in
settlement patterns today that conform more to commuting, recreation, and retirement
than to farming, mining, or logging” (Heimlich and Anderson 2001).
“It is well known that in most cities and towns growth is occurring outside the
urban core area, with very low densities of residential and commercial activity in
surrounding areas. This condition is often known as urban sprawl and has been subject
to a wide range of criticism, including for its negative effects on travel behavior and
commuting. Residents of sprawl areas may drive longer distances to more dispersed
destinations, be more reliant on automobiles due to a lack of transit service and limited
opportunities for biking or walking, and contribute unnecessarily to air pollution and
congestion” (Weber and Sultana 2005).
There are researches consider urban fringe area and urban sprawl from various
views. Many disciplines like planning, geography care fringe area as a subject. They
have explained transformation and expansion process, form, land use, socioeconomic
characteristics, cost and effects of fringe areas. Some researches regarding
transportation have inquired effects fringe areas especially related with commuting
time. In these researches, they are included cost of sprawl, travel behavior, demands of
people. In Turkey there are some researches about fringe area today. They inquire
different development trends of fringe areas. In addition there are qualitative judgment
related to interaction sprawl and travel behavior but there is no quantitative research
about it. Therefore, this study has been planned to understand how the development of
fringe in İstanbul affects transportation system. It will be tried to explain influence and
importance of urban sprawl on urban transportation and travel behavior.
1.1. Aim of the Study
“Urban expansion and urbanization of rural area is a dynamic process because
rural people moved off the farms, and residents of the densely populated central cities
dispersed to surrounding suburbs. Enabling this dispersion are investments in new

3
infrastructure such as roads, sewers, and water supplies” (Heimlich and Anderson
2001).
Technological developments in the field of infrastructure and increasing
population make the urban sprawl inevitable. Furthermore, increasing car ownership
and changing standard of living direct people to urban fringe areas and promote sprawl
formation. People who settle in urban fringe never break off connection with the city
center. They maintain their daily routines within the city and there exists an everlasting
trip between urban core and sprawl. In terms of transportation and travel behavior
between sprawl and urban, the primary argument focuses on high levels of dependence
on cars for transportation and greater distances between destinations. Impacts of these
could include more and longer daily trips and greater traffic congestion, reducing access
to services or jobs (Weber and Sultana 2005). Furthermore, driving private car is
preferred by people living in sprawl area because it is more comfortable and it gives
ease of access to where they want to go. In recent years, improvements in automotive
sector have been also effective on the increases in these preferences. Accretion of
dependence on private car, preference living in sprawl areas, and insufficiency of
transportation system cause traffic congestion.
At the present day many big cities face traffic congestion problem. One of these
cities is İstanbul. It has become more bothersome due to especially the increase car
ownership after 1970 and rapid expanding of cities in urban fringe after 1980. In the
literature, observations about interaction of urban sprawl and transportation have been
gone increasing in recent years. Urban sprawl is blamed that it causes many traffic
problems. These problems especially about commuting time created by spreading cities
(Crane and Chatman 2003, Gordon and Richardson 1997) have been searched.
Moreover, researches about influence of urban sprawl on commute distance (Schwanen,
et al. 2004), traffic congestion (Johnson 2001), air pollution, transportation cost
(Carruther and Ulfarson 2003), and high level of dependence on cars (McCarthy 2004)
have been performed. The results of these researches reveal that sprawl causes more
driving, more dependence on car, more spent of time in traffic. As a result, these
negative effects act whole city and daily life by causing traffic congestion and air
pollution.
However, there is no quantitative research about interaction of urban sprawl and
transportation in Turkey. On this account the aim of this study is to analyze influence of
urban sprawl on transportation system and understand interaction of urban sprawl and

4
travel behavior in İstanbul. In this context, this thesis examines the influence and
importance of urban sprawl on trip travel characteristics within İstanbul and investigates
accreting extra imposition of development of sprawl in İstanbul traffic.
1.2. Methodology and Data
Poor infrastructure in transportation system or misallocation of investment, new
developments in metropolitan urban fringe cause people to spend more time in traffic.
In this research characteristics of trips between the fringe area and the urban core have
been analyzed, and travel behavior caused by development of sprawl has been
examined. Time and distance of trip, trip modes, origin and destination of trip, purpose
of trip and many activity analyses have been investigated, and the reasons effective in
these preferences have been analyzed. The differences between the trips made by people
living in city center and urban fringe have been observed. In addition, the changes and
problems in traffic of city created by sprawl have been examined.
First of all, in this study, review of literature has been done to conceive
definition of urban fringe, urban sprawl and development process of these terms. In
literature, on account of lacking common definition, firstly urban fringe and sprawl
terms have been determined. To understand development and transformations of urban
sprawl in İstanbul, previously spatial development, planning process and population
growth have been inquired. Then previous studies on İstanbul fringe area have been
analyzed. It has been used map drawn up by İstanbul Metropolitan Planning and Urban
Design Center (IMP) in 2007. The map shows boundaries of urban core and urban
fringe areas. In that study, it has been used population potential map, development
process of settlement area and previous definition about sprawl in İstanbul to define
boundaries of urban core and urban fringe area. Definition map of urban fringe area by
Doğru which is drawn in 2002 has been used as reference. It has been updated by using
population potential map and development map of settlement by years. The study
carried by Istanbul Metropolitan Planning and Urban Design Center is still in progress
therefore the definition of urban core and urban fringe boundries is subject to change.
In addition, transformation of urban fringe which have taken place in the process
of development of İstanbul is explicated. This transformation, within the context of
plans of environmental regulations made for the overall city, especially after 1980, has

5
depended on the researches for entire İstanbul. Macro plans have been analyzed and
aimed to understand the process of development by comparing with land use
characteristics of today. Spatial development of industrial and residential areas direct
urban development have been analyzed. Changes and development in residential areas
and the decentralization of industrial areas have been analyzed to explicate process of
development in İstanbul. Periodic development process and spatial dispersion of these
areas have been analyzed by using Geographic Information System (GIS). Besides,
population growth rates have also been searched. In this way population mobility in
urban fringe was tried to understand. Data of the Turkish Statistical Institute
(TURKSTAT) has been used. Population values of the year 2005 which were calculated
by the İstanbul Metropolitan Municipality (IMM) in transportation research based on
that of the year 2000 have also been used. It is used exponential increase method to
calculate 2005 population. However in some districts which are under populated it has
been got access to vast accretion of population. Therefore it has been implicated age
structure in projection to counteract it.
Furthermore interaction of urban fringe and transportation has been searched.
The connection between fringe areas and the main roads (E-5, TEM, Şile Road and
orbital roads) of İstanbul have been analyzed. With the new linked transportation
connections it is tried to understand how development is directed. GIS also has been
used for this study. New roads and spatial development process in İstanbul overlapped
in ArcGIS. Connection between fringe area and urban core area has been evaluated and
trips between these areas are explained. Distributions of trips between urban core and
urban fringe have been obtained by using survey of İstanbul Transportation Master Plan
which is executed by IMP. This study includes İstanbul and Gebze. It includes the
survey of the Transportation Master Plan which was addressed on overall 90.000
houses. Transportation Master Plan Household and O-D survey performed between
dates March 2006-March 2007. It was visited 90.000 household, and it was got 80 %
answering ratio and totally interviewed 263.768 persons. Also it was employed self
weighted, multistage, stratified cluster sampling. Sampling rate is 2, 2 %.
In the thesis, it has been analyzed first phases (ilk kademe) in urban fringe area.
Sampling rates of first phases in case area are more than 1.0 %. First phases which has
less sampling rate than 1.0 % were discarded to make a better statistical evaluation.
Thence only Göktürk was discarded because sampling rate of Göktürk is 0, 3 %.
Consequently, case area includes 17 first phases that are Çavuşbaşı, Bahçeşehir,

6
Beylikdüzü, Esenyurt, Gürpınar, Kıraç, Yakuplu, Arnavutköy, Boğazköy, Bolluca,
Haraççı, Taşoluk, Bahçeköy, Akfırat, Orhanlı, Alemdar, and Ömerli. These areas will
be mentioned in chapter 5.
The characteristic of trips in case study are determined according to some
variables. Variables include;
• number of auto,
• number of worker,
• number of house owner person,
• average household income.
Besides trip data have been evaluated. Distribution of trip mode and purpose has
been investigated. Trip time has been calculated as minute by Microsoft Office Access.
Trip distance also has been calculated as meter. Distance between origin and destination
points of trips has been calculated using TransCAD shortest path tool.
With this study, the negative or positive effects of unconsciously added load to
the city traffic in İstanbul by sprawl will have been determined. It will be implemented
travel behavior survey and comment about results Thereby, with decisions made
according to the results obtained better quality accessibility will be provided.
1.3. Structure of the Thesis
This thesis includes four chapters except introduction and conclusion parts.
In the second chapter, development process of metropolitan areas and new
development process of cities in urban fringe is examined. In addition driving forces for
sprawl are determined and alternative strategies against urban sprawl are determined.
In the third chapter, different development process of urban fringes in
developing and developed countries are tried to be explained through samples. Then
fringe development process in Turkey is explained. In addition interaction between
transportation and urban sprawl is criticized.
In the forth chapter, firstly development process of İstanbul is analyzed. Then
development and transformation process of urban fringe in İstanbul are determined
related to population, industry and residential settlements. Transportation development
process in İstanbul and general characteristic of İstanbul transportation are also
explained.

7
In the fifth chapter, urban core and urban fringe areas in İstanbul are defined.
Trip characteristics of fringe and urban core area are analyzed. Some variables are
examined. Travel behavior in sprawl and urban core areas are compared each other and
other research results.
In the last chapter all study is evaluated. General comparative discussion about
travel behavior and sprawl is implemented.

8
CHAPTER 2
NEW DEVELOPMENT AND GROWTH PROCESS IN METROPOLITAN CITIES
The change in cities after industrial revolution, increase in motor vehicles,
developments in communication technology and increasing population in 20th century
were cause of the city growth in time and change interaction with others. With these
changes, cities of industrial revolution getting free of just to mean the city, namely the
form of traditional city, it exposed a new form ‘metropolitan cities’.
“Motor vehicles which especially became widespread in 20th. century expand
daily connection areas and integrated settlements in a very wide area. Increase in
population in the face of these, environment getting under control, technological success
and developing a complex social organization are the interconnected processes which
advanced urbanization. Economical and demographical growth gathered speed and
transformation process of cities to metropol started after sovereignty on an environment
in which there are other cities” (Özçevik 1999).
Metropolitan area concept first started to use in the United States of America. In
1910s it is brought forward that in Chicago, on a specific communication,
transportation, specialization and organization level mutual interaction is changed in
several ways, the working place and living place are diverged from each other rapidly,
in environment suburbs existed, the metropolitan city which is in center of spreading of
relations commands and controls in economic social and management relations and
metropolitan area is introduced as a new social and economic module (Özçevik 1999).
The rapid urbanization process which was by the second half of 20th century
started to be unfastened as from this date. According to developments, change in the
structure of metropolitan cities is occurred. These developments occurred in different
form and time in respect of the development level of the city.
Especially after 1950s, development in out of city center increased. The
metropolitan city event which is the highest level of development, after reaching to a
specific saturation it started to affect environs of the city. Technology, private cars
ownership, easiness in communication triggered this development.

9
“Metropolitan expansion since 1950 has occurred because rural people moved
off the farms, and residents of the densely populated central cities dispersed to
surrounding suburbs. Growth is spilling out of metropolitan areas, as population
disperses to rural parts of metropolitan counties and previously rural nonmetropolitan
counties (Heimlich and Anderson 2001). This dispersion are supported by investments
in roads, sewers, and water supplies” These investments, economical and technological
developments, increase in population and new consumer demands composed a new
structuring area out of the city center and gave rise to fringe concept. The studies
towards explaining this concept are intensified after 1950s.
2.1. Defining Urban Fringe and Its General Characteristics
The definition of fringe was in different ways. There is no a common fringe
definition. Fringe has a heterogeneous structure and differs according to place and time.
Therefore it fails to recognize the uniqueness of the urban fringe.
“Many terms are found in the literature, implying different delimitations and
levels of analysis. The following list illustrates the diversity in terminology: rurban
fringe (Schenk 1997), urban fringe (Kumar 1998, Kabra 1980, Hill 1986), rural
hinterland of the city (Kundu 1991), the city’s countryside (Bryant, et al. 1982), peri-
urban fringe (Swindell 1988), rural fringe of the city (Leeming and Soussan 1979), peri-
urban areas (Dupont 1997, McGee 1991), desakota regions (McGee 1991), and
metropolitan fringe (Browder, et al. 1995, Rao 1991, Saini 1989)” (Dissertations
University Of Groningen 2007).
The fringe concept became to be surveyed in literature in 1940s and 50s. The
first definition is made by American studies. Later studies which were made in
Australian and European metropolis started to take a place in literature. The fringe
concept is undertaken in different ways in literature and in definitions content of the
study changes according to time and place.
The urban fringe concept was the first used in a study which was done by T.L.
Smith in 1937. “According to Smith fringe as the built up area just outside the corporate
limits of the city” (Velibeyoğlu 2004). Later some studies were done on this subject and
new definitions were put off. Definition of fringe has been changed according to content
of studies. Pryor analyzed the fringe in two groups as urban fringe and rural fringe,

10
realizing the change of land use depending on distance. He described urban fringe as
sub zone of the rural urban fringe in contact and contiguous relation with the central
city, exhibiting a density of occupied dwelling higher than the median density of the
total rural urban fringe, a high proportion of residential, commercial, industrial and
vacant as distinct from farmland, and a higher rate of increase in population density land
use conversion, and commuting. And he also described rural fringe that sub zone of the
rural urban fringe contiguous with the urban fringe, exhibiting a density of occupied
dwellings lower than the median density of the total rural urban fringe, a high
proportion of farm, as distinct from non- farm and vacant land, and a lower rate of
increase in population (Velibeyoğlu 2004).
Thomas L. Daniels describes fringe according distance and population as “the
area within 5-50 miles of a city that has scattered, low density development fewer than
500 people per square mile typically on 1-10 acre lots.”
Ramachandran described fringe as “the rural-urban fringe is an area of mixed
rural and urban populations and land uses, which begins at the point where agricultural
land uses appear near the city and extends up to the point where villages have distinct
urban land uses or where some persons, at least, from the village community commute
to the city daily for work or other purposes” (Dissertations University Of Groningen
2007).
Heimlich and Anderson emphasis fringe as “the urban fringe is that part of
metropolitan counties that is not settled densely enough to be called urban. Low-density
development (2 or fewer houses per acre) of new houses, roads, and commercial
buildings causes urban areas to grow farther out into the countryside, and increases the
density of settlement in formerly rural areas.”
Gallent, et al. in their study on urban fringe area in England undertake the fringe
area in six dimensions.
Location: The urban fringe is a zone of transition where urban areas meet the
countryside. The characteristics of fringe areas will also vary according to distance from
the urban edge.
Land use: The urban fringe is often the location of particular land uses and
functions. These areas are often characterized by a wide variety of suburban related
uses, which are in many instances, space-demanding, such as water treatment works and
golf courses.

11
Population density: As in delimitations of rural areas, particular population
characteristics are frequently attributed to the fringe, though not in the UK. In the
United States and in Canada, precise and rigorous definitions of urban fringe have been
employed in population censuses for many years. In Canada, the urban fringe has been a
defined geographical unit since 1961: it is said to include all small urban areas (with a
population of fewer than 10 000 persons) within a census metropolitan area (CMA) or
census agglomeration (CA) which are not contiguous with the urban core of the CMA
or CA. Likewise, the US Bureau of the Census has defined geographic entities for the
collection of land use and population statistics. It includes the ‘urban fringe’, and
describes it as comprising ‘rural areas in metropolitan counties.
Spatial economy: Also in a US context, Hite (1998) sees the urban fringe as
possessing certain (spatial) economic characteristics and efficiencies. Hite argues
(1998) that ‘“urban” and “rural” are labels applied to different parts of space based on
its [economic] uses. The urban fringe ‘is the frontier in space where the returns from
traditional and customary urban land uses are roughly equal to the returns from
traditional and customary rural land uses’. Spatially, the urban fringe is economically
transitional.
Transitional/interfacing zone: Many definitions of the urban fringe emphasize
its transitional nature, or its role as an interface between urban and rural areas. A recent
European study of three urban centers (Newcastle/Gouda/Leidschendam) by Reurba
(2001) described the urban fringe as a ‘transitional location where city and countryside
overlap and is found at the edges of settlements and developed areas. It will not
commonly have any major development or infrastructure, and may have agricultural or
recreational activities on a fairly large scale. It can also contain scattered small
communities and freestanding residential and commercial developments.’
Landscape: The fringe is often perceived as a focus for un-neighborly land
uses, and sometimes as an untidy landscape prone to the abuse of both legal and illegal
tipping. But it is also recognized that the urban fringe may contain a diversity of
landscapes, host important habitats and boast significant levels of biodiversity (Gallent,
et al. 2004).
The urban fringe commonly defined as the transition zone between the city or
urban areas and the surrounding countryside (Lamb 1983). Ralph E. Heimlich and
William D. Anderson define the urban fringe as low density settlement 0.5 acre lot so
larger in metropolitan counties (2001). The importance of the land use dynamics at this

12
interface is underestimated or at least undervalued, because measurement of land use
change is difficult” (Theobald 2001).
Jed Griffiths has described the fringe as the last frontier of planning. According
to other researchers if fringe is a last frontier, it means that it is an indescribable last
frontier.
“Many commentators, point out social characteristics of fringe. Foot (2000), for
instance, suggests that the Italian periferia can be seen as a focus for certain ways of
living; more traditional neighborhoods exhibiting positive qualities of community,
neighborliness and solidarity; together with other often newer peripheries exhibiting
negative features, including crime, unemployment and delocalization” (Gallent, et al.
2004).
“It is not merely an extension of town into country, or a transitional aberration
delaying the onset of real countryside: it is that land lying between urban areas and
countryside with its own separate and frequently unique characteristics. These are:
1. a multi-functional environment, but often characterized by essential service
functions;
2. a dynamic environment, characterized by adaptation and conversion between
uses;
3. low-density economic activity including retail, industry, distribution and
warehousing;
4. an untidy landscape, potentially rich in wildlife” (Gallent, et al. 2004).
A Cumberland County Council report of 1957 implied urban fringe areas:
a. contain the city to a planned population and to prevent its outward growth;
b. provide a belt of countryside between the city and rural towns of the county;
c. provide an escape from urban living with spiritual, mental and physical
relaxation;
d. provide for rural pursuits close to the city;
e. provide for institutions which require a rural site;
f. provide major reserves for Government use;
g. provide for major Open Space Reserves;

13
h. provide for a united area around the city which can be planned countryside,
providing for husbandry of the land, desirable standards of living, working and
playing, and maintenance of beauty, character and tradition (Bunker 2002).
2.2. Definition of Sprawl
Sprawl is a worldwide problem. Especially after 1980 sprawl took large part in
literature. According to changes in the fringe by location and time gave rise to different
definitions of sprawl. In definitions there are common and different parts. But in general
common point is being accepted as an unplanned development.
Sprawl can be defined in a variety of ways. According to The Sierra Club,
“sprawl is low-density development beyond the edge of service and employment, which
separates where people live from where they shop, work, recreate, and educate - thus
requiring cars to move between zones” (Sierra Club 2007).
Ewing (1997) defines sprawl as the combination of three characteristics:
1. leapfrog or scattered development;
2. commercial strip development; and
3. large expanses of low-density or single-use developments as well as by such
indicators as low accessibility and lack of functional open space (Johnson 2001).
“Nelson and Duncan have synthesized a broad definition of sprawl as
unplanned, uncontrolled, and uncoordinated single-use development that does not
provide for an attractive and functional mix uses of and/or is not functionally related to
surrounding land uses and which variously appears as low density, ribbon or strip,
scattered, leapfrog, or isolated development” (Pendall 1999).
The US Department of Housing and Urban Development (USHUD, 1999)
defines sprawl as "a particular type of suburban development characterized by very low-
density settlements, both residential and non-residential; dominance of movement by
use of private automobiles, unlimited outward expansion of new subdivisions and leap-
frog development of these subdivisions; and segregation of land uses by activity”.
Richmond (1995) adds the following indicators of sprawl: decentralized land
ownership and fragmentation of governmental land-use authority, and disparities in the

14
fiscal capacities of local governments. Downs (1998) adds two more characteristics of
sprawl to those presented above: widespread commercial strip development, and no
low-income housing outside central cores (Johnson 2001).
“Some researches analyze negative sides of sprawl. The negative impacts of
sprawl leapfrog development and low-density and unlimited outward expansion is the
same as those that define the positive aspects of sprawl. Definitions of sprawl are
difficult to quantify, as metropolitan areas may have some but not all of the
characteristics of sprawl and to varying degrees” (Johnson 2001). In addition, Orfield
(1997) has drawn attention to the negative political and fiscal impacts of suburban
sprawl, not just in the areas that are experiencing sprawl but also in the inner cities and
inner-ring suburbs that are losing population to farther-out suburban areas.
The Sierra Club emphasis negative impact of sprawl as follows:
• Traffic congestion.
• Longer commutes that steal time from family and work.
• Worsening air and water pollution.
• Loss of farmland, open fields, forests and wetlands.
• Increased flooding.
• Raised taxes to pay for services police and fire departments and infrastructure
new schools, roads, water, and sewer structure (Sierra Club 2007).
There is no widely accepted definition of sprawl. Most definitions have some
common elements. To summarize a variety of definitions or characteristics of sprawl,
having in common:
a. Segregated land uses: Geographic separation of essential places such as work,
homes, schools, and shopping,
b. Causes of an externality: Emphasis on the automobile for transit, loss of
productive farmland, air and water pollution et al,
c. Demand of self behavior: A push for growth the further side of metropolitan
boundary,

15
d. Aesthetic judgment: Low-density and mixed development that is dispersed and
uses a lot of land; residential and employment densities that are generally lower
than those in further-in suburbs or in the central city,
e. Process of population and urban growth: A process of growth occurs over some
period of time,
f. The inability of local governments and poor planning: lack of devising common
policies to address perceived negative characteristics of the current growth
regime.
2.2.1. Driving Forces for Urban Sprawl
Sprawl as a part of development focuses on fundamentally land development
and transformation of land uses. Changes in land use are the end result of a variety of
forces that drive the millions of separate choices made by individuals and governments.
It is possible to mainly summarize driving force of sprawl as below.
1. Urban expansion and population growth
Increase in population is an undeniable fact. The great majority of world
population lives in cities. Both immigrations and the natural increase in population
speed up the growth of cities. Rapid population growth and immigration also give rise
to city widening and sprawling.
2. Social effects
Change in life style, increasing air pollution, noise and crime in center gave rise
to move to out of cities. Although it is not explained well changing social trends with
effects of other variants, for instance, demand for low density, preference of places in
nature direct people out of city.
3. Employment, economic development, and technology
“Developments in information and communication technology have been a
major driver in the recent U.S. economic expansion. New technologies have changed
the economics of spatial decisions, both for consumers and businesses, and are
facilitating the existing trend toward a more dispersed economy. Although the new

16
technologies will technically enable firms and residents to disperse to rural areas, they
are more likely to relocate both to lower cost metropolitan areas and to suburban and
exurban locations within metros” (Heimlich and Anderson 2001).
4. Infrastructure and transportation
Metropolitan areas grow organically, like a living thing, with stages of growth
that are palpable and predictable. After the new housing developments are built and
occupied, the new residents realize they need new schools and improvements in the
roads, sewers, and water supplies servicing the new housing; the expanded
infrastructure then attracts more housing at higher densities. When a critical mass is
reached, shopping centers and businesses follow the population, to serve them and to be
closer to the labor force.
Investments in infrastructure, such as roads, sewers, and water supplies, can be
one of the most important drivers of urbanization, since infrastructure provides the
essential framework for development (Heimlich and Anderson 2001). A study in
Maryland showed that highway construction was a key factor in growth, with new roads
preceding migration outward from the cities (Heimlich and Anderson 2001).
Population growth and the pressure on the land increase requires closer to the
better-serviced and accessible areas along the roadsides. On this reason sprawl firstly
occur trough transportation axes in general.
5. Poor planning and management
Local governments generally do not develop adequate capacity to plan for and
manage growth until it is too late to effectively channel development. Planning and
zoning have generally been upheld by valid regulation. Local governments often fail to
appreciate impending growth facing them, and generally lack capacity to develop
adequate responses before growth overwhelms them.
“Changes in land use are the end result of many forces that drive millions of
separate choices made by homeowners, farmers, businesses, and government. Economic
growth increases income and wealth, and preferences for housing and lifestyles, enabled
by new transportation and communications technologies, spur new housing
development and new land-use patterns” (Heimlich and Anderson 2001). Growth,
demands and land use change are anticipated results.

17
2.2.2. Alternative Development Strategies against Sprawl
Sprawl acknowledged as undesirable form of development. Sprawl also has been
seen as cause of diverse problems. Economic, social and environmental disadvantages
of sprawl have been inquired in lots of searches. Therefore a number of land-use
strategies that include sprawl as well as certain alternatives to sprawl have been
generated (Razin 1998), but urban sprawl has complex structure and it differs from
country to country. Therefore there are different strategies to fight sprawl. Some
prevalent development strategies against sprawl are defined in this context.
1. Transit-oriented development (TOD) aims to design livable communities that
are centered on high quality train systems. It is defined as walk, livable, mixed-
use communities built around transit stops. Train stations are prominent places
of city. It is easy to access stations by walk. It is provide maximize access to
public transport and reduce dependence on car.
2. Urban growth boundaries (UGB), one antidote to sprawl, have been defined by
Stoel as a line drawn around a city at a distance sufficient to accommodate
expected urban growth. Beyond the boundary, urban development is prohibited
(Johnson 2001). It is intended to control urbanization by designing higher
density area inside the boundary and protect farmlands and natural resources
around city.
3. Smart growth based on rehabilitation land-use to make them more sensitive to
solve problems of lack of housing diversity, traffic congestion, and
environmental confusion. When city is growth, smart growth purposes to
provide developed infrastructure, acquiring certain open spaces and increased
social equity. 10 guidelines for smart growth are:
• Mix land uses,
• Take advantage of compact building design,
• Create housing opportunities and choices for a range of household types, family
size and incomes,
• Create walking neighborhoods,
• Foster distinctive, attractive communities with a strong sense of place,

18
• Preserve open space, farmland, natural beauty, and critical environmental areas,
• Reinvest in and strengthen existing communities & achieve more balanced
regional development. Provide a variety of transportation choices,
• Make development decisions predictable, fair and cost-effective,
• Encourage citizen and stakeholder participation in development decisions of
Smart Growth (New Urbanism 2007).
4. “The sustainable development strategy, derived in large part from the World
Congress on Sustainable Development held in Rio de Janiero in 1992, is
designed to limit growth to the degree that public facilities and services are in
place to accommodate this growth” (Johnson 2001).
5. “New urbanization” derived from traditional urbanism and a basis for smart
growth. It is trend had its roots in the work of maverick architects and planners
in the 1970s and 1980s that coalesced into a unified group in the 1990s. From
modest beginnings, the trend is beginning to have a substantial impact. More
than 600 new towns, villages, and neighborhoods are planned or under
construction in the US, using principles of the New Urbanism (Newurbannews
2007). Principles of new urbanization are walk ability, connectivity, mixed-use
and diversity, mixed housing, quality architecture and urban design, traditional
neighborhood structure, increased density, smart transportation, sustainability
and quality of life.
There are also some other policies to control urban sprawl that frequently based
on land use plans at the national, regional and metropolitan levels such as zoning and
land use policies, transportation investment decisions, and taxation.
2.3. Summary
There are many researches about urban fringe and sprawl terms which are
occurred in accordance with development in 20th century. Each researches investigates
these terms from own view point. In addition to this sprawl have different characters to
time and place. On this account there is no mutual definition of these terms.
In the literature survey, it is noticed that sprawl has been searched in terms of
physical and socio economic characteristics, impacts, negative effects especially in

19
environment and transportation. Sprawl has been criticized that it causes many negative
effects. Criticisms include following items.
• air pollution caused by car using,
• spent of time in traffic,
• environmental and water pollution,
• people live in fringe area driving farther,
• car dependence, wasteful use of land,
• traffic congestion,
• lengthened travel.
Despite these negative effects, people has preferred to live in urban sprawl and
they have maintained connection to city center for daily activities either school or work.
Offices of people live in fringe area generally are in urban area instead of sprawl or
rural areas. And also many activities such as school, shopping and cultural are in the
city center. Distance between these two areas and lack of public transportation are
considered daily trips can create diverse problems. In spite of these problems people
preferred to live in sprawl. Therefore it is important to research interaction sprawl and
travel behavior.
In addition to defining of term, impacts of sprawl on transportation system have
been analyzed in recent years. Attention focuses on high levels of dependence on cars,
trip distances, and increasing trip time. Then sprawl creates more and longer daily trips
and traffic congestion. Besides, many other subjects have been studied. They will be
mentioned in the next chapter.
In this study, urban fringe treats according to Ramachandran description as “the
rural-urban fringe is an area of mixed rural and urban populations and land uses, which
begins at the point where agricultural land uses appear near the city and extends up to
the point where villages have distinct urban land uses or where some persons, at least,
from the village community commute to the city daily for work or other purposes”. In
parallel with urban expansion will be analyzed in respect of demographical, physical,
land use characteristics and planning process. Planning study and daily transit relation
development of transportation system also will be researched. Then urban development
and these studies are assessed. In this context, transformation process and characteristics
of sprawl in developed and developing countries will be studied in the next section. And
it will be surveyed interaction between sprawl and transportation.

20
CHAPTER 3
URBAN FRINGE AND TRANSPORTATION SYSTEM
With the industrial revolution in 18th century people started to immigrate to big
cities- where production facilities are seen. Usage of technology development in
agriculture, too and replacing machines instead of man power forced people to
immigrate to cities. After the industrial revolution a rapid process of urbanization
started. Cities which started to be in a great production process until 19th century, in
this process were in a bad situation from the point of life standard. A new urban land is
needed for the intensive population in cities. New suburbs which are near cities and
transportation facilities started to be built to provide the lack of urban land. The private
car ownership in 20th century, developments in highway system gave rise to suburbs
diverge from city. Furthermore, in this century the development in production needed
bigger places and as a result of this they took place in more widely areas outside the
cities. The industry which is outside the city engendered the necessity of house in its
close quarter. As a result, an industry and house lands which are dependent on city
started to build outside the city. These places glamorized more by making the needed
infrastructure for them.
Although this process of development is the same in its general framework, it
has some differences in developing and developed countries. Experiencing the same
process of development in different time periods causes diversification of development.
Discrepancy of population growth rate, technology and utilization resource and so forth
are different in both countries. Development which is different in terms of time and
process is evaluated in following parts separately as developing and developed
countries.

21
3.1. Development and Transformation Process of Urban Fringe in
Developed Countries
In most traditional European cities, suburban areas usually became the choice of
the lower-income laboring classes in 17th-century. This outward dispersion accelerated
with the widespread arrival of the steam railroad in the 1850s. Suburban villages sprang
up along the rail lines. The introduction of the electric trolley car in the 1880s permitted
an even larger segment of the population to leave the center city behind, as trolley car
lines followed major streets to the edges of the city. The suburban expansions of the late
19th century, however, did not totally encircle the city. Being rail-based, the overall
pattern was one of a few routes radiating out from the city center (where commerce and
industry was still located), with residential development focused within a few blocks of
either side of the transit line. This left huge swaths of open space between the rail lines
(Planning Commissioners Journal 2006).
In England, social and physical changes were formed because of development
occurred in 18th. “At the end of the 18th century, scattered middle-class suburban
villages surrounded London. By the 19th century the process of building suburban villas
by the middle-class was a commonplace practice” (Mubarak 2004).
The increase in communication and car ownership in 20th century started the
process of transformation of urban fringe. Until this period, fringe gave shelter to
middle income people. After this period, the low income group living in urban fringe
started to give its place to middle and high income groups. With developments in
transportation new sprawl areas started to depart from cities more. The wide lands are
appropriate for new process of development which needs big areas in urban fringe.
Therefore, the production units which were moved to urban fringe composed a low
intensity and limited structure in this area.
“The nature of American sprawl changed radically with coming of the
inexpensive automobile in the 1920s. No longer limited to close proximity to major
streets and trolley lines, low density development expanded to previously inaccessible
areas, often leapfrogging over undeveloped areas to more distant locations. Independent
suburban villages, with their own land subdivision, planning, and zoning authorities,
grew rapidly” (Planning Commissioners Journal 2006).

22
After World War II, a new system of development was implemented nationwide,
replacing neighborhoods with a rigorous separation of uses that has become known as
conventional suburban development, or sprawl (Newurbannews 2007).
By the end of the 20th century, sprawl had reshaped metropolitan areas across
America. While central cities still remained a focal point for government, financial, and
large corporation day-time office workers (and night-time theater goers), they had been
drained of newer production industries, and of middle- and upper-income residents
(Planning Commissioners Journal 2006).
In advanced industrial societies such as Northern America and England things
that seen for last 20 years from the city center were some management and
administration functions which are dependent inspection and coordination associations
in this city, moving to suburbs called with some names such as new cities, satellite city
around (Kıray 1998).This case in urban fringe gave rise to area to transform itself to a
heterogeneous structure. In social and land use cases it has a heterogeneous structure.
There are mixed land use such as house, shopping, industry, big offices and have a
lower intensity from the city area. Although sprawl has a disconnected structure from
city, difference between sprawl and urban reduced so much. There are not great
differences about socio-cultural, economical and technological usage.
But despite these positive developments, with having a low intensity of structure
and spreading to wide areas, increase of using of car have come up many problems.
First of all there are problems in transportation and air pollution problem is in a scary
size. Although the urban fringe performs a life style which is away from noise and
chaos of city, these people who are dependent on city in their daily life have some
traffic problems between city and urban fringe. “In the outlying suburb of Washington,
businesses, shopping centers, and residential developments encroach on land that
recently consisted of farms and woods. Mass transit is scarce in these areas, and
highways have expanded and re-expanded to meet increased demand. But larger
highways have failed to reduce congestion. In 1998, a federally sponsored study found
that traffic delays caused the average resident of the Washington area to waste two full
work weeks per year while stuck in traffic” (Stoel 1999).

23
3.2. Development and Transformation Process of Urban Fringe in
Developing Countries
In these countries there is trade development before the industrial revolution. In
developed countries big coastal towns which were made for distribution of industrial
products later had transformation with technological developments. In these countries,
development mostly has been affected by crowds who have come to cities with
emigration, small or medium scaled industry and location of advanced technology. The
differences of sources, the difference in usage in technology, feebler institutional and
professional structure and in parallel with these growing speculations differentiate the
process of development.
In the developing countries, developing of the fringe has appeared in parallel
with transformation process of cities. This development which was realized after 1960
was affected by site selection of advanced technology and medium scaled industry and
emigrations. Advanced technology took part far away from city center and medium
scaled industry took part in urban fringe. People who migrated in city preferred places
close to city because of the high land value in city center. Then, they started to become
intense around middle scaled industry. After site selection of production advanced
technology outside of city, development toward these areas gave rise to be settled
vacant land among this area or agricultural areas to change function. In the main
roadside or around the old small settlements new housing areas and working places
started to occur.
The urban fringe has the characteristics of a confused, complicated transit area
in which both the escapers from the city and people who migrated to city live. It
encloses both country side and urban characteristics.
Differently from the developments in fringe of developed countries, in spite of
the increase in communication and transportation opportunities in developing countries
there is still the difference between these two areas. In the fringe area which has a
heterogeneous structure in terms of land use, when moving towards field from city it is
intense first, then, a scattered structure which is becoming sparse attracts the attention.
Moreover, the agricultural areas in urban fringe are gradually depreciating; on the other
hand, an urban income is becoming a current issue. In these areas where the
substructure has not been done exactly, doings of urbanization creates an unplanned

24
development. In other words, a pre-industrial city does not get transformed via the
industrial phase into a post-industrial urban structure and pattern according to Western
models of the non-planned city.
The most important differences from the Western post-industrial city are the
following.
• The size and variety in low-cost housing, which determines to a considerable
extent the morphological pattern in the Third World and is not comparable with
a pattern in the Western world.
• The relation between urbanization and social change. In the industrialized world
the spatial component of urbanization was coupled with a strong social-cultural
component that changed the rural behavior pattern. In the developing countries
this last component is less evident and the importance of the belonging to an
extended family remains. Hence we observe there the phenomenon of urban
villages.
• The importance of the informal circuit in the urban economy of the Third World
is fundamental. One can not state that this is just an intermediate stage leading to
formal employment in industrial and tertiary sectors.
• The strength of the cultural tradition has its impact on the morphological pattern
in the sense that traditional elements are sometimes pertinent components of the
urban form (Vanneste, et al. 1999).
3.3. Development of Urban Fringe in Turkey
“Turkey, like so many other nations in the twentieth century, has been
transformed by rapid urbanization. As is the case everywhere, urbanization, in Turkey is
an inherent component of the process of modernization. Migration, the growth of urban
economies, and rapid expansion of cities are integral features of the set of structural
changes we call modernization. Urbanization, however, is not merely a synonym for
modernization or industrialization. Instead urbanization refers to a particular element of
the development process- the concentration of population in relatively large settlements.
Concentration of people into large settlements is associated with distinctive economic,
social, and political changes, such as specialization of the labor force, alteration in

25
family structure, and changes in the political attitudes of urban dwellers” (Danielson
and Keleş 1985).
The primate city fact which occurred in 1950s when the characteristic of
settlement is changed and the urbanization started with its wide meaning, at last, after
1960s has gone towards metropolitan area with changes on society’s part (Kıray 1998).
By this date the city which has developed around the existing settlements has started to
expand. After that date, cities in Turkey have been spreaded to urban fringe an
increasing rates.
In 1970s, increasing in automotive sector affected urban form. Automotive
transportation has had the same effect on the Turkish metropolis as in cities all over the
world, permitting more dispersed location of jobs and residences, particularly along the
main highways that radiate outward from the urban core. Rising land prices have
pushed development outward in search of cheaper sites. Factories no longer cluster
around port and rail facilities, and newer industries are highly decentralized in the major
Turkish cities. Housing development reaches far beyond the limits of public
transportation, in the form of both low-density conventional housing and squatter
dwellings (Danielson and Keleş 1985).
In the urban fringe where urban structures have started to raise together with
squatter housing which speeded in 1960s, development of mass housing and
cooperative housing after 1970 also have taken part. The character of countryside has
taken urban characteristics. The huge agricultural areas were divided into small pieces
and the land speculation started. Having these developments in the place, the social and
economic structures are changing, too. It can be seen that the number of workers in non-
agricultural sector has increased due to the increase in non-agricultural activities.
Additionally, those who immigrate to cities preferred these areas as they were cheaper
lands, and this gave rise to a mixed structure in the fringe.
After 1980s, urban land market entered into a different period, in Turkey. In this
period big scales about housing were aimed and laws were adopted directed to this aim.
With the problems such as congestion, infrastructure and environment, car ownership
became further widespread, and the belt highways, credit facilities, urban land market
accelerated. The urban fringes where those who emigrate made room for
accommodation in previous periods now came under the areas of cluster housing and
the following demands of cooperative of medium scaled group according to working
place or job. The high income groups who were stucked in city could not maintain the

26
non-mandatory assurance, house and environment prestige. Like small groups, the high
income groups organized to open lands for housing in metropolitan urban fringe (Doğru
2002). The demand of high income group developed significantly, especially after 1990.
The luxury housing areas in urban fringe were affected by the current usage of
transportation and land use, and at the same time, they were determinative in building of
many new transportation connections (Çekiç and Ferhan 2004).
3.4. Urban Sprawl and Transportation System
From date of first settlements to 19th century, form of urban figure on walking.
These cities disappeared by effect of growth population and industry after mid of 19th
century. Small cities located environs of train stations which are out of city so that train
and tram enabled more fast access. In addition, cities were developed along
transportation axles. After starting of using private car in 20th century, people preferred
to move to surrounding areas of cities. Private car ownership has provided large
freedom in people’s travel choices. Development in transportation technology and
regarding accretion of accessibility, new roads and infrastructure facility growth also
acted people’s spatial choices which have been efficient to form cities.
Early cities were compact, to make them easier to defend and to keep home,
work and activities within walking distance of each other. Nevertheless most
fashionable and respectable addresses tended to be located close to the center of town
because of latent transportation vehicles and infrastructure (Frumkin, et al. 2004). But
over time, cities sprawled beyond their original boundaries, notably after development
in transportation. Many activities and people started to settle in urban fringe because of
moving away from complex city life, high land price, air pollution and many other
reasons. Besides, life in urban fringe area provides larger land, fresh air, placid space,
low land price and so on. In the US, lower cost housing is often unavailable in
peripheral areas and, as a result of not living close to their place of employment. In
contrast to typical US cities, the most socio-economically disadvantaged areas in
Australia are located in outer suburban locations, as opposed to the centre of the city.
Higher income groups, on the other hand, will often make a conscious choice to
distance themselves from employment zones and their negative externalities (Buchanan,
et al. 2006). For that reasons people has expanded urban surrounding area and settled in

27
low density. “The highway system has been the major force for continued low density
settlement and suburbanization. The barriers of distance continue to dissolve; factories
and offices continue to move to where employees want to live” (Gordon and Richardson
1997).
New development in urban sprawl has the potential to affect travel demand.
Characteristics of the new development such as size, type, shape and land uses have
been criticized to affect how daily travel. The studies measure urban form and travel
behavior in a variety of ways, use a variety of study designs, and consider a variety of
spatial scales, from the neighborhood to the census tract to the entire metropolitan
region (Frumkin, et al.2004). One of the important county-level studies was published
in the late 1980s by Peter Gordon, Ajay Kumar, and Harry Richardson, which looked at
the amount of time involved in commutes. They found that commutes in spatially large
cities took more time than in small cities (Crane and Chatman 2003). In addition “travel
behavior theory and other behavioral theories point to the importance of relationships
between longer-term choices, such as residential location choices, and shorter-term
choices, such as daily travel choices. Work by Domencich and McFadden (1975) and
others on travel behavior theory recognized that daily choices about travel are related to
choices about auto ownership, residential location, and job location (Handy, et al.
2004). One study focused on the impact of residential relocation on travel patterns in the
United Kingdom found that there is an association between housing migration and
increased commuting distances, with increased travel accompanying moves out of the
central city. Research in Sydney found similar increases in travel time after moving out
and also found that people had fixed travel mode preferences when traveling to work
and that a change in residential location did not lead to a large change in travel mode
after relocation. Research in Denmark by Naess (2005) and the US by Krizek (2003)
have found similar findings (Buchanan, et al. 2006).
Like these, many researches about effects of sprawl on travel have been studied
especially on commuting time, longer trip distances, and greater reliance on the car.
Especially dependence on use of car is very important problem. “According to the 2001
National Household Travel Survey (NHTS), households without a vehicle made 34.1%
of their trips by auto, 19.1% by transit, and 43.5% by no motorized modes; in contrast,
households with one vehicle made 81.9% of their trips by automobile and households
with 3 or more vehicles made 90.5% of their trips by automobile” (Handy, et al 2004).
Sprawl is blamed causing these results in many researches. On the other hand some

28
research suggests that many people who live in sprawl would prefer more walking
communities. Survey in Boston and Atlanta confirm there is indeed a latent demand for
communities that permit less driving and more walking.
Now, accretion of trips both interurban and intraurban has become global
phenomenon. People have covered longer distance for work or shopping in the course
of time, and have drive more private car regarding economical growth. This situation is
related to development of sprawl. In Turkey especially in the metropolitan area, it is
similar to the world. New development areas in urban fringe of metropolitan cities have
affected travel behavior but there is no research about this subject in Turkey. This study
is the first to research influence of urban sprawl on daily travel behavior.
29
CHAPTER 4
ANALYSIS OF URBAN FRINGE AND TRANSPORTATION SYSTEM IN İSTANBUL METROPOLITAN AREA
4.1. Development and Transformation Process of İstanbul
Metropolitan Area
İstanbul is a metropol which has always been at an important situation for
Turkey. Besides its economic, social and cultural features, it is an important center with
its historical and geographical position as well. İstanbul is the focus of activeness with
this feature and it is on a continuous development process as the result of migration and
its rapid population growth. Development process of metropolitan area started to show
its effects in İstanbul after 1960s. But, the process that was experienced in İstanbul
evolved differently from the developed countries. The city which had not completed its
industrialization process yet and which experienced rapid population growth had
developed unplanned.
The first Bosporus Bridge (Boğaziçi Bridge) which was opened to the traffic in
1973 and the connection roads directed the form of the city and accelerated the spread
of the city. Afterwards, the second Bosporus Bridge that was opened in 1988 caused the
city to expand towards north. At the same time, the roads which were constructed in
order to obtain interior city connections affected the development of the city quite
considerably. The increased automobile ownership of the people which was seen at the
same term caused people to head out of the city and this situation was effective at the
expanding of the town. İstanbul has developed as a one-centered city, however daily
trips are expanded to large areas and this situation is being felt as a burden on the
traffic.
The planned development of the city was aimed with the planning studies, but
these studies were not successful because of some political and economic reasons. The
city which had developed uncontrolled got into a rapid sprawl process. Due to the
spreading of the town towards fringe, unplanned, and rapid development process in the

30
city has started to be insufficient for infrastructure. Especially traffic problems have
become more evident.
“The development process of İstanbul, starting from its establishment until our
day, has increased or decreased according to its population’s economic and political
situation, however, it is observed that, there has always been an expanding at the spill
out of the city” (Sazak 2002). In this section, the evaluation of the expanding process
that has seen in İstanbul and the evaluation of the issues which were effective at this
process, like population, industry, residence and transportation, will be deliberated.
Besides there four main topics, the plans that determine the development direction of
the town and which comprise the whole city will be evaluated, as well.
4.1.1. General Growth and Development Process of İstanbul
İstanbul city has stood in the forefront at every term. The city has an important
position for the country’s economy; within time it has come into a situation of
accommodating a very crowded population due to migration and population increase.
On the other hand, the rapid increase of the population has brought some problems
together with it. The center of the city which had arrived to a saturation point started to
develop and expand city through fringe areas after 1950s. The town has continued its
rapid development process until our day, and it accommodates various problems which
were caused by this rapid growth in its structure.
The planning studies which were being made to the aim of organizing İstanbul’s
development started at the 19th century. Until 1930s, lots of planning studies were made
at the urban scale. 1580 and 1593 numbered laws which were legislated in 1930s stated
that, the municipalities which were greater than some certain level had to make
planning. In this way, arrangement of city was made with the local implementation
plans until 1950. In this term, the planning of İstanbul occurred around the prevailing
historical city center and the growth continued according to plans which were being
prepared in respect of one-centered growth model that expands through every direction
and in the form of destroying historical city pattern and renewing it (İBB 1995).
In 1965, planning offices which were going to make the plans of İstanbul,
Ankara and İzmir were formed with the decision of Council of Ministers. These offices
were connected to Ministry of Public Works and Settlement. It was decided that, the
31
plan were going to be financed by Iller Bank. According to this decision, İstanbul
Metropolitan Area Planning Office was established in 1966. In the same year, İstanbul
Industrial Zones Master Plan was prepared by the bureau.
In the Industrial Zones Master Plan that was approved and become valid in 1966
it was emphasized that, growth should be taken into account in a greater frame than the
settled area; it should be firstly thought within the limits of East Marmara and Thrace
Sub-Region and afterwards within the limits of İstanbul’s metropolis. It was anticipated
that, at the regional level, the industry-service development of the cities like İzmit and
Bursa should be supported and at the metropolitan level, the development of the
industry, the observed growth tendency at the east edge should be supported through
establishing Industrial Estate. It was suggested that, there was the necessity of
organizing various industry regions also at the west edge and infrastructural investments
should be used as a tool in designating the limits of development. In the plan, it was
anticipated that, faster development of the east edge in contrast to the west could occur,
and by forming a second axle in the west-east direction with urban fringe roads,
decentralization would be easier (Yüzer and Giritlioğlu 2003).
Especially after 1970s, the development of globalization which was the
dominant economic system at that term showed its effects more clearly in big cities. As
a prolongation of this change, new structural changes occurred. Starting from the 1970s,
mass housing implementations has increased and after the construction of the orbital
roads, it fastened the process. However, these new settlements were swallowed by the
city that had been expanding rapidly and uncontrolled, and they combined with the city.
This process continues by repeating itself in the similar way. All of the vacant lands
around the intensive urban core and villages turned to suburban areas. The city
continued to grow without control by adding these suburban areas to its borders from
every direction. It was observed that 1/25.000 scaled İstanbul Master Plan (1973) is
insufficient on the basis of city growth.
In 1980, a metropolitan scaled plan firstly was done by Ministry of Public
Works and Settlement. It was approved in 29.07.1980. The plan which was targeting the
year 1995 was a 1/50.000 scaled Master Plan. The planning studies that were done after
1980 included planning decisions which supported the expanding policies of the town.
Discharging operations of the production areas that are in the city center and planning
orbital roads are decisions that support the expanding process of the metropolis. In the
plan prepared in 1980 term, the location decisions of mass housing and great industry

32
areas targeted especially the fringe areas of the city like Büyükçekmece,
Küçükçekmece, Pendik and Tuzla. These kinds of decisions triggered the city’s shift to
these directions.
Planning authorization of İstanbul Metropolis was given to the Metropolitan
Municipality and Ministry of Public Works and Settlement with the 3030 numbered law
which was legislated in 1984. Metropolitan Area Planning Office was connected to
İstanbul Metropolitan Municipality in 1985. Afterwards a restructuring was done in
1989 and in March 1994, 1/50.000 scaled İstanbul Metropolitan Area Master Plan was
approved by the Metropolitan Municipality. After the local elections in 1994,
reexamination studies of this 1/50.000 scaled master plan started, and in 15.11.1995,
1/50.000 scaled İstanbul Metropolitan Area Master Plan was approved by the
Metropolitan Municipality. After the approval of Metropolitan Area Master Plan,
Metropolitan Area Master Plan which was approved in 1980 continued to be
implemented in İstanbul. All of the plans that were made after that day until today were
prepared according to this upper-scaled plan (İBB 2006a).

33
Map 1. İstanbul Metropolitan Area Development Plan (1995)
33

34
In 1995 plan, decentralization of industrial zones was suggested and these zones
were located at the areas which are close to water reservoirs in İstanbul urban fringe.
This decision was taken in order to diminish the pressure on Central Business District
(C.B.D); however the development in the urban fringe was not taken into consideration
with this decision and as a result of this, new and big settlement, mass housing and
cooperative apartment housing areas started to develop around these new industry
zones.
The town developed according to the local roads of First and Second Bosporus
bridges. This situation fastened the development of Sultanbeyli and Samandıra regions
in Asian Side, and Arnavutköy and Gürpınar regions in the European Side. Industrial
development has occurred partially according to the plan; however, it developed at a
bounced form beyond the borders of the Municipality. This development, through
migration, enabled the constitution of shanty towns.
When we evaluate the planning studies related to İstanbul Metropolitan; we can
see that, the area that İstanbul Metropolitan has expanded and the growth at the urban
fringe is quite different from the targeted level of 1973 and 1980 plans. In 1995 Plan,
though, lots of decisions were taken related to metropolitan fringe. Decentralization of
the industry and services, and taking these to the wings (edges) of the city are the most
important decisions which was taken for the metropolitan fringe.
New developments are observed about planning at the present day. According to
the 5216 numbered Metropolitan Municipality Law that was approved in 10.07.2004,
environment arrangement planning authorization is transferred to the Metropolitan
Municipality. Planning endeavors have started within the Metropolitan Municipality in
accordance with this plan. A 20 year development process was planned with the
1/100.000 scaled İstanbul Province Development Plan which was completed in 2006. A
sustainable urban development through evaluating global and regional dynamics and
increasing the quality of life were the targets of this plan. Multi-centered structuring was
described. Thus, a symmetric distribution of development was targeted. In this way, the
integration of urban fringe with the urban is going to be achieved; development will be
extended to the whole region through centers and focuses (İBB 2006a).
Decentralization of industrial areas out of İstanbul and controlling the
population increase in İstanbul are within the targets of the plan. Besides, it is
considered that, new attraction centers that will be created in Silivri and Kartal boroughs
will ease urban core-urban fringe transportation problems. “New attraction centers will

35
be able to control the settlement of population at these areas with their transportation
systems which are based on rapid and high-capacity rail systems and which have public
transportation priority. According to the multi-centered urban development target that
determines the macro form, the direction of CBD to the west and creating sub-level
centers within the city and attraction centers that are integrated to the rail systems in two
wings are supplemental politics. These policies offer solutions to the various problems
like symmetric distribution of income, sustainability and decentralization of the
industry. Multi-centered structures make contributions to equal access to services both
socially and spatially and creates healthy living environment by diminishing residence-
business transportation to minimum levels” (İBB 2006a).

36
Map 2. İstanbul Metropolitan Area Development Plan (2006)
36

37
4.1.2. The Urban Fringe as Part of İstanbul Metropolitan Area
Process of sprawl in İstanbul city which is one of the metropolitan cities of
Turkey and is affected from globalization truth shows a similar character with the
process seen in the entire country. After 1950s, demand that caused the density of the
center started to loose its strength. Developments that occurred after that date fastened
the expanding through the urban fringe.
Sprawl process started in 1950 when industry choose place around main
transportation axles. It continued its development in 1960s around industry zones like
grease spots. Until the ends of the 1960s, İstanbul had developed by protecting its
natural features with a partial protectionist approach. However, due to rapid and
unplanned urbanization which occurred after 1970s, it entered to a term in which natural
and geographical features were not seen important.
After 1975, city sprawled towards urban fringe and created a very fast
transformation in this area. Changes at urban fringes in metropolitan area started at this
term and new industry and residence areas were placed into the urban fringe which had
rural characteristics. As a result of the growth of the industry within city, the process of
moving industry zones to urban fringe and illegal and uncontrolled development at this
area has started. When industry zones were expanded to longer-distances through urban
fringe from city center, firstly, residence sub-cities, then, industry sub-cities and also
satellite cities settled in the fringe of metropolis. The rapid and uncontrolled
development that occurred at İstanbul Metropolitan fringe turned the urban fringe into
areas where great urban development problems are seen (Doğru 2002).
This process developed quickly in 1970s, and during the 1980 term, it continued
quite rapidly as planned and unplanned. The planning studies that were done after 1980
term, the expanding policies of the metropolitan city were supported. Before 1980,
urban fringe were opened to residence generally with migration; but after 1980, these
regions turned to be targets of the cooperative housing demands of the middle-bracket
income.
1990 period is a term in which sprawl is partially continued under control.
Decentralization of the factors like especially industry that create problems at the city
center to the urban fringe was deeply taken into consideration and was partially applied.
On the other hand, this development caused new industry and residence areas to develop

38
in regions which were beyond the municipality border. In the period; while settlement
areas in the center grew slowly, unplanned and infrastructural insufficient residence
areas at the urban fringe grew quite rapidly. Unlike this trend, at that term, high-income
people started to choose a new lifestyle by leaving the city center and settling around
urban fringe. The increase in car possession played an important role in these decisions.
Far from the city center and isolated from the other parts of the city, a villa style settling
and living was preferred. This movement started in 1980 but it fastened and expanded
after 1990. The residences of these new cities promise an isolated from problems and
isolated from the whole city and a secure life; they prepare base for being isolated from
public life. These places are reflection of changing-new life style. “When we look at the
distribution of luxurious-residences which developed at the urban fringe after 1980, we
see that they generally settle around forest areas which prevail at the northern sides of
both edges of the city, at the Ömerli Barrage basin, around Terkos Lake, in
Büyükçekmece and Çekmeköy” (Çekiç and Ferhan 2004).
Residence place area choosing process takes shape according to the development
and alteration in the transportation, and also depending on private-car possession of
income-groups. Similarly, area choosing of industry zones takes place according to the
development at transportation, and depending on various economic criteria. Besides, the
selection of industrial zones location affects the settlement choosing criteria of the
population particularly caused by migration.
4.1.3. Population Development
İstanbul is the city that has the greater and faster population growth rate than
Turkey. According to 2000 population census results, population of İstanbul was
10.018.735 and this amount corresponds approximately to 14 % of Turkey’s total
population. İstanbul’s population grew at a close ratio until 1950s; however, it got into a
quite rapid population growth process after that term. The city developed under the
control of agricultural sector until 1950s, but after those years rapid industrialization is
one of the major factors that caused rapid population growth. The concept of migration
from country to town fastened at that term, and this caused great amount of migration
demand to İstanbul Metropolitan Area. Table 1 shows the changes that have occurred in
İstanbul’s and Turkey’s population is seen.

39
Table 1. Population Growth of Turkey and İstanbul
(Source: Turkish Statistical Web Site, 2007)
Year Population of Turkey
Population of İstanbul
İstanbul/Turkey Rate (%)
Growth Rate of Population in Turkey (%)
Growth Rate of Population in İstanbul (%)
1927 13.648.270 806.863 5,91 1935 16.158.018 883.599 5,47 18 101940 17.820.950 991.237 5,56 10 121945 18.790.174 1.078.399 5,74 5 91950 20.947.188 1.166.477 5,57 11 81955 24.064.763 1.533.822 6,37 15 311960 27.754.820 1.882.092 6,78 15 231965 31.391.421 2.293.823 7,31 13 221970 35.605.176 3.019.032 8,48 13 321975 40.347.719 3.904.588 9,68 13 291980 44.736.957 4.741.890 10,6 11 211985 50.664.458 5.842.985 11,53 13 231990 56.473.035 7.309.190 12,94 11 252000 67.803.927 10.018.735 14,78 20 37
The population growth rate of İstanbul and the general population growth rate of
the country develop at the same parallel; however, especially after 1950, the increase
rate in population growth of İstanbul became much more rapid. When we look at an
annual basis, we see that the population growth rate in İstanbul is quite faster than the
general population growth rate of Turkey.
Growth Rate
0,000,200,400,600,801,001,201,401,60
1927 1935 1940 1945 1950 1955 1960 1965 1970 1975 1980 1985 1990
Growth Rate of Population in Turkey Growth Rate of Population in Istanbul
Figure 1. Comparison of Growth Rate in Turkey and İstanbul

40
It is observed that, the population living in İstanbul had increased more and
more from 1950 to our day. It is adopted definition of TURKSTAT used after 1950 to
confirm development of population in space. Population was analysed in two groups as
city center and urban fringe that city center is county defined as central zone and urban
fringe is county out of central zone. City center includes Bakırköy, Beyoğlu, Beşiktaş,
Eminönü, Eyüp, Sarıyer, Şişli, Fatih, Bayrampaşa, Zeytinburnu, Kağıthane, Adalar,
Beykoz, Kadıköy and Üsküdar. Urban fringe also includes Küçükçekmece,
Büyükçekmece, Çatalca, Silivri, Kartal, Ümraniye and Şile. However, they do not
contain villages and subdistrict in their boundaries. In parallel with definition, 82 % of
the population was living in central parts of the city and 2 % of the population was
living in urban fringe parts in 1955. However, in 1965, 75 % of the population was
living in central parts and 8 % was living in urban fringe.
When we look at the situation in 1980, we observe that 59, 2 % of the
population was living in central municipality, 40.9 % of the population was living in
other municipalities. After 1980, population and accordingly settling incentives have
moved out of the central municipality and new-municipality content became valid
(Aysu 1990). As a result, we can say that, after 1950s, İstanbul’s population started to
depart from the city center and expand to urban fringe of the center. It is observed that,
with the politics that were applied especially after 1980, this incentive became clearer.
“Besides its historical and cultural features, İstanbul is the biggest business and
commerce center; as a result of these features, it has always been an attraction point for
the population of the county and this attraction continues in our day” (İBB 2005). It is
observed that, having a great amount of migration which occurred as the result of the
global development pressures that were seen at the country level were also quite
effective for İstanbul to be an attraction center. “In İstanbul Metropolitan Area,
generally between 1935 and 1980, and especially after 1950, population growth
increased swiftly, population moved out of central business areas towards new
developing areas, and these new-developing areas started to become urbanized rapidly
and afterwards, in these new areas, sub-urbanization was seen commonly” (Aysu 1990).
The developments that were experienced in transportation after 1970 moved people
away from the struggle of being close to the center and these developments supported
the moving towards the urban fringe. After 1980 to our day, investments to highways
are being made, automobile possession continues to increase and as a result of these
factors, people started to choose to live in the areas that are close to new roads. As the

41
result of both migrations due to industrial development and due to the rapid population
growth that occurred during the globalization process in İstanbul, great amount of
population occurred in İstanbul. Infrastructure became insufficient for increasing
population and for new settlement areas. People moved out of the center because of
their increased standards of life. This factor, together with insufficient infrastructure
caused people to be dependent on automobiles. On the other hand, the increase in the
use of automobile has negative effects on the traffic of the city.
4.1.4. Effects of Industrial Zones’ Development on Urban Fringe
Industrial developments that were experienced after 18th century caused quite
important and big differences on the structure of the city. The macro form of the city
changed according to the settlement of the industry within the city. Worldwide
economic systems were known with the technology that developed especially after 20th
century. This caused the settlement of the ‘globalization’ concept and speeded the
market movements. All of these developments caused new developments to occur in
industry sector. According to the developments on transportation and communication
areas, the growing industry zones within the city were moved out of the city, to the
urban fringe areas. Cheap building plot prices have an important role on the decision of
moving industry zone out of the city. Moving industry zones to urban fringe brings
cheap labor force. As a result, it caused people who had little income and people that
came with migration to settle this area. And consequently squatter housing areas
occurred at the urban fringe.
Industrial organizations country-wide choose İstanbul for a settlement place both
for production and management, thus, İstanbul has an important place for industry. “In
İstanbul, city growth and industry relationship developed as two factors that affect each
other. Until 1960s, there was a certain stagnation period. In 1963, planned development
period started. Accordingly, industrialization policies were developed and industry
sector had a rapid increase. Its ratio in the economy increased and its annual increasing
ratio in Gross National Product closed to 7 %. This amount was anticipated in the plan.
An increasing of 36.82 % was occurred between 1960 and 1965” (Aysan, et al. 1997).
In this term, industry continued its development and it also directed to the growth of the
city as a result of this, a development in the form of grease spot started. In 1966,

42
İstanbul Industrial Plan was prepared and approved. In this 1966 plan, new-suggested
industrial zones were insufficient, consequently their development split to the areas out
of the plan (Yüzer 2002).
In 1960, for the general development of the areas at the urban fringe, it is
observed that, residence areas occurred around the industrial zones in the form of grease
spots. “In spite of the developments at the urban fringe, it is seen that, through the urban
fringe lines, population growth decreases and residence-settlement areas increase”
(Aysu 1990).
“After 1970s, urban rent and costs increased. These kinds of inducements caused
industry to develop through Kartal, Maltepe areas and Tuzla, Yakacık, Çayırova, Gebze
regions which are around the central settlement” (İBB 2006b). In the plan that was
prepared by İstanbul Metropolitan Area Planning Office in 1980, it was determined that,
industry zones were going to develop between Büyükçekmece and Küçükçekmece
lakes, partially in Kemerburgaz, Ümraniye, Kurtköy, Dolayoba, Gebze, Şekerpınar and
Dilovası; and the development of totally 7100 hectares industrial-area was anticipated.
In the Development Plan that was approved in 1980, encouraging advance-
technology and artifice-dense industries to settle in İstanbul, and transferring standard
technology, unskilled worker-dense industries and much industrial water and energy
consuming industries out of İstanbul Metropolitan area were determined. According to
these decisions, İkitelli Industrial Estate was established; by this, transferring businesses
within the city out of the city was aimed (İBB 2006b).

43
Map 3. 1980 İstanbul Development Plan Industry Zones
Industry areas which were suggested in the plan and their growth are shown in
the Table 2.
Table 2. Industrial Zones in 1980 İstanbul Master Plan (ha)
Industrial Zones Area
Dudullu 265
Kurtköy (Kartal) 400
Gebze 325
İkitelli (Bakırköy) 425
Firüzköy (Bakırköy) 750
Çakmaklı (Çatalca) 625
Peteköy ( Silivri) 200
“After 1980’s, the industrial zones like Hoşdere, Firüzköy, Kurtköy, Tuzla,
Tepeören which were located in urban fringe developed” (Ocakçı 1989).
İstanbul Metropolitan Area Master Plan which was approved in 1995 aims to
find solution to the small-scale and middle-scale industries at the stated planned areas
according to their sectors, prevent the areas from being wreckages which became empty
after transferring prevailing industry, moving the industries out of the city which pollute
İstanbul, have little value-added to İstanbul, consume too much electricity and water
and that create big problems within the city. The plan aims to turn İstanbul to a history,
science, culture, commerce, service and art city. In the 1/50.000 scaled İstanbul
Metropolitan Master Plan which was approved in 1994, and in the İstanbul Metropolitan
Area Master Plan that was approved in 1995, removing production industry out of
Haliç, Kurtköy, Bakırköy, Zeytinburnu and Eminönü was targeted; and the industrial
zones in Topkapı, Maltepe, Yenibosna, Kartal, Maltepe and Kurtköy were stated as the
areas which will turn to service (Ocakçı 1989).

44
Map 4. 1995 İstanbul Development Plan Industry Zones
With the 2006 Development Plan, shifting to services sector from industry
sector which was more effective until the present day was aimed. Locating industry at
the potential areas around İstanbul and the rehabilitation of the prevailing industry
zones were planned. “Gebze at the east side and Çerkezköy at the west side are
evaluated as close regions to İstanbul. It is anticipated that, these regions will be buffer
areas for industry investments and labor force” (İBB 2006a). Connecting prevailing
industry areas with the İkitelli, Hadımköy and Tuzla industrial zones was suggested.
“In 1966 İstanbul Industrial Plan, industrial area per person was determined as
5.4 m², and total industrial areas were determined as 1140.5 hectares. In 1980 Master
Plan of İstanbul, total extend of the industrial areas as of 1995 were anticipated as 7100
hectares and industrial area per person was determined as 10 m². In the present day
industrial zones have reached to 11.000 hectares and industrial area per person is almost
10m²” (İBB 2006a).

45
Map 5. Comparison of Industrial Areas in 1980, 1995 and 2006 İstanbul Development Plans
45

46
The process of the development of industrial areas affected the movements of
people and their residence-settlement characteristics. During the developments that were
experienced until our day, the effects of industrial areas on the structure of the city are
seen clearly. In İstanbul, generally, together with the industrial areas that had
decentralization, residence areas had also fringed. The fringing of residence areas
around industrial zones is seen more clearly in Anatolian Side. Firstly, great industrial
zones in Maltepe, Kartal, Pendik, Ümraniye and Tuzla were settled around the mail
transportation axles and within time, people moved and settled to the areas around these
industrial zones. The interaction between transportation industrial zones and industrial
zones residence areas is continuous circle.
4.1.5. Development of Residence Areas
Urban population increases rapidly and this increase is more effective in big
cities like İstanbul. This situation created a great demand for residence. In city centers
land prices are quite high, there are investments that are made with speculative purposes
and some empty areas are not used, however land prices are relatively cheaper at the
urban fringe. Consequently settlement residence demands at the urban fringe are
increasing.
In 1950, first movements through the fringe area occurred with illegal
settlements around industrial zones. In 1950 migration increased rapidly, consequently
uncontrolled and unplanned structuring started firstly around industrial zones. Until the
middle of 1960s, there have been clemencies from time to time; these clemencies
legalized the shanty structures which caused shanty structuring at the urban fringe and
around industrial zones to continue increasingly at the next term.
After 1975, increases in the construction of mass housing affected the
development of the town and it was effective at the expanding of urban fringe. With the
growth of the city, CBD’s tend to expand to new areas. The changes in CBD areas and
in the transportation system created new prestige areas. The changes in the town’s
business centers and industrial areas and changes in the city distribution, together with
the increase in the scale of the city and arrangements of the city transportation created
important differences in residence-domicile areas and residential areas developed
according to these changes.

47
After 1980, urban land market got into different term. This term turned to be a
term in which large scales were targeted related to residence issues and laws were
legislated accordingly. Crowd of the city center, infrastructural and environmental
problems, increased automobile ownership, orbital roads and Bosporus Bridge passes
and new credit possibilities caused new movements at the urban land market. Amnesty
laws which were legislated in 1983 and afterwards caused shanty building process to
increase. These squatter houses generally targeted the areas close to transportation axles
and the urban fringe.
In the previous periods, urban fringe were opened to residence by immigrants’
constraints. Later on these areas became the targets of the cooperative housing demands
of the middle-income bracket that were organized according to mass housing areas and
business places or career scales. High-income people who were stacked within the city
and whose necessity-over security, residence and environment prestige were not
enabled organized as well, and moved towards to big lands at the metropolitan city
center in small groups.

48
Map 6. Development Process of Residential Areas in İstanbul
48
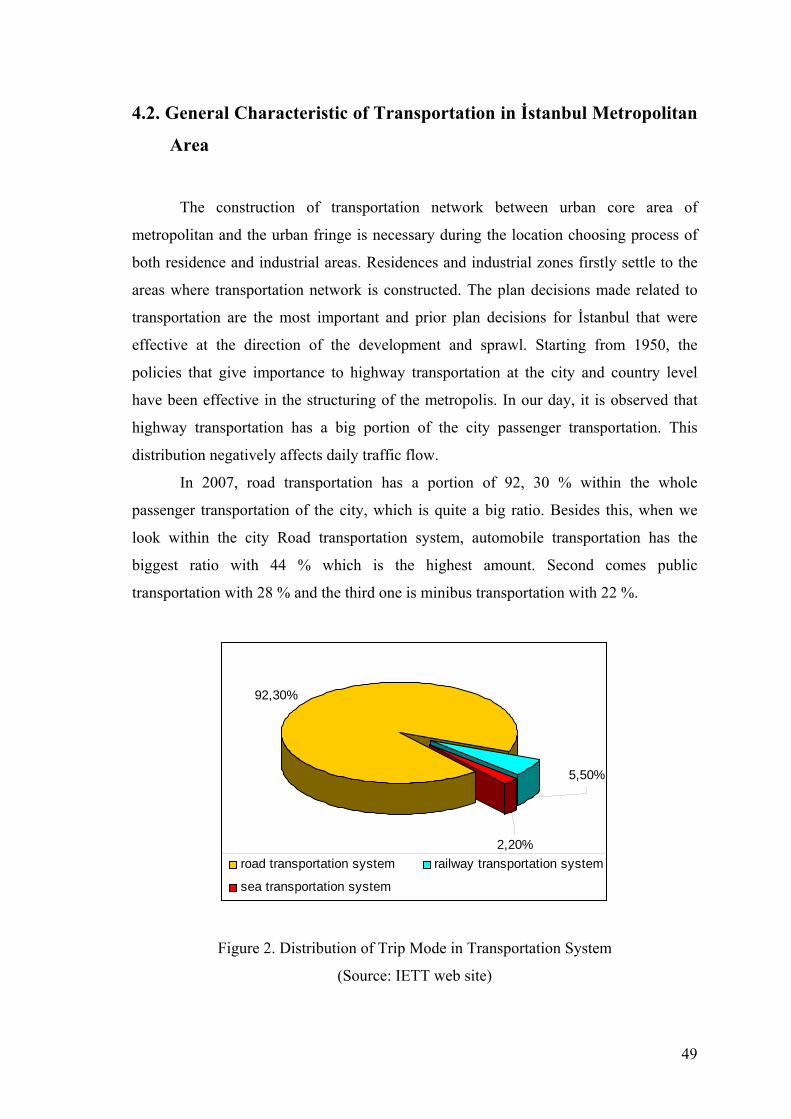
49
4.2. General Characteristic of Transportation in İstanbul Metropolitan
Area
The construction of transportation network between urban core area of
metropolitan and the urban fringe is necessary during the location choosing process of
both residence and industrial areas. Residences and industrial zones firstly settle to the
areas where transportation network is constructed. The plan decisions made related to
transportation are the most important and prior plan decisions for İstanbul that were
effective at the direction of the development and sprawl. Starting from 1950, the
policies that give importance to highway transportation at the city and country level
have been effective in the structuring of the metropolis. In our day, it is observed that
highway transportation has a big portion of the city passenger transportation. This
distribution negatively affects daily traffic flow.
In 2007, road transportation has a portion of 92, 30 % within the whole
passenger transportation of the city, which is quite a big ratio. Besides this, when we
look within the city Road transportation system, automobile transportation has the
biggest ratio with 44 % which is the highest amount. Second comes public
transportation with 28 % and the third one is minibus transportation with 22 %.
92,30%
5,50%
2,20%road transportation system railway transportation system
sea transportation system
Figure 2. Distribution of Trip Mode in Transportation System
(Source: IETT web site)

50
28%3%
44%
1%
22%
2%
public transporttaxiautomobildolmus taximinibusservice
Figure 3. Distribution of Mode in Road Transportation
(Source: IETT web site)
The day by day increase in private-car ownership causes transportation problem
to increase as well. Besides this, increase in private-car possession brings parking
garage problem. For 2035 when we calculate vehicle-ownership, there will be 447
vehicle/1000 people and 67 vehicles in 150 people/hectare area. Every single vehicle
needs a 25 meter square parking garage area. As a result 1675 meter square area will be
used for parking garage in every 1 hectare. Consequently, an important parking garage
problem will arise in central places (İBB 2006a).
Until 1965, planning and transportation studies that do not involve the town
completely, but those concern particular parts were done. Planning studies that enclose
the city completely started with the Planning Office which was established in those
years. In those years, the foundation of Boğaziçi Bridge which was going to connect
two sides of the city was laid and it was opened in 1973. Central functions and CBD
started to choose place at two ends of the bridge after First Bosporus Bridge was opened
for traffic. This fastened the linear development at the east-west axle and caused the city
to develop through north. At the same time, E-5 highway was constructed which caused
unplanned industrial and residence areas to develop around it.
Another important concept of the 1970s is the development of the automotive
sector and the great increase in private-automobiles. Automobile-ownership has
increased day by day, and this has caused the movement area of people in İstanbul to
extend and motivated people to move long distances. Consequently, new settlement

51
areas far-to urban core have been settled. After the bridge connected the two sides of
İstanbul, increasing of population increase in the Asian side observes. The people who
work at the European side started to live in the Asian Side, as well. This development
extended Asian Side to Maltepe and Kartal. At the same time, European Side spreaded
until Silivri along E-5 Highway. Behavior of people to this direction made burden on
both bridge and urban traffic.
Due to the increasing population and automobile-ownership after 1970, urban
transportation problems reached to great levels. The suggested 1971 Plan was not
approved. After this, with the contribution of World Bank and cooperation of
Metropolitan Area Planning Bureau, English consulting firm Jamieson & Mackay Cons.
developed Urban Land use Transportation Model. This study can be accepted as the
most comprehensive study that evaluated all of the studies which were previously done
about the physical development of the city and also the transportation-land use
interaction according to 1995.
After the end of the 1970, over-demand caused traffic congestion at the 1.
Bosporus Bridge and its orbital roads. This situation brought in the idea of constructing
second Bosporus Bridge which would connect two sides of the city. At the end of the
studies, second Bosporus Bridge which was located at the north side of the first one was
opened to traffic in 1988. This development fastened İstanbul’s movement through
north. Besides, it caused sprawl along TEM Highway. Due to the problems that were
being experienced related to transportation and urban growth out of the core area made
starting transportation-related studies necessary. In 1987, for the first time,
Transportation Master Plan studies started and this plan was completed in 1988.
Modeling of the traffic demand was done. In 1994, studies on İstanbul Master Plan were
started. In this frame, 1987 transportation plan data and collection data in 1994 were
calibrated and a new transportation modeling was prepared. The second transportation
master plan was completed in 1997 and this plan’s target is 2010. In this plan, it is
observed that public transportation has importance. And a tube-tunnel project for the
Bosporus passing was suggested. The importance of a public transportation system that
is complementary, but not competing was emphasized.

52
Map 7. 1. and 2. Bridge and Main Roads
After 1990, the prevailing transportation network was effective in the direction
of the residential areas through east-west and north direction. Also other land uses
sprawled immense area. In parallel with mobility accrued in the city. In view of this
accretion IETT and the other municipalities were insufficient for public transportation,
and therefore minibus transportation gained importance. This situation prepared base for
informal buildings and illegal apportioned settlements. Consequently, old İstanbul
center started to grow slower than the areas at the urban fringe which were unplanned
and did not have infrastructural functions. The investment decisions also affected the
growth direction, speed and population allocation of the city. Important developments
are seen in İstanbul in this period; tram, metro and LRT were opened for service. Tube-
tunnel studies have also started (İBB 2006a). However, İstanbul does not have a
sufficient transportation infrastructure yet. As well as this, sprawl of the city is a burden
on the traffic.
Road network that is equivalent to European country as length is available in
İstanbul. However, disgusting situation on physical structure of network and non-
integration characteristic with other transportation system cause problems in traffic.
Road public transportation system is supreme portion according to passenger
transportation in İstanbul. Two kind of road public transportation have been used. These
are İETT and Private Public Bus. Route lengths are seen in Figure 4.

53
0
50
100
150
200
250
1-10 11-20 21-30 31-40 41-50 51-60 61-70 71-80 81-90 91-100
Length of Route (km)
Num
ber o
f Rou
te
Figure 4. İETT Route Length
(Source: İBB 2006c)
Although daily capacity of İETT is 3.491.779 persons, number of daily
passenger 1.312.515. It has 38 % efficiency.
Minibus and dolmuş supply the negation in area where public transportation
system is not available. In İstanbul there are 136 minibus and 248 dolmuş routes.
Existing route lines are shown in Map 8.
Map 8. Existing Minibus Routes
(Source: IMM, Department of Transportation, 2007)

54
Railway transportation system is less developed. There are existing 125, 9 km
railway. Distribution of length is seen in the following Table 3 and Figure 5.
Table 3. Distribution of Length
(Source: Transportation Insurance Company Web Site, 2007)
Mode Length (km) Suburban Railway 72,3LRT 20Tram 19Metro 8Nostalgic Tram 4,4Tunel 1,2Teleferic 0,3Total 125,2
0
10
20
30
40
50
60
70
80
SuburbanRailway
LRT Tram Metro NostalgicTram
Tunel Teleferic
Figure 5. Distribution of Length
Railway system services small area in current but it is tried to develop.
Distribution of existing railway system in space is in Map 9.
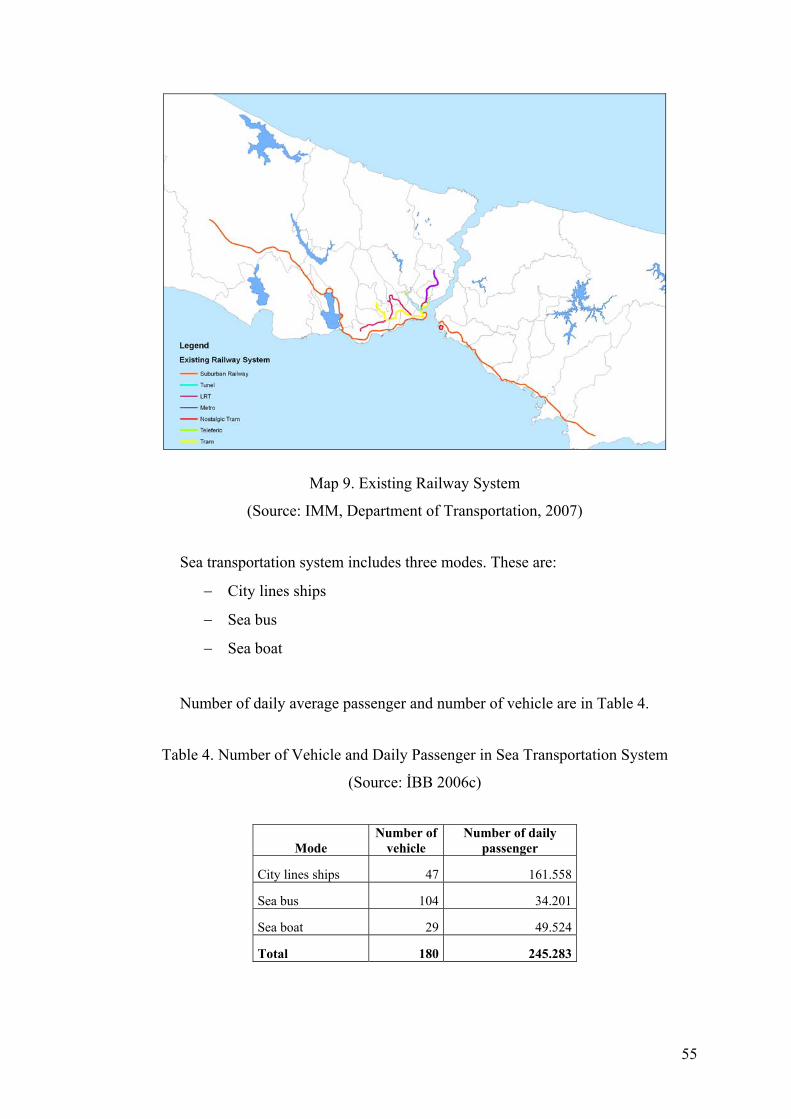
55
Map 9. Existing Railway System
(Source: IMM, Department of Transportation, 2007)
Sea transportation system includes three modes. These are:
− City lines ships
− Sea bus
− Sea boat
Number of daily average passenger and number of vehicle are in Table 4.
Table 4. Number of Vehicle and Daily Passenger in Sea Transportation System
(Source: İBB 2006c)
Mode Number of
vehicle Number of daily
passenger
City lines ships 47 161.558
Sea bus 104 34.201
Sea boat 29 49.524
Total 180 245.283

56
In the present day, most important problem of İstanbul is transportation. As a
result of unplanned developments and wrong investments, the city has a great
transportation problem today. This problem reflects the whole city because all of the
activities performed in the city have a direct or indirect connection with transportation.
In other words positive or negative effects of whole activity generated in the city on
transportation are asset, and transportation problems are sum of them (İBB 2006a).
Unplanned structuring and population growth and consequently the shift of the city to
fringe increase transportation problems.
Transportation problem became important in İstanbul in 1970s. Although it has
been trying to solve during the last 20 years, it has been not get to grips with this
problem. The main sources of this are the increase in the car ownership and insufficient
infrastructure. The investments about transportation are related to highways and these
do not support public transportation. This situation props up use of automobile.
Although private- automobile transportation is expensive people prefer it because of its
facilities that it is comfortable, it is more practical for time, it has point to point
transport specialty and people reach destination. Public transportation system is not
sufficient to answer the needs of people; comfortable transportation vehicles like metro
are less in number and they cannot serve to large areas; these issues support people’s
incentives to use private car in order to reach to urban fringe and consequently, the
automobile number that is added to İstanbul traffic increases day by day, which in turn
causes greater traffic problems.

57
CHAPTER 5
FINDINGS AND ANALYSIS
As in several cities, an expansion is occurred in İstanbul from urban core area to
the outside. These improvements which show themselves as residence, industry, and
trade land uses are mostly seen in fringe areas of the city and in the form of low-density
constructions. This development caused by fast increase of city population and
migration causes a number of negative impacts in surrounding areas of İstanbul.
Especially trip values daily created by people living in the urban fringe and their impact
on urban transport and environment are not ignorable. Residents of sprawl areas may
drive longer distances to more dispersed destinations, be more reliant on automobiles
due to a lack of transit service and limited opportunities for biking or walking, and
contribute unnecessarily to air pollution and congestion.
In this section, time spent by people in traffic to perform their daily activities
and change of the distance depending on the location of people and some other variables
will be examined in the case of İstanbul and search will be made on the extra load
imposed by these daily trips on İstanbul traffic.
As mentioned before, urban fringe and urban core areas were defined in
İstanbul. It has been used map by IMP in 2007 to determine boundaries of urban core
and urban fringe areas. These areas are shown in Map 10.

58
Map 10. Boundaries of Urban Core and Urban Fringe Areas
Urban fringe area includes 18 first phases. First phases with 1, 0 % or higher
sample rate in the urban fringe of İstanbul have been selected among determined urban
fringe area so as to obtain more accurate results for travel behavior. After this selection,
Göktürk is out of the case areas. It has sampling rate of 0,3 %. Case area includes 17
first phases which is shown in the following Map.
Map 11. Urban Core and Urban Fringe Areas in İstanbul

59
Distribution of case area in fringe and their connection with the core area are
shown in Map 12.
Map 12. Case Area
Findings of the survey conducted for entire İstanbul in 2006-2007 periods are
used to analyse urban fringe. This research consists of household surveys conducted
with 90.000 households within the framework of İstanbul Transportation Master Plan
Calibration work. With these surveys, demographic, social-economic data of people are
obtained. Also daily trip data of each person are collected. Survey studies cover
workdays and academic year. The research aims to identify daily transportation
demands of people and connecting these demands with social-economic and
demographic structure.
In case area, many variables are used for understanding trip characteristics in
urban fringe. Distributions of population and age pattern are evaluated. Economic
variables such as income, automobile ownership and home ownership are analyzed.
These social and economic surveys are related to trip travel of people. They affect trip
demand and mode choices of people.
A lot of trip values are calculated. They are examined in urban fringe. In fringe
and urban areas, the values of several trip variables also compared between them. The

60
average length of commute trips in meters, duration in minutes, driving time for those
commuting by car, bus travel time, and bicycle and walking times etc were examined,
with significant differences between sprawl and urban areas tested using.
5.1. Evaluation of Survey Results
A total of 12.896 people were interviewed in the urban fringe areas. Total
population of these areas as of 2005 is 637.503. Number of survey person, 2005
population and sampling rate are shown in the table. Bahçeşehir was chosen as the
lowest sampling rate with 1, 1 and number of persons interviewed in Bahçeşehir is 345.
Esenyurt has the highest figure of interviews with 4397 persons.
Table 5. Sampling Rate of Fringe Areas
Fringe County District
Number of Survey Persons
2005 Population
Sampling Rate (%)
Beykoz Cavusbasi 494 17285 2,8
Buyukcekmece Bahcesehir 345 29304 1,1
Buyukcekmece Beylikduzu 999 61758 1,6
Buyukcekmece Esenyurt 4397 221972 1,9
Buyukcekmece Gurpınar 533 31632 1,6
Buyukcekmece Kırac 833 44897 1,8
Buyukcekmece Yakuplu 629 39013 1,6
Gaziosmanpasa Arnavutkoy 1513 61416 2,4
Gaziosmanpasa Bogazkoy 555 20991 2,6
Gaziosmanpasa Bolluca 209 9662 2,1
Gaziosmanpasa Haracci 240 12832 1,8
Gaziosmanpasa Tasoluk 506 20143 2,5
Sariyer Bahcekoy 143 6931 2
Tuzla Akfirat 486 12002 2,9
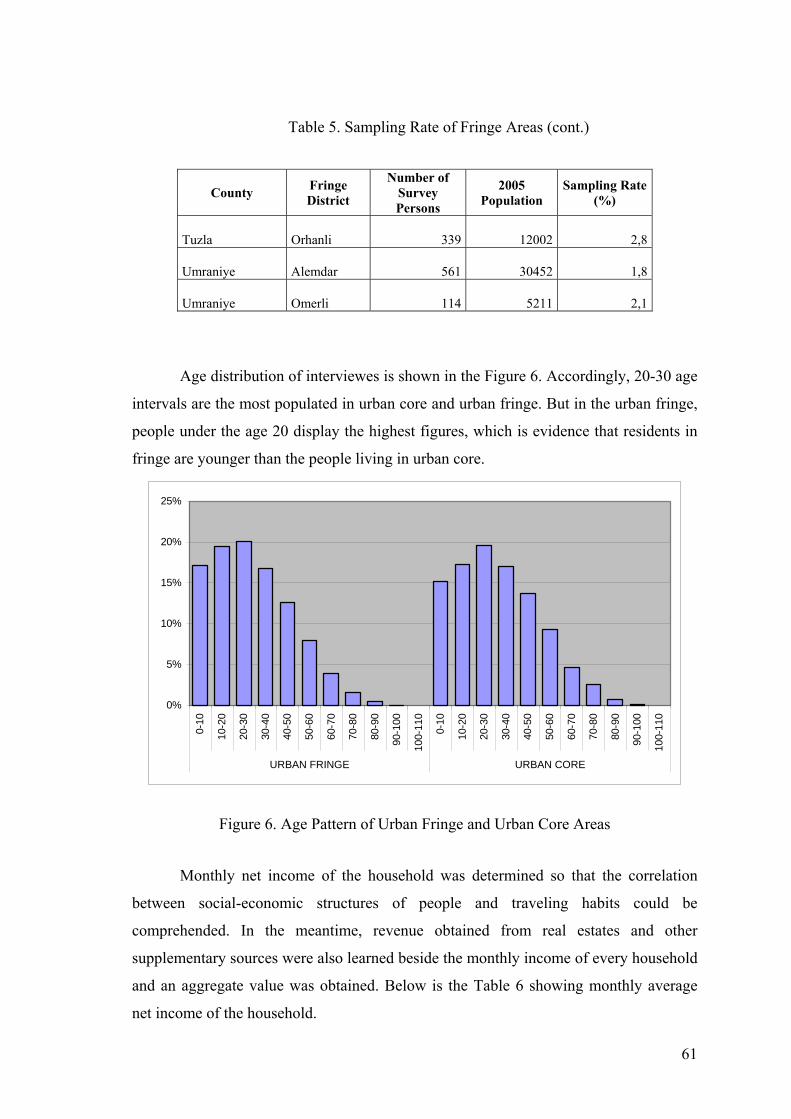
61
Table 5. Sampling Rate of Fringe Areas (cont.)
County Fringe District
Number of Survey Persons
2005 Population
Sampling Rate (%)
Tuzla Orhanli 339 12002 2,8
Umraniye Alemdar 561 30452 1,8
Umraniye Omerli 114 5211 2,1
Age distribution of interviewes is shown in the Figure 6. Accordingly, 20-30 age
intervals are the most populated in urban core and urban fringe. But in the urban fringe,
people under the age 20 display the highest figures, which is evidence that residents in
fringe are younger than the people living in urban core.
0%
5%
10%
15%
20%
25%
0-10
10-2
0
20-3
0
30-4
0
40-5
0
50-6
0
60-7
0
70-8
0
80-9
0
90-1
00
100-
110
0-10
10-2
0
20-3
0
30-4
0
40-5
0
50-6
0
60-7
0
70-8
0
80-9
0
90-1
00
100-
110
URBAN FRINGE URBAN CORE
Figure 6. Age Pattern of Urban Fringe and Urban Core Areas
Monthly net income of the household was determined so that the correlation
between social-economic structures of people and traveling habits could be
comprehended. In the meantime, revenue obtained from real estates and other
supplementary sources were also learned beside the monthly income of every household
and an aggregate value was obtained. Below is the Table 6 showing monthly average
net income of the household.

62
Table 6. Average Income of Fringe per Household
(Source: İstanbul Transportation Master Plan Calibration Work)
County Fringe district Income
Beykoz Cavusbasi 998
Buyukcekmece Bahcesehir 3819
Buyukcekmece Beylikduzu 1656
Buyukcekmece Esenyurt 839
Buyukcekmece Gurpinar 1446
Buyukcekmece Kirac 913
Buyukcekmece Yakuplu 1410
Gaziosmanpasa Arnavutkoy 771
Gaziosmanpasa Bogazkoy 682
Gaziosmanpasa Bolluca 852
Gaziosmanpasa Haracci 773
Gaziosmanpasa Tasoluk 747
Sariyer Bahcekoy 1895 Tuzla Akfirat 741 Tuzla Orhanli 759 Umraniye Alemdar 981 Umraniye Omerli 1010
Number of cars per person in the entire urban fringe is 0, 11. When distribution
between areas is considered, it can be seen that rate of car ownership varies between 0,
04 and 0, 38. Bahçeşehir has the highest rate of car ownership, which is attributable to
the level of income.

63
Table 7. Car Ownership in Fringe Area
(Source: İstanbul Transportation Master Plan Calibration Work)
County Fringe district Total
Number of Auto
Total Number of Person
Car Ownership per Person
Beykoz Cavusbasi 66 494 0,13 Buyukcekmece Bahcesehir 130 345 0,38 Buyukcekmece Beylikduzu 216 999 0,22 Buyukcekmece Esenyurt 319 4397 0,07 Buyukcekmece Gurpinar 94 533 0,18 Buyukcekmece Kirac 57 833 0,07 Buyukcekmece Yakuplu 101 629 0,16 Gaziosmanpasa Arnavutkoy 125 1513 0,08 Gaziosmanpasa Bogazkoy 22 555 0,04 Gaziosmanpasa Bolluca 16 209 0,08 Gaziosmanpasa Haracci 29 240 0,12 Gaziosmanpasa Tasoluk 38 506 0,08 Sariyer Bahcekoy 32 143 0,22 Tuzla Akfirat 21 486 0,04 Tuzla Orhanli 43 339 0,13 Umraniye Alemdar 58 561 0,10 Umraniye Omerli 15 114 0,13
House ownership data are examined in 5 groups.
− House owner
− Renter
− No house owner and no renter
− Lojman
− other
According to distribution of ownership in the urban fringe, house owners
account for 60 % of the total ownership. Renters are 33%.
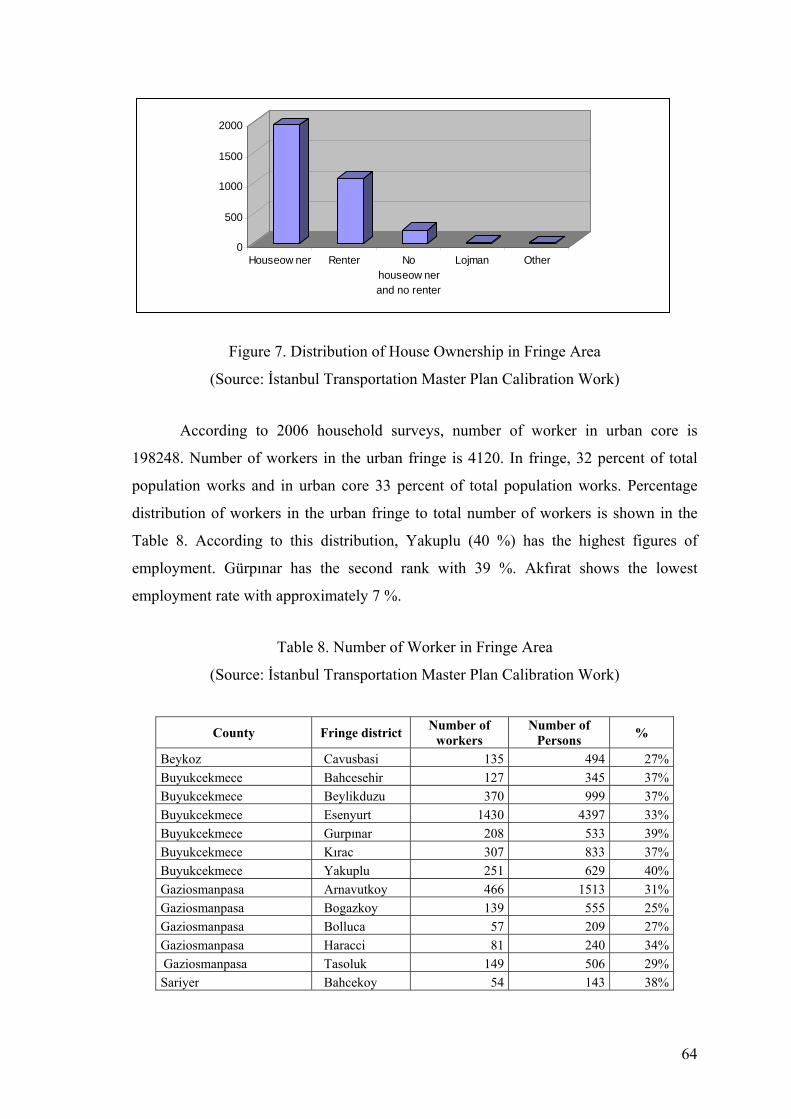
64
0
500
1000
1500
2000
OtherLojmanNohouseow nerand no renter
RenterHouseow ner
Figure 7. Distribution of House Ownership in Fringe Area
(Source: İstanbul Transportation Master Plan Calibration Work)
According to 2006 household surveys, number of worker in urban core is
198248. Number of workers in the urban fringe is 4120. In fringe, 32 percent of total
population works and in urban core 33 percent of total population works. Percentage
distribution of workers in the urban fringe to total number of workers is shown in the
Table 8. According to this distribution, Yakuplu (40 %) has the highest figures of
employment. Gürpınar has the second rank with 39 %. Akfırat shows the lowest
employment rate with approximately 7 %.
Table 8. Number of Worker in Fringe Area
(Source: İstanbul Transportation Master Plan Calibration Work)
County Fringe district Number of workers
Number of Persons %
Beykoz Cavusbasi 135 494 27%Buyukcekmece Bahcesehir 127 345 37%Buyukcekmece Beylikduzu 370 999 37%Buyukcekmece Esenyurt 1430 4397 33%Buyukcekmece Gurpınar 208 533 39%Buyukcekmece Kırac 307 833 37%Buyukcekmece Yakuplu 251 629 40%Gaziosmanpasa Arnavutkoy 466 1513 31%Gaziosmanpasa Bogazkoy 139 555 25%Gaziosmanpasa Bolluca 57 209 27%Gaziosmanpasa Haracci 81 240 34%Gaziosmanpasa Tasoluk 149 506 29%Sariyer Bahcekoy 54 143 38%

65
Table 8. Number of Worker in Fringe Area (cont.)
County Fringe district Number of workers
Number of Persons %
Tuzla Akfirat 36 486 7%Tuzla Orhanli 100 339 29%Umraniye Alemdar 172 561 31%Umraniye Omerli 38 114 33%
5.2. Trip Distribution
In 2006 household surveys, trip that people used the day before was taken. All
trip information during the day was obtained so that mobility figures in the entire
İstanbul were calculated. Trips were evaluated on the basis of differentiation between
urban core and urban fringe. Therefore, trips from/to urban core and urban fringe were
become assessable.
Total number of trips generated in the urban fringe is 14.809, 73 % of which is
in the urban fringe and 27 % between urban fringe and the urban core. Total number of
trips generated in urban core and urban fringe is 267.909. Distribution of this trips
between urban and fringe shows in Table 9.
Table 9. Number of Trip Distribution for Urban Core and Urban Fringe
(Source: İstanbul Transportation Master Plan Calibration Work)
District Number of Trip
Urban Fringe - Urban Fringe 10325Urban Fringe - Urban Core 3764Urban Core- Urban Fringe 3750Urban Core- Urban Core 250070
Each trip generates as adapted for a purpose. Trip distribution regarding to
purpose includes 4 main groups.
− Home based work (HBW)
− Home based school (HBS)
− Home based other (HBO)
− Non home based (NHB)

66
Travels of urban fringe residents are grouped as HBW (38 %), HBS (29 %),
HBO (28 %) and NHB (5 %) according to their purposes. HBW trips have higher value.
Distribution of trips for purpose is shown in Figure 8.
28%
29%
38%
5%
HBOHBSHBWNHB
Figure 8. Trip Distribution per Purpose
When we look at the distribution of travels from urban fringe to the urban core
according to their purposes, we can notice that number of HBW travels has increased.
Sixty percent of total travel from urban fringe to the urban core is HBW travels.
Remaining 40 % consists of HBO travel (23 %), school (11 %) and NHB (6 %) travels.
23%
11%
60%
6%
HBOHBSHBWNHB
Figure 9. Trip Distribution from Fringe to Urban Per Trip Purpose

67
Categorization of total trips generated in the urban fringe and urban core for
purpose is given in Table 10. A can be seen from the Figure, number of trips from urban
core to the urban fringe and vice versa are very close to each other. Accordingly trips
between urban core and urban fringe are return travels and HBW trip has the highest
ratio.
Table 10. Purpose of Trip between Fringe and Urban
(Source: İstanbul Transportation Master Plan Calibration Work)
District/Purpose HBO HBS HBW NHB TOTAL
Urban Fringe
Urban Fringe 3201 3895 2836 353 10285
Urban Fringe
Urban Core 846 417 2191 223 3677
Urban Core
Urban Fringe 824 417 2205 230 3676
Urban Core
Urban Core 85205 66458 87623 15566 254852
When distribution of travels according to type of vehicles is viewed, it can be
seen that travel by walk has the highest figure. Use of private cars in urban core and
urban fringe has the same figure with approximately 14 %. Use of service car is wider
in urban fringe, and public transport is more widely used in the urban core. This
situation emanates from lack of public transport substructure.
Table 11. Trip Distribution per Mode
(Source: İstanbul Transportation Master Plan Calibration Work)
A kind of Vehicle
Fringe-Fringe % Fringe-
Urban % Urban-Fringe % Urban-
Urban %
Other 41 0,4 1047 14,5 1018 14,2 1174 0,4Walk 7101 71,8 3614 50 3597 50 133453 53,3Bike 10 0,1 36 0,5 41 0,6 108 0,04Private car 827 8,4 1044 14,4 1035 14,4 36964 14,7Service 1150 11,6 1287 17,8 1315 18,3 21487 8,5Public Transport 757 7,7 200 2,8 188 2,6 56884 22,7Total 9886 100 7228 100 7194 100 250070 100

68
Private cars have the highest ratio in HBW trips when distributed according to
purpose and type of vehicles of travel generated in the urban fringe. Trip distribution
according to purpose and mode is shown in Table 12.
Table 12. Trip Distribution According to Purpose and Mode
(Source: İstanbul Transportation Master Plan Calibration Work)
Mode/Purpose HBO HBS HBW NHB Total
Other 20 5 48 31 104
Walk 2632 3309 1515 265 7721
Bike 2 5 1 8
Private car 788 214 1333 289 2624
Service 137 736 1786 59 2718
Public
transport 962 507 1471 159 3099
Trip distance is shown in Table 13. When distance of trip is calculated, origin
and destination points are employed. Distance between each pair of origin and
destination zones are calculated by using shortest path tool of TransCAD. Then these
data is matched fringe and urban trips. Trips between urban fringe and urban core have
longer distance than other trips. It is changed between 23 and 25 km.
Table 13. Trip Distance per Mode (meter)
(Source: İstanbul Transportation Master Plan Calibration Work)
Areas Other Private car Service Public transport
Fringe Fringe 10249,26 7795,12 7054,86 7812,43
Fringe Urban 24494,54 25231,14 23209,37 24014,15
Urban Fringe 27272,22 24858,6 23102,54 24332,22
Urban Urban 9399,88 8376,36 8356,19 8719,55
Distribution of trip time according to mode is given in Table 14. Average period
of total trips is 65 minutes. Public transportation has longest time. Generally for entire
modes trip time is long.

69
Table 14. Average Trip Time per Mode
(Source: İstanbul Transportation Master Plan Calibration Work)
Mode Average Trip Time
(minute)
Other 62,88
Private car 58,44
Service vehicle 61,11
Public transport 81,13
Walk 27,89
5.3. Comparison of Travel Behavior in Urban Fringe and Urban Core
Expansion of urban areas naturally affects transportation in metropolitan area. In
this section, trips accomplished in urban core and urban fringe areas compared between
each other to calculate this effects. It is searched that how travel behavior vary between
fringe and urban areas, and how it contributes to overall metropolitan traffic patterns.
Therefore, figures of daily trip generated in the metropolitan area, which is
grouped as urban core and urban fringe, will be assessed on a number of variables.
Variables used only for the urban fringe in the previous section will be used for
comparison of figures obtained for urban core and the difference between them will be
found, through which the change in traffic witnessed with expansion of the city will be
identified. For this purpose, trips generated in the urban core and urban fringe is
calculated. These results generated in urban fringe compared with urban core and other
research results. Change of trips within the differentiation between urban core and
fringe is shown in Table 15. Average figures of all areas in urban core and urban fringe
are considered when calculating these figures.

70
Table 15. Comparison of Urban Core and Urban Fringe Areas
(Source: İstanbul Transportation Master Plan Calibration Work)
Variable Urban Core Urban Fringe
Number of person 198248 12896
Number of auto per person 0,11 0,11
Number of worker/Total number of
person (%) 0,33 0,32
Homeowner/Number of household 0,57 0,60
Average Household Income (YTL) 1153 1086
Average trip time (minute) 30,54 65,62
Average Other trip time 44,34 62,88
Average Private Car trip time 35,23 58,45
Average Service trip time 43,59 61,11
Average public transport trip time 55,71 81,13
Average walk trip time 16,32 27,90
Percent trip for other 3 % 2 %
Percent trip for Private car 14 % 29 %
Percent trip for service 8 % 28 %
Percent trip for public transport 22 % 36 %
Percent trip for walk 53 % 5 %
Average trip distance (meter) 7119 24230
Average Other trip distance 9399 24494
Average Private Car trip distance 8376 25231
Average Service trip distance 8356 23209
Average Public transport trip distance 8719 24014
Number of people interviewed in the urban fringe is equal to approximately 6 %
of the people interviewed in the urban core. As can be seen in the table, difference in
home-ownership, number of workers, average monthly income and car-ownership per
capita is negligible between urban core and urban fringe. Results of two areas are
similar. However, despite the fact that difference between these values which determine
social-economic levels of persons, thus, affect their trip travels, is low, there are major
changes between travel behaviors.
When we take a look at distribution of mode, we can see that travel by walk has
a considerably high rate with 53 % in urban cores. Public transport has displays high
71
figures in both areas. However, use of private cars in the urban fringe is higher
compared to the urban core. Constant spreading of city as unplanned and uncontrolled
and long trip time encouraged people to use of private car in urban fringe area because
investment and planning are insufficient on public transport systems. In fact, duration of
trips in urban core is 30 minutes, whereas average duration of trips in the urban fringe is
more than its double. It lasts 65 minutes. Duration of trips is rather long for all vehicles
in urban fringe when categorized according to vehicle modes. Travel time in especially
public transport is quite high, which is 81 minutes. In California, Los Angeles, San
Francisco, and Riverside commute time do not exceed 30 minutes (Crane and Chatman
2003). In Los Angeles, average trip time is 26, 5 minutes. Existing literature suggests
that average commuting time ranges from 23 to 27 minutes (Handy, et al. 2004). In
addition, “information released by the Census Bureau shows that commuting times are
increasing across the country as more people are spending more time alone in their car.
Average commute times to work in the U.S. increased an average of 3.1 minutes, from
22.4 to 25.5 minutes, from 1990-2000 according to Census numbers” (Sierra Club
2007). Trip time in İstanbul is much than other cities. Such high time values that trip
can reach is an unfavorable condition in terms of accessibility. A long time trips are
unwanted due to both psychological negative results created on people and
environmental pollution.
Another reason of a long time trips by public transport in the urban fringe is that
heavily relies on road public transport. It is a result of lack of rail system investment in
the urban fringe. Due to such lack of investment, people are inclined to ride their private
cars. People prefer driving their cars in such long distances for reasons of comfort and
accessibility.
When distance of travel is calculated, origin and destination points are
employed, which was mentioned above. This is due to the fact that surveys do not
include transport distances. But it was possible to measure the distance between each
pair of origin and destination zones within TransCAD. First, origins and destinations of
travels were detected. Areas of these points were grouped as urban core and urban
fringe. Then shortest paths were computed between origin and destination with
TransCAD and average distance for each area was calculated. Average trip distances are
for urban core and urban fringe 7.1 kilometers and 24, 2 kilometers respectively. Not
surprisingly, for other transportation mode the average distance in urban fringe are
significantly longer than urban core. This corresponds to expectations. There is a huge

72
difference between the two areas. According to Buchanan et al study in New Zealand
the average work-trip distance was 9, 3 km in 2001 and work trip distance by car was
11, 1 km in sprawl. When this value is compared with İstanbul, it is small but in their
study it is high value. That is way, trip distance in İstanbul is higher and it is not
desirable situation. “Internationally, average trip lengths have increased dramatically in
the last 20 years and this increase has been linked to the growing use of the car,
allowing greater distances to be traveled” (Buchanan, et al. 2006). This situation is
similar to İstanbul, and it causes serious problems on traffic and people. Negative
impacts such a long distance, especially in care of traffic congestion, is an important
issue which deserves attention.
Each average trip values compared between urban fringe and urban core like trip
time, percent of trip and trip distance are higher in fringe than in urban. It is not
surprisingly but it is not desired situation. Also different between each part is in a big
way. Expanding of sprawl has increased transportation area and this unplanned and
uncontrolled development has affected city negatively. Then increasing sprawl could
potentially result in raise of travel time within metropolitan area. It is unclaimed
position for transportation. That is way development of sprawl as uncontrolled and leap
frog is not demanded.

73
CHAPTER 6
CONCLUSION
Cities are not a stationary state and they are developed consistently. Especially
metropolitan cities have been developed after 20th century in term of development of
technology and socio-economic structure. Then cities were spreaded out of from their
boundaries and encroached on to the surrounding rural areas. Transformation of
metropolitan cities gave rise to new development in urban fringe areas. In the literature
it is defined by the term ‘urban sprawl’.
Sprawl has become a phenomenon which all large cities of the world are faced
with. One of these cities is İstanbul. İstanbul has acceded rapid urbanization process
after 1950s, and sprawl has occurred because of rapid urbanization. In 1970s
development of automotive industry result in accretion of private car use and
decentralization of industry areas contribute development of sprawl. In this term, city
grew irregularly. Development of sprawl has also caused this irregular development
because of planning studies in local scale, land speculation, high emigration, and
political problems. Areas in fringe have developed rapidly without infrastructure and
plan while urban core of İstanbul growth rather slowly.
Existing roads have conducted to outspread city and sprawl has placed around
these roads. New settlements in urban fringe have generated additional travel demand.
Travel demand has persistently increased over the past three decades in all metropolitan
areas. The growing travel demand and associated side effects congestion and pollution
are imposing tremendous pressures on the built and natural environment (Li 2006). In
addition, development of sprawl in cities acts daily trip. In terms of transportation and
travel behavior, the primary argument focuses on high levels of dependence on cars for
transportation and greater distances between destinations. Impacts of these could
include more and longer daily trips and greater traffic congestion, reducing access to
services or jobs (Johnson 2001).
The major purpose of this thesis is to show how travel behaviors vary between
sprawl and urban areas, and how it contributes to overall metropolitan transportation
patterns. In this context, urban development process and patterns of İstanbul have been

74
examined. Spatial development of city in different periods has been evaluated.
Additionally the major object of this thesis transportation and travel behavior of
İstanbul revealed. The influence and importance of development in urban fringe on
urban transportation and travel behavior within İstanbul have been examined. Common
assumptions about sprawl and its effects on transportation have been supported by
empirical study. In this thesis, it has been shown that how is travel behavior in fringe
and how does it vary between urban core and urban fringe areas. In addition,
contributions of sprawl to overall metropolitan transportation and trip distribution have
been discussed. As a result of this study, similar results with other researches have
attained in İstanbul.
Development of sprawl in İstanbul causes more and longer daily trips as in the
world. This process imposes transportation adversely in İstanbul. Especially accretion
of using private car increases traffic congestion. The automobile has meant greater
personal freedom and more options of where to live in relation to work and shopping.
Accordingly development of sprawl and at the same time incompetent infrastructure in
transportation contributes to use private car. Automobile ownership changed structure
of urban form because of greater mobility they provided; cars became the preferred
mode of transportation. It has been attained that using of private car has increased in
California (Crane and Chatman 2003). It has been determined similarly that using of
private car in sprawl areas of İstanbul is higher than in urban core. Contrary to
expectations using of public transport rate has higher value than using of private car rate
in sprawl. Owing to abstinence of periodic data, it is not to be proved true to comment
this result.
Moreover, daily trip time and distance become more length. People who travel
from urban sprawl to urban core have the longest commutes, while those who commute
within urban core commute fewer minutes. Negative impacts of urban sprawl occurred
lots of problems. In addition unplanned development of sprawl is comminatory factors
for urban form. Trips from urban fringe to urban core for job are % 60 of total fringe to
urban travel. Although İstanbul has grown in space, people have been depending on
central area because of mono-centric form of İstanbul. Then it has created density in
transportation lines between fringe and urban core. These results suggest that
commuting patterns may be altered by decentralization of jobs. Because workers have
been yet continued to work in central area and moved to sprawl to live and then

75
commuting time has been increased. However, if İstanbul is decentralized, commuting
time can be decreased.
In addition to commuting time, in terms of transportation system a range of
negative effects of sprawl has been identified in literature. They includes the greater
cost of building roads and other infrastructure in sprawling areas (Carruthers and
Ulfarsoon 2003), greater personal isolation for people who spend all their time in cars or
inside their home (Freeman 2001), and various health problems (Weber and Sultana
2005). In order to manage transportation in accordance with sprawl development some
policies should be recommend. First investments should be directed to public transport
system but not only to routes. Root of the transportation problems in cities in Turkey is
to keep route investment in the foreground. Public transport gets behind in view of the
private car, because of route investment and poorly public transport studies. Besides
discomfort and deficient public transport vehicles direct people to use private car
whereas new transportation alternatives should be presented to people. It is necessary to
enhance railway system. Especially this system should be designed around density lines
and beforehand for new settlement areas.
Now, people prefer to live out of city center and to move away from its chaos
and stress. This demand increase sprawl, but sprawl in İstanbul has not been developed
under control. There are not organized infrastructure and roads. People lives in
dependence on city center for some activities. Dependence on urban core and
unorganized and uncontrolled development trends cause negative results. Therefore it
should be built more affordable housing near transit and job centers. As mentioned
previously, İstanbul is a mono-centric city, but if it is polycentric city, trips which are
from fringe to urban and generally include work travel can be decreased. Then traffic
congestion can be diminished. It should be also used resources to maintain existing
roads before building new ones. Besides building more affordable housing and job
centers, it should be promoted and supported regional and statewide planning that
combines transportation, land use and environmental planning. In planning progress, it
is necessary to determine how will be provided travel demand and additional traffic load
created by new life areas in urban. Transport constitutes spine in planning studies. New
transport system provides to connect settlement regions each others, but it also increases
demand for these areas and affects land use in these areas. That is way, transportation
and urban development process should be treated as a whole.

76
In spite of all problems in cities, people need some criteria to get cities livable.
Criteria include clean air, security and quietness, flow of traffic. İstanbul does not
provide these situations, and even transportation problems are the first to occur to one.
Transportation problems in İstanbul should not be assessed separately. All of the
activities in the city are aligned with transportation. All new developments and activities
affect transportation negatively or positively. And transportation problems are the result
of these effects. Besides sprawling of city regarding to uncontrolled building, increasing
of population has aggravated transportation problems.
Consequently, sprawl is inevitable development process in many cities. So, the
sprawl phenomenon should not be ignored in both transportation and other planning
activities. It is possible to predict and then to direct travel demand and behavior by
understanding better relation between urban development trends and transportation and
by planning development of city correctly. Transportation planning is serious
component of urban planning studies and should be developed with urban plans. Thus
urban development trends and development of transportation regarding these are
planned alternately and traffic problems can be reduced. In addition development of
sprawl and travel behavior are predictable then provide to manage.

77
REFERENCES
Adams, David. 1994. Urban Planning and the Development Process. London: UCL
Press. Aysan, M., O. Demir, Z. Altan, and V. Dökmeci. 1997. Industrial Decentralization in
Istanbul and its Impact on Transport. Journal of Urban Planning and Development 123 (3): 40-58.
Aysu, Emre. 1990. İstanbul Anakent Alanında Kentiçi Demografik Örüntüsü. İstanbul:
Yıldız Teknik Üniversitesi Yayınları. Bentinck, J.V. 2000. Unruly Urbanisation on Delhi's Fringe : Changing Patterns of Land
Use and Livelihood. http://dissertations.ub.rug.nl/faculties/rw/2000/j.v.bentinck/ (accessed January 1, 2007).
Browder, J.O. Bohland, J.R. and Scarpaci, J.L. 1995. Patterns of Development on the
Metropolitan Fringe: Urban Fringe Expansion in Bangkok, Jakarta, and Santiago. Journal of the American Planning Association 61 (3): 310-327.
Buchanan, N., R. Barnett, S. Kingham, and D. Johnston. 2006. The Effect of Urban
Growth on Commuting Patterns in Christchurch, New Zealand. Journal of Transport Geography 14: 342-354.
Bunker, R. 2002. In the Shadow of the City: The Fringe around the Australian
Metropolis in the 1950s. Planning Perspectives 17: 61–82. Carruther, J.I. and G.F. Ulfarson. 2003. Urban Sprawl and the Cost of Public Services.
Environment and Planning B: Planning and Design 2003 30: 503-522. Crane, R. and D.G. Chatman. 2003. As Jobs Sprawl, Whither the Commute? Access 23:
14-19. Çekiç, T.İ. and G. Ferhan. 2004. İstanbul Metropoliten Kent Çeperindeki Yeni
Kullanıcılar: Lüks Konut Alanları. Kent Gündemi 6: 99-106. Daniels, Tom. 1999. When City and Country Collide: Managing Growth in the
Metropolitan Fringe. Washington D.C: Island Press. Danielson, M.N. and Ruşen Keleş. 1985. The Politics of Rapid Urbanisation:
Government and Growth in Modern Turkey. London: Holmas- Meier. Doğru, A.B. 2002. İstanbul Kent Çeperinde Saçaklanma ve Sürdürülebilirlik: Eyüp
Kent Çeperi Örneği, (MSc. Thesis, Mimar Sinan Üniversitesi, Ankara).
78
Frumkin, Howard, Lawrence Frank, and Richard Jackson. 2004. Urban Sprawl and
Public Health: Designing, Planning, and Building for Healthy Communities. Washington: Island Press.
Gallent, N. Shoard, M. Andersson, J. Oades, R. and Tudor, C. 2004. England’s Urban
Fringes: Multi-functionality and Planning. Local Environment 9 (3): 217–233. Gordon, P. and H.W. Richardson. 1997. Are Compact Cities a Desirable Planning
Goal? Journal of the American Planning Association 63 (1): 95-106. Handy, Susan L., Patricia L. Mokhtarian, Theodore J. Buehler, and Xinyu Cao. 2004.
Residential Location Choice and Travel Behavior: Implication for Air Quality. California: California Department of Transportation, Report No. 27.
Heimlich, Ralph E. and William D Anderson. 2001. Development at the Urban Fringe
and Beyond: Impacts on Agriculture and Rural Land. Washington: U.S. Department of Agriculture, Report No. 803.
İ.B.B. Şehir Planlama Müdürlüğü. 1995. 1/50.000 Ölçekli İstanbul Metropoliten
Alan Alt Bölge Nazım Planı. İstanbul: Şehir Planlama Müdürlüğü. İ.B.B. Metropoliten Planlama ve Kentsel Tasarım Merkezi. 2005. Ulaşım Analizi
Raporu. İstanbul: İ.B.B. İ.B.B. Metropoliten Planlama ve Kentsel Tasarım Merkezi. 2006a. İstanbul İl Bütünü
Çevre Düzeni Planı Raporu. İstanbul: Metropoliten Planlama ve Kentsel Tasarım Merkezi.
İ.B.B. Metropoliten Planlama ve Kentsel Tasarım Merkezi. 2006b. Türkiye’de
Sanayileşme Süreci. İstanbul: Metropoliten Planlama ve Kentsel Tasarım Merkezi.
İ.B.B. Metropoliten Planlama ve Kentsel Tasarım Merkezi. 2006c. Toplu Taşıma
Sistemi. İstanbul: Metropoliten Planlama ve Kentsel Tasarım Merkezi. Johnson, M.P. 2001. Environmental Impacts of Urban Sprawl: A Survey of the
Literature and Proposed Research Agenda. Environment and Planning A 33: 717-735.
Jun, M. 2004. The Effects of Portland’s Urban Growth Boundary on Urban
Development Patterns and Commuting. Urban Studies 41 (7): 1333-1348. Karataş, N. 2000. Effects of Land Ownership Transformation in Metropoliten Fringe
Area on Existing Pattern, (MSc. Thesis, İzmir Institute of Technology, İzmir). Kıray, Mübeccel. 1998. Kentleşme Yazıları. İstanbul: Bağlam Yayıncılık. Mubarak, F.A. 2004. Urban Growth Boundary Policy and Residential Suburbanization:
Riyadh, Saudi Arabia. Habitat International 28: 567-591.

79
Ocakçı, M. 1989. Metropolitenleşme Sürecinde İmalat Sanayii ve Metropoliten Şehir
İlişkileri, (Doctoral Thesis, İstanbul Technical University, İstanbul). Özçevik, Ö.G. 1999. Metropoliten Kent Çeperindeki Yerleşimlerde Yapısal Dinamikler-
İstanbul Metropoliten Kent Çeperi Örneği, (Doctoral Thesis, İstanbul Technical University, İstanbul).
Özdemir, S. 1993. Kent Çeperlerinde Mülkiyet Örüntüsü Değişim Süreci, (Doctoral
Thesis, Dokuz Eylül University, İzmir). Pendall, P. 1999. Do Land Use Controls Cause Sprawl? Environment and Planning B:
Planning and Design 26: 555-571. Planning Commissioners Journal. 2006.
http://www.plannersweb.com/planning-abcs/u.html (accessed December 4, 2006).
Pryor, R.J. 1968. Defining the Rural Urban Fringe. Social Forces 6: 202-215. Razin, E. 1998. Policies to Control Urban Sprawl: Planning Regulations or Changes in
the ‘Rules of the Game’. Urban Studies 35 (2): 321-340. Sazak, Şazuman. 2002. Metropoliten Kentin Etki Alanında Kalan Kentlerin Çeperindeki
Arsaların Dönüşüm Süreci: Çorlu-Büyükkarıştıran Örneği. Edirne: Trakya Üniversitesi Yayınları No. 50.
Schwanen, T., M. Dijst, and F.M. Dieleman. (2004). Policies for Urban Form and their
Impact on Travel: The Netherlands Experience. Urban Studies 41 (3): 579-603. Sierra Club. 2007.
http://www.sierraclub.org/sprawl/report98/ (accessed March 3, 2007).
Steuteville, Robert. 2004. The New Urbanism.
http://www.newurbannews.com/AboutNewUrbanism.html (accessed March 12, 2007).
Stoel, T.B. 1999. Urban Sprawl: What Can Be Done to Tackle This Growing Problem?
Environment 41 (4): 6-11, 29-33. Theobald, M. 2001. Land Use Dynamics beyond the American Urban Fringe. The
Geographical Review 91 (3): 544-564. Tirado, Jessica. 2007. Smart Growth.
http://www.newurbanism.org/newurbanism/smartgrowth.html (accessed February 22, 2007).
Vanneste, Dominique, K. Claes, and L. Marais. 1999. The Urban Fringe: Conflicts in
the Process of Transformation.

80
http://impulscentrum.blogspot.com/ (accessed February 2, 2007).
Velibeyoğlu, H. 2004. Development Trends of Single Family Housing Estate in İzmir
Metropolitan Fringe Area, (MSc. Thesis, İzmir Institute of Technology, İzmir). Weber, Joe and Selima Sultana. 2005. The Impact of Sprawl on Commuting in Alabama.
Birmingham: University Transportation Center for Alabama, Report No. 04108. Yüzer, A. Ş. 2002. Yerleşmelerde Sanayi Alanları Yer Seçimi Eğilimi – Alan Tahsisleri
ve Yeni Düzenleme Stratejileri: İstanbul Örneği, (Doctoral Thesis, İstanbul Technical University, İstanbul).
Yüzer, A.Ş. and C. Giritlioglu. 2003. Sanayi Alanları Yeni Düzenleme Stratejileri:
İstanbul Örneği. İTÜ Dergisi 2 (1): 119-127.