Embed Size (px)
Citation preview
brainsciences
Article
Inter-Session Reliability of Functional Near-InfraredSpectroscopy at the Prefrontal Cortex While Walkingin Multiple Sclerosis
Kim-Charline Broscheid 1,* , Dennis Hamacher 1,† , Juliane Lamprecht 2,3, Michael Sailer 2,3,4
and Lutz Schega 1
1 Department of Sport Science, Institute III, Otto von Guericke University (OvGU) Magdeburg,Zschokkestraße 32, 39104 Magdeburg, Germany; [email protected] (D.H.);[email protected] (L.S.)
2 MEDIAN Neurological Rehabilitation Center Magdeburg, Gustav-Ricker-Straße 4, 39120 Magdeburg,Germany; [email protected] (J.L.); [email protected] (M.S.)
3 Institute for Neurorehabilitation affiliated to OvGU Magdeburg, MEDIAN Neurological RehabilitationCenter Magdeburg, Gustav-Ricker-Straße 4, 39120 Magdeburg, Germany
4 MEDIAN Rehabilitation Center Flechtingen, Parkstraße, 39345 Flechtingen, Germany* Correspondence: [email protected]; Tel.: +49-(0)391-54942† Present adress: DHGS Deutsche Hochschule für Gesundheit & Sport GmbH, Vulkanstraße 1,
10367 Berlin, Germany.
Received: 17 August 2020; Accepted: 16 September 2020; Published: 17 September 2020�����������������
Abstract: Many established technologies are limited in analyzing the executive functions in motion,especially while walking. Functional near-infrared spectroscopy (fNIRS) fills this gap. The aim of thestudy is to investigate the inter-session reliability (ISR) of fNIRS-derived parameters at the prefrontalcortex while walking in people with multiple sclerosis (MS) and healthy control (HC) individuals.Twenty people with MS/HC individuals walked a 12 m track back and forth over 6 min. The primaryoutcomes were the absolute and relative reliability of the mean, slope coefficient (SC), and area underthe curve (A) of the oxy-/deoxyhemoglobin concentrations (HbO/HbR) in the Brodmann areas (BA)9/46/10. The SC and the A of HbO exhibited a fair ISR in BA10 in people with MS. For the mean andA of the HbR, almost all areas observed revealed a fair ISR. Overall, the ISR was better for HbR thanHbO. A fair to excellent ISR was found for most BA of the prefrontal cortex in HC individuals. In total,the ISR of the analyzed fNIRS-derived parameters was limited. To improve the ISR, confounderssuch as fatigue and mind wandering should be minimized. When reporting the ISR, the focus shouldbe on the mean/A rather than SC.
Keywords: MS; hemodynamic response; fNIRS; test–retest reliability; cortical activity; PFC
1. Introduction
Human bipedal locomotion is a central determinant of participation in daily life. Especiallypeople suffering from inflammatory autoimmune diseases, such as multiple sclerosis (MS), oftenexhibit impaired locomotion [1]. These impairments can be diverse (e.g., ataxia, spasticity, or muscleweakness) and depend on the affected area in the brain or spinal cord [2]. To treat these deficits moreefficiently, it is necessary to understand the underlying motor and cognitive mechanisms.
One concept that comprises both mechanisms is gait automaticity. According to Clark [3], gaitautomaticity is “[ . . . ] the ability of the nervous system to successfully coordinate movement withminimal use of attention-demanding executive control resources”. The interaction of automaticityand executive control are essential for executing movements. The respective contributions and the
Brain Sci. 2020, 10, 643; doi:10.3390/brainsci10090643 www.mdpi.com/journal/brainsci
Brain Sci. 2020, 10, 643 2 of 15
relation to each other can be shifted by different factors such as (motor-) learning progresses [4] ordamage of the central nervous system [3], as it can be found in people with MS. To estimate the degreeof gait automaticity, it is important to quantify the activation of the prefrontal cortex (PFC) in whichthe executive functions and the attention are located [5].
The established technologies (magnetic resonance imaging, positron emission tomography, andmagnetoencephalography) are too limited to assess the PFC activation in motion due to the requiredfixed head position and non-portability [6]. Although electroencephalography (EEG) is portable, thepreparation is time-consuming, and it has a high susceptibility to motion artifacts [6].
Functional near-infrared spectroscopy (fNIRS) is a promising tool that provides the followingproperties [7]. It is a non-invasive, easy to apply, and portable optical brain imaging method that isapplicable in motion [8–10]. It is less affected by motion artefacts than comparable systems and hasa relatively high temporal resolution up to 1 ms [8,11]. Due to these features, the interest in fNIRSis rapidly increasing in the rehabilitative context. First studies have already investigated the PFCactivation while walking in people with MS [12,13]. They were able to distinguish between healthypeople and people with MS and between different walking conditions based on the PFC activation.Even though these first results are promising, there is a lack of basic methodological studies on fNIRS.
To the best of our knowledge, there are no studies analyzing absolute and relative inter-sessionreliability (ISR) data in people with MS while walking yet, which is urgently necessary to assesschanges in fNIRS-derived parameters. Especially in people with MS, it is important to verify theISR, as the disease is accompanied by a high fluctuation in daily performance caused by, e.g., statefatigue or fatigability [14]. Moreover, there is only one study that has demonstrated moderate ISR offNIRS-derived parameters while walking in healthy adults [15] yet.
Therefore, the present study aims to analyze the relative and absolute ISR of fNIRS-derivedparameters at the PFC during single-task walking on two consecutively days in moderately affectedpeople with MS and healthy control individuals (HC individuals).
2. Materials and Methods
2.1. Study Design and Participants
For this cross-sectional controlled ISR study, 20 people with MS (15 female/5 male) with a confirmedMS diagnosis according to the revised McDonald criteria [16] were recruited. They were 41.0 ± 12.0years old and had an Expanded Disability Status Scale (EDSS) [17] of 2.0 ± 0.9. The patients had tobe able to walk at least 300 m without walking aids. Therefore, only patients with an EDSS less thanor equal to 4.5 were included. The last acute episode of MS and the last cortisone intake should dateback more than 30 days. The HC individuals were age- (42.2 ± 9.8 years) and sex- (16 female/4 male)matched. They should not have orthopedic or neurologic limitations nor hypertension or obesity.The study was approved by the ethics committee of the Medical Faculty of the Otto von GuerickeUniversity (OvGU) Magdeburg (Germany) (No.: 116/18) and is registered in the German Clinical TrialRegister (ID: DRKS00015190).
2.2. Study Procedure
The study was conducted by the Department of Health and Physical Activity of the OvGUMagdeburg together with the Center for Neurorehabilitation Median Klinik Flechtingen (Germany).The people with MS were recruited by health professionals at the clinic at the beginning of theirsix weeks rehabilitation. First, the patients were informed about the study and written informedconsent was obtained. In the pre-assessment, the 6-min walk test (6MWT) was executed [18] byphysiotherapists and the 12-Item Multiple Sclerosis Walking Scale (MSWS-12, German version) [19]was obtained. Subsequently, the test and retest measurements (24 h in between) were conducted in themorning on non-treatment days. The participants walked a distance of 12 m on a level floor back andforth, in their self-selected walking pace and were advised to concentrate on walking only. Due to the
Brain Sci. 2020, 10, 643 3 of 15
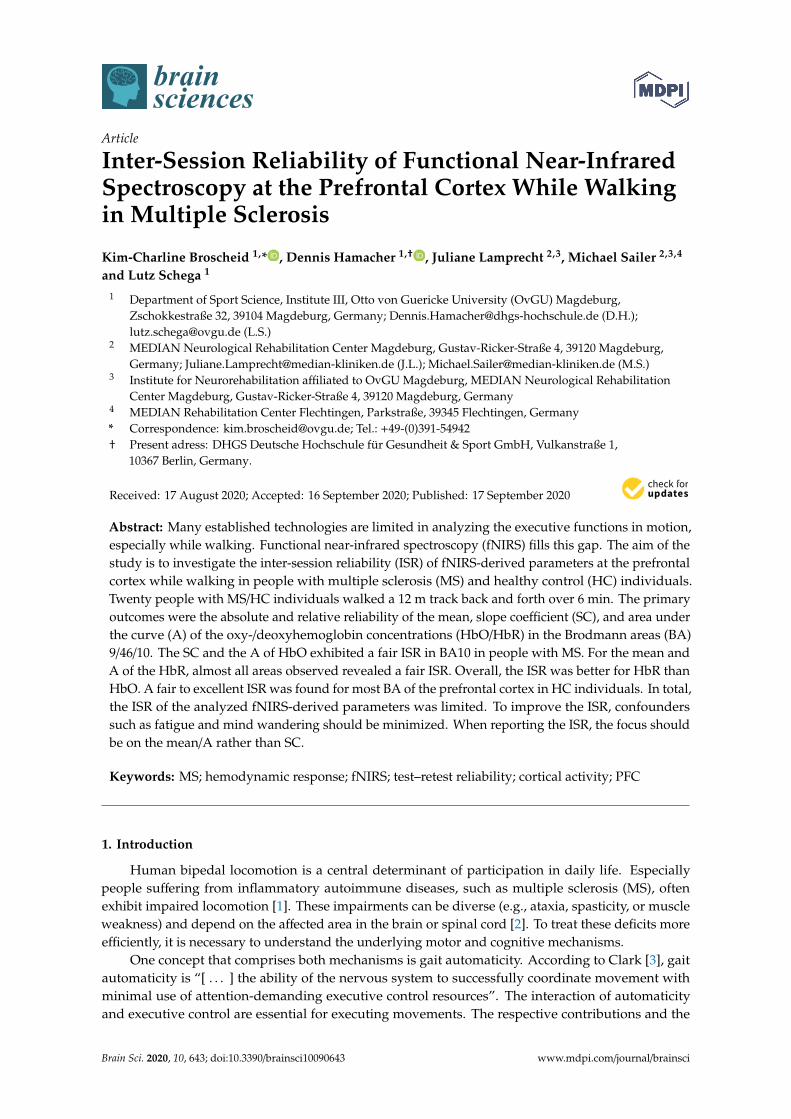
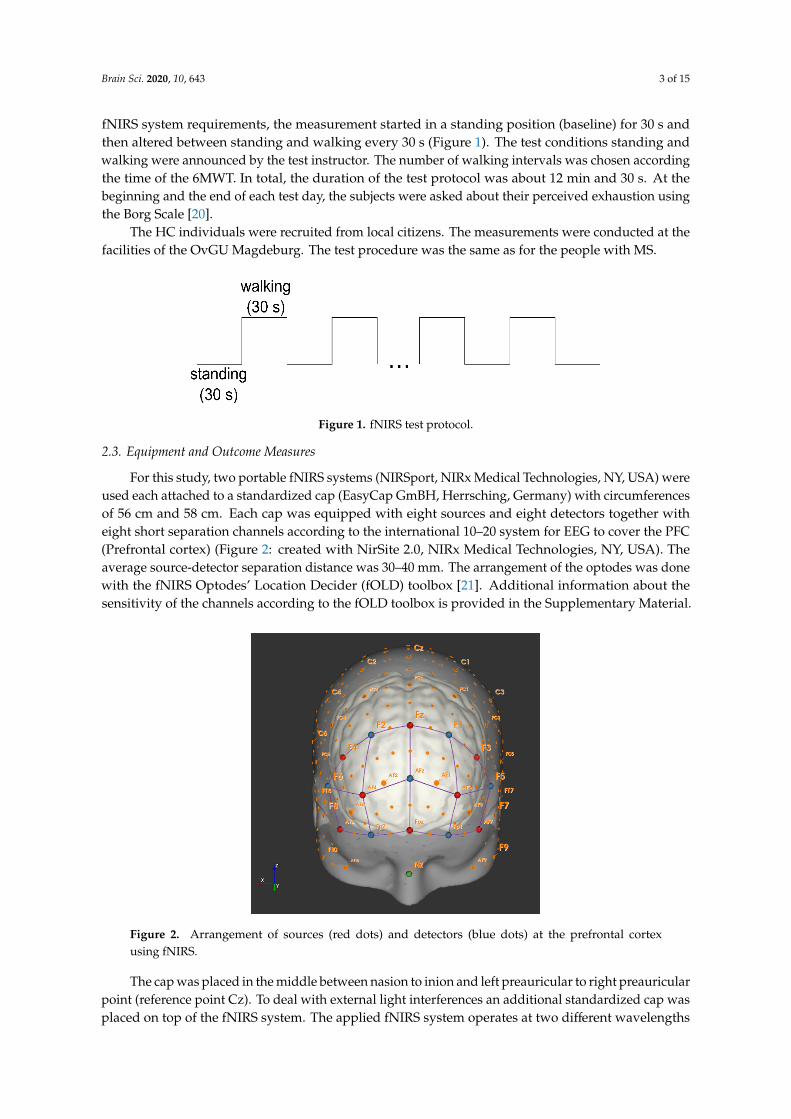
fNIRS system requirements, the measurement started in a standing position (baseline) for 30 s andthen altered between standing and walking every 30 s (Figure 1). The test conditions standing andwalking were announced by the test instructor. The number of walking intervals was chosen accordingthe time of the 6MWT. In total, the duration of the test protocol was about 12 min and 30 s. At thebeginning and the end of each test day, the subjects were asked about their perceived exhaustion usingthe Borg Scale [20].
The HC individuals were recruited from local citizens. The measurements were conducted at thefacilities of the OvGU Magdeburg. The test procedure was the same as for the people with MS.
Brain Sci. 2020, 10, x FOR PEER REVIEW 3 of 18
according the time of the 6MWT. In total, the duration of the test protocol was about 12 min and 30 s. At the beginning and the end of each test day, the subjects were asked about their perceived exhaustion using the Borg Scale [20].
The HC individuals were recruited from local citizens. The measurements were conducted at the facilities of the OvGU Magdeburg. The test procedure was the same as for the people with MS.
Figure 1. fNIRS test protocol.
2.3. Equipment and Outcome Measures
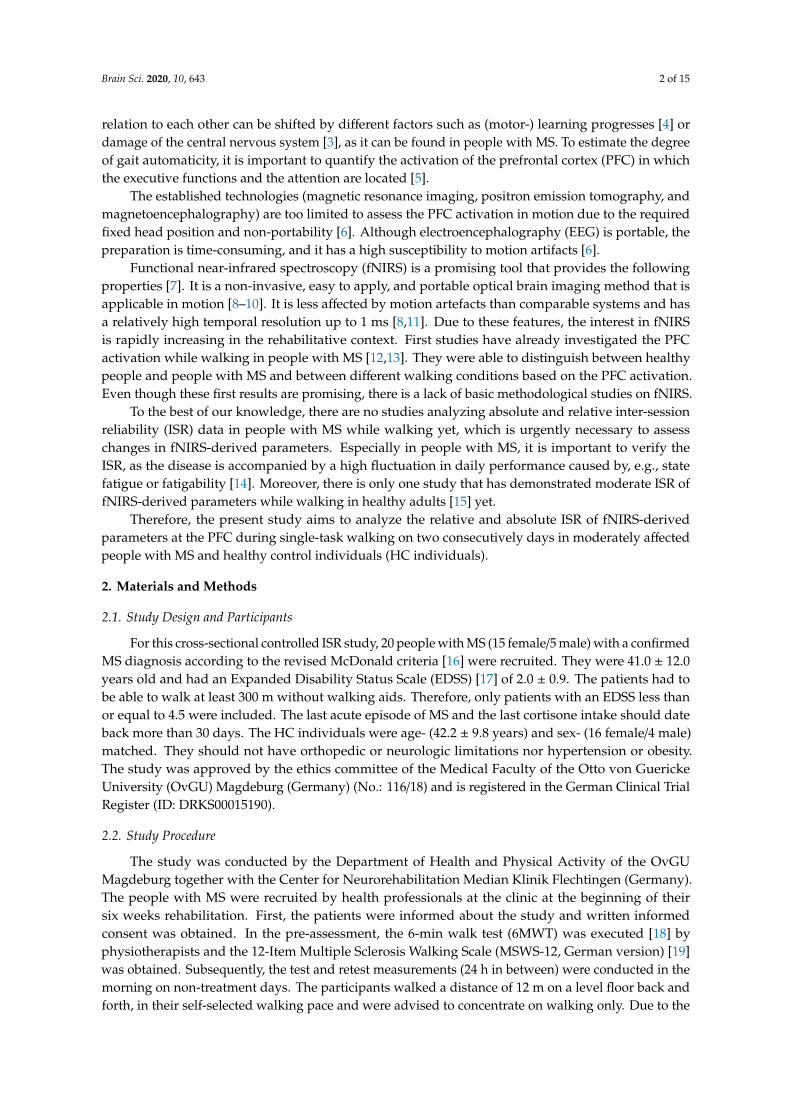
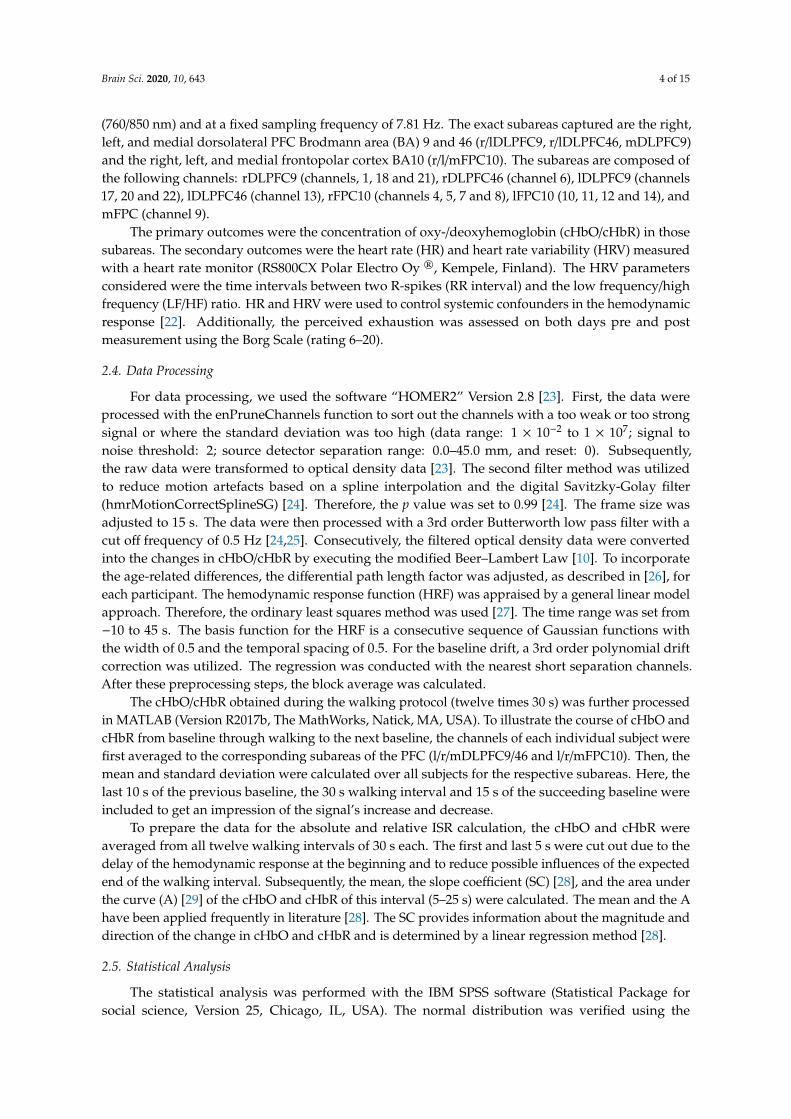
For this study, two portable fNIRS systems (NIRSport, NIRx Medical Technologies, NY, USA) were used each attached to a standardized cap (EasyCap GmBH, Herrsching, Germany) with circumferences of 56 cm and 58 cm. Each cap was equipped with eight sources and eight detectors together with eight short separation channels according to the international 10–20 system for EEG to cover the PFC (Prefrontal cortex) (Figure 2: created with NirSite 2.0, NIRx Medical Technologies, NY, USA). The average source-detector separation distance was 30–40 mm. The arrangement of the optodes was done with the fNIRS Optodes’ Location Decider (fOLD) toolbox [21]. Additional information about the sensitivity of the channels according to the fOLD toolbox is provided in the supplementary material.
Figure 2. Arrangement of sources (red dots) and detectors (blue dots) at the prefrontal cortex using fNIRS.
The cap was placed in the middle between nasion to inion and left preauricular to right preauricular point (reference point Cz). To deal with external light interferences an additional standardized cap was placed on top of the fNIRS system. The applied fNIRS system operates at two different wavelengths (760/850 nm) and at a fixed sampling frequency of 7.81 Hz. The exact subareas captured are the right, left, and medial dorsolateral PFC Brodmann area (BA) 9 and 46 (r/lDLPFC9, r/lDLPFC46, mDLPFC9) and the right, left, and medial frontopolar cortex BA10 (r/l/mFPC10). The subareas are composed of the following channels: rDLPFC9 (channels, 1, 18 and 21), rDLPFC46
Figure 1. fNIRS test protocol.
2.3. Equipment and Outcome Measures
For this study, two portable fNIRS systems (NIRSport, NIRx Medical Technologies, NY, USA) wereused each attached to a standardized cap (EasyCap GmBH, Herrsching, Germany) with circumferencesof 56 cm and 58 cm. Each cap was equipped with eight sources and eight detectors together witheight short separation channels according to the international 10–20 system for EEG to cover the PFC(Prefrontal cortex) (Figure 2: created with NirSite 2.0, NIRx Medical Technologies, NY, USA). Theaverage source-detector separation distance was 30–40 mm. The arrangement of the optodes was donewith the fNIRS Optodes’ Location Decider (fOLD) toolbox [21]. Additional information about thesensitivity of the channels according to the fOLD toolbox is provided in the Supplementary Material.
Brain Sci. 2020, 10, x FOR PEER REVIEW 3 of 18
according the time of the 6MWT. In total, the duration of the test protocol was about 12 min and 30 s. At the beginning and the end of each test day, the subjects were asked about their perceived exhaustion using the Borg Scale [20].
The HC individuals were recruited from local citizens. The measurements were conducted at the facilities of the OvGU Magdeburg. The test procedure was the same as for the people with MS.
Figure 1. fNIRS test protocol.
2.3. Equipment and Outcome Measures
For this study, two portable fNIRS systems (NIRSport, NIRx Medical Technologies, NY, USA) were used each attached to a standardized cap (EasyCap GmBH, Herrsching, Germany) with circumferences of 56 cm and 58 cm. Each cap was equipped with eight sources and eight detectors together with eight short separation channels according to the international 10–20 system for EEG to cover the PFC (Prefrontal cortex) (Figure 2: created with NirSite 2.0, NIRx Medical Technologies, NY, USA). The average source-detector separation distance was 30–40 mm. The arrangement of the optodes was done with the fNIRS Optodes’ Location Decider (fOLD) toolbox [21]. Additional information about the sensitivity of the channels according to the fOLD toolbox is provided in the supplementary material.
Figure 2. Arrangement of sources (red dots) and detectors (blue dots) at the prefrontal cortex using fNIRS.
The cap was placed in the middle between nasion to inion and left preauricular to right preauricular point (reference point Cz). To deal with external light interferences an additional standardized cap was placed on top of the fNIRS system. The applied fNIRS system operates at two different wavelengths (760/850 nm) and at a fixed sampling frequency of 7.81 Hz. The exact subareas captured are the right, left, and medial dorsolateral PFC Brodmann area (BA) 9 and 46 (r/lDLPFC9, r/lDLPFC46, mDLPFC9) and the right, left, and medial frontopolar cortex BA10 (r/l/mFPC10). The subareas are composed of the following channels: rDLPFC9 (channels, 1, 18 and 21), rDLPFC46
Figure 2. Arrangement of sources (red dots) and detectors (blue dots) at the prefrontal cortexusing fNIRS.
The cap was placed in the middle between nasion to inion and left preauricular to right preauricularpoint (reference point Cz). To deal with external light interferences an additional standardized cap wasplaced on top of the fNIRS system. The applied fNIRS system operates at two different wavelengths
Brain Sci. 2020, 10, 643 4 of 15
(760/850 nm) and at a fixed sampling frequency of 7.81 Hz. The exact subareas captured are the right,left, and medial dorsolateral PFC Brodmann area (BA) 9 and 46 (r/lDLPFC9, r/lDLPFC46, mDLPFC9)and the right, left, and medial frontopolar cortex BA10 (r/l/mFPC10). The subareas are composed ofthe following channels: rDLPFC9 (channels, 1, 18 and 21), rDLPFC46 (channel 6), lDLPFC9 (channels17, 20 and 22), lDLPFC46 (channel 13), rFPC10 (channels 4, 5, 7 and 8), lFPC10 (10, 11, 12 and 14), andmFPC (channel 9).
The primary outcomes were the concentration of oxy-/deoxyhemoglobin (cHbO/cHbR) in thosesubareas. The secondary outcomes were the heart rate (HR) and heart rate variability (HRV) measuredwith a heart rate monitor (RS800CX Polar Electro Oy ®, Kempele, Finland). The HRV parametersconsidered were the time intervals between two R-spikes (RR interval) and the low frequency/highfrequency (LF/HF) ratio. HR and HRV were used to control systemic confounders in the hemodynamicresponse [22]. Additionally, the perceived exhaustion was assessed on both days pre and postmeasurement using the Borg Scale (rating 6–20).
2.4. Data Processing
For data processing, we used the software “HOMER2” Version 2.8 [23]. First, the data wereprocessed with the enPruneChannels function to sort out the channels with a too weak or too strongsignal or where the standard deviation was too high (data range: 1 × 10⁻² to 1 × 10⁷; signal tonoise threshold: 2; source detector separation range: 0.0–45.0 mm, and reset: 0). Subsequently,the raw data were transformed to optical density data [23]. The second filter method was utilizedto reduce motion artefacts based on a spline interpolation and the digital Savitzky-Golay filter(hmrMotionCorrectSplineSG) [24]. Therefore, the p value was set to 0.99 [24]. The frame size wasadjusted to 15 s. The data were then processed with a 3rd order Butterworth low pass filter with acut off frequency of 0.5 Hz [24,25]. Consecutively, the filtered optical density data were convertedinto the changes in cHbO/cHbR by executing the modified Beer–Lambert Law [10]. To incorporatethe age-related differences, the differential path length factor was adjusted, as described in [26], foreach participant. The hemodynamic response function (HRF) was appraised by a general linear modelapproach. Therefore, the ordinary least squares method was used [27]. The time range was set from−10 to 45 s. The basis function for the HRF is a consecutive sequence of Gaussian functions withthe width of 0.5 and the temporal spacing of 0.5. For the baseline drift, a 3rd order polynomial driftcorrection was utilized. The regression was conducted with the nearest short separation channels.After these preprocessing steps, the block average was calculated.
The cHbO/cHbR obtained during the walking protocol (twelve times 30 s) was further processedin MATLAB (Version R2017b, The MathWorks, Natick, MA, USA). To illustrate the course of cHbO andcHbR from baseline through walking to the next baseline, the channels of each individual subject werefirst averaged to the corresponding subareas of the PFC (l/r/mDLPFC9/46 and l/r/mFPC10). Then, themean and standard deviation were calculated over all subjects for the respective subareas. Here, thelast 10 s of the previous baseline, the 30 s walking interval and 15 s of the succeeding baseline wereincluded to get an impression of the signal’s increase and decrease.
To prepare the data for the absolute and relative ISR calculation, the cHbO and cHbR wereaveraged from all twelve walking intervals of 30 s each. The first and last 5 s were cut out due to thedelay of the hemodynamic response at the beginning and to reduce possible influences of the expectedend of the walking interval. Subsequently, the mean, the slope coefficient (SC) [28], and the area underthe curve (A) [29] of the cHbO and cHbR of this interval (5–25 s) were calculated. The mean and the Ahave been applied frequently in literature [28]. The SC provides information about the magnitude anddirection of the change in cHbO and cHbR and is determined by a linear regression method [28].
2.5. Statistical Analysis
The statistical analysis was performed with the IBM SPSS software (Statistical Package forsocial science, Version 25, Chicago, IL, USA). The normal distribution was verified using the
Brain Sci. 2020, 10, 643 5 of 15
Kolmogorov–Smirnov test. The relative ISR was determined by the intraclass correlation coefficient(ICC) estimates and their 95% confidence intervals (CI) of the mean, SC, and A of the cHbO/cHbR buildon a single-rating, absolute-agreement, 2-way, mixed-effects model [30]. The ICC was classified aspoor with values ≤ 0.40, fair between 0.40 and 0.59, good between 0.60 and 0.74, and excellent between0.75 and 1.00 [31]. In addition, the absolute reliability was checked by applying Bland and Altmanlimits of agreement (LoA), the bias, and the CI of the lower and upper LoA [32]. The differences of thesecondary outcomes between testing days were tested by paired t-tests or, in case of none, normaldistribution by Wilcoxon tests.
3. Results
The data of 16 people with MS (14 female/2 male) and 19 HC individuals (15 female/4 male) withan average age of 41.0 ± 12.0 and 42.1 ± 9.8 years, respectively, were analyzed (Table 1). Four peoplewith MS had to be excluded due to an acute episode during the study period, breathing problems(allergic coryza) during the measurement, and two for not finishing the measurement. One subject ofthe HC individuals had to be excluded due to obesity (body mass index: 36.5). Overall, the peoplewith MS suffered from moderate walking limitations (MSWS-12: 45% ± 20.7%) and were able to cover473.1 ± 109.7 m in the 6MWT (HC individuals: 533.5 ± 64.5 m).
Table 1. Descriptive subject data.
Age [Years] f/m Weight [kg] Height [cm] EDSS FD [Years] FM [years] MSWS-12[%] 6MWT [m]
MS (n = 16) 41.0 ± 12.0 14/2 74.6 ± 18.1 170.1 ± 9.0 2.0 ± 0.9 5.9 ± 6.8 8.6 ± 8.7 45.0 ± 20.7 473.1 ± 109.7
HC (n = 19) 42.2 ± 9.8 15/4 73.0 ± 16.0 171.4 ± 8.8 n.a. n.a. n.a. n.a. 533.5 ± 64.5
MS: multiple sclerosis; HC: healthy control; f: female; m: male; EDSS: Expanded Disability Status Scale; FD: firstdiagnosis; FM: first manifestation; MSWS-12: 12-Item Multiple Sclerosis Walking Scale; 6MWT: 6-min walk test; n.a.:not applicable.
3.1. Descriptive Data cHbO/cHbR
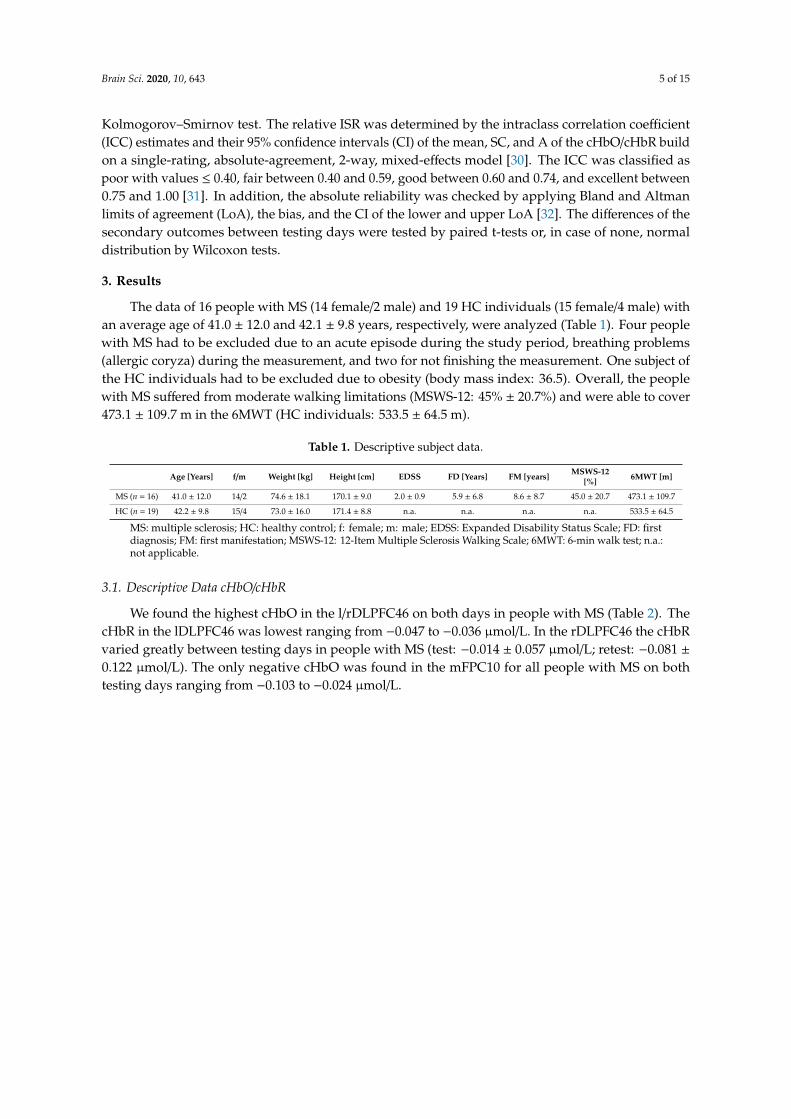
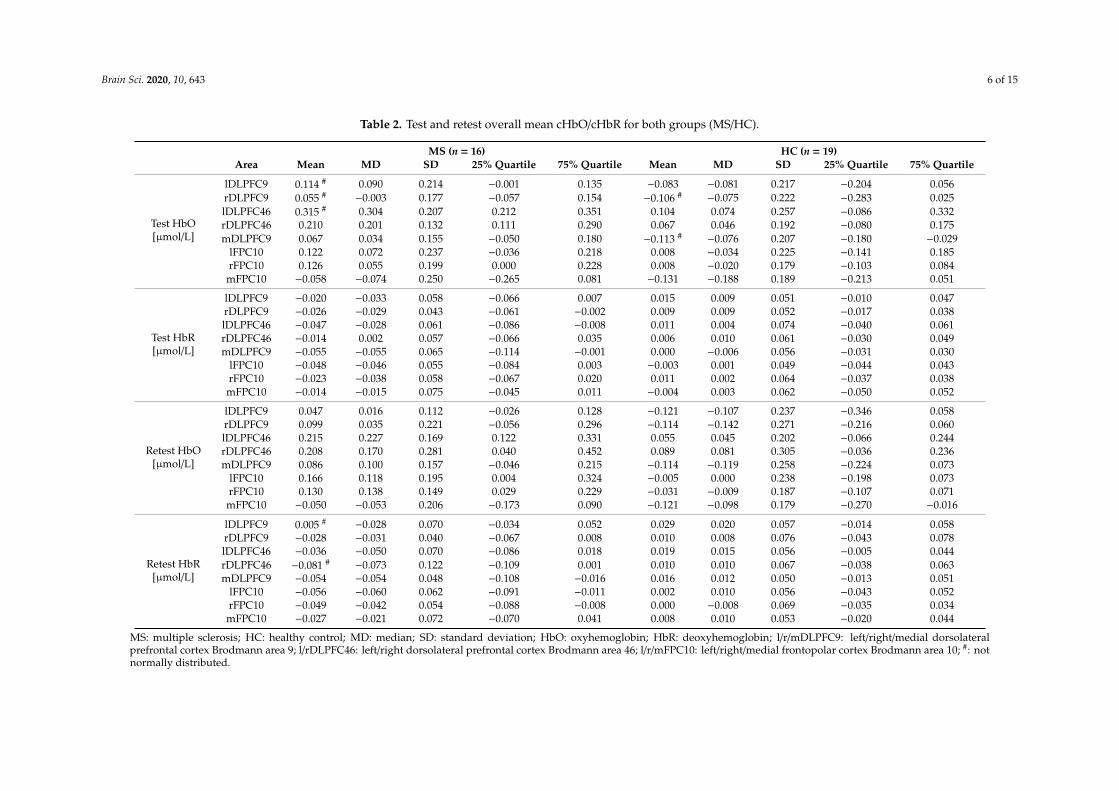
We found the highest cHbO in the l/rDLPFC46 on both days in people with MS (Table 2). ThecHbR in the lDLPFC46 was lowest ranging from −0.047 to −0.036 µmol/L. In the rDLPFC46 the cHbRvaried greatly between testing days in people with MS (test: −0.014 ± 0.057 µmol/L; retest: −0.081 ±0.122 µmol/L). The only negative cHbO was found in the mFPC10 for all people with MS on bothtesting days ranging from −0.103 to −0.024 µmol/L.
Brain Sci. 2020, 10, 643 6 of 15
Table 2. Test and retest overall mean cHbO/cHbR for both groups (MS/HC).
MS (n = 16) HC (n = 19)Area Mean MD SD 25% Quartile 75% Quartile Mean MD SD 25% Quartile 75% Quartile
Test HbO[µmol/L]
lDLPFC9 0.114 # 0.090 0.214 −0.001 0.135 −0.083 −0.081 0.217 −0.204 0.056rDLPFC9 0.055 # −0.003 0.177 −0.057 0.154 −0.106 # −0.075 0.222 −0.283 0.025lDLPFC46 0.315 # 0.304 0.207 0.212 0.351 0.104 0.074 0.257 −0.086 0.332rDLPFC46 0.210 0.201 0.132 0.111 0.290 0.067 0.046 0.192 −0.080 0.175mDLPFC9 0.067 0.034 0.155 −0.050 0.180 −0.113 # −0.076 0.207 −0.180 −0.029
lFPC10 0.122 0.072 0.237 −0.036 0.218 0.008 −0.034 0.225 −0.141 0.185rFPC10 0.126 0.055 0.199 0.000 0.228 0.008 −0.020 0.179 −0.103 0.084mFPC10 −0.058 −0.074 0.250 −0.265 0.081 −0.131 −0.188 0.189 −0.213 0.051
Test HbR[µmol/L]
lDLPFC9 −0.020 −0.033 0.058 −0.066 0.007 0.015 0.009 0.051 −0.010 0.047rDLPFC9 −0.026 −0.029 0.043 −0.061 −0.002 0.009 0.009 0.052 −0.017 0.038lDLPFC46 −0.047 −0.028 0.061 −0.086 −0.008 0.011 0.004 0.074 −0.040 0.061rDLPFC46 −0.014 0.002 0.057 −0.066 0.035 0.006 0.010 0.061 −0.030 0.049mDLPFC9 −0.055 −0.055 0.065 −0.114 −0.001 0.000 −0.006 0.056 −0.031 0.030
lFPC10 −0.048 −0.046 0.055 −0.084 0.003 −0.003 0.001 0.049 −0.044 0.043rFPC10 −0.023 −0.038 0.058 −0.067 0.020 0.011 0.002 0.064 −0.037 0.038mFPC10 −0.014 −0.015 0.075 −0.045 0.011 −0.004 0.003 0.062 −0.050 0.052
Retest HbO[µmol/L]
lDLPFC9 0.047 0.016 0.112 −0.026 0.128 −0.121 −0.107 0.237 −0.346 0.058rDLPFC9 0.099 0.035 0.221 −0.056 0.296 −0.114 −0.142 0.271 −0.216 0.060lDLPFC46 0.215 0.227 0.169 0.122 0.331 0.055 0.045 0.202 −0.066 0.244rDLPFC46 0.208 0.170 0.281 0.040 0.452 0.089 0.081 0.305 −0.036 0.236mDLPFC9 0.086 0.100 0.157 −0.046 0.215 −0.114 −0.119 0.258 −0.224 0.073
lFPC10 0.166 0.118 0.195 0.004 0.324 −0.005 0.000 0.238 −0.198 0.073rFPC10 0.130 0.138 0.149 0.029 0.229 −0.031 −0.009 0.187 −0.107 0.071mFPC10 −0.050 −0.053 0.206 −0.173 0.090 −0.121 −0.098 0.179 −0.270 −0.016
Retest HbR[µmol/L]
lDLPFC9 0.005 # −0.028 0.070 −0.034 0.052 0.029 0.020 0.057 −0.014 0.058rDLPFC9 −0.028 −0.031 0.040 −0.067 0.008 0.010 0.008 0.076 −0.043 0.078lDLPFC46 −0.036 −0.050 0.070 −0.086 0.018 0.019 0.015 0.056 −0.005 0.044rDLPFC46 −0.081 # −0.073 0.122 −0.109 0.001 0.010 0.010 0.067 −0.038 0.063mDLPFC9 −0.054 −0.054 0.048 −0.108 −0.016 0.016 0.012 0.050 −0.013 0.051
lFPC10 −0.056 −0.060 0.062 −0.091 −0.011 0.002 0.010 0.056 −0.043 0.052rFPC10 −0.049 −0.042 0.054 −0.088 −0.008 0.000 −0.008 0.069 −0.035 0.034mFPC10 −0.027 −0.021 0.072 −0.070 0.041 0.008 0.010 0.053 −0.020 0.044
MS: multiple sclerosis; HC: healthy control; MD: median; SD: standard deviation; HbO: oxyhemoglobin; HbR: deoxyhemoglobin; l/r/mDLPFC9: left/right/medial dorsolateralprefrontal cortex Brodmann area 9; l/rDLPFC46: left/right dorsolateral prefrontal cortex Brodmann area 46; l/r/mFPC10: left/right/medial frontopolar cortex Brodmann area 10; #: notnormally distributed.
Brain Sci. 2020, 10, 643 7 of 15
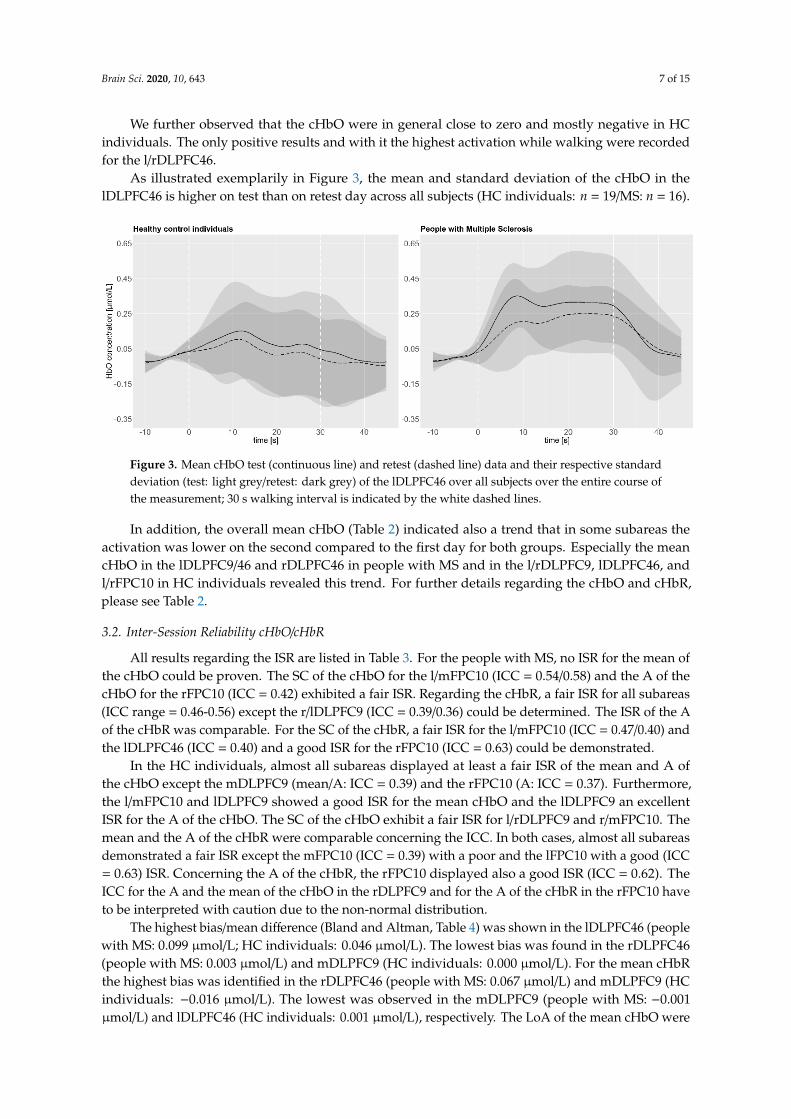
We further observed that the cHbO were in general close to zero and mostly negative in HCindividuals. The only positive results and with it the highest activation while walking were recordedfor the l/rDLPFC46.
As illustrated exemplarily in Figure 3, the mean and standard deviation of the cHbO in thelDLPFC46 is higher on test than on retest day across all subjects (HC individuals: n = 19/MS: n = 16).
Brain Sci. 2020, 10, x FOR PEER REVIEW 8 of 18
We further observed that the cHbO were in general close to zero and mostly negative in HC individuals. The only positive results and with it the highest activation while walking were recorded for the l/rDLPFC46.
As illustrated exemplarily in Figure 3, the mean and standard deviation of the cHbO in the lDLPFC46 is higher on test than on retest day across all subjects (HC individuals: n = 19/MS: n = 16).
Figure 3. Mean cHbO test (continuous line) and retest (dashed line) data and their respective standard deviation (test: light grey/retest: dark grey) of the lDLPFC46 over all subjects over the entire course of the measurement; 30 s walking interval is indicated by the white dashed lines.
In addition, the overall mean cHbO (Table 2) indicated also a trend that in some subareas the activation was lower on the second compared to the first day for both groups. Especially the mean cHbO in the lDLPFC9/46 and rDLPFC46 in people with MS and in the l/rDLPFC9, lDLPFC46, and l/rFPC10 in HC individuals revealed this trend. For further details regarding the cHbO and cHbR, please see Table 2.
3.2. Inter-Session Reliability cHbO/cHbR
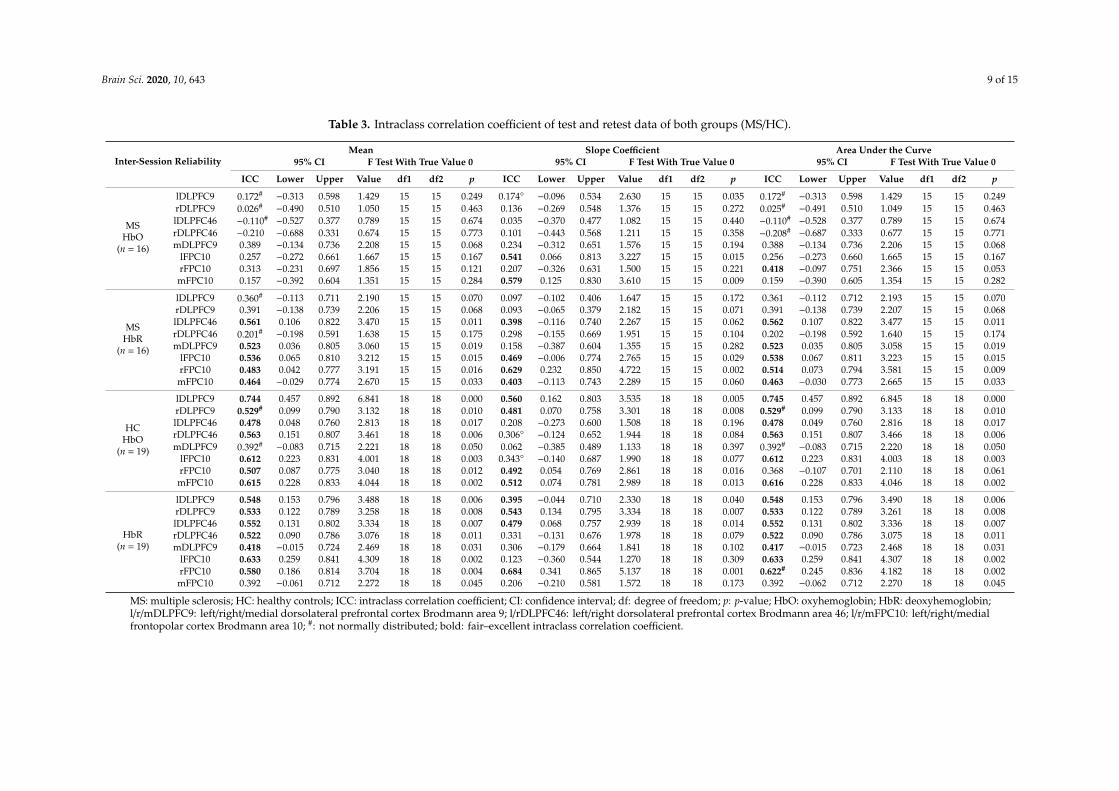
All results regarding the ISR are listed in Table 3. For the people with MS, no ISR for the mean of the cHbO could be proven. The SC of the cHbO for the l/mFPC10 (ICC = 0.54/0.58) and the A of the cHbO for the rFPC10 (ICC = 0.42) exhibited a fair ISR. Regarding the cHbR, a fair ISR for all subareas (ICC range = 0.46-0.56) except the r/lDLPFC9 (ICC = 0.39/0.36) could be determined. The ISR of the A of the cHbR was comparable. For the SC of the cHbR, a fair ISR for the l/mFPC10 (ICC = 0.47/0.40) and the lDLPFC46 (ICC = 0.40) and a good ISR for the rFPC10 (ICC = 0.63) could be demonstrated.
In the HC individuals, almost all subareas displayed at least a fair ISR of the mean and A of the cHbO except the mDLPFC9 (mean/A: ICC = 0.39) and the rFPC10 (A: ICC = 0.37). Furthermore, the l/mFPC10 and lDLPFC9 showed a good ISR for the mean cHbO and the lDLPFC9 an excellent ISR for the A of the cHbO. The SC of the cHbO exhibit a fair ISR for l/rDLPFC9 and r/mFPC10. The mean and the A of the cHbR were comparable concerning the ICC. In both cases, almost all subareas demonstrated a fair ISR except the mFPC10 (ICC = 0.39) with a poor and the lFPC10 with a good (ICC = 0.63) ISR. Concerning the A of the cHbR, the rFPC10 displayed also a good ISR (ICC = 0.62). The ICC for the A and the mean of the cHbO in the rDLPFC9 and for the A of the cHbR in the rFPC10 have to be interpreted with caution due to the non-normal distribution.
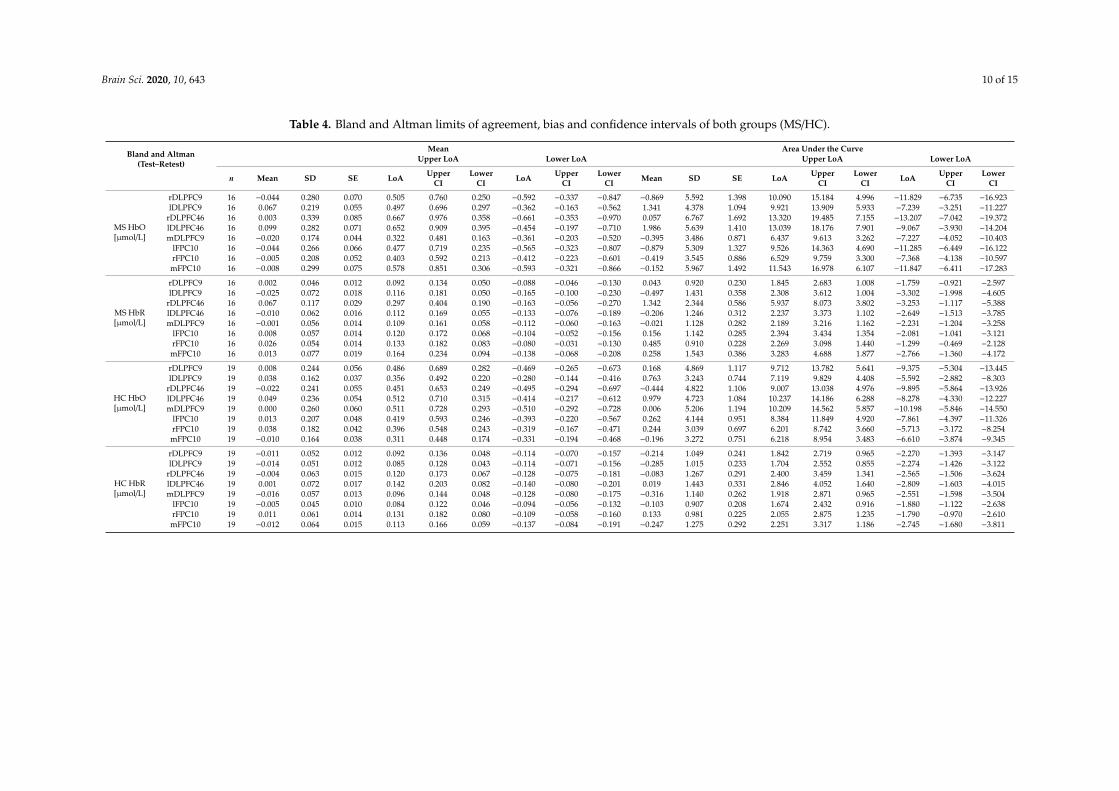
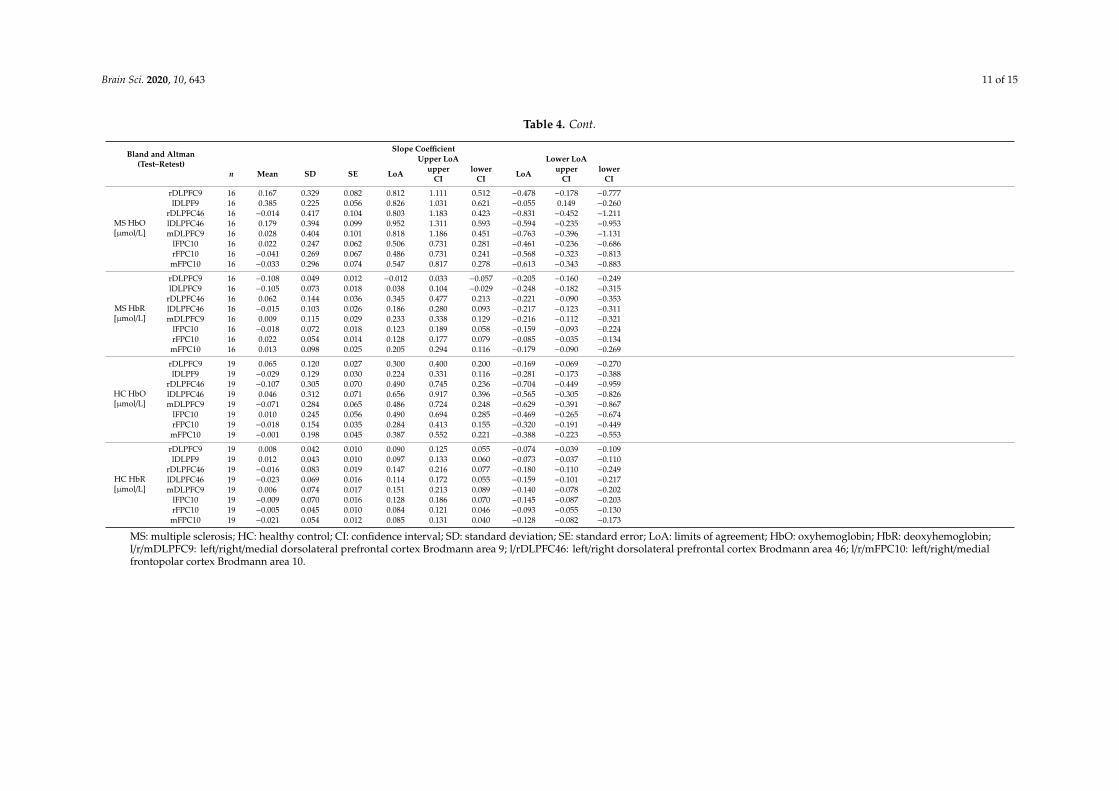
The highest bias/mean difference (Bland and Altman, Table 4) was shown in the lDLPFC46 (people with MS: 0.099 µmol/L; HC individuals: 0.046 µmol/L). The lowest bias was found in the rDLPFC46 (people with MS: 0.003 µmol/L) and mDLPFC9 (HC individuals: 0.000 µmol/L). For the mean cHbR the highest bias was identified in the rDLPFC46 (people with MS: 0.067 µmol/L) and mDLPFC9 (HC individuals: −0.016 µmol/L). The lowest was observed in the mDLPFC9 (people with MS: −0.001 µmol/L) and lDLPFC46 (HC individuals: 0.001 µmol/L), respectively. The LoA of the mean cHbO were smallest in mDLPFC9 (0.322/−0.361 µmol/L) in people with MS and lDLPFC9 (0.356/−0.280 µmol/L) as well as mFPC10 (0.311/−0.331 µmol/L) in HC individuals. Considering the
Figure 3. Mean cHbO test (continuous line) and retest (dashed line) data and their respective standarddeviation (test: light grey/retest: dark grey) of the lDLPFC46 over all subjects over the entire course ofthe measurement; 30 s walking interval is indicated by the white dashed lines.
In addition, the overall mean cHbO (Table 2) indicated also a trend that in some subareas theactivation was lower on the second compared to the first day for both groups. Especially the meancHbO in the lDLPFC9/46 and rDLPFC46 in people with MS and in the l/rDLPFC9, lDLPFC46, andl/rFPC10 in HC individuals revealed this trend. For further details regarding the cHbO and cHbR,please see Table 2.
3.2. Inter-Session Reliability cHbO/cHbR
All results regarding the ISR are listed in Table 3. For the people with MS, no ISR for the mean ofthe cHbO could be proven. The SC of the cHbO for the l/mFPC10 (ICC = 0.54/0.58) and the A of thecHbO for the rFPC10 (ICC = 0.42) exhibited a fair ISR. Regarding the cHbR, a fair ISR for all subareas(ICC range = 0.46-0.56) except the r/lDLPFC9 (ICC = 0.39/0.36) could be determined. The ISR of the Aof the cHbR was comparable. For the SC of the cHbR, a fair ISR for the l/mFPC10 (ICC = 0.47/0.40) andthe lDLPFC46 (ICC = 0.40) and a good ISR for the rFPC10 (ICC = 0.63) could be demonstrated.
In the HC individuals, almost all subareas displayed at least a fair ISR of the mean and A ofthe cHbO except the mDLPFC9 (mean/A: ICC = 0.39) and the rFPC10 (A: ICC = 0.37). Furthermore,the l/mFPC10 and lDLPFC9 showed a good ISR for the mean cHbO and the lDLPFC9 an excellentISR for the A of the cHbO. The SC of the cHbO exhibit a fair ISR for l/rDLPFC9 and r/mFPC10. Themean and the A of the cHbR were comparable concerning the ICC. In both cases, almost all subareasdemonstrated a fair ISR except the mFPC10 (ICC = 0.39) with a poor and the lFPC10 with a good (ICC= 0.63) ISR. Concerning the A of the cHbR, the rFPC10 displayed also a good ISR (ICC = 0.62). TheICC for the A and the mean of the cHbO in the rDLPFC9 and for the A of the cHbR in the rFPC10 haveto be interpreted with caution due to the non-normal distribution.
The highest bias/mean difference (Bland and Altman, Table 4) was shown in the lDLPFC46 (peoplewith MS: 0.099 µmol/L; HC individuals: 0.046 µmol/L). The lowest bias was found in the rDLPFC46(people with MS: 0.003 µmol/L) and mDLPFC9 (HC individuals: 0.000 µmol/L). For the mean cHbRthe highest bias was identified in the rDLPFC46 (people with MS: 0.067 µmol/L) and mDLPFC9 (HCindividuals: −0.016 µmol/L). The lowest was observed in the mDLPFC9 (people with MS: −0.001µmol/L) and lDLPFC46 (HC individuals: 0.001 µmol/L), respectively. The LoA of the mean cHbO were
Brain Sci. 2020, 10, 643 8 of 15
smallest in mDLPFC9 (0.322/−0.361 µmol/L) in people with MS and lDLPFC9 (0.356/−0.280 µmol/L) aswell as mFPC10 (0.311/−0.331 µmol/L) in HC individuals. Considering the LoA of the mean cHbR,these were narrowest in rDLPFC9 (people with MS: 0.092/−0.088 µmol/L) and lFPC10 (HC individuals:0.084/−0.094 µmol/L).
3.3. Secondary Outcomes
The mean HR did not differ significantly between test and retest in people with MS (test: 98.1± 12.2 bpm/retest: 97.3 ± 16.4 bpm) and in HC individuals (test: 91.1 ± 10.2 bpm/retest: 91.5 ± 8.2bpm). In addition, the mean RR interval did not reveal any difference in people with MS (test: 618.09± 72.52 ms/retest: 626.37 ± 104.60 ms) and in HC individuals (test: 674.58 ± 80.24 ms/retest: 660:39± 59.63 ms) as well as the standard deviation of the RR interval (people with MS test: 19.51 ± 9.08ms/retest: 22.75 ± 14.02 ms and HC individuals (test: 60.78 (44.20/90.78) ms/retest: 70.25 (45.77/128.56)ms)). Furthermore, no difference could be found for the mean LF/HF ratio in people with MS (test: 3.51± 2.06/retest: 4.67 ± 4.25) and HC individuals (test: 2.72 ± 1.06/retest: 2.77 ± 1.32).
The perceived exhaustion (Borg Scale) was rated as “very light” to “light” in people with MS(median (25%/75% quartile) test: 8 (8/10); retest: 8 (8/12)) and in HC individuals (test: 9 (8/11); retest:10 (8/11)).
Brain Sci. 2020, 10, 643 9 of 15
Table 3. Intraclass correlation coefficient of test and retest data of both groups (MS/HC).
Inter-Session ReliabilityMean Slope Coefficient Area Under the Curve
95% CI F Test With True Value 0 95% CI F Test With True Value 0 95% CI F Test With True Value 0
ICC Lower Upper Value df1 df2 p ICC Lower Upper Value df1 df2 p ICC Lower Upper Value df1 df2 p
MSHbO
(n = 16)
lDLPFC9 0.172# −0.313 0.598 1.429 15 15 0.249 0.174◦ −0.096 0.534 2.630 15 15 0.035 0.172# −0.313 0.598 1.429 15 15 0.249rDLPFC9 0.026# −0.490 0.510 1.050 15 15 0.463 0.136 −0.269 0.548 1.376 15 15 0.272 0.025# −0.491 0.510 1.049 15 15 0.463lDLPFC46 −0.110# −0.527 0.377 0.789 15 15 0.674 0.035 −0.370 0.477 1.082 15 15 0.440 −0.110# −0.528 0.377 0.789 15 15 0.674rDLPFC46 −0.210 −0.688 0.331 0.674 15 15 0.773 0.101 −0.443 0.568 1.211 15 15 0.358 −0.208# −0.687 0.333 0.677 15 15 0.771mDLPFC9 0.389 −0.134 0.736 2.208 15 15 0.068 0.234 −0.312 0.651 1.576 15 15 0.194 0.388 −0.134 0.736 2.206 15 15 0.068
lFPC10 0.257 −0.272 0.661 1.667 15 15 0.167 0.541 0.066 0.813 3.227 15 15 0.015 0.256 −0.273 0.660 1.665 15 15 0.167rFPC10 0.313 −0.231 0.697 1.856 15 15 0.121 0.207 −0.326 0.631 1.500 15 15 0.221 0.418 −0.097 0.751 2.366 15 15 0.053mFPC10 0.157 −0.392 0.604 1.351 15 15 0.284 0.579 0.125 0.830 3.610 15 15 0.009 0.159 −0.390 0.605 1.354 15 15 0.282
MSHbR
(n = 16)
lDLPFC9 0.360# −0.113 0.711 2.190 15 15 0.070 0.097 −0.102 0.406 1.647 15 15 0.172 0.361 −0.112 0.712 2.193 15 15 0.070rDLPFC9 0.391 −0.138 0.739 2.206 15 15 0.068 0.093 −0.065 0.379 2.182 15 15 0.071 0.391 −0.138 0.739 2.207 15 15 0.068lDLPFC46 0.561 0.106 0.822 3.470 15 15 0.011 0.398 −0.116 0.740 2.267 15 15 0.062 0.562 0.107 0.822 3.477 15 15 0.011rDLPFC46 0.201# −0.198 0.591 1.638 15 15 0.175 0.298 −0.155 0.669 1.951 15 15 0.104 0.202 −0.198 0.592 1.640 15 15 0.174mDLPFC9 0.523 0.036 0.805 3.060 15 15 0.019 0.158 −0.387 0.604 1.355 15 15 0.282 0.523 0.035 0.805 3.058 15 15 0.019
lFPC10 0.536 0.065 0.810 3.212 15 15 0.015 0.469 −0.006 0.774 2.765 15 15 0.029 0.538 0.067 0.811 3.223 15 15 0.015rFPC10 0.483 0.042 0.777 3.191 15 15 0.016 0.629 0.232 0.850 4.722 15 15 0.002 0.514 0.073 0.794 3.581 15 15 0.009mFPC10 0.464 −0.029 0.774 2.670 15 15 0.033 0.403 −0.113 0.743 2.289 15 15 0.060 0.463 −0.030 0.773 2.665 15 15 0.033
HCHbO
(n = 19)
lDLPFC9 0.744 0.457 0.892 6.841 18 18 0.000 0.560 0.162 0.803 3.535 18 18 0.005 0.745 0.457 0.892 6.845 18 18 0.000rDLPFC9 0.529# 0.099 0.790 3.132 18 18 0.010 0.481 0.070 0.758 3.301 18 18 0.008 0.529# 0.099 0.790 3.133 18 18 0.010lDLPFC46 0.478 0.048 0.760 2.813 18 18 0.017 0.208 −0.273 0.600 1.508 18 18 0.196 0.478 0.049 0.760 2.816 18 18 0.017rDLPFC46 0.563 0.151 0.807 3.461 18 18 0.006 0.306◦ −0.124 0.652 1.944 18 18 0.084 0.563 0.151 0.807 3.466 18 18 0.006mDLPFC9 0.392# −0.083 0.715 2.221 18 18 0.050 0.062 −0.385 0.489 1.133 18 18 0.397 0.392# −0.083 0.715 2.220 18 18 0.050
lFPC10 0.612 0.223 0.831 4.001 18 18 0.003 0.343◦ −0.140 0.687 1.990 18 18 0.077 0.612 0.223 0.831 4.003 18 18 0.003rFPC10 0.507 0.087 0.775 3.040 18 18 0.012 0.492 0.054 0.769 2.861 18 18 0.016 0.368 −0.107 0.701 2.110 18 18 0.061mFPC10 0.615 0.228 0.833 4.044 18 18 0.002 0.512 0.074 0.781 2.989 18 18 0.013 0.616 0.228 0.833 4.046 18 18 0.002
HbR(n = 19)
lDLPFC9 0.548 0.153 0.796 3.488 18 18 0.006 0.395 −0.044 0.710 2.330 18 18 0.040 0.548 0.153 0.796 3.490 18 18 0.006rDLPFC9 0.533 0.122 0.789 3.258 18 18 0.008 0.543 0.134 0.795 3.334 18 18 0.007 0.533 0.122 0.789 3.261 18 18 0.008lDLPFC46 0.552 0.131 0.802 3.334 18 18 0.007 0.479 0.068 0.757 2.939 18 18 0.014 0.552 0.131 0.802 3.336 18 18 0.007rDLPFC46 0.522 0.090 0.786 3.076 18 18 0.011 0.331 −0.131 0.676 1.978 18 18 0.079 0.522 0.090 0.786 3.075 18 18 0.011mDLPFC9 0.418 −0.015 0.724 2.469 18 18 0.031 0.306 −0.179 0.664 1.841 18 18 0.102 0.417 −0.015 0.723 2.468 18 18 0.031
lFPC10 0.633 0.259 0.841 4.309 18 18 0.002 0.123 −0.360 0.544 1.270 18 18 0.309 0.633 0.259 0.841 4.307 18 18 0.002rFPC10 0.580 0.186 0.814 3.704 18 18 0.004 0.684 0.341 0.865 5.137 18 18 0.001 0.622# 0.245 0.836 4.182 18 18 0.002mFPC10 0.392 −0.061 0.712 2.272 18 18 0.045 0.206 −0.210 0.581 1.572 18 18 0.173 0.392 −0.062 0.712 2.270 18 18 0.045
MS: multiple sclerosis; HC: healthy controls; ICC: intraclass correlation coefficient; CI: confidence interval; df: degree of freedom; p: p-value; HbO: oxyhemoglobin; HbR: deoxyhemoglobin;l/r/mDLPFC9: left/right/medial dorsolateral prefrontal cortex Brodmann area 9; l/rDLPFC46: left/right dorsolateral prefrontal cortex Brodmann area 46; l/r/mFPC10: left/right/medialfrontopolar cortex Brodmann area 10; #: not normally distributed; bold: fair–excellent intraclass correlation coefficient.
Brain Sci. 2020, 10, 643 10 of 15
Table 4. Bland and Altman limits of agreement, bias and confidence intervals of both groups (MS/HC).
Bland and Altman(Test–Retest)
Mean Area Under the CurveUpper LoA Lower LoA Upper LoA Lower LoA
n Mean SD SE LoA UpperCI
LowerCI LoA Upper
CILower
CI Mean SD SE LoA UpperCI
LowerCI LoA Upper
CILower
CI
MS HbO[µmol/L]
rDLPFC9 16 −0.044 0.280 0.070 0.505 0.760 0.250 −0.592 −0.337 −0.847 −0.869 5.592 1.398 10.090 15.184 4.996 −11.829 −6.735 −16.923lDLPFC9 16 0.067 0.219 0.055 0.497 0.696 0.297 −0.362 −0.163 −0.562 1.341 4.378 1.094 9.921 13.909 5.933 −7.239 −3.251 −11.227
rDLPFC46 16 0.003 0.339 0.085 0.667 0.976 0.358 −0.661 −0.353 −0.970 0.057 6.767 1.692 13.320 19.485 7.155 −13.207 −7.042 −19.372lDLPFC46 16 0.099 0.282 0.071 0.652 0.909 0.395 −0.454 −0.197 −0.710 1.986 5.639 1.410 13.039 18.176 7.901 −9.067 −3.930 −14.204mDLPFC9 16 −0.020 0.174 0.044 0.322 0.481 0.163 −0.361 −0.203 −0.520 −0.395 3.486 0.871 6.437 9.613 3.262 −7.227 −4.052 −10.403
lFPC10 16 −0.044 0.266 0.066 0.477 0.719 0.235 −0.565 −0.323 −0.807 −0.879 5.309 1.327 9.526 14.363 4.690 −11.285 −6.449 −16.122rFPC10 16 −0.005 0.208 0.052 0.403 0.592 0.213 −0.412 −0.223 −0.601 −0.419 3.545 0.886 6.529 9.759 3.300 −7.368 −4.138 −10.597mFPC10 16 −0.008 0.299 0.075 0.578 0.851 0.306 −0.593 −0.321 −0.866 −0.152 5.967 1.492 11.543 16.978 6.107 −11.847 −6.411 −17.283
MS HbR[µmol/L]
rDLPFC9 16 0.002 0.046 0.012 0.092 0.134 0.050 −0.088 −0.046 −0.130 0.043 0.920 0.230 1.845 2.683 1.008 −1.759 −0.921 −2.597lDLPFC9 16 −0.025 0.072 0.018 0.116 0.181 0.050 −0.165 −0.100 −0.230 −0.497 1.431 0.358 2.308 3.612 1.004 −3.302 −1.998 −4.605
rDLPFC46 16 0.067 0.117 0.029 0.297 0.404 0.190 −0.163 −0.056 −0.270 1.342 2.344 0.586 5.937 8.073 3.802 −3.253 −1.117 −5.388lDLPFC46 16 −0.010 0.062 0.016 0.112 0.169 0.055 −0.133 −0.076 −0.189 −0.206 1.246 0.312 2.237 3.373 1.102 −2.649 −1.513 −3.785mDLPFC9 16 −0.001 0.056 0.014 0.109 0.161 0.058 −0.112 −0.060 −0.163 −0.021 1.128 0.282 2.189 3.216 1.162 −2.231 −1.204 −3.258
lFPC10 16 0.008 0.057 0.014 0.120 0.172 0.068 −0.104 −0.052 −0.156 0.156 1.142 0.285 2.394 3.434 1.354 −2.081 −1.041 −3.121rFPC10 16 0.026 0.054 0.014 0.133 0.182 0.083 −0.080 −0.031 −0.130 0.485 0.910 0.228 2.269 3.098 1.440 −1.299 −0.469 −2.128mFPC10 16 0.013 0.077 0.019 0.164 0.234 0.094 −0.138 −0.068 −0.208 0.258 1.543 0.386 3.283 4.688 1.877 −2.766 −1.360 −4.172
HC HbO[µmol/L]
rDLPFC9 19 0.008 0.244 0.056 0.486 0.689 0.282 −0.469 −0.265 −0.673 0.168 4.869 1.117 9.712 13.782 5.641 −9.375 −5.304 −13.445lDLPFC9 19 0.038 0.162 0.037 0.356 0.492 0.220 −0.280 −0.144 −0.416 0.763 3.243 0.744 7.119 9.829 4.408 −5.592 −2.882 −8.303
rDLPFC46 19 −0.022 0.241 0.055 0.451 0.653 0.249 −0.495 −0.294 −0.697 −0.444 4.822 1.106 9.007 13.038 4.976 −9.895 −5.864 −13.926lDLPFC46 19 0.049 0.236 0.054 0.512 0.710 0.315 −0.414 −0.217 −0.612 0.979 4.723 1.084 10.237 14.186 6.288 −8.278 −4.330 −12.227mDLPFC9 19 0.000 0.260 0.060 0.511 0.728 0.293 −0.510 −0.292 −0.728 0.006 5.206 1.194 10.209 14.562 5.857 −10.198 −5.846 −14.550
lFPC10 19 0.013 0.207 0.048 0.419 0.593 0.246 −0.393 −0.220 −0.567 0.262 4.144 0.951 8.384 11.849 4.920 −7.861 −4.397 −11.326rFPC10 19 0.038 0.182 0.042 0.396 0.548 0.243 −0.319 −0.167 −0.471 0.244 3.039 0.697 6.201 8.742 3.660 −5.713 −3.172 −8.254mFPC10 19 −0.010 0.164 0.038 0.311 0.448 0.174 −0.331 −0.194 −0.468 −0.196 3.272 0.751 6.218 8.954 3.483 −6.610 −3.874 −9.345
HC HbR[µmol/L]
rDLPFC9 19 −0.011 0.052 0.012 0.092 0.136 0.048 −0.114 −0.070 −0.157 −0.214 1.049 0.241 1.842 2.719 0.965 −2.270 −1.393 −3.147lDLPFC9 19 −0.014 0.051 0.012 0.085 0.128 0.043 −0.114 −0.071 −0.156 −0.285 1.015 0.233 1.704 2.552 0.855 −2.274 −1.426 −3.122
rDLPFC46 19 −0.004 0.063 0.015 0.120 0.173 0.067 −0.128 −0.075 −0.181 −0.083 1.267 0.291 2.400 3.459 1.341 −2.565 −1.506 −3.624lDLPFC46 19 0.001 0.072 0.017 0.142 0.203 0.082 −0.140 −0.080 −0.201 0.019 1.443 0.331 2.846 4.052 1.640 −2.809 −1.603 −4.015mDLPFC9 19 −0.016 0.057 0.013 0.096 0.144 0.048 −0.128 −0.080 −0.175 −0.316 1.140 0.262 1.918 2.871 0.965 −2.551 −1.598 −3.504
lFPC10 19 −0.005 0.045 0.010 0.084 0.122 0.046 −0.094 −0.056 −0.132 −0.103 0.907 0.208 1.674 2.432 0.916 −1.880 −1.122 −2.638rFPC10 19 0.011 0.061 0.014 0.131 0.182 0.080 −0.109 −0.058 −0.160 0.133 0.981 0.225 2.055 2.875 1.235 −1.790 −0.970 −2.610mFPC10 19 −0.012 0.064 0.015 0.113 0.166 0.059 −0.137 −0.084 −0.191 −0.247 1.275 0.292 2.251 3.317 1.186 −2.745 −1.680 −3.811
Brain Sci. 2020, 10, 643 11 of 15
Table 4. Cont.
Bland and Altman(Test–Retest)
Slope CoefficientUpper LoA Lower LoA
n Mean SD SE LoA upperCI
lowerCI LoA upper
CIlower
CI
MS HbO[µmol/L]
rDLPFC9 16 0.167 0.329 0.082 0.812 1.111 0.512 −0.478 −0.178 −0.777lDLPF9 16 0.385 0.225 0.056 0.826 1.031 0.621 −0.055 0.149 −0.260
rDLPFC46 16 −0.014 0.417 0.104 0.803 1.183 0.423 −0.831 −0.452 −1.211lDLPFC46 16 0.179 0.394 0.099 0.952 1.311 0.593 −0.594 −0.235 −0.953mDLPFC9 16 0.028 0.404 0.101 0.818 1.186 0.451 −0.763 −0.396 −1.131
lFPC10 16 0.022 0.247 0.062 0.506 0.731 0.281 −0.461 −0.236 −0.686rFPC10 16 −0.041 0.269 0.067 0.486 0.731 0.241 −0.568 −0.323 −0.813mFPC10 16 −0.033 0.296 0.074 0.547 0.817 0.278 −0.613 −0.343 −0.883
MS HbR[µmol/L]
rDLPFC9 16 −0.108 0.049 0.012 −0.012 0.033 −0.057 −0.205 −0.160 −0.249lDLPFC9 16 −0.105 0.073 0.018 0.038 0.104 −0.029 −0.248 −0.182 −0.315
rDLPFC46 16 0.062 0.144 0.036 0.345 0.477 0.213 −0.221 −0.090 −0.353lDLPFC46 16 −0.015 0.103 0.026 0.186 0.280 0.093 −0.217 −0.123 −0.311mDLPFC9 16 0.009 0.115 0.029 0.233 0.338 0.129 −0.216 −0.112 −0.321
lFPC10 16 −0.018 0.072 0.018 0.123 0.189 0.058 −0.159 −0.093 −0.224rFPC10 16 0.022 0.054 0.014 0.128 0.177 0.079 −0.085 −0.035 −0.134mFPC10 16 0.013 0.098 0.025 0.205 0.294 0.116 −0.179 −0.090 −0.269
HC HbO[µmol/L]
rDLPFC9 19 0.065 0.120 0.027 0.300 0.400 0.200 −0.169 −0.069 −0.270lDLPF9 19 −0.029 0.129 0.030 0.224 0.331 0.116 −0.281 −0.173 −0.388
rDLPFC46 19 −0.107 0.305 0.070 0.490 0.745 0.236 −0.704 −0.449 −0.959lDLPFC46 19 0.046 0.312 0.071 0.656 0.917 0.396 −0.565 −0.305 −0.826mDLPFC9 19 −0.071 0.284 0.065 0.486 0.724 0.248 −0.629 −0.391 −0.867
lFPC10 19 0.010 0.245 0.056 0.490 0.694 0.285 −0.469 −0.265 −0.674rFPC10 19 −0.018 0.154 0.035 0.284 0.413 0.155 −0.320 −0.191 −0.449mFPC10 19 −0.001 0.198 0.045 0.387 0.552 0.221 −0.388 −0.223 −0.553
HC HbR[µmol/L]
rDLPFC9 19 0.008 0.042 0.010 0.090 0.125 0.055 −0.074 −0.039 −0.109lDLPF9 19 0.012 0.043 0.010 0.097 0.133 0.060 −0.073 −0.037 −0.110
rDLPFC46 19 −0.016 0.083 0.019 0.147 0.216 0.077 −0.180 −0.110 −0.249lDLPFC46 19 −0.023 0.069 0.016 0.114 0.172 0.055 −0.159 −0.101 −0.217mDLPFC9 19 0.006 0.074 0.017 0.151 0.213 0.089 −0.140 −0.078 −0.202
lFPC10 19 −0.009 0.070 0.016 0.128 0.186 0.070 −0.145 −0.087 −0.203rFPC10 19 −0.005 0.045 0.010 0.084 0.121 0.046 −0.093 −0.055 −0.130mFPC10 19 −0.021 0.054 0.012 0.085 0.131 0.040 −0.128 −0.082 −0.173
MS: multiple sclerosis; HC: healthy control; CI: confidence interval; SD: standard deviation; SE: standard error; LoA: limits of agreement; HbO: oxyhemoglobin; HbR: deoxyhemoglobin;l/r/mDLPFC9: left/right/medial dorsolateral prefrontal cortex Brodmann area 9; l/rDLPFC46: left/right dorsolateral prefrontal cortex Brodmann area 46; l/r/mFPC10: left/right/medialfrontopolar cortex Brodmann area 10.
Brain Sci. 2020, 10, 643 12 of 15
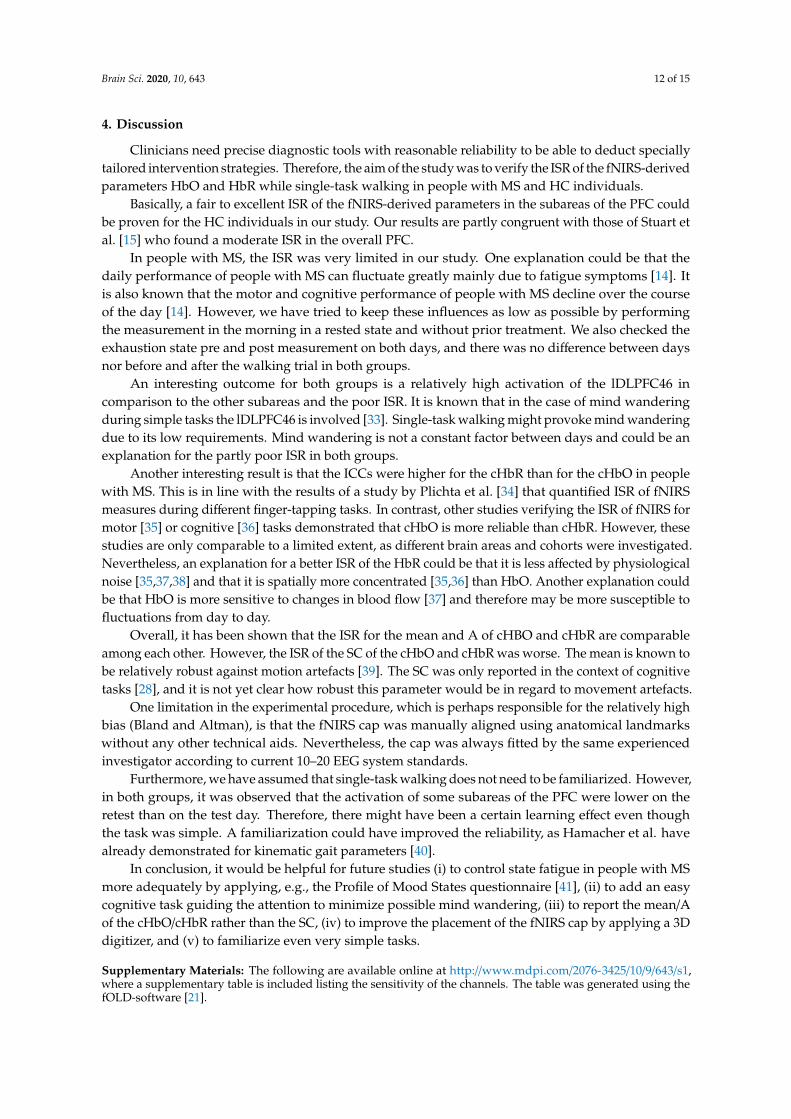
4. Discussion
Clinicians need precise diagnostic tools with reasonable reliability to be able to deduct speciallytailored intervention strategies. Therefore, the aim of the study was to verify the ISR of the fNIRS-derivedparameters HbO and HbR while single-task walking in people with MS and HC individuals.
Basically, a fair to excellent ISR of the fNIRS-derived parameters in the subareas of the PFC couldbe proven for the HC individuals in our study. Our results are partly congruent with those of Stuart etal. [15] who found a moderate ISR in the overall PFC.
In people with MS, the ISR was very limited in our study. One explanation could be that thedaily performance of people with MS can fluctuate greatly mainly due to fatigue symptoms [14]. Itis also known that the motor and cognitive performance of people with MS decline over the courseof the day [14]. However, we have tried to keep these influences as low as possible by performingthe measurement in the morning in a rested state and without prior treatment. We also checked theexhaustion state pre and post measurement on both days, and there was no difference between daysnor before and after the walking trial in both groups.
An interesting outcome for both groups is a relatively high activation of the lDLPFC46 incomparison to the other subareas and the poor ISR. It is known that in the case of mind wanderingduring simple tasks the lDLPFC46 is involved [33]. Single-task walking might provoke mind wanderingdue to its low requirements. Mind wandering is not a constant factor between days and could be anexplanation for the partly poor ISR in both groups.
Another interesting result is that the ICCs were higher for the cHbR than for the cHbO in peoplewith MS. This is in line with the results of a study by Plichta et al. [34] that quantified ISR of fNIRSmeasures during different finger-tapping tasks. In contrast, other studies verifying the ISR of fNIRS formotor [35] or cognitive [36] tasks demonstrated that cHbO is more reliable than cHbR. However, thesestudies are only comparable to a limited extent, as different brain areas and cohorts were investigated.Nevertheless, an explanation for a better ISR of the HbR could be that it is less affected by physiologicalnoise [35,37,38] and that it is spatially more concentrated [35,36] than HbO. Another explanation couldbe that HbO is more sensitive to changes in blood flow [37] and therefore may be more susceptible tofluctuations from day to day.
Overall, it has been shown that the ISR for the mean and A of cHBO and cHbR are comparableamong each other. However, the ISR of the SC of the cHbO and cHbR was worse. The mean is known tobe relatively robust against motion artefacts [39]. The SC was only reported in the context of cognitivetasks [28], and it is not yet clear how robust this parameter would be in regard to movement artefacts.
One limitation in the experimental procedure, which is perhaps responsible for the relatively highbias (Bland and Altman), is that the fNIRS cap was manually aligned using anatomical landmarkswithout any other technical aids. Nevertheless, the cap was always fitted by the same experiencedinvestigator according to current 10–20 EEG system standards.
Furthermore, we have assumed that single-task walking does not need to be familiarized. However,in both groups, it was observed that the activation of some subareas of the PFC were lower on theretest than on the test day. Therefore, there might have been a certain learning effect even thoughthe task was simple. A familiarization could have improved the reliability, as Hamacher et al. havealready demonstrated for kinematic gait parameters [40].
In conclusion, it would be helpful for future studies (i) to control state fatigue in people with MSmore adequately by applying, e.g., the Profile of Mood States questionnaire [41], (ii) to add an easycognitive task guiding the attention to minimize possible mind wandering, (iii) to report the mean/Aof the cHbO/cHbR rather than the SC, (iv) to improve the placement of the fNIRS cap by applying a 3Ddigitizer, and (v) to familiarize even very simple tasks.
Supplementary Materials: The following are available online at http://www.mdpi.com/2076-3425/10/9/643/s1,where a supplementary table is included listing the sensitivity of the channels. The table was generated using thefOLD-software [21].
Brain Sci. 2020, 10, 643 13 of 15
Author Contributions: Conceptualization, K.-C.B.; formal analysis, K.-C.B. and J.L.; investigation, K.-C.B.;methodology, K.-C.B.; project administration, L.S.; resources, K.-C.B. and L.S.; supervision, L.S.; validation, D.H.,M.S. and L.S.; visualization, K.-C.B.; writing—original draft, K.-C.B.; writing—review & editing, D.H., J.L., M.S.and L.S. All authors have read and agreed to the published version of the manuscript.
Funding: This research received no external funding.
Acknowledgments: There is nothing to declare. This research did not receive any specific grant from fundingagencies in the public, commercial, or not-for-profit sectors.
Conflicts of Interest: The authors declare no conflict of interest.
Abbreviations
6MWT 6-min walk testA area under the curveBA Brodmann areacHbO concentration of oxyhemoglobincHBR concentration of deoxyhemoglobinCI confidence intervaldf degree of freedomDLPFC dorsolateral prefrontal cortexEDSS Expanded Disability Status ScaleEEG electroencephalographyFD first diagnosisFM first manifestationfNIRS functional near-infrared spectroscopyfOLD fNIRS Optodes’ Location DeciderFPC frontopolar cortexHbO oxyhemoglobinHbR deoxyhemoglobinHC individuals healthy control individualsHR heart rateHRF hemodynamic response functionHRV heart rate variabilityICC intraclass correlation coefficientl leftLF/HF low frequency/high frequencyLoA limits of agreementm medialMS multiple sclerosisMSWS-12 12-Item Multiple Sclerosis Walking ScaleOvGU Otto von Guericke UniversityPFC prefrontal cortexpeople with MS people with MSr rightSC slope coefficientISR inter-session reliability
References
1. LaRocca, N.G. Impact of walking impairment in multiple sclerosis: Perspectives of patients and care partners.Patient 2011, 4, 189–201. [CrossRef] [PubMed]
2. Benedetti, M.G.; Piperno, R.; Simoncini, L.; Bonato, P.; Tonini, A.; Giannini, S. Gait abnormalities in minimallyimpaired multiple sclerosis patients. Mult. Scler. J. 1999, 5, 363–368. [CrossRef] [PubMed]
3. Clark, D.J. Automaticity of walking: Functional significance, mechanisms, measurement and rehabilitationstrategies. Front. Hum. Neurosci. 2015, 9, 246. [CrossRef]
Brain Sci. 2020, 10, 643 14 of 15
4. Rochester, L.; Baker, K.; Hetherington, V.; Jones, D.; Willems, A.-M.; Kwakkel, G.; van Wegen, E.; Lim, I.;Nieuwboer, A. Evidence for motor learning in Parkinson’s disease: Acquisition, automaticity and retentionof cued gait performance after training with external rhythmical cues. Brain Res. 2010, 1319, 103–111.[CrossRef] [PubMed]
5. Yogev, G.; Hausdorff, J.M.; Giladi, N. The Role of Executive Function and Attention in Gait. Mov. Disord.2008, 23, 329–472. [CrossRef]
6. Gramann, K.; Ferris, D.P.; Gwin, J.; Makeig, S. Imaging natural cognition in action. Int. J. Psychophysiol. 2014,91, 22–29. [CrossRef]
7. Hamacher, D.; Herold, F.; Wiegel, P.; Hamacher, D.; Schega, L. Brain activity during walking: A systematicreview. Neurosci. Biobehav. Rev. 2015, 57, 310–327. [CrossRef]
8. Ferrari, M.; Quaresima, V. A brief review on the history of human functional near-infrared spectroscopy(fNIRS) development and fields of application. NeuroImage 2012, 63, 921–935. [CrossRef]
9. Gramigna, V.; Pellegrino, G.; Cerasa, A.; Cutini, S.; Vasta, R.; Olivadese, G.; Martino, I.; Quattrone, A.Near-Infrared Spectroscopy in Gait Disorders: Is It Time to Begin? Neurorehabil. Neural Repair 2017, 31,402–412. [CrossRef]
10. Izzetoglu, M.; Bunce, S.; Izzetoglu, K.; Onaral, B.; Pourrezaei, A. Functional brain imaging using near-infraredtechnology. IEEE Eng. Med. Biol. Mag. 2007, 26, 38–46. [CrossRef]
11. Strangman, G.; Culver, J.P.; Thompson, J.H.; Boas, D.A. A Quantitative Comparison of Simultaneous BOLDfMRI and NIRS Recordings during Functional Brain Activation. NeuroImage 2002, 17, 719–731. [CrossRef][PubMed]
12. Hernandez, M.E.; Holtzer, R.; Chaparro, G.; Jean, K.; Balto, J.M.; Sandroff, B.M.; Izzetoglu, M.; Motl, R.W. Brainactivation changes during locomotion in middle-aged to older adults with multiple sclerosis. J. Neurol. Sci.2016, 370, 277–283. [CrossRef] [PubMed]
13. Chaparro, G.; Balto, J.M.; Sandroff, B.M.; Holtzer, R.; Izzetoglu, M.; Motl, R.W.; Hernandez, M.E. Frontalbrain activation changes due to dual-tasking under partial body weight support conditions in older adultswith multiple sclerosis. J. NeuroEng. Rehabil. 2017, 14, 65. [CrossRef]
14. Powell, D.J.H.; Liossi, C.; Schlotz, W.; Moss-Morris, R. Tracking daily fatigue fluctuations in multiple sclerosis:Ecological momentary assessment provides unique insights. J. Behav. Med. 2017, 40, 772–783. [CrossRef]
15. Stuart, S.; Belluscio, V.; Quinn, J.F.; Mancini, M. Pre-frontal Cortical Activity During Walking and Turning IsReliable and Differentiates Across Young, Older Adults and People With Parkinson’s Disease. Front. Neurol.2019, 10, 536. [CrossRef]
16. Polman, C.H.; Reingold, S.C.; Banwell, B.; Clanet, M.; Cohen, J.A.; Filippi, M.; Fujihara, K.; Havrdova, E.;Hutchinson, M.; Kappos, L.; et al. Diagnostic criteria for multiple sclerosis: 2010 Revisions to the McDonaldcriteria. Ann. Neurol. 2011, 69, 292–302. [CrossRef] [PubMed]
17. Kurtzke, J.F. Rating neurologic impairment in multiple sclerosis: An expanded disability status scale (EDSS).Neurology 1983, 33, 1444–1452. [CrossRef]
18. Wetzel, J.L.; Fry, D.K.; Pfalzer, L.A. Six-minute walk test for persons with mild or moderate disability frommultiple sclerosis: Performance and explanatory factors. Physiother. Can. 2011, 63, 166–180. [CrossRef]
19. Hobart, J.C.; Riazi, A.; Lamping, D.L.; Fitzpatrick, R.; Thompson, A.J. Measuring the impact of MS onwalking ability: The 12-Item MS Walking Scale (MSWS-12). Neurology 2003, 60, 31–36. [CrossRef]
20. Borg, G. Borg’s Perceived Exertion and Pain Scales; Human Kinetics: Champaign, IL, USA, 1998;ISBN 0880116234.
21. Zimeo Morais, G.A.; Balardin, J.B.; Sato, J.R. fNIRS Optodes’ Location Decider (fOLD): A toolbox for probearrangement guided by brain regions-of-interest. Sci. Rep. 2018, 8, 3341. [CrossRef]
22. Scholkmann, F.; Kleiser, S.; Metz, A.J.; Zimmermann, R.; Mata Pavia, J.; Wolf, U.; Wolf, M. A review oncontinuous wave functional near-infrared spectroscopy and imaging instrumentation and methodology.NeuroImage 2014, 85, 6–27. [CrossRef] [PubMed]
23. Huppert, T.J.; Diamond, S.G.; Franceschini, M.A.; Boas, D.A. HomER: A review of time-series analysismethods for near-infrared spectroscopy of the brain. Appl. Opt. 2009, 48, D280–D298. [CrossRef]
24. Jahani, S.; Setarehdan, S.K.; Boas, D.A.; Yücel, M.A. Motion artifact detection and correction in functionalnear-infrared spectroscopy: A new hybrid method based on spline interpolation method and Savitzky-Golayfiltering. Neurophotonics 2018, 5, 15003. [CrossRef]
Brain Sci. 2020, 10, 643 15 of 15
25. Herold, F.; Wiegel, P.; Scholkmann, F.; Thiers, A.; Hamacher, D.; Schega, L. Functional near-infraredspectroscopy in movement science: A systematic review on cortical activity in postural and walking tasks.Neurophotonics 2017, 4, 041403. [CrossRef]
26. Scholkmann, F.; Wolf, M. General equation for the differential pathlength factor of the frontal human headdepending on wavelength and age. J. Biomed. Opt. 2013, 18, 105004. [CrossRef]
27. Ye, J.C.; Tak, S.; Jang, K.E.; Jung, J.; Jang, J. NIRS-SPM: Statistical parametric mapping for near-infraredspectroscopy. NeuroImage 2009, 44, 428–447. [CrossRef] [PubMed]
28. Mandrick, K.; Derosiere, G.; Dray, G.; Coulon, D.; Micallef, J.P.; Perrey, S. Utilizing slope method as analternative data analysis for functional near-infrared spectroscopy-derived cerebral hemodynamic responses.Int. J. Ind. Ergon. 2013, 43, 335–341. [CrossRef]
29. Gagnon, C.; Desjardins-Crépeau, L.; Tournier, I.; Desjardins, M.; Lesage, F.; Greenwood, C.E.; Bherer, L.Near-infrared imaging of the effects of glucose ingestion and regulation on prefrontal activation duringdual-task execution in healthy fasting older adults. Behav. Brain Res. 2012, 232, 137–147. [CrossRef]
30. Koo, T.K.; Li, M.Y. A Guideline of Selecting and Reporting Intraclass Correlation Coefficients for ReliabilityResearch. J. Chiropr. Med. 2016, 15, 155–163. [CrossRef] [PubMed]
31. Cicchetti, D.V. Guidelines, Criteria, and Rules of Thumb for Evaluating Normed and Standardized AssessmentInstruments in Psychology. Psychol. Assess. 1994, 6, 284–290. [CrossRef]
32. Bland, J.M.; Altman, D.G. Statistical methods for assessing agreement between two methods of clinicalmeasurement. Lancet 1986, 327, 307–310. [CrossRef]
33. Turnbull, A.; Wang, H.T.; Murphy, C.; Ho, N.S.P.; Wang, X.; Sormaz, M.; Karapanagiotidis, T.; Leech, R.M.;Bernhardt, B.; Margulies, D.S.; et al. Left dorsolateral prefrontal cortex supports context-dependentprioritisation of off-task thought. Nat. Commun. 2019, 10, 3816. [CrossRef] [PubMed]
34. Plichta, M.M.; Herrmann, M.J.; Baehne, C.G.; Ehlis, A.C.; Richter, M.M.; Pauli, P.; Fallgatter, A.J. Event-relatedfunctional near-infrared spectroscopy (fNIRS) based on craniocerebral correlations: Reproducibility ofactivation? Hum. Brain Mapp. 2007, 28, 733–741. [CrossRef]
35. Dravida, S.; Noah, J.A.; Zhang, X.; Hirsch, J. Comparison of oxyhemoglobin and deoxyhemoglobin signalreliability with and without global mean removal for digit manipulation motor tasks. Neurophotonics2018, 5, 11006. [CrossRef]
36. Plichta, M.M.; Herrmann, M.J.; Baehne, C.G.; Ehlis, A.C.; Richter, M.M.; Pauli, P.; Fallgatter, A.J. Event-relatedfunctional near-infrared spectroscopy (fNIRS): Are the measurements reliable? NeuroImage 2006, 31, 116–124.[CrossRef] [PubMed]
37. Herold, F.; Wiegel, P.; Scholkmann, F.; Müller, N.G. Applications of Functional Near-Infrared Spectroscopy(fNIRS) Neuroimaging in Exercise-Cognition Science: A Systematic, Methodology-Focused Review.J. Clin. Med. 2018, 7, 466. [CrossRef]
38. Kirilina, E.; Jelzow, A.; Heine, A.; Niessing, M.; Wabnitz, H.; Brühl, R.; Ittermann, B.; Jacobs, A.M.; Tachtsidis, I.The physiological origin of task-evoked systemic artefacts in functional near infrared spectroscopy. NeuroImage2012, 61, 70–81. [CrossRef]
39. Vitorio, R.; Stuart, S.; Rochester, L.; Alcock, L.; Pantall, A. fNIRS response during walking—Artefact orcortical activity? A systematic review. Neurosci. Biobehav. Rev. 2017, 83, 160–172. [CrossRef]
40. Hamacher, D.; Hamacher, D.; Krowicki, M.; Schega, L. Between-day test–retest reliability of gait variabilityin older individuals improves with a familiarization trial. Aging Clin. Exp. Res. 2017, 29, 327–329. [CrossRef]
41. McNair, D.; Lorr, M.; Droppleman, L. Manual for Profile of Mood States; Educational and Industrial TestingServices: San Diego, CA, USA, 1992.
© 2020 by the authors. Licensee MDPI, Basel, Switzerland. This article is an open accessarticle distributed under the terms and conditions of the Creative Commons Attribution(CC BY) license (http://creativecommons.org/licenses/by/4.0/).