Embed Size (px)
Citation preview
INTER-RELATIONSHIP BETWEEN ECONOMIC GROWTH, SAVINGS AND INFLATION IN ASIA
Vaibhav Chaturvedi Brajesh Kumar
Ravindra H. Dholakia
W.P. No. 2008-07-01 July 2008
The main objective of the working paper series of the IIMA is to help faculty members, research staff and doctoral students to speedily share their research findings with professional colleagues and test their research findings at the pre-publication stage. IIMA is committed to
maintain academic freedom. The opinion(s), view(s) and conclusion(s) expressed in the working paper are those of the authors and not that of IIMA.
INDIAN INSTITUTE OF MANAGEMENT AHMEDABAD INDIA
Research and Publications
INDIAN INSTITUTE OF MANAGEMENT AHMEDABAD-380 015
INDIA
IIMA INDIA Research and Publications
INTER-RELATIONSHIP BETWEEN ECONOMIC
GROWTH, SAVINGS AND INFLATION IN ASIA
Vaibhav Chaturvedi1
Brajesh Kumar2
Ravindra H. Dholakia3
Abstract
The present study examines the inter- relationship between economic growth, saving rate and
inflation for south-east and south Asia in a simultaneous equation framework using two stage
least squares with panel data. The relationship between saving rate and growth has been found to
be bi-directional and positive. Inflation has a highly significant negative effect on growth but
positive effect on saving rate. Inflation is not affected by growth but is largely determined by its
past values, and saving rate is not affected by interest rate. These findings for countries in Asia
with widely divergent values of aggregates are very relevant for development policies and
strategies.
JEL classification: C33; E21; E31; E60; O57
Keywords: Growth; Savings; Inflation; Asia; Simultaneity; Fixed-Effect
1 Doctoral Student, Indian Institute of Management Ahmedabad, India (e-mail- vaibhavc@iimahd,ernet.in) 2 Doctoral Student, Indian Institute of Management Ahmedabad, India (e-mail- brajeshk@iimahd,ernet.in) 3 Professor, Economics Area, Indian Institute of Management Ahmedabad, India (e-mail- rdholkia@iimahd,ernet.in)
Page No. 2
W.P. No. 2008-07-01
IIMA INDIA Research and Publications
1. Introduction
Growth experience in south-east and south Asia has generated keen interest among economists
and policy makers for the last two decades. Numerous macroeconomic factors affecting
economic growth like inflation, savings, foreign exchange rate, etc. have widely varying values
across these nations and so also their economic growth. However, almost all these nations are
growing at relatively fast rate. Since the growth in some of these economies is often considered
resource intensive rather than technology intensive (see, Rosegrant and Evenson,. 1992; The
World Bank, 2007), savings are likely to play a very important role in promoting real growth.
Several empirical studies found a positive effect of the saving rate on the long term growth
(Page, 1994; Cardenas and Escobar, 1998; Motely, 1994; and Krieckhaus, 2002) though the
neo-classical growth theory predicted only temporary positive effect of increased saving rate on
the growth rate in the economy due to corresponding negative effect on capital productivity.
The endogenous growth theory (see, Barro and Sala-i-Martin, 1995; and Romer, 2006) de-
linking the capital productivity from the savings, explained such positive relationship between
long term growth and saving rate. Even the life cycle theory for savings would explain the
positive relationship between savings and income growth (Loayza et al., 2000). It is, then,
important for the policy makers to know what determines the saving rate in order to formulate
appropriate policies to promote economic growth. Edwards (1996) found that the level and
rates of growth of the GDP were important determinants of savings and discussed the
possibility of a bi-directional relationship. The possibility that some other factor affects both
growth and savings cannot be ruled out. Literature suggests inflation as one such factor (see,
Deaton, 1977; Chopra, 1988; Haslag, 1997; Heer and Suessmuth, 2006; etc.). Does the stability
of macroeconomic environment as reflected by inflation play a substantial role in promoting the
saving rate and the growth rate?
The effect of inflation on savings, however, is ambiguous both in theory and practice (Heer and
Suessmuth, 2006; and Deaton and Paxson, 1993). Empirical evidence about the relationship of
inflation and growth differs with some studies finding a negligible effect of inflation on growth
(e.g. Chari et al., 1996), some finding a negative effect (Chopra, 1988; Fischer, 1993; Gylfason
and Herbertsson, 2001) and some studies providing an evidence of positive effect (Dholakia,
1995; Mallik and Chowdhury, 2001). The effect of inflation on economic growth in theory is
largely through the sub-optimal use of resources and distorted investment decisions due to
inflation (Miller and Benjamin, 2008; Paul et. al., 1997). However, economic growth leading
to high inflation through overheating of the economy is also found in practice. In a supply
constrained closed economy, on the other hand, higher growth can lead to reduced inflation
Page No.3 W.P. No. 2008-07-01
IIMA INDIA Research and Publications
(Dholakia R. H., 1990). Thus, the relationship between growth and inflation may also be bi-
directional. This ambiguous relationship between inflation and growth implies that though
rising inflation may have associated growth costs, policy efforts to contain inflation could
negatively affect growth. On the other hand, allowing inflation at higher rates could lead to
higher growth although it may cause some distorted choices. Relationship between inflation
and savings is critical in understanding this complex trade-off between growth and inflation
particularly for the policy makers.
Growth, savings and inflation are interrelated variables as discussed above and should,
therefore, be endogenously determined simultaneously in the system. However, most of the
studies on these variables do not analyze them in a simultaneous equation framework. It is
important for a policy maker to understand the dynamics among economic growth, savings and
inflation in the system. Specifically, answers to the following questions are crucial: (i) Is there
simultaneity between economic growth and savings? (ii) Is the relationship between economic
growth and inflation bi-directional or unidirectional? (iii) What is the direction of causality,
sign and magnitude of relationship between these variables? The present paper tries to examine
these questions in a simultaneous equation framework for 13 south-east and south Asian
economies for the period, 1989 to 2003. The selected sample shows wide variations among all
these variables not only across countries but also over time within a country. The panel data
analysis used in the current study would overcome several limitations of the empirical
evidences presented earlier.
In what follows, Section 2 outlines the theories and empirical results discussing channels
through which economic growth and inflation, and savings and inflation are inter-related.
Section 3 deals with the conceptual framework and regression model, detailing upon the
various other predictor variables as well as the functional form used in this paper. Section 4
discusses some statistical issues in estimation. Section 5 presents and analyzes the results of the
regression model with focus on economic growth, inflation, and savings and their inter-
relationship with each other. The individual country and year effects are also discussed in this
section. Finally, section 6 concludes and discusses some policy implications arising out of the
study.
Page No.4 W.P. No. 2008-07-01
IIMA INDIA Research and Publications
2. Inflation with Growth and Savings: Theory and Empirical Evidence
Growth and Inflation
There are broadly two types of theoretical expectations concerning the effect of change in
average inflation level on output growth (Chari et al., 1996). One expectation, based on
exogenous growth models, is that inflation rate will have no effect on the growth rate as well as
the level of output. As opposed to this, the endogenous growth models emphasize that money
and inflation do affect the growth rate of output itself. There are two channels for such an
effect. One argument is known as the Mundell-Tobin effect in which a more inflationary policy
enhances growth as investors move out of money and into growth enhancing capital
investment. This is because inflation reduces the wealth of people, and for accumulating the
desired wealth, people save more, decreasing real interest rate and driving up capital
accumulation (Haslag, 1997). It is possible, however, to argue that inflation in such a case
would affect savings and investment decisions essentially by increasing the uncertainties with
regard to the real rates of return. This can actually reduce the productive capital and hurt the
output growth (Motley, 1994; and Miller and Benjamin, 2008).
The structural argument, on the other hand, emphasizes that inflation promotes real growth.
There are two possible justifications stemming from two schools of thoughts- (i) in fixed
prices Keynesian economies, inflation can induce growth by redistributing profits from workers
with low saving propensities to entrepreneurs with high propensities to save and invest, and by
increasing the nominal rates of return relative to the cost; and (ii) in economies with flexible
prices, inflation can redistribute money from holders of money balance to the monetary
authorities, a phenomenon also known as inflation tax that helps governments to expand their
investment programs and thereby increase growth. As against this, the alternative view is that
inflation retards growth. The arguments supporting this view are that: (i) high inflation rates
raise the cost and risk of productive capital, and may lead to misallocation of funds to less
productive investments that act as a hedge against inflation (Chopra, 1988); and (ii) high
inflation rates along with managed exchange rates lead to trade imbalances and speculative
capital outflows affecting the economy’s growth (Paul et al., 1997). Gillman and Kejak (2002)
find the negative relationship between inflation and growth. Roubini and Sala-i-Martin (1992),
on the other hand, argue that the findings by various studies about the negative link between
inflation and growth, if not carefully established, can be spurious since both high inflation and
low growth are often caused by the policies of financial repression.
Page No.5 W.P. No. 2008-07-01
IIMA INDIA Research and Publications
Most of the studies examining the relationship between inflation and growth end up focusing
on the effect of inflation on savings and investments and thereby on the growth of the economy,
assuming independence of the incremental capital output ratio (ICOR) from inflation. Except
Chopra (1988), the ICOR channel of the effect of inflation on growth is not seriously examined
in the literature. Thus, if inflation leads saving rate to increase and ICOR to decrease, inflation
will definitely promote growth, but the reverse would be true if saving ratio decreases and
ICOR increases with inflation. If both these variables increase or decrease simultaneously as a
result of inflation, the magnitude of the statistical impact of inflation on these two variables
would determine the sign of the relationship between inflation and growth. Chopra (1988)
argued that inflation would affect the ICOR by changes in the composition of output produced
as a result of households shifting from financial savings to physical savings or consumer
durables in an economy. This would lead to shifts of investment from low capital intensive
industries to high capital intensive industries, increasing the capital output ratio in the economy.
Thus, inflation is likely to increase the ICOR.
Savings and Inflation
The effect of inflation on savings depends on the way households react to increase in inflation
(Chopra, 1988). If households direct their savings from financial to physical assets and
consumer durables, then due to consumption associated with these consumer durables, present
savings will decline. Also, due to increased uncertainty, the utility from holding wealth declines
leading to increased consumption and decreased savings. On the other hand, wealth owners
interested in maintaining the real value of their wealth would increase their savings in an
inflationary scenario to maintain the desired amount. In the context of the life cycle theory of
savings, if the economy does not have a detailed and well established institutional structure or
network for social security, healthcare, etc., inflation would induce higher savings in the system
(Chopra, 1988).
Most of the models analyzing the effect of inflation on savings find a considerably negative
effect (Heer and Suessmuth, 2006). If the incomes are not indexed, unanticipated inflation will
cause unanticipated cuts in the real income and hence decreased the saving rates (Deaton,
1977). Also, high inflation can increase the opportunity cost of holding money and increase the
rewards for the search activities in shopping wasting real resources and thereby reducing
savings (Miller and Benjamin, 2008). As against this, another theory proposes that if the real
income is correctly anticipated either by indexation or wage inflation, unanticipated inflation
will increase the saving rate. Inflation is a good proxy for macroeconomic uncertainty. Higher
uncertainty induces people to save a larger portion of their money for precautionary motives.
Page No.6 W.P. No. 2008-07-01
IIMA INDIA Research and Publications
Thus rise in inflation should have a positive coefficient. Savings will also increase if there are
lifecycle factors promoting savings (Deaton and Paxson, 1993). If, however, one believes in
the super-neutrality of money in the ultimate sense, inflation cannot have any effect on savings
in the long run (Heer and Suessmuth, 2006).
3. Conceptual Framework
Apart from the saving rate and inflation, there are demographic variables also which have been
found to be instrumental in affecting the growth rate. Bloom et. al. (1999) emphasize the
importance of ‘age structure’ on the economic growth. Age structure implies the distribution of
population amongst various age categories. The people falling in working age group earn for
the old people and the children, who can be categorized as dependents. The ‘dependency ratio’,
signifying the proportion of population dependent on the working age persons can be a very
important factor affecting the saving rate and also the economic growth of a country, if
accompanied by increasing labor productivity. Adult literacy rate is a reflection of better human
capital and hence higher labor productivity.
In the increasingly globalised world, trade has become one of the most important sources of
growth and efficient allocation of resources. The degree of openness hence becomes very
important for a country’s growth. Similarly, the convergence hypothesis suggests that the level
of GDP would determine whether the country will grow at a high or a low rate (Barro and Sala-
i-Martin, 1995). Many models of growth neglect monetary variables and include only the real
variables. However, this is justified only if the monetary variables have no effect on the real
variables of the system, i.e. neutrality of money, a concept which has been debated for long
(Sidrauski, 1967). The impact of money growth on the output growth is modeled through
inflation (Paul et al., 1997).
Savings are affected by many variables, the prominent being income, real rates of return,
inflation, as well as demographics (Loayza et al., 2000). Savings is dependent on the level of
income as well as the growth of income. In the determination of inflation, along with money
supply growth, past values of inflation as per the adaptive expectations hypothesis are also
considered. In the formulation of our regression model, money supply is included in the
equation for inflation and not in the growth equation. This is because inflation is explicitly
considered in the growth equation where the production function approach using money as an
input augmenting variable is not appropriate.
Page No.7 W.P. No. 2008-07-01
IIMA INDIA Research and Publications
3.1 Functional Form
Regarding choice of the functional form, especially for inflation, there have been many
different forms used, varying from simple inflation to log of inflation, to log of ‘1 + inflation’4.
The problem with log form is that it is undefined for negative values and ‘1+log’ is arbitrary.
Using the inflation rate straight away could be problematic if there are high inflation rates
present in the data because the distribution could, then, be skewed, which can be normalized by
using the log transformation (Gillman et al., 2001). In another study (Loayza et al., 2000), the
inflation rates more than 50% have been eliminated to avoid such problems. However, in our
case, it was found that not many observations of inflation were above 50% and hence there was
no need for any kind of transformation.
The model being estimated is -
Per Capita Real GDP Growth Rate = a1 + b1 * Log Per Capita Real GDP with Lag +
c1 * Inflation Rate + d1 * Saving Rate + e1 * Openness Ratio + f1 * Population Growth Rate+
g1 * Dependency Ratio + h1 * Adult Literacy Rate + i1 * Nominal Depreciation Rate + error
-------------------------------------------------------------- (1)
Saving Rate = a3 + b3 * Log Per Capita Real GDP + c3 * Per Capita Real GDP Growth Rate
+ d3 * Real Interest Rate + e3 * Inflation Rate + f3 * Dependency Ratio + error
---------------------------------------------------------------------------------- (2)
Inflation Rate = a2 + b2 * Money Supply Growth Rate + c2 * Per Capita Real GDP Growth
Rate + d2 * Inflation with Lag + e2* Nominal Depreciation Rate + error
---------------------------------------------------------------------------------- (3)
There are three equations in this system and there are interrelationships between the three
variables- per capita real GDP growth rate, saving rate and inflation rate. The model involves
presence of simultaneous effect between per capita real GDP growth rate and saving rate, per
capita real GDP growth rate and inflation rate.
4 There is however a different interpretation and effect of using the log versus linear model. In the linear model, additive inflation shocks will have same effect on all rich or poor economies, whereas in the log model multiplicative inflation shocks will have the same effect on all economies. E.g. in the linear model, an increase in the inflation rate by say 5% will have the same effect on two economies in which one is at an initial inflation level of 10% while the other is on 50%. But as per the log model, only doubling the inflation rate will have the same effect on growth of two economies at a very different level of inflation (Khan and Senhadji, 2001).
Page No.8 W.P. No. 2008-07-01
IIMA INDIA Research and Publications
3.2 Data and Variables
The study is based on the developing countries pursuing the policies to achieve rapid growth
from the south-east and south Asia region. The choice of the countries was also restricted by
availability of required data on all variables over the selected period. There are 13 countries
satisfying these criteria from the region for 15 years, i.e. from 1989 to 2003. The following
countries are considered - Bangladesh, China, Hong Kong, India, Korea, Malaysia, Maldives,
Nepal, Pakistan, Philippines, Singapore, Sri Lanka, and Thailand. The figures for per capita real
GDP and its growth have been taken from Penn World Tables, while all the other data,
excluding dependency ratio and adult literacy rate, have been taken from the Asian
Development Bank. The dependency ratio and adult literacy rate values have been taken from
various census estimates for different countries, as well as UNICEF and World Bank statistics.
The missing values (especially in dependency ratio and adult literacy ratio as these statistics are
mostly calculated with a gap of a few years) have been substituted after studying the trend of
the variable for that country. If the trend is increasing or decreasing, missing values have been
computed by extrapolation assuming constant growth or decline. In case the trend is
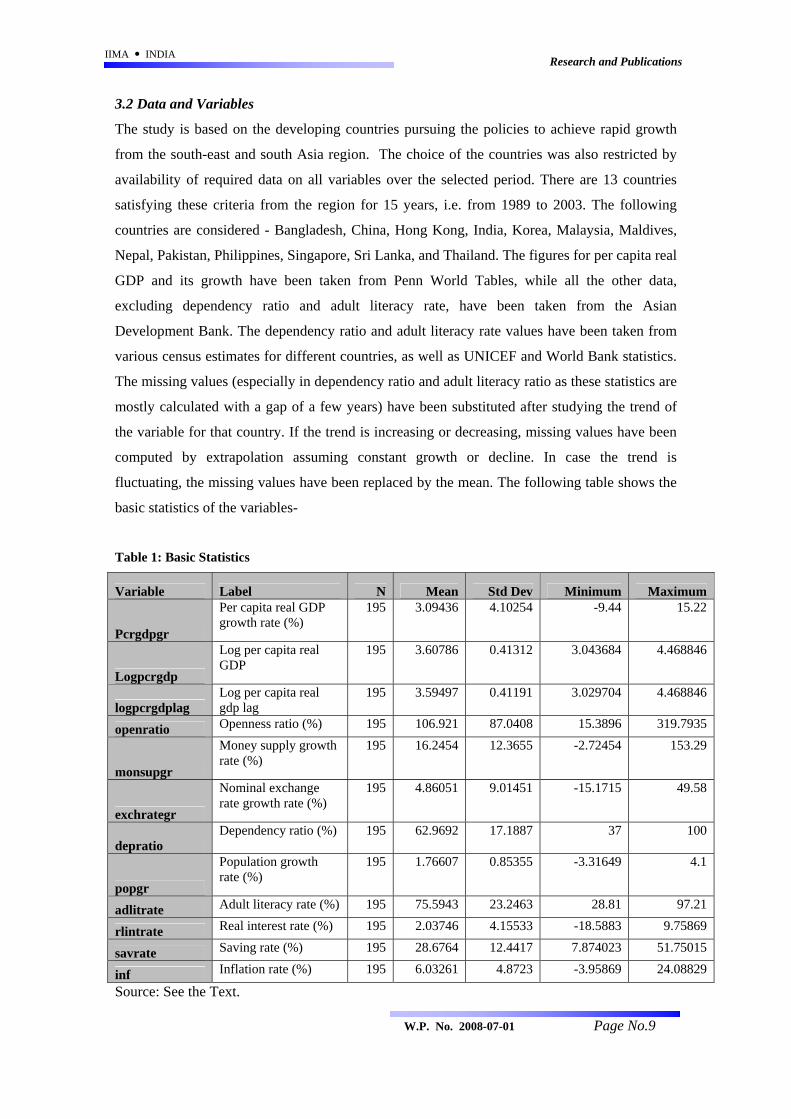
fluctuating, the missing values have been replaced by the mean. The following table shows the
basic statistics of the variables-
Table 1: Basic Statistics
Variable Label N Mean Std Dev Minimum Maximum
Pcrgdpgr
Per capita real GDP growth rate (%)
195 3.09436 4.10254 -9.44 15.22
Logpcrgdp
Log per capita real GDP
195 3.60786 0.41312 3.043684 4.468846
logpcrgdplag Log per capita real gdp lag
195 3.59497 0.41191 3.029704 4.468846
openratio Openness ratio (%) 195 106.921 87.0408 15.3896 319.7935
monsupgr
Money supply growth rate (%)
195 16.2454 12.3655 -2.72454 153.29
exchrategr
Nominal exchange rate growth rate (%)
195 4.86051 9.01451 -15.1715 49.58
depratio Dependency ratio (%) 195 62.9692 17.1887 37 100
popgr
Population growth rate (%)
195 1.76607 0.85355 -3.31649 4.1
adlitrate Adult literacy rate (%) 195 75.5943 23.2463 28.81 97.21
rlintrate Real interest rate (%) 195 2.03746 4.15533 -18.5883 9.75869
savrate Saving rate (%) 195 28.6764 12.4417 7.874023 51.75015
inf Inflation rate (%) 195 6.03261 4.8723 -3.95869 24.08829
Source: See the Text. Page No.9 W.P. No. 2008-07-01
IIMA INDIA Research and Publications
Percentage change in consumer price index has been taken as inflation. Gross domestic savings
figures have been used for saving rate. Money supply growth is the growth in M2 stock of the
country. Real interest rates have been calculated by subtracting inflation (CPI) from the interest
rate on demand deposits of 12 months as end of period. For China, CPI has been subtracted
from interest rates on borrowings from the external sector (due to unavailability of interest rates
on demand and other deposits). Openness ratio is the sum of exports and imports over GDP.
Dependency ratio is the number of persons under age 15 and over age 65 per 100 of those aged
between 15 to 64 years. Adult literacy rate implies percentage of persons aged 15 and over who
can read and write. Exchange rate is in nominal terms and is the yearly average of local
currency value of dollar. Depreciation rate is the growth rate of the so-defined exchange rate.
All the values are in percentage terms instead of ratios.
4. Estimation Issues
The model involves three simultaneous equations which have been jointly estimated using a
2SLS estimation procedure. The choice between fixed and random effects model for analyzing
the panel data, and tackling the auto-regression bias has been explained below.
4.1 Pooled v/s Individual Effects
Panel data consisting of 13 countries of Asia for 15 years, from 1989 to 2003 has been used in
the study. The regression model can assume that there are individual country and time effects
present, or these effects are absent in the data. If these effects are missing, then a simply pooled
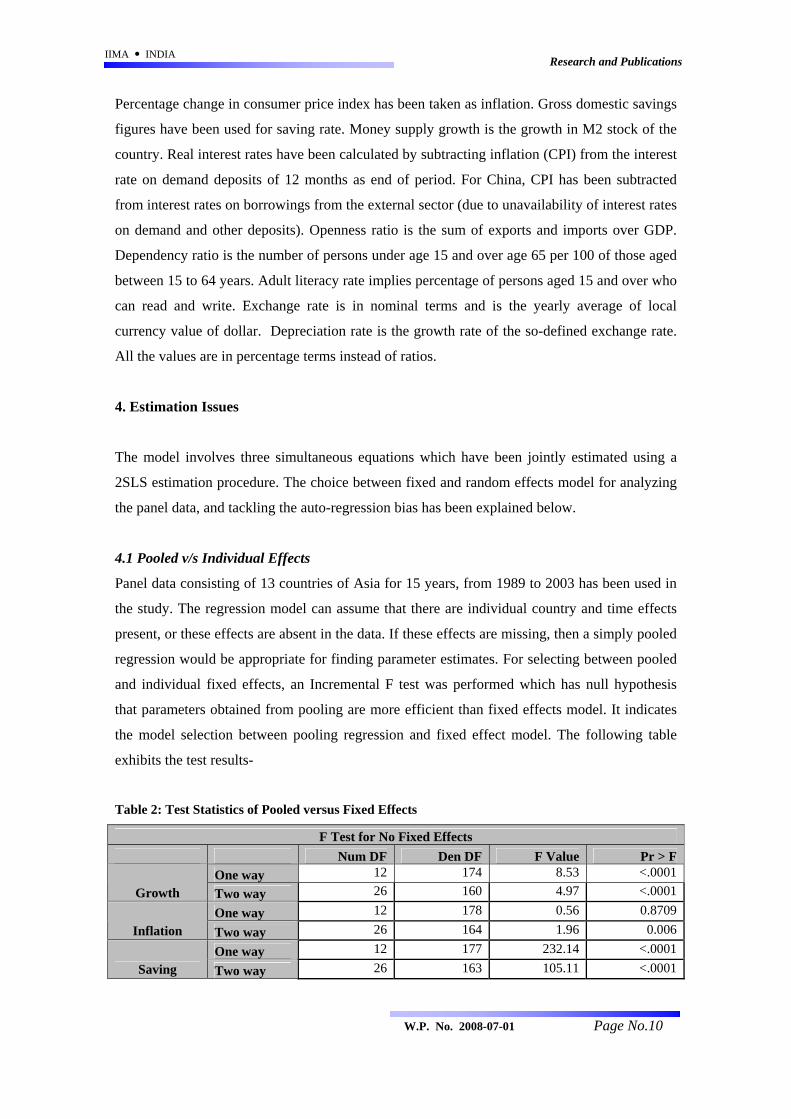
regression would be appropriate for finding parameter estimates. For selecting between pooled
and individual fixed effects, an Incremental F test was performed which has null hypothesis
that parameters obtained from pooling are more efficient than fixed effects model. It indicates
the model selection between pooling regression and fixed effect model. The following table
exhibits the test results-
Table 2: Test Statistics of Pooled versus Fixed Effects
F Test for No Fixed Effects Num DF Den DF F Value Pr > F
One way 12 174 8.53 <.0001 Growth Two way 26 160 4.97 <.0001
One way 12 178 0.56 0.8709 Inflation Two way 26 164 1.96 0.006
One way 12 177 232.14 <.0001 Saving Two way 26 163 105.11 <.0001
Page No.10 W.P. No. 2008-07-01
IIMA INDIA Research and Publications
The test supports two-way fixed affect specification for all the three equations over the pooled
regression specification.
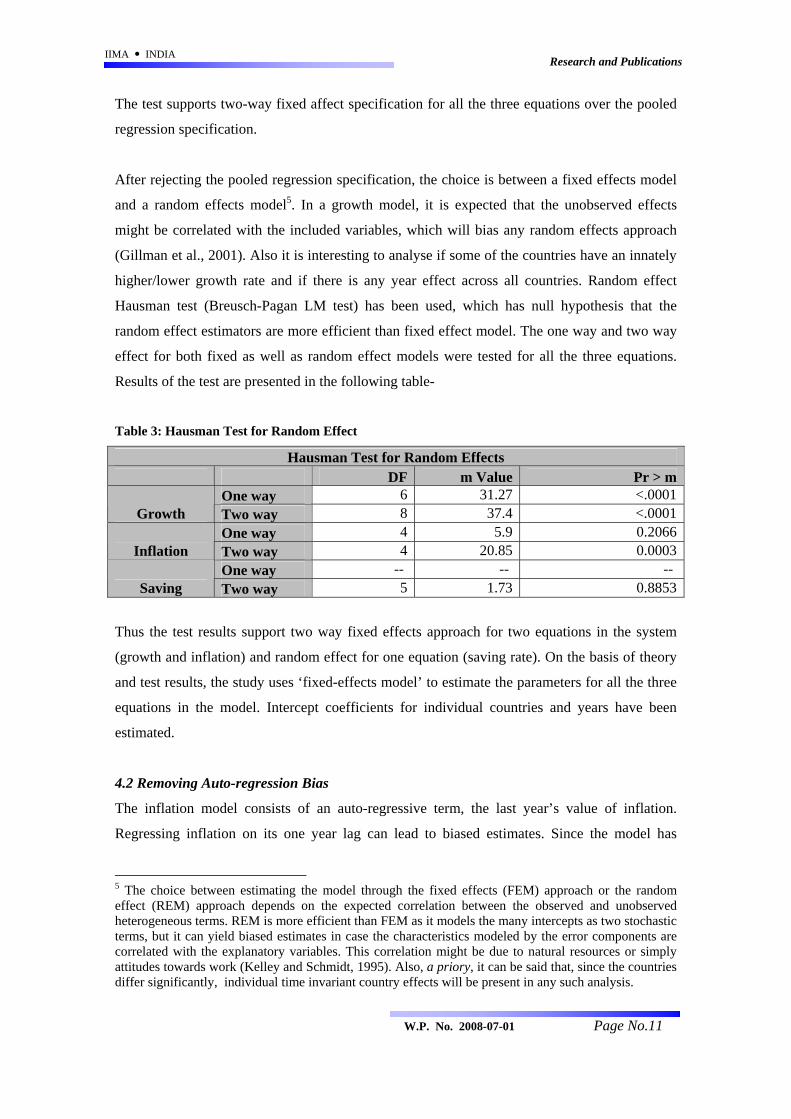
After rejecting the pooled regression specification, the choice is between a fixed effects model
and a random effects model5. In a growth model, it is expected that the unobserved effects
might be correlated with the included variables, which will bias any random effects approach
(Gillman et al., 2001). Also it is interesting to analyse if some of the countries have an innately
higher/lower growth rate and if there is any year effect across all countries. Random effect
Hausman test (Breusch-Pagan LM test) has been used, which has null hypothesis that the
random effect estimators are more efficient than fixed effect model. The one way and two way
effect for both fixed as well as random effect models were tested for all the three equations.
Results of the test are presented in the following table-
Table 3: Hausman Test for Random Effect
Hausman Test for Random Effects DF m Value Pr > m
One way 6 31.27 <.0001Growth Two way 8 37.4 <.0001
One way 4 5.9 0.2066Inflation Two way 4 20.85 0.0003
One way -- -- -- Saving Two way 5 1.73 0.8853
Thus the test results support two way fixed effects approach for two equations in the system
(growth and inflation) and random effect for one equation (saving rate). On the basis of theory
and test results, the study uses ‘fixed-effects model’ to estimate the parameters for all the three
equations in the model. Intercept coefficients for individual countries and years have been
estimated.
4.2 Removing Auto-regression Bias
The inflation model consists of an auto-regressive term, the last year’s value of inflation.
Regressing inflation on its one year lag can lead to biased estimates. Since the model has
5 The choice between estimating the model through the fixed effects (FEM) approach or the random effect (REM) approach depends on the expected correlation between the observed and unobserved heterogeneous terms. REM is more efficient than FEM as it models the many intercepts as two stochastic terms, but it can yield biased estimates in case the characteristics modeled by the error components are correlated with the explanatory variables. This correlation might be due to natural resources or simply attitudes towards work (Kelley and Schmidt, 1995). Also, a priory, it can be said that, since the countries differ significantly, individual time invariant country effects will be present in any such analysis.
Page No.11 W.P. No. 2008-07-01
IIMA INDIA Research and Publications
simultaneity, this bias can affect the significance level as well as parameter estimates of the
other two equations as well, which have inflation as an explanatory variable. To remove this
bias, the auto-regressive variable has been replaced by an instrument. The instrument used in
this case is the difference in current value of inflation and its one year lagged value. This
instrument was checked for its degree of correlation with the auto-regressive term, and the
degree of correlation was found to be substantially high. Also, there is no theoretical reason to
believe that this instrument will be correlated to the error term in the equation.
5. Results and Discussions
The results show that the model fits given data extremely well with the R-square values of
88.9%, 70.8%, and 97% for respectively the growth, inflation, and saving rate equation in the
structural form. The structural form parameters give only partial impact of the pre-determined
variables on the endogenous variables. In the simultaneous equation framework, the total
impact of a predetermined variable is measured by the impact parameter coefficient
corresponding to the variable in the reduced form of the model. Depending on the model and
the sample, the total impact parameter can be different from the partial impact parameter as
obtained from the structural model. It is possible that even the sign of the two impacts may turn
out different. However, in our model and sample, the results show the same sign but
substantially different magnitudes in a few cases. We therefore, first discuss the structural form
estimates and then consider the total impact parameters.
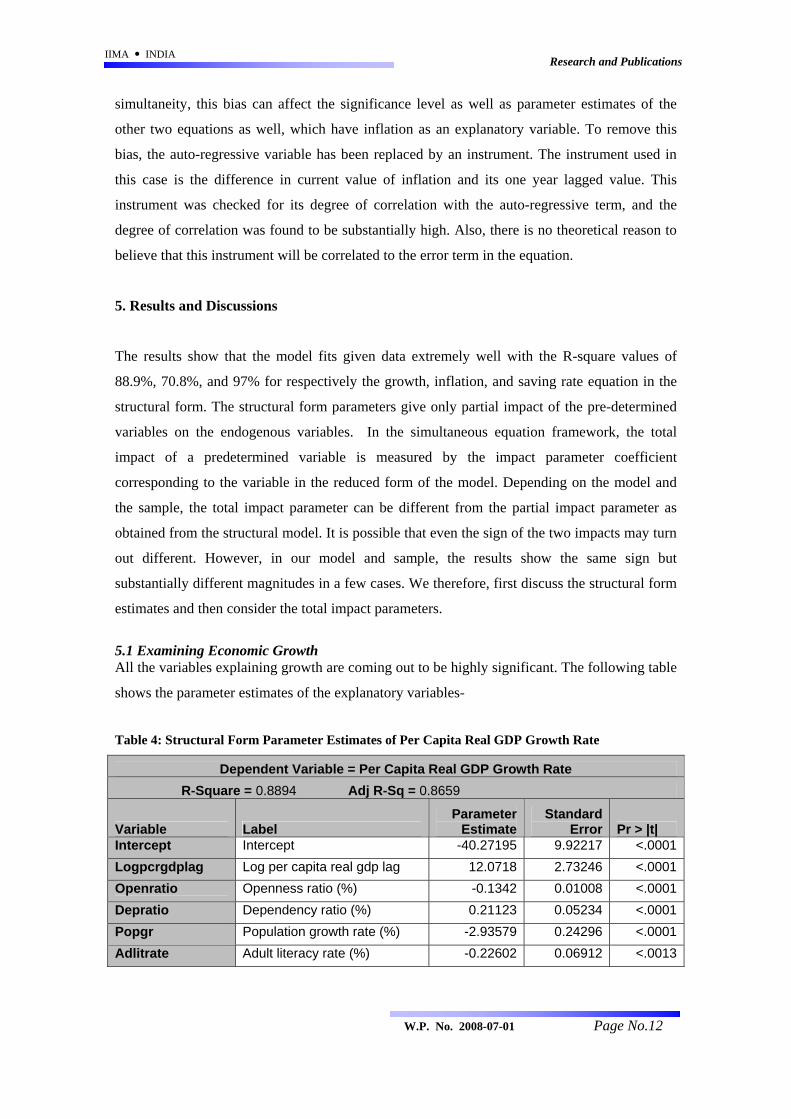
5.1 Examining Economic Growth All the variables explaining growth are coming out to be highly significant. The following table
shows the parameter estimates of the explanatory variables-
Table 4: Structural Form Parameter Estimates of Per Capita Real GDP Growth Rate
Dependent Variable = Per Capita Real GDP Growth Rate R-Square = 0.8894 Adj R-Sq = 0.8659
Variable Label Parameter
EstimateStandard
Error Pr > |t| Intercept Intercept -40.27195 9.92217 <.0001Logpcrgdplag Log per capita real gdp lag 12.0718 2.73246 <.0001Openratio Openness ratio (%) -0.1342 0.01008 <.0001Depratio Dependency ratio (%) 0.21123 0.05234 <.0001Popgr Population growth rate (%) -2.93579 0.24296 <.0001Adlitrate Adult literacy rate (%) -0.22602 0.06912 <.0013
Page No.12 W.P. No. 2008-07-01
IIMA INDIA Research and Publications
Page No.13 W.P. No. 2008-07-01
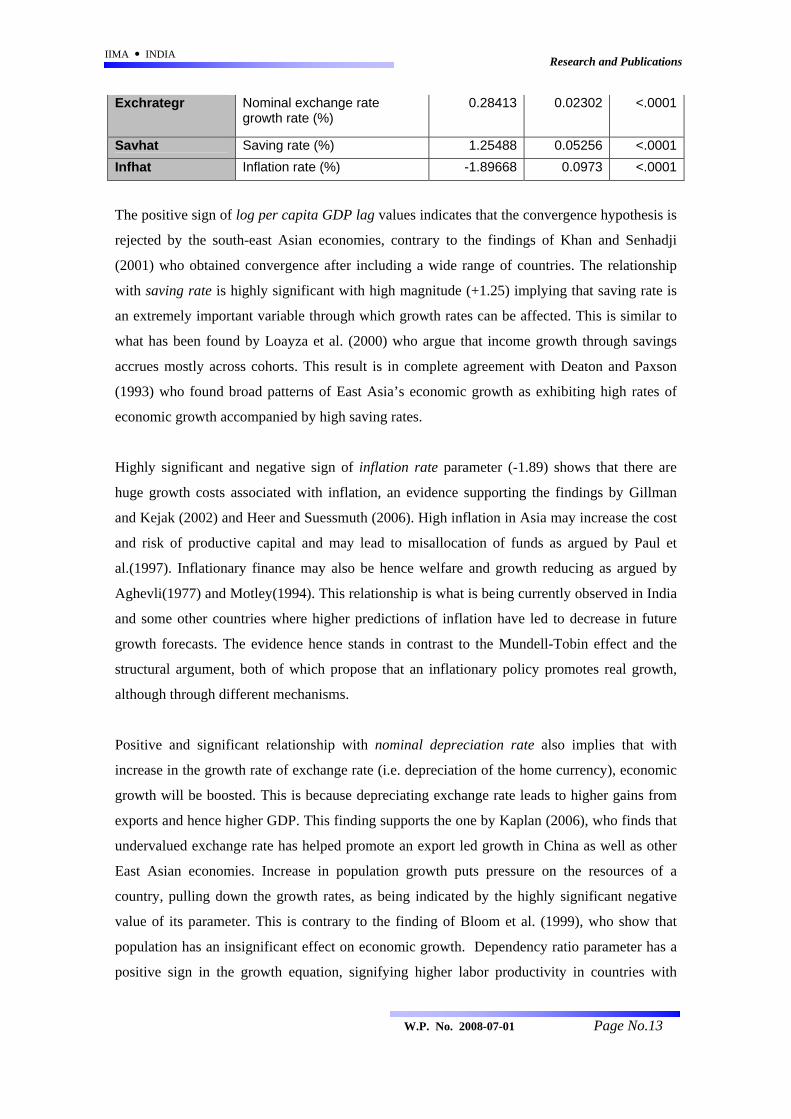
Exchrategr Nominal exchange rate growth rate (%)
0.28413 0.02302 <.0001
Savhat Saving rate (%) 1.25488 0.05256 <.0001Infhat Inflation rate (%) -1.89668 0.0973 <.0001
The positive sign of log per capita GDP lag values indicates that the convergence hypothesis is
rejected by the south-east Asian economies, contrary to the findings of Khan and Senhadji
(2001) who obtained convergence after including a wide range of countries. The relationship
with saving rate is highly significant with high magnitude (+1.25) implying that saving rate is
an extremely important variable through which growth rates can be affected. This is similar to
what has been found by Loayza et al. (2000) who argue that income growth through savings
accrues mostly across cohorts. This result is in complete agreement with Deaton and Paxson
(1993) who found broad patterns of East Asia’s economic growth as exhibiting high rates of
economic growth accompanied by high saving rates.
Highly significant and negative sign of inflation rate parameter (-1.89) shows that there are
huge growth costs associated with inflation, an evidence supporting the findings by Gillman
and Kejak (2002) and Heer and Suessmuth (2006). High inflation in Asia may increase the cost
and risk of productive capital and may lead to misallocation of funds as argued by Paul et
al.(1997). Inflationary finance may also be hence welfare and growth reducing as argued by
Aghevli(1977) and Motley(1994). This relationship is what is being currently observed in India
and some other countries where higher predictions of inflation have led to decrease in future
growth forecasts. The evidence hence stands in contrast to the Mundell-Tobin effect and the
structural argument, both of which propose that an inflationary policy promotes real growth,
although through different mechanisms.
Positive and significant relationship with nominal depreciation rate also implies that with
increase in the growth rate of exchange rate (i.e. depreciation of the home currency), economic
growth will be boosted. This is because depreciating exchange rate leads to higher gains from
exports and hence higher GDP. This finding supports the one by Kaplan (2006), who finds that
undervalued exchange rate has helped promote an export led growth in China as well as other
East Asian economies. Increase in population growth puts pressure on the resources of a
country, pulling down the growth rates, as being indicated by the highly significant negative
value of its parameter. This is contrary to the finding of Bloom et al. (1999), who show that
population has an insignificant effect on economic growth. Dependency ratio parameter has a
positive sign in the growth equation, signifying higher labor productivity in countries with
IIMA INDIA Research and Publications
higher dependency ratio. This is possible if in the south and east Asian countries higher
dependency ratios are associated with higher life expectancy and better health status of the
population (Tuljapurkar, 2002), as is the case with OECD economies (Jacobzone et. al., 2000).
The results exhibit negative relationship of openness ratio with economic growth. India,
Pakistan, Bangladesh, Nepal, Philippines, Sri Lanka, and Thailand have been net importers
during this period while the other countries (China, Singapore, Malaysia, Maldives, Hong Kong
and Korea) have been net exporters. For most of the net exporter countries, high growth of
exports is a significant source of growth like technical progress achieving high growth rates in
the economy. However, for all the other countries having preponderance of imports, there is a
net pay out and the growth of GDP may suffer statistically. Also, these countries suffer from
various infrastructural bottlenecks and policy inefficiencies. All these interactions could have
resulted in the negative parameter of the openness ratio. However, our finding may imply that
the south Asian countries should focus on increasing exports for fostering growth as done by
the East Asian economies rather than focusing on increasing the degree of openness.
Parameter of adult literacy rate has a negative sign in the growth equation. This counter
intuitive sign could be on account of the special characteristics of the south-east Asian
economies. On an average, all these economies can be considered as developing economies and
not as developed ones, especially during the period of the study. The literacy rates on an
average are low and hence increasing these are an important social sector priority for most of
these governments. Low adult literacy rate implies that the current labor force is not well
educated and skilled. Higher adult literacy rates will only provide opportunities to build the
capacity and skills in future and contribute to the growth process. The negative sign could be
present because, in the short run, focusing on adult literacy rate would lead to diversion of
substantial amount of resources devoted for increasing literacy rates and education from their
immediately productive uses. But, investing in increasing literacy rate and education is a social
sector investment and will have significant positive returns in the long run (Dholakia A., 1990).
It may take about seven to nine years for the positive effects to be felt on the growth (Dholakia,
2003).
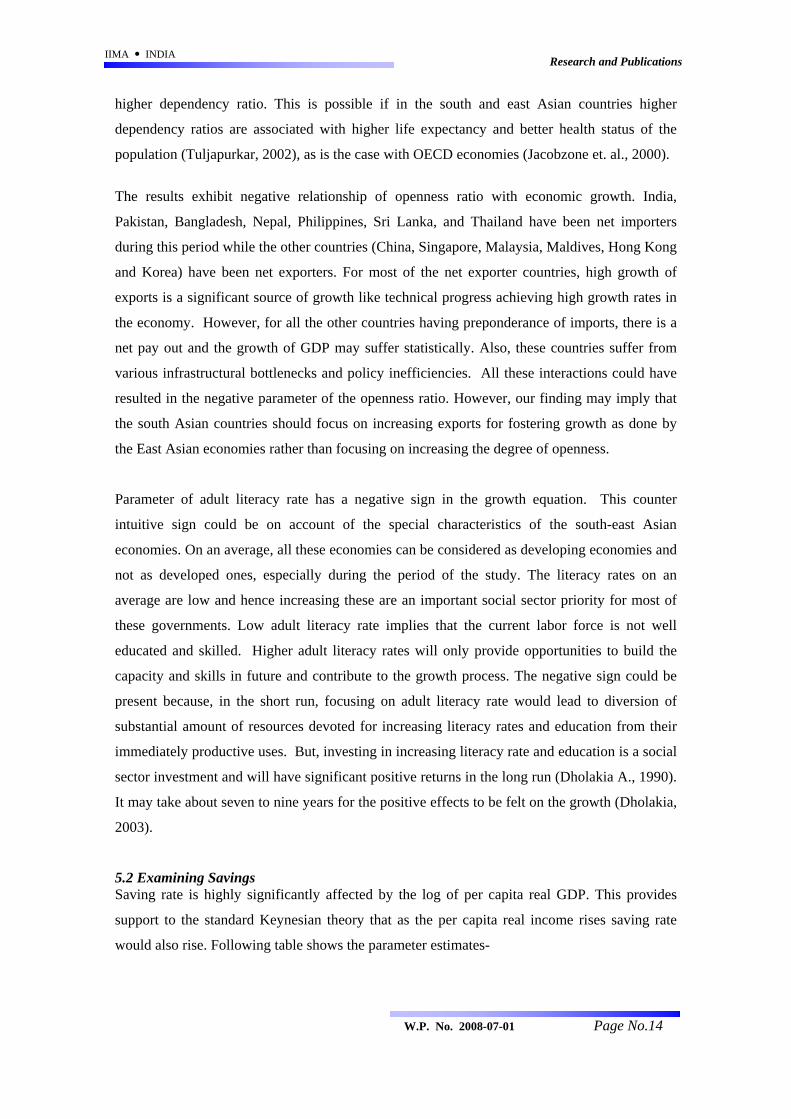
5.2 Examining Savings Saving rate is highly significantly affected by the log of per capita real GDP. This provides
support to the standard Keynesian theory that as the per capita real income rises saving rate
would also rise. Following table shows the parameter estimates-
Page No.14 W.P. No. 2008-07-01
IIMA INDIA Research and Publications
Table 5: Structural Form Parameter Estimates of Saving Rate
R-Square = 0.9708 Adj R-Sq = 0.9652
Variable Label Parameter
EstimateStandard
Error Pr > |t| Intercept Intercept -29.59898 13.60293 0.031Logpcrgdp Log per capita real GDP 15.35819 3.68027 <.0001
Depratio Dependency ratio (%) -0.06383 0.07007 0.3637
Rlintrate Real interest rate (%) -0.06358 0.05421 0.2426Infhat Inflation rate (%) 0.08673 0.08797 0.3256Gdphat Per capita real GDP
growth rate (%) 0.14053 0.0543 0.0105
The results also show that the per capita real GDP growth rate also significantly and positively
affects the saving rate. Thus along with higher income, at higher growth rate of income, too, the
saving rate is higher. The effect of dependency ratio is statistically insignificant but the
negative sign provides support to the findings of Loayza et al. (2000) about the lifecycle theory
that, as dependency ratio increases, saving rate would decrease. The insignificant parameter of
real interest rate rejects the classical theory of positive relationship of savings with real interest
rates. This is contrary to the finding of Athukorala and Sen (2004) who found a positive impact
of the real interest rates on the savings in India. This is perhaps because they did not adjust for
the simultaneity bias. Inflation is also found positively but statistically insignificantly related to
savings in the present study. This is contrary to the findings of Chopra (1988) who obtained a
significant positive impact of inflation on savings in the case of the Indian economy prior to
1982. The positive inflation coefficient can be explained in terms of the people wanting to
preserve the real value of their wealth in presence of inflation, perhaps because the social
security and health concerns are not adequately addressed by the existing institutional network
in these countries. As a result, the inflation induced increased macroeconomic uncertainty
forces people to save more. This is contrary to the findings of Heer and Suessmuth (2006).
5.3 Examining Inflation
The lagged value of inflation (instrumented by using the difference between present and last
year’s value of inflation) has a positive and highly significant relationship with inflation. Since
this lagged value has been taken as a proxy of inflationary expectations, the result supports the
adaptive inflationary expectations hypothesis. Evidence suggests that inflationary expectations
Page No.15 W.P. No. 2008-07-01
IIMA INDIA Research and Publications
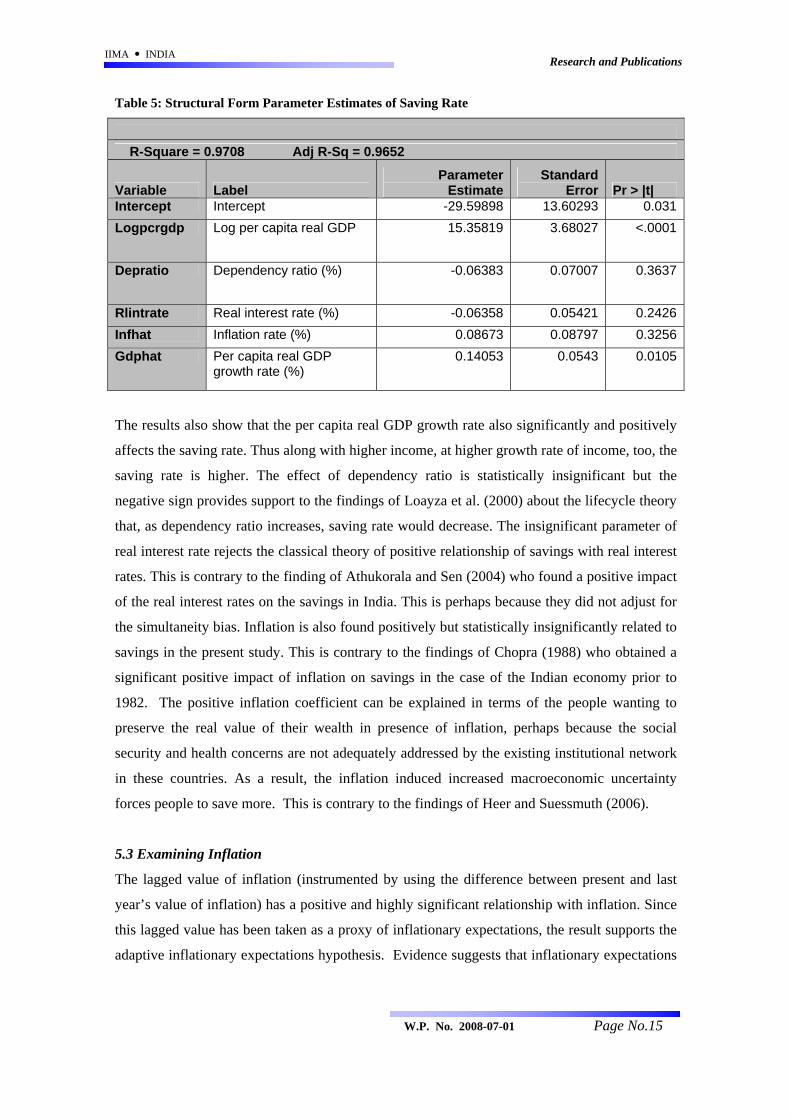
are extremely important in predicting future values of inflation, as discussed by Sidrauski’s
(1967). The detailed parameter estimates for inflation rate are given in the following table-
Table 6: Structural Form Parameter Estimates of Inflation Rate
Dependent Variable = Inflation Rate R-Square = 0.7083 Adj R-Sq = 0.6549
Variable Label Parameter
EstimateStandard
Error Pr > |t| Intercept Intercept 6.59268 1.14661 <.0001Infdif Instrument for lagged
inflation (%) 0.45684 0.05626 <.0001
Monsupgr Money supply growth rate (%)
0.02954 0.01967 0.1351
Exchrategr Nominal exchange rate growth rate (%)
0.09226 0.02908 0.0018
Gdphat Per capita real GDP growth rate (%)
-0.03577 0.06688 0.5935
Money supply growth does not turn out to be statistically significant even at 10% level in
affecting the inflation rate. The sign of the parameter is, however, positive as expected. This
result is in agreement with Saini (1982) who also found that money stock growth was not the
primary source of inflation for some Asian countries. Similarly, per capita real GDP growth
rate is also not statistically significant in predicting the inflation rate. Thus, the experience of
the south and east Asia does not support the prediction of quantity theory of money even at 10
per cent level of significance. This contradicts R. H. Dholakia (1990), who in his analysis of
India found strong support to the quantity theory and hence recommended that high growth of
income would tackle the problem of high inflation. In the present study, exchange rate
depreciation is highly significantly and positively related to inflation rate. This supports the
findings of Honohan and Lane (2004) for Ireland. This finding is all the more plausible because
most of the countries in our sample are net importers of oil.
5.4 Simultaneity Evidence
The regression model was based on the hypothesis that there is a simultaneous relationship
between growth and savings and between growth and inflation. A simultaneous relationship has
been found between growth and savings, with both significantly and positively affecting each
other. The effect of savings on growth is much higher (parameter estimate equal to 1.25) as
compared to the effect of growth on savings (parameter estimate equal to 0.14). On the other
hand, the evidence from Asia rejects the hypothesis of a two-way relationship between growth
and inflation. Thus inflation affects growth in a highly negative way (-1.89), but growth does
Page No.16 W.P. No. 2008-07-01
IIMA INDIA Research and Publications
not affect inflation (though the parameter is negative (-0.03)). On the other hand, inflation does
not affect the saving rate (though the parameter is positive at 0.087). These two findings
together imply that inflation must have a substantially positive effect on ICOR providing
support to Chopra’s (1988) hypothesis about inflation leading to shifts in production structure
from less capital intensive to more capital intensive goods ultimately resulting in raising ICOR.
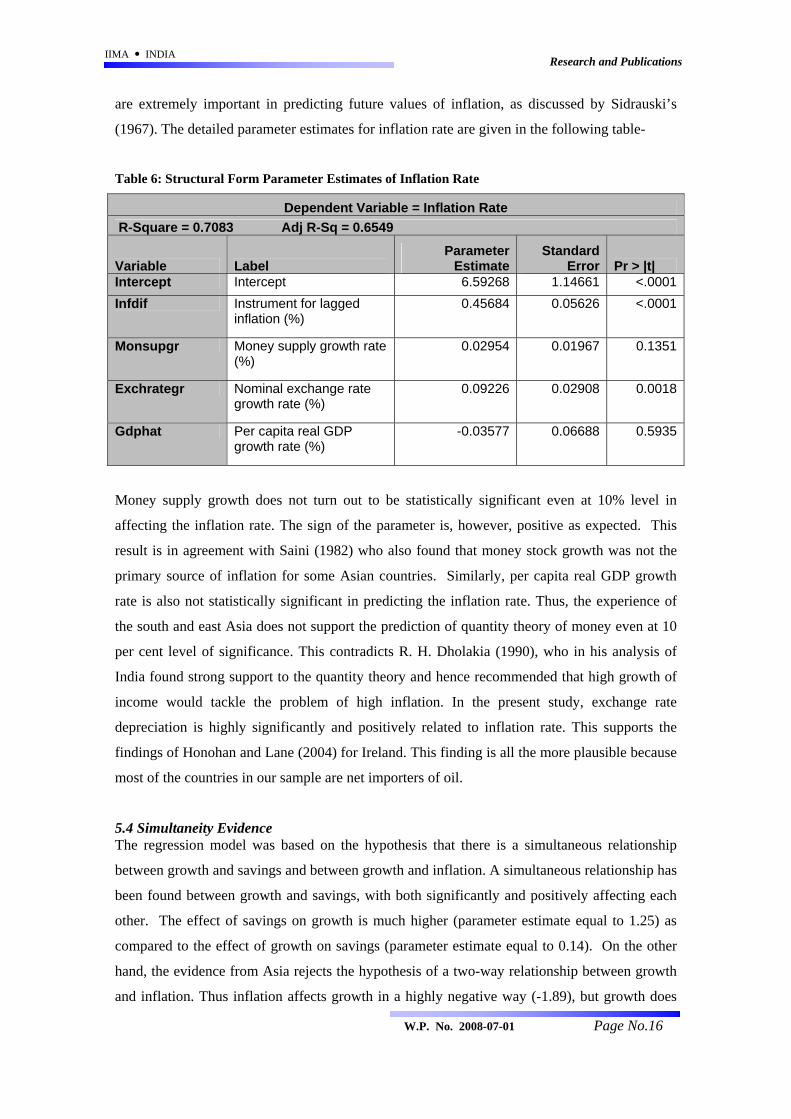
5.5 Impact Parameters
Impact parameters, which refer to the total net effect of exogenous (or pre-determined)
variables on the endogenous variables, are presented in Table 7. When compared to the
coefficient estimates in Tables 4, 5, and 6 it is clear that the direction of the impact as given by
the sign of the coefficients has not reversed in any of the three endogenous variables. Thus the
presence of simultaneity has not totally altered the direction of results in our case. For several
variables, however, the magnitude of the impact has substantially changed. The change in the
magnitude of the impact is in both the directions. For openness ratio and adult literacy rate,
there is a sharp increase in their impact on the growth, whereas dependency ratio, population
growth and depreciation rate experience a sharp decrease in their impact on growth rate when
simultaneity is considered. Similarly in the case of the saving rate, while the impact of the level
of GDP substantially increases, that of the dependency ratio sharply falls when simultaneity is
considered. For inflation rate, however, the impact parameters in the structural form and the
reduced form differ only marginally.
Table 7: Impact Parameters
Real GDP Growth Rate Saving Rate Inflation Rate Log Per Capita Real GDP Lag 15.88782549 2.18342679 -0.56830388Openness Ratio -0.17111991 -0.02351661 0.00612092Dependency Ratio 0.17731605 -0.03563187 -0.0063426Population Growth Rate -3.85677951 -0.53002821 0.13795612Adult Literacy Rate -0.28958754 -0.03979734 0.01035848Nominal Depreciation Rate 0.15676446 0.02934996 0.0843925Log Per Capita Real GDP 25.35523745 18.8345114 -0.9069394Real Interest Rate -0.09910842 -0.07362024 0.00354504Inflation Lag -1.0590075 -0.106506 0.4878801Money Supply Growth Rate -0.0706005 -0.0071004 0.03252534
Comparing these net effect estimates with the estimates of the regression parameters, we do not
observe substantial difference in the effect of almost all the predetermined variables. The
positive direct effect of nominal exchange rate depreciation on the GDP growth rate decreases
Page No.17 W.P. No. 2008-07-01
IIMA INDIA Research and Publications
from .28 to .15 on the account of its indirect negative effect through inflation. The negative
effect of population growth on GDP growth increases on the account of interplay between the
exogenous variables. Apart from these, the changes in the effects of all the exogenous variables
on the three endogenous variables are only marginal.
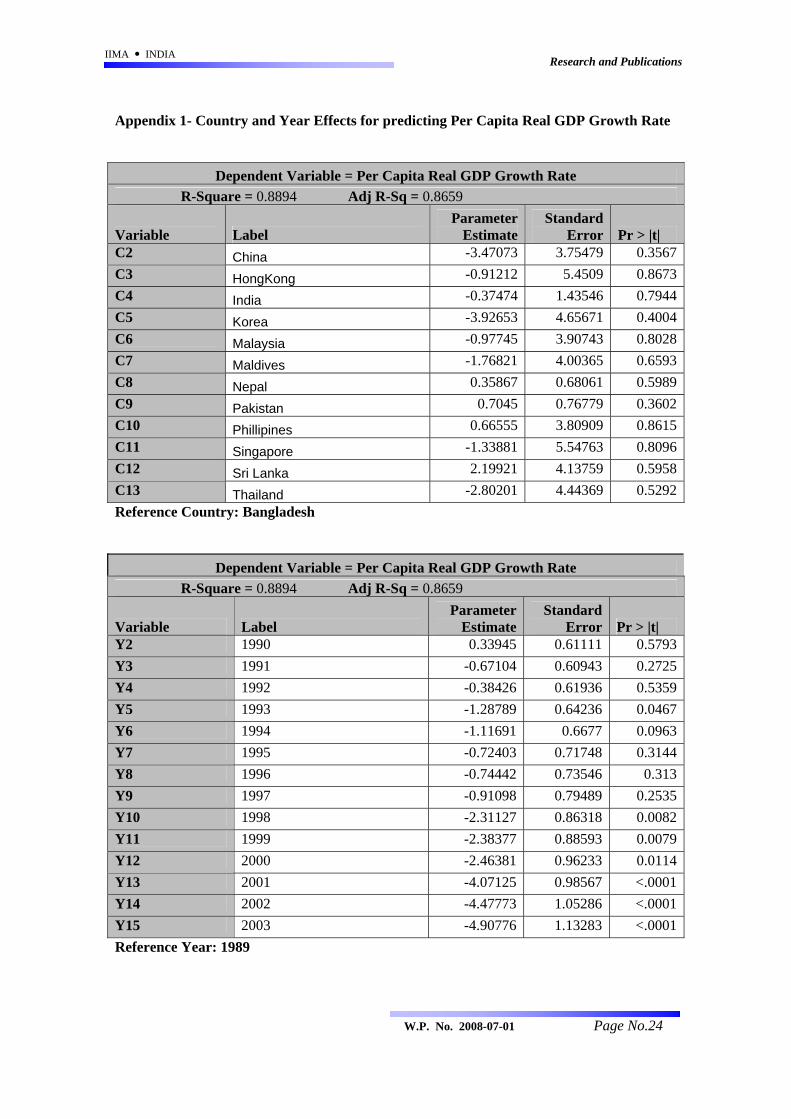
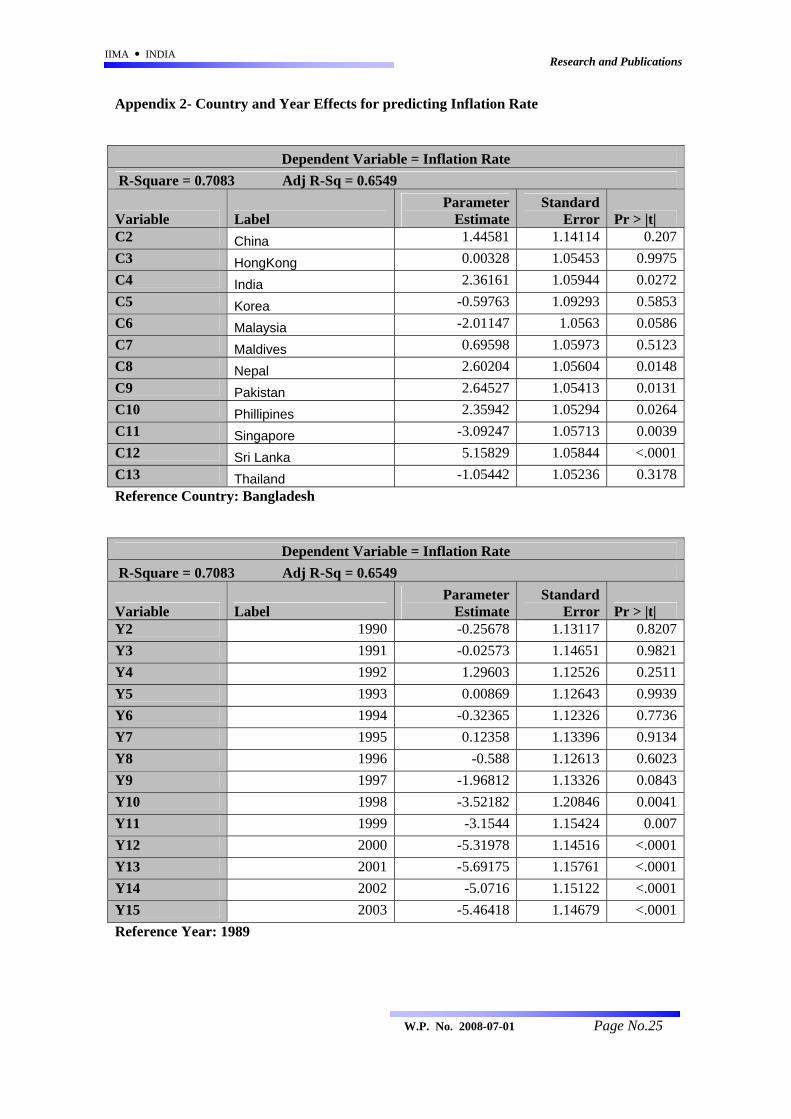
5.5 Country and Year Specific Effects6
Country Effects
There are no country specific effects for explaining per capita real GDP growth rate, but in case
of inflation rate and saving rate, many countries exhibit individual effects which were modeled
as fixed effects in the panel data framework. Bangladesh is taken as the reference country and
all the analysis is done with reference to this country. India, Philippines, Singapore and Sri
Lanka show presence of time invariant fixed effects influencing both saving rate and inflation
rate. Pakistan, and Nepal show individual fixed effects influencing only inflation rate while
China, Korea, Malaysia, Thailand and Maldives all exhibit individual fixed effects influencing
only saving rate.
China, India, Malaysia, Korea, Maldives, Singapore and Thailand exhibit positive individual
effect on saving rate, while Philippines and Sri Lanka show negative fixed effect on the saving
rate. The magnitude of positive fixed effect of China, Korea Malaysia, Maldives and Singapore
on saving rate is particularly very high, which is expected given the policies favoring high
saving rate adopted in these East Asian countries. In case of inflation, India, Pakistan, Nepal,
Sri Lanka, and Philippines all show positive individual fixed effects while Singapore has a
negative fixed effect on inflation.
Year Effects
As contrary to the time invariant country fixed effects, there is no country invariant year fixed
effect on saving rate, while there is highly significant negative effect on growth as well as
inflation. 1989 is taken as the reference year and all the analysis is done with reference to this
year. This effect is exhibited consistently from 1998 to 2003 and is negative in all the cases.
This highly significant negative year effect can be strongly related to the East Asian financial
crisis which started in mid 1997 and affected many economies, particularly in Asia. This crisis
mainly affected South Korea, Thailand, Hong Kong, Malaysia and Philippines and affected the
other south-east Asian countries to a lesser degree. The currency rates, stock markets and asset
6 The detailed estimates for individual country and year effects are given in the Appendix
Page No.18 W.P. No. 2008-07-01
IIMA INDIA Research and Publications
prices were affected in many of these countries which can be assumed to have an impact on the
inflation as well as growth rates of most of the Asian economies, as revealed by the data.
6. Concluding Remarks
There are two broad types of learning we have from the exercise carried out in the present
study: (i) methodological and (ii) related to development policy arising from the experience of
the south and south-east Asian countries. Most papers in the literature so far have analyzed the
determinants of growth and savings separately. Few attempts have been made to analyze these
variables in a simultaneous equation framework. The simultaneous effect of inflation on both
economic growth and savings has also not been examined so far in a comprehensive
framework. On the other hand, there are not only solid theoretical reasons to believe that these
variables are determined simultaneously, but also that savings and inflation are very
instrumental in the growth and economic development process of emerging economies. The
most relevant finding of the present paper from the methodology angle is that growth and
saving rate has bi-directional simultaneous relationship. Although we found only
unidirectional relationship between inflation and growth in our sample, it is important to model
it in simultaneous equation framework to avoid errors arising out of ignoring the simultaneity
bias. Similarly, inflation was not found to affect the saving rate in our sample, but it needs to be
considered while examining the interrelationships among growth, savings and inflation. The
present study attempted to address this methodological issue and thereby the methodological
limitations of earlier studies on the subject. With widely varying macroeconomic factors
affecting economic growth, south-east and south Asian economies provided an interesting
ground to analyze these relationships.
From the viewpoint of the development policy, our finding of a bi-directional relationship
between savings and growth is important. Savings is not an end it itself. It is only a means to
achieve high income growth and improved standards of living. Policies focusing on increasing
the saving rates need to be followed, which can lead to higher growth rates and higher per-
capita income. Both will, in turn, reinforce the higher saving rate. The magnitude of the effect
of saving rate on growth is found to be substantially higher than the one of growth on saving
rate and hence policies to promote savings are very important for promoting development. This
approach seems to have been followed by many East Asian economies as reflected in the highly
significant positive country effects exhibited for those economies in our study. These countries
have high saving rates averaging around 40% of GDP leading to highly positive effects on their
growth rates. The positive and significant effect of GDP level and GDP growth on the saving
Page No.19 W.P. No. 2008-07-01
IIMA INDIA Research and Publications
rate as per the standard Keynesian theory, found in our study, is consistent with the findings of
Morande (1998) in the case of Chile and Athukorala and Sen (2004) in the case of India.
The most relevant finding from the policy perspective is the significant negative effect of
inflation on the economic growth, which is unidirectional, i.e. economic growth does not affect
inflation. The negative effect of inflation on growth was found in the case of Mexico (Grier and
Grier, 2006) as well as Nigeria (Fabayo and Ajilore, 2006). High inflation in Asia may increase
the cost and risk of productive capital and may lead to misallocation of funds as argued by Paul
et al. (1997). The evidence stands in contrast to the Mundell-Tobin effect and the structural
argument, both of which propose that an inflationary policy promotes real growth. Thus,
controlling inflation and thereby providing macroeconomic stability is very essential for
promoting growth in the economy. Inflation is also found positively but statistically
insignificantly related to savings. Thus, there is an indirect evidence of inflation affecting the
ICOR positively that supports the hypothesis propounded by Chopra (1988).
In the present situation of unprecedented rise in global commodity prices, the concern of the
policy makers to control inflation is paramount. All developing countries targeting a high
growth rate are grappling with this problem. Our findings from the data on south-east and south
Asian countries reject the popular hypotheses that inflation is affected by economic growth and
the growth of money supply. Therefore, the strategies of rapid economic recovery for
effectively addressing the problem of high inflation in such countries (Dholakia R. H., 1990)
and of controlling the growth of money supply propagated by IMF are not supported by the
findings of this paper. The best way to curb inflation according to our findings on inflation
equation is to control exchange rate depreciations and, if possible, directly influence
inflationary expectations. However, when we consider the simultaneous framework,
depreciation of exchange rate has the total net positive effect on and the net positive effect on
inflation. Thus, there exists a clear trade off between growth and inflation in following any
conscious exchange rate policy and the policy makers must exercise the choice cautiously.
Page No.20 W.P. No. 2008-07-01
IIMA INDIA Research and Publications
Reference
• Aghevli, B. B. 1977. Inflationary Finance and Growth. The Journal of Political
Economy, Vol. 85, No. 6, Dec. 1977, pp. 1295-1308
• Athukorala, P. C. and Sen, K. 2004. The Determinants of Private Saving in India.
World Development, Vol. 32, No. 3, pp. 491–503
• Barro ,R. and Sala-i-Martin, X. 1995. Economic Growth. McGraw Hill
• Bloom, D. E., Canning, D., and Malaney, P. N. 1999. Demographic Change and
Economic Growth in Asia. CID Working Paper No. 15. May 1999
• Cardenas, M. and Escobar, A. 1998. Saving determinants in Colombia: 1925–1994.
Journal of Development Economics, Vol. 57, pp. 5–44
• Chari, V. V., Jones, L. E., and Manuelli, R. E. 1996. Inflation, Growth, and Financial
Intermediation. Federal Reserve Bank of St. Louis, May/June 1996 Review
• Chopra, S. 1988. Inflation, Household Savings and Economic Growth. Ph. D. thesis,
M. S. University of Baroda, India
• Deaton, A. 1977. Involuntary Saving Through Unanticipated Inflation. The American
Economic Review, Vol. 67, No. 5, pp. 899-910
• Deaton, A. S. and Paxson, C. H. 1993. Saving, Growth, and Aging in Taiwan. NBER
Working Paper No. 4330
• Dholakia, Archana. 1990. Benefits from Government Expenditures in India- A Welfare
Indicator Approach. Bombay: Himalaya Publishing House, India
• Dholakia, R. H. 1990. Extended Phillips Curve for the Indian Economy. Indian
Economic Journal, Vol. 38, No. 1, pp. 69-78
• Dholakia, R. H. 1995. Expected Inflation and Short-Term Forecast of Growth Rate in
India. IASSI Quarterly, Vol. 13, No. 4, pp. 44-67
• Dholakia, R. H. 2003. Regional Disparity in Economic and Human Development in
India. Economic and Political Weekly, Vol. 38, No. 39, pp. 4166-4172
• Edwards, S. 1996. Why are Latin America' s savings rates so low? An international
comparative analysis. Journal of Development Economics, Vol. 51, pp. 5-44
• Fabayo, J. A. and Ajilore, O. T. 2006. Inflation -- How Much Is Too Much For
Economic Growth in Nigeria. Indian Economic Review, Vol. 41 , Issue No. 2, pp. 129-
148
• Fischer, S. 1993. The Role of Macroeconomic Factors in Growth. NBER Working
Paper Series, Working Paper No. 4565
Page No.21 W.P. No. 2008-07-01
IIMA INDIA Research and Publications
• Gillman, M. and Kejak, M. 2002. Modeling the Effect of Inflation: Growth, Levels,
and Tobin. Proceedings of the 2002 North American Summer Meetings of the
Econometric Society: Money, edited by David K. Levine, William Zame, Lawrence
Ausubel, Pierre-Andre Chiappori, Bryan Ellickson, Ariel Rubinstein and Larry
Samuelson
• Gillman, M., Harris, M. and Mátyás, L. 2001. Inflation and Growth: Some Theory and
Evidence. 2001. Central European University Department of Economics Working
Paper WP1/2001
• Grier, R. and Grier, K. B. 2006. On the real effects of inflation and inflation uncertainty
in Mexico. Journal of Development Economics, Vol. 80, pp. 478– 500
• Gylfason, T. and Herbertsson, T. T. 2001. Does Inflation Matter for Growth? Japan
and the World Economy, Volume 13, Number 4, December 2001 , pp. 405-428
• Haslag, J. H. 1997. Output, Growth, Welfare and Inflation: A Survey. Federal Reserve
Bank of Dallas, Economic Review, Second Quarter, 1997
• Heer, B. and Suessmuth, B. 2006. The Savings-Inflation Puzzle. Cesifo Working Paper
No. 1645
• Honohan, P. and Lane, P. R. 2004. Exchange Rates and Inflation under EMU: An
Update. Prepared as a web essay for Economic Policy
(http://www.economicpolicy.org/commentaries.asp)
• Jacobzone, S., Cambois, E., and Robine, J. M. 2000. Is the Health of Older Persons in
OECD Countries Improving Fast Enough to Compensate for Population Ageing?
OECD Economic Studies No. 3
• Kaplan, S. B. 2006. The Political Obstacles to Greater Exchange Rate
Flexibility in China. World Development Vol. 34, No. 7, pp. 1182–1200
• Khan, M. S. and Senhadji, A. S. 2001. Threshold Effects in the Relationship Between
Inflation and Growth. IMF Staff Papers 2001, Vol. 48, No. 1
• Krieckhaus, J. 2002. Reconceptualizing the Developmental State: Public Savings and
Economic Growth. World Development, Vol. 30, No. 10, pp. 1697–1712
• Loayza, N., Schmidt-Hebbel, K., and Serven, L. 2000. What Drives Private Saving
Across the World? The Review of Economics and Statistics, Vol. 82, No. 2, May 2000,
pp. 165-181.
• Mallik, G. and Chowdhury, A. 2001. Inflation and Economic Growth: Evidence from
four South Asian Countries. Asia-Pacific Development Journal Vol. 8, no. 1, June 2001
• Miller, R. L. and Benjamin, D. K. 2008. The Economics of Macro Issues. Pearson
Addison Wesley, Third Edition
Page No.22 W.P. No. 2008-07-01
IIMA INDIA Research and Publications
• Morande, F. G. 1998. Savings in Chile. What went right? Journal of Development
Economics. Vol. 57, pp. 201–228
• Motley, B. 1994. Growth and Inflation: A Cross-Country Study. CEPR Publication No.
395, Center for Economic Policy Research, Stanford University (March)
• Page, J. M. 1994. The East Asian Miracle: An Introduction. World Development, Vol.
22, No. 4, pp. 615-625
• Paul, S., Kearney, C., and Chowdhury, K. 1997. Inflation and Economic Growth: A
Multi-Country Empirical Analysis. Applied Economics, 1997, Vol. 29, pp. 1387-1401
• Romer, D. 2006. Advanced Macroeconomics. McGraw Hill/ Irwin
• Rosegrant, M. W. and Evenson, R. E. 1992. Agricultural Productivity and Sources of
Growth in South Asia. American Journal of Agricultural Economics, Vol. 74, No. 3 ,
pp. 757-761
• Roubini, N. and Sala-i-Martin, X. 1992. A Growth Model of Inflation, tax Evasion, and
Financial Repression. NBER Working Paper No. 4062
• Saini, K. G. 1982. The Monetarist Explanation of Inflation: The Experience of Six
Asian Countries. World Development, Vol. 10, No. 10, pp. 871-884
• Sidrauski, M. 1967. Inflation and Economic Growth. The Journal of Political
Economy, Vol. 75, No. 6, Dec. 1967, pp. 796-810
• Tuljapurkar, S. 2002. Demographic Forces in South Asia Through 2050: Population,
Economy, and Health, in Chambers, M. R. (ed.) South Asia in 2020: Future Strategic
Balances and Alliances, accessed from
https://www.strategicstudiesinstitute.army.mil/pdffiles/pub108.pdf#page=104
on May 15, 2008
• The World Bank. 2007. Agriculture for Development. World Development Report
2008
Page No.23 W.P. No. 2008-07-01
IIMA INDIA Research and Publications
Appendix 1- Country and Year Effects for predicting Per Capita Real GDP Growth Rate
Dependent Variable = Per Capita Real GDP Growth Rate R-Square = 0.8894 Adj R-Sq = 0.8659
Variable Label Parameter
EstimateStandard
Error Pr > |t| C2 China -3.47073 3.75479 0.3567C3 HongKong -0.91212 5.4509 0.8673C4 India -0.37474 1.43546 0.7944C5 Korea -3.92653 4.65671 0.4004C6 Malaysia -0.97745 3.90743 0.8028C7 Maldives -1.76821 4.00365 0.6593C8 Nepal 0.35867 0.68061 0.5989C9 Pakistan 0.7045 0.76779 0.3602C10 Phillipines 0.66555 3.80909 0.8615C11 Singapore -1.33881 5.54763 0.8096C12 Sri Lanka 2.19921 4.13759 0.5958C13 Thailand -2.80201 4.44369 0.5292Reference Country: Bangladesh
Dependent Variable = Per Capita Real GDP Growth Rate R-Square = 0.8894 Adj R-Sq = 0.8659
Variable Label Parameter
EstimateStandard
Error Pr > |t| Y2 1990 0.33945 0.61111 0.5793Y3 1991 -0.67104 0.60943 0.2725Y4 1992 -0.38426 0.61936 0.5359Y5 1993 -1.28789 0.64236 0.0467Y6 1994 -1.11691 0.6677 0.0963Y7 1995 -0.72403 0.71748 0.3144Y8 1996 -0.74442 0.73546 0.313Y9 1997 -0.91098 0.79489 0.2535Y10 1998 -2.31127 0.86318 0.0082Y11 1999 -2.38377 0.88593 0.0079Y12 2000 -2.46381 0.96233 0.0114Y13 2001 -4.07125 0.98567 <.0001Y14 2002 -4.47773 1.05286 <.0001Y15 2003 -4.90776 1.13283 <.0001Reference Year: 1989
Page No.24 W.P. No. 2008-07-01
IIMA INDIA Research and Publications
Appendix 2- Country and Year Effects for predicting Inflation Rate
Dependent Variable = Inflation Rate R-Square = 0.7083 Adj R-Sq = 0.6549
Variable Label Parameter
EstimateStandard
Error Pr > |t| C2 China 1.44581 1.14114 0.207C3 HongKong 0.00328 1.05453 0.9975C4 India 2.36161 1.05944 0.0272C5 Korea -0.59763 1.09293 0.5853C6 Malaysia -2.01147 1.0563 0.0586C7 Maldives 0.69598 1.05973 0.5123C8 Nepal 2.60204 1.05604 0.0148C9 Pakistan 2.64527 1.05413 0.0131C10 Phillipines 2.35942 1.05294 0.0264C11 Singapore -3.09247 1.05713 0.0039C12 Sri Lanka 5.15829 1.05844 <.0001C13 Thailand -1.05442 1.05236 0.3178Reference Country: Bangladesh
Dependent Variable = Inflation Rate R-Square = 0.7083 Adj R-Sq = 0.6549
Variable Label Parameter
EstimateStandard
Error Pr > |t| Y2 1990 -0.25678 1.13117 0.8207Y3 1991 -0.02573 1.14651 0.9821Y4 1992 1.29603 1.12526 0.2511Y5 1993 0.00869 1.12643 0.9939Y6 1994 -0.32365 1.12326 0.7736Y7 1995 0.12358 1.13396 0.9134Y8 1996 -0.588 1.12613 0.6023Y9 1997 -1.96812 1.13326 0.0843Y10 1998 -3.52182 1.20846 0.0041Y11 1999 -3.1544 1.15424 0.007Y12 2000 -5.31978 1.14516 <.0001Y13 2001 -5.69175 1.15761 <.0001Y14 2002 -5.0716 1.15122 <.0001Y15 2003 -5.46418 1.14679 <.0001Reference Year: 1989
Page No.25 W.P. No. 2008-07-01
IIMA INDIA Research and Publications
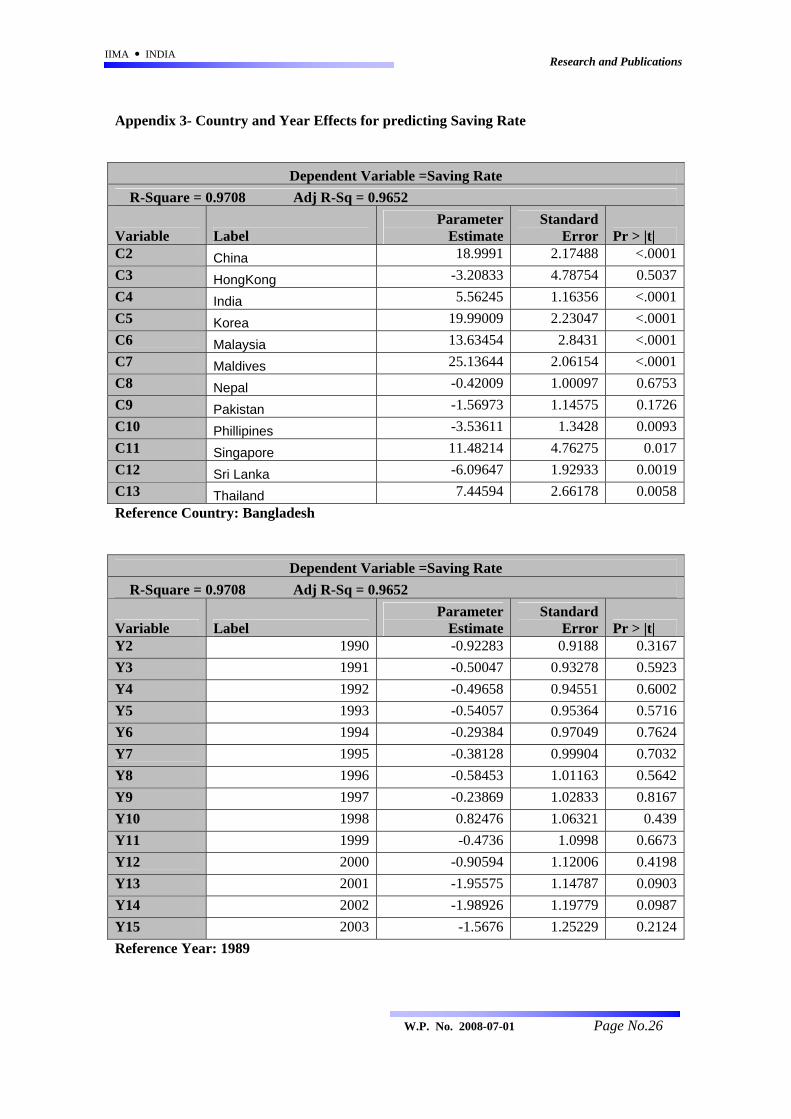
Appendix 3- Country and Year Effects for predicting Saving Rate
Dependent Variable =Saving Rate R-Square = 0.9708 Adj R-Sq = 0.9652
Variable Label Parameter
EstimateStandard
Error Pr > |t| C2 China 18.9991 2.17488 <.0001C3 HongKong -3.20833 4.78754 0.5037C4 India 5.56245 1.16356 <.0001C5 Korea 19.99009 2.23047 <.0001C6 Malaysia 13.63454 2.8431 <.0001C7 Maldives 25.13644 2.06154 <.0001C8 Nepal -0.42009 1.00097 0.6753C9 Pakistan -1.56973 1.14575 0.1726C10 Phillipines -3.53611 1.3428 0.0093C11 Singapore 11.48214 4.76275 0.017C12 Sri Lanka -6.09647 1.92933 0.0019C13 Thailand 7.44594 2.66178 0.0058Reference Country: Bangladesh
Dependent Variable =Saving Rate R-Square = 0.9708 Adj R-Sq = 0.9652
Variable Label Parameter
EstimateStandard
Error Pr > |t| Y2 1990 -0.92283 0.9188 0.3167Y3 1991 -0.50047 0.93278 0.5923Y4 1992 -0.49658 0.94551 0.6002Y5 1993 -0.54057 0.95364 0.5716Y6 1994 -0.29384 0.97049 0.7624Y7 1995 -0.38128 0.99904 0.7032Y8 1996 -0.58453 1.01163 0.5642Y9 1997 -0.23869 1.02833 0.8167Y10 1998 0.82476 1.06321 0.439Y11 1999 -0.4736 1.0998 0.6673Y12 2000 -0.90594 1.12006 0.4198Y13 2001 -1.95575 1.14787 0.0903Y14 2002 -1.98926 1.19779 0.0987Y15 2003 -1.5676 1.25229 0.2124Reference Year: 1989
Page No.26 W.P. No. 2008-07-01