Embed Size (px)
Citation preview
Inter-industry Linkages of Services in the Bangladesh Economy(With a Case Study of the Ready-made Garments Industry)
And Potential Service Trade
Dr. A. K. Azad
Consultant
World Bank, Washington, D.C.
Paper prepared for presentation at WTO2000 South Asia Workshop, organized by the NCAER and the
World Bank, held in New Delhi, India on 20-21 December 1999.

2
Executive Summary
1. The purpose of the present study has been to assess the direct and indirect contribution made by services
in the economy of a developing country like Bangladesh. With this aim in view, we tried to estimate the
direct and indirect linkages of services in the economy of Bangladesh. Since, the RMG industry presently
earns Bangladesh the largest amount of foreign exchange and is considered to be the leading 'growth
industry' of Bangladesh, we made a particular attempt to assess the contribution of services in RMG
manufacturing and exporting activity. These exercises, together with an examination of the current
international service trade of Bangladesh, made it possible to outline the future development and potential
international trade of services in Bangladesh.
2. It has been found that the service sector contributed most to the growth of GDP in Bangladesh. The share
of the service sector rose from 39% of GDP in 1976/77 to 62% in 1997-98. Within the service sector,
professional and miscellaneous services made the largest contribution followed by transport-storage-
communication services, housing services and so on. On the other hand, services like power-gas-water-
sanitation, public administration, professional and miscellaneous services recorded relatively high growth
rates. Yet higher than average price-inflation in these as well as housing and banking-insurance services
indicated a relatively large shortfall in their supply.
3. It has been found that services are used widely as inputs in commodity and service production. In
industrial production, service-contents are the largest per unit of output. This, in turn, implies that increased
industrial production will not only require an increased supply of inputs, but a cheaper and better supply of
services will help to reduce per unit costs of production. It has also been found that, in the industrial
sector, trade, electricity-gas and transport are the major services used.
4. It has been further observed that service production itself requires services as inputs and, in fact, the
service sector is the largest user of services as inputs in the Bangladesh economy. It has been found that

3
housing, electricity-gas, public administration, banking and insurance services are the big user of services
per unit of output. Moreover, the larger share of most of the services has been found to meet final demand
(as private and public consumption) and service sector as whole is the second largest employer after
agriculture. It provides employment to more than a quarter of the total employed labor force in
Bangladesh.
5. The examination of inter-industry linkages of services has revealed that while electricity-gas, transport-
communication and public administration create greater backward linkages, trade and banking-insurance
create larger forward linkages. On the basis of total direct linkages, electricity-gas, trade and banking-
insurance dominate all other services. Again, on the basis of total direct and indirect linkages, banking-
insurance, electricity-gas and transport services rank higher than other services. This means that an
increase in final demand for one unit of output of these services will bring forth a greater increase in total
output of the economy compared to other services. Regression analysis also confirms strong inter-industry
linkages of services with the commodity producing sectors (agriculture, industry) of the economy. It has
also been found that if agricultural and industrial production increases by one per cent, services will be
increasing by more than one per cent.
6. The study of the role of services in RMG industry has revealed that production-planning, input-
procurement, management-accounting, banking and insurance, shipping service, port service, transport
and communication service, electricity, legal counseling, sales and distribution, security, cleaning, housing
service, data processing, photocopying and some special services are widely used in RMG manufacturing
firms. Some of these services are internally procured, some are procured partly from internal sources and
partly from outside suppliers, and some services are entirely procured from outside suppliers. The outside
supplies of services, again, may come from domestic private suppliers or national government or may be
imported from abroad.
7. It has been further found that shipping services and sales and distribution services are almost entirely
imported from abroad by the RMG manufacturing industry as a whole.

4
8. The estimate of service use in RMG manufacturing industry has revealed that the RMG manufacturing
firms located in the Chittagong Zone have to incur relatively less in terms of transport costs than those
located in the Dhaka Zone. It was also found that medium and large firms consistently spent more on
travelling, entertainment and participation in trade fairs. No distinct variation was, however, found between
RMG manufacturing firms located in the export processing zones and those located in ordinary places, in
respect of service-use.
9. Calculations based on sample data and CMI data showed that the contribution of services in total RMG
production ranges between 20-25 per cent.
10. As for trade in services, it has been found that shipping service is the largest service imported by
Bangladesh. It accounted for roughly 12% of total commodity-imports and 37% of the trade-deficit in
1996-97. Travelling is the second largest import of services followed by banking and insurance service.
On the other hand, labor service is the largest service export from Bangladesh. Earnings from export of
labor service paid for 28% of total commodity imports and covered 90% of the trade-deficit in 1996-97.
11. As for the future development of services and services trade, it has been suggested that shipping services
should be developed on a priority-basis. Because it will, on the one hand, save our imports and, on the
other hand, create prospect of exporting shipping services by incorporating it in our RMG exports, i.e., by
exporting the output of RMG industry, using our own shipping services.
12. Dockyard/ship repairing and harbor services have been pointed out for development with the potential for
export to the northeastern region of neighboring India. It has been argued that Bangladesh may sell
transport services also to India in the same fashion, and that Bangladesh and India do not need any formal
transit/transshipment agreement signed between them in order to engage in such trade.
13. It is suggested that Bangladesh should allow foreign investors to set up tourist resorts and hospitals with
modern equipment in different parts of the country. It has been particularly suggested that a convention

5
center may be set up in Chittagong/Cox's Bazar in order to host international conferences and
conventions.
14. To expand the current export of labor services, it has been suggested that Bangladesh should institute
training programs for appropriate skill-development. But to sell data entry, data processing, accounting
and monitoring services through electronic media, Bangladesh may need to import improved and modern
communication services. Electricity-gas and communication sectors have been found to experience a large
shortfall in supply. Importation of these services has been suggested as an alternative to make up for the
shortfall in the supply of power.
15. Lastly, it was noted that the importation of communication, power services and the development of health
and tourists services, would require FDI.

6
Inter-industry Linkages of Services in the Bangladesh Economy(With a Case Study of the Ready-made Garments Industry)
And Potential Service Trade*
Dr. A. K. Azad**
Introduction
Gone are the days of Adam Smith, David Ricardo and Karl Marx when services were viewed as
unproductive and the mention of trade in services was hardly found in economics literature. However, things
have changed since then. Nowadays, services are recognized to constitute an important sector of the economy
no less than the agriculture or industry. Not only do services contribute significantly towards GDP and
employment in both developed and developing countries, the use of new technologies has made many services
storable, transportable and consequently, tradable. Lately, a large proportion of the world economic
transactions is taking place in service trade. Again, services may be classified as those consumed directly and
those used as intermediate inputs. These intermediate services, also known as 'producer services' play a much
more complex and important role in the development process than is suggested by their direct contribution to
gross domestic product (GDP) and employment-creation. This is reflected in the inter-linkages between
services and the rest of the
economy. Production and export in agriculture, industry and the service sectors require many services
--------------------------------------------------------------------------------------------------------------
-------

7
* An earlier version of this paper was presented at the WTO 2000: South Asia Workshop, organized jointly by the NCAER
and the World Bank, held in New Delhi on 20-21 December 1999.
** The author is Professor of Economics, University of Chittagong, Bangladesh. He expresses his deep gratitude to
Professor Robert M. Stern, Department of Economics and Public Policy, University of Michigan, U.S.A., for the latter's
extremely helpful comments and editorial suggestions on an earlier draft of this paper. The author also expresses his
gratitude to the World Bank for funding the research undertaken for writing this paper. He is further grateful to Dr. Zaidis
Sattar of the World Bank, Dhaka office, and Dr. Aaditya Mattoo and Mrs. Malina Savova of the World Bank, Washington
office, for help and constructive suggestions at various stages of the research. The author, however, is solely responsible
for any remaining error, omission or the opinion expressed in this paper.
like planning, coordination, banking, insurance, transportation and storage, utilities, telecommunication and
other infra-structural services. The lack of access to adequate and efficient services is considered as an
impediment to economic development in developing countries. National efficiency and the international
competitiveness of a country depend not only on the availability of adequate infra-structural services, but also
on an inter-linked ‘services infrastructure’ of producer services. So when the domestic supply of services is
inadequate or inefficient, the import of services is the other option left open to a country. Thus we see that
efficient production in the economy is inter-linked with adequate and efficient supply of services from both
internal and external sources. This again makes policies relating to trade and investment (including FDI) in the
service sector strategically important.
The objective of the present study is to examine the inter-linkages between services and other
activities of the Bangladesh economy. The study of such inter-linkages will help to identify services where
increased and better supply, requiring imports and FDI, will raise the general productivity of the economy.
Since the readymade garments (RMG) industry is the leading 'growth industry' of Bangladesh, we intend to
supplement our study of inter-industry linkages of services with reference to the RMG industry particularly.
The scheme of the paper is as follows: Section I presents a profile of the service sector in Bangladesh; Section
II examines the inter-linkages between services and other sectors of the economy; Section III explores the
role of services in the RMG industry of Bangladesh, Section IV discusses the potential service trade and
service-related FDI and, finally, Section V presents the summary of findings, policy implications and
conclusions.

8
Section I
Profile of the Service Sector in the Bangladesh Economy
Size and Growth
In order to understand the role of the service sector in the Bangladesh economy, let us examine its
size, components and growth rates over time. Table 1 shows that in 1973/74, services accounted for 39% of
overall economic activities, measured in terms of contribution to Gross Domestic Product (GDP). In 1986/87,
half of the GDP originated in the service sector and in 1997/98, the service sector's contribution rose to 62%
of total GDP. During the same period, agriculture's share in GDP declined from 51% to 29%. While the
agricultural sector's decline is consistent with the predictions of the 'stages of growth theories' 1, the very large
rise in the size of the service sector is not necessarily what these theories anticipated. The stage-sequencing
theories consider the growth in the service sector as a 'post-industrial' phenomenon2. We may, however,
consider the growth of service sector as a modern-day development phenomenon3, reflecting the growing role
of services in the modern mode of production (of both commodities and services) as well as satisfaction of
final demand. Within the service sector, the largest contributions have come from professional and
miscellaneous services (247 billion Taka) followed by the transport-storage- communication (TSC) services
(173 billion Taka), housing services (147 billion Taka), trade services (137 billion Taka)[Table 2]. Banking-
insurance, power-gas-water-sanitation (PGWS) services, public administration (including health and education
services) and construction services made relatively small contribution. This ranking is, of course, based on the
absolute contribution of various services. This does not say much about the growth of individual services over
time. In order to estimate the growth of real services we have fitted an exponential trend line to the time series
1 W.W. Rostow, The Stages of Economic Growth, (Cambridge, 1960).
2 D. Bell, The Coming of the Post-Industrial Society: A Venture in Social forecasting, (New York, 1973).
3 In Japan, labor movement to the service sector occurred before the movement to manufacturing. R. Minami, The
Economic Development of Japan, (London, 1986). p. 273. In Singapore, over 60 percent of the labor force were
employed in the service sector as early as 1920 and over 70 percent of GDP has originated in services since 1970. D.
Riddle, Service-led Growth: The Role of the Service Sector in World Development (New York, 1986), pp.5-6

9
data (in constant value) for each service sub-sector (Table 3). The resulting trend values are presented in
Table 4. The table shows that while services as a whole increased at an annual compound rate of 5.5%, some
specific services such as power-gas-water-sanitation service (17.1%), public administration (8.9%),
professional and miscellaneous services (7%) recorded higher growth rates. The growth of services has been
plotted on graphs also. Graph I shows the growth of service sector vis-a-vis agriculture and industries. Low
growth trends for agriculture and industries compared to services are evident. Graph II, on the other hand,
shows the changes in shares, represented by bar diagrams, of various services over time. It can be seen that
services like power-gas-water-sanitation and public administration (including public health and education)
which recorded relatively high growth rates, started rather with a small base.
The price behavior of services is shown in Table 5 for 1997-98. The GDP implicit deflator was 214.6
compared to 100 in 1984-85. But the corresponding price increases were much higher for professional and
miscellaneous services, housing, power-gas-water-sanitation services, banking-insurance and public
administration.
The use of services as inputs in industrial, agricultural and service production also creates demand for
services4. In 1976-77, 34% of the total output of the service sector was used as inputs (Table 6). Out of this,
15% was used by the industrial sector while the agriculture and the service sectors used 12% and 7%,
respectively. Compared to 1976-77, only 17% of the total output of the service sector was used as inputs in
1986-87 (Table 7). Moreover, the service sector itself was the largest user of services as inputs (7%) in
1986-87. This does not, however, mean that the use and importance of services as inputs declined. In fact, the
use of services as inputs rather increased in 1986-87, compared to 1976-77, by more than five times. In
1986-87, although the industrial sector was no more the largest user of services as inputs, it was, nevertheless,
the most intense user of services per unit of output. This can be verified by comparing the service-content of
output (per unit) of various sectors. In 1976-77, one Taka-worth output of the agricultural, industrial and
service sectors required, respectively, .09 Taka-, .19 Taka- and .07 Taka-worth services as inputs (Table 6).
In 1986-87, these service-requirements per unit of output were .07 Taka, .16 Taka and .07 Taka,
respectively (Table 7). Because of technical progress, the use of services per unit of output reduced but still
4 Services used as inputs in agricultural, industrial and service production are also known as 'producer services' and these
producer services play a far more important role in the development process than is suggested by their direct contributions
to GDP and employment. See UNCTAD, 'Services and the Development Process', Document No.TD/B/1008/Rev.1, p. 12.

10
industrial production possessed the largest service-contents per unit of output. The implication is that the
increase in industrial production (and for that reason, agricultural and service production too) will require
increased supply of services as inputs. Besides, the cheaper and better supply of service-inputs will reduce the
costs of production to a great extent in the industrial sector5.
Among the services, housing, health and education, though receive inputs from other sectors, do not
supply inputs to any sector (except for health sector supplying inputs to banking-insurance sector only).
Construction, electricity-gas, trade, transport, public administration, banking and insurance and professional &
miscellaneous services receive inputs from and supply inputs to most of the other sectors (Table 8). In the
industrial sector, after trade, electricity-gas and transport are the dominant service-supplier (3% and 2%
respectively) followed by professional services, banking insurance and construction (1% each) [Table 10].
Service production itself requires services as inputs. In 1976-77, service production used 12.5% of its
total output as input (Table 6). In 1986-87 service inputs used in service production accounted for 7% of the
total production (Table 7). The share of intra-service transaction was as high as 20% in housing followed by
electricity and gas (16%), public administration (12%), banking and insurance (8%) [Table 10].
The bigger chunk of most of the services produced go to meet the final demand as private and public
consumption. While trade services go entirely to meet input-demand, housing health and education services
are entirely exhausted to satisfy final consumption. The lowest proportion of services going to final demand is
in construction (18%) and electricity-gas (20%)6.
The sectoral employment shares have been reported in Table 9. In 1996, 27.3% of the total employed
labor force was employed in the service sector. Between 1974 and 1996, total employment increased by
5 In the process, the international competitiveness of the country also may get enhanced. See B. Hoekman, 'Assessing the
General Agreement on trade in Trade in Services', in Martin, W. and L. A. Winter (eds.), The Uruguay Round and
Developing Economies, World Bank Discussion Papers, No. 307, (Ch. 10, p.340)
6 Government of Bangladesh, Planning Commission, An Augmented Input-Output Table of Bangladesh Economy 1986-
87, p. 23

11
4.5% per annum. But employment in the service sector increased by about 6.9% per annum. Within the
service sector, growth of employment was the largest in construction (18.2%) followed by trade (10.7%),
electricity-gas (10.6%, banking-insurance (10.3%) and transport-storage-communication (10.0%).
So far, we have seen the contribution of services to GDP and employment in the Bangladesh
economy. But these are only the direct contributions of the services sector. Services make an even greater
contribution through its linkages with the rest of the economy. In the following section we will, therefore, make
an attempt to examine these inter-linkages.
Section II
Estimating Inter-linkages between Services and Other Sectors of the Economy
(A) Input - output Analysis
Method
The importance of inter-linkages of various sectors of the economy has been stressed by Hirschman7.
These inter-linkages are created as a consequence of each sector's role as a supplier of inputs to and receiver
of inputs from other sectors of the economy. In order to estimate the role of services as a supplier and receiver
of intermediate inputs, an ideal starting point is an input-output table of the economy.
As is commonly known, an input-output table gives the flow of goods and services from each sector
of the economy to different sectors of the economy over a period of one year normally. An input output table
is alternatively also called 'inter-industry transaction' table. Production of output in any sector of the economy
requires raw materials as well as labor and capital as inputs. The outputs produced, in turn, are used to satisfy
intermediate input demand as well as to satisfy final demand. The economy is divided into a number of sectors.
Each sector is represented in the input-output table by a row and a column. The row corresponding to a
7 A. O. Hirschman, The Strategy of Economic Development, New Haven, 1958.

12
sector gives the delivery of outputs of the sector while the column indicates the amount of inputs received by
the sector. Thus an entry into the cell corresponding to the i-th row and j-th column denotes the quantity of
output of sector i absorbed as input by sector j, and is represented by Xij. The output of sector j is
represented by Xj.
The inter-industry transaction table can be used to derive input-output coefficients. This is done by
dividing each column entry in the matrix by the total output of the sector. If we denote the input coefficient by
aij, then
Xij
aij = ---------Xj
The input-output coefficient 'aij' gives the amount of purchases from the i-th industry to support one unit of
output of industry 'j'. Suppose aij = .12. This means that each Taka worth of output of industry j will require
twelve paisa worth of input from industry i. The input-output coefficient, thus, gives the direct interdependence
among sectors of the economy. But this is only a partial picture of interdependence among various sectors of
the economy.
The total significance of any sector in the economy can be estimated by examining the inter-industry
linkage effects that represent the effect of a one unit increase in the autonomous portion of final demand on the
level of production in each sector. A sector may receive inputs from one or more other sectors. This reflects
the sector's backward linkage. Again, a sector may supply inputs to one or more other sectors. This indicates
the forward linkage of the sector with the sector/sectors to which it supplies inputs. Thus, backward linkages
refer to the interdependence of one industry through purchases of inputs from other industries/sectors. On the
other hand, forward linkages mean interdependence of one industry through sales to other industries/sectors.
However, these backward or forward linkages only measure the first round direct effects of inter-industry
relationships. But there are also important indirect linkages (second, third, fourth, .............. rounds). An
increase in sector j's output will require not only an increase in the output of the sectors supplying inputs to
sector j but also increased outputs of the sectors providing inputs to these sectors. Thus inter-industry or inter-

13
sectoral linkages have three components: (I) backward linkage effects, (ii) forward linkage effects and (iii) total
linkage effects. Specifically, these linkages may be defined as follows8:
∑ X ij i
LBj = ----------- = ∑ aij ;Xj i
∑ X ij i
LFi = -------------Zi
and
LTj = ∑ aij*
i
Where LBj denotes backward linkages of sector j, Xij denotes number of units of commodity i used in theproduction of commodity j; LFi denotes forward linkages of sector i; Zi denotes total demand for commodity iconsisting of intermediate demand for i, ∑ Xij, and the final demand for i, Yi ; LTj
jdenotes total linkages and aij
* = (1-aij)-1
Measurement of Linkages
For measuring the inter-sectoral linkages of the service sector in the Bangladesh economy, we have
used the input-output table of Bangladesh economy for the year 1986-87. This input-output table gives input-
output flow for 53 sectors of the Bangladesh economy. Since our purpose is to estimate the sectoral inter-
linkages of the service sector only, we have consolidated this 53 x 53 input-output table into a 12 x 12 input-
output table with 10 service sectors and agriculture and industry included (Table 8). From this input-output
8 P.A. Yotopoulos and J.B. Nugent, Economics of Development : Empirical Investigations (NewYork, 1976), p. 268

14
flow table, we have constructed a 12 x 12 input-output coefficient table 'A' (Table 10). From this table, we
have computed the Leontief-matrix [I-A] which, in turn, has been inverted to give [I-A]-1 (Table 11).
Results
The results of the exercise are reported in Table 12. In this Table, the backward linkage, forward
linkage, total direct linkage and total direct and indirect linkages of various service sectors and corresponding
ranking of the sectors have been given. Although this Table reports inter-linkages of agriculture and industrial
sectors too, these two sectors have been excluded from the sectoral ranking exercise. And this is because,
here, our main purpose is to see the ranking of various services only on the basis of their respective inter-
sectoral linkages.
Table 12 shows that electricity-gas, transport, public administration, health and construction services
create greater backward linkages in comparison with other services. In fact, for a unit increase in the output of
electricity, gas, transport, public administration and health, additional demand-creation for output of other
sectors ranges between 30% to 43%. Housing, construction and banking-insurance services spur demand for
other sector's output to the tune of 15 to 20% for a unit increase in their own output. Backward linkages, thus
represent the capacity of the corresponding services to generate demand for goods and services in other
sectors following an increase in their own output. Therefore, on the basis of backward linkages of services, it
is clear that investment in electricity-gas, transport, construction, banking-insurance, health and public
administration would have the most expansionary effects on the economy.
On the other hand trade, electricity-gas, banking-insurance and transport services accounted for
100%, 80%, 53% and 20%, respectively as inputs in the production of other sectors' output. Forward
linkages, thus, reflect the importance of the corresponding services as inputs for output of other sectors of the
economy. The importance of services as inputs for other sector's output implies that not only is their
availability essential for production to continue in other sectors of the economy but a cheap and better supply
of services will substantially reduce the costs of production of the goods in which they are used as inputs.

15
Forward linkages, therefore, represent the 'producer role' of services, and we can see the paramount
importance of trade, electricity-gas, banking-insurance and transport services in this respect.
Total direct linkages are obtained by adding the backward and forward linkages together, and
represent the capacity of the corresponding services to induce and to be induced in respect of production-
activity. Total linkages on the other hand represent both direct and indirect capacity of the services to spur
economic activity throughout the economy, following an increase in their own demand. On the basis of total
direct and total direct-indirect linkages, we can also see the dominant role of electricity-gas, banking-insurance
and transport services in the economy of Bangladesh. Services, therefore, represent both challenges and
opportunities for the policy-makers. The challenge is to find the way to make the services available in the
country at cheaper prices whereas the opportunity lies in the capacity of the services to induce economic
activity in the economy both as supplier and receiver of inputs.
We need now to consider two shortcomings of the input-output exercise presented above. First, the
input-output flow of goods and services relates to a particular year and second, the year for which the input-
output table is available is not a recent year. In order to circumvent these shortcomings, we have carried out
regression analysis.
(B) Estimating Linkages of Services by Regression Analysis
The table showing the contribution of agriculture, industry and services in GDP forms the basis of our
regression analysis. The nature of the regression exercise undertaken is that the absolute contribution of each
sub-sector of services to GDP is regressed on the absolute contribution of agriculture and industry in GDP, at
constant 1984-85 prices, for the period between 1984-85 to 1997-98 (Table 3). We have tried with both
linear and log-linear forms of regression equation:
(i) S = αo + α1 Ag. + α2 Ind.
(ii) Log S = µo + µ1 Log Ag. + µ2 Log Ind.
where,

16
S = contribution of each sub-sector of services in GDP
αo, µo = intercept
Ag. = contribution of Agriculture in GDP
Ind. = contribution of Industry in GDP
α1, µ1 = regression coefficient of Agriculture in equations (i) and (ii), respectively;
α2 µ2 = regression coefficient of Industry in equations (i) and (ii) , respectively.
The results of the regression exercise are presented in Tables 13-14. The results in both tables are
similar. The estimated coefficients, particularly for the industrial sector, are statistically significant in most of the
regression equations. The explanatory power of the estimated regression equations given by R2 is very high.
Durbin-Watson (D-W) test in the case of simple regression either indicates absence of serial auto-correlation
or is inconclusive about it presence. In the case of log-linear regression, of course, auto-correlation problem
seems to exist. But our purpose, here, is the identification of linkages instead of making precise prediction. So
serial auto-correlation of the 'disturbance' term does not pose a serious problem. However, in terms of the
number of statistically significant coefficients, value of R2 and value of the Durbin-Watson statistic, the simple
linear regressions seem to give a better 'line of best-fit' to the data than the log-linear regression. However,
both types of regression results confirm that strong linkages do exist between services and other commodity
producing sectors.
The interpretation of the regression coefficients is simple. For example, in equation (1) of Table 13, if
agricultural production increases by one Taka, it will require aggregate service input to the extent of 0.69
Taka. In equation (2) of Table 14, if industrial production increases by one Taka, additional construction
service will be required to the extent of .42 Taka. We can interpret the other regression equations also in the
same manner.
The log-linear regression equation fitted to the data above is the log transformation of the Cobb-
Douglas function9. Hence, µ1 and µ2 denote the input-elasticities and the sum (µ1 + µ2) gives changes in the
9 The log-linear equation Log S = µ0 + µ1 Log Ag. + µ2 Log Ind. (fitted to the data) is the log - transformation of the
equation S = A . Agµ1 . Ind µ2 which is similar to the Cobb-Douglas production function Q= AK α Lβ.

17
output of services following changes in inputs (output of agriculture and industry). The computed values have
been presented along with the regression results (Table 14). It may be observed that in all of the cases except
for trading and housing services, the sum of the input-elasticities is greater than one. The implication of the
finding is that if agricultural and industrial production increases by one percent, services would be increasing by
more than one percent.
Both the input-output and the regression exercises confirm that services have been using inputs from
the commodity producing sectors (agriculture, industry) and also are being used, themselves, as intermediate
inputs in agricultural and industrial production. Of course, intra-service use of services as inputs is also
significant.
Section III
Role of Services in the Ready-made Garments (RMG) Industry of Bangladesh
Starting in late 1970s as a small non-traditional sector of export, the Ready-made Garment (RMG)
industry has emerged as the largest foreign exchange-earner for Bangladesh. In 1997-98, Bangladesh's total
exports were 5161.2 million U.S. dollars. The RMG share was 55% of total exports and 61% of total
manufacturing exports from Bangladesh. Out of this total RMG-exports, 43% went to countries belonging to
the European Union (EU) and 40% went to the United States and Canada10. Currently, Bangladesh enjoys
preferential access in these markets. The removal of Multi-Fiber Agreement (MFA) quotas in the year 2004
under the Uruguay Round Agreement on Textiles and Clothing (ATC) will result in Bangladesh’s losing its
preferential access in the EU and American markets11. Consequently, Bangladesh will be compelled to
compete with other low-cost RMG-exporting countries of Asia and elsewhere. So the continuation of
Bangladesh's present success in RMG exports will depend on her ability to reduce costs and improve the
quality of output. In the preceding sections, we have seen the crucial role of services in manufacturing
production. In this section we examine the role of services in the RMG industry, particularly.
10 Government of Bangladesh, Export Promotion Bureau (EPB), Export From Bangladesh (1972-73-97-98), p.1
11 The World Bank and the Asian Development Bank, Bangladesh : Economic Trends and Policy Agenda, May 1998, p.17
18
The RMG manufacturers are scattered all over Bangladesh. But those who manufacture RMG for
exports only are mainly located in Dhaka and Chittagong. There are about 2,600 RMG manufacturers
registered with the Bangladesh Garment Manufacturers' and Exporters' Association (BGMEA). Time and
other constraints did not permit us to contact more than 100 RMG manufacturers. But because of general
aversion to disclose business information to outsiders, we were able to collect information only from 83 RMG
manufacturers. Again, information from some RMG manufacturers was not comprehensive. So we finally
settled for 74 RMG manufacturing units to carry out our analysis. Out of these 74 RMG manufacturing firms,
36 are located in Dhaka and 38 in Chittagong. Of the 38 RMG manufacturing units selected from Chittagong,
8 are located in the Chittagong Export Processing Zone (CEPZ) and the rest are situated in the city and its
surrounding areas. Of the 74 firms under study, 50 belong to an 'average group' employing up to 300 people,
15 belong to a 'medium group' employing more than 300 but less than 1,000 people and 9 belong to a 'large
group' employing more than 1,000 people.12
We now proceed to investigate the type of services used by RMG manufacturing firms and their level
of adoption, sources of supply and method of securing these services and, finally, estimate the extent of service
use in RMG manufacturing and exporting activity.
(A) Type of services used in RMG Manufacturing & Exporting:
Accordingly, we first describe below different services used in RMG production (Table 15) along with
their level of adoption and sources of procurement:
12 The classification of firms as 'average', 'medium' and 'large' is arbitrary. The CMI in Bangladesh follows the tradition of
classifying all manufacturing establishment with50+ workers as a large-scale manufacturing firm. But we know that the RMG
industry in Bangladesh is a labor-intensive manufacturing activity. So we computed the average employment per unit, which
has been found to be about 300 workers (in our sample). We, therefore, placed all firms, employing 300 or less people, in the
'average' group. For all the above-average firms, again a 'mean' value has been computed. The firms employing workers equal
to this 'mean' number or below, have been placed in the 'medium group'. The firms employing workers more than this 'mean'
number have been ranked as the 'large group'. On the basis of such calculations and some subjective consideration (for
example, rounding of the figure) we classified the firms in various groups.

19
Production Planning, Input procurement, Management and Accounting
After receiving orders from the customers, the RMG manufacturing firms carry out production
planning. All firms (100%) perform production planning without any formal outside help. On the other hand,
input procurement is carried out in almost 87% of the cases (64 out of 74) by the firms themselves if and when
they are the direct suppliers to the foreign buyers. In 13% of the cases foreign buyers supply inputs to the
RMG manufacturing firms. But RMG manufacturing firms that supply to the domestic RMG firms (for export)
receive inputs from the latter in 100% of the cases. That is, in such cases, input procurement is done 100%
outside the firm.
Management control and accounting are performed by almost all of the firms, and these are carried
out internally except in the case of a few large and joint-venture firms where the services of external audit firms
are used. Quality control is performed by all the firms, and it is done mostly internally (82%).
Banking and Insurance Service
Almost all firms (98%) turn to banks for working capital against their sales orders from abroad and
about 57% (42 out of 74) borrowed from banks to purchase their machines and equipment as well. Bank
loans are used invariably by all firms to buy inputs and to meet a certain percentage of running expenditure,
except for a couple of partially (joint- venture) and fully foreign-owned firms. All firms use banking services in
varying degree.
All firms have their machines and plants insured and, additionally, all input-importers (87%) and 15%
of the exporters get their imports/exports also insured.
Shipping Service and Shipping Agent & Port-use
Shipping service is widely used by RMG manufacturers. Shipping service is required for procuring
inputs and exporting outputs. Sometimes air-freight service is also used. RMG manufacturers have to hire
services of Clearing & Forwarding Agents for clearing inputs from the port/custom and loading the finished
goods onto ships for export. Port-charge is a normal expenditure by all RMG manufacturers for using the
port-facilities for the purpose of import and export.

20
Transport and Communication
Within the country, to get the imported inputs from the ports to the plant-premise and to carry the
finished goods to the ports, wheel transportation and rail transportation are the chief transport modes. Services
are also widely used by RMG manufacturing and exporting firms for moving cargo. Wheel transport service is
procured by almost all firms (about 98%) from independent transport companies and, only in a few cases,
from sister companies (belonging to the same parent organization). Railway service is used by 68% (50 out of
74) of the firms. Of course, when a particular firm operates as a subcontractor to the exporting firm, the
service-charges for wheel transport/railway transport are paid by the latter.
All RMG manufacturing firms use telephone, telex, fax and courier service extensively. All firms own
telephones, and about 62% (45 out of 74) firms own telex/fax machines. Several firms (about 10%) use the
Internet also. Of course, for maintenance of their communication equipment, all firms use external service.
Electricity
All firms use electricity supplied by the Government-owned Power Development Board (PDB).
Disruption in power supply hampers production in the RMG manufacturing firms. To overcome such
disruptions, about 70% firms (50 out of 74) own and use small power generators.
Legal Service
About 85% of the firms (61 out of 74) use legal service from professional legal consultants. Most
medium and large firms have one or more legal consultants employed on a permanent basis and hire others
(both local and foreign as per requirement) to look after the legal matters concerning the firms.
Sales and Distribution
Marketing services, in the form of securing orders for output, are performed by the firms themselves
except for those who work as subcontractors to the exporting firm.
21
In Bangladesh, RMG manufacturers who export to foreign countries do not normally take the service
of electronic or print media to advertise their products. They do, however, organize and participate in trade
fairs to display their products to and secure orders from foreign distributors. Almost all firms (99% per cent)
get their products distributed in foreign markets by foreign distributors. Only one joint-venture firm in the
sample was found to secure distribution of its product by its foreign-owner.
Security, Cleaning and Housing Services
All firms have their own security and cleaning staffs to maintain security and tidiness of their plant-
premises. The plant-premises are secured on a rental basis in 95% cases (62 out of 66 firms located outside
export processing zone).
Data Processing and of Photocopy
About 25% of the firms (18 out of 74) own one or more than one computer. Data processing is
carried out internally in all the firms with computers or without computers. Maintenance service for computers
is, of course, secured from outside, normally, the computer- supplier. About 30% of the firms (23 out of 74)
own a photocopy machine, although all firms use photocopy service in variable amount.
Special Services
RMG manufacturing firms use some special services that they get by dint of their membership in some
association or location in a certain area of the country. For example, the BGMEA lobbies on behalf of all
members, with national and foreign governments and international organizations to facilitate and promote RMG
trade. It organizes trade fairs for display of wares produced by the members, arranges for participation of
members in international trade fairs, provides the members with various relevant information, gives them legal
and other aid/assistance and so on. Again, the RMG manufacturing firms located in export processing zones
enjoy certain privileges and facilities which are not available to firms located in other areas. For example,
RMG manufacturing firms located in the Chittagong Export Processing zone enjoy the privilege of getting their
cargo containers cleared (by the custom) right at their own plant-premise instead of at port-sheds. This
enables the firms to avoid losses incurred through pilferage of their wares (imported/intended for export)
during clearance at the port sheds. Again, the firms located in the export processing-zone secure the

22
connection to some services such as telephone, electricity, water, etc. almost instantly whereas in other areas
of the country it takes months/years for getting connection for these essential services. Of course, firms have to
pay for such special services in terms of their membership subscription to the association or in terms of higher
rent for their plant premises.
(B) Supply of Services
We have seen that services are widely used in RMG manufacturing and exporting activities. Now we
turn to examine the sources of supply of these services:
Own Supply
Securing orders from buyers, planning production, managing the implementation phase and controlling
the accounts are all indispensable services to carry out production activity. Hence these services are
internalized, i.e., supplied by the RMG manufacturing and exporting firm internally. Security, cleaning, legal
service, data processing, etc. may be internally supplied or obtained entirely from outside or may be supplied
partly internally and partly externally (from supplier outside the firm). The firms decide on the sources of
securing these services according to convenience and cost effectiveness and, in this respect, no systematic
variation has been observed among the firms irrespective of their size and location.
External Supply
On the other hand, services like shipping, transport, communication, banking-insurance, etc. are
supplied entirely from outside the RMG manufacturing and exporting firms. Again, these services are supplied
by private firms and/or government-owned institutions. While wheel transportation is entirely supplied by
private suppliers, railway service is a government monopoly. Within the country, airfreight is also a government
monopoly. In telecommunication service, government is the dominant supplier. Private telephone service, on a
limited scale, is a recent introduction. In banking and insurance also, government is the major supplier. Apart
from the poor quality, the government-supplied services are also known for their comparatively high costs.
Government Supply

23
Other than the services that government-owned organizations supply in parallel with the private-
suppliers, there are some services for which government is the sole supplier. These services are electricity,
water supply, satellite communication, port-service, rail transport, international shipping service (by national
carrier) and so on. Government monopoly in the supply of these services more often leads to high costs and
low quality of the services supplied.
Imported Services
There are some services that are partially or fully imported by the RMG manufacturing and exporting
firms. The Bangladesh-made RMG are distributed and sold in foreign markets entirely by foreign business
firms. Foreign shipping services are imported to the extent these are used for importing inputs, machines and
exporting the finished goods produced by the RMG manufacturing firms. Banking and insurance services are
imported to the extent that RMG manufacturing firms use such services supplied by the foreign-owned banks
and insurance companies. Legal services also are imported to the extent that Bangladeshi RMG manufacturing
firms use such services supplied by foreign nationals/legal consulting firms.
Supply of Special Services
Special services are supplied by specialized institutions. For example, the BGMEA has been
established for providing services to its members. On the other hand, special services provided by the export-
processing zones can be enjoyed by only those firms that are located in such special economic zones. So far
such services have been provided by the government owned export-processing zone only. From now on, such
services may be obtained from private export processing zones also. Since a foreign-owned export processing
zone (Korean Export Processing Zone, for example) has already started its operation in Bangladesh, it means
that special services, provided by the export processing zones, may now be imported too.
(C) Estimate of Service use in RMG Manufacturing and Exporting Firms
We have seen that services are widely used by RMG manufacturing and exporting firms in
Bangladesh. Here we intend to estimate the extent of such service-use in RMG manufacturing and exporting
activity. Our survey of RMG manufacturing and exporting firms gives us information on the yearly output, raw
material use and the use of different services for 74 firms. These are reported in Table 16. For estimating total
24
service use, expenditure on transport, shipping, shipping agent and port charge, electricity, security and
cleaning, rent for the plant premise, legal service, telephone telex/fax charges, photo copy, participation in
trade fairs, travelling-entertainment, repair and maintenance, bank and insurance fee, association fee were
recorded separately. It has been observed that the firms located in the Chittagong Zone spent relatively less on
transport use than those located in the Dhaka Zone. Again, it also has been found that medium and large firms
consistently spent more on travelling, entertainment and participation in trade fairs. No distinct variation in
service-use between the RMG manufacturing and exporting firms located in export-processing zones (EPZ)
and those located in ordinary places was found. The reason may be that services supplied to the EPZ and
those supplied to other area of the country vary in quality only (prompt and regular supply), not in costs. The
difference was expected, to be reflected by the differences in rent paid (for plant-premise) by the firms located
in EPZ and those located in other areas of the country. But all the firms located in EPZ owned their plant
premises. So the rent was imputed (and hence, subjective) rather than actual costs. In any case, we were able
to calculate the total expenditure on different services incurred by the RMG manufacturing and exporting firms
in our sample survey. And the ratio of services to total output has been calculated to be .253 (from Table 16).
This means that the contribution of services in total RMG production is around 25%.
Since our sample size for the above exercise was small, we tried to supplement our finding on the
contribution of services in RMG production by an estimation using data from published sources. We used data
from the Census of Manufacturing Industries (CMI) 1989-90, the Input-Output Table of the Bangladesh
Economy for 1976/77, the Input-Output Table of the Bangladesh Economy for 1986/87, and also various
publications of the Bangladesh Bureau of Statistics (BBS) in order to obtain a separate estimate.
The CMI data were available for the year 1989-90 (published in 1994). The information on more than
700 RMG manufacturing and exporting firms has been reported. But data on service use by the RMG
manufacturing and exporting firms are not available directly. For example, CMI reports expenditures on
advertising, banking and insurance, legal and accounting services, consultative service, telephone, postage, etc.
under the heading of 'Non-industrial Costs'. Electricity costs have been reported under the heading of
'Industrial Costs' along with raw material costs. Costs of repair and maintenance have been reported
separately. On the other hand, shipping costs and transport costs have not been reported anywhere. So we

25
had to estimate transport and shipping service inputs going into RMG manufacturing. CMI reported 'raw
material costs' which included transport and shipping costs. Since almost the entire supply of raw materials
came from imports, both shipping costs and transport costs were involved. From the values for total imports
and total transport services going into imports, reported in the Input-Output Table 1986/87, we have
computed the input-coefficient for transport services going into imports and it has been found to be .09. Again,
the ratio of freight and insurance costs to total imports (f.o.b) has been computed for the last eight years
(1989-90 to 1996-97) and it has been found that for most of the years, the value for this ratio has been 0.11.
We have used this value as the input-coefficient for shipping services going into imports. Now using the input-
coefficients for transport and shipping service going into import along with the value of raw materials reported
in CMI, we have estimated the transport service and shipping service used in the RMG manufacturing. These
estimates along with other components of service-use are reported in Table 17, which, in turn, enabled us to
compute the contribution of services in RMG manufacturing. The contribution of services to RMG
manufacturing has been calculated to be 21%. On the basis of this exercise along with the findings from our
sample survey, it may be concluded with some degree of certainty that the contribution of services in RMG
manufacturing ranges between 20-25 per cent. But what is even more important is that this contribution can be
made to exceed 30 per cent or so of the RMG manufacturing and exporting activity. This point will be dealt on
more elaborately in the following section.
Section IV
Current and Potential International Trade in Services for Bangladesh
We have seen that services play an important role in the agricultural and industrial production of
Bangladesh. Services make strong direct and indirect contribution to the production of goods as well as
services. We have further seen that the contribution of services to the largest foreign-exchange earning
industry, the RMG manufacturing, is also substantial. We have seen that these services are procured from both
domestic and external sources. It is well recognized that a prompt, adequate and better supply of services can
26
increase national productivity significantly. Where the supply of services falls short of total demand, import is
the alternative left open.
(A) Current Service Trade
Table 18 shows that currently Bangladesh incurs the largest amount of foreign exchange for importing
shipping services. It accounted for roughly 12% of the total commodity-imports and 37% of the trade-deficit
in 1996-97. Travelling abroad by the nationals of Bangladesh is the second largest service-import (Table 19).
The presence of a good number of foreign banks in Bangladesh and import of insurance services for almost all
commodity imports in Bangladesh make the banking and insurance services the third largest import of services
in Bangladesh.
Regarding the export of services from Bangladesh, it may be seen from Table 18 that manpower
export is the largest service export from Bangladesh---second only to RMG exports. In fact, even in the early
1990s, manpower export earned Bangladesh the largest amount of foreign-currency. Today, the remittances
by Bangladeshi skilled- and unskilled-workers working abroad provide for 27 per cent of the total
commodity-imports of Bangladesh and cover 90% of the trade-deficit of the country.
(B) Development of Services and Potential Service Export/Import
We have seen that shipping service is not only the largest service import by Bangladesh, almost our
entire exports, particularly RMG exports, go abroad by foreign vessels. Hence development and expansion of
shipping service should be a natural choice. It will be import-saving, on the one hand, and export-augmenting,
on the other. We have seen that shipping service accounts for more than one-third of the total service-use in
RMG manufacturing. This, of course, does not include the shipping services used in RMG export. Since RMG
is our largest foreign-exchange earner, and if we can export RMG by using our own shipping services, it
means that we shall be exporting a huge amount of shipping services as well. It is only needless to mention that
in such a prospective case, the contribution of services will go up further in total RMG manufacturing and
exporting activity.

27
Related to shipping service are the dockyard/ship repairing services and port facilities. Even if the
development and expansion of these services require foreign direct investment (FDI) and hence involve import
of services initially, it will be profitable in the long run. For, these services hold a great prospect for export.
Particularly, the port services can be exported to the northeastern region of neighboring India by way of re-
exporting to this region commodities imported through the ports of Bangladesh.
In the same fashion, Bangladesh may export transport services also to India. Movement of goods
between northeastern and western India through Bangladesh territory is cheaper than that through alternative
Indian route. For such trade, India and Bangladesh, of course, need not sign a formal transit/transshipment
agreement, which has recently created a very bitter political controversy in Bangladesh. Bangladeshi business
firms (Bangladesh-India Joint venture firm as well) may import the relevant goods in normal way and re-export
them to the Indian businessman on the Eastern or Western border of Bangladesh as the demand for the goods
requires. All Bangladesh and India need to do is to sign a trade-protocol agreeing not to impose tariff on such
movement of goods between the two countries. In this way Bangladesh can sell (export) transport services to
India and India can have its own output cheaply transported between her Eastern and Western regions.13
We have seen that Bangladesh imports huge amount of tour/travel services for her nationals. To offset
such imports, Bangladesh can only develop and export its own travel services. As a part of development of
tour/travel service, Bangladesh currently allows foreign companies to set up five-star hotels in Bangladesh.
Besides this, Bangladesh should also allow FDI in tourist resort development in Bangladesh. Particularly an
International Convention Center may be set up in Chittagong/Cox's Bazar to host international/regional
conferences and conventions. This will raise the tourism prospect of these two places.
Currently, many people go abroad for medical treatment (see Table 19). Bangladesh may encourage
foreign investors to set up hospitals with most modern equipment. This will reduce the flow of Bangladeshi
nationals going abroad for medical treatment.
13 A K. Azad, ‘Transit/Transshipment Agreement: An Economic Alternative to a Political Controversy.’ Paper presented at
a seminar organized by the Dept. of Economics, University of Chittagong, Bangladesh, on October 7, 1999.

28
Bangladesh earns a substantial amount of foreign exchange by exporting labor services abroad. A
striking degree of complementarity between the petroleum exporting countries of West Asia and the
developing countries of South Asia/North Africa has enabled Bangladesh to export both skilled and unskilled
labor. Given Bangladesh’s abundant labor supply, in order to expand further the export of labor services,
Bangladesh should arrange for training of its labor force according to current and expected future development
of labor service-demand abroad.
But export of labor services involves cross-border movement of labor. Recently, there has been a
significant increase in the barriers to cross-border movement of such labor, seriously threatening this mode of
service-export. So Bangladesh should try to export its labor services by selling data entry, data processing,
accounting and monitoring services abroad through electronic media. This again will require development of
easy, cheap and improved telecommunication services. Since the development of communication service
requires huge investment and sophisticated technology, Bangladesh should try to attract foreign investors to
invest in telecommunication infrastructure14. Finally, power service's (electricity-gas) irregular, interrupted,
inadequate and costly supply is the cause of millions of man-hour losses in Bangladesh. High costs of power
supply raises production cost. So the importation of electricity-gas service should get top priority in the import
list of services. It may be remembered, here, that electricity-gas and communication are the services that have
been found to be in short supply and have experienced higher than average price-inflation in the past. Again,
importation of these services requires FDI also.
With this we conclude our discussions of the current and potential international trade in services for
Bangladesh. The summary of the findings of the study and conclusions follow.
Section V
Summary of Findings and Conclusions
14 The World Bank’s Country Report also recognizes the large investment and fast moving technology involved with the
development of communication services and stresses the need for partnership between Bangladesh and transitional
companies (TNC s). The World Bank, Op. cit. p.16.
29
(A) Summary of the Findings
The purpose of the present study has been to assess the direct and indirect contribution made by
services in the economy of a developing country like Bangladesh. With this aim in view, we tried to estimate
the direct and indirect linkages of services in the economy of Bangladesh. Since, the RMG industry presently
earns Bangladesh the largest amount of foreign exchange and is considered to be the leading 'growth industry'
of Bangladesh, we made a particular attempt to assess the contribution of services in RMG manufacturing and
exporting activity. These exercises, together with an examination of the current international service trade of
Bangladesh, made it possible to outline the future development and potential international trade of services in
Bangladesh. The findings of the study may be summarized as follows:
It has been found that the service sector contributed most to the growth of GDP in Bangladesh. The
share of the service sector rose from 39% of GDP in 1976/77 to 62% in 1997-98. Within the service sector,
professional and miscellaneous services made the largest contribution followed by transport-storage-
communication services, housing services and so on. On the other hand, services like power-gas-water-
sanitation, public administration, professional and miscellaneous services recorded relatively high growth rates.
Yet higher than average price-inflation in these as well as housing and banking-insurance services indicated a
relatively large shortfall in their supply.
It has been found that services are used widely as inputs in commodity and service production. In
industrial production, service-contents are the largest per unit of output. This, in turn, implies that increased
industrial production will not only require an increased supply of inputs, but a cheaper and better supply of
services will help to reduce per unit costs of production. It has also been found that, in the industrial sector,
trade, electricity-gas and transport are the major services used.
It has been further observed that service production itself requires services as inputs and, in fact, the
service sector is the largest user of services as inputs in the Bangladesh economy. It has been found that
housing, electricity-gas, public administration, banking and insurance services are the big user of services per
unit of output. Moreover, the larger share of most of the services has been found to meet final demand (as
30
private and public consumption) and service sector as whole is the second largest employer after agriculture. It
provides employment to more than a quarter of the total employed labor force in Bangladesh.
The examination of inter-industry linkages of services has revealed that while electricity-gas, transport-
communication and public administration create greater backward linkages, trade and banking-insurance
create larger forward linkages. On the basis of total direct linkages, electricity-gas, trade and banking-
insurance dominate all other services. Again, on the basis of total direct and indirect linkages, banking-
insurance, electricity-gas and transport services rank higher than other services. This means that an increase in
final demand for one unit of output of these services will bring forth a greater increase in total output of the
economy compared to other services. Regression analysis also confirms strong inter-industry linkages of
services with the commodity producing sectors (agriculture, industry) of the economy. It has also been found
that if agricultural and industrial production increases by one per cent, services will be increasing by more than
one per cent.
The study of the role of services in RMG industry has revealed that production-planning, input-
procurement, management-accounting, banking and insurance, shipping service, port service, transport and
communication service, electricity, legal counseling, sales and distribution, security, cleaning, housing service,
data processing, photocopying and some special service are widely used in RMG manufacturing firms. Some
of these services are internally procured, some are procured partly from internal sources and partly from
outside suppliers, and some services are entirely procured from outside suppliers. The outside supplies of
services, again, may come from domestic private suppliers or national government or may be imported from
abroad.
It has been further found that shipping services and sales and distribution services are almost entirely
imported from abroad by the RMG manufacturing industry as a whole.
The estimate of service use in RMG manufacturing industry has revealed that the RMG manufacturing
firms located in the Chittagong Zone have to incur relatively less in terms of transport costs than those located

31
in the Dhaka Zone. It was also found that medium and large firms consistently spent more on travelling,
entertainment and participation in trade fairs. No distinct variation was, however, found between RMG
manufacturing firms located in the export processing zones and those located in ordinary places, in respect of
service-use.
Calculations based on sample data and CMI data showed that the contribution of services in total
RMG production ranges between 20-25 per cent.
As for trade in services, it has been found that shipping service is the largest service imported by
Bangladesh. It accounted for roughly 12% of total commodity-imports and 37% of the trade-deficit in 1996-
97. Travelling is the second largest import of services followed by banking and insurance service. On the other
hand, labor service is the largest service export from Bangladesh. Earnings from export of labor service paid
for 28% of total commodity imports and covered 90% of the trade-deficit in 1996-97.
As for the future development of services and services trade, it has been suggested that shipping
services should be developed on a priority-basis. Because it will, on the one hand, save our imports and, on
the other hand, create prospect of exporting shipping services by incorporating it in our RMG exports, i.e., by
exporting the output of RMG industry, using our own shipping services.
Dockyard/ship repairing and harbor services have been pointed out for development with the potential
for export to the northeastern region of neighboring India. It has been argued that Bangladesh may sell
transport services also to India in the same fashion, and that Bangladesh and India do not need any formal
transit/transshipment agreement signed between them in order to engage in such trade.
It is suggested that Bangladesh should allow foreign investors to set up tourist resorts and hospitals
with modern equipment in different parts of the country. It has been particularly suggested that a convention
center may be set up in Chittagong/Cox's Bazar in order to host international conferences and conventions.

32
To expand the current export of labor services, it has been suggested that Bangladesh should institute
training programs for appropriate skill-development. But to sell data entry, data processing, accounting and
monitoring services through electronic media, Bangladesh may need to import improved and modern
communication services. Electricity-gas and communication sectors have been found to experience a large
shortfall in supply. Importation of these services has been suggested as an alternative to make up for the
shortfall in supply.
Lastly, it was noted that the importation of communication, power services and the development of
health and tourists services, would require FDI.
(B) Concluding Remarks
The present study has demonstrated that services make important direct and indirect contributions to
the economy by supplying and receiving inputs, providing employment, earning foreign exchange and meeting
final demand as private and government consumption.
The study of the role of services in a least developed country like Bangladesh has revealed that the
growth of services is not necessarily a 'post-industrial' phenomenon. Growth in the service sector may occur
even before full-scale industrialization is in place.
The strong interdependence between industry and services, revealed by the assessment of inter-
industry linkages, implies that the lack of growth of services, particularly producer services, may prove to be a
bottleneck to the growth of the industrial sector.
The 'bottleneck' caused by the shortage in domestic supply of services may, of course, be relaxed by
increasing the supply of services through imports. But, unlike commodities, import of services to meet
domestic demand may require FDI in some cases.
33
The constraints to growth of the domestic economy may be eased by importation of services
that, in turn, may require FDI. The importance of services for a developing country like Bangladesh highlights
the significance of the prospective WTO services negotiations. These negotiations should stress the need for
granting greater access into the developed countries of services in which the developing countries, like
Bangladesh, have a comparative advantage.
National strategy for future development of services should recognize the inter-industry linkages of
services. A country will benefit more from the development of services having strong and substantial inter-
linkages with the industries that are nationally important and/or internationally competitive. Again, the
development of services having significant backward linkages with industries, will expedite the process of
industrialization itself.
On the whole, the development of services should be viewed neither as an alternative nor as an
appendage but as complementary to industrial development. Hence, services deserve great care and attention
in their own right.

34

Table 1
Sectoral Percenage Shares in the Bangladesh Economy
Sectors 1973/74 1976/76 1984/85 1986/87 1997/98
Agriculture 51.0 46.0 42.0 41.0 29.0
Industry 10.0 10.0 10.0 8.0 9.0
Services 39.0 44.0 48.0 51.0 62.0
Total 100.0 100.0 100.0 100.0 100.0
Source: Based on nominal values and calculated from Bangladesh Economic Survey 1998, Min. of Finance,
Govt. of Bangladesh (GOB).

Table 2
Sectoral Percentage shares of Services in the Bangladesh Economy
1984-85 1985-86 1986-87 1987-88 1988-89 1989-90 1990-91 1991-92 1992-93 1993-94 1994-
1995
1995-1996 1996-1997 1997-1998
(Provisional)
All Services
(billion Taka;
current price)
197 234 271 314 359 402 460 512 567 619 696 787 860 950
Construction 11.6 11.1 10.7 10.8 10.9 10.7 10.2 10.5 10.0 9.7 9.9 9.8 9.6 9.7
(92)
PGWS 1.9 1.3 1.1 1.6 1.9 2.2 2.4 2.7 3.1 3.2 3.4 3.6 3.5 3.5
(33)
TSC 23.2 23.5 22.9 21.0 20.1 18.7 21.3 21.3 21.7 20.8 19.9 18.9 18.7 18.2
(173)
Trade 19.7 17.5 17.0 15.9 15.3 15.4 14.8 14.4 13.7 13.9 14.5 14.8 14.6 14.3
(137)
Housing 16.2 15.8 15.1 15.9 16.7 16.4 16.1 15.4 15.3 15.7 15.5 15.9 15.6 15.4
(147)
Pub. Ad & Def. 6.5 7.3 7.7 7.9 8.1 8.2 8.2 8.5 8.6 8.8 8.9 9.0 9.3 9.7
(92)
Banking &
Insurance
3.5 3.8 3.7 3.5 3.6 3.7 3.5 3.5 3.5 3.4 3.3 3.3 3.3 3.2
(30)
Professional &
Misc.
17.6 19.7 21.8 23.2 23.4 24.6 23.5 23.6 24.0 24.5 24.5 24.6 25.3 26.0
(247)
Total 100.0 100.0 100.0 100.0 100.0 100.0 100.0 100.0 100.0 100.0 100.0 100.0 100.0 100.0
Source: Bangladesh Economic Survey, 1995, 1998; Min. of Finance, GOB [Calculated; Figures may not add up to 100.0 because of rounding error;
Figures in the bracket give absolute contribution of services in billion Taka (current)].

Table 3
Contributions of Different Sectors of the Bangladesh Economy, 1984-85 to 1997-98
(1984-85 constant price; billion Taka)
1984-85 1985-86 1986-87 1987-88 1988-89 1989-90 1990-91 1991-92 1992-93 1993-94 1994-95 1995-96 1996-97 1997-98
Provisional
Agriculture 170 176 178 175 173 190 193 198 201 202 200 207 220 227
Industry 40 41 44 44 46 49 50 54 60 64 69 73 75 81
All Services 197 208 221 236 248 259 272 284 299 318 341 362 385 410
Construction 23 23 25 27 29 30 31 32 34 36 39 40 42 45
PGWS 2 3 3 4 5 6 7 8 9 10 11 12 13 13
TSC 46 47 52 54 56 59 61 63 66 70 74 78 83 89
Trade 39 39 40 42 44 45 47 49 51 53 59 65 69 73
Housing 32 33 35 36 37 38 39 41 42 44 45 47 49 51
Pub. Ad & Def. 13 16 17 19 25 20 22 24 26 28 31 34 36 40
Banking &
Insurance
7 9 9 9 9 10 10 10 10 11 11 11 12 12
Professional &
Misc.
35 38 40 45 47 51 54 57 62 66 70 75 80 86
Total 407 425 443 455 467 498 514 536 560 584 610 642 680 718
Source: Bangladesh Economic Survey, 1995,1998, Min. of Finance, GOB.

Table 4
Results of Trend of Services
Trend on time of : Estimated (exponential) Model Computed t- value R2 Compound Growth Rates (percent)
All Services Y = 197 (1.055)t 105.24** .999 5.5
Construction Y = 23 (1.050)t 70.59** 0.998 5.0
PGWS Y = 2 (1.171)t 24.44** 0.980 17.1
TSC Y = 46 (1.048)t 72.29** 0.998 4.8
Trade Y = 39 (1.041)t 19.12** 0.968 4.1
Housing Y = 32 (1.035)t 106.82** 0.999 3.5
Pub. Adm. Y = 13 (1.089)t 24.42** 0.980 8.9
Banking & Ins. Y = 7 (1.047) 13.84** 0.941 4.7
Professional & Misc. Y = 35 (1.070) 108.17** 0.999 7.0
Note: PGWS = Power-Gas-Water-Sanitation ; TSC = Transport -storage-communication; ** indicates significance at 99% level.

Table 5
Implicit GDP and Sectoral Deflators, 1984-85 to 1997-98
Sectors 1984/85 1994/95 1995/96 1996/97 1997/98
Gross Domestic Product(GDP) 100 191.9 202.6 206.3 214.6
Agriculture 100 180.8 188.3 186.7 195.7
Industry 100 163.0 170.8 173.1 178.1
Services:
Construction 100 179.3 190.8 196.8 204.8
PGWS 100 208.5 229.8 239.3 245.6
TSC 100 187.4 190.3 194.3 195.4
Trade 100 171.4 182.0 181.7 188.1
Housing 100 235.1 263.9 275.5 287.6
Pub. Adm. 100 201.2 211.0 220.0 228.4
Banking & Ins. 100 208.5 229.8 239.3 244.9
Prof. & Misc. 100 243.3 258.9 270.9 287.7
Source: Monthly Statistical Bulletin (August 1998), BBS

Table 6
Use of Different Sector's Output in the Bangladesh Economy, 1976/77
(in percentage)
Agriculture Industry Services Total Input Demand Final Demand
Agriculture 10.4
(.104367)
11.4
(.193734)
1.7
(.022837)
23.5 76.5
Industry 7.1
(.041336)
26.6
(.266525)
28.8
(.228267)
62.5 37.5
Services 12.2
(.090338)
14.8
(.187001)
6.6
(.065776)
33.6 66.4
Total Output (Million Taka) 69592.30
(.236041)
41001.67
(.647260)
51753.52
(.316880)
Note: Computed from the Input-output Table of Bangladesh Economy 1976-77. The values in the parentheses denote the
input-coefficient.

Table 7
Use of Different Sector's Output in the Bangladesh, 1986/87
(In percentage)
Agriculture. Industry Services Input Demand Final Demand
Agriculture.
13.1
(.130778).
9.8
(.168360)
0.7
(.004679)
23.6 76.4
Industry 8.4
(.052613)
36.6
(.366161)
35.1
(.127386)
80.1 19.9
Services 4.2
(.067325)
6.0
(.164821)
7.1
(.071511)
17.3 82.6
Total Output
(Million Taka)
326095.9
(.250714)
189692.6
(.699344)
522480.61
(.203577)
Note: Computed from the Input-output Table of Bangladesh Economy 1986-77. The values in the parentheses
denote the input-coefficient.

Table 8
Input - Output Flow Table 1986-87
(Million Taka)
Agriculture Industry construction Electric &
Gas
Trade Transport Housing Health Education Public Adm. Banking Prof. & Misc.
Agriculture 42645.65 31936.75 1345.51 0 146.6681 0 0 242.7308 0 657.9062 52.0215 0
Industry 17156.77 69458.0 41573.65 2461.555 1264.961 12887.19 88.7661 1673.943 241.6973 4506.882 769.3706 1088.696
Construction 919.9707 1107.38 0 64.1126 9.5476 1951.878 8749.523 20.4076 33.5371 248.7807 80.8388 108.0936
Electric & Gas 1005.535 3819.014 134.255 1168.795 169.3652 430.0248 0 40.4148 36.395 287.7642 36.9695 109.0098
Trade 13780.55 18332.62 0 0 0 127.7495 0 0 0 0 5.3749 31.7011
Transport 4172.445 4076.575 61.6662 40.7869 20.4432 1656.45 0 7.1233 13.8473 1020.594 124.8717 65.5789
Housing 0 0 0 0 0 0 0 0 0 0 0 0
Health 0 0 0 0 0 0 0 0 0 0 60.8105 0
Education 0 0 0 0 0 0 0 0 0 0 0 0
Public Adm. 889.7885 485.483 3.2903 36.0593 65.1453 839.383 0 1.4977 24.7707 418.0357 146.778 165.9159
Banking & Ins. 301.8171 1445.85 0 7.1804 452.4598 516.5123 3204.796 0 0 0 0 152.2672
Prof. & Misc. 884.3627 1998.159 0 128.4851 68.692 118.1523 0 3.5846 0 920.1574 422.4494 202.8921
Source: Computed from the Augmented Input-Output Table of the Bangladesh Economy 1986-87, Planning Commission, GOB.

Table 9
Share of Employment by Sector in the Bangladesh Economy
Sector Total Employment
(million)
Percent of Employment in
1974
Total Employment
(million)
Percent of Employment in
1996
Av. Annual Growth (percent)
All Sector 21.4 100 56.0 100 4.5
Agriculture 16.8 78.7 35.4 63.2 3.4
Mining & Industry 1.0 4.8 5.3 9.5 7.8
All Services 3.5 16.5 15.3 27.3 6.9
Construction 0.04 0.2 0.5* 1.0* 18.2*
EGWS .008 0.04 0.04* 0.1* 10.6*
TSC 0.4 1.6 1.6* 3.2* 10.0*
Trade 0.8 3.9 4.3* 8.5* 10.7*
Housing 1.6* 3.2*
Pub. Adm. & Def. 0.9* 1.7*
Banking & Insurance 0.06 0.3 0.3* 0.6* 10.3*
Professional & Misc. 2.2 10.4 1.7* 3.4* 1.0*
Source: Statistical Yearbook of Bangladesh ( various issues), BBS.. Note:* The latest employment figures for individual service sectors are available only for the year 1990.
Hence the sectoral shares and the annual growth rates refer to the year 1990 only.

Table 10
Input - Output Co-efficient Table 1986-87
[A]
Agriculture Industry Construction Electric & Gas Trade Transport Housing Health Education Public Adm. Banking & Ins. Prof. & Misc.
Agriculture 0.130777 0.16836 0.004916 0 0.004544 0 0 0.036448 0 0.026931 0.037593 0
Industry 0.052613 0.36986 0.151891 0.272063 0.03919 0.229969 0.001466 0.251357 0.015837 0.184489 0.555981 0.032868
Construction 0.002821 0.005838 0 0.007086 0.000296 0.034831 0.144497 0.003064 0.002198 0.010184 0.058418 0.003263
Electric & Gas 0.003084 0.020133 0.000491 0.129181 0.005247 0.007674 0 0.006069 0.002385 0.01178 0.026716 0.003291
Trade 0.042259 0.096644 0 0 0 0.00228 0 0 0 0 0.003884 0.000957
Transport 0.012795 0.02149 0.000225 0.004508 0.000633 0.029559 0 0.00107 0.000907 0.041778 0.090238 0.00198
Housing 0 0 0 0 0 0 0 0 0 0 0 0
Health 0 0 0 0 0 0 0 0 0 0 0.043944 0
Education 0 0 0 0 0 0 0 0 0 0 0 0
Public Adm. 0.002729 0.002559 .000012 0.003985 0.002018 0.014979 0 0.000225 0.001623 0.017112 0.106068 0.005009
Banking & Ins. 0.000926 0.007622 0 0.000794 0.014018 0.009217 0.052927 0 0 0 0 0.004597
Prof. & Misc. 0.002712 0.010534 0 0.014201 0.002128 0.002108 0 0.000538 0 0.037667 0.305281 0.006125
Source: Computed from the Augmented Input-Output Table of Bangladesh Economy 1986-87, Planning Commission, (G.O.B).

Table 11
[1-A]-1
Agriculture Industry Construction Electricity &
Gas
Trade Transport Housing Health Education Public Adm. Banking & Ins. Prof. & Misc.
Agriculture 1.173808 0.3275918 0.0555998 0.1041461 0.0226645 0.0845395 0.0222835 0.126048 0.005797 0.0995773 0.2601569 0.0132563
Industry 0.117386 1.681056 0.2562763 0.5331563 0.0855863 0.4277913 0.096828 0.4314161 0.0294117 0.3485055 1.0832404 0.065901
Construction 0.0049591 0.0137257 1.0021247 0.0128573 0.0020206 0.0402684 0.1487175 0.0068285 0.0025113 0.0151253 0.0735572 0.0042855
Electric & Gas 0.0075802 0.0421895 0.0070203 1.1619442 0.0087288 0.0204185 0.0043613 0.017984 0.0035108 0.023212 0.0620686 0.0057189
Trade 0.0610088 0.1764938 0.0271463 0.0560197 1.0093049 0.0473592 0.0105443 0.0470732 0.0030932 0.038069 0.1202231 0.0079255
Transport 0.0186348 0.043773 0.0069857 0.019568 0.004474 1.043298 0.0078348 0.0129525 0.0017888 0.053551 0.1277473 0.0044787
Housing 0 0 0 0 0 0 1 0 0 0 0 0
Health 0.0001336 0.0007094 0.0001087 0.0002708 0.0006551 0.0006017 0.0023726 1.000186 1.295E-05 0.0001757 0.0445122 0.0002333
Education 0 0 0 0 0 0 0 0 1 0 0 0
Public Adm. 0.0043622 0.0083573 0.0013111 0.0075941 0.0041114 0.0189687 0.0063934 0.0025627 0.0018265 1.0202403 0.1169864 0.0060305
Banking & Ins. 0.0030409 0.0161425 0.002473 0.0061623 0.0149064 0.0136916 0.0539917 0.0042317 0.0002947 0.0039982 1.0129226 0.0053092
Prof. & Misc. 0.005825 0.0250598 0.0038505 0.0248794 0.0079992 0.0122958 0.0180164 0.0072402 0.0005479 0.0443861 0.3291951 1.0088653

Table 12
Linkage Effect of Services and other Sectors of the Bangladesh Economy
Backward Linkages
LBj
Forward Linkages
LFi
Total Direct Linkages
LB
+ LF
Total Direct & Indirect
Linkages
LTi
Rank
LBj
Rank
LFi
Rank
LB
+ LF
Rank
LTj
Agriculture .251 .236 .487 1.396
Industry .705 .811 1.514 2.321
Construction .158 .049 .207 1.361 5 7 7 7
Electricity & Gas .432 .800 1.232 1.922 1 2 1 2
Trade .068 1.000 1.068 1.159 7 1 2 8
Transport .331 .201 .532 1.706 2 4 4 3
Housing .199 0 .199 1.371 4 9 9 6
Health .299 .009 .308 1.653 3 8 6 4
Education .023 0 .023 1.049 9 9 10 10
Pub. Adm. .330 .126 .456 1.644 2 6 5 5
Banking & Insurance .149 .534 .683 3.221 6 3 3 1
Professional Service &
Misc.
.058 .143 .201 1.121 8 5 8 9

Table 13
Regression Results (Simple linear form)
Eq No. Dependent variable Independent variables R2 D-W Marginal Returns Rank
1 Service = -08.84 + .69 Ag. +3.96 Ind
(-1.27) (1.62) (7.26)**
.987 1.02 4.65
2 Construction = - 3.63 + .06 Ag. + .42 Ind.
(-.48) (1.07) (5.59)**
.977 .754 .48 5
3 PGWS = - 14.39 + .05 Ag + .21 Ind.
(-2.87)* (1.32) (4.04)**
.966 .921 .26 7
4 TSC = -10.23 + .17 Ag + .74 Ind.
(-.86) (1.78) (6.20)**
.984 .763 .91 2
5 Trade = -.42 + .05 Ag + .75 Ind.
(-.03) (.44) (5.38)**
.970 .791 .80 3
6 Housing = 6.44 + .08 Ag + .33 Ind.
(.75) (3.60)* (6.02)**
.983 .937 .41 6
7 Pub. Adm. = .22 + .05 Ag + .63 Ind
(.02) (.78) (4.54)**
.940 1.55 .68 4
8 Banking & Ins. = -1.25 - .05 Ag. + .03 Ind.
(-.37) - (1.87) (.87)
.875 1.47 .08 8
9 Prof. & Misc. = - 35.2 + .22 Ag + .89 Ind.
(-2.69)* (2.13)* (6.73)**
.987 1.04 .111 1
Note: Figures in the brackets give t-values. *indicates that the co-efficient is statistically significant at 95% level and ** indicates that the
the coefficient is significant at 99% level.

Table 14
Regression Results(Log-linear form)
Eq No. Dependent variable Independent variables R2 D-W Input-elasticity Rank
1 Service .51 + 1.35 Log Ag +.83 Log Ind.
(.37) (.97) (6.19)**
.981 .816 .35 + .43= 1.18>1
2 Construction -.80 + .19 Log Ag + .82 Log Ind.
(-.49) (.44) (5.04)**
.968 .637 .19 + .82=1.01 >1 6
3 PGWS -14.44 +1.76 Log Ag + 1.76 Log Ind.
(-1.71) (.80) (2.13)*
.895 .628 1.76 + 1.76=3.52>1 1
4 TSC -.65 + .37 Log Ag + .71 Log Ind
(-2.21) * (1.13) (5.68)**
.979 .644 .37 + .71=1.080>1 5
5 Trade -.15 + .16 Log Ag + .81 Log Ind.
(-.10) (.39) (5.36)**
.971 .905 .16 + .81=.97<1 7
6 Housing .23 + . 28 Log Ag + .50 Log Ind.
(.28) (1.3) (6.20)*
.982 .852 .28 +.50=.78<1 8
7 Pub. Adm. .87 - .76 Log Ag + 1.57 Log Ind.
(.21) - (.71) (3.87)**
.912 1.388 .76 + 1.57=2.33>1 2
8 Banking & Ins. -3.43 + ..94 Log Ag + . 20 Log Ind.
(-1.42) (1.49) (. 82)
.841 1.427 .94 + .20=1.14>1 4
9 Prof. & Misc. -2.93 + .60 Log Ag + .95 Log Ind.
(-1.55) (1.22) (5.09)**
.975 .660 .60 + .95=1.55>1 3
Note: Figures in the brackets give t-values. * indicates that the co-efficient is statistically significant at 95% level and ** indicates that the coefficient
is significant at 99% level.

Table 15
Use and Procurement-Source of Services in RMG Manufacturing Firms of Bangladesh
Sources
(Percent of total supply)
Services
Degree of Adoption
(Percent of the firms using the service) Internal Private Govt. Import
Production Planning, Management, Accounting 100.0 100.0
Input Procurement 87.0 87.0 13.0
Quality control 100.0 82.0 18.0
Banking: Financial Service (L/C etc.)
Working Capital
Machines, Equipment
100.0
98.0
57.0
2.0
43.0
26.0
20
15.0
56.0
74.0
42.0
18.0
4.0
Insurance: Imports (Inputs)
Machines, Plants
Exports
87.0
100.0
15.0
17.0
100.0
73.0
83.0
27.0
Shipping
Shipping Agent
Harbor Service
87.0
87.0
87.0
100.0
14.0
100.0
86.0
Transport: Wheel transport
Railway Service
100.0
68.0
2.0 98.0
100.0
Communication: Telephone
Telex, fax
100.0
100.0 84.0
1.0
14.0
99.0
Travelling & Entertainment 100.0 25.0 75.0
Electricity 100.0 1.0 99.0
Legal & Fiscal Services 85.0 67.0 33.0
Sales and Distribution 85.0 1.0 99.0
Security & cleaning 100.0 100.0
Housing Service 95.0 100.0

Data processing
Photocopy
100.0
100.0
100.0
30.0 70.0
Source: Sample Survey. Note: Govt. supply of banking, insurance and shipping services refers to those supplied by
Govt.-owned banks, insurance and shipping corporations.

Table 16
Output and Service-use by RMG Manufacturing Firms of Bangladesh
(Thousand Taka)
Dhaka Zone Chittagong Zone
Large Medium Average Total Large Medium Average Total Large
Total
Dhaka+Chittagong
Medium
Total
Dhaka+Chittagong
Average
Total
Dhaka+
Chitta gong
Total
No. of Units 3 6 27 36 6 9 23 38 9 15 50 74
Output 428715 547633 2176412 3152760 1070394 908584 1410602 3389580 1499109 1456217 3587014 6542340
Service Expenditure 87742 134619 603713 826074 219893 197849 380038 797780 307635 332468 983751 1623854
Transport 40738 53865 240610 335213 85360 69686 131096 286142 126098 123551 371706 621355
Shipping 35150 53869 242405 331424 101806 88535 160546 350887 136956 142431 402924 682311
Post service 2986 5286 21668 29940 10021 8973 12609 31603 13007 14259 34277 61543
Telephone/Fax/E-
2017 3834 14758 20609 4312 5818 13679 23809 6392 9652 28374 44418
Travelling 2486 4038 14919 21443 4431 6317 13940 24688 6917 10355 28859 46131
Banking & Insurance 525 1008 4122 5655 1556 1389 2613 5558 2081 2397 6735 11213
Rent for Plant-
premise
810 2015 16473 19298 1381 2121 12756 16258 2191 4136 29229 35556
Legal Service 515 1110 4985 6610 1632 1785 3971 7388 2147 2895 8956 13998
Security & Cleaning 657 3355 16118 20130 2238 3571 9272 15081 2895 6926 25390 35211
Photocopy 122 510 2929 3561 490 912 2576 3978 612 1422 5505 7539
Fair Participation 612 991 3206 4809 1720 1825 1543 5088 2332 2816 4749 9897
Association Fee 112 205 885 1202 241 362 707 1310 353 567 1592 2512
Electricity 1012 4533 20635 26180 4705 6555 14730 25990 5717 11088 35365 52170

Source: Sample Survey

Table 17
Service Costs in RMG Industry of Bangladesh 1989-90
(Million Taka)
Items Costs
1. Non- industrial Costs 1136.0
2. Shipping costs 1574.3
3. Transport costs 1288.1
4. Electricity 165.3
5. Payment others 77.0
6. Repair & maintenance 131.4
a. Total Services 4372.1
b. Total Industrial costs 14412.9
c. Total Raw materials 14312.1
d. Total Output 20717.3
Source: Computed from the CMI 1989-90, Input-Output Tables for Bangladesh
Economy (1976-77 and 1986-87) and Statistical Yearbook of Bangladesh
(various years)

Table 18
Balance of Payment of Bangladesh, 1989-90 to 1996-97(Current Account)
(Million Taka)
Items 1989-90 90-91 91-92 92-93 93-94 94-95 95-96 96-97
Import (f.o,b) 111250 111510 118920 139840 150599 210917 252600 271790
Export (f.o.b) 48930 59560 72630 83700 100976 139285 158791 188130
Freight & Insurance
a) On Import
b) Earned
c) Net
12500
80
-12420
12290
90
-12200
13240
80
-13160
16210
130
-16080
17069
191
-16878
23656
196
-23460
28417
477
-27940
31259
638
-30621
Other goods and Services(net) 420 2660 2540 2900 653 -2336 -4805 5413
Balance -74320 -61490 -56910 -69320 -65848 -97428 -126554 -108868
Instrument (net) -4050 -3660 -3390 -2860 -1211 -1632 -242 -4585
Transfer by Bangladeshi Nationals 26310 30170 3724 41660 49849 57303 60274 75613
Grants, Donations etc. 24620 29660 31170 32030 28404 35783 27672 31479
Surplus/Deficit on Current Account
-27400 -1660 -25460 -1510 -11193 -5974 -38850 6361
Source: Statistical Pocket book 1994, Statistical Bulletin (Monthly) [various issues]
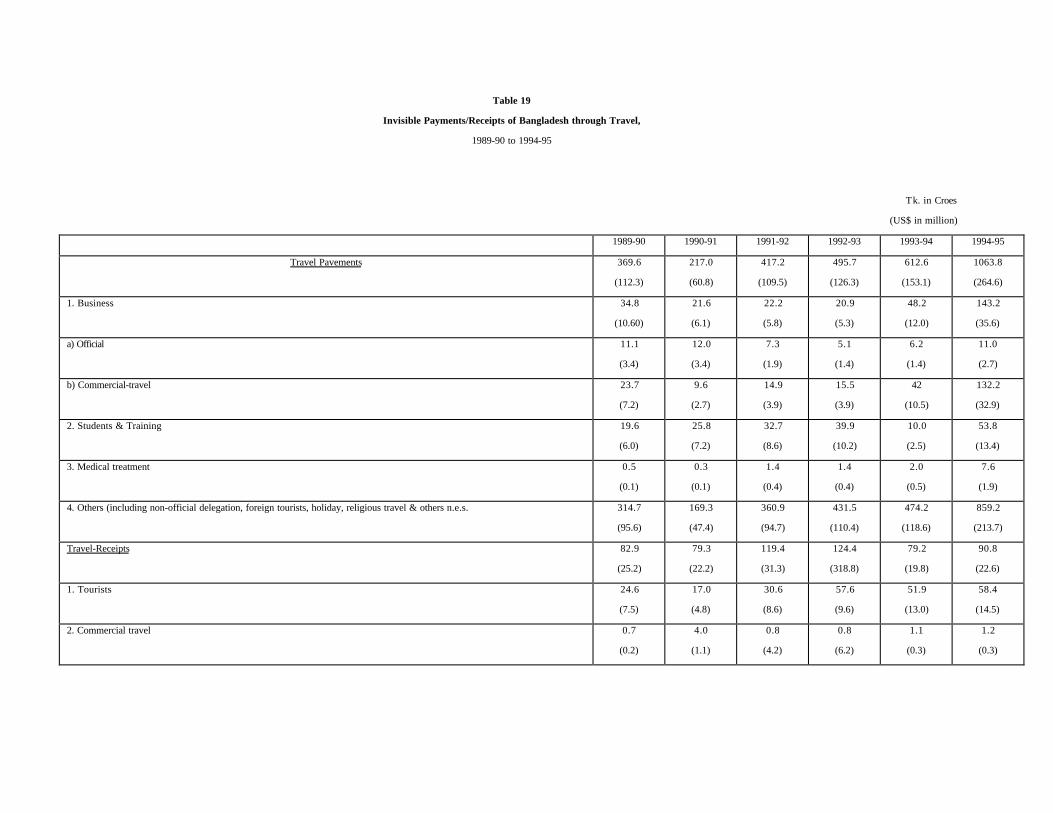
Table 19
Invisible Payments/Receipts of Bangladesh through Travel,
1989-90 to 1994-95
Tk. in Croes
(US$ in million)
1989-90 1990-91 1991-92 1992-93 1993-94 1994-95
Travel Pavements 369.6
(112.3)
217.0
(60.8)
417.2
(109.5)
495.7
(126.3)
612.6
(153.1)
1063.8
(264.6)
1. Business 34.8
(10.60)
21.6
(6.1)
22.2
(5.8)
20.9
(5.3)
48.2
(12.0)
143.2
(35.6)
a) Official 11.1
(3.4)
12.0
(3.4)
7.3
(1.9)
5.1
(1.4)
6.2
(1.4)
11.0
(2.7)
b) Commercial-travel 23.7
(7.2)
9.6
(2.7)
14.9
(3.9)
15.5
(3.9)
42
(10.5)
132.2
(32.9)
2. Students & Training 19.6
(6.0)
25.8
(7.2)
32.7
(8.6)
39.9
(10.2)
10.0
(2.5)
53.8
(13.4)
3. Medical treatment 0.5
(0.1)
0.3
(0.1)
1.4
(0.4)
1.4
(0.4)
2.0
(0.5)
7.6
(1.9)
4. Others (including non-official delegation, foreign tourists, holiday, religious travel & others n.e.s. 314.7
(95.6)
169.3
(47.4)
360.9
(94.7)
431.5
(110.4)
474.2
(118.6)
859.2
(213.7)
Travel-Receipts 82.9
(25.2)
79.3
(22.2)
119.4
(31.3)
124.4
(318.8)
79.2
(19.8)
90.8
(22.6)
1. Tourists 24.6
(7.5)
17.0
(4.8)
30.6
(8.6)
57.6
(9.6)
51.9
(13.0)
58.4
(14.5)
2. Commercial travel 0.7
(0.2)
4.0
(1.1)
0.8
(4.2)
0.8
(6.2)
1.1
(0.3)
1.2
(0.3)

3. Cost of ticket/passages for against encashment certificate of foreign currency a/c under WES 54.0
(16.4)
52.4
(14.7)
80.0
(21.0)
79.0
(20.2)
18.4
(4.6)
11.1
(2.8)
4. Others (including official, students, training and others n.e.s.) 3.6
(1.1)
5.9
(1.6)
8.0
(2.1)
7.0
(1.8)
7.8
(1.9)
20.1
(5.0)
Source: Statistics Department, Bangladesh Bank.