Embed Size (px)
Citation preview
INTER-AMERICAN TROPICAL TUNA COMMMISSION COMISIÓN INTERAMERICANA DEL ATÚN TROPICAL
QUARTERLY REPORT—INFORME TRIMESTRAL
January-March 2010—Enero-Marzo 2010
COMMISSIONERS—COMISIONADOS COLOMBIA FRANCE—FRANCIA PERÚ José Alfredo Ramos Marie-Sophie Dufau-Richet Gladys Cárdenas Quintana Carlos Robles Christiane Laurent-Monpetit Alfonso Miranda Eyzaguirre Yadir Salazar Mejía Jonathan Lemeunier Doris Sotomayor Yalan Xiomara Sanclemente Michel Sallenave Jorge Vértiz Calderón COSTA RICA GUATEMALA REPUBLIC OF KOREA—
Bernal Alberto Chavarría Valverde Hugo Andrés Alsina Lagos REPÚBLICA DE COREA Asdrubal Vásquez Nuñez Bryslie Siomara Cifuentes Velasco Il Jeong Jeong Carlos Villalobos Sole Rómulo Dimas Gramajo Lima Hyun Wook Kwon Manuel de Jesús Ixquiac Cabrera Jeongseok Park ECUADOR Jimmy Martínez Ortiz JAPAN—JAPÓN USA—EE.UU. Ramón Montaño Cruz Yutaka Aoki Robert Fletcher Guillermo Morán Velásquez Masahiro Ishikawa Rodney McInnis Luis Torres Navarrete Shingo Ota Patrick Rose EL SALVADOR MÉXICO VANUATU Manuel Calvo Benivides Marío Aguilar Sanchez Christophe Emelee Manuel Ferín Oliva Miguel Ángel Cisneros Mata Roy Mickey Joy Sonia Salaverría Ramón Corral Ávila Dimitri Malvirlani José Emilio Suadi Hasbun Michel Dreyfus León Laurent Parenté ESPAÑA—SPAIN
NICARAGUA VENEZUELA
Rafael Centenera Ulecia Steadman Fagoth Müller Alvin Delgado Fernando Curcio Ruigómez Julio César Guevara Gilberto Giménez Samuel J. Juárez Casado Danilo Rosales Pichardo Nancy Tablante Armando Segura Espinoza PANAMÁ María Patricia Díaz Ramón González Carlos Eduardo Isaza George Novey
_____________________
DIRECTOR
Dr. Guillermo A. Compeán
HEADQUARTERS AND MAIN LABORATORY—OFICINA Y LABORATORIO PRINCIPAL 8604 La Jolla Shores Drive
La Jolla, California 92037-1508, USA www.iattc.org

The
QUARTERLY REPORT
January-March 2010
of the
INTER-AMERICAN TROPICAL TUNA COMMISSION
is an informal account, published in English and Spanish, of the current status of the tuna fi-sheries in the eastern Pacific Ocean in relation to the interests of the Commission, and of the research and the associated activities of the Commission's scientific staff. The research re-sults presented should be regarded, in most instances, as preliminary and in the nature of progress reports.
El
INFORME TRIMESTRAL
Enero-Marzo 2010
de la
COMISIÓN INTERAMERICANA DEL ATÚN TROPICAL
es un relato informal, publicado en inglés y español, de la situación actual de la pesca atunera en el Océano Pacífico oriental con relación a los intereses de la Comisión, y de la investigación científica y demás actividades del personal científico de la Comisión. Gran parte de los resul-tados de investigación presentados en este informe son preliminares y deben ser considerados como informes del avance de la investigación.
Editor—Redactor: William H. Bayliff
1
INTRODUCTION
The Inter-American Tropical Tuna Commission (IATTC) operates under the authority and direction of a convention originally entered into by Costa Rica and the United States. The convention, which came into force in 1950, is open to adherence by other governments whose nationals fish for tropical tunas and tuna-like species in the eastern Pacific Ocean (EPO). Under this provision Panama adhered in 1953, Ecuador in 1961, Mexico in 1964, Canada in 1968, Ja-pan in 1970, France and Nicaragua in 1973, Vanuatu in 1990, Venezuela in 1992, El Salvador in 1997, Guatemala in 2000, Peru in 2002, Spain in 2003, the Republic of Korea in 2005, and Co-lombia in 2007. Canada withdrew from the IATTC in 1984.
The convention states that the Commission is to “make investigations concerning the ab-undance, biology, biometry, and ecology of yellowfin … and skipjack … tuna in the waters of the eastern Pacific Ocean fished by the nationals of the High Contracting Parties, and the kinds of fishes commonly used as bait in the tuna fisheries … and of other kinds of fish taken by tuna fishing vessels; and the effects of natural factors and human activities on the abundance of the populations of fishes supporting all of these fisheries.” Further it is to “recommend from time to time, on the basis of scientific investigations, proposals for joint action by the High Contracting Parties designed to keep the populations of fishes covered by this Convention at those levels of abundance which will permit the maximum sustained catch.” (In practice, the Commissioners appoint the Director, the Director appoints the members of the staff, and the Director and staff perform the research and make recommendations for conservation and management, when ap-propriate, to the Commissioners.)
The IATTC's responsibilities were broadened in 1976 to address the problems arising from the incidental mortality in purse seines of dolphins that associate with yellowfin tuna in the EPO. The Commission agreed that it “should strive to maintain a high level of tuna production and also to maintain [dolphin] stocks at or above levels that assure their survival in perpetuity, with every reasonable effort being made to avoid needless or careless killing of [dolphins]” (IATTC, 33rd meeting, minutes: page 9). The principal responsibilities of the IATTC's Tuna-Dolphin Program are (1) to monitor the abundance of dolphins and their mortality incidental to purse-seine fishing in the EPO, (2) to study the causes of mortality of dolphins during fishing operations and promote the use of fishing techniques and equipment that minimize these mortali-ties, (3) to study the effects of different modes of fishing on the various fish and other animals of the pelagic ecosystem, and (4) to provide a secretariat for the International Dolphin Conservation Program, described below.
On 17 June 1992, the Agreement for the Conservation of Dolphins (“the 1992 La Jolla Agreement”), which created the International Dolphin Conservation Program (IDCP), was adopted. The main objective of the Agreement was to reduce the mortality of dolphins in the purse-seine fishery without harming the tuna resources of the region and the fisheries that depend on them. This agreement introduced such novel and effective measures as Dolphin Mortality Limits (DMLs) for individual vessels and the International Review Panel to monitor the perfor-mance and compliance of the fishing fleet. On 21 May 1998, the Agreement on the International Dolphin Conservation Program (AIDCP), which built on and formalized the provisions of the 1992 La Jolla Agreement, was signed, and it entered into force on 15 February 1999. In 2010, Costa Rica, Ecuador, El Salvador, the European Union, Guatemala, Honduras, Mexico, Nicara-
2
gua, Panama, Peru, the United States, Vanuatu, and Venezuela were Parties to this agreement, and Bolivia and Colombia were applying it provisionally. The objectives of the AIDCP are to ensure the sustainability of the tuna stocks in the eastern Pacific Ocean, to progressively reduce the incidental mortalities of dolphins in the tuna fishery of the eastern Pacific Ocean to levels approaching zero, and to minimize the incidental catches and discards of juvenile tunas and non-target species, taking into consideration the interrelationships among the species in the ecosys-tem. This agreement established Stock Mortality Limits, which are similar to DMLs except that (1) they apply to all vessels combined, rather than to individual vessels, and (2) they apply to in-dividual stocks of dolphins, rather than to all stocks of dolphins combined. The IATTC provides the Secretariat for the International Dolphin Conservation Program (IDCP) and its various work-ing groups and panels and coordinates the On-Board Observer Program and the Tuna Tracking and Verification System. (The former is described later in this report and the latter in recent An-nual Reports of the IATTC.)
In addition, the IATTC staff has become involved with conservation of seabirds (Resolu-tion C-05-01, adopted at its 73rd meeting in June 2005), sharks (Resolution C-05-03, adopted at the same meeting), and sea turtles (Resolution C-07-01, adopted at its 75th meeting in June 2007).
At its 70th meeting, on 24-27 June 2003, the Commission adopted the Resolution on the Adoption of the Convention for the Strengthening of the Inter-American Tropical Tuna Commis-sion Established by the 1949 Convention between the United States of America and the Republic of Costa Rica (“the Antigua Convention”). This convention will replace the original one 15 months after it has been ratified or acceded to by seven Parties that were Parties to the 1949 Con-vention on the date that the Antigua Convention was open for signature. It has been ratified or ac-ceded to by Mexico on 14 January 2005, El Salvador on 10 March 2005, the Republic of Korea on 13 December 2005, the European Union on 7 June 2006, Nicaragua on 13 December 2006, Belize on 12 June 2007, Panama on 10 July 2007, France on 20 July 2007, Japan on 11 July 2008, and Costa Rica on 27 May 2009. Of these, Costa Rica, El Salvador, France, Japan, Mexico, Nicaragua, and Panama were Parties to the 1949 Convention on the date that the Antigua Convention was open for signature, so it will enter into force on 27 August 2010.
To carry out its responsibilities, the IATTC conducts a wide variety of investigations at sea, in ports where tunas are landed, and in its laboratories. The research is carried out by a per-manent, internationally-recruited research and support staff appointed by the Director, who is directly responsible to the Commission.
The scientific program is now in its 60th year. The results of the IATTC staff's research are published in the IATTC's Bulletin and Stock Assessment Report series in English and Span-ish, its two official languages, in its Special Report and Data Report series, and in books, outside scientific journals, and trade journals. Summaries of each year's activities are reported upon in the IATTC's Annual Reports and Fishery Status Reports, also in the two languages.
MEETINGS
Dr. Guillermo A. Compeán participated in the sixth Regular Session of the Western and Central Pacific Fisheries Commission (WCPFC) in Papeete, Tahiti, on 7-11 December 2009. Among other things, he signed a Memorandum of Cooperation (MOC) on the Exchange and Re-lease of Data between the IATTC and the WCPFC. The MOC provides for exchange of “catch

3
and effort (including by-catch of mammals, turtles, sharks and billfish), observer, transshipment and port inspection data” and also “monitoring, surveillance, inspection and enforcement data”… (“subject to fulfilling internal requirements of each Commission regarding data confidentiality and information security”).
On 2 February 2010, Dr. Compeán and Mr. Brian S. Hallman met in La Jolla, California, USA, with Dr. Usha Varanasi, Acting Science and Research Director, and Ms. Kristen Koch, Deputy Science and Research Director, Southwest Fisheries Science Center, U.S. National Ma-rine Fisheries Service, to discuss matters of mutual interest.
Dr. Martín A. Hall participated in “Seafood Summit 2010: Changing Assumptions in a Changing World” in Paris, France, on 31 January-2 February 2010, and in the “Tuna Workshop” that preceded it on 30 January 2010. At the Tuna Workshop, he was one of five members of a panel entitled “Bycatch in the World’s Tuna Fisheries: a Global Approach.”
Dr. Hall participated in the “Technical Meeting for the Elaboration of a Conservation and Management Plan for Migratory Sharks” and the “Third Meeting On International Cooperation on Migratory Sharks under the Convention on Migratory Species” in Manila, Philippines, on 8-12 February 2010.
Dr. Robert J. Olson participated in the CLIOTOP “Mid-Term Workshop” at the United Nations Education, Scientific, and Cultural Organization (UNESCO) in Paris, France, on 8-12 February 2010. CLIOTOP (Climate Impacts on Oceanic Top Predators), previously a program of the international research program Global Ocean Ecosystem Dynamics (GLOBEC), is now sponsored by Integrated Marine Biogeochemistry and Ecosystem Research (IMBER). The pur-pose of the workshop was to plan the second 5-year phase of the CLIOTOP scientific program and to outline a position paper to be published in a prominent journal to publicize the research direc-tions of CLIOTOP. Dr. Olson’s travel expenses were paid by IMBER and CLIOTOP.
Dr. Mark N. Maunder participated in a mid-term review of the Pacific Tuna Tagging Programme of the Secretariat of the Pacific Community (SPC) in Noumea, New Caledonia, on 22-26 February 2010. His expenses were paid by the SPC.
A meeting of the Overseas Fishery Cooperation Foundation of Japan (OFCF)-IATTC “Cooperative Project for the Reduction of Incidental Catches of Sea Turtles in the Eastern Pacif-ic Ocean” was held in La Jolla, California, USA, on 24-25 February 2010. The participants were Dr. Guillermo A. Compeán, Mr. Brian S. Hallman, Dr. Martín A. Hall, and Mr. Marlon Román Verdesoto of the IATTC, and Messrs. Hirokazu Chubachi, Special Advisor, Technical Coopera-tion Department, Tokimasa Kobayashi, Technical Advisor, Toshihiro Araya, Project Operation Division, Takahisa Mitsuhashi, Expert in Methods of Fishing and Coordinator of the project, and Kumiko Cho, interpreter, all of the OFCF. They discussed activities for the next fiscal year and distribution of the results of the project. It was agreed that workshops would be held in the par-ticipating countries and also that there would one regional workshop.
Dr. Michael G. Hinton participated in the sixth session of the Steering Committee of the FAO Fishery Resources and Monitoring System (FIRMS) and the 23rd meeting of the Coordi-nating Working Party on Fisheries Statistics (CWP) in Hobart, Australia, on 22-26 February
4
2010. Of particular interest was the establishment of a CWP subgroup to develop standards for reporting of fisheries statistics for aquaculture, as compared to the long-established practices of development of standards for capture fisheries. Dr. Hinton was elected Vice-Chairman of the CWP, which position he will hold through the 24th meeting of the CWP, after which he will as-sume the role of Chairman. The report of the CWP meeting is available at ftp://ftp.fao.org/FI/DOCUMENT/cwp/cwp_23/Questionnaire_ICCAT.pdf. At the meeting of FIRMS, its progress and increasing stability since its inception were recognized, and it was de-cided that the systems were sufficiently stable to begin approaching additional regional fisheries management organizations (e.g. the International Pacific Halibut Commission and the Pacific Salmon Commission) about membership in FIRMS. The full report of the meeting is available at ftp://ftp.fao.org/fi/DOCUMENT/FIGIS_FIRMS/2010/report.pdf. At the close of the meeting, Dr. Hinton was elected Chairman for the upcoming session of FIRMS.
Dr. Daniel Margulies served as a U.S. panel member for the Sixth U.S.-Korea Joint Coordination Panel Meeting for Aquaculture Cooperation, held in La Jolla, California, USA, on 25-27 February 2010. The Joint Panel reviewed 2011-2012 proposals for joint aquaculture re-search conducted by Korean and U.S. scientists and made recommendations on priority topics for aquaculture research.
Dr. Margulies participated in the World Aquaculture Society’s Aquaculture 2010 meet-ing, held in San Diego, California, USA, on 2-5 March 2010. He presented a talk entitled “Re-search on Reproductive Biology and Early Life History of Yellowfin Tuna at the IATTC’s Acho-tines Laboratory, Republic of Panama,” as part of a special session entitled “Tuna Culture.” Mr. Vernon P. Scholey and Mss. Jeanne B. Wexler and Maria C. Santiago were co-authors of the outline on which the talk was based.
Dr. Guillermo A. Compeán, in his capacity as a member of the “Comisión Dictaminadora Externa” of the Centro de Investigaciones Biológicas del Noroeste (CIBNOR) participated in a meeting of that organization in La Paz, Baja California Sur, Mexico, on 9-10 March 2010.
Dr. Compeán also participated in the “V Cátedra Nacional Juan Luis Cifuentes Lemus” of the Consorcio de Universidades Mexicanas (CUMEX) in Puerto Vallarta, Jalisco, Mexico, on 11-12 March 2010. He gave a talk entitled “Peces Marinos de México” on 11 March, and on 12 March he was one of four participants in a panel discussion entitled “Enfoque Ecosistémico en el Manejo Pesquero.”
Mr. Brian S. Hallman participated in the Ninth Round of Informal Consultations of States Parties to the Agreement for the Implementation of the Provisions of the UN Convention on the Law of the Sea, in New York City, USA, on 16-17 March 2010.
Mr. Kurt M. Schaefer participated in an Atlantic Innovation Fund (AIF) Project review meeting at Lotek Wireless, Inc., in St. John’s, Newfoundland, Canada, on 22-25 March 2010. Lotek manufactures various types of electronic tags for studying the movements, behavior, and habitat utilization of aquatic and terrestrial animals. Mr. Schaefer has been working with Lotek in the development of various tags and utilizing its products with tropical tunas since about 2002. The meeting was attended by staff members of Lotek, the Canadian National Research Council, and the Department of Fisheries and Oceans of Canada. Lotek received a significant sum of
5
money in 2007 from the AIF for a four-year project for the further refinement, development, and commercialization of archival tags for marine applications. The purpose of the meeting was to review and discuss the various active components of this project, including new tags in devel-opment, miniaturization, increases in memory capacity, and new environmental sensors. Mr. Schaefer’s travel expenses were paid by Lotek.
Drs. Mark N. Maunder and Alexandre Aires-da-Silva participated in a meeting of the AD Model Builder Foundation in La Jolla, California, USA, on 29-31 March 2010.
RESEARCH
The research activities of the IATTC staff were re-organized, effective 1 January 2010, into four programs, the Data Collection and Data Base Program, the Biology and Ecosystem Program, the Stock Assessment Program, and the Bycatch and AIDCP Program. It is anticipated that this re-organization will enable the staff to more effectively meet its responsibilities when the new IATTC Convention becomes effective on 27 August 2010.
DATA COLLECTION AND DATA BASE PROGRAM
The IATTC had field offices at Las Playas and Manta, Ecuador; Manzanillo and Ma-zatlan, Mexico; Panama, Republic of Panama; and Cumaná, Venezuela, during the first quarter of 2010. Personnel at these offices collected 131 length-frequency samples from 80 wells and abstracted logbook information for 246 trips of commercial fishing vessels during the quarter.
Reported fisheries statistics
Information reported herein are for the eastern Pacific Ocean (EPO: the region east of 150ºW, south of 50ºN, and north of 50°S, unless noted otherwise. Catch is reported in metric tons (t), vessel capacity in cubic meters (m3), and effort in days fishing. Estimates of fisheries statistics with varying degrees of accuracy and precision are available. The most accurate and precise are those made after all available information has been entered into the data base, processed, and verified. While it may require a year or more to obtain some final information, much of the catch information is processed and available within two to three months of the return of a vessel from a fishing trip. Thus the estimates for the current week are the most preliminary, while those made a year later are much more accurate and precise. Statistics are developed using data from many sources, including records of landings, fishing vessel logbooks, scientific ob-servers, and governmental agencies.
Fleet statistics for the purse seine and pole-and-line fishery
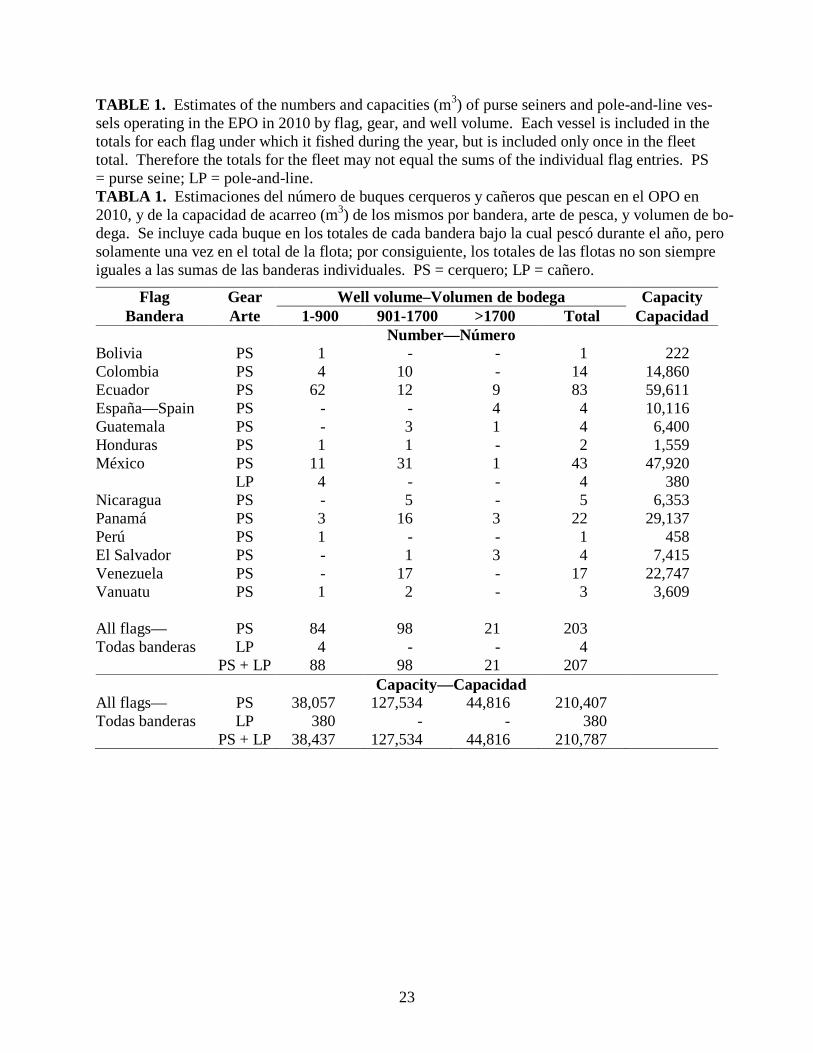
The lists of vessels authorized to fish for tunas in the EPO are given in the IATTC Regional Vessel Register (http://www.iattc.org/VesselListsENG.htm). The estimated total carrying capacity of the purse-seine and pole-and-line vessels that have or are expected to fish in the EPO during 2010 is about 210,800 m3 (Table 1). The average weekly at-sea capacity for the fleet, for the weeks ending 1 January through 28 March, was about 133,600 m3 (range: 66,800 to 161,100 m3).
6
Catch and catch-per-unit-of-effort statistics for the purse-seine and pole-and-line fi-sheries
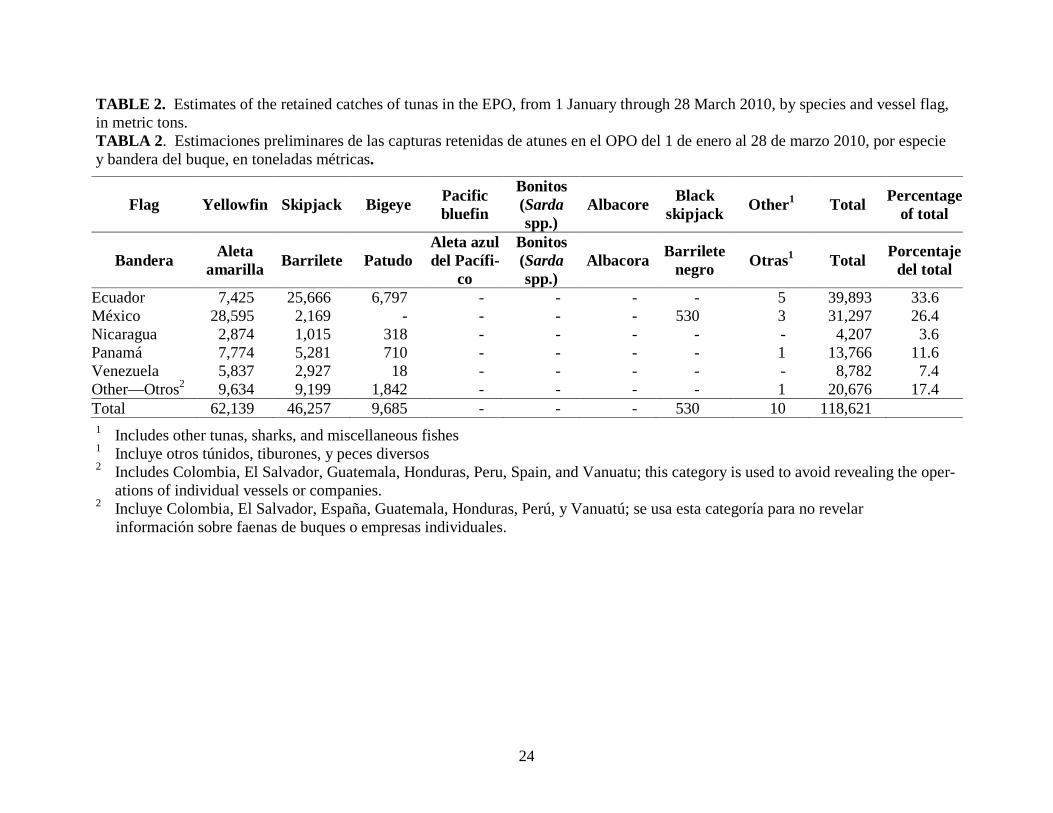
Catch statistics Estimated total retained catches (t) of tropical tunas from the EPO during the period of January-March in 2010, and comparative statistics for 2005-2009, were:
Species 2010 2005-2009 Weekly average, 2010 Average Minimum Maximum
Yellowfin 62,100 62,600 52,600 89,000 5,200 Skipjack 46,300 73,300 56,800 93,100 3,900 Bigeye 9,700 12,000 9,000 15,500 800
Summaries of the estimated retained catches, by species and by flag of vessel, are shown in Ta-ble 2.
Catch-per-unit-of-effort statistics for purse-seine vessels No adjustments to the catch-per-unit-of-effort data are included for factors, such as type of set or vessel operating costs and market prices, which might identify whether a vessel was di-recting its effort toward a specific species.
The measures of catch rate used in analyses are based on fishing trips landing predomi-nantly yellowfin, skipjack, bigeye, and bluefin tuna. The great majority of the purse-seine catches of yellowfin, skipjack, and bigeye are made by vessels with fish-carrying capacities greater than about 425 m3, and only data for these vessels are included in these measures of catch rate. There are now far fewer pole-and-line vessels than in previous years, so the data for these vessels are combined without regard to carrying capacity.
The estimated nominal catches per day of fishing for yellowfin, skipjack, and bigeye in the EPO during quarters one to four of 2009 and comparative statistics for 2004-2008 were:
Region Species Gear 2009 2004-2008 Average Minimum Maximum
N of 5° N S of 5° N Yellowfin PS 12.7 9.5 8.1 10.8
2.1 4.1 2.0 8.2 N of 5° N S of 5° N Skipjack PS 1.0 2.9 2.3 3.7
8.1 10.0 6.3 12.6 EPO Bigeye PS 2.3 2.8 2.0 4.1 EPO Yellowfin LP 1.6 2.4 1.7 4.1 EPO Skipjack LP 0.5 1.1 0.5 1.7
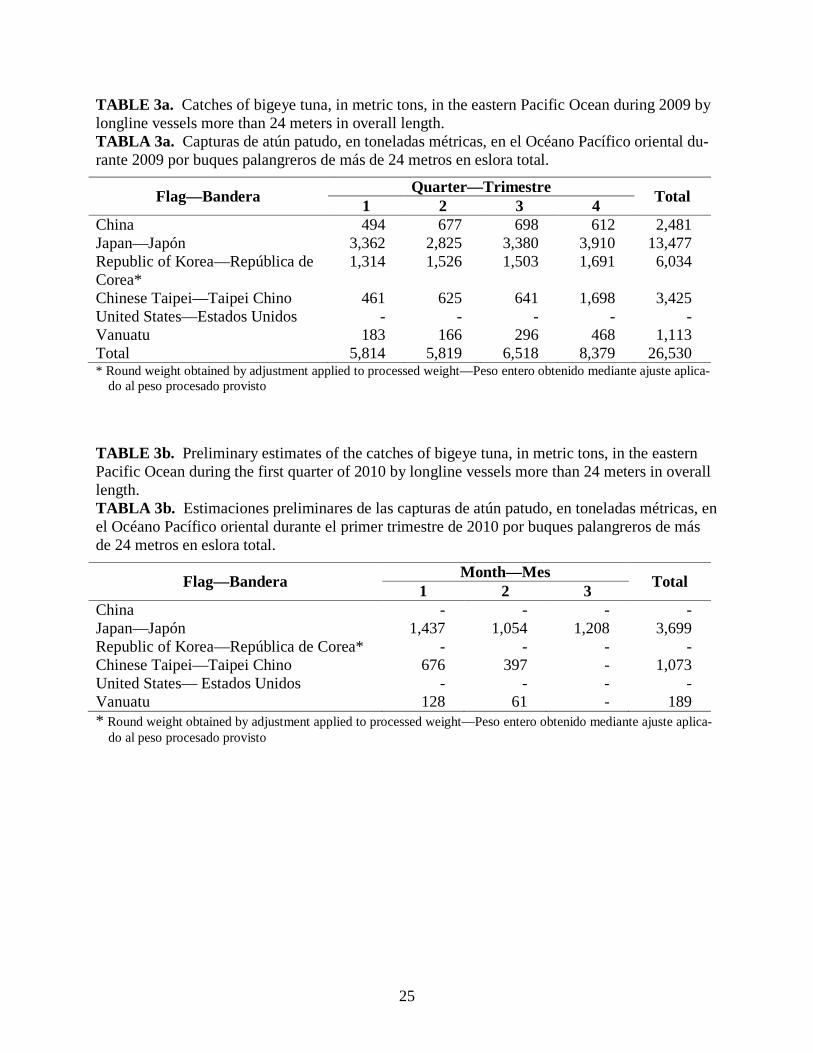
Catch statistics for the longline fishery Catches of bigeye by longline gear in the EPO are reported by flag states whose an-nual catches have exceeded 500 t (http://www.iattc.org/PDFFiles2/Resolutions/C-09-01-Tuna-conservation-2009-2011.pdf). The catches that have been reported for January-December 2009 are shown in Table 3a, and preliminary estimates of those reported for the first quarter of 2010 are shown in Table 3b.
7
Size compositions of the surface catches of tunas
Length-frequency samples are the basic source of data used for estimating the size and age compositions of the various species of fish in the landings. This information is necessary to obtain age-structured estimates of the population. Samples of yellowfin, skipjack, bigeye, Pacif-ic bluefin, and, occasionally, black skipjack from the catches of purse-seine, pole-and-line, and recreational vessels in the EPO are collected by IATTC personnel at ports of landing in Ecuador, Mexico, Panama, the USA, and Venezuela. The catches of yellowfin and skipjack were first sampled in 1954, bluefin in 1973, and bigeye in 1975.
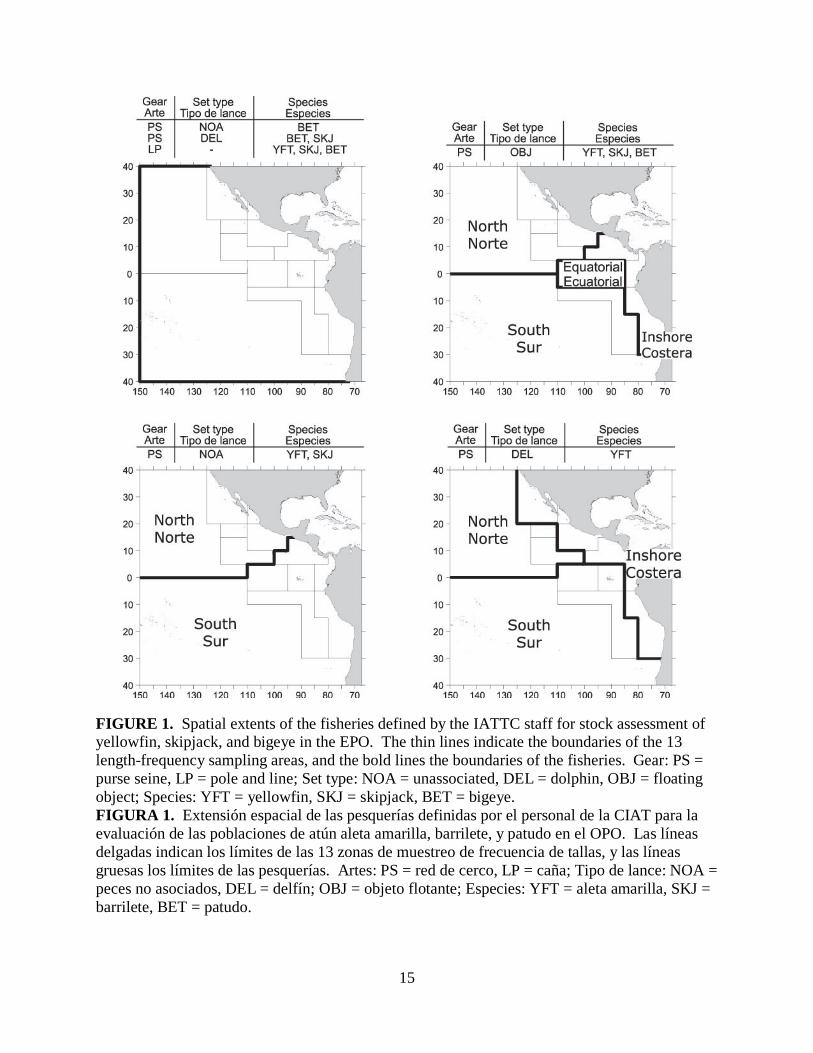
The methods for sampling the catches of tunas are described in the IATTC Annual Re-port for 2000 and in IATTC Stock Assessment Report 4. Briefly, the fish in a well of a purse-seine or pole-and-line vessel are selected for sampling only if all the fish in the well were caught during the same calendar month, in the same type of set (floating-object, unassociated school, or dolphin), and in the same sampling area. These data are then categorized by fishery (Figure 1).
Data for fish caught during the fourth quarters of 2004-2009 are presented in this report. Two sets of length-frequency histograms are presented for each species; the first shows the data by stratum (gear type, set type, and area) for the fourth quarter of 2009, and the second shows data for the combined strata for the fourth quarter of each year of the 2004-2009 period. Sam-ples from 151 wells were taken during the fourth quarter of 2009.
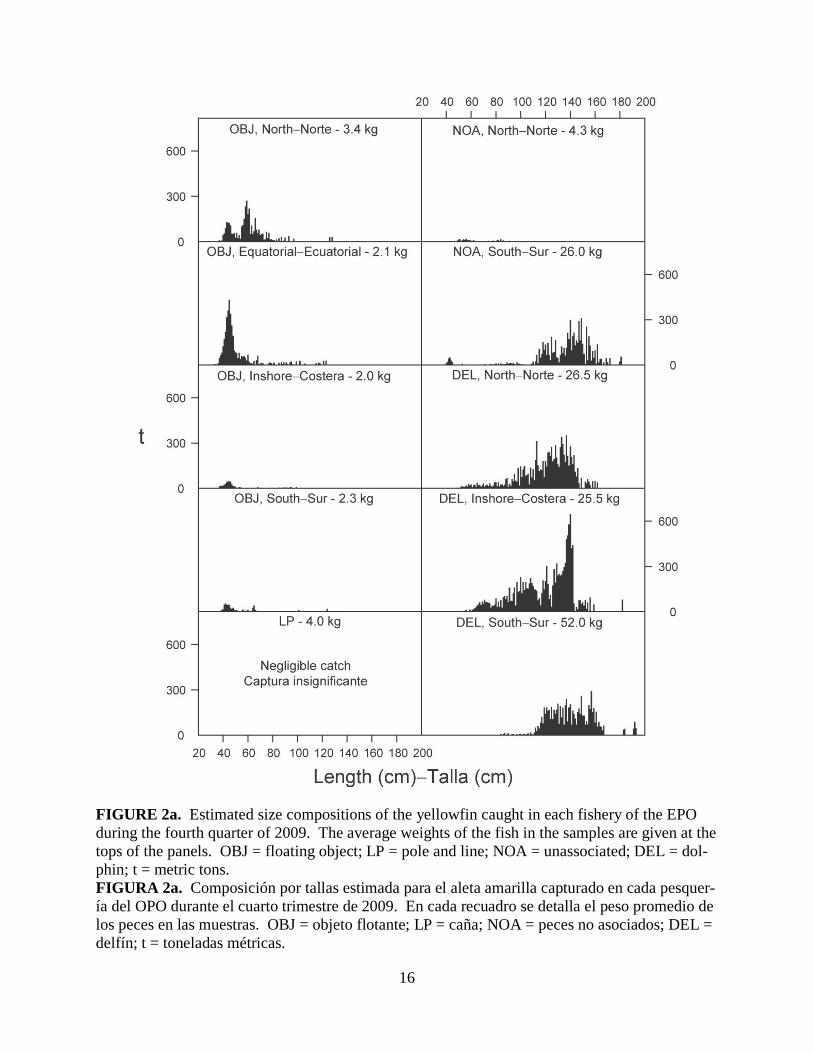
There are ten surface fisheries for yellowfin defined for stock assessments: four asso-ciated with floating objects, two unassociated school, three associated with dolphins, and one pole-and-line (Figure 1). The last fishery includes all 13 sampling areas. Of the 151 wells sam-pled that contained fish caught during the fourth quarter of 2009, 130 contained yellowfin. The estimated size compositions of these fish are shown in Figure 2a. The majority of the yellowfin catch during the fourth quarter was taken by sets on dolphins in the Northern, Southern and In-shore areas. Yellowfin in the 120- to160-cm size range were caught in the Southern unasso-ciated fishery during the fourth quarter. Smaller amounts of yellowfin (40-60 cm) were taken in floating-object sets, primarily in the Northern and Equatorial areas.
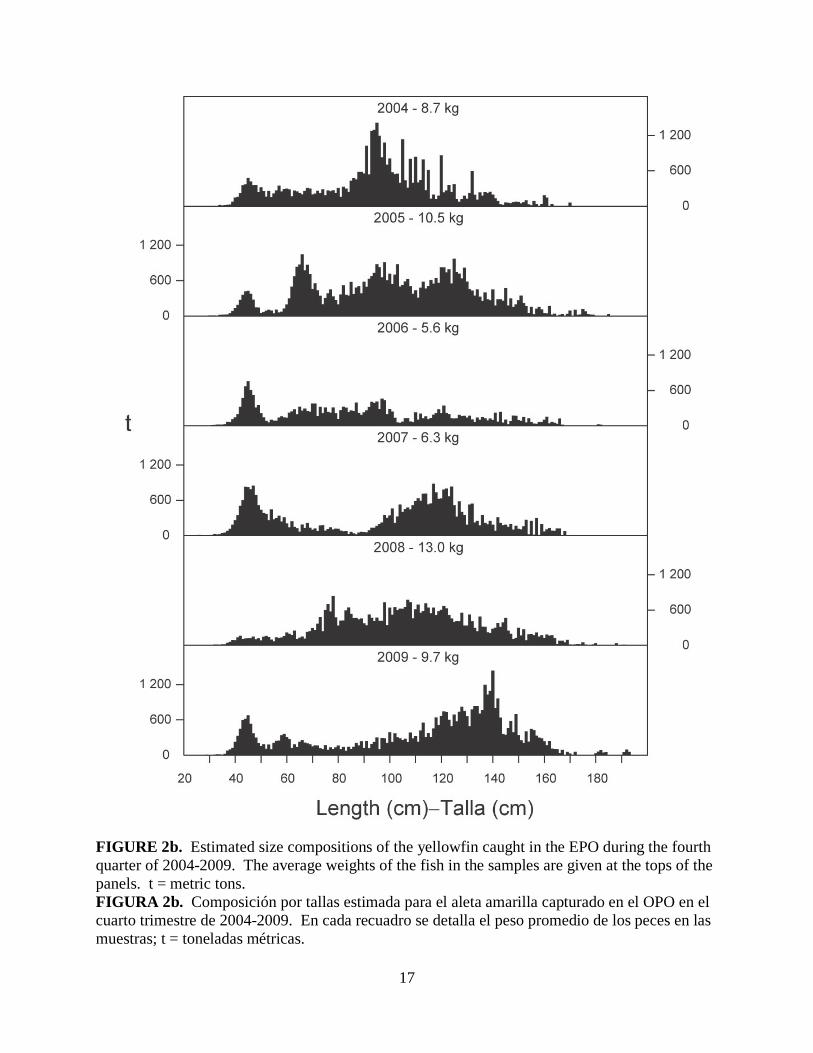
The estimated size compositions of the yellowfin caught by all fisheries combined during the fourth quarters of 2004-2009 are shown in Figure 2b. The average weight of the yellowfin caught during the fourth quarter of 2009 (9.7 kg) was considerably less than that of 2008 (13.0 kg), but considerably greater than those of 2006 (5.6 kg) and 2007 (6.3 kg).
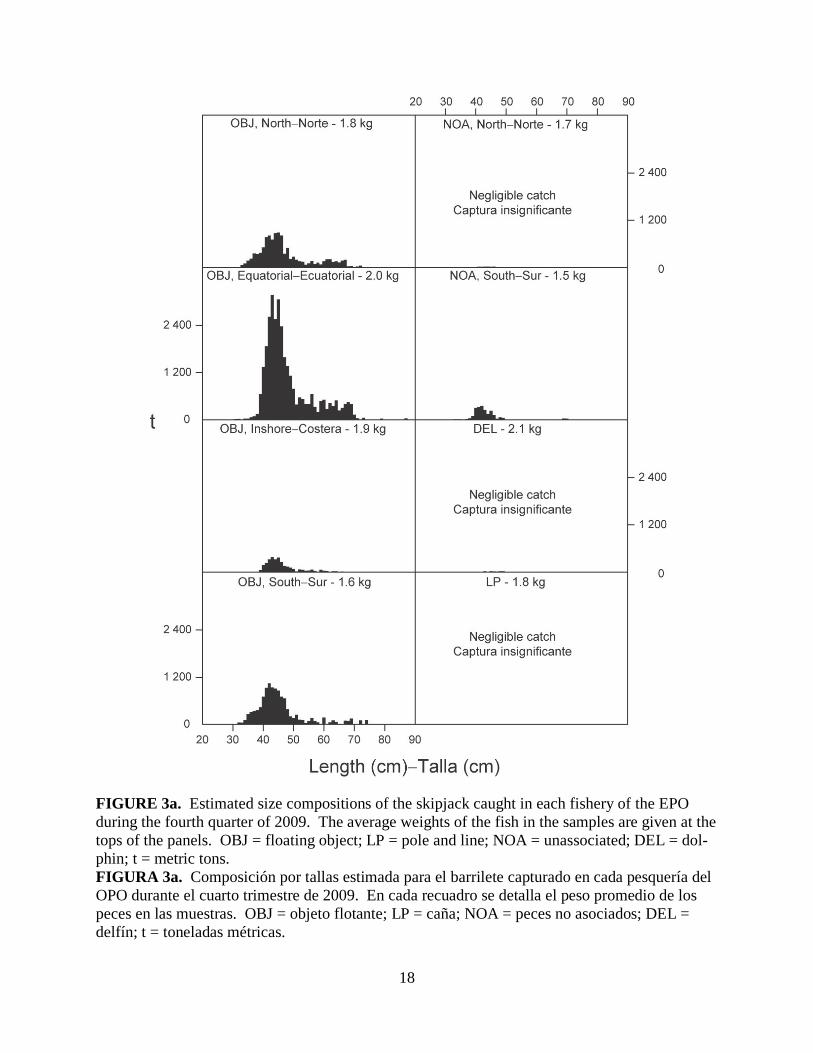
There are eight fisheries for skipjack defined for stock assessments: four associated with floating objects, two unassociated school, one associated with dolphins, and one pole-and-line (Figure 1). The last two fisheries include all 13 sampling areas. Of the 151 wells sampled that contained fish caught during the fourth quarter of 2009, 108 contained skipjack. The estimated size compositions of these fish are shown in Figure 3a. Large amounts of skipjack in the 40- to 50-cm range were caught in the Northern, Equatorial, and Southern floating-object fisheries dur-ing the fourth quarter. Lesser amounts of skipjack in the 40- to 50-cm size range were caught in the Southern unassociated and Inshore floating-object fisheries.
8
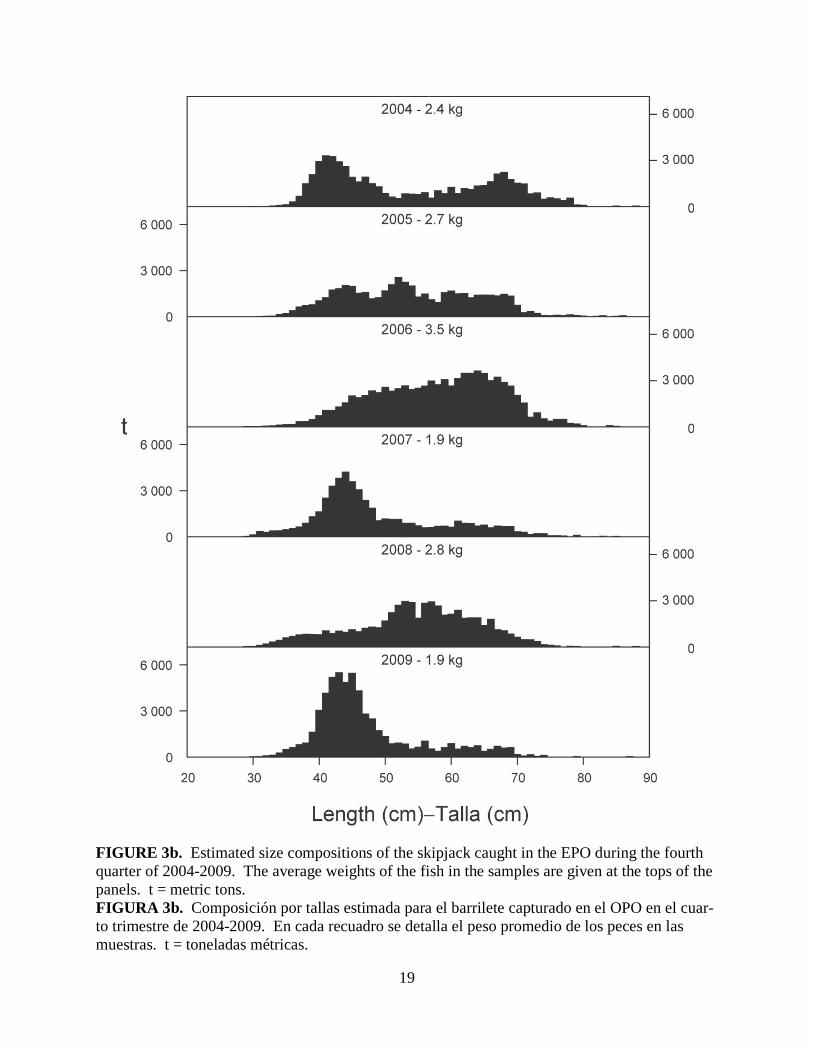
The estimated size compositions of the skipjack caught by all fisheries combined during the fourth quarters of 2004-2009 are shown in Figure 3b. The average weight for the fourth quarter of 2009 (1.9 kg) was less than those of four of the five previous years.
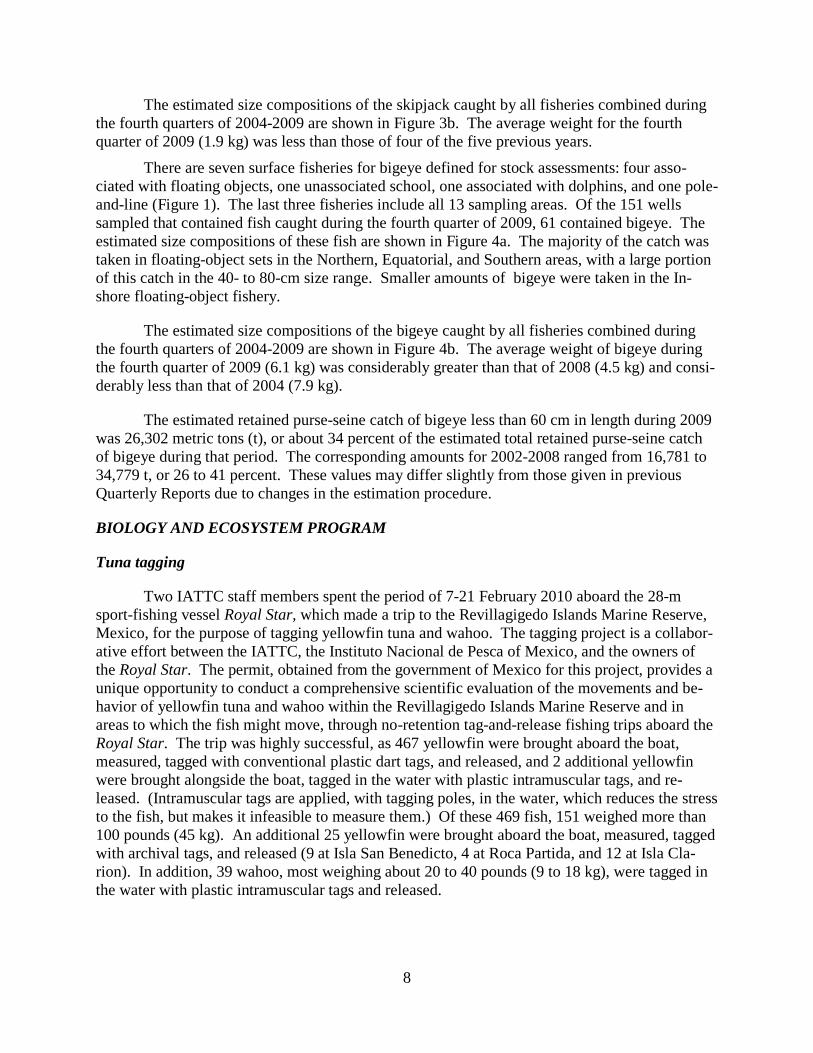
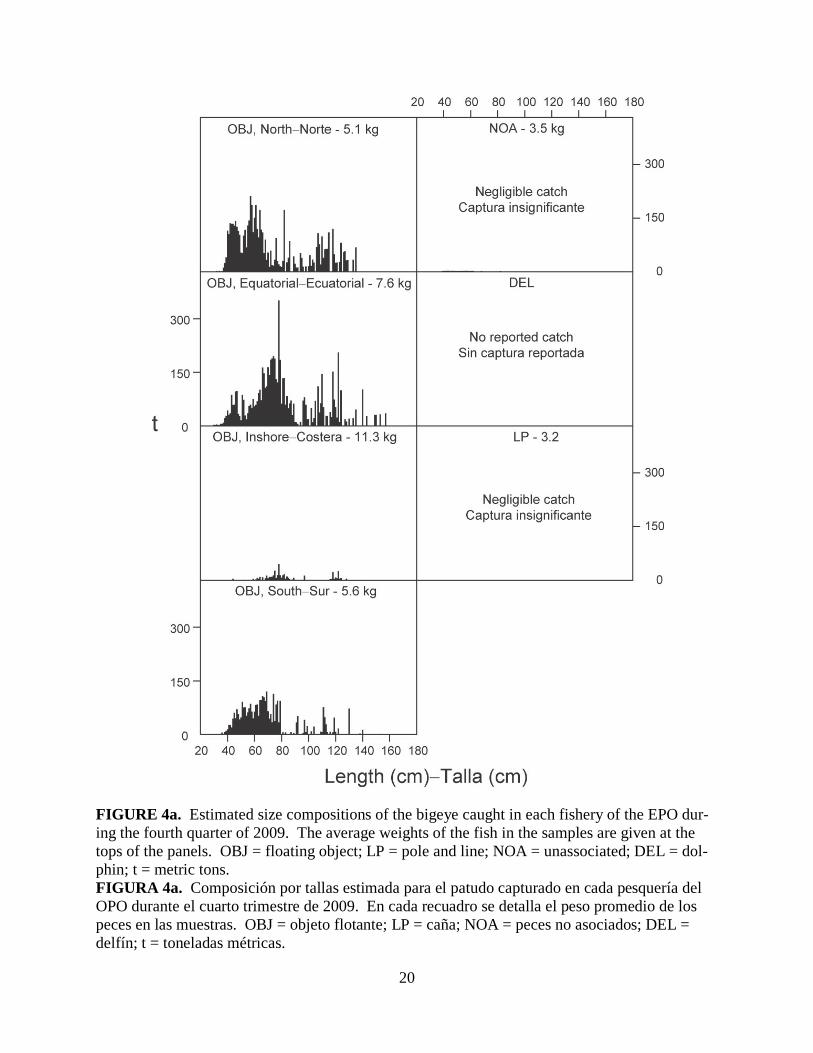
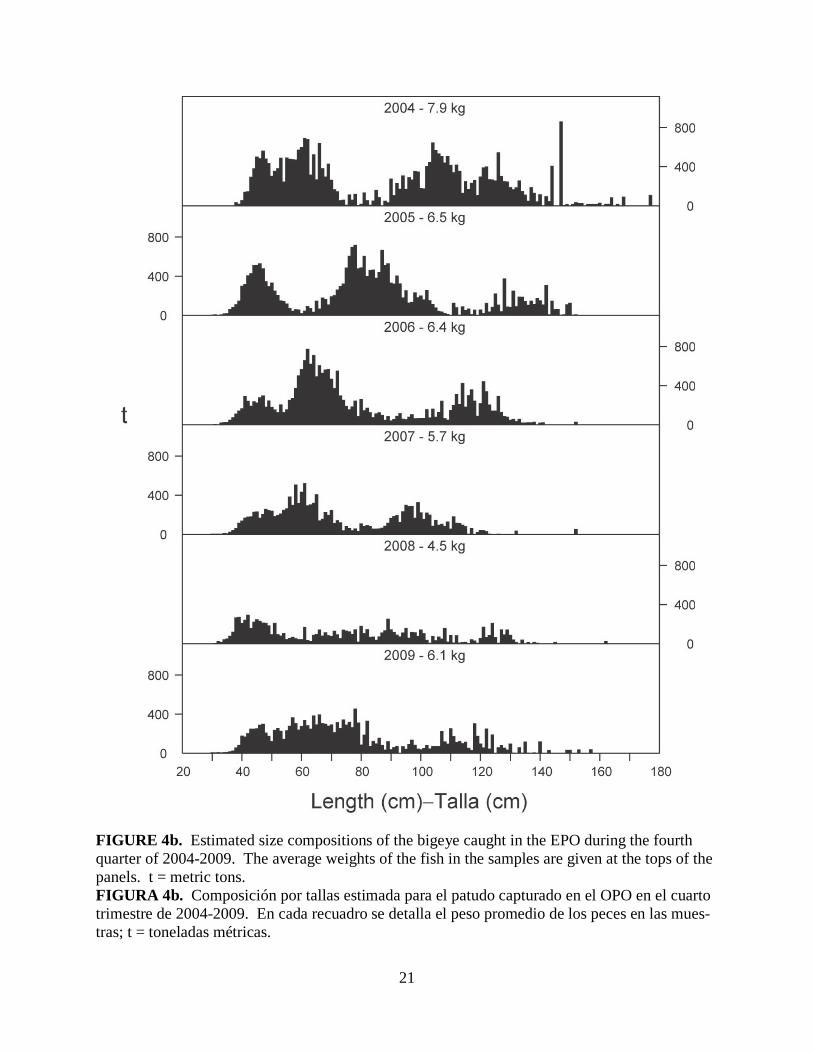
There are seven surface fisheries for bigeye defined for stock assessments: four asso-ciated with floating objects, one unassociated school, one associated with dolphins, and one pole-and-line (Figure 1). The last three fisheries include all 13 sampling areas. Of the 151 wells sampled that contained fish caught during the fourth quarter of 2009, 61 contained bigeye. The estimated size compositions of these fish are shown in Figure 4a. The majority of the catch was taken in floating-object sets in the Northern, Equatorial, and Southern areas, with a large portion of this catch in the 40- to 80-cm size range. Smaller amounts of bigeye were taken in the In-shore floating-object fishery.
The estimated size compositions of the bigeye caught by all fisheries combined during the fourth quarters of 2004-2009 are shown in Figure 4b. The average weight of bigeye during the fourth quarter of 2009 (6.1 kg) was considerably greater than that of 2008 (4.5 kg) and consi-derably less than that of 2004 (7.9 kg).
The estimated retained purse-seine catch of bigeye less than 60 cm in length during 2009 was 26,302 metric tons (t), or about 34 percent of the estimated total retained purse-seine catch of bigeye during that period. The corresponding amounts for 2002-2008 ranged from 16,781 to 34,779 t, or 26 to 41 percent. These values may differ slightly from those given in previous Quarterly Reports due to changes in the estimation procedure.
BIOLOGY AND ECOSYSTEM PROGRAM
Tuna tagging
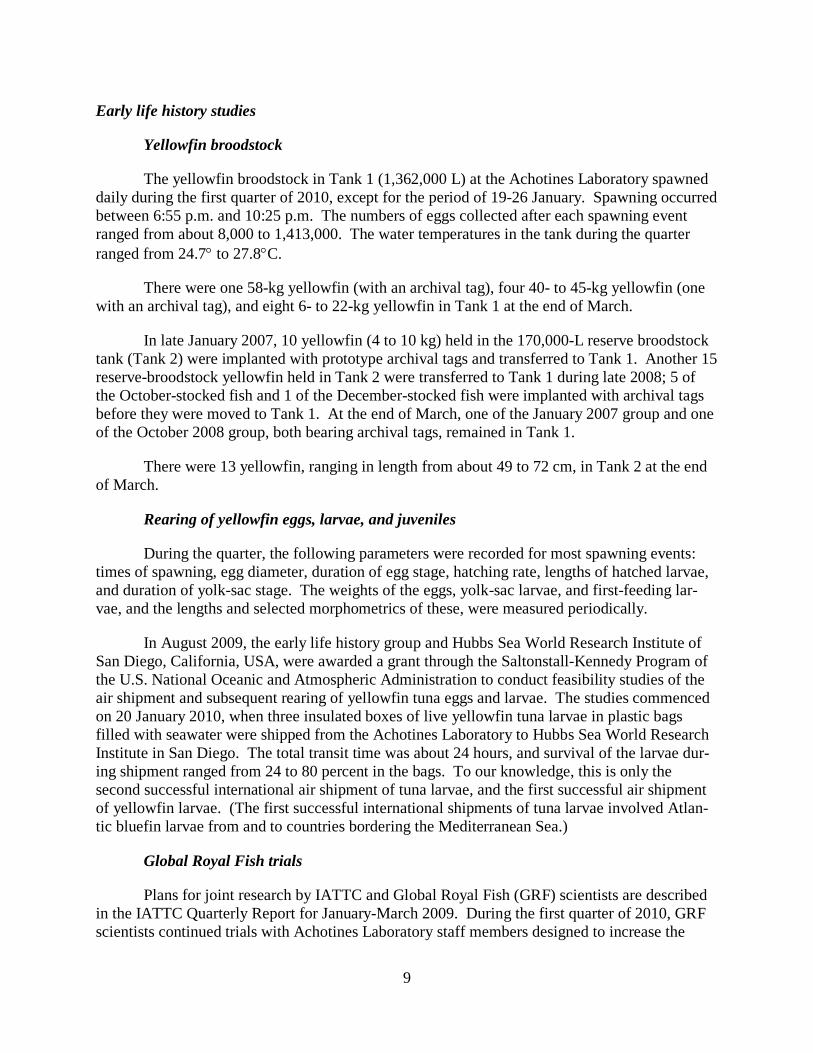
Two IATTC staff members spent the period of 7-21 February 2010 aboard the 28-m sport-fishing vessel Royal Star, which made a trip to the Revillagigedo Islands Marine Reserve, Mexico, for the purpose of tagging yellowfin tuna and wahoo. The tagging project is a collabor-ative effort between the IATTC, the Instituto Nacional de Pesca of Mexico, and the owners of the Royal Star. The permit, obtained from the government of Mexico for this project, provides a unique opportunity to conduct a comprehensive scientific evaluation of the movements and be-havior of yellowfin tuna and wahoo within the Revillagigedo Islands Marine Reserve and in areas to which the fish might move, through no-retention tag-and-release fishing trips aboard the Royal Star. The trip was highly successful, as 467 yellowfin were brought aboard the boat, measured, tagged with conventional plastic dart tags, and released, and 2 additional yellowfin were brought alongside the boat, tagged in the water with plastic intramuscular tags, and re-leased. (Intramuscular tags are applied, with tagging poles, in the water, which reduces the stress to the fish, but makes it infeasible to measure them.) Of these 469 fish, 151 weighed more than 100 pounds (45 kg). An additional 25 yellowfin were brought aboard the boat, measured, tagged with archival tags, and released (9 at Isla San Benedicto, 4 at Roca Partida, and 12 at Isla Cla-rion). In addition, 39 wahoo, most weighing about 20 to 40 pounds (9 to 18 kg), were tagged in the water with plastic intramuscular tags and released.
9
Early life history studies
Yellowfin broodstock
The yellowfin broodstock in Tank 1 (1,362,000 L) at the Achotines Laboratory spawned daily during the first quarter of 2010, except for the period of 19-26 January. Spawning occurred between 6:55 p.m. and 10:25 p.m. The numbers of eggs collected after each spawning event ranged from about 8,000 to 1,413,000. The water temperatures in the tank during the quarter ranged from 24.7° to 27.8°C.
There were one 58-kg yellowfin (with an archival tag), four 40- to 45-kg yellowfin (one with an archival tag), and eight 6- to 22-kg yellowfin in Tank 1 at the end of March.
In late January 2007, 10 yellowfin (4 to 10 kg) held in the 170,000-L reserve broodstock tank (Tank 2) were implanted with prototype archival tags and transferred to Tank 1. Another 15 reserve-broodstock yellowfin held in Tank 2 were transferred to Tank 1 during late 2008; 5 of the October-stocked fish and 1 of the December-stocked fish were implanted with archival tags before they were moved to Tank 1. At the end of March, one of the January 2007 group and one of the October 2008 group, both bearing archival tags, remained in Tank 1.
There were 13 yellowfin, ranging in length from about 49 to 72 cm, in Tank 2 at the end of March.
Rearing of yellowfin eggs, larvae, and juveniles
During the quarter, the following parameters were recorded for most spawning events: times of spawning, egg diameter, duration of egg stage, hatching rate, lengths of hatched larvae, and duration of yolk-sac stage. The weights of the eggs, yolk-sac larvae, and first-feeding lar-vae, and the lengths and selected morphometrics of these, were measured periodically.
In August 2009, the early life history group and Hubbs Sea World Research Institute of San Diego, California, USA, were awarded a grant through the Saltonstall-Kennedy Program of the U.S. National Oceanic and Atmospheric Administration to conduct feasibility studies of the air shipment and subsequent rearing of yellowfin tuna eggs and larvae. The studies commenced on 20 January 2010, when three insulated boxes of live yellowfin tuna larvae in plastic bags filled with seawater were shipped from the Achotines Laboratory to Hubbs Sea World Research Institute in San Diego. The total transit time was about 24 hours, and survival of the larvae dur-ing shipment ranged from 24 to 80 percent in the bags. To our knowledge, this is only the second successful international air shipment of tuna larvae, and the first successful air shipment of yellowfin larvae. (The first successful international shipments of tuna larvae involved Atlan-tic bluefin larvae from and to countries bordering the Mediterranean Sea.)
Global Royal Fish trials
Plans for joint research by IATTC and Global Royal Fish (GRF) scientists are described in the IATTC Quarterly Report for January-March 2009. During the first quarter of 2010, GRF scientists continued trials with Achotines Laboratory staff members designed to increase the
10
growth and survival of larval and juvenile yellowfin tuna. These trials will be continued through the second quarter of 2010.
Studies of snappers
The work on snappers (Lutjanus spp.) is carried out by the Autoridad de los Recursos Acuáticos de Panamá (ARAP).
During 1996-2009, ARAP staff members had conducted full life cycle research on spot-ted rose snapper (Lutjanus guttatus) in captivity. During the second and third quarters of 2009, the broodstock fish died due to low water temperatures and feeding problems. The mortality coincided with ARAP plans to commence spawning and rearing studies with a new, more com-mercially-important species of snapper. Yellow snapper (Lutjanus argentiventris) was chosen as the new species of snapper for study. During the first quarter, collection of broodstock yellow snapper, started during the fourth quarter of 2009, continued in local waters. At the end of March, there were 18 yellow snappers being held in reserve holding tanks at the Laboratory.
Visitors at the Achotines Laboratory
Dr. Takahisa Mitsuhashi, Overseas Fisheries Cooperation Foundation of Japan Fisheries Expert, and Mr. Kazuyoshi Shimizu, Consul at the Japanese Embassy in Panama, visited the Achotines Laboratory on 14-16 February 2010.
A mission from the Overseas Fishery Cooperation Foundation, consisting of Dr. Tokima-sa Kobayashi, Mr. Hirokazu Chubachi, Dr. Takahisa Mitsuhashi, and Mr. Toshihiro Araya, vi-sited the Achotines Laboratory on 1 March 2010 to check on the status of activities and infra-structure there.
Dr. Stephen W. Pacala, Frederick D. Petrie Professor in the Department of Ecology and Evolutionary Biology at Princeton University, Princeton, New Jersey, USA, taught a portion of his “Biology of Coral Reefs” field course at the Achotines Laboratory. The 30-person group ar-rived at the Achotines Laboratory on 8 March and departed on 11 March 2010.
Oceanography and meteorology
Easterly surface winds blow almost constantly over northern South America, which cause upwelling of cool, nutrient-rich subsurface water along the equator east of 160ºW, in the coastal regions off South America, and in offshore areas off Mexico and Central America. El Niño events are characterized by weaker-than-normal easterly surface winds, which cause above-normal sea-surface temperatures (SSTs) and sea levels and deeper-than-normal thermoclines over much of the tropical eastern Pacific Ocean (EPO). In addition, the Southern Oscillation In-dices (SOIs) are negative during El Niño episodes. (The SOI is the difference between the ano-malies of sea-level atmospheric pressure at Tahiti, French Polynesia, and Darwin, Australia. It is a measure of the strength of the easterly surface winds, especially in the tropical Pacific in the Southern Hemisphere.) Anti-El Niño events, which are the opposite of El Niño events, are cha-racterized by stronger-than-normal easterly surface winds, below-normal SSTs and sea levels, shallower-than-normal thermoclines, and positive SOIs. Two additional indices, the NOI* (Progress Ocean., 53 (2-4): 115-139) and the SOI*, have recently been devised. The NOI* is the
11
difference between the anomalies of sea-level atmospheric pressure at the North Pacific High (35°N-130°W) and Darwin, Australia, and the SOI* is the difference between the anomalies of sea-level atmospheric pressure at the South Pacific High (30°S-95°W) and Darwin. Ordinarily, the NOI* and SOI* values are both negative during El Niño events and positive during anti-El Niño events.
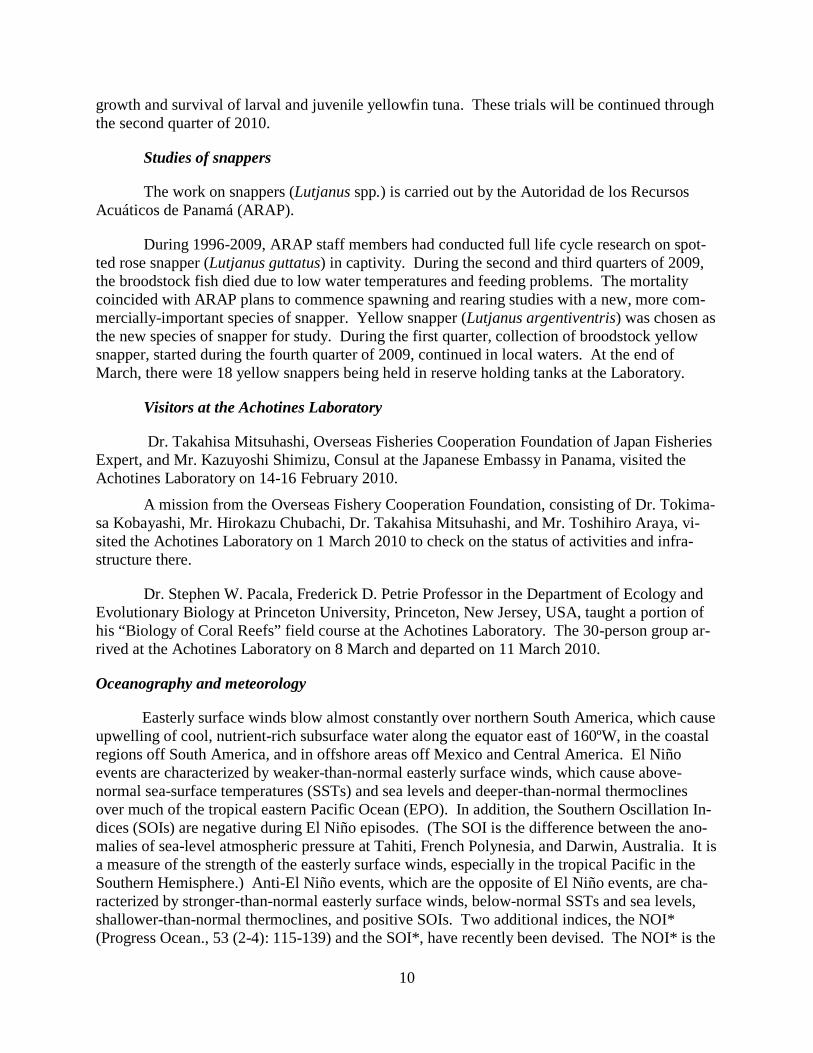
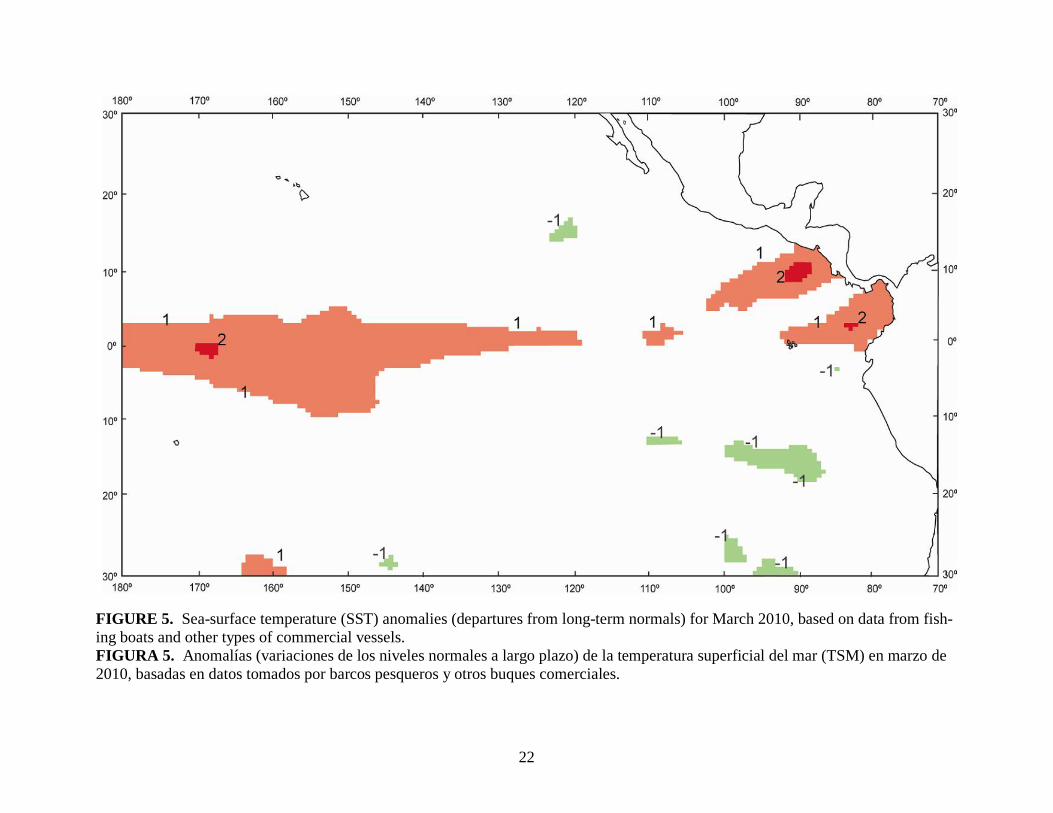
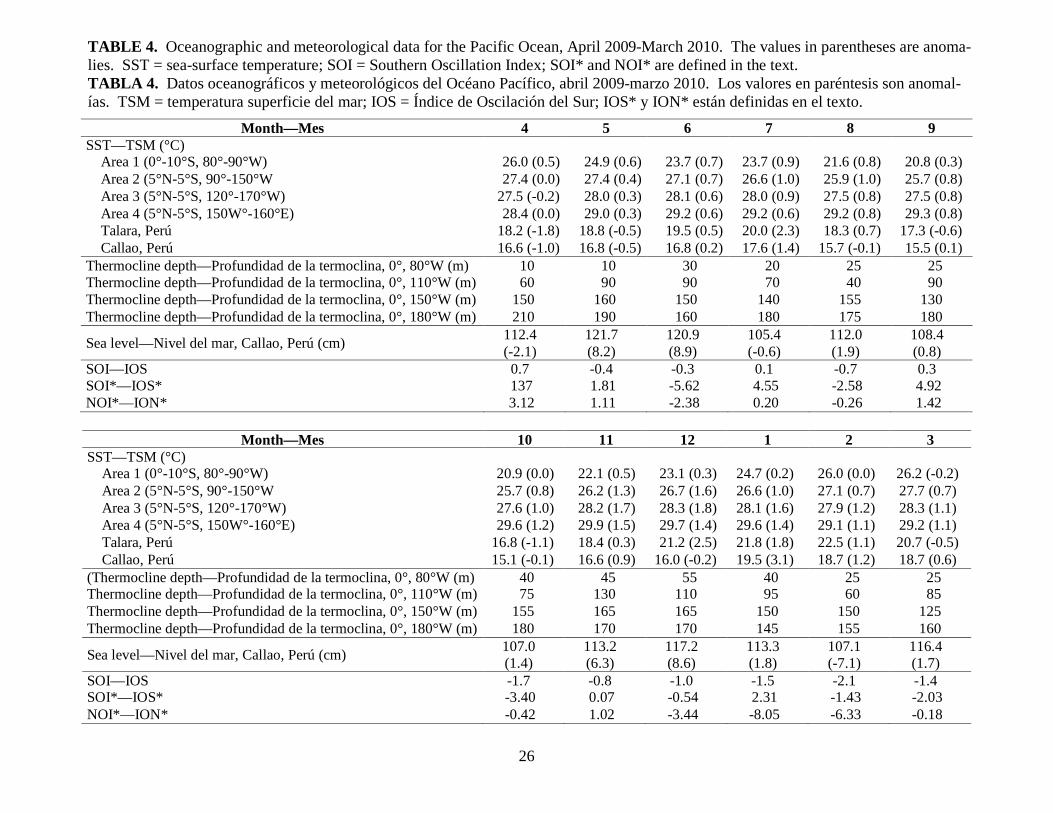
Weak anti-El Niño conditions were in effect in the EPO during the first quarter of 2009 (IATTC Quarterly Report for January-March 2009). A band of cool water that had existed along the equator during the first four months of 2009 virtually disappeared in May, and in June it was replaced by a band of warm water that persisted for the rest of the year. The SSTs were mostly above normal during the second quarter of 2009 and all normal or above normal during the third and fourth quarters of that year (IATTC Quarterly Report for October-December 2009: Figure 6; Table 5). Also, the depths of the thermoclines were greater and the sea levels at Callao, Peru, were higher during the fourth quarter. The band of warm water that had existed along the equa-tor since June 2009 persisted throughout the first quarter of 2010 (Figure 5). An area of cool wa-ter that had formed offshore off Peru in late 2009 reached its maximum area in January 2010, and then it diminished in February and March. The SSTs were mostly above average during the first quarter (Table 4). However, the thermoclines along the equator at 80°W during February and March were shallow, and the sea level at Callao, Peru, in February was well below average, both indicating anti-El Niño conditions. On the other hand, the NOIs in January and February were strongly negative, indicating El Niño conditions. According to the Climate Diagnostics Bulletin of the U.S. National Weather Service for March 2010, the current El Niño event “is ex-pected to continue through the Northern Hemisphere spring [of] 2010 and transition to … neutral conditions by the Northern Hemisphere summer [of] 2010. The majority of models … indicate the persistence of … neutral conditions through 2010.” BYCATCH AND AIDCP PROGRAM
Data collection
The IATTC had field offices at Las Playas and Manta, Ecuador; Manzanillo and Ma-zatlan, Mexico; Panama, Republic of Panama; and Cumaná, Venezuela, during the first quarter of 2010. Members of the field office staffs placed IATTC observers on 114 fishing trips by vessels that participate in the AIDCP On-Board Observer Program during the quarter. In addi-tion, 80 IATTC observers completed trips during the quarter, and were debriefed by field of-fice personnel.
Observer program
Coverage
The Agreement on the International Dolphin Conservation Program (AIDCP) requires 100-percent coverage by observers on trips by purse seiners with carrying capacities greater than 363 metric tons that fish for tunas in the eastern Pacific Ocean (EPO). This mandate is carried out by the AIDCP On-Board Observer Program, made up of the IATTC’s international observer program and the observer programs of Colombia, Ecuador, the European Union, Mexico, Nicaragua, Panama, and Venezuela. The observers are biologists trained to collect a variety of
12
data on the mortalities of dolphins associated with the fishery, sightings of dolphin herds, catches of tunas and bycatches of fish and other animals, oceanographic and meteorological data, and other information used by the IATTC staff to assess the conditions of the various stocks of dolphins, study the causes of dolphin mortality, and assess the effect of the fishery on tunas and other components of the ecosystem. The observers also collect data relevant to compliance with the provisions of the AIDCP, and data required for the tuna-tracking system established under the AIDCP, which tracks the “dolphin-safe” status of tuna caught in each set from the time it is captured until it is unloaded (and, after that, until it is canned and labeled).
In 2010 the observer programs of Colombia, the European Union, Mexico, Nicaragua, Panama, and Venezuela are to sample half, and that of Ecuador approximately one-third, of the trips by vessels of their respective fleets, while IATTC observers are to sample the remainder of those trips. Except as described in the next paragraph, the IATTC is to cover all trips by vessels registered in other nations that are required to carry observers.
At the fifth meeting of the Parties to the AIDCP in June 2001, observers from the international observer program of the South Pacific Forum Fisheries Agency (FFA) were approved to collect pertinent information for the On-Board Observer Program, pursuant to Annex II (9) of the AIDCP in cases for which the Director determines that the use of an observer from the AIDCP On-Board Observer Program is not practical.
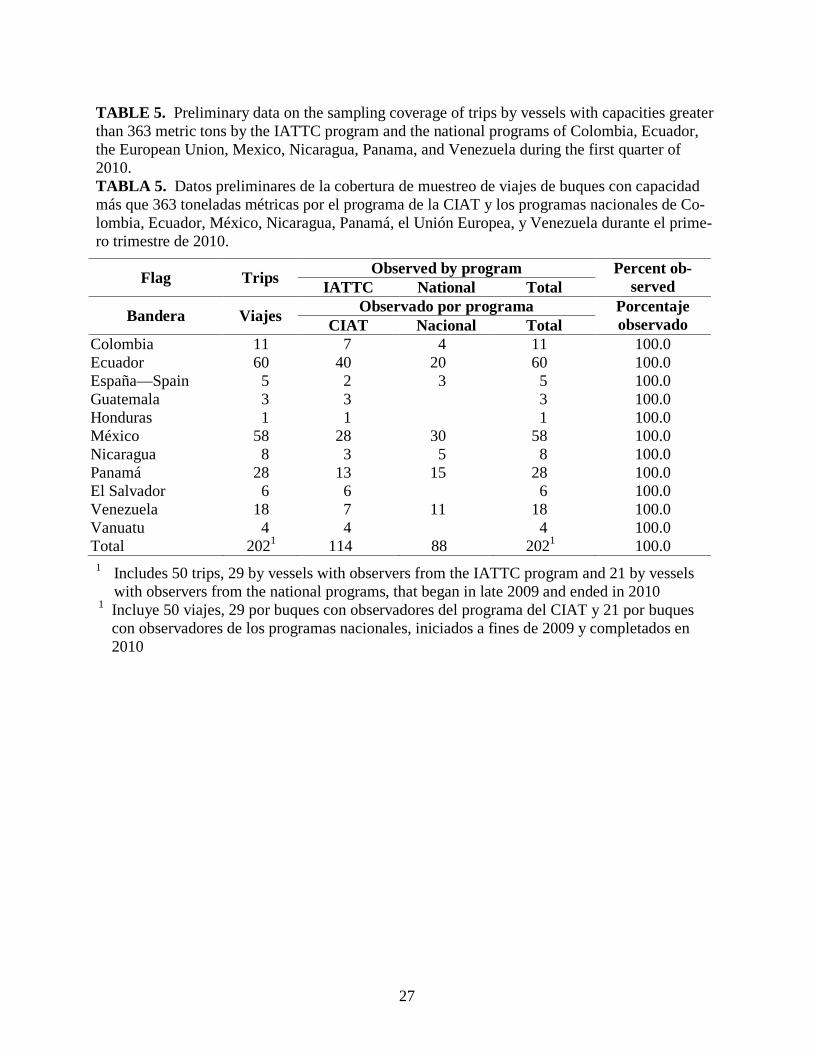
Observers from the On-Board Observer Program departed on 202 fishing trips aboard purse seiners covered by that program during the first quarter of 2010. Preliminary coverage data for these vessels during the quarter are shown in Table 5.
Training
There were no IATTC observer training courses conducted during the quarter.
GEAR PROJECT
During the first quarter an IATTC staff member participated in a dolphin safety-gear in-spection and safety-panel alignment procedure aboard a Mexican-flag purse-seiner.
INTER-AGENCY COOPERATION Mr. Brian S. Hallman gave a talk on high-seas fisheries under the Law of the Sea Con-vention, with emphasis on highly-migratory species, to a class on Law of the Sea at the Califor-nia Western School of Law, San Diego, California, USA, on 24 February 2010.
PUBLICATIONS
IATTC
Anonymous. 2010. Inter-American Tropical Tuna Commission. Annual Report for 2008: 100 pp.

13
Outside journals
Gilman, Eric, Jeff Gearhart, Blake Price, Scott Eckert, Henry Milliken, John Wang, Yonat Swimmer, Daisuke Shiode, Osamu Abe, S. Hoyt Peckham, Milani Chaloupka, Martín Hall, Jeff Mangel, Joanna Alfaro-Shigueto, Paul Dalzell, and Asuka Ishizaki. 2010. Mitigating sea turtle by-catch in coastal passive net fisheries. Fish and Fisheries, 11 (1): 57-88.
Lennert-Cody, Cleridy E., Mihoko Minami, Patrick K. Tomlinson, and Mark N. Maunder. 2010. Exploratory analysis of spatial-temporal patterns in length-frequency data: an example of distributional regression trees. Fish. Res., 102 (3): 323-326.
Book
Allen, Robin, James Joseph, and Dale Squires (editors). 2010. Conservation and Manage-ment of Transnational Tuna Fisheries, Wiley-Blackwell: xvi, 343 pp.
Chapters in books
Allen, Robin, James Joseph, Dale Squires, and Elizabeth Stryjewski. 2010. Introduction In Allen, Robin, James Joseph, and Dale Squires (editors), Conservation and Management of Transnational Tuna Fisheries, Wiley-Blackwell: 3-10.
Joseph, James, Dale Squires, William Bayliff, and Theodore Groves. 2010. Addressing the problem of excess fishing capacity in tuna fisheries. In Allen, Robin, James Joseph, and Dale Squires (editors), Conservation and Management of Transnational Tuna Fisheries, Wiley-Blackwell: 11-38.
Allen, Robin, William Bayliff, James Joseph, and Dale Squires. 2010. Rights-based man-agement in transnational tuna fisheries. In Allen, Robin, James Joseph, and Dale Squires (editors), Conservation and Management of Transnational Tuna Fisheries, Wiley-Blackwell: 65-86.
Allen, Robin, William Bayliff, James Joseph, and Dale Squires. 2010. The benefits and costs of transformation of open access on the high seas In Allen, Robin, James Joseph, and Dale Squires (editors), Conservation and Management of Transnational Tuna Fisheries, Wiley-Blackwell: 87-95.
Squires, Dale, James Joseph, and Theodore Groves. 2010. Buybacks in transnational fisheries In Allen, Robin, James Joseph, and Dale Squires (editors), Conservation and Manage-ment of Transnational Tuna Fisheries, Wiley-Blackwell: 181-194.
Hallman, Brian, Scott Barrett, Raymond Clarke, James Joseph, and Dale Squires. 2010. Li-mited access in transnational tuna fisheries. In Allen, Robin, James Joseph, and Dale Squires (editors), Conservation and Management of Transnational Tuna Fisheries, Wiley-Blackwell: 195-211.
Gjertsen, Heidi, Martín Hall, and Dale Squires. 2010. Incentives to address bycatch issues. In Allen, Robin, James Joseph, and Dale Squires (editors), Conservation and Management of Transnational Tuna Fisheries, Wiley-Blackwell: 225-248.
Squires, Dale, Theodore Groves, R. Quentin Grafton, Rita Curtis, James Joseph, and Robin Allen. 2010. Fisheries buybacks. In Grafton, R. Quentin, Ray Hilborn, Dale Squires, Ma-
14
ree Tait, and Meryl Williams (editors). Handbook of Marine Fisheries Conservation and Management, Oxford University Press: 507-519.
Allen, Robin, James Joseph, and Dale Squires. 2010. Managing world tuna fisheries with emphasis on rights-based management. In Grafton, R. Quentin, Ray Hilborn, Dale Squires, Maree Tait, and Meryl Williams (editors). Handbook of Marine Fisheries Con-servation and Management, Oxford University Press: 698-712.
ADMINISTRATION Ms. Denisse Bonares, a graduate of San Diego State University, San Diego, California, USA, was hired as bilingual secretary for the Bycatch and AIDCP Program on 8 February 2010. She replaces Ms. Mary Carmen López, who had resigned on 20 December 2009.
15
FIGURE 1. Spatial extents of the fisheries defined by the IATTC staff for stock assessment of yellowfin, skipjack, and bigeye in the EPO. The thin lines indicate the boundaries of the 13 length-frequency sampling areas, and the bold lines the boundaries of the fisheries. Gear: PS = purse seine, LP = pole and line; Set type: NOA = unassociated, DEL = dolphin, OBJ = floating object; Species: YFT = yellowfin, SKJ = skipjack, BET = bigeye. FIGURA 1. Extensión espacial de las pesquerías definidas por el personal de la CIAT para la evaluación de las poblaciones de atún aleta amarilla, barrilete, y patudo en el OPO. Las líneas delgadas indican los límites de las 13 zonas de muestreo de frecuencia de tallas, y las líneas gruesas los límites de las pesquerías. Artes: PS = red de cerco, LP = caña; Tipo de lance: NOA = peces no asociados, DEL = delfín; OBJ = objeto flotante; Especies: YFT = aleta amarilla, SKJ = barrilete, BET = patudo.
16
FIGURE 2a. Estimated size compositions of the yellowfin caught in each fishery of the EPO during the fourth quarter of 2009. The average weights of the fish in the samples are given at the tops of the panels. OBJ = floating object; LP = pole and line; NOA = unassociated; DEL = dol-phin; t = metric tons. FIGURA 2a. Composición por tallas estimada para el aleta amarilla capturado en cada pesquer-ía del OPO durante el cuarto trimestre de 2009. En cada recuadro se detalla el peso promedio de los peces en las muestras. OBJ = objeto flotante; LP = caña; NOA = peces no asociados; DEL = delfín; t = toneladas métricas.
17
FIGURE 2b. Estimated size compositions of the yellowfin caught in the EPO during the fourth quarter of 2004-2009. The average weights of the fish in the samples are given at the tops of the panels. t = metric tons. FIGURA 2b. Composición por tallas estimada para el aleta amarilla capturado en el OPO en el cuarto trimestre de 2004-2009. En cada recuadro se detalla el peso promedio de los peces en las muestras; t = toneladas métricas.
18
FIGURE 3a. Estimated size compositions of the skipjack caught in each fishery of the EPO during the fourth quarter of 2009. The average weights of the fish in the samples are given at the tops of the panels. OBJ = floating object; LP = pole and line; NOA = unassociated; DEL = dol-phin; t = metric tons. FIGURA 3a. Composición por tallas estimada para el barrilete capturado en cada pesquería del OPO durante el cuarto trimestre de 2009. En cada recuadro se detalla el peso promedio de los peces en las muestras. OBJ = objeto flotante; LP = caña; NOA = peces no asociados; DEL = delfín; t = toneladas métricas.
19
FIGURE 3b. Estimated size compositions of the skipjack caught in the EPO during the fourth quarter of 2004-2009. The average weights of the fish in the samples are given at the tops of the panels. t = metric tons. FIGURA 3b. Composición por tallas estimada para el barrilete capturado en el OPO en el cuar-to trimestre de 2004-2009. En cada recuadro se detalla el peso promedio de los peces en las muestras. t = toneladas métricas.
20
FIGURE 4a. Estimated size compositions of the bigeye caught in each fishery of the EPO dur-ing the fourth quarter of 2009. The average weights of the fish in the samples are given at the tops of the panels. OBJ = floating object; LP = pole and line; NOA = unassociated; DEL = dol-phin; t = metric tons. FIGURA 4a. Composición por tallas estimada para el patudo capturado en cada pesquería del OPO durante el cuarto trimestre de 2009. En cada recuadro se detalla el peso promedio de los peces en las muestras. OBJ = objeto flotante; LP = caña; NOA = peces no asociados; DEL = delfín; t = toneladas métricas.
21
FIGURE 4b. Estimated size compositions of the bigeye caught in the EPO during the fourth quarter of 2004-2009. The average weights of the fish in the samples are given at the tops of the panels. t = metric tons. FIGURA 4b. Composición por tallas estimada para el patudo capturado en el OPO en el cuarto trimestre de 2004-2009. En cada recuadro se detalla el peso promedio de los peces en las mues-tras; t = toneladas métricas.
22
FIGURE 5. Sea-surface temperature (SST) anomalies (departures from long-term normals) for March 2010, based on data from fish-ing boats and other types of commercial vessels. FIGURA 5. Anomalías (variaciones de los niveles normales a largo plazo) de la temperatura superficial del mar (TSM) en marzo de 2010, basadas en datos tomados por barcos pesqueros y otros buques comerciales.
23
TABLE 1. Estimates of the numbers and capacities (m3) of purse seiners and pole-and-line ves-sels operating in the EPO in 2010 by flag, gear, and well volume. Each vessel is included in the totals for each flag under which it fished during the year, but is included only once in the fleet total. Therefore the totals for the fleet may not equal the sums of the individual flag entries. PS = purse seine; LP = pole-and-line. TABLA 1. Estimaciones del número de buques cerqueros y cañeros que pescan en el OPO en 2010, y de la capacidad de acarreo (m3) de los mismos por bandera, arte de pesca, y volumen de bo-dega. Se incluye cada buque en los totales de cada bandera bajo la cual pescó durante el año, pero solamente una vez en el total de la flota; por consiguiente, los totales de las flotas no son siempre iguales a las sumas de las banderas individuales. PS = cerquero; LP = cañero.
Flag Gear Well volume–Volumen de bodega Capacity Bandera Arte 1-900 901-1700 >1700 Total Capacidad
Number—Número Bolivia PS 1 - - 1 222 Colombia PS 4 10 - 14 14,860 Ecuador PS 62 12 9 83 59,611 España—Spain PS - - 4 4 10,116 Guatemala PS - 3 1 4 6,400 Honduras PS 1 1 - 2 1,559 México PS 11 31 1 43 47,920
LP 4 - - 4 380 Nicaragua PS - 5 - 5 6,353 Panamá PS 3 16 3 22 29,137 Perú PS 1 - - 1 458 El Salvador PS - 1 3 4 7,415 Venezuela PS - 17 - 17 22,747 Vanuatu PS 1 2 - 3 3,609 All flags— Todas banderas
PS 84 98 21 203 LP 4 - - 4
PS + LP 88 98 21 207 Capacity—Capacidad All flags— Todas banderas
PS 38,057 127,534 44,816 210,407 LP 380 - - 380
PS + LP 38,437 127,534 44,816 210,787
24
TABLE 2. Estimates of the retained catches of tunas in the EPO, from 1 January through 28 March 2010, by species and vessel flag, in metric tons. TABLA 2. Estimaciones preliminares de las capturas retenidas de atunes en el OPO del 1 de enero al 28 de marzo 2010, por especie y bandera del buque, en toneladas métricas.
Flag Yellowfin Skipjack Bigeye Pacific bluefin
Bonitos (Sarda spp.)
Albacore Black skipjack Other1 Total Percentage
of total
Bandera Aleta amarilla Barrilete Patudo
Aleta azul del Pacífi-
co
Bonitos (Sarda spp.)
Albacora Barrilete negro Otras1 Total Porcentaje
del total
Ecuador 7,425 25,666 6,797 - - - - 5 39,893 33.6 México 28,595 2,169 - - - - 530 3 31,297 26.4 Nicaragua 2,874 1,015 318 - - - - - 4,207 3.6 Panamá 7,774 5,281 710 - - - - 1 13,766 11.6 Venezuela 5,837 2,927 18 - - - - - 8,782 7.4 Other—Otros2 9,634 9,199 1,842 - - - - 1 20,676 17.4 Total 62,139 46,257 9,685 - - - 530 10 118,621 1 Includes other tunas, sharks, and miscellaneous fishes 1 Incluye otros túnidos, tiburones, y peces diversos 2 Includes Colombia, El Salvador, Guatemala, Honduras, Peru, Spain, and Vanuatu; this category is used to avoid revealing the oper-
ations of individual vessels or companies. 2 Incluye Colombia, El Salvador, España, Guatemala, Honduras, Perú, y Vanuatú; se usa esta categoría para no revelar información sobre faenas de buques o empresas individuales.
25
TABLE 3a. Catches of bigeye tuna, in metric tons, in the eastern Pacific Ocean during 2009 by longline vessels more than 24 meters in overall length. TABLA 3a. Capturas de atún patudo, en toneladas métricas, en el Océano Pacífico oriental du-rante 2009 por buques palangreros de más de 24 metros en eslora total.
Flag—Bandera Quarter—Trimestre Total 1 2 3 4 China 494 677 698 612 2,481 Japan—Japón 3,362 2,825 3,380 3,910 13,477 Republic of Korea—República de Corea*
1,314 1,526 1,503 1,691 6,034
Chinese Taipei—Taipei Chino 461 625 641 1,698 3,425 United States—Estados Unidos - - - - - Vanuatu 183 166 296 468 1,113 Total 5,814 5,819 6,518 8,379 26,530 * Round weight obtained by adjustment applied to processed weight—Peso entero obtenido mediante ajuste aplica-
do al peso procesado provisto
TABLE 3b. Preliminary estimates of the catches of bigeye tuna, in metric tons, in the eastern Pacific Ocean during the first quarter of 2010 by longline vessels more than 24 meters in overall length. TABLA 3b. Estimaciones preliminares de las capturas de atún patudo, en toneladas métricas, en el Océano Pacífico oriental durante el primer trimestre de 2010 por buques palangreros de más de 24 metros en eslora total.
Flag—Bandera Month—Mes Total 1 2 3 China - - - - Japan—Japón 1,437 1,054 1,208 3,699 Republic of Korea—República de Corea* - - - - Chinese Taipei—Taipei Chino 676 397 - 1,073 United States— Estados Unidos - - - - Vanuatu 128 61 - 189 * Round weight obtained by adjustment applied to processed weight—Peso entero obtenido mediante ajuste aplica-
do al peso procesado provisto
26
TABLE 4. Oceanographic and meteorological data for the Pacific Ocean, April 2009-March 2010. The values in parentheses are anoma-lies. SST = sea-surface temperature; SOI = Southern Oscillation Index; SOI* and NOI* are defined in the text. TABLA 4. Datos oceanográficos y meteorológicos del Océano Pacífico, abril 2009-marzo 2010. Los valores en paréntesis son anomal-ías. TSM = temperatura superficie del mar; IOS = Índice de Oscilación del Sur; IOS* y ION* están definidas en el texto.
Month—Mes 4 5 6 7 8 9 SST—TSM (°C) Area 1 (0°-10°S, 80°-90°W) 26.0 (0.5) 24.9 (0.6) 23.7 (0.7) 23.7 (0.9) 21.6 (0.8) 20.8 (0.3) Area 2 (5°N-5°S, 90°-150°W 27.4 (0.0) 27.4 (0.4) 27.1 (0.7) 26.6 (1.0) 25.9 (1.0) 25.7 (0.8) Area 3 (5°N-5°S, 120°-170°W) 27.5 (-0.2) 28.0 (0.3) 28.1 (0.6) 28.0 (0.9) 27.5 (0.8) 27.5 (0.8) Area 4 (5°N-5°S, 150W°-160°E) 28.4 (0.0) 29.0 (0.3) 29.2 (0.6) 29.2 (0.6) 29.2 (0.8) 29.3 (0.8) Talara, Perú 18.2 (-1.8) 18.8 (-0.5) 19.5 (0.5) 20.0 (2.3) 18.3 (0.7) 17.3 (-0.6) Callao, Perú 16.6 (-1.0) 16.8 (-0.5) 16.8 (0.2) 17.6 (1.4) 15.7 (-0.1) 15.5 (0.1) Thermocline depth—Profundidad de la termoclina, 0°, 80°W (m) 10 10 30 20 25 25 Thermocline depth—Profundidad de la termoclina, 0°, 110°W (m) 60 90 90 70 40 90 Thermocline depth—Profundidad de la termoclina, 0°, 150°W (m) 150 160 150 140 155 130 Thermocline depth—Profundidad de la termoclina, 0°, 180°W (m) 210 190 160 180 175 180
Sea level—Nivel del mar, Callao, Perú (cm) 112.4 (-2.1)
121.7 (8.2)
120.9 (8.9)
105.4 (-0.6)
112.0 (1.9)
108.4 (0.8)
SOI—IOS 0.7 -0.4 -0.3 0.1 -0.7 0.3 SOI*—IOS* 137 1.81 -5.62 4.55 -2.58 4.92 NOI*—ION* 3.12 1.11 -2.38 0.20 -0.26 1.42
Month—Mes 10 11 12 1 2 3
SST—TSM (°C) Area 1 (0°-10°S, 80°-90°W) 20.9 (0.0) 22.1 (0.5) 23.1 (0.3) 24.7 (0.2) 26.0 (0.0) 26.2 (-0.2) Area 2 (5°N-5°S, 90°-150°W 25.7 (0.8) 26.2 (1.3) 26.7 (1.6) 26.6 (1.0) 27.1 (0.7) 27.7 (0.7) Area 3 (5°N-5°S, 120°-170°W) 27.6 (1.0) 28.2 (1.7) 28.3 (1.8) 28.1 (1.6) 27.9 (1.2) 28.3 (1.1) Area 4 (5°N-5°S, 150W°-160°E) 29.6 (1.2) 29.9 (1.5) 29.7 (1.4) 29.6 (1.4) 29.1 (1.1) 29.2 (1.1) Talara, Perú 16.8 (-1.1) 18.4 (0.3) 21.2 (2.5) 21.8 (1.8) 22.5 (1.1) 20.7 (-0.5) Callao, Perú 15.1 (-0.1) 16.6 (0.9) 16.0 (-0.2) 19.5 (3.1) 18.7 (1.2) 18.7 (0.6) (Thermocline depth—Profundidad de la termoclina, 0°, 80°W (m) 40 45 55 40 25 25 Thermocline depth—Profundidad de la termoclina, 0°, 110°W (m) 75 130 110 95 60 85 Thermocline depth—Profundidad de la termoclina, 0°, 150°W (m) 155 165 165 150 150 125 Thermocline depth—Profundidad de la termoclina, 0°, 180°W (m) 180 170 170 145 155 160
Sea level—Nivel del mar, Callao, Perú (cm) 107.0 (1.4)
113.2 (6.3)
117.2 (8.6)
113.3 (1.8)
107.1 (-7.1)
116.4 (1.7)
SOI—IOS -1.7 -0.8 -1.0 -1.5 -2.1 -1.4 SOI*—IOS* -3.40 0.07 -0.54 2.31 -1.43 -2.03 NOI*—ION* -0.42 1.02 -3.44 -8.05 -6.33 -0.18
27
TABLE 5. Preliminary data on the sampling coverage of trips by vessels with capacities greater than 363 metric tons by the IATTC program and the national programs of Colombia, Ecuador, the European Union, Mexico, Nicaragua, Panama, and Venezuela during the first quarter of 2010. TABLA 5. Datos preliminares de la cobertura de muestreo de viajes de buques con capacidad más que 363 toneladas métricas por el programa de la CIAT y los programas nacionales de Co-lombia, Ecuador, México, Nicaragua, Panamá, el Unión Europea, y Venezuela durante el prime-ro trimestre de 2010.
Flag Trips Observed by program Percent ob-served IATTC National Total
Bandera Viajes Observado por programa Porcentaje observado CIAT Nacional Total
Colombia 11 7 4 11 100.0 Ecuador 60 40 20 60 100.0 España—Spain 5 2 3 5 100.0 Guatemala 3 3 3 100.0 Honduras 1 1 1 100.0 México 58 28 30 58 100.0 Nicaragua 8 3 5 8 100.0 Panamá 28 13 15 28 100.0 El Salvador 6 6 6 100.0 Venezuela 18 7 11 18 100.0 Vanuatu 4 4 4 100.0 Total 2021 114 88 2021 100.0 1 Includes 50 trips, 29 by vessels with observers from the IATTC program and 21 by vessels
with observers from the national programs, that began in late 2009 and ended in 2010 1 Incluye 50 viajes, 29 por buques con observadores del programa del CIAT y 21 por buques
con observadores de los programas nacionales, iniciados a fines de 2009 y completados en 2010


![Boletim Estatístico Trimestral n.º 10 · [BOLETIM ESTATÍSTICO TRIMESTRAL N.º 10] ABR-JUN’11 [ 3 ] NOTAS E MÉTODOS O décimo boletim estatístico trimestral, referente ao período](https://img.pdfslide.us/doc/110x75/5fa8f46f720f3f6d790c1c53/boletim-estatstico-trimestral-n-10-boletim-estatstico-trimestral-n-10.jpg)