Embed Size (px)
Citation preview

PROSPECTUS
3,300,000 Shares
Common Stock
This is PLX Technology, Inc.'s initial public oÅering of common stock.
Prior to the oÅering, no public market existed for the shares. The common stock hasbeen approved for listing on the Nasdaq National Market under the symbol ""PLXT.''
Investing in the common stock involves risks which are described in the""Risk Factors'' section beginning on page 4 of this prospectus.
Per Share Total
Public OÅering Price ÏÏÏÏÏÏÏÏÏÏÏÏÏÏÏÏÏÏÏÏÏÏÏÏÏÏÏ $9.00 $29,700,000
Underwriting Discount ÏÏÏÏÏÏÏÏÏÏÏÏÏÏÏÏÏÏÏÏÏÏÏÏÏÏ $.63 $2,079,000
Proceeds, before expenses, to PLXÏÏÏÏÏÏÏÏÏÏÏÏÏÏÏÏ $8.37 $27,621,000
The underwriters may also purchase up to an additional 495,000 shares at the publicoÅering price, less the underwriting discount, within 30 days from the date of thisprospectus to cover over-allotments.
Neither the Securities and Exchange Commission nor any state securities commissionhas approved or disapproved of these securities or determined if this prospectus is truthfulor complete. Any representation to the contrary is a criminal oÅense.
Merrill Lynch & Co.NationsBanc Montgomery Securities LLC
Wit Capital Corporation
The date of this prospectus is April 5, 1999.
TABLE OF CONTENTSPage
Prospectus SummaryÏÏÏÏÏÏÏÏÏÏÏÏÏÏÏÏÏÏÏÏÏÏÏÏÏÏÏÏÏÏÏÏÏÏÏÏÏÏÏÏÏÏÏÏÏÏÏÏÏÏÏÏÏÏ 1Risk Factors ÏÏÏÏÏÏÏÏÏÏÏÏÏÏÏÏÏÏÏÏÏÏÏÏÏÏÏÏÏÏÏÏÏÏÏÏÏÏÏÏÏÏÏÏÏÏÏÏÏÏÏÏÏÏÏÏÏÏÏÏÏ 4Forward-Looking Statements ÏÏÏÏÏÏÏÏÏÏÏÏÏÏÏÏÏÏÏÏÏÏÏÏÏÏÏÏÏÏÏÏÏÏÏÏÏÏÏÏÏÏÏÏÏÏÏ 14TrademarksÏÏÏÏÏÏÏÏÏÏÏÏÏÏÏÏÏÏÏÏÏÏÏÏÏÏÏÏÏÏÏÏÏÏÏÏÏÏÏÏÏÏÏÏÏÏÏÏÏÏÏÏÏÏÏÏÏÏÏÏÏÏ 14Information in ProspectusÏÏÏÏÏÏÏÏÏÏÏÏÏÏÏÏÏÏÏÏÏÏÏÏÏÏÏÏÏÏÏÏÏÏÏÏÏÏÏÏÏÏÏÏÏÏÏÏÏÏ 14Use of Proceeds ÏÏÏÏÏÏÏÏÏÏÏÏÏÏÏÏÏÏÏÏÏÏÏÏÏÏÏÏÏÏÏÏÏÏÏÏÏÏÏÏÏÏÏÏÏÏÏÏÏÏÏÏÏÏÏÏÏÏ 15Dividend Policy ÏÏÏÏÏÏÏÏÏÏÏÏÏÏÏÏÏÏÏÏÏÏÏÏÏÏÏÏÏÏÏÏÏÏÏÏÏÏÏÏÏÏÏÏÏÏÏÏÏÏÏÏÏÏÏÏÏÏ 15Capitalization ÏÏÏÏÏÏÏÏÏÏÏÏÏÏÏÏÏÏÏÏÏÏÏÏÏÏÏÏÏÏÏÏÏÏÏÏÏÏÏÏÏÏÏÏÏÏÏÏÏÏÏÏÏÏÏÏÏÏÏÏ 16DilutionÏÏÏÏÏÏÏÏÏÏÏÏÏÏÏÏÏÏÏÏÏÏÏÏÏÏÏÏÏÏÏÏÏÏÏÏÏÏÏÏÏÏÏÏÏÏÏÏÏÏÏÏÏÏÏÏÏÏÏÏÏÏÏÏÏ 17Selected Consolidated Financial DataÏÏÏÏÏÏÏÏÏÏÏÏÏÏÏÏÏÏÏÏÏÏÏÏÏÏÏÏÏÏÏÏÏÏÏÏÏÏÏÏ 18Management's Discussion and Analysis of Financial Condition and Results of
OperationsÏÏÏÏÏÏÏÏÏÏÏÏÏÏÏÏÏÏÏÏÏÏÏÏÏÏÏÏÏÏÏÏÏÏÏÏÏÏÏÏÏÏÏÏÏÏÏÏÏÏÏÏÏÏÏÏÏÏÏÏÏ 19Business ÏÏÏÏÏÏÏÏÏÏÏÏÏÏÏÏÏÏÏÏÏÏÏÏÏÏÏÏÏÏÏÏÏÏÏÏÏÏÏÏÏÏÏÏÏÏÏÏÏÏÏÏÏÏÏÏÏÏÏÏÏÏÏÏ 27ManagementÏÏÏÏÏÏÏÏÏÏÏÏÏÏÏÏÏÏÏÏÏÏÏÏÏÏÏÏÏÏÏÏÏÏÏÏÏÏÏÏÏÏÏÏÏÏÏÏÏÏÏÏÏÏÏÏÏÏÏÏÏ 42Transactions Between PLX and its OÇcers, Directors or SigniÑcant StockholdersÏÏÏ 50Principal StockholdersÏÏÏÏÏÏÏÏÏÏÏÏÏÏÏÏÏÏÏÏÏÏÏÏÏÏÏÏÏÏÏÏÏÏÏÏÏÏÏÏÏÏÏÏÏÏÏÏÏÏÏÏÏ 52Description of Capital Stock ÏÏÏÏÏÏÏÏÏÏÏÏÏÏÏÏÏÏÏÏÏÏÏÏÏÏÏÏÏÏÏÏÏÏÏÏÏÏÏÏÏÏÏÏÏÏÏ 54Shares Eligible for Future Sale ÏÏÏÏÏÏÏÏÏÏÏÏÏÏÏÏÏÏÏÏÏÏÏÏÏÏÏÏÏÏÏÏÏÏÏÏÏÏÏÏÏÏÏÏÏ 57UnderwritingÏÏÏÏÏÏÏÏÏÏÏÏÏÏÏÏÏÏÏÏÏÏÏÏÏÏÏÏÏÏÏÏÏÏÏÏÏÏÏÏÏÏÏÏÏÏÏÏÏÏÏÏÏÏÏÏÏÏÏÏÏ 59Legal MattersÏÏÏÏÏÏÏÏÏÏÏÏÏÏÏÏÏÏÏÏÏÏÏÏÏÏÏÏÏÏÏÏÏÏÏÏÏÏÏÏÏÏÏÏÏÏÏÏÏÏÏÏÏÏÏÏÏÏÏÏ 62Experts ÏÏÏÏÏÏÏÏÏÏÏÏÏÏÏÏÏÏÏÏÏÏÏÏÏÏÏÏÏÏÏÏÏÏÏÏÏÏÏÏÏÏÏÏÏÏÏÏÏÏÏÏÏÏÏÏÏÏÏÏÏÏÏÏÏ 62Where You Can Find More Information ÏÏÏÏÏÏÏÏÏÏÏÏÏÏÏÏÏÏÏÏÏÏÏÏÏÏÏÏÏÏÏÏÏÏÏÏÏ 62Glossary ÏÏÏÏÏÏÏÏÏÏÏÏÏÏÏÏÏÏÏÏÏÏÏÏÏÏÏÏÏÏÏÏÏÏÏÏÏÏÏÏÏÏÏÏÏÏÏÏÏÏÏÏÏÏÏÏÏÏÏÏÏÏÏÏ 64Index to Consolidated Financial Statements ÏÏÏÏÏÏÏÏÏÏÏÏÏÏÏÏÏÏÏÏÏÏÏÏÏÏÏÏÏÏÏÏÏÏ F-1

®INTENTIONALLY LEFT BLANK©

PROSPECTUS SUMMARY
This summary is not complete and does not contain all of the information that maybe important to you. You should read the entire prospectus carefully, including theÑnancial data and related notes, before making an investment decision.
PLX Technology
PLX develops and supplies semiconductor devices and software that accelerate andmanage the transfer of data in networking and telecommunications, enterprise storage,imaging and industrial equipment. This equipment is typically controlled by internalcomputers, commonly referred to as embedded systems. PLX oÅers a complete solutionconsisting of three related types of products: semiconductor devices, software developmentkits and hardware design kits. Our semiconductor devices simplify the development of datatransfer circuits in high-performance embedded systems and are compatible withmicroprocessors such as IBM's PowerPC, Motorola's PowerPC, Intel's i960, IDT's MIPsand Hitachi's SH. Our software development kits and hardware design kits promote salesof our semiconductor devices by lowering customers' development costs and byaccelerating their ability to bring new products to market.
Demand for networking, telecommunications and other equipment that transmits,stores and processes information rapidly has dramatically increased due to the:
‚ growth of the Internet,‚ deployment of high-speed networking, and‚ proliferation of multimedia.
Suppliers of this equipment are changing the way they design their products to reduceproduct development time and to use their scarce engineering resources more eÇciently.Until recently, these suppliers typically developed their own system components and theconnections between the components. Now, however, they are increasingly building theirequipment based on industry standard connection methods, and they are purchasingcomponents supplied by other companies that comply with these standards. By doing so,they reduce the time and resources required for product development. Consequently, thereis a growing demand for standards-based components that connect systems together, suchas our semiconductor devices. The majority of PLX's products are based on PeripheralComponent Interconnect, or PCI, a standard that is widely used in our markets.
Our objective is to expand our advantages in data transfer technology by:
‚ focusing on high-growth markets,‚ delivering comprehensive solutions, including semiconductor devices, software
development kits and hardware design kits,‚ extending our technology advantages by incorporating new functions and
technologies,‚ driving industry standards, and‚ strengthening and expanding our industry relationships.
1

PLX Technology, Inc. was incorporated in California in May 1986. In March 1999,our state of incorporation was changed to Delaware. Our principal executive oÇce islocated at 390 Potrero Avenue, Sunnyvale, California 94086, and our telephone number atthis address is (408) 774-9060. We maintain a World Wide Web site address atwww.plxtech.com. The reference to this World Wide Web site address does not constituteincorporation by reference of the information contained therein.
The OÅering
Common stock oÅered ÏÏÏÏÏÏÏÏÏÏÏÏÏÏÏÏÏÏ 3,300,000 sharesCommon stock outstanding after this
oÅering ÏÏÏÏÏÏÏÏÏÏÏÏÏÏÏÏÏÏÏÏÏÏÏÏÏÏÏÏÏ 21,665,551 shares(1)Use of proceeds ÏÏÏÏÏÏÏÏÏÏÏÏÏÏÏÏÏÏÏÏÏÏÏÏ We intend to use the oÅering proceeds for
working capital and general corporatepurposes.
Nasdaq National Market symbolÏÏÏÏÏÏÏÏÏÏ PLXT
(1) Excludes 1,500,000 shares of common stock reserved for issuance under our 1998Stock Incentive Plan and 1,000,000 shares of common stock reserved for issuanceunder our 1999 Stock Incentive Plan. See ""Description of Capital Stock ÌAuthorized and Outstanding Capital Stock'' and Note 5 to Consolidated FinancialStatements.
2
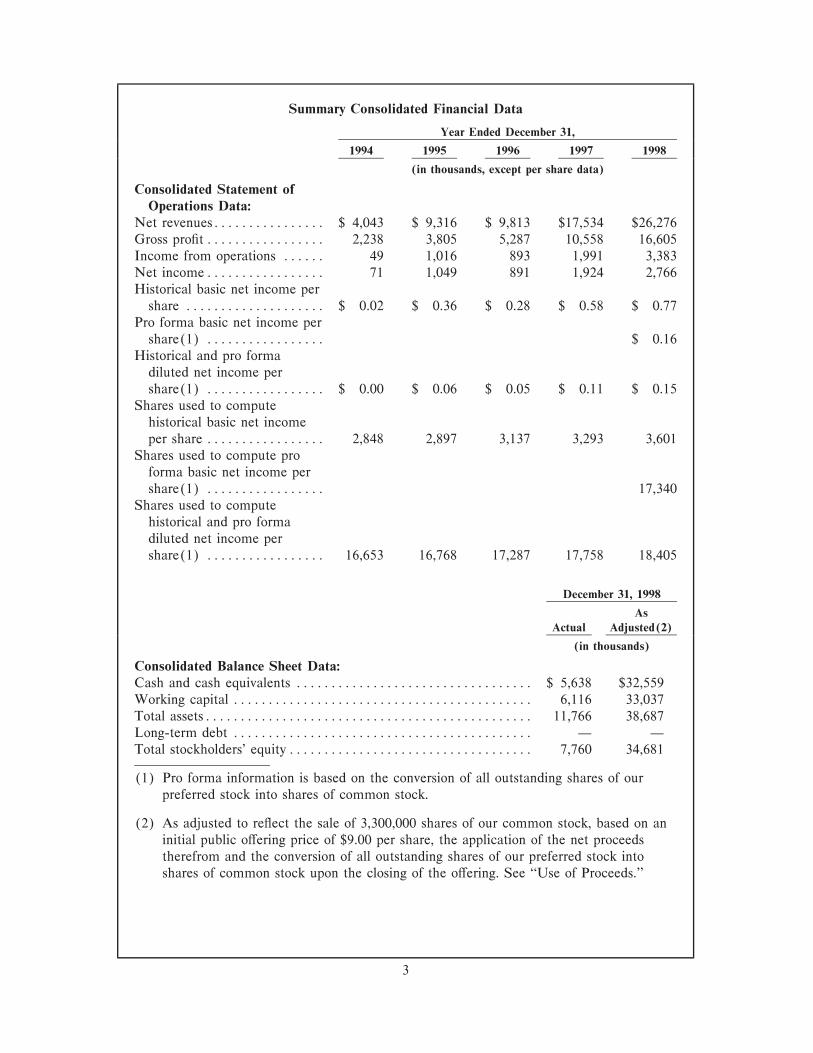
Summary Consolidated Financial Data
Year Ended December 31,
1994 1995 1996 1997 1998
(in thousands, except per share data)
Consolidated Statement ofOperations Data:
Net revenuesÏÏÏÏÏÏÏÏÏÏÏÏÏÏÏÏ $ 4,043 $ 9,316 $ 9,813 $17,534 $26,276Gross proÑt ÏÏÏÏÏÏÏÏÏÏÏÏÏÏÏÏÏ 2,238 3,805 5,287 10,558 16,605Income from operations ÏÏÏÏÏÏ 49 1,016 893 1,991 3,383Net incomeÏÏÏÏÏÏÏÏÏÏÏÏÏÏÏÏÏ 71 1,049 891 1,924 2,766Historical basic net income per
share ÏÏÏÏÏÏÏÏÏÏÏÏÏÏÏÏÏÏÏÏ $ 0.02 $ 0.36 $ 0.28 $ 0.58 $ 0.77Pro forma basic net income per
share(1) ÏÏÏÏÏÏÏÏÏÏÏÏÏÏÏÏÏ $ 0.16Historical and pro forma
diluted net income pershare(1) ÏÏÏÏÏÏÏÏÏÏÏÏÏÏÏÏÏ $ 0.00 $ 0.06 $ 0.05 $ 0.11 $ 0.15
Shares used to computehistorical basic net incomeper share ÏÏÏÏÏÏÏÏÏÏÏÏÏÏÏÏÏ 2,848 2,897 3,137 3,293 3,601
Shares used to compute proforma basic net income pershare(1) ÏÏÏÏÏÏÏÏÏÏÏÏÏÏÏÏÏ 17,340
Shares used to computehistorical and pro formadiluted net income pershare(1) ÏÏÏÏÏÏÏÏÏÏÏÏÏÏÏÏÏ 16,653 16,768 17,287 17,758 18,405
December 31, 1998
AsActual Adjusted(2)
(in thousands)
Consolidated Balance Sheet Data:Cash and cash equivalents ÏÏÏÏÏÏÏÏÏÏÏÏÏÏÏÏÏÏÏÏÏÏÏÏÏÏÏÏÏÏÏÏÏÏ $ 5,638 $32,559Working capital ÏÏÏÏÏÏÏÏÏÏÏÏÏÏÏÏÏÏÏÏÏÏÏÏÏÏÏÏÏÏÏÏÏÏÏÏÏÏÏÏÏÏÏ 6,116 33,037Total assetsÏÏÏÏÏÏÏÏÏÏÏÏÏÏÏÏÏÏÏÏÏÏÏÏÏÏÏÏÏÏÏÏÏÏÏÏÏÏÏÏÏÏÏÏÏÏÏ 11,766 38,687Long-term debt ÏÏÏÏÏÏÏÏÏÏÏÏÏÏÏÏÏÏÏÏÏÏÏÏÏÏÏÏÏÏÏÏÏÏÏÏÏÏÏÏÏÏÏ Ì ÌTotal stockholders' equityÏÏÏÏÏÏÏÏÏÏÏÏÏÏÏÏÏÏÏÏÏÏÏÏÏÏÏÏÏÏÏÏÏÏÏ 7,760 34,681
(1) Pro forma information is based on the conversion of all outstanding shares of ourpreferred stock into shares of common stock.
(2) As adjusted to reÖect the sale of 3,300,000 shares of our common stock, based on aninitial public oÅering price of $9.00 per share, the application of the net proceedstherefrom and the conversion of all outstanding shares of our preferred stock intoshares of common stock upon the closing of the oÅering. See ""Use of Proceeds.''
3
RISK FACTORS
You should carefully consider the following factors as well as other informationcontained in this prospectus before deciding to invest in shares of the common stock.
Our Operating Results May Fluctuate SigniÑcantly Due to Factors Which Are NotWithin Our Control
Our quarterly operating results have Öuctuated signiÑcantly in the past and areexpected to Öuctuate signiÑcantly in the future based on a number of factors, many ofwhich are not in our control. Our operating expenses, which include product developmentcosts and selling, general and administrative expenses, are relatively Ñxed in the short-term.If our revenues are lower than we expect because we sell fewer semiconductor devices,delay the release of new products or the announcement of new features, or for otherreasons, we may not be able to quickly reduce our spending in response.
Other circumstances that can aÅect our operating results include:
‚ our ability to develop, introduce and market new products and technologies on atimely basis,
‚ the timing of signiÑcant orders, order cancellations and reschedulings,
‚ changes in our pricing policies or those of our competitors or suppliers, includingdecreases in unit average selling prices of our products,
‚ introduction of products and technologies by our competitors,
‚ shifts in our product mix toward lower margin products,
‚ the availability of production capacity at the fabrication facilities that manufactureour products,
‚ purchasing patterns related to the Year 2000, and
‚ the availability and cost of materials to our suppliers.
These factors are diÇcult to forecast, and these or other factors could adversely aÅectour business. Any shortfall in our revenues would have a direct impact on our business. Inaddition, Öuctuations in our quarterly results could adversely aÅect the market price of ourcommon stock in a manner unrelated to our long-term operating performance.
Our Lengthy Sales Cycle Can Result in Uncertainty and Delays with Regard to OurExpected Revenues
Our customers typically perform numerous tests and extensively evaluate our productsbefore incorporating them into their systems. The time required for test, evaluation anddesign of our products into the customer's equipment can range from six to twelve monthsor more. It can take an additional six to twelve months or more before a customercommences volume shipments of equipment that incorporates our products. Because of thislengthy sales cycle, we may experience a delay between the time when we increaseexpenses for research and development and sales and marketing eÅorts and the time whenwe generate higher revenues, if any, from these expenditures.
4
In addition, the delays inherent in our lengthy sales cycle raise additional risks ofcustomer decisions to cancel or change product plans. When we achieve a design win,there can be no assurance that the customer will ultimately ship products incorporating ourproducts. Our business could be materially adversely aÅected if a signiÑcant customercurtails, reduces or delays orders during our sales cycle or chooses not to release productsincorporating our products.
Rapid Technological Change Could Make Our Products Obsolete
The semiconductor industry is characterized by rapidly changing technology andindustry standards, along with frequent new product introductions. Consequently, our futuresuccess depends on our ability to identify trends in our target markets and to oÅer newsemiconductor devices, as well as other products and services, that address the changingneeds of our target customers.
We Must Make SigniÑcant Research and Development Expenditures Prior to GeneratingRevenues from Products
To establish market acceptance of a new semiconductor device, we must dedicatesigniÑcant resources to research and development, production and sales and marketing. Weincur substantial costs in developing, manufacturing and selling a new product, which oftensigniÑcantly precede meaningful revenues from the sale of this product. Consequently, newproducts can require signiÑcant time and investment to achieve proÑtability. Prospectiveinvestors should note that our eÅorts to introduce new semiconductor devices or otherproducts or services may not be successful or proÑtable. In addition, products ortechnologies developed by others may render our products or technologies obsolete ornoncompetitive.
We record as expenses the costs related to the development of new semiconductordevices and other products as these expenses are incurred. As a result, our proÑtabilityfrom quarter to quarter and from year to year may be adversely aÅected by the numberand timing of our new product launches in any period and the level of acceptance gainedby these products.
Our Independent Manufacturers May Not Be Able to Meet Our ManufacturingRequirements
We do not manufacture any of our semiconductor devices. Therefore, we are referredto in the semiconductor industry as a ""fabless'' producer of semiconductors. Consequently,we depend upon third party manufacturers to produce semiconductors that meet ourspeciÑcations. We currently have third party manufacturers that can producesemiconductors which meet our needs. However, as the semiconductor industry continuesto progress to smaller manufacturing and design geometries, the complexities of producingsemiconductors will increase. Decreasing geometries may introduce new problems anddelays that may aÅect product development and deliveries. Due to the nature of thesemiconductor industry and our status as a ""fabless'' semiconductor company, we couldencounter fabrication related problems that may aÅect the availability of oursemiconductor devices, may delay our shipments or may increase our costs.
5
Our Reliance on Single Source Manufacturers of Our Semiconductor Devices CouldDelay Shipments and Increase Our Costs
None of our semiconductor devices is currently manufactured by more than onesupplier. We place our orders on a purchase order basis and do not have a long termpurchase agreement with any of our existing suppliers. In the event that the supplier of asemiconductor device was unable or unwilling to continue to manufacture this product inthe required volume, we would have to identify and qualify a substitute supplier.Introducing new products or transferring existing products to a new third partymanufacturer or process may result in unforeseen device speciÑcation and operatingproblems. These problems may aÅect product shipments and may be costly to correct.Silicon fabrication capacity may also change, or the costs per silicon wafer may increase.Manufacturing-related problems may have a material adverse eÅect on our business.
Intense Competition in the Markets in Which We Operate May Reduce the Demand foror Prices of Our Products
Competition in the semiconductor industry is intense. If our main target market, theembedded systems market, continues to grow, the number of competitors may increasesigniÑcantly. In addition, new semiconductor technology may lead to new products that canperform similar functions as our products. Some of our competitors and othersemiconductor companies may develop and introduce products that integrate into a singlesemiconductor device the functions performed by our semiconductor devices. This wouldeliminate the need for our products in some applications.
In addition, competition in our markets comes from companies of various sizes, manyof which are signiÑcantly larger and have greater Ñnancial and other resources than we doand thus can better withstand adverse economic or market conditions. Also, as we start tosell our processor products, we will compete with established embedded microprocessorcompanies and others. Many of these indirect competitors and microprocessor companieshave signiÑcantly greater Ñnancial, technical, marketing and other resources than PLX.Therefore, we cannot assure you that we will be able to compete successfully in the futureagainst existing or new competitors, and increased competition may adversely aÅect ourbusiness. See ""Business Ì Competition,'' and "" Ì Products.''
Failure to Have Our Products Designed into the Products of Electronic EquipmentManufacturers Will Result in Reduced Sales
Our future success depends on electronic equipment manufacturers that design oursemiconductor devices into their systems. We must anticipate market trends and the price,performance and functionality requirements of current and potential future electronicequipment manufacturers and must successfully develop and manufacture products thatmeet these requirements. In addition, we must meet the timing requirements of theseelectronic equipment manufacturers and must make products available to them insuÇcient quantities. These electronic equipment manufacturers could develop products thatprovide the same or similar functionality as one or more of our products and render theseproducts obsolete in their applications.
We do not have purchase agreements with our customers that contain minimumpurchase requirements. Instead, electronic equipment manufacturers purchase our productspursuant to short-term purchase orders that may be canceled without charge. We believethat in order to obtain broad penetration in the markets for our products, we must
6

maintain and cultivate relationships, directly or through our distributors, with electronicequipment manufacturers that are leaders in the embedded systems markets. Accordingly,we will often incur signiÑcant expenditures in order to build relationships with electronicequipment manufacturers prior to volume sales of new products. If we fail to developrelationships with additional electronic equipment manufacturers, to have our productsdesigned into new embedded systems or to develop suÇcient new products to replaceproducts that have become obsolete, our business would be materially adversely aÅected.
Lower Demand for Our Customers' Products Will Result in Lower Demand for OurProducts
Demand for our products depends in large part on the development and expansion ofthe high-performance embedded systems markets including networking andtelecommunications, enterprise storage, imaging and industrial applications. The size andrate of growth of these embedded systems markets may in the future Öuctuate signiÑcantlybased on numerous factors. These factors include the adoption of alternative technologies,capital spending levels and general economic conditions. Demand for products thatincorporate high-performance embedded systems may not grow.
Defects in Our Products Could Increase Our Costs and Delay Our Product Shipments
Our products are complex. While we test our products, these products may still haveerrors, defects or bugs that we Ñnd only after commercial production has begun. We haveexperienced errors, defects and bugs in the past in connection with new products.
Our customers may not purchase our products if the products have reliability, qualityor compatibility problems. This delay in acceptance can make it more diÇcult to retainour existing customers and to attract new customers. Moreover, product errors, defects orbugs can result in additional development costs, diversion of technical and other resourcesfrom our other development eÅorts, claims by our customers or others against us, or theloss of credibility with our current and prospective customers. In the past, the additionaltime required to correct defects has caused delays in product shipments and resulted inlower revenues. We may have to spend signiÑcant amounts of capital and resources toaddress and Ñx problems in new products.
We must continuously develop our products using new process technology withsmaller geometries to remain competitive on a cost and performance basis. Migrating tonew technologies is a challenging task requiring new design skills, methods and tools and isdiÇcult to achieve.
Failure to Hire Additional Personnel and to Improve Our Operations Will Limit OurGrowth
We have experienced rapid growth which places a signiÑcant strain on our limitedpersonnel and other resources. To manage our expanded operations eÅectively, we willneed to further improve our operational, Ñnancial and management systems. We will alsoneed to successfully hire, train, motivate and manage our employees. We may not be ableto manage our growth eÅectively, which could have a material adverse eÅect on ourbusiness. Also, we are seeking to hire additional skilled development engineers, who arecurrently in short supply. Our business could be adversely aÅected if we encounter delaysin hiring additional engineers.
7

We Could Lose Key Personnel Due to Competitive Market Conditions and Attrition
Our success depends to a signiÑcant extent upon our senior management and keytechnical and sales personnel. The loss of one or more of these employees could have amaterial adverse eÅect on our business. We do not have employment contracts with any ofour executive oÇcers.
Our success also depends on our ability to attract and retain qualiÑed technical, salesand marketing, customer support, Ñnancial and accounting, and managerial personnel.Competition for such personnel in the semiconductor industry is intense, and we may notbe able to retain our key personnel or to attract, assimilate or retain other highly qualiÑedpersonnel in the future. In addition, we may lose key personnel due to attrition, includinghealth, family and other reasons. We have experienced, and may continue to experience,diÇculty in hiring and retaining candidates with appropriate qualiÑcations. If we do notsucceed in hiring and retaining candidates with appropriate qualiÑcations, our businesscould be materially adversely aÅected.
A Large Portion of Our Revenues Is Derived from Sales to Third-Party Distributors WhoMay Terminate Their Relationships with Us at Any Time
We depend on distributors to sell a signiÑcant portion of our products. In 1998, netrevenues through distributors accounted for approximately 49% of our net revenues. Someof our distributors also market and sell competing products. Distributors may terminatetheir relationships with us at any time. Our future performance will depend in part on ourability to attract additional distributors that will be able to market and support ourproducts eÅectively, especially in markets in which we have not previously distributed ourproducts. We may lose one or more of our current distributors or may not be able torecruit additional or replacement distributors. The loss of one or more of our majordistributors could have a material adverse eÅect on our business.
The Demand for Our Products Depends Upon Our Ability to Support Evolving IndustryStandards
Substantially all of our revenues are derived from sales of products which rely on thePCI standard. If the embedded systems markets move away from this standard and beginusing new standards, we may not be able to successfully design and manufacture newproducts that use these new standards. There is also the risk that new products we developin response to new standards may not be accepted in the market. In addition, the PCIstandard is continuously evolving, and we may not be able to modify our products toaddress new PCI speciÑcations. Any of these events would have a material adverse eÅecton our business.
The Successful Marketing and Sales of Our Products Depend Upon Our Third PartyRelationships, Which Are Not Supported by Written Agreements
When marketing and selling our semiconductor devices, we believe we enjoy acompetitive advantage based on the availability of development tools oÅered by thirdparties. These development tools are used principally for the design of other parts of theembedded system but also work with our products. We will lose this advantage if thesethird party tool vendors cease to provide these tools for existing products or do not oÅer
8

them for our future products. This event could have a material adverse eÅect on ourbusiness. We generally have no written agreements with these third parties, and theseparties could choose to stop providing these tools at any time.
Our Limited Ability to Protect Our Intellectual Property and Proprietary Rights CouldAdversely AÅect Our Competitive Position
Our future success and competitive position depend upon our ability to obtain andmaintain proprietary technology used in our principal products. Currently, we have limitedprotection of our intellectual property in the form of patents and rely instead on tradesecret protection. Our existing or future patents may be invalidated, circumvented,challenged or licensed to others. The rights granted thereunder may not providecompetitive advantages to us. In addition, our future patent applications may not be issuedwith the scope of the claims sought by us, if at all. Furthermore, others may developtechnologies that are similar or superior to our technology, duplicate our technology ordesign around the patents owned or licensed by us. In addition, eÅective patent, trademark,copyright and trade secret protection may be unavailable or limited in foreign countrieswhere we may need protection. We cannot be sure that steps taken by us to protect ourtechnology will prevent misappropriation of the technology.
We may from time to time receive notiÑcations of claims that we may be infringingpatents or other intellectual property rights owned by other third parties. While there iscurrently no intellectual property litigation pending against us, litigation could result insigniÑcant expenses to us, adversely aÅect sales of the challenged product or technology.This litigation could also divert the eÅorts of our technical and management personnel,whether or not the litigation is determined in our favor. In addition, we may not be able todevelop or acquire non-infringing technology or procure licenses to the infringingtechnology under reasonable terms. This could require expenditures by us of substantialtime and other resources. Any of these developments would have a material adverse eÅecton our business. See ""Business Ì Intellectual Property.''
The Cyclical Nature of the Semiconductor Industry May Lead to SigniÑcant Variances inthe Demand for Our Products
In the last two years, the semiconductor industry has been characterized by signiÑcantdownturns and wide Öuctuations in supply and demand. Also, during this time, the industryhas experienced signiÑcant Öuctuations in anticipation of changes in general economicconditions, including economic conditions in Asia. This cyclicality has led to signiÑcantvariances in product demand and production capacity. It has also accelerated erosion ofaverage selling prices per unit. We may experience periodic Öuctuations in our futureÑnancial results because of industry-wide conditions.
9

Because We Sell Our Products to Customers Outside of North America and Because ourProducts Are Incorporated with Products of Others That Are Sold Outside of NorthAmerica We Face Foreign Business, Political and Economic Risks
Sales outside of North America accounted for 21%, 22% and 34% of our revenues in1996, 1997 and 1998, respectively. We anticipate that these sales may increase in futureperiods and may account for an increasing portion of our revenues. In addition, equipmentmanufacturers who incorporate our products into their products, sell their products outsideof North America, thereby exposing us indirectly to foreign risks. Further, most of oursemiconductor products are manufactured outside of North America. Accordingly, we aresubject to international risks, including:
‚ diÇculties in managing distributors,
‚ diÇculties in staÇng and managing foreign subsidiary and branch operations,
‚ political and economic instability,
‚ foreign currency exchange Öuctuations,
‚ diÇculties in accounts receivable collections,
‚ potentially adverse tax consequences,
‚ timing and availability of export licenses,
‚ changes in regulatory requirements, tariÅs and other barriers,
‚ diÇculties in obtaining governmental approvals for telecommunications and otherproducts, and
‚ the burden of complying with complex foreign laws and treaties.
Although less than 10% of our revenues were attributable to sales in Asia during 1998,the recent Asian economic instability could adversely aÅect our business, particularly tothe extent that this instability impacts the sales of products manufactured by ourcustomers.
Because sales of our products have been denominated to date exclusively in UnitedStates dollars, increases in the value of the United States dollar will increase the price ofour products so that they become relatively more expensive to customers in the localcurrency of a particular country, leading to a reduction in sales and proÑtability in thatcountry.
We Could Experience Disruptions from Important Suppliers and Customers BecauseThey Are Not Year 2000 Compliant
We are highly dependent on our computer software programs and operating systems inoperating our business. We also depend on proper functioning of computer systems of thirdparties, such as suppliers and customers. Any computer programs that have date-sensitivesoftware may recognize a date using ""00'' as the year 1900 instead of the year 2000. Wehave completed audits of our internal systems, including our accounting, sales andtechnical support automation system, and obtained assurances from our major suppliersand customers that they have done the same. However, we do not have the resources toverify these assurances. Thus, there is a risk that some of our customers' and suppliers'systems will not function adequately. If they do not, the result could be a system failure ormiscalculation causing disruptions of operations, including, among other things, atemporary inability to process transactions, send invoices, or engage in similar normal
10

business activities. See ""Management's Discussion and Analysis of Financial Condition andResults of Operations Ì Year 2000 Readiness Disclosure.''
Our Potential Future Acquisitions May Not be Successful Because We Have Not MadeAcquisitions in the Past
There have been a signiÑcant number of mergers and acquisitions in thesemiconductor industry in the past. As part of our business strategy, we expect to reviewacquisition prospects that would complement our existing product oÅerings, improvemarket coverage or enhance our technological capabilities. We have no current agreementsor negotiations underway with respect to any acquisitions, and we may not be able tolocate suitable acquisition opportunities. Future acquisitions could result in the following:
‚ potentially dilutive issuances of equity securities,
‚ large one-time write-oÅs,
‚ the incurrence of debt and contingent liabilities or amortization expenses related togoodwill and other intangible assets,
‚ diÇculties in the assimilation of operations, personnel, technologies, products andthe information systems of the acquired companies,
‚ diversion of management's attention from other business concerns, and
‚ risks of entering geographic and business markets in which we have no or limitedprior experience and potential loss of key employees of acquired organizations.
Since we have not made any acquisitions in the past, we are not certain that we willbe able to successfully integrate any businesses, products, technologies or personnel thatmay be acquired in the future. Our failure to do so could have a material adverse eÅect onour business.
Our Principal Stockholders Have SigniÑcant Voting Power and May Take Actions ThatMay Not Be in the Best Interests of Our Other Stockholders
Immediately after the oÅering, our executive oÇcers, directors and other principalstockholders will, in the aggregate, beneÑcially own approximately 45% of our outstandingcommon stock. Although these stockholders will not have majority control, they currentlyhave, and likely will continue to have, signiÑcant inÖuence with respect to the election ofour directors and approval or disapproval of our signiÑcant corporate actions. This inÖuenceover our aÅairs might be adverse to the interests of other stockholders. In addition, thevoting power of these stockholders could have the eÅect of delaying or preventing a changein control of PLX. Commencing at the Ñrst annual meeting of stockholders following theannual meeting of stockholders when we shall have had at least 800 stockholders, ourstockholders will not be entitled to cumulate their votes in the election of directors, andthe holders of a majority of the common stock present at a meeting of stockholders will beable to elect all of our directors.
11
The Anti-Takeover Provisions in Our CertiÑcate of Incorporation Could Adversely AÅectthe Rights of the Holders of Our Common Stock
Anti-takeover provisions of Delaware law and our CertiÑcate of Incorporation maymake a change in control of PLX more diÇcult, even if a change in control would bebeneÑcial to the stockholders. These provisions may allow the Board of Directors toprevent changes in the management and control of PLX. Under Delaware law, our Boardof Directors may adopt additional anti-takeover measures in the future.
One anti-takeover provision that we have is the ability of our Board of Directors todetermine the terms of preferred stock and issue preferred stock without the approval ofthe holders of the common stock. EÅective upon the oÅering, our CertiÑcate ofIncorporation allows the issuance of up to 5,000,000 shares of preferred stock. At the timeof the oÅering, there are no shares of preferred stock outstanding. However, because therights and preferences of any series of preferred stock may be set by the Board ofDirectors in its sole discretion without approval of the holders of the common stock, therights and preferences of this preferred stock may be superior to those of the commonstock. Accordingly, the rights of the holders of common stock may be adversely aÅected.
The Sale of a Substantial Number of Our Shares of Common Stock Could Cause theMarket Price of Our Common Stock to Decline
We will have 21,665,551 shares of our common stock outstanding immediately afterthe oÅering. The shares sold in the oÅering will be freely transferable. Additional sharesmay be sold in the public market to the extent permitted by Rule 144 or exemptions underthe Securities Act. The market price of our common stock could decline as a result ofsales of a large number of shares of our common stock in the market after the oÅering, orthe perception that these sales could occur. These factors also could make it more diÇcultfor us to raise funds through future oÅerings of common stock. See ""Shares Eligible forFuture Sale.''
Our Common Stock Has Not Been Publicly Traded and We Expect that the Price ofOur Stock May Fluctuate Substantially
Recently, the stock prices of technology companies, like PLX, have been quitevolatile. Moreover, prior to this oÅering, there has been no public market for our commonstock. The initial public oÅering price was determined through negotiations between theunderwriters and us. You may not be able to resell your shares at or above the initialpublic oÅering price due to a number of factors, including:
‚ actual or anticipated Öuctuations in our operating results,
‚ changes in expectations as to our future Ñnancial performance,
‚ changes in Ñnancial estimates of securities analysts,
‚ technological innovations by others, and
‚ the operating and stock price performance of other comparable companies.
Due to the above factors, the price of our stock may decline and the value of yourinvestment would be reduced.
12

New Investors Will Incur Substantial and Immediate Dilution
The present owners of our issued and outstanding shares of common stock haveacquired a controlling interest in PLX at a cost substantially less than the price at whichthe investors in this oÅering may purchase their shares. Therefore, the investors in thisoÅering will bear a substantial portion of the risk of loss. Investors in this oÅering willsuÅer immediate and substantial dilution. See ""Dilution.''
13

FORWARD-LOOKING STATEMENTS
This prospectus includes forward-looking statements. We have based these forward-looking statements on our current expectations and projections about future events. Theseforward-looking statements are subject to risks, uncertainties and assumptions about PLX,including:
‚ Our ability to identify trends in our target markets and to oÅer new semiconductordevices that address the changing needs of our target customers,
‚ Availability of production capacity at the fabrication facilities that manufacture ourproducts,
‚ Changes in our pricing policies and those of our competitors or suppliers,
‚ Our ability to compete successfully against direct and indirect competitors, and
‚ Growth in demand for embedded systems.
We undertake no obligation to publicly update or revise any forward-lookingstatements, whether as a result of new information, future events or otherwise. In light ofthese risks, uncertainties and assumptions, the forward-looking events discussed in thisprospectus might not occur.
TRADEMARKS
Each trademark, trade name or service mark appearing in this prospectus belongs toits respective holder. Among the trademarks that we claim rights to are PLX, PLXMon,PLXMon 98, I2O Manager, I2OMon, Data Pipe Architecture and FlexPORT.
INFORMATION IN PROSPECTUS
Unless otherwise speciÑcally stated, the information in this prospectus has beenadjusted to reÖect the automatic conversion of all outstanding shares of preferred stockinto shares of common stock, but does not take into account the possible sale of additionalshares of common stock to the underwriters pursuant to the underwriters' right to purchaseadditional shares to cover over-allotments.
You should rely only on the information contained in this prospectus. We have not,and the underwriters have not, authorized any other person to provide you with diÅerentinformation. If anyone provides you with diÅerent or inconsistent information, you shouldnot rely on it. We are not, and the underwriters are not, making an oÅer to sell thesesecurities in any jurisdiction where the oÅer or sale is not permitted. You should assumethat the information appearing in this prospectus is accurate as of the date on the frontcover of this prospectus only. Our business, Ñnancial condition, results of operations andprospects may have changed since that date.
We intend to furnish our stockholders with annual reports containing Ñnancialstatements audited by an independent accounting Ñrm and quarterly reports for the Ñrstthree quarters of each Ñscal year containing interim unaudited Ñnancial information.
14

USE OF PROCEEDS
Based on an initial public oÅering price of $9.00 per share, our net proceeds from thesale of the 3,300,000 shares of our common stock will be approximately $26,921,000. If theunderwriters' over-allotment option is exercised in full, our net proceeds will beapproximately $31,064,150.
The principal purposes of this oÅering are:
‚ to increase our working capital,
‚ to create a public market for our common stock,
‚ to facilitate future access by us to public equity markets, and
‚ to provide increased visibility and credibility to us.
We intend to use the net proceeds primarily for general corporate purposes, includingworking capital. We may, when and if the opportunity arises, use an unspeciÑed portion ofthe net proceeds to acquire or invest in complementary businesses, products andtechnologies. We have no present understandings, commitments or agreements with respectto any material acquisition of, or investment in, third parties. Pending use of the netproceeds for the above purposes, we intend to invest the funds in interest-bearing,investment-grade securities.
DIVIDEND POLICY
We have never declared or paid dividends on our capital stock, and currently we donot intend to pay dividends in the foreseeable future. We plan to retain any earnings foruse in the operation of our business and to fund future growth.
15

CAPITALIZATION
The following table sets forth the capitalization of PLX as of December 31, 1998 asfollows:
‚ on an actual basis;
‚ on a pro forma basis to give eÅect to the conversion of all outstanding shares of ourpreferred stock into common stock; and
‚ on a pro forma, as adjusted basis to reÖect the application of the net proceeds fromthe initial public oÅering and the conversion of all outstanding shares of ourpreferred stock into common stock.
December 31, 1998
Pro FormaPro As
Actual Forma Adjusted
(in thousands)
Stockholders' equity(1):Preferred stock, $0.001 par value; 5,000,000 shares
authorized Ì pro forma as adjusted, no shares issuedand outstanding Ì actual, pro forma and pro forma asadjusted ÏÏÏÏÏÏÏÏÏÏÏÏÏÏÏÏÏÏÏÏÏÏÏÏÏÏÏÏÏÏÏÏÏÏÏÏÏÏÏÏÏ $ Ì $ Ì $ Ì
Redeemable convertible preferred stock, $0.001 par value;5,000,000 shares authorized, 4,868,738 shares designated,4,579,636 shares issued and outstanding Ì actual; noshares issued and outstanding Ì pro forma and proforma as adjusted ÏÏÏÏÏÏÏÏÏÏÏÏÏÏÏÏÏÏÏÏÏÏÏÏÏÏÏÏÏÏÏÏÏ 5 Ì Ì
Common stock, $0.001 par value; 30,000,000 sharesauthorized, 4,626,643 shares issued and outstanding Ìactual; 18,365,551 shares issued and outstanding Ì proforma; 21,665,551 shares issued and outstanding Ì proforma as adjusted(2) ÏÏÏÏÏÏÏÏÏÏÏÏÏÏÏÏÏÏÏÏÏÏÏÏÏÏÏÏÏÏ 5 18 22
Additional paid in capitalÏÏÏÏÏÏÏÏÏÏÏÏÏÏÏÏÏÏÏÏÏÏÏÏÏÏÏÏÏ 5,616 5,608 32,525Retained earnings ÏÏÏÏÏÏÏÏÏÏÏÏÏÏÏÏÏÏÏÏÏÏÏÏÏÏÏÏÏÏÏÏÏÏÏ 2,580 2,580 2,580Deferred compensationÏÏÏÏÏÏÏÏÏÏÏÏÏÏÏÏÏÏÏÏÏÏÏÏÏÏÏÏÏÏÏ (283) (283) (283)Stockholders' notes receivable ÏÏÏÏÏÏÏÏÏÏÏÏÏÏÏÏÏÏÏÏÏÏÏÏÏ (163) (163) (163)
Total stockholders' equity ÏÏÏÏÏÏÏÏÏÏÏÏÏÏÏÏÏÏÏÏÏÏÏÏÏÏÏÏ 7,760 7,760 34,681
Total capitalization ÏÏÏÏÏÏÏÏÏÏÏÏÏÏÏÏÏÏÏÏÏÏÏÏÏÏÏÏ $7,760 $7,760 $34,681
(1) ReÖects our reincorporation in Delaware in March 1999.
(2) Excludes 800,000 shares of common stock reserved for issuance under our 1998 StockIncentive Plan as of December 31, 1998. See ""Description of Capital Stock ÌAuthorized and Outstanding Capital Stock'' and Note 5 to Consolidated FinancialStatements.
16

DILUTION
The pro forma net tangible book value of PLX at December 31, 1998, after givingeÅect to the conversion of all outstanding shares of our preferred stock into shares ofcommon stock upon completion of this oÅering, was approximately $7,759,798, or $0.42per share. Pro forma net tangible book value per share is equal to our total tangible assetsless our total liabilities, divided by the total number of shares of our common stockoutstanding, after giving eÅect to the conversion of all outstanding shares of our preferredstock into shares of common stock. After giving eÅect to the sale of 3,300,000 shares ofour common stock oÅered by PLX hereby at an initial public oÅering price of $9.00 pershare and after deducting underwriting discounts and commissions and estimated oÅeringexpenses payable by us, our as adjusted pro forma net tangible book value atDecember 31, 1998 would have been approximately $34,680,798, or $1.60 per share. Thisrepresents an immediate increase in net tangible book value of $1.18 per share to existingstockholders and an immediate dilution of $7.40 per share to new investors purchasingshares of our common stock in this oÅering. The following table illustrates the per sharedilution to the new investors:
Initial public oÅering price per share ÏÏÏÏÏÏÏÏÏÏÏÏÏÏÏÏÏÏÏÏÏÏÏÏÏÏÏÏÏÏÏÏÏ $9.00Pro forma net tangible book value per share at December 31, 1998. ÏÏÏÏÏ $0.42Increase per share attributable to this oÅering ÏÏÏÏÏÏÏÏÏÏÏÏÏÏÏÏÏÏÏÏÏÏÏ 1.18
As adjusted pro forma net tangible book value per share after the offeringÏÏÏÏ 1.60
Dilution per share to new investors in this oÅeringÏÏÏÏÏÏÏÏÏÏÏÏÏÏÏÏÏÏÏÏÏÏ $7.40
The following table summarizes on a pro forma basis, as of December 31, 1998, thetotal number of shares of our common stock purchased from PLX, the total considerationpaid and the average price per share paid by the existing stockholders and by the newinvestors in this oÅering:
AverageShares Purchased Total Consideration Price PerNumber Percent Amount Percent Share
Existing stockholders ÏÏ 18,365,551 84.8% $ 5,264,682 15.1% $0.29New investors ÏÏÏÏÏÏÏÏ 3,300,000 15.2 29,700,000 84.9 9.00
Total ÏÏÏÏÏÏÏ 21,665,551 100.0% $34,964,682 100.0%
The foregoing discussion and tables assume no exercise of any stock optionsoutstanding as of December 31, 1998. As of December 31, 1998, there were optionsoutstanding to purchase a total of 645,250 shares of common stock at a weighted averageexercise price of $4.91 per share and 154,750 shares reserved for future grant under our1998 Stock Option Plan. To the extent that any of these shares are issued, there will befurther dilution to new investors. See ""Capitalization,'' ""Management Ì Stock OptionPlans'' and Note 5 of Notes to Consolidated Financial Statements.
17
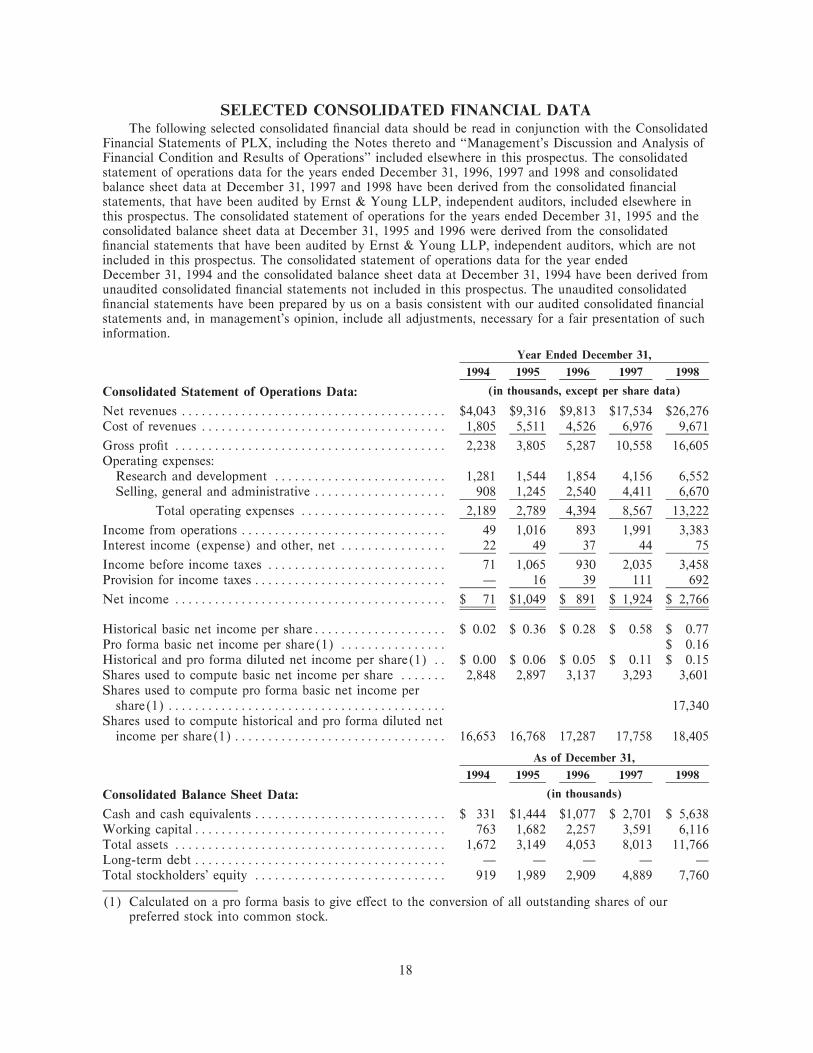
SELECTED CONSOLIDATED FINANCIAL DATAThe following selected consolidated Ñnancial data should be read in conjunction with the Consolidated
Financial Statements of PLX, including the Notes thereto and ""Management's Discussion and Analysis ofFinancial Condition and Results of Operations'' included elsewhere in this prospectus. The consolidatedstatement of operations data for the years ended December 31, 1996, 1997 and 1998 and consolidatedbalance sheet data at December 31, 1997 and 1998 have been derived from the consolidated Ñnancialstatements, that have been audited by Ernst & Young LLP, independent auditors, included elsewhere inthis prospectus. The consolidated statement of operations for the years ended December 31, 1995 and theconsolidated balance sheet data at December 31, 1995 and 1996 were derived from the consolidatedÑnancial statements that have been audited by Ernst & Young LLP, independent auditors, which are notincluded in this prospectus. The consolidated statement of operations data for the year endedDecember 31, 1994 and the consolidated balance sheet data at December 31, 1994 have been derived fromunaudited consolidated Ñnancial statements not included in this prospectus. The unaudited consolidatedÑnancial statements have been prepared by us on a basis consistent with our audited consolidated Ñnancialstatements and, in management's opinion, include all adjustments, necessary for a fair presentation of suchinformation.
Year Ended December 31,
1994 1995 1996 1997 1998
(in thousands, except per share data)Consolidated Statement of Operations Data:
Net revenues ÏÏÏÏÏÏÏÏÏÏÏÏÏÏÏÏÏÏÏÏÏÏÏÏÏÏÏÏÏÏÏÏÏÏÏÏÏÏÏÏ $4,043 $9,316 $9,813 $17,534 $26,276Cost of revenues ÏÏÏÏÏÏÏÏÏÏÏÏÏÏÏÏÏÏÏÏÏÏÏÏÏÏÏÏÏÏÏÏÏÏÏÏÏ 1,805 5,511 4,526 6,976 9,671
Gross proÑt ÏÏÏÏÏÏÏÏÏÏÏÏÏÏÏÏÏÏÏÏÏÏÏÏÏÏÏÏÏÏÏÏÏÏÏÏÏÏÏÏÏ 2,238 3,805 5,287 10,558 16,605Operating expenses:
Research and development ÏÏÏÏÏÏÏÏÏÏÏÏÏÏÏÏÏÏÏÏÏÏÏÏÏÏ 1,281 1,544 1,854 4,156 6,552Selling, general and administrative ÏÏÏÏÏÏÏÏÏÏÏÏÏÏÏÏÏÏÏÏ 908 1,245 2,540 4,411 6,670
Total operating expenses ÏÏÏÏÏÏÏÏÏÏÏÏÏÏÏÏÏÏÏÏÏÏ 2,189 2,789 4,394 8,567 13,222
Income from operations ÏÏÏÏÏÏÏÏÏÏÏÏÏÏÏÏÏÏÏÏÏÏÏÏÏÏÏÏÏÏÏ 49 1,016 893 1,991 3,383Interest income (expense) and other, net ÏÏÏÏÏÏÏÏÏÏÏÏÏÏÏÏ 22 49 37 44 75
Income before income taxes ÏÏÏÏÏÏÏÏÏÏÏÏÏÏÏÏÏÏÏÏÏÏÏÏÏÏÏ 71 1,065 930 2,035 3,458Provision for income taxes ÏÏÏÏÏÏÏÏÏÏÏÏÏÏÏÏÏÏÏÏÏÏÏÏÏÏÏÏÏ Ì 16 39 111 692
Net income ÏÏÏÏÏÏÏÏÏÏÏÏÏÏÏÏÏÏÏÏÏÏÏÏÏÏÏÏÏÏÏÏÏÏÏÏÏÏÏÏÏ $ 71 $1,049 $ 891 $ 1,924 $ 2,766
Historical basic net income per shareÏÏÏÏÏÏÏÏÏÏÏÏÏÏÏÏÏÏÏÏ $ 0.02 $ 0.36 $ 0.28 $ 0.58 $ 0.77Pro forma basic net income per share(1) ÏÏÏÏÏÏÏÏÏÏÏÏÏÏÏÏ $ 0.16Historical and pro forma diluted net income per share(1) ÏÏ $ 0.00 $ 0.06 $ 0.05 $ 0.11 $ 0.15Shares used to compute basic net income per share ÏÏÏÏÏÏÏ 2,848 2,897 3,137 3,293 3,601Shares used to compute pro forma basic net income per
share(1) ÏÏÏÏÏÏÏÏÏÏÏÏÏÏÏÏÏÏÏÏÏÏÏÏÏÏÏÏÏÏÏÏÏÏÏÏÏÏÏÏÏÏ 17,340Shares used to compute historical and pro forma diluted net
income per share(1)ÏÏÏÏÏÏÏÏÏÏÏÏÏÏÏÏÏÏÏÏÏÏÏÏÏÏÏÏÏÏÏÏ 16,653 16,768 17,287 17,758 18,405
As of December 31,
1994 1995 1996 1997 1998
(in thousands)Consolidated Balance Sheet Data:
Cash and cash equivalents ÏÏÏÏÏÏÏÏÏÏÏÏÏÏÏÏÏÏÏÏÏÏÏÏÏÏÏÏÏ $ 331 $1,444 $1,077 $ 2,701 $ 5,638Working capitalÏÏÏÏÏÏÏÏÏÏÏÏÏÏÏÏÏÏÏÏÏÏÏÏÏÏÏÏÏÏÏÏÏÏÏÏÏÏ 763 1,682 2,257 3,591 6,116Total assets ÏÏÏÏÏÏÏÏÏÏÏÏÏÏÏÏÏÏÏÏÏÏÏÏÏÏÏÏÏÏÏÏÏÏÏÏÏÏÏÏÏ 1,672 3,149 4,053 8,013 11,766Long-term debt ÏÏÏÏÏÏÏÏÏÏÏÏÏÏÏÏÏÏÏÏÏÏÏÏÏÏÏÏÏÏÏÏÏÏÏÏÏÏ Ì Ì Ì Ì ÌTotal stockholders' equity ÏÏÏÏÏÏÏÏÏÏÏÏÏÏÏÏÏÏÏÏÏÏÏÏÏÏÏÏÏ 919 1,989 2,909 4,889 7,760
(1) Calculated on a pro forma basis to give eÅect to the conversion of all outstanding shares of ourpreferred stock into common stock.
18

MANAGEMENT'S DISCUSSION AND ANALYSIS OFFINANCIAL CONDITION AND RESULTS OF OPERATIONS
The following Management's Discussion and Analysis of Financial Condition andResults of Operations contains forward-looking statements that involve risks anduncertainties. Our actual results could diÅer materially from those anticipated in theseforward-looking statements as a result of various factors, including those set forth under""Risk Factors'' and elsewhere in this prospectus. The following discussion should be readin conjunction with our Consolidated Financial Statements and related notes theretoincluded elsewhere in this prospectus.
Overview
PLX was founded in 1986, and since 1994 we have focused on development of I/Ointerface semiconductors and related software and development tools that are used insystems incorporating the PCI standard. In 1994 and 1995, a signiÑcant portion of ourrevenues was from the sale of semiconductor devices that perform similar functions as ourcurrent products, except they were based on a variety of industry standards. Our revenuessince 1996 have been derived predominantly from the sale of semiconductor devices basedon the PCI standard to a large number of customers in a variety of applications includingnetworking and telecommunications, enterprise storage, imaging, industrial and otherembedded applications as well as in related adapter cards. We generate a small portion ofour revenues from sales of our software and development tools.
We utilize a ""fabless'' semiconductor business model whereby we purchase packagedand tested semiconductor devices from independent manufacturing foundries. Thisapproach allows us to focus on deÑning, developing, and marketing our products andeliminates the need for us to invest large amounts of capital in manufacturing facilities andwork-in-process inventory.
We rely on a combination of direct sales personnel and distributors andmanufacturers' representatives throughout the world to sell a signiÑcant portion of ourproducts. We pay manufacturers' representatives a commission on sales while we sellproducts to distributors at a discount from the selling price. We recognize revenue at thetime of product shipment to electronic equipment manufacturers. Revenues from sales todistributors that are made under agreements which allow the return of products unsold bythe distributor are not recognized until the distributor ships the product to its customer.See ""Risk Factors Ì A Large Portion of Our Revenues Is Derived From Sales to Third-Party Distributors Who May Terminate Their Relationships with Us at Any Time.''
Our gross margins have Öuctuated in the past and are expected to Öuctuate in thefuture due to changes in product mix, the position of our products in their respective lifecycles, and speciÑc product manufacturing costs.
The time period between initial customer evaluation and design completion can rangefrom six to twelve months or more. Furthermore, there is typically an additional six totwelve month or greater period after design completion before a customer commencesvolume production of equipment incorporating our products. Due to these lengthy salescycles, we may experience signiÑcant Öuctuations in new orders from month to month.Consequently, if anticipated sales and shipments in any quarter do not occur whenexpected, expenses and inventory levels could be disproportionately high, and our resultsfor that quarter and potentially future quarters would be materially and adversely aÅected.
19

Our long-term success will depend on our ability to introduce new products. Althoughtypically new products generate little or no revenues during the Ñrst twelve to twenty-fourmonths following their introduction, our revenues in subsequent periods depend upon thesenew products. Due to the lengthy sales cycle and additional time for customers tocommence volume production, signiÑcant revenues from our new products typically occuronly twelve to twenty-four months after product introduction. As a result, revenues fromnewly introduced products have been a small percentage of revenues in the year theproduct was introduced. See ""Risk Factors Ì Our Lengthy Sales Cycle Can Result inUncertainty and Delays with Regard to Our Expected Revenues.''
Results of Operations
The following table summarizes historical results of operations as a percentage of netrevenues for the periods shown.
Fiscal Year EndedDecember 31,
1996 1997 1998
Net revenuesÏÏÏÏÏÏÏÏÏÏÏÏÏÏÏÏÏÏÏÏÏÏÏÏÏÏÏÏÏÏÏÏÏÏÏÏÏÏÏÏÏÏÏ 100.0% 100.0% 100.0%Cost of revenuesÏÏÏÏÏÏÏÏÏÏÏÏÏÏÏÏÏÏÏÏÏÏÏÏÏÏÏÏÏÏÏÏÏÏÏÏÏÏÏÏ 46.1 39.8 36.8
Gross proÑt ÏÏÏÏÏÏÏÏÏÏÏÏÏÏÏÏÏÏÏÏÏÏÏÏÏÏÏÏÏÏÏÏÏÏÏÏÏÏÏÏÏÏÏÏ 53.9 60.2 63.2Expenses:
Research and development ÏÏÏÏÏÏÏÏÏÏÏÏÏÏÏÏÏÏÏÏÏÏÏÏÏÏÏÏÏ 18.9 23.7 24.9Selling, general and administrative ÏÏÏÏÏÏÏÏÏÏÏÏÏÏÏÏÏÏÏÏÏÏ 25.9 25.2 25.4
Total operating expenses ÏÏÏÏÏÏÏÏÏÏÏÏÏÏÏÏÏÏÏÏÏÏÏÏÏ 44.8 48.9 50.3
Operating incomeÏÏÏÏÏÏÏÏÏÏÏÏÏÏÏÏÏÏÏÏÏÏÏÏÏÏÏÏÏÏÏÏÏÏÏÏÏÏÏ 9.1 11.3 12.9Interest income (expense) and other, netÏÏÏÏÏÏÏÏÏÏÏÏÏÏÏÏÏÏÏ 0.4 0.3 0.3
Income before income taxes ÏÏÏÏÏÏÏÏÏÏÏÏÏÏÏÏÏÏÏÏÏÏÏÏÏÏÏÏÏÏ 9.5 11.6 13.2Provision for income taxes ÏÏÏÏÏÏÏÏÏÏÏÏÏÏÏÏÏÏÏÏÏÏÏÏÏÏÏÏÏÏÏ 0.4 0.6 2.6
Net incomeÏÏÏÏÏÏÏÏÏÏÏÏÏÏÏÏÏÏÏÏÏÏÏÏÏÏÏÏÏÏÏÏÏÏÏÏÏÏÏÏÏÏÏÏ 9.1% 11.0% 10.6%
Comparison of Years Ended December 31, 1996, 1997, and 1998
Net Revenues. Revenues consist of product revenues generated principally by sales ofour semiconductor devices. Revenues for 1998 were $26.3 million, an increase of$8.8 million or 50% from 1997. Revenues for 1997 were $17.5 million, an increase of$7.7 million or 79% from $9.8 million for 1996. In each year the increase was primarilydue to higher volume shipments of PCI products.
Gross ProÑt. Gross proÑt represents net revenues less the cost of revenues. Cost ofrevenues includes the cost of purchasing packaged semiconductor devices from ourindependent foundries, our operating costs associated with the procurement, storage, andshipment of products, as well as royalty expenses paid on some of our products. GrossproÑt for 1998 was $16.6 million, an increase of $6.0 million or 57% from 1997. GrossproÑt for 1997 was $10.6 million, an increase of $5.3 million or 100% from $5.3 million for1996. Gross proÑt as a percentage of revenues was 63.2% in 1998, 60.2% in 1997 and53.9% in 1996. In each year, the increase in absolute dollars was primarily due to higherrevenues. Gross margin as a percentage of revenues increased in 1998 from 1997 and in1997 from 1996 primarily due to lower product costs.
20
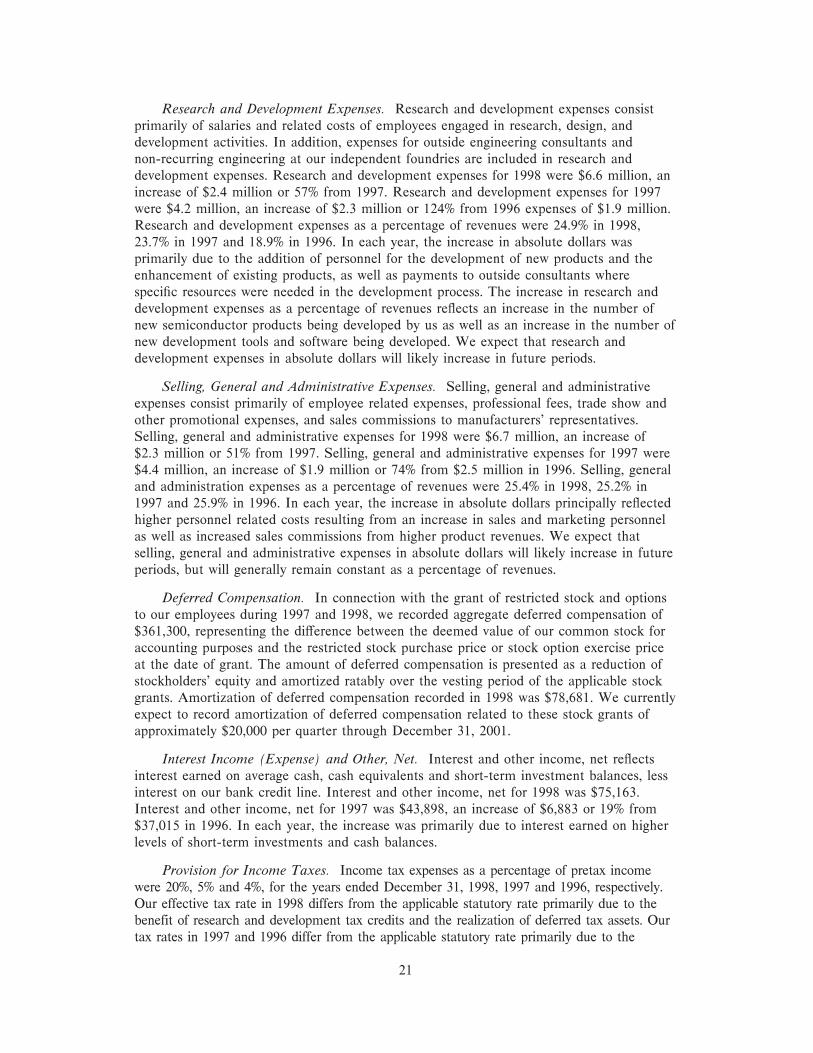
Research and Development Expenses. Research and development expenses consistprimarily of salaries and related costs of employees engaged in research, design, anddevelopment activities. In addition, expenses for outside engineering consultants andnon-recurring engineering at our independent foundries are included in research anddevelopment expenses. Research and development expenses for 1998 were $6.6 million, anincrease of $2.4 million or 57% from 1997. Research and development expenses for 1997were $4.2 million, an increase of $2.3 million or 124% from 1996 expenses of $1.9 million.Research and development expenses as a percentage of revenues were 24.9% in 1998,23.7% in 1997 and 18.9% in 1996. In each year, the increase in absolute dollars wasprimarily due to the addition of personnel for the development of new products and theenhancement of existing products, as well as payments to outside consultants wherespeciÑc resources were needed in the development process. The increase in research anddevelopment expenses as a percentage of revenues reÖects an increase in the number ofnew semiconductor products being developed by us as well as an increase in the number ofnew development tools and software being developed. We expect that research anddevelopment expenses in absolute dollars will likely increase in future periods.
Selling, General and Administrative Expenses. Selling, general and administrativeexpenses consist primarily of employee related expenses, professional fees, trade show andother promotional expenses, and sales commissions to manufacturers' representatives.Selling, general and administrative expenses for 1998 were $6.7 million, an increase of$2.3 million or 51% from 1997. Selling, general and administrative expenses for 1997 were$4.4 million, an increase of $1.9 million or 74% from $2.5 million in 1996. Selling, generaland administration expenses as a percentage of revenues were 25.4% in 1998, 25.2% in1997 and 25.9% in 1996. In each year, the increase in absolute dollars principally reÖectedhigher personnel related costs resulting from an increase in sales and marketing personnelas well as increased sales commissions from higher product revenues. We expect thatselling, general and administrative expenses in absolute dollars will likely increase in futureperiods, but will generally remain constant as a percentage of revenues.
Deferred Compensation. In connection with the grant of restricted stock and optionsto our employees during 1997 and 1998, we recorded aggregate deferred compensation of$361,300, representing the diÅerence between the deemed value of our common stock foraccounting purposes and the restricted stock purchase price or stock option exercise priceat the date of grant. The amount of deferred compensation is presented as a reduction ofstockholders' equity and amortized ratably over the vesting period of the applicable stockgrants. Amortization of deferred compensation recorded in 1998 was $78,681. We currentlyexpect to record amortization of deferred compensation related to these stock grants ofapproximately $20,000 per quarter through December 31, 2001.
Interest Income (Expense) and Other, Net. Interest and other income, net reÖectsinterest earned on average cash, cash equivalents and short-term investment balances, lessinterest on our bank credit line. Interest and other income, net for 1998 was $75,163.Interest and other income, net for 1997 was $43,898, an increase of $6,883 or 19% from$37,015 in 1996. In each year, the increase was primarily due to interest earned on higherlevels of short-term investments and cash balances.
Provision for Income Taxes. Income tax expenses as a percentage of pretax incomewere 20%, 5% and 4%, for the years ended December 31, 1998, 1997 and 1996, respectively.Our effective tax rate in 1998 differs from the applicable statutory rate primarily due to thebenefit of research and development tax credits and the realization of deferred tax assets. Ourtax rates in 1997 and 1996 differ from the applicable statutory rate primarily due to the
21

benefit of net operating loss and research and development tax credit carryforwards. Weexpect that the effective tax rate in future periods will increase from historical rates.
The valuation allowance for deferred tax assets decreased by $407,000 and $639,000in 1998 and 1997, respectively. Decreases in the valuation allowance were based upontaxable income earned in 1998 and 1997, as well as management's expectations of futuretaxable income. Although realization is not assured, we believe we will generate futuretaxable income suÇcient to realize the beneÑt of the net deferred tax assets recognized.
22

Quarterly Results of Operations
The following table presents selected quarterly Ñnancial information for each quarter of 1997 and 1998.This information is unaudited but, in the opinion of our management, reÖects all adjustments (consisting only ofnormal recurring adjustments) that we consider necessary for a fair presentation of this information inaccordance with generally accepted accounting principles. These quarterly results are not necessarily indicativeof future results of operations.
Three Months Ended(in thousands)
Mar 31, June 30, Sept 30, Dec 31, Mar 31, June 30, Sept 30, Dec 31,1997 1997 1997 1997 1998 1998 1998 1998
Net revenues ÏÏÏÏÏÏÏÏÏÏÏÏÏÏÏÏÏÏÏÏÏÏÏÏÏÏÏÏ $3,890 $3,605 $4,805 $5,234 $5,413 $5,626 $7,385 $7,852Cost of revenues ÏÏÏÏÏÏÏÏÏÏÏÏÏÏÏÏÏÏÏÏÏÏÏÏÏ 1,829 1,616 1,639 1,892 2,008 2,108 2,622 2,933
Gross proÑtÏÏÏÏÏÏÏÏÏÏÏÏÏÏÏÏÏÏÏÏÏÏÏÏÏÏÏÏÏÏ 2,061 1,989 3,166 3,342 3,405 3,518 4,763 4,919Expenses:
Research and developmentÏÏÏÏÏÏÏÏÏÏÏÏÏÏÏ 756 841 1,003 1,556 1,798 1,600 1,531 1,623Selling, general and administrative ÏÏÏÏÏÏÏÏ 836 983 1,168 1,424 1,448 1,568 1,686 1,968
Total operating expensesÏÏÏÏÏÏÏÏÏÏÏÏÏÏÏÏÏÏÏ 1,592 1,824 2,171 2,980 3,246 3,168 3,217 3,591
Operating income ÏÏÏÏÏÏÏÏÏÏÏÏÏÏÏÏÏÏÏÏÏÏÏÏ 469 165 995 362 159 350 1,546 1,328Interest income (expense) and other net ÏÏÏÏÏ 10 11 9 14 14 14 19 28
Income before income taxes ÏÏÏÏÏÏÏÏÏÏÏÏÏÏÏ 479 176 1,004 376 173 364 1,565 1,356Provision for (beneÑt from) income
taxes ÏÏÏÏÏÏÏÏÏÏÏÏÏÏÏÏÏÏÏÏÏÏÏÏÏÏÏÏÏÏÏÏÏ 71 27 149 (136) 35 73 313 271
Net income ÏÏÏÏÏÏÏÏÏÏÏÏÏÏÏÏÏÏÏÏÏÏÏÏÏÏÏÏÏ $ 408 $ 149 $ 855 $ 512 $ 138 $ 291 $1,252 $1,085
Historical basic net income per share ÏÏÏÏÏÏÏÏ $ 0.13 $ 0.05 $ 0.26 $ 0.15 $ 0.04 $ 0.08 $ 0.34 $ 0.28Pro forma basic net income per share ÏÏÏÏÏÏÏ $ 0.01 $ 0.02 $ 0.07 $ 0.06Historical and pro forma diluted net income
per shareÏÏÏÏÏÏÏÏÏÏÏÏÏÏÏÏÏÏÏÏÏÏÏÏÏÏÏÏÏÏ $ 0.02 $ 0.01 $ 0.05 $ 0.03 $ 0.01 $ 0.02 $ 0.07 $ 0.06Shares used in computing historical basic net
income per share ÏÏÏÏÏÏÏÏÏÏÏÏÏÏÏÏÏÏÏÏÏÏÏ 3,174 3,283 3,335 3,379 3,441 3,508 3,638 3,819Shares used in computing pro forma basic net
income per share ÏÏÏÏÏÏÏÏÏÏÏÏÏÏÏÏÏÏÏÏÏÏÏ 17,180 17,247 17,377 17,558Shares used in computing historical and pro
forma diluted net income per shareÏÏÏÏÏÏÏÏ 17,385 17,505 17,863 18,280 18,420 18,420 18,405 18,375
As a Percentage of Net Revenues Three Months Ended
Mar 31, June 30, Sept 30, Dec 31, Mar 31, June 30, Sept 30, Dec 31,1997 1997 1997 1997 1998 1998 1998 1998
Net revenuesÏÏÏÏÏÏÏÏÏÏÏÏÏÏÏÏÏÏÏÏÏÏÏÏÏÏÏÏÏ 100.0% 100.0% 100.0% 100.0% 100.0% 100.0% 100.0% 100.0%Cost of revenues ÏÏÏÏÏÏÏÏÏÏÏÏÏÏÏÏÏÏÏÏÏÏÏÏÏÏ 47.0 44.8 34.1 36.1 37.1 37.5 35.5 37.3
Gross proÑt ÏÏÏÏÏÏÏÏÏÏÏÏÏÏÏÏÏÏÏÏÏÏÏÏÏÏÏÏÏÏ 53.0 55.2 65.9 63.9 62.9 62.5 64.5 62.7Expenses:
Research and development ÏÏÏÏÏÏÏÏÏÏÏÏÏÏÏ 19.4 23.3 20.9 29.7 33.2 28.4 20.7 20.7Selling, general and administrativeÏÏÏÏÏÏÏÏÏ 21.5 27.3 24.4 27.1 26.8 27.9 22.8 25.1
Total operating expenses ÏÏÏÏÏÏÏÏÏÏÏ 40.9 50.6 45.3 56.8 60.0 56.3 43.5 45.8
Operating income ÏÏÏÏÏÏÏÏÏÏÏÏÏÏÏÏÏÏÏÏÏÏÏÏÏ 12.1 4.6 20.6 7.1 2.9 6.2 21.0 16.9Interest income (expense) and other income,
net ÏÏÏÏÏÏÏÏÏÏÏÏÏÏÏÏÏÏÏÏÏÏÏÏÏÏÏÏÏÏÏÏÏÏÏ 0.3 0.3 0.2 0.3 0.3 0.2 0.3 0.4
Income before income taxes ÏÏÏÏÏÏÏÏÏÏÏÏÏÏÏ 12.4 4.9 20.8 7.4 3.2 6.4 21.3 17.3Provision for income taxesÏÏÏÏÏÏÏÏÏÏÏÏÏÏÏÏÏÏ 1.8 0.7 3.1 (2.6) 0.6 1.3 4.2 3.5
Net income ÏÏÏÏÏÏÏÏÏÏÏÏÏÏÏÏÏÏÏÏÏÏÏÏÏÏÏÏÏÏ 10.6% 4.2% 17.7% 10.0% 2.6% 5.1% 17.1% 13.8%
23

Net Revenues. Revenues increased each quarter from the second quarter of 1997through the fourth quarter of 1998 as a result of higher unit shipments of our PCI products.The decrease in net revenues from $3.9 million in the first quarter of 1997 to $3.6 million inthe second quarter of 1997 was primarily due to a reduction of unit shipments.
Gross ProÑt. Gross proÑt increases as a percentage of net revenues to 65.9% in thethird quarter of 1997 and to 64.5% in the third quarter of 1998 were the result of lowerproduct costs. The gross proÑt percentage in the fourth quarter of 1998 declined slightly to62.7%, due primarily to changes in product mix.
Research and Development Expenses. Research and development expenses increasedin absolute dollars in each quarter from the Ñrst quarter of 1997 through the Ñrst quarterof 1998 primarily due to a signiÑcant increase in the number of new product developmentprograms including new software and development tools. Research and developmentexpenses as a percentage of net revenues increased in each quarter from the Ñrst quarter of1997 through the Ñrst quarter of 1998, except for the third quarter of 1997 when netrevenues grew faster than research and development expenditures. These increases weredue to the increased number of new product development programs relative to productshipments. Research and development expenses as a percentage of net revenues declinedeach quarter from the second quarter of 1998 through the fourth quarter of 1998. Thisreduction was due primarily to reductions in outside consulting and non-recurringengineering expenses, which related to the timing and completion of product developmentprojects, and increased product shipments.
Selling, General and Administrative Expenses. Selling, general and administrativeexpenses increased in absolute dollars through the fourth quarter of 1998 as we expandedour infrastructure to accommodate higher unit shipments and expanding operations. Inaddition, commissions to manufacturers' representatives have increased with revenues andmarketing expenses have increased due to new product introductions.
Fluctuations in Quarterly Results. Our quarterly results of operations have ÖuctuatedsigniÑcantly in the past and are expected to Öuctuate signiÑcantly in the future based on anumber of factors, many of which are not in our control. We believe period to periodcomparisons are not necessarily meaningful and should not be relied upon as indicative offuture results. See ""Risk Factors Ì Our Operating Results May Fluctuate SigniÑcantlyDue to Factors Which Are Not Within Our Control.''
Liquidity and Capital Resources
Since inception, we have Ñnanced our operations through a combination of privatesales of equity securities and cash generated by operations. At December 31, 1998, we had$6.1 million in working capital and $5.6 million in cash and cash equivalents. Ouroperating activities generated cash of $4.0 million, $2.6 million and $307,688 in 1998, 1997and 1996, respectively. Cash provided by operating activities in 1998, 1997, and 1996 wasprimarily attributable to net income adjusted for depreciation. In addition, cash providedby operating activities in 1998 was also due to a decrease in our accounts receivablebalance. The decrease in accounts receivable was primarily due to the fact that, ascompared with the fourth quarter of 1997, there were more shipments of products earlierin the fourth quarter of 1998, which enabled us to collect more of our 1998 accountsreceivable prior to year end.
24
Our investing activities used cash of $1.1 million in 1998 and $1.0 million and$602,850 in 1997 and 1996, respectively. These investing activities were primarily for thepurchase of capital equipment. Cash provided by Ñnancing activities was approximately$26,000 in 1998 and $56,000 in 1997. Cash used in Ñnancing activities was approximately$72,000 in 1996. The main source of cash from Ñnancing activities in 1998 was therepayment of notes receivable from stockholders. In 1996, cash was used to repayoutstanding notes payable.
In February 1999, we signed a commitment letter with Comerica Bank for a$1.5 million line of credit. Currently, this line of credit has not been Ñnalized and there areno amounts outstanding.
As of December 31, 1998, we had no material commitments outstanding.
We believe that the net proceeds of this offering, together with cash generated from ouroperations and funds available under our credit facilities will be sufficient to meet our capitalrequirements for at least the next twelve months. Our future capital requirements will dependon many factors, including the inventory levels we maintain, the level of investment we makein new technologies and improvements to existing technologies, the levels of monthly expensesrequired to launch new products. To the extent that the funds generated by this offering,together with existing resources and future earnings, are insufficient to fund our futureactivities, we may need to raise additional funds through public or private financing. Additionalfunds may not be available or, if available, we may not be able to obtain them on termsfavorable to us and our stockholders. See ""Use of Proceeds.''
Year 2000 Readiness Disclosure
State of Readiness. We utilize a number of computer software programs andoperating systems across our entire organization, including applications used in Ñnancialbusiness systems and various administrative functions. To the extent that our softwareapplications contain source code that is unable to appropriately interpret the upcomingYear 2000 and beyond, some level of modiÑcation or replacement of such applications willbe necessary. We believe that our internal Year 2000 issues are limited to informationtechnology, or IT systems such as software programs and computer operating systems, andwe are working closely with the suppliers of such systems to ensure that all systems areYear 2000 compliant. Employing a team made up of internal personnel, we havecompleted our identiÑcation of IT systems that are not yet Year 2000 compliant and havecommenced modiÑcation or replacement of non-compliant systems as necessary. We havealso completed our assessment of the Year 2000 compliance issues presented by oursemiconductor hardware and software products. We anticipate that modiÑcation orreplacement and testing of these systems will be completed by September 30, 1999. Noneof our hardware or software products has Year 2000 issues that require productmodiÑcation or replacement.
We are highly dependent on a few semiconductor foundry companies to produce themajority of our products. To the extent that Year 2000 issues eÅect these suppliers' abilityto deliver product, we must review the suppliers plans for Year 2000 compliance andsatisfy ourselves that they have made the necessary modiÑcations to or replacements oftheir aÅected systems. We have requested these plans and will evaluate them as they arereceived. We anticipate that this evaluation will be completed by September 30, 1999. Wewill rely primarily on the suppliers' commitments to accomplish this task but have nocontractual commitment from the suppliers regarding Year 2000 issues.
25
Costs of Addressing Year 2000 Issues. Given the information known at this time aboutour non-compliant systems, coupled with ongoing, normal course-of-business efforts to upgradeor replace critical systems, as necessary, we do not expect Year 2000 compliance costs to haveany material adverse impact on our business. We estimate that total costs for the Year 2000compliance assessment and remediation will not exceed $50,000. The costs of this assessmentand remediation will be paid out of general and administrative expenses.
Risks of Year 2000 Issues. In light of our assessment and remediation eÅorts to date,and the planned, normal course-of-business upgrades, we believe that any residual Year2000 risk is limited to non-critical business applications and support hardware. Noassurance can be given, however, that all of our systems will be Year 2000 compliant orthat compliance will not have a material adverse eÅect on our business. We also do nothave any assurance that the manufacturers who supply semiconductors for us will be Year2000 compliant with their internal systems; a reduction in the supply of product from thesesuppliers could have a material adverse eÅect on our business.
Contingency Plans. We believe that, if our suppliers are not Year 2000 compliant, thereasonably likely worst case would be that we would be unable to receive products fromthem on a timely basis which would disrupt our shipments to customers and couldmaterially adversely aÅect our business. In addition, if our IT systems are not Year 2000compliant, we may be unable to process customer orders, which could also lead toshipment delays. We plan to develop a contingency plan for all operations to address themost reasonably likely worst case scenarios regarding Year 2000 compliance. We expectthis contingency plan to be completed by June 30, 1999.
Financial Market Risk
Our principal financial market risk relates to the interest rates associated with ouravailable-for-sale securities. At December 31, 1998, our market risk related to theseinvestments was immaterial and all these investments had original maturities not exceeding90 days.
26

BUSINESS
The following discussion contains forward-looking statements that involve risks anduncertainties. Our actual results could diÅer materially from those anticipated in theseforward-looking statements as a result of factors, including those set forth under ""RiskFactors'' and elsewhere in this prospectus.
Industry Background
Embedded systems are found in many common products and oÅer varying levels ofperformance depending on each product's requirements. These products range from lowperformance devices such as electronic toys and microwave ovens to very complex, high-performance electronic equipment such as network routers and switches. High-performanceembedded systems oÅer increased data processing capabilities and typically utilize one ormore 32-bit or 64-bit microprocessors, fast memories and peripherals, and sophisticatedoperating systems or control code.
Demand for high-performance embedded systems, which are designed to transmit,store and process information rapidly, has dramatically increased due to the:
‚ growth of the Internet,
‚ deployment of high-speed networking and
‚ proliferation of multimedia.
Markets for electronic equipment that rely on high-performance embedded systemsinclude the following:
Networking and Telecommunications. Networking and telecommunicationsapplications include digital telephony, remote access servers, routers, network switchesand cable modem equipment. This market segment is growing rapidly due to the riseof the Internet and the proliferation of high bandwidth communication technologiessuch as Fast Ethernet, Gigabit Ethernet, Asynchronous Transfer Mode, or ATM,cable modem, and Digital Subscriber Line, or xDSL.
Enterprise Storage. Enterprise storage applications include disk storage subsystems,automated tape libraries and Ñle servers. The growing use of multimedia applicationsand storage networks is driving corporate demand for increased data storage capacity.
Imaging. Imaging applications include printers, copiers, medical instrumentation andvideo and graphics equipment. The demand for better image quality and fasterperformance, as well as connection of these applications to high-speed networks, haveincreased their data processing requirements.
Industrial. Industrial applications include a wide range of process control computersand factory automation equipment. These products have high data transfer raterequirements, are used to monitor and control complex processes in real-time and arebeing increasingly attached to networks.
Manufacturers of products that rely on high-performance embedded systems seek tomaximize the performance and minimize the cost of their increasingly complex products.In addition, these manufacturers must develop and bring new products to market quicklyto keep pace with technological advancements.
27

The I/O Subsystem
A typical embedded system can be described in terms of four primary functions: thehost microprocessor, the memory, the peripherals and the input/output, or I/O, subsystem.The host microprocessor is the primary control center for the system. The memory acts asa storage area for instructions to be executed and data to be processed. The peripheralsenable connections between the system and other external devices such as networkcomponents, printers and storage systems. The I/O subsystem is the circuitry and softwarethat connects these three other functions and allows for the transfer of instructions anddata among these functions. The I/O subsystem includes the system bus which is aphysical connection between these diÅerent functions. High-performance electronicequipment can contain multiple embedded systems, each requiring a separateI/O subsystem. The following diagram illustrates the major components of a typicalembedded system:
To enable increased performance and functionality from computer systems,semiconductor suppliers have historically focused on improving the operation ofperipherals, microprocessors and memories. The I/O subsystem must also improve to keeppace with these improvements by transferring more information at faster speeds.
As data transfer requirements for the I/O subsystem have increased, so has thecomplexity of its interface components such as processors, logic and related software. Untilrecently, most embedded systems used simple I/O subsystems that contained noprocessors, limited logic and rudimentary software, if any. Complex I/O subsystemcomponents such as processors, elaborate control logic and advanced software were costly,and therefore their use was conÑned to very high-end equipment such as mainframecomputers. Furthermore, the lack of widely accepted I/O standards impeded the use ofcomplex I/O subsystems in other than high-end applications. However, advances insemiconductor technology combined with the widespread adoption of standards inembedded systems have enabled the development of highly integrated semiconductordevices that can better manage I/O subsystem performance at lower cost.
Penetration of I/O Standards in Embedded Systems
Until recently embedded systems manufacturers relied on a wide variety of proprietaryand a fragmented set of industry standard I/O architectures. For example, many
28

networking, imaging, storage and industrial applications employed proprietary architecturesto meet their speciÑc performance and cost requirements. A mix of standard buses such asVMEbus, Multibus and ISA was used in some industrial, telecommunications and militaryapplications. Embedded system software was even more fragmented with many proprietaryand application speciÑc software architectures in use. While embedded developers couldtake advantage of many standard microprocessor, memory and peripheral componentssupplied by external vendors, the lack of acceptable I/O standards forced many to developcustom I/O subsystems internally, placing a heavy demand on development resources.
The deployment of the PCI standard was one of the catalysts for the widespreadadoption of I/O standards in embedded systems. In the early 1990s, PC manufacturersdeveloped PCI, a new standard hardware architecture to connect the major components ofa PC at high speed. It oÅered up to a one hundred times improvement in I/O datatransfer rates over the previous architectures. By the mid-1990s, PCI became the mostwidely used bus architecture in the PC market. Consequently, most suppliers of peripheralsemiconductor components used in PCs adopted PCI as the standard system interface.PCI is now emerging as the standard I/O architecture for many high-performanceembedded systems because it allows the use of low cost and state-of-the-art peripheralsemiconductor components developed for the PC market and provides a foundation forembedded system interoperability. PCI also oÅers equivalent or superior performance tothe in-house developed standards of many embedded equipment suppliers. Furthermore,the use of PCI enables faster time to market, lower development cost and the ability toquickly integrate new I/O components.
Although the PCI standard has resolved many development issues relating to I/Ohardware architectures, software remains a challenge. The lack of standards for I/Ocontrol software and the wide use of proprietary operating systems place a signiÑcantdemand on development resources. Consequently, embedded developers are increasinglyadopting standard operating systems with well-deÑned I/O structures as opposed todeveloping their own software internally. Examples include Windows NT, Windows CEand standard operating systems from companies such as Wind River and IntegratedSystems. In a related development, a consortium of industry leaders approved a newspeciÑcation, Intelligent I/O, or I2O, in 1997 to address software compatibility andperformance issues. I2O architecture enables more eÇcient use of the PCI bus and canresult in higher data transfer rates and thus increased embedded system performance.Instead of designing proprietary software, developers can use I2O architecture as a standardsoftware architecture that reduces software development time and costs. Furthermore, byusing I2O architecture, embedded system suppliers can more easily integrate third partysystem components, thereby reducing development costs and improving time-to-market.
Need for Standard I/O Products and Comprehensive I/O Solutions
Even with standard I/O speciÑcations, design teams must still create the circuitry andrelated software that implements these speciÑcations. Designers must also update their I/Osubsystems to include frequent improvements in these speciÑcations.
Instead of developing all the hardware and software technology internally, embeddedsystems developers seek to focus their scarce engineering resources on the proprietaryfeatures of their products. By using standard semiconductor devices in the I/O subsysteminstead of using custom-designed devices they are able to implement the basic frameworkof the system more easily and thereby reduce the I/O subsystem design eÅort, providingfaster time-to-market and lower development cost. Standard products allow the design
29

teams to concentrate their eÅorts on diÅerentiating hardware and software features. Inaddition to standard semiconductor devices, embedded designers can beneÑt from severalother design elements, such as data control software, hardware design kits and third-partydevelopment tools to complete their development work in a timely manner. Theseadditional elements simplify development and improve time to market. They provide thedesign team with proven hardware and software design examples and the tools to adaptthese examples to the embedded designers' needs.
Due to the availability and adoption of I/O standards by embedded developers, thereis now a large demand for I/O subsystem components based on these standards.
The PLX Solution
PLX develops and supplies semiconductor devices and software that accelerate andmanage the transfer of data in high-performance embedded systems. Our solution consistsof three related products:
‚ semiconductor devices,
‚ software development kits which assist in developing systems that incorporate oursemiconductor devices, and
‚ hardware design kits that allow development of a system using our semiconductordevices and software development kits.
Development tools provided by third parties support these three related products.These development tools are used for the design of other parts of the embedded systembut also work with our products.
Our products are designed for use in a variety of high-performance embeddedapplications including networking and telecommunications, enterprise storage, imaging andindustrial. We focus on I/O accelerators and I/O processors, which are highly integrated,cost-eÅective semiconductor devices that optimize the Öow of data and simplify thedevelopment of high-performance I/O subsystems. Our software development kits andhardware design kits promote sales of our semiconductor devices by lowering customers'development costs and allowing them to bring new products to market more quickly.
PLX products provide I/O connectivity solutions for PCI and I2O and other industrystandards. As new I/O standards evolve, we expect to support them where appropriate.More than 500 electronic equipment manufacturers use PLX semiconductor devices in awide variety of embedded systems applications. Customers currently shipping systems thatincorporate our products include 3Com, Cisco Systems, Compaq Computer, Hewlett-Packard, IBM, Lucent Technologies, Nortel Networks, Siemens and Tektronix.
Strategy
Our objective is to continue to expand our market position as a developer and supplierof I/O connectivity solutions for high-performance embedded systems. Key elements ofour strategy include the following:
Focus on High-Growth Markets. We focus on high-growth embedded systemsmarkets including networking and telecommunications, enterprise storage, imaging andindustrial. Within these markets, there are many highly diÅerentiated applications with
30
diÅerent design criteria such as product function, performance, cost, power consumption,software, size limitations and design support. The requirements of many of thesediÅerentiated applications are addressed by our products, and we target those applicationswhere we believe we can attain a leadership position.
Deliver Comprehensive Solutions. Our products provide embedded systems developerswith a comprehensive, proven development environment to simplify I/O subsystem design,enhance performance, reduce development costs and accelerate time-to-market. Thissolution consists of semiconductor devices, software development kits and hardware designkits. These design elements are supported by development tools provided by third parties.For example, our PCI 9080 I/O accelerator is supported by two software development kitsand Ñve hardware design kits which support microprocessors from Hitachi, IBM, IDT,Intel, and Motorola.
Extend I/O Subsystem Technology. We oÅer our customers highly integratedsemiconductor devices and related software that incorporate many of the latest advances inI/O technology. Our semiconductor devices and software are designed to enable quickadoption of new I/O technologies and enhancements to existing I/O standards. We seek tointegrate additional I/O-related functions into our semiconductor devices to provide ourcustomers with increasing functionality at the same or lower costs. For example, we aredeveloping our IOP 480, a device that will integrate IBM's PowerPC core with our PCItechnology. We employ a team of engineers with considerable expertise in embeddedsystems architectures, product deÑnition, semiconductor and software design andengineering to maintain our I/O subsystem technology advantages.
Drive I/O Subsystem Standards for Embedded Applications. We believe that ourunderstanding of I/O technology trends and market requirements allows us to bring tomarket more quickly new products that support the latest I/O technologies. Through ourparticipation in key industry groups responsible for standards such as the PCI SpecialInterest Group, the PCI Industrial Computer Manufacturers' Group and the I2O SpecialInterest Group, we have taken an active role in deÑning new I/O standards.
Strengthen and Expand Industry Relationships. We work with industry leaders indeveloping software development tools and marketing programs that promote the use ofeach company's products. Key microprocessor partners include Hitachi, IBM, IDT, Inteland Motorola, and key software partners include Integrated Systems, Microsoft, Synopsysand Wind River. As a result of these relationships, we enable embedded systems designersto choose the best products for their particular applications while still employing ourproduct as the core of their I/O subsystem design.
Customers
We supply our products to customers for a wide variety of high-performanceembedded systems applications including networking and telecommunications, enterprisestorage, imaging and industrial. We also have sales in other markets such as the personalcomputer, server and consumer markets. The typical product life cycle of a highperformance embedded system is one to two years or more of product development andinitial marketing activity followed by two to Ñve years or more of volume production,assuming the product is successful in the market. The embedded system design teamtypically selects the sole-source hardware and software components early in the designcycle. Generally, the embedded system will incorporate these same components throughoutits product life because changes require an expensive re-engineering eÅort. Therefore, when
31

our products are designed into an embedded system, they are likely to be used in thatsystem throughout its two to Ñve year or more production life.
Our products are standard semiconductor devices that may be incorporated intoequipment used in several of our target markets. More than 500 electronic equipmentmanufacturers incorporate our semiconductor devices in their products. The following tablelists representative customers that purchased directly or through distributors more than$100,000 of our products in 1998.
Networking andTelecommunications Enterprise Storage
3Com Compaq ComputerArtesyn Technologies IBMAscend Communications Network ApplianceCabletron Systems
ImagingCisco Systems
Hewlett-PackardDialogicKofax Image ProductsDigi InternationalOptibaseEicon TechnologyPinnacle SystemsEmulexScitexFore SystemsTektronixGilat Satellite Networks
IBM IndustrialIntel SiemensInterphase TektronixLucent TechnologiesNortel NetworksPerformance TechnologySDLShiva
Products
Our products consist of semiconductor devices, software development kits andhardware design kits. Development tools provided by third parties support these threedesign elements. Our semiconductor device products include I/O accelerators and ourannounced I/O processor, which are designed to simplify the development of high-performance I/O subsystems. The sales of these semiconductor devices account for asubstantial majority of our revenues. We generate a small portion of our revenues fromsales of our software and hardware design kits. The other layers of our solution promotesales of our semiconductor devices by lowering customers' development costs and allowingthem to bring new products to market more quickly.
I/O Accelerators and I/O Processors. Our I/O accelerators are semiconductordevices that accelerate movement of data across a PCI bus and between one or moredevices or subsystems that need to communicate across the PCI bus. These productsincorporate the Data Pipe Architecture technology, a set of circuits and features thatenable eÇcient Öow of data within systems with minimal supervision from the systemprocessor. Our I/O accelerators address a range of applications and provide Öexibleinterfaces that allow them to connect to a wide variety of semiconductor devices, includingprocessors such as IBM's and Motorola's PowerPC, Intel's i960, Hitachi's SH, IDT's
32

MIPs, and Motorola's 68K series. Customers also use these semiconductor devices inconnection with digital signal processors, or DSPs, which are specialized microprocessors,from Texas Instruments, Analog Devices and others. The I/O accelerators can beconnected with a wide range of peripheral devices, including LAN, WAN, disk control andgraphics.
We have announced, but are not yet shipping, the IOP 480, our Ñrst I/O processor,which combines the features of our I/O accelerator devices with a microprocessor core andmemory controller that can connect to a variety of memory types and sizes. An I/Oprocessor is a microprocessor designed to manage I/O tasks and move data eÇciently. TheI/O processor will enhance overall system performance by maximizing data Öow and oÅ-loading more I/O tasks from the host processor, compared with an I/O accelerator. It willintegrate, in one cost and space-saving device, many of the circuit elements required forI/O management. By combining several functions into one semiconductor device, the IOP480 will enable a more compact, power-eÇcient design, compared with designs that useseveral semiconductor devices to achieve these functions.
Software Development Kits. Our software development kits are designed to simplifyand accelerate the development of systems that incorporate our semiconductor devices. ForPCI technology we oÅer PCI SDK software, which shortens the time needed to developthe software used to transfer data through a PCI bus. It includes a programming interfacethat enables developers to execute complex transactions with simple commands. Thisprogramming interface allows customers to migrate their designs, with the same softwareinterface, from our existing 32 bit I/O accelerators to our 64 bit I/O accelerators and I/Oprocessor products. This common interface allows customers to preserve their softwareinvestment even as their designs evolve in complexity and as new I/O architectures aredeployed. The PCI SDK is applicable to both proprietary and standard operating systems.Our software development kit for I2O Architecture simpliÑes the development of softwarefor I2O architecture-based technology.
Hardware Design Kits. We oÅer hardware design kits that support the developmentof systems incorporating PLX semiconductor devices. We call our hardware design kits""reference design kits.'' Designers use the hardware design kits to evaluate oursemiconductor devices and to simplify and accelerate product development. Each hardwaredesign kit includes a development circuit board that designers can use to evaluate the PLXproducts and also design their own system. These hardware design kits also includetechnical drawings, documentation and other design assistance tools. Current hardwaredesign kits support IBM's PowerPC processors, Motorola's PowerQuicc processors, Intel'si960 processors, IDT's MIPs processors and Hitachi's SH processors.
To oÅer additional design support, we work with third party companies that providedevelopment tools for our customers. Although we receive no revenues from thesedevelopment tools, they promote sales of our semiconductor devices because these toolsoften make it easier to develop embedded systems incorporating our products. Examplesinclude software development tools from Diab Data, IBM, Integrated Systems, Microsoft,Netware, and Wind River and software modeling tools from Synopsys.
33
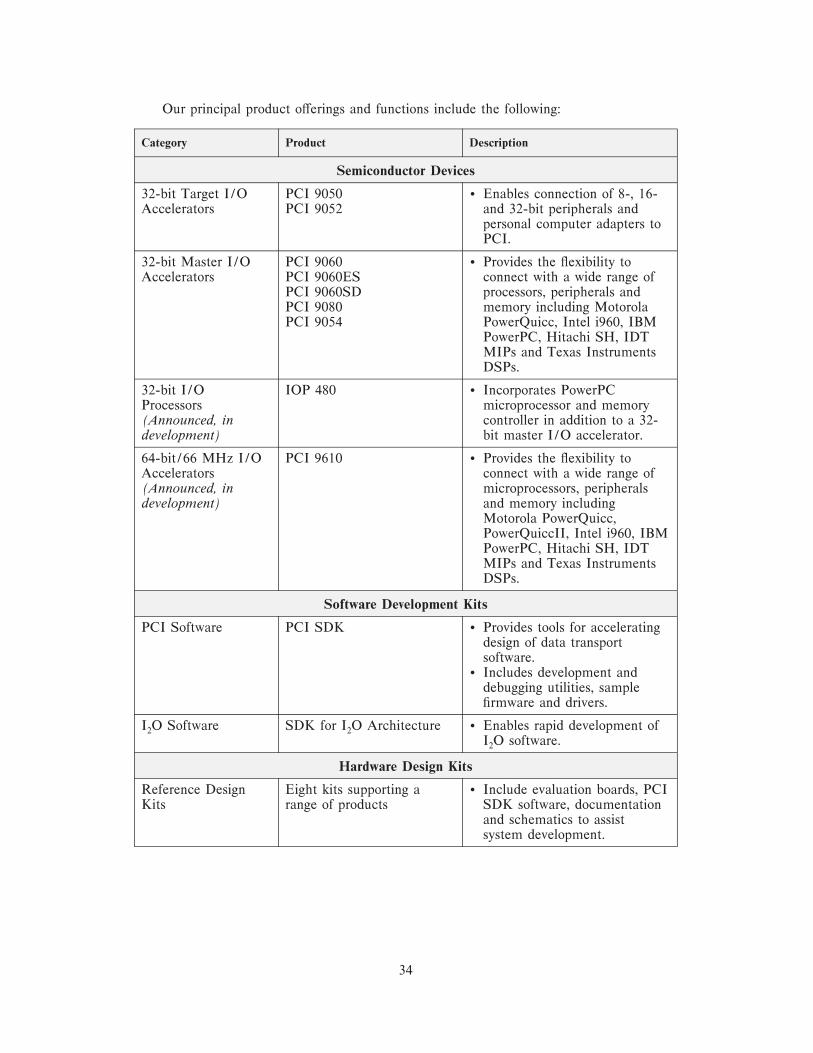
Our principal product oÅerings and functions include the following:
Category Product Description
Semiconductor Devices
32-bit Target I/O PCI 9050 ‚ Enables connection of 8-, 16-Accelerators PCI 9052 and 32-bit peripherals and
personal computer adapters toPCI.
32-bit Master I/O PCI 9060 ‚ Provides the Öexibility toAccelerators PCI 9060ES connect with a wide range of
PCI 9060SD processors, peripherals andPCI 9080 memory including MotorolaPCI 9054 PowerQuicc, Intel i960, IBM
PowerPC, Hitachi SH, IDTMIPs and Texas InstrumentsDSPs.
32-bit I/O IOP 480 ‚ Incorporates PowerPCProcessors microprocessor and memory(Announced, in controller in addition to a 32-development) bit master I/O accelerator.
64-bit/66 MHz I/O PCI 9610 ‚ Provides the Öexibility toAccelerators connect with a wide range of(Announced, in microprocessors, peripheralsdevelopment) and memory including
Motorola PowerQuicc,PowerQuiccII, Intel i960, IBMPowerPC, Hitachi SH, IDTMIPs and Texas InstrumentsDSPs.
Software Development Kits
PCI Software PCI SDK ‚ Provides tools for acceleratingdesign of data transportsoftware.
‚ Includes development anddebugging utilities, sampleÑrmware and drivers.
I2O Software SDK for I2O Architecture ‚ Enables rapid development ofI2O software.
Hardware Design Kits
Reference Design Eight kits supporting a ‚ Include evaluation boards, PCIKits range of products SDK software, documentation
and schematics to assistsystem development.
34
Technology
We believe that supplying high-performance I/O connectivity solutions for I/Osubsystems requires expertise in four areas:
‚ semiconductor design,
‚ software technology,
‚ system design, and
‚ industry standards.
Semiconductor Design. Our engineers have substantial expertise in semiconductordesign and have developed a comprehensive library of complex functional blocks for use insemiconductor devices for I/O connectivity. As a result of this expertise, we oÅer bothinnovative architectures and high levels of functionality. For example, our proprietary DataPipe Architecture technology allows the system developer a high degree of control over thePCI bus in order to address speciÑc design needs. In high-performance systems, the DataPipe Architecture technology enables data throughput that is several times faster thantypical approaches. We continue to integrate more functionality in our semiconductordevices to reduce cost, improve performance, reduce size and simplify the customer'sdesign eÅort.
Software Technology. We devote substantial engineering resources to thedevelopment of software technology used to assist the system developer in debugginghardware and creating data control software. The quality and availability of these tools arekey diÅerentiating factors between PLX and competing alternatives. We are now shipping,as part of our software development kits, our third generation PCI debugger, PLXMon 98.We continue to enhance and expand our software development kits, which contain a set ofprogramming interfaces that simplify the development of software. Our softwaredevelopment kit for I2O Architecture was the Ñrst commercially available private platformI2O software development kit. As an example of our software advantages, we licensed ourI2O software technology to Integrated Systems, a leading supplier of embedded operatingsystems, for use in Integrated System's I2O products. Our software expertise provides uswith valuable insights into our customers' software development issues, which aids thedeÑnition and development of future semiconductor devices.
System Design. We employ a team of system level design engineers that arededicated to the development of hardware design kits. These kits are high-performanceadapters and embedded systems that customers can use to assist development of theirproducts. Each of these hardware design kits is a system or adapter similar in complexityto those built by our customers. The system design experience provides us valuable insightswhich we can use to improve future semiconductor device and software products.
Industry Standards. Through our participation in the key industry groups responsiblefor standards such as the PCI Special Interest Group, the I2O Special Interest Group andthe PCI Industrial Computer Manufacturers' Group, we take an active role in deÑning newI/O standards. In addition, we are closely monitoring new I/O technologies to determinetheir applicability to our embedded market customer base.
The following diagram displays a typical embedded system incorporating PLX I/OAccelerators, I/O Processors and Data Control Software. The I/O subsystem depictedbelow includes buses, semiconductor devices and software for moving data through the
35

system. The example shows a host connected to three types of peripherals which havediÅerent performance levels and functions. The host software and three sets of peripheralsoftware shown on the right run on the corresponding hardware on the left.
Peripheral Controller
Competition
Competition in the semiconductor industry is intense. If our main target market, theembedded systems market, continues to grow, the number of competitors may increasesigniÑcantly. In addition, new semiconductor technology may lead to new products that canperform similar functions as our products.
Competition in the various markets served by us comes from companies of varioussizes, many of which are signiÑcantly larger and have greater Ñnancial and other resourcesthan we do and thus can better withstand adverse economic or market conditions than we.Our principal products compete with standard products from companies such as AnchorChips, Applied Micro Circuits, Galileo Technology, Tundra Semiconductor, and V3Semiconductor.
In addition, two alternative devices can perform some or all of the functions of oursemiconductor devices. The first is the Application Specific Integrated Circuit, or ASIC.With the ASIC approach, a customer creates a custom semiconductor device for a particularapplication. Because the customer buys the ASIC directly from the semiconductor foundry,this approach may lead to lower unit production costs. However, this approach entails a largeinitial investment in developing the custom device. The second alternative device is the FieldProgrammable Gate Array, or FPGA. The FPGA is a semiconductor device whose logicfunction can be programmed by the system manufacturer. This requires less design effortthan the ASIC approach. However, because of the additional circuitry required to enable thedevice to be programmed, this approach entails higher unit production costs which can beprohibitive compared to ASICs or standard semiconductor devices. Accordingly, we alsoexperience indirect competition from leading ASIC suppliers, including IBM, LSI Logic,NEC, and Toshiba as well as from FPGA suppliers, including Altera, Atmel, Lucent
36

Technologies, Quicklogic, Vantis, and Xilinx. As we start to sell our I/O processor products,we will compete with established embedded microprocessor companies including Hitachi,IBM, IDT, Intel, Motorola and others. Many of these indirect competitors and processorcompanies are large companies that have significantly greater financial, technical, marketingand other resources than PLX.
We believe that the principal factors of competition in our business includefunctionality, product performance, price, product innovation, availability of developmenttools, customer service and reliability. We believe that we compete favorably with respectto each of these factors. We diÅerentiate our products from those of our competitors byincorporating innovative features that allow our customers to build systems based onindustry standards that are more eÇcient and higher in performance. Furthermore, ingeneral, our software and hardware development tools are more comprehensive thancompeting solutions. However, we cannot assure you that we will be able to competesuccessfully in the future against existing or new competitors, and increased competitionmay adversely aÅect our business.
Sales, Marketing and Technical Support
Our sales and marketing strategy is to achieve design wins at leading embeddedsystems companies in high-growth market segments. We market and sell our products inthe United States through a combination of direct regional sales managers, a nationaldistributor, and a network of independent manufacturers' representatives. We maintainUnited States direct sales oÇces in Baltimore, Boston, Chicago, Los Angeles, Raleighand Sunnyvale.
Outside the United States, we have engaged a team of manufacturers' representatives,stocking representatives and distributors to sell and market our products. Our internationalnetwork includes representatives in Australia, Belgium, Canada, Denmark, France,Germany, Hong Kong, Israel, Japan, Korea, Norway, Singapore, South Africa, Sweden,Taiwan, The Netherlands, and the United Kingdom. We maintain a direct sales oÇce inthe United Kingdom to service customers in Europe and the Middle East.
As of December 31, 1998, we employed 21 individuals in sales and marketing and 9in Ñeld and factory applications support. Sales in North America represented 66%, 78%and 79% of product revenues for 1998, 1997 and 1996, respectively. All sales to date havebeen denominated in U.S. dollars.
In 1998, sales to our exclusive United States distributor Unique Technologiesaccounted for 22% of our revenues, and sales to a European distributor, A2M, accountedfor 11% of our revenues. Revenues related to sales through distributors are expected tocontinue to account for a signiÑcant portion of our total revenues. See ""Risk Factors Ì ALarge Portion of Our Revenues Is Derived from Sales to Third-Party Distributors WhoMay Terminate Their Relationships with Us at Any Time.''
Net revenues through distributors accounted for approximately 49%, 56% and 41% ofour net revenues for 1998, 1997 and 1996, respectively. Sales to IBM directly or throughdistributors accounted for 13% of our revenues. In 1997, sales to no single customeraccounted for 10% or more of our total revenues.
Technical support to customers is provided through Ñeld and factory applicationsengineers, technical marketing personnel and, if necessary, product design engineers. LocalÑeld support is provided in person or by telephone. We also use our World Wide Web site
37

to provide product documentation and technical support information. We believe thatproviding customers with comprehensive product support is critical to remainingcompetitive in the markets we serve. In addition, our close contact with customer designengineers provides valuable input into existing product enhancements and next generationproduct speciÑcations.
Research and Development
Our future success will depend to a large extent on our ability to rapidly develop andintroduce new products and enhancements to our existing products that meet emergingindustry standards and satisfy changing customer requirements. We have made and expectto continue to make substantial investments in research and development and to participatein the development of new and existing industry standards.
Our research and development has been focused in three main areas: PCI I/Oaccelerators and I/O processors, hardware design kits and software development kits. Themajority of our engineers are involved in semiconductor device design and verification, withthe remaining engineers working on software and reference design hardware. Beforedevelopment of a new product commences, our marketing managers work closely withresearch and development engineers and customers to develop a comprehensive requirementsspecification. In addition, our marketing managers and engineers review the applicable industrystandards and incorporate desired changes into the new product specification. After theproduct is designed and commercially available, our engineers continue to work with variouscustomers on specific design issues to understand emerging requirements that may beincorporated into future product generations or product upgrades.
Our research and development expenditures totaled $6.6 million in 1998 and$4.2 million in 1997. Research and development expenses consist primarily of salaries andrelated costs of employees engaged in research, design, and development activities. Inaddition, expenses for outside engineering consultants and non-recurring engineering at ourindependent foundries are included in research and development expenses. As ofDecember 31, 1998, there were 31 employees engaged in research and development. Weperform our research and development activities at our headquarters in Sunnyvale,California. We are seeking to hire additional skilled development engineers, who arecurrently in short supply. Our business could be adversely aÅected if we encounter delaysin hiring additional engineers. See ""Risk Factors Ì Our Potential Future Acquisitions MayNot be Successful Because We Have Not Made Acquisitions in the Past.''
Our future performance depends on a number of factors, including our ability to identifyemerging technology trends in our target markets, define and develop competitive newproducts in a timely manner, enhance existing products to differentiate them from those ofcompetitors and bring products to market at competitive prices. The technical innovations andproduct development required for us to remain competitive are inherently complex and requirelong development cycles. We typically must incur substantial research and development costsbefore the technical feasibility and commercial viability of a product can be ascertained. Wemust also continue to make significant investments in research and development in order tocontinually enhance the performance and functionality of our products to keep pace withcompetitive products and customer demands for improved performance. Revenues from futureproducts or product enhancements may not be sufficient to recover the development costsassociated with these products or enhancements. The failure to successfully develop newproducts on a timely basis could have a material adverse effect on our business. See ""RiskFactors Ì Rapid Technological Change Could Make Our Products Obsolete.''
38

Manufacturing
We have adopted a ""fabless'' semiconductor manufacturing model and outsource allof our semiconductor manufacturing, assembly and testing. This approach allows us tofocus our resources on the design, development and marketing of products and signiÑcantlyreduces our capital requirements. We subcontract substantially all of our semiconductormanufacturing to Seiko-Epson Semiconductor in Japan and Taiwan SemiconductorManufacturing Corporation in Taiwan. In the second quarter of 1999, IBM will become anadditional manufacturing subcontractor for one of our principal new products. None of ourproducts is currently manufactured by more than one supplier, and all of our products areexpected to be single-source manufactured for the foreseeable future. We must placeorders two to four months in advance of expected delivery. We maintain inventory levelsbased on current lead times from foundries plus safety stock to account for anticipatedÖuctuations in demand. Our inventory comprises a major portion of our working capital.As a result, we have limited ability to react to Öuctuations in demand for our products,which could cause us to have an excess or a shortage of inventory of a particular productand reduced product revenues.
In the event of a loss of, or a decision by us to change, a key supplier or foundry,qualifying a new supplier or foundry and commencing volume production would likely involvedelay and expenses, resulting in lost revenues, reduced operating margins and possibledetriment to customer relationships. Since we place our orders on a purchase order basis anddo not have a long term volume purchase agreement with any of our existing suppliers, any ofthese suppliers may allocate capacity to the production of other products while reducingdeliveries to us on short notice. While we believe we currently have good relationships withour foundries and adequate capacity to support our current sales levels, there can be noassurance that adequate foundry capacity will be available in the future on acceptable terms, ifat all. See ""Risk Factors Ì We May Experience Shipment Delays and Increased Cost Due toOur Dependence on Independent Manufacturers.''
Our PCI devices are currently fabricated using a range of semiconductormanufacturing processes. We must continuously develop our devices using more advancedprocesses to remain competitive on a cost and performance basis. Migrating to newtechnologies is a challenging task requiring new design skills, methods and tools. Webelieve that the transition of our products to smaller geometries will be important for us toremain competitive. Our business could be materially adversely aÅected if any transition tonew processes is delayed or ineÇciently implemented. See ""Risk Factors Ì Defects in OurProducts Could Increase Our Costs and Delay Our Product Shipments.''
Intellectual Property
Our future success and competitive position depend upon our ability to obtain andmaintain the proprietary technology used in our principal products. Most of our currentproducts include implementations of the PCI and I2O industry standards, which areavailable to other companies. We currently have no patents on any of our PCI or I2Oproducts and rely instead on trade secret protection. We have two patents on technology inour other products that expire in September 2007 and September 2014. In the future, weplan to seek patent protection when we feel it is necessary.
Our existing or future patents may be invalidated, circumvented, challenged orlicensed to others. The rights granted thereunder may not provide competitive advantagesto us. In addition, our future patent applications may not be issued with the scope of theclaims sought by us, if at all. Furthermore, others may develop technologies that are
39

similar or superior to our technology, duplicate our technology or design around thepatents owned or licensed by us. In addition, eÅective patent, trademark, copyright andtrade secret protection may be unavailable or limited in foreign countries where we mayneed this protection. We cannot be sure that steps taken by us to protect our technologywill prevent misappropriation of our technology.
The semiconductor industry is characterized by vigorous protection and pursuit ofintellectual property rights or positions. This often results in signiÑcant and oftenprotracted and expensive litigation. There is no intellectual property litigation currentlypending against us. However, we may from time to time receive notiÑcations of claimsthat we may be infringing patents or other intellectual property rights owned by other thirdparties. If it is necessary or desirable, we may seek licenses under these third party patentsor intellectual property rights. However, we cannot be sure that licenses will be oÅered orthat the terms of any oÅered licenses will be acceptable to us.
The failure to obtain a license from a third party for technology used by us couldcause us to incur substantial liabilities and to suspend the manufacture or shipment ofproducts or our use of processes requiring the technology. Litigation could result insigniÑcant expenses to us, adversely aÅect sales of the challenged product or technologyand divert the eÅorts of our technical and management personnel, whether or not thelitigation is determined in our favor. In the event of an adverse result in any litigation, wecould be required to pay substantial damages, cease the manufacture, use, sale orimportation of infringing products, expend signiÑcant resources to develop or acquire non-infringing technology, and discontinue the use of processes requiring the infringingtechnology or obtain licenses to the infringing technology. We may not be successful in thedevelopment or acquisition, or the necessary licenses may not be available underreasonable terms, and any development, acquisition or license could require expendituresby us of substantial time and other resources. Any of these developments would have amaterial adverse eÅect on our business. See ""Risk Factors Ì Our Limited Ability toProtect Our Intellectual Property and Proprietary Rights Could Adversely AÅect OurCompetitive Position.''
Facilities
We lease two adjacent facilities in Sunnyvale, California, which have approximately20,000 square feet and 15,000 square feet pursuant to two leases which expire in February2001 and November 2004, respectively. These two facilities comprise our headquarters andinclude our research and development, sales and marketing and administrationdepartments. We believe that our current facilities will be adequate through 1999.
Employees
As of December 31, 1998, we employed a total of 71 full-time employees, including31 engaged in research and development, 30 engaged in sales and marketing, 4 engaged inmanufacturing operations and 6 engaged in general administration activities. We also fromtime to time employ part-time employees and hire contractors. Our employees are notrepresented by any collective bargaining agreement, and we have never experienced a workstoppage. We believe that our employee relations are good.
Backlog
PLX's backlog at any particular date is not necessarily indicative of actual sales forany succeeding period. This results from expected changes in product delivery schedules
40

and cancellation of product orders. In addition, PLX's sales will often reÖect ordersshipped in the same quarter that they are received.
Legal Proceedings
We may from time to time be a party to litigation matters incidental to the conductof our business. As of the date of this prospectus, there is no pending or threatened legalproceeding to which we are a party.
41

MANAGEMENT
Executive OÇcers and Directors
Our executive oÇcers and directors, their ages and their positions as of December 31,1998, are as follows:
Name Age Position
Michael J. SalamehÏÏÏÏÏÏÏÏÏÏÏÏÏÏ 44 President and DirectorKenyon Mei, Ph.D. ÏÏÏÏÏÏÏÏÏÏÏÏÏÏ 53 Vice President, EngineeringScott M. GibsonÏÏÏÏÏÏÏÏÏÏÏÏÏÏÏÏÏ 40 Vice President, Finance, Chief Financial
OÇcer and SecretaryMark R. Easley ÏÏÏÏÏÏÏÏÏÏÏÏÏÏÏÏÏ 43 Vice President, MarketingMichael A. Hopwood ÏÏÏÏÏÏÏÏÏÏÏÏ 36 Vice President, Worldwide SalesWilliam E. Hart ÏÏÏÏÏÏÏÏÏÏÏÏÏÏÏÏÏ 46 Vice President, OperationsD. James Guzy, Sr.(1)(2) ÏÏÏÏÏÏÏÏ 62 Chairman of the Board of DirectorsEugene Flath(2) ÏÏÏÏÏÏÏÏÏÏÏÏÏÏÏÏ 61 DirectorTimothy Draper(1) ÏÏÏÏÏÏÏÏÏÏÏÏÏÏ 40 DirectorYoung K. Sohn(3) ÏÏÏÏÏÏÏÏÏÏÏÏÏÏ 42 Nominee DirectorJohn H. Hart(4) ÏÏÏÏÏÏÏÏÏÏÏÏÏÏÏÏ 53 Nominee Director
(1) Member of the Audit Committee.
(2) Member of the Compensation Committee.
(3) Mr. Sohn has agreed to be nominated as director and is expected to be elected to theBoard of Directors immediately after the closing of the oÅering.
(4) Mr. Hart has agreed to be nominated as director and is expected to be elected to theBoard of Directors immediately after the closing of the oÅering.
Michael J. Salameh co-founded PLX and has served as our President and as amember of the Board of Directors since PLX's inception in May 1986. From 1980 through1986, Mr. Salameh was employed in various marketing management positions withHewlett-Packard Company. Mr. Salameh received a B.S. in Engineering and AppliedScience from Yale University and an M.B.A. from Harvard Business School.
Kenyon Mei, Ph.D., has served as our Vice President of Engineering since joining usin August 1997. From 1985 through August 1997, Dr. Mei held various senior levelexecutive positions with Cirrus Logic, Inc., a semiconductor company, including GeneralManager of the Personal Systems Division from 1992 through July 1997 and Senior VicePresident of Engineering from 1985 through 1991. Dr. Mei received a B.S. and an M.S. inElectrical Engineering from the University of California, Davis and a Ph.D. in ElectricalEngineering from Stanford University.
Scott M. Gibson has served as our Vice President of Finance and Chief FinancialOÇcer since joining us in October 1997. Mr. Gibson was employed by YieldUPInternational Corporation, a semiconductor equipment manufacturer, as Vice President andChief Financial OÇcer from September 1995 through March 1997. Mr. Gibson served asVice President of Customer Service for Tencor Instruments, a semiconductor equipmentmanufacturer, from April 1994 through June 1995. Mr. Gibson was employed byPrometrix Corporation, a semiconductor equipment manufacturer, as Vice President andChief Financial OÇcer from April 1992 until its merger with Tencor Instruments in
42

February 1994. Mr. Gibson received a B.S. in Industrial Engineering from Iowa StateUniversity and an M.B.A. from the University of Michigan Business School.
Mark R. Easley has served as our Vice President of Marketing since March 1996.From October 1993 through March 1996, he owned Mission Research EnterprisesTechnical Sales, a manufacturers' representative company. From March 1986 throughOctober 1993, Mr. Easley held various positions at Adaptec, Inc., a semiconductorcompany including Director of Sales for Asia-PaciÑc and Japan from July 1988 throughOctober 1993 and Strategic Marketing Manager from March 1986 through June 1988.Mr. Easley is also a director of Sebring Systems, Inc. Mr. Easley received a B.S. inComputer Science from Purdue University.
Michael A. Hopwood has served as our Vice President of Worldwide Sales since 1995.From 1989 to 1995, he held a variety of other sales management positions with ourCompany. From 1984 until 1989, Mr. Hopwood held various sales positions at IntelCorporation, a semiconductor manufacturer. Mr. Hopwood received a B.S. in PhysicsEngineering from PaciÑc Lutheran University.
William E. Hart has served as our Vice President of Operations since January 1996.Between July 1993 and January 1996, he served as our Operations Manager andController. From January 1992 to June 1993, Mr. Hart was employed by Euphonix Inc., adigital audio equipment company, as its production manager. From November 1982through December 1991, Mr. Hart was employed as a manufacturing manager for NTXCommunications, a computer company. Mr. Hart received a B.A. from St. Mary's Collegeand a Masters degree in Public Administration from California State University, Hayward.
D. James Guzy, Sr. has been a director of PLX since 1986. Mr. Guzy is theChairman, President and CEO of SRC Computer Corporation, a developer of super-computer systems. Since 1969, he has also served as the President of the Arbor Company,a limited partnership involved in the electronics and computer industry. Mr. Guzy is also adirector of Cirrus Logic, Inc., Intel Corporation, Micro Component Technology, Inc.,Novellus Systems, Inc., Davis Selected Group of Mutual Funds and Alliance CapitalManagement Technology Fund, and a member of the board of directors of several privatetechnology companies, including Sebring Systems. Mr. Guzy received a B.S. from theUniversity of Minnesota and an M.S. from Stanford University.
Eugene Flath has been a director of PLX since May 1989. Mr. Flath has been aGeneral Partner of Associated Venture Investors since February 1988 and a SpecialGeneral Partner of Applied Technology Investors since July 1994. Mr. Flath also serves onthe board of directors of several private companies. Mr. Flath received a B.S. in ElectricalEngineering and a B.S. in Naval Science from the University of Wisconsin and an M.S. inElectrical Engineering from the University of New Hampshire.
Timothy Draper has been a director of PLX since 1986. Mr. Draper has been aManaging Director of Draper Fisher Jurvetson, an investment company since 1992.Mr. Draper managed Draper Associates LP from 1986 to 1992. Mr. Draper received aB.S. in Electrical Engineering from Stanford University and an M.B.A. from HarvardBusiness School.
Young K. Sohn will become a member of our Board of Directors immediately aftercompletion of the oÅering. Mr. Sohn is currently serving as CEO of Oak Technology, asemiconductor manufacturer. From 1992 until March 1999, Mr. Sohn held variousexecutive management positions at Quantum Corporation, a disk drive manufacturer,
43

including President of the Hard Disk Drive Business. Prior to joining Quantum, Mr. Sohnwas employed for nine years at Intel as a Marketing and Sales Executive and Director ofWorldwide Channel Marketing in Intel's Reseller Channel organization. Mr. Sohn receiveda B.S. in Electrical Engineering from the University of Pennsylvania and an M.B.A. fromMIT's Sloan School of Management.
John H. Hart will become a member of our Board of Directors immediately aftercompletion of the oÅering. Mr. Hart has been Senior Vice President and Chief TechnicalOÇcer of 3Com Corporation since August 1996. From the time Mr. Hart joined 3Com inSeptember 1990 until July 1996, he was Vice President and Chief Technical OÇcer. Priorto joining 3Com, Mr. Hart worked for Vitalink Communications Corporation for sevenyears, where his most recent position was Vice President of Network Products.
OÇcers are appointed by the Board of Directors. Our Bylaws provide that the Boardof Directors shall consist of Ñve members. Directors are elected at our annual generalmeeting of stockholders by a vote of the holders of a majority of the voting powerrepresented at the meeting. A director may be re-elected for subsequent terms.
Board Committees
The Compensation Committee of the Board of Directors reviews and makesrecommendations to the Board regarding our compensation policies and all forms ofcompensation to be provided to our executive oÇcers and directors, including annualsalaries and bonuses and stock option and other incentive compensation arrangements. Inaddition, the Compensation Committee reviews bonus and stock compensationarrangements for all our other employees. The Compensation Committee also administersour 1998 Stock Incentive Plan and 1999 Stock Incentive Plan. The current members ofthe Compensation Committee are Messrs. Flath and Guzy.
The Audit Committee of the Board of Directors reviews and monitors our corporateÑnancial reporting and external audits, including our internal control functions, the resultsand scope of the annual audit and other services provided by our independent auditors andour compliance with legal matters that have a signiÑcant impact on our Ñnancial reports.The Audit Committee also consults with our management and our independent auditorsprior to the presentation of Ñnancial statements to stockholders and, as appropriate,initiates inquiries into aspects of our Ñnancial aÅairs. In addition, the Audit Committee hasthe responsibility to consider and recommend the appointment of, and to review feearrangements with, our independent auditors. The current members of our AuditCommittee are Messrs. Draper and Guzy.
Director Compensation and Other Arrangements
Non-employee directors of PLX receive for their service as directors cashcompensation in the amount of $4,000 upon election at the annual stockholders meetingand $2,000 for each Board meeting that they attend. In addition, each new non-employeedirector will receive an option to purchase 15,000 shares of our common stock upon joiningthe Board of Directors. Each incumbent non-employee director who has served on theBoard for at least eleven months will be granted an option to purchase an additional5,000 shares of our common stock after each annual stockholders' meeting. All options areimmediately exercisable upon grant. See ""Stock Option Plans Ì 1999 Stock IncentivePlan.''
44

Compensation Committee Interlocks and Insider Participation
The Board of Directors established a Compensation Committee in July 1990. TheCompensation Committee is currently comprised of Messrs. Flath and Guzy. Neither ofthese individuals were at any time since the formation of PLX an executive oÇcer oremployee of PLX. Prior to the establishment of the Compensation Committee, alldecisions relating to executive compensation were made by the Board. For a description ofthe transactions between PLX and members of the Compensation Committee and entitiesaÇliated with the Compensation Committee members, see ""Transactions Between PLXand its OÇcers, Directors or SigniÑcant Stockholders.'' None of our executive oÇcersserves as a member of the board of directors or compensation committee of any entitywhich has one or more executive oÇcers serving as a member of our Board of Directors orCompensation Committee.
No Employment Contracts
None of our executive oÇcers has an employment agreement with PLX.
Executive Compensation
The following table provides summary information concerning the compensationearned by our chief executive oÇcer and our next four most highly compensated executiveoÇcers in the Ñscal year ended December 31, 1998, whose salary and bonus exceeded$100,000 for services rendered in all capacities to PLX and our subsidiary during thatÑscal year. This includes bonus amounts in the Ñscal year earned, rather than in the Ñscalyear in which each bonus amount was paid. All stock options were granted pursuant to the1998 Stock Incentive Plan.
Summary Compensation Table
Long-TermCompensation
Annual Compensation Awards
Shares UnderlyingName and Principal Position Salary Bonus Options
Michael J. SalamehPresident ÏÏÏÏÏÏÏÏÏÏÏÏÏÏÏÏÏÏÏÏÏÏÏÏÏÏÏÏÏÏÏ $144,000 $101,258 150,000
Kenyon Mei, Ph.D.Vice President, Engineering ÏÏÏÏÏÏÏÏÏÏÏÏÏÏÏ 210,000 87,202 0
Mark R. EasleyVice President, Marketing ÏÏÏÏÏÏÏÏÏÏÏÏÏÏÏÏ 138,000 109,407 65,000
Michael A. HopwoodVice President, Worldwide Sales ÏÏÏÏÏÏÏÏÏÏÏ 124,000 96,953 25,000
Scott M. GibsonVice President, FinanceÏÏÏÏÏÏÏÏÏÏÏÏÏÏÏÏÏÏÏ 120,000 48,923 30,000
45

The following table sets forth information concerning grants of options to purchaseshares of our common stock to each of the following oÇcers during Ñscal 1998. In eachcase, the options vest pursuant to a four-year schedule. Under this schedule, on the Ñrstanniversary of the date of grant, 25% of the total options granted vest. Thereafter, 2.083%of the total options granted vest each month.
Option Grants in Fiscal 1998
Potential Realizable ValuePercent ofat Assumed Annual RatesNumber of Total Options
of Stock PriceSecurities Granted toAppreciation for OptionUnderlying Employees in Exercise
Term(4)Options Fiscal Year Price Per Expiration
Name Granted 1998(1) Share(2) Date(3) 5% 10%
Michael J. Salameh ÏÏÏÏ 150,000 22.79% $5.00 01/20/08 $471,671 $1,195,307Kenyon Mei, Ph.D. ÏÏÏÏ Ì Ì Ì Ì Ì ÌMark R. EasleyÏÏÏÏÏÏÏÏ 65,000 9.87 5.00 01/20/08 204,391 517,966Michael A. HopwoodÏÏÏ 25,000 3.80 5.00 01/20/08 78,612 199,218Scott M. Gibson ÏÏÏÏÏÏÏ 30,000 4.56 5.00 01/20/08 94,334 239,061
(1) In Ñscal year 1998, we granted options to employees to purchase an aggregate of658,250 shares.
(2) Each of these options was granted pursuant to our 1998 Plan and is subject to theterms of such plan as described below. These options were granted at an exerciseprice equal to the fair market value of our common stock as determined by our Boardof Directors on the date of the grant. The Board of Directors based this determinationon our operating results and Ñnancial condition and the valuations of comparablepublic companies in the semiconductor industry.
(3) Options may terminate before their expiration dates if the optionee's status as anemployee or consultant is terminated or upon the optionee's death or disability.
(4) The 5% and 10% assumed annual rates of compounded stock price appreciation aremandated by rules of the Securities and Exchange Commission and do not representour estimate or projection of our future common stock prices.
Stock Option Plans
1986 Restricted Stock Purchase Program
On May 7, 1986, our Board of Directors approved a form of Restricted StockPurchase Agreement to be used to sell restricted shares of our common stock to ouremployees, oÇcers and consultants. There was no formal, written plan. From time to time,the Board of Directors reserved shares of our common stock for grant under the program.At December 31, 1998, a total of 4,402,060 restricted shares were issued and outstandingpursuant to the program. The shares were issued at fair market value as determined by theBoard of Directors. The repurchase price of the restricted shares is the original sales price.The shares are subject to a repurchase option in favor of PLX that expires over a period offour years from the date of issuance. On the Ñrst anniversary of the date of issuance, thenumber of shares subject to the repurchase option is reduced by 25%; and each monththereafter, the number of shares subject to the repurchase option is reduced by 2.083% ofthe total restricted shares issued.
46

As consideration for the issuance of these restricted shares, each of the purchasers haspaid 20% of the aggregate purchase price of the restricted shares issued to him in cash andhas executed a promissory note for the remaining 80% of the aggregate purchase price.These notes bear interest at a rate of 6% per annum and become due and payable uponthe earlier of four years from the date of issuance or the eÅectiveness of a registrationstatement pursuant to which the subject securities may be oÅered and sold by suchpurchasers; provided, however, that in the event the oÇcers are restricted by the terms ofmarket stand-oÅ agreements relating to the securities, amounts that would become dueunder the notes upon such registration are reduced to the amount that would be coveredby sale of shares allowed to be sold. Each of the directors and oÇcers that has purchasedrestricted shares has executed a market stand-oÅ agreement, which prevents such oÇcersand directors from selling our securities for a period of at least 150 days following ourissuance of securities pursuant to an underwritten oÅering. Thus, they will not be requiredto pay the notes until at least 150 days after the oÅering. The due dates of the loans didnot extend past the repurchase option of PLX. The notes are full recourse and, in addition,each of the purchasers has pledged the restricted shares as collateral to secure theobligations under his note. The program was terminated upon adoption of our 1998Incentive Stock Plan on January 15, 1998.
1998 Stock Incentive Plan
Our 1998 Stock Incentive Plan was approved by the Board of Directors onJanuary 15, 1998 and by our stockholders on June 22, 1998. The 1998 Plan provides forthe grant of options intended to qualify as ""incentive stock options'' under Section 422 ofthe Internal Revenue Code of 1986, as amended, and nonqualiÑed stock options. As ofMarch 31, 1999, a total of 1,500,000 shares of our common stock have been reserved forissuance under the 1998 Plan. As of December 31, 1998, no shares of our common stockhad been issued upon exercise of options granted under the 1998 Plan, options to purchase645,250 shares were outstanding, and 154,750 shares remained available for future grant.In 1999, our Board of Directors approved the grant of options to purchase an aggregate of734,250 shares of our common stock. The Board of Directors or a committee designatedby the Board has the power, subject to the limitations contained in the 1998 Plan, toprescribe the terms and conditions of any option granted under the 1998 Plan, includingthe total number of shares to be oÅered to each optionee. The maximum term of anystock option granted under the 1998 Plan is ten years, except that with respect to incentivestock options granted to a person possessing more than 10% of the combined voting powerof PLX, the term of these stock options shall be for no more than Ñve years. The exerciseprice of incentive stock options granted under the 1998 Plan must be at least 100% of thefair market value of our common stock on the grant date except that the exercise price ofincentive stock options granted to a 10% stockholder must be at least 110% of the fairmarket value on the date of grant. The aggregate fair market value on the date of grant ofour common stock for which incentive stock options are exercisable for the Ñrst time by anemployee during any calendar year may not exceed $100,000. In the event of a change ofcontrol of PLX, all of the options granted under the 1998 Plan will terminate unlessassumed or substituted or except as provided otherwise in an individual option agreement.The Board of Directors may amend the 1998 Plan at any time, except to the extent thatstockholder approval is required. The 1998 Plan will terminate in January 2008, unlessterminated earlier by the Board of Directors.
47
1999 Stock Incentive Plan
Our 1999 Stock Incentive Plan was approved by the Board of Directors onJanuary 15, 1999 and by our stockholders in March 1999, eÅective as of the eÅective dateof the oÅering. The 1999 Plan permits the grant of securities of PLX, including optionsintended to qualify as ""incentive stock options'' under Section 422 of the Code, andnonqualiÑed stock options to employees, oÇcers, directors, independent contractors andconsultants; provided, however that incentive stock options may be granted only to ouremployees. Initially 1,000,000 shares of common stock were reserved for issuance inconnection with the grant of options under the 1999 Plan. As of January 31, 1999 nooptions had been awarded under the 1999 Plan.
The Board of Directors or a committee designated by the Board is authorized toadminister the 1999 Plan, including the selection of persons to whom options may begranted and the interpretation and implementation of the 1999 Plan. Options granted underthe 1999 Plan will vest and become exercisable as determined by the Board or thecommittee at the time of the option grant. The term of each option will be as determinedby the Board or the committee; provided, however, that the maximum term of an optiongranted under the 1999 Plan is ten years or Ñve years in the case of an incentive stockoption granted to a 10% stockholder. The aggregate fair market value, on the date of grant,of our common stock for which incentive stock options are exercisable for the Ñrst time byan employee during any calendar year may not exceed $100,000. The exercise price ofeach option granted under the 1999 Plan shall not be less than the fair market value of ourcommon stock on the date of grant or not less than 110% of fair market value in the caseof an incentive stock option granted to a 10% stockholder. In the event there is a changeof control of PLX under the 1999 Plan, all of the options granted under the 1999 Plan willterminate unless assumed or substituted or except as provided otherwise in an individualoption agreement. The 1999 Plan may be amended at any time by the Board of Directors,except to the extent that stockholder approval is required. The 1999 Plan will terminate inJanuary 2009, unless earlier terminated by the Board.
Pursuant to the authority granted by the 1999 Plan, the Administrator has adopted,concurrently with the approval of the 1999 Plan, the 1999 Non-Employee Director OptionProgram. Shares issued under the Non-Employee Director Plan will come from the1,000,000 shares of common stock reserved for issuance pursuant to the 1999 Plan. TheNon-Employee Director Program provides for the grant of non-qualiÑed stock options tonon-employee directors upon election or appointment to the Board of Directors and forannual non-qualiÑed stock option grants thereafter. See ""Management Ì DirectorCompensation and Other Arrangements.''
Limitation of Liability and IndemniÑcation Matters
Our CertiÑcate of Incorporation limits the liability of directors to the maximum extentpermitted by Delaware law. Delaware law provides that a director of a corporation will notbe personally liable for monetary damages for breach of the director's Ñduciary duties as adirector except for liability
‚ for any breach of the director's duty of loyalty to PLX or to its stockholders,
‚ for acts or omissions not in good faith or that involve intentional misconduct or aknowing violation of law,
48

‚ for unlawful payments of dividends or unlawful stock repurchases as provided inSection 174 of the Delaware General Corporation Law or
‚ for any transaction from which a director derives an improper personal beneÑt.
Our Bylaws provide that PLX shall indemnify its directors and executive oÇcers andmay indemnify its oÇcers, employees and other agents to the full extent permitted by law.We believe that indemniÑcation under our Bylaws covers at least negligence and grossnegligence on the part of an indemniÑed party. Our Bylaws also permit us to advanceexpenses incurred by an indemniÑed party in connection with the defenses of any action orproceeding arising out of the indemniÑed party's status or service as a director, oÇcer oremployee or other agent of PLX upon an undertaking by the indemniÑed party to repaythe advances if it is ultimately determined that the indemniÑed party is not entitled toindemniÑcation.
We have entered into separate indemniÑcation agreements with each of our directorsand oÇcers. These agreements require us, among other things, to indemnify the director oroÇcer, against expenses, judgments, Ñnes and settlements paid by the individual inconnection with any action, suit or proceeding arising out of the individual's status orservice as a director or oÇcer of PLX, other than Liabilities arising from willfulmisconduct or conduct that is knowingly fraudulent or deliberately dishonest. Theseagreements also require us to advance expenses incurred by the individual in connectionwith any proceeding against the individual with respect to which the individual may beentitled to indemniÑcation by PLX. We believe that our CertiÑcate of Incorporation andBylaw provisions and indemniÑcation agreements are necessary to attract and retainqualiÑed persons as directors and oÇcers. We also maintain directors' and oÇcers' liabilityinsurance.
At present we are not aware of any pending litigation or proceeding involving anydirector, oÇcer, employee or agent of PLX in which indemniÑcation will be required orpermitted. We are not aware of any threatened litigation or proceeding that might result ina claim for indemniÑcation.
49
TRANSACTIONS BETWEEN PLX AND ITS OFFICERS, DIRECTORS,OR SIGNIFICANT STOCKHOLDERS
Sale of Restricted Stock to Executive OÇcers
We have entered into Employee Stock Purchase Agreements with each of theexecutive oÇcers listed below which provide for the sale of shares of restricted PLXcommon stock to these executive oÇcers subject to a repurchase option on behalf of PLX.The repurchase price of the restricted stock is the original sales price. Except as notedbelow, the number of shares subject to each repurchase option is reduced according to ourstandard vesting schedule. As consideration for the issuance of this restricted stock, each ofthe oÇcers has paid 20% of the aggregate purchase price of the restricted stock issued tohim in cash and has executed a promissory note for the remaining 80% of the aggregatepurchase price. The notes contain the standard terms for all notes issued in connectionwith the issuance of Restricted Stock.
PrincipalPurchase Number of Price per Amount of
Name Date Shares Share Note Note Due
Kenyon Mei ÏÏÏÏÏÏÏÏÏÏÏÏÏÏ 08/01/1997 350,000 $0.15 $42,000 08/01/2001Michael A. Hopwood ÏÏÏÏÏÏ 03/15/1996 46,000(1) $0.15 $ 5,520 03/15/2000
08/01/1997 35,000 $0.15 $ 4,200 08/01/2001Scott M. Gibson ÏÏÏÏÏÏÏÏÏÏ 11/01/1997 110,000 $0.30 $26,400 10/14/2001William E. HartÏÏÏÏÏÏÏÏÏÏÏ 03/15/1996 43,000(2) $0.15 $ 5,160 03/15/2000
08/01/1997 25,000(2) $0.15 $ 3,000 08/01/2001Mark R. Easley ÏÏÏÏÏÏÏÏÏÏÏ 03/11/1996 75,000 $0.15 $ 9,000 03/11/2000
03/31/1997 70,000 $0.15 $ 8,400 06/01/200008/01/1997 40,000(3) $0.15 $ 4,800 08/01/2001
(1) These shares vest as follows:
‚ on March 15, 1997, the number of shares subject to a repurchase option wasreduced by 9,000 shares;
‚ each month thereafter until March 15, 1998, the number of shares subject to therepurchase option was reduced by 750 shares; and
‚ each month thereafter until March 15, 2000, the number of shares subject to therepurchase option is reduced by 1,166.67 shares.
(2) These shares vest as follows:
‚ on March 15, 1997, the number of shares subject to a repurchase option wasreduced by 8,000 shares;
‚ on March 15, 1998, the number of shares subject to the repurchase option wasreduced by 750 shares; and
‚ each month thereafter until March 15, 2000, the number of shares subject to therepurchase option is reduced by 1,083.33 shares.
The 25,000 shares issued to Mr. Hart on August 1, 1997 are restricted and vest asfollows:
‚ on each of August 1, 1998, 1999 and 2000, the number of shares subject to therepurchase option is reduced by 5,000 shares; and
‚ on August 1, 2001, the number of shares subject to the repurchase option isreduced by 10,000 shares.
50
(3) These shares vest as follows:
‚ on August 1, 1998, the number of shares subject to a repurchase option is reducedby 6,000 shares; and
‚ thereafter, the number of shares subject to the repurchase option is reducedmonthly in the aggregate annual amounts of 6,000 shares in each of the nexttwo years and 22,000 shares in the remaining year of vesting.
Grant of Stock Options to Executive OÇcers
Options to purchase the following amounts of shares were granted to our executiveoÇcers in 1998 under the 1998 Plan:
‚ Michael J. Salameh, 150,000 shares,
‚ Mark R. Easley, 65,000 shares,
‚ Michael A. Hopwood, 25,000 shares,
‚ Scott Gibson, 30,000 shares, and
‚ William E. Hart, 15,000 shares.
All of these options were issued with an exercise price equal to $5.00 per share and vest,in the case of Michael J. Salameh, over a period of forty-eight (48) months and, in the caseof the other executive officers, over a period of thirty-six (36) months, from the date of grant.
Additionally, in January 1999, the Board of Directors approved options to purchasethe following amounts of shares to our executive oÇcers under the 1998 Plan with anexercise price per share equal to the initial public oÅering price:
‚ Michael J. Salameh, 163,000 shares,
‚ Mark R. Easley, 100,000 shares,
‚ Michael A. Hopwood, 80,000 shares,
‚ Scott Gibson, 40,000 shares, and
‚ William E. Hart, 40,000 shares.
All of these options were approved by the Board of Directors effective upon theoffering. All options are immediately exercisable. Exercised shares are subject to vesting atthe rate of 25% of the shares granted on the first anniversary of the grant and monthlythereafter.
Investment in Sebring Systems
On June 18, 1997, we purchased a total of 892,857 shares of Series A Preferred Stockof Sebring Systems, Inc., a New York corporation, for an aggregate purchase price of$100,000. Immediately following the investment, PLX held approximately 3.9% of theoutstanding shares of Sebring. Also, three related parties purchased a total of 22.06% ofthe then outstanding shares of Sebring for an aggregate purchase price of $560,000. Therelated parties are:
‚ Arbor Company, a PLX stockholder, of which D. James Guzy, Sr., a director ofPLX, is a general partner,
‚ Draper Associates, L.P., a PLX stockholder, of which Timothy Draper, a director ofPLX, is a general partner, and
‚ Eugene J. Flath, a director of PLX.
Pursuant to the terms of the purchase and sale documents relating to the aboveinvestment, D. James Guzy, Sr. was elected as a director and Chairman of the Board ofDirectors of Sebring.
51

PRINCIPAL STOCKHOLDERS
The following table sets forth information regarding beneÑcial ownership of ourcommon stock as of December 31, 1998, and as adjusted to reÖect the sale of shares inthis oÅering. It shows ownership by:
‚ each person (or group of aÇliated persons) who is known by us to own beneÑciallymore than Ñve percent of the outstanding shares of our common stock,
‚ our chief executive oÇcer and our next four most highly compensated executiveoÇcers in the Ñscal year ended December 31, 1998,
‚ each of our directors, and
‚ all current oÇcers and directors as a group.
In the table below, the amounts set forth in the column entitled ""Number of SharesBeneÑcially Owned'' include shares set forth in the column titled ""Number of SharesBeneÑcially Owned as a Result of Options Exercisable Within 60 days of the Date of thisProspectus.'' Percentage of beneÑcial ownership is based upon 18,365,551 shares ofcommon stock outstanding prior to this oÅering and 21,665,551 shares of our commonstock outstanding after this oÅering, as of December 31, 1998 and assuming no exercise ofthe underwriters' overallotment option.
Number of SharesBeneÑcially Owned
as a Result ofPercentage ofOptions Exercisable
Shares Outstanding5% BeneÑcial Owners, Directors, Within 60 Days ofNominees for Director, Named Number of Shares the Date of Before the After theOÇcers BeneÑcially Owned this Prospectus OÅering OÅering
Eugene Flath(1) ÏÏÏÏÏÏÏÏÏÏÏÏ 2,579,826 Ì 14.1% 11.9%AVI II ÏÏÏÏÏÏÏÏÏÏÏÏÏÏÏÏÏÏÏÏ 2,313,978 Ì 12.6 10.7
1 First Street #2Los Altos, CA 94022
Timothy Draper(2)ÏÏÏÏÏÏÏÏÏÏ 2,084,460 Ì 11.4 9.6Arbor CompanyÏÏÏÏÏÏÏÏÏÏÏÏÏ 1,955,436 Ì 10.7 9.0
P.O. Box 128Glenbrook, NV 89413
D. James Guzy, Sr.(3)ÏÏÏÏÏÏÏ 1,955,436 Ì 10.7 9.0Draper Associates ÏÏÏÏÏÏÏÏÏÏÏ 1,656,294 Ì 9.0 7.7
400 Seaport Court,Suite 250
Redwood City, CA 94063Wei-Ti LiuÏÏÏÏÏÏÏÏÏÏÏÏÏÏÏÏÏ 966,021 Ì 5.3 4.5Michael J. Salameh ÏÏÏÏÏÏÏÏÏ 961,483 313,000(4) 5.2 4.4Kenyon Mei, Ph.D.ÏÏÏÏÏÏÏÏÏÏ 350,000 Ì 1.9 1.6Mark R. Easley ÏÏÏÏÏÏÏÏÏÏÏÏÏ 350,000 165,000(5) 1.9 1.6Michael S. Hopwood ÏÏÏÏÏÏÏÏ 240,000 105,000(6) 1.3 1.1Scott M. Gibson ÏÏÏÏÏÏÏÏÏÏÏÏ 180,000 70,000(7) 1.0 *Young K. Sohn ÏÏÏÏÏÏÏÏÏÏÏÏÏ 15,000 15,000(8) * *John H. Hart ÏÏÏÏÏÏÏÏÏÏÏÏÏÏÏ 15,000 15,000(8) * *All directors, nominees for
director and executiveoÇcers as a group(11 persons) ÏÏÏÏÏÏÏÏÏÏÏÏÏ 8,911,205 738,000 47.8% 41.1%
52
* Less than one percent.
(1) Includes
‚ 2,313,978 shares held by AVI II and 39,423 shares held by AVI PGF which areinvestments managed by AVI Management Partners II of which Mr. Flath is aGeneral Partner; and
‚ 75,027 shares held by AVI Partners II NV and 151,398 shares held by AVIPartners NV which are investments managed by AVI Management Partners ofwhich Mr. Flath is a special limited partner. Mr. Flath disclaims beneÑcialownership of these shares except for his proportional interest therein.
(2) Includes 1,656,294 shares held by Draper Associates L.P. of which DraperAssociates, Inc. is the General Partner. Mr. Draper is the President of DraperAssociates, Inc. Also includes 85,326 shares held by JABE LLC of which Mr. Draperis a member and 342,840 shares held in trust for Mr. Draper's minor children.
(3) Includes 1,955,436 shares held by Arbor Company of which Mr. Guzy, Sr. isPresident.
(4) Includes an option to purchase 163,000 shares which will be eÅective as of the date ofthis oÅering. The option will be immediately exercisable, but the shares will besubject to four-year vesting.
(5) Includes an option to purchase 100,000 shares which will be eÅective as of the date ofthis oÅering. The option will be immediately exercisable, but the shares will besubject to four-year vesting.
(6) Includes an option to purchase 80,000 shares which will be eÅective as of the date ofthis oÅering. The option will be immediately exercisable, but the shares will besubject to four-year vesting.
(7) Includes an option to purchase 40,000 shares which will be eÅective as of the date ofthis oÅering. The option will be immediately exercisable, but the shares will besubject to four-year vesting.
(8) Includes an option to purchase 15,000 shares. The option is immediately exercisable.
53
DESCRIPTION OF CAPITAL STOCK
Authorized and Outstanding Capital Stock
Our authorized capital stock consists of 30,000,000 shares of common stock, par value$0.001 per share, and 5,000,000 shares of preferred stock, par value $0.001 per share.Upon consummation of this oÅering, no shares of preferred stock and 21,665,551 shares ofcommon stock, or 22,160,551 shares if the underwriters' over-allotment option is exercisedin full, will be outstanding. The following summary is qualiÑed in its entirety by referenceto our CertiÑcate of Incorporation and Bylaws, copies of which are Ñled as exhibits to theRegistration Statement of which this prospectus is a part.
Under our 1998 Stock Incentive Plan, 1,500,000 shares of common stock have beenreserved for issuance. Options to purchase 645,250 shares were outstanding as ofDecember 31, 1998. In 1999, our Board of Directors approved the grant of options topurchase 734,250 shares of our common stock under our 1998 Stock Incentive Plan.Further, 1,000,000 shares of our common stock have been reserved for issuance under our1999 Stock Incentive Plan, under which no options were outstanding as of December 31,1998.
Common Stock
As of December 31, 1998, there were 18,365,551 shares of our common stockoutstanding held of record by approximately 123 stockholders, including 13,738,908 sharesthat will be issued upon the automatic conversion of the outstanding shares of ourpreferred stock into common stock upon the closing of the oÅering. As of December 31,1998, 800,000 shares of our common stock were reserved for issuance pursuant to ourStock Option Plans. In 1999, the Board of Directors approved an increase to1,500,000 shares. In January 1999, the Board of Directors approved the 1999 Plan underwhich 1,000,000 shares of our common stock are reserved for issuance. Upon completionof the oÅering, there will be 21,665,551 shares of common stock outstanding.
Pursuant to our CertiÑcate of Incorporation, the holders of our common stock areentitled to one vote per share on all matters to be voted upon by the stockholders.However, until, but not including the Ñrst annual meeting of stockholders following theannual meeting of stockholders when PLX shall have had at least 800 stockholders, thestockholders will have cumulative voting rights in the election of directors. If anystockholder has properly requested cumulative voting, each stockholder may cumulate his,her or its votes and give one candidate a number of votes equal to the number of directorsto be elected multiplied by the number of votes to which the stockholder's shares arenormally entitled. The stockholder may also distribute the votes on the same principleamong as many candidates as the stockholder thinks Ñt. Thereafter, holders of more than50% of the shares voting will be able to elect all of the directors. Subject to preferencesthat may be applicable to any of our outstanding preferred stock, the holders of ourcommon stock are entitled to receive ratably such dividends, if any, as may be declaredfrom time to time by the Board of Directors out of funds legally available therefor. See""Dividend Policy.''
In the event of liquidation, dissolution or winding up of PLX, the holders of ourcommon stock are entitled to share ratably in all assets remaining after payment ofliabilities, subject to prior distribution rights of preferred stock, if any, then outstanding.
54
Our common stock has no preemptive or conversion rights or other subscription rights.There are no redemption or sinking fund provisions applicable to our common stock. Alloutstanding shares of our common stock are fully paid and nonassessable, and the shares ofour common stock to be issued upon completion of this oÅering will be fully paid andnonassessable.
Preferred Stock
As of the closing of this oÅering, no shares of our preferred stock will be outstanding.EÅective at the closing of this oÅering and pursuant to our CertiÑcate of Incorporation, theBoard of Directors will have the authority, without further action by the stockholders, toissue the preferred stock in one or more series and to Ñx the rights, preferences, privilegesand restrictions thereof, including dividend rights, dividend rates, conversion rights, votingrights, terms of redemption, redemption prices, liquidation preferences and the number ofshares constituting any series or the designation of any series, without further vote oraction by the stockholders. The issuance of preferred stock may have the eÅect ofdelaying, deferring or preventing a change in control of PLX without further action by thestockholders and may adversely aÅect the voting and other rights of the holders of ourcommon stock. The issuance of preferred stock with voting and conversion rights may havethe eÅect of decreasing the market price of our common stock, and may adversely aÅectthe voting power of the holders of our common stock, including the loss of voting controlto others. At present, we have no plans to issue any shares of preferred stock.
Registration Rights
PLX has entered into registration rights agreements with those individuals who own13,738,908 shares of our common stock which will be issued upon the automaticconversion of their preferred stock into common stock in connection with this oÅering.Under the registration rights agreements, the holders or their transferees are entitled torights with respect to the registration of these shares under the Securities Act. If wepropose to register any of our securities under the Securities Act, either for our ownaccount or the account of other security holders, the holders are entitled to notice of theregistration and, subject to conditions and limitations, are entitled to include their shares inthe registration. In addition, at any time, the holders of at least 50% of these shares ofcommon stock may require us, on not more than two occasions, to Ñle a registrationstatement under the Securities Act with respect to at least 20% of all of the outstandingregistrable securities, or a lesser percentage if the gross oÅering price would exceed$5.0 million. We are required to use our best eÅorts to eÅect the required registration,subject to conditions and limitations set forth in the registration rights agreements. Further,the holders of these shares of common stock may require us to Ñle additional registrationstatements on Form S-3 when the form becomes available to us, subject to conditions andlimitations. The expenses incurred in connection with all of these registrations will beborne by us.
Anti-Takeover, Limited Liability and IndemniÑcation Provisions;Section 203 of the Delaware General Corporation Law
We are subject to Section 203 of the Delaware General Corporation Law, as amended(""Section 203''), which, subject to exceptions, prohibits a Delaware corporation from
55
engaging in any business combination with any interested stockholder for a period of threeyears following the date that such stockholder became an interested stockholder, unless:
‚ prior to such date, the board of directors of the corporation approved either thebusiness combination or the transaction that resulted in the stockholder becomingan interested stockholder,
‚ upon consummation of the transaction that resulted in the stockholder becoming aninterested stockholder, the interested stockholder owned at least 85% of the votingstock of the corporation outstanding at the time the transaction commenced,excluding for purposes of determining the number of shares outstanding thoseshares owned by:
‚ by persons who are directors and also oÇcers; and
‚ by employee stock plans in which employee participants do not have the right todetermine conÑdentially whether shares held subject to the plan will be tenderedin a tender or exchange oÅer, or
‚ on or subsequent to such date, the business combination is approved by the boardof directors and authorized at an annual or special meeting of stockholders, and notby written consent, by the aÇrmative vote of at least 66π% of the outstandingvoting stock that is not owned by the interested stockholder.
Section 203 deÑnes business combinations to include:
‚ any merger or consolidation involving the corporation or any majority-ownedsubsidiary of the corporation and any other person or entity,
‚ any sale, transfer, pledge or other disposition of 10% or more of the assets of thecorporation or any majority-owned subsidiary of the corporation involving theinterested stockholder,
‚ any transaction that results in the issuance or transfer by the corporation or anymajority-owned subsidiary of the corporation of any stock of the corporation to theinterested stockholder,
‚ any transaction involving the corporation or any majority-owned subsidiary of thecorporation that has the eÅect of increasing the proportionate share of the stock ofany class or series of the corporation or any majority-owned subsidiary of thecorporation beneÑcially owned by the interested stockholder, or
‚ the receipt by the interested stockholder of the beneÑt of any loans, advances,guarantees, pledges or other Ñnancial beneÑts provided by or through thecorporation or any majority-owned subsidiary of the corporation. In general,Section 203 deÑnes an interested stockholder as any entity or person beneÑciallyowning 15% or more or the outstanding voting stock of the corporation and anyentity or person aÇliated with or controlling or controlled by such entity or person.
Transfer Agent and Registrar
The Transfer Agent and Registrar for our common stock is BankBoston, N.A. TheTransfer Agent's address is 150 Royall Street, Canton, Massachusetts and its telephonenumber is (781) 575-2000.
56
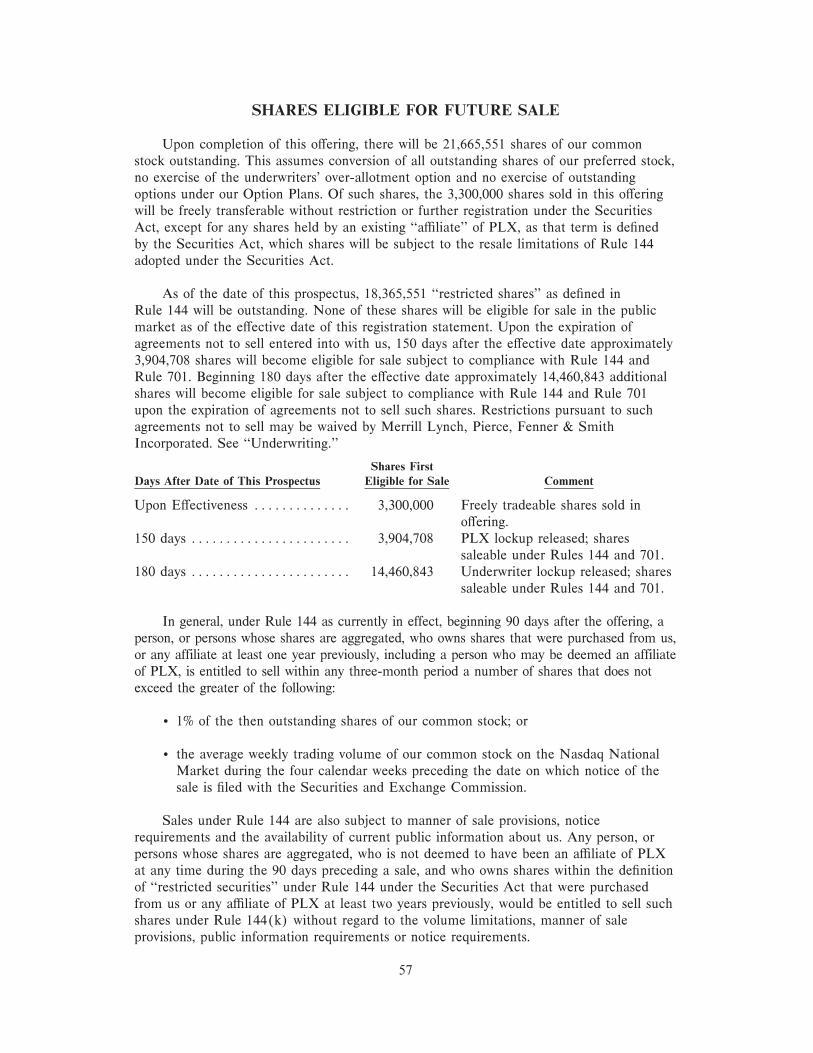
SHARES ELIGIBLE FOR FUTURE SALE
Upon completion of this oÅering, there will be 21,665,551 shares of our commonstock outstanding. This assumes conversion of all outstanding shares of our preferred stock,no exercise of the underwriters' over-allotment option and no exercise of outstandingoptions under our Option Plans. Of such shares, the 3,300,000 shares sold in this oÅeringwill be freely transferable without restriction or further registration under the SecuritiesAct, except for any shares held by an existing ""aÇliate'' of PLX, as that term is deÑnedby the Securities Act, which shares will be subject to the resale limitations of Rule 144adopted under the Securities Act.
As of the date of this prospectus, 18,365,551 ""restricted shares'' as deÑned inRule 144 will be outstanding. None of these shares will be eligible for sale in the publicmarket as of the eÅective date of this registration statement. Upon the expiration ofagreements not to sell entered into with us, 150 days after the eÅective date approximately3,904,708 shares will become eligible for sale subject to compliance with Rule 144 andRule 701. Beginning 180 days after the eÅective date approximately 14,460,843 additionalshares will become eligible for sale subject to compliance with Rule 144 and Rule 701upon the expiration of agreements not to sell such shares. Restrictions pursuant to suchagreements not to sell may be waived by Merrill Lynch, Pierce, Fenner & SmithIncorporated. See ""Underwriting.''
Shares FirstDays After Date of This Prospectus Eligible for Sale Comment
Upon EÅectiveness ÏÏÏÏÏÏÏÏÏÏÏÏÏÏ 3,300,000 Freely tradeable shares sold inoÅering.
150 days ÏÏÏÏÏÏÏÏÏÏÏÏÏÏÏÏÏÏÏÏÏÏÏ 3,904,708 PLX lockup released; sharessaleable under Rules 144 and 701.
180 days ÏÏÏÏÏÏÏÏÏÏÏÏÏÏÏÏÏÏÏÏÏÏÏ 14,460,843 Underwriter lockup released; sharessaleable under Rules 144 and 701.
In general, under Rule 144 as currently in effect, beginning 90 days after the offering, aperson, or persons whose shares are aggregated, who owns shares that were purchased from us,or any affiliate at least one year previously, including a person who may be deemed an affiliateof PLX, is entitled to sell within any three-month period a number of shares that does notexceed the greater of the following:
‚ 1% of the then outstanding shares of our common stock; or
‚ the average weekly trading volume of our common stock on the Nasdaq NationalMarket during the four calendar weeks preceding the date on which notice of thesale is Ñled with the Securities and Exchange Commission.
Sales under Rule 144 are also subject to manner of sale provisions, noticerequirements and the availability of current public information about us. Any person, orpersons whose shares are aggregated, who is not deemed to have been an aÇliate of PLXat any time during the 90 days preceding a sale, and who owns shares within the deÑnitionof ""restricted securities'' under Rule 144 under the Securities Act that were purchasedfrom us or any aÇliate of PLX at least two years previously, would be entitled to sell suchshares under Rule 144(k) without regard to the volume limitations, manner of saleprovisions, public information requirements or notice requirements.
57

Subject to limitations on the aggregate oÅering price of a transaction and otherconditions, Rule 701 may be relied upon with respect to the resale of securities originallypurchased from us by our employees, directors, oÇcers, consultants or advisers prior to thedate the issuer becomes subject to the reporting requirements of the Securities ExchangeAct of 1934, as amended, pursuant to written compensatory beneÑt plans or writtencontracts relating to the compensation of such persons. In addition, the Commission hasindicated that Rule 701 will apply to typical stock options granted by an issuer before itbecomes subject to the reporting requirements of the Exchange Act, along with the sharesacquired upon exercise of such options, including exercises after the date of thisprospectus. Securities issued in reliance on Rule 701 are restricted securities and, subjectto the contractual restrictions described above, beginning 90 days after the date of thisprospectus, may be sold by:
‚ persons other than aÇliates, subject only to the manner of sale provisions ofRule 144, and
‚ aÇliates under Rule 144 without compliance with its one-year holding periodrequirement.
We have agreed not to oÅer, sell or otherwise dispose of any shares of our commonstock or any securities convertible into or exercisable or exchangeable for our commonstock or any rights to acquire our common stock for a period of 180 days after the date ofthis prospectus, without the prior written consent of the representatives of the underwriters,subject to limited exceptions. See ""Underwriting.''
After the oÅering, the holders of 13,738,908 shares of our common stock or theirrespective transferees, will be entitled to rights with respect to the registration of the sharesunder the Securities Act. See ""Description of Capital Stock Ì Registration Rights.''Registration of the shares under the Securities Act would result in such shares becomingfreely tradable without restriction under the Securities Act, except for shares purchased byaÇliates, immediately upon the eÅectiveness of such registration.
We intend to Ñle a registration statement under the Securities Act covering 2,500,000shares of our common stock reserved for issuance under the option plans. See""Management Ì Stock Option Plans.'' This registration statement is expected to be Ñledwithin 90 days after the date of this prospectus and will automatically become eÅectiveupon Ñling. Following such Ñling, shares registered under the registration statement will,subject to the lockup agreements, Rule 144 volume limitations applicable to aÇliates andthe lapsing of our repurchase rights, be available for sale in the open market upon theexercise of vested options 90 days after the eÅective date of this prospectus. AtDecember 31, 1998, options to purchase 645,250 shares were issued and outstanding underthe Option Plans. In 1999, our Board of Directors approved the grant of options topurchase 734,250 shares of our common stock under our 1998 Stock Incentive Plan.
58

UNDERWRITING
General
We intend to oÅer our common stock in the United States and Canada through anumber of underwriters. Merrill Lynch, Pierce, Fenner & Smith Incorporated,NationsBanc Montgomery Securities LLC and Wit Capital Corporation are acting asrepresentatives of each of the underwriters named below. Subject to the terms andconditions set forth in a purchase agreement between us and the underwriters, we haveagreed to sell to the underwriters, and each of the underwriters severally and not jointlyhas agreed to purchase from us, the number of shares of our common stock set forthopposite its name below.
Number ofUnderwriters Shares
Merrill Lynch, Pierce, Fenner & SmithIncorporatedÏÏÏÏÏÏÏÏÏÏÏÏÏÏÏÏÏÏÏÏÏÏÏÏÏÏÏÏÏÏÏÏÏÏÏÏÏÏÏÏÏÏÏÏÏÏ 1,552,500
NationsBanc Montgomery Securities LLC ÏÏÏÏÏÏÏÏÏÏÏÏÏÏÏÏÏÏÏÏÏÏÏÏÏÏÏÏÏÏÏ 1,012,500Wit Capital CorporationÏÏÏÏÏÏÏÏÏÏÏÏÏÏÏÏÏÏÏÏÏÏÏÏÏÏÏÏÏÏÏÏÏÏÏÏÏÏÏÏÏÏÏÏÏÏÏ 135,000Allen & Company Incorporated ÏÏÏÏÏÏÏÏÏÏÏÏÏÏÏÏÏÏÏÏÏÏÏÏÏÏÏÏÏÏÏÏÏÏÏÏÏÏÏÏ 80,000BancBoston Robertson Stephens Inc.ÏÏÏÏÏÏÏÏÏÏÏÏÏÏÏÏÏÏÏÏÏÏÏÏÏÏÏÏÏÏÏÏÏÏÏÏ 80,000CIBC Oppenheimer Corp. ÏÏÏÏÏÏÏÏÏÏÏÏÏÏÏÏÏÏÏÏÏÏÏÏÏÏÏÏÏÏÏÏÏÏÏÏÏÏÏÏÏÏÏÏ 80,000Salomon Smith Barney Inc. ÏÏÏÏÏÏÏÏÏÏÏÏÏÏÏÏÏÏÏÏÏÏÏÏÏÏÏÏÏÏÏÏÏÏÏÏÏÏÏÏÏÏÏ 80,000Adams, Harkness & Hill, Inc. ÏÏÏÏÏÏÏÏÏÏÏÏÏÏÏÏÏÏÏÏÏÏÏÏÏÏÏÏÏÏÏÏÏÏÏÏÏÏÏÏÏ 40,000Fahnestock & Co. Inc. ÏÏÏÏÏÏÏÏÏÏÏÏÏÏÏÏÏÏÏÏÏÏÏÏÏÏÏÏÏÏÏÏÏÏÏÏÏÏÏÏÏÏÏÏÏÏÏ 40,000Gerard Klauer Mattison & Co., Inc. ÏÏÏÏÏÏÏÏÏÏÏÏÏÏÏÏÏÏÏÏÏÏÏÏÏÏÏÏÏÏÏÏÏÏÏÏ 40,000Kaufman Bros., L.P. ÏÏÏÏÏÏÏÏÏÏÏÏÏÏÏÏÏÏÏÏÏÏÏÏÏÏÏÏÏÏÏÏÏÏÏÏÏÏÏÏÏÏÏÏÏÏÏÏÏ 40,000Moors & Cabot, Inc. ÏÏÏÏÏÏÏÏÏÏÏÏÏÏÏÏÏÏÏÏÏÏÏÏÏÏÏÏÏÏÏÏÏÏÏÏÏÏÏÏÏÏÏÏÏÏÏÏÏ 40,000Brad Peery Inc. ÏÏÏÏÏÏÏÏÏÏÏÏÏÏÏÏÏÏÏÏÏÏÏÏÏÏÏÏÏÏÏÏÏÏÏÏÏÏÏÏÏÏÏÏÏÏÏÏÏÏÏÏÏ 40,000J.E. Sheehan & Company, Inc. ÏÏÏÏÏÏÏÏÏÏÏÏÏÏÏÏÏÏÏÏÏÏÏÏÏÏÏÏÏÏÏÏÏÏÏÏÏÏÏÏ 40,000
Total ÏÏÏÏÏÏÏÏÏÏÏÏÏÏÏÏÏÏÏÏÏÏÏÏÏÏÏÏÏÏÏÏÏÏÏÏÏÏÏÏÏÏÏÏÏÏÏÏÏÏÏÏ 3,300,000
In the purchase agreement, the several underwriters have agreed, subject to the termsand conditions set forth in that agreement, to purchase all of the shares of our commonstock being sold under the terms of the agreement if any of the shares of common stockare purchased. Under the purchase agreement, the commitments of non-defaultingunderwriters may be increased.
We have agreed to indemnify the underwriters against liabilities under the SecuritiesAct, or to contribute to payments the underwriters may be required to make in respect ofthose liabilities.
The expenses of this oÅering, exclusive of the underwriting discount, are estimated at$700,000 and are payable by us.
The shares of common stock are being oÅered by the several underwriters, subject toprior sale, when, as and if issued to and accepted by them, subject to approval of legalmatters by counsel for the underwriters and other conditions. The underwriters reserve theright to withdraw, cancel or modify such oÅer and to reject orders in whole or in part.
A prospectus in electronic format is being made available on an Internet Web sitemaintained by Wit Capital. In addition, all dealers purchasing shares from Wit Capital in
59

this oÅering have agreed to make a prospectus in electronic format available on Web sitesmaintained by each of these dealers.
Wit Capital, a member of the National Association of Securities Dealers, Inc., willparticipate in this oÅering as one of the underwriters. The National Association ofSecurities Dealers, Inc. approved the membership of Wit Capital on September 4, 1997.Since that time, Wit Capital has acted as an underwriter, e-Manager or selected dealer inover 50 public oÅerings.
The shares of common stock will be ready for delivery in New York, New York on orabout April 9, 1999.
Commissions and Discounts
The representatives have advised us that the underwriters propose initially to oÅer theshares of our common stock to the public at the initial public oÅering price set forth onthe cover page of this prospectus, and to dealers at such price less a concession not inexcess of $.35 per share of common stock. The underwriters may allow, and such dealersmay reallow, a discount not in excess of $.10 per share of common stock to other dealers.After the initial public oÅering, the public oÅering price, concession and discount may bechanged.
The following table shows the per share and total public oÅering price, underwritingdiscount to be paid by us to the underwriters and the proceeds before expenses to us. Thisinformation is presented assuming either no exercise or full exercise by the underwriters oftheir over-allotment options.
Without WithPer Share Option Option
Public oÅering priceÏÏÏÏÏÏÏÏÏÏÏÏÏÏÏÏÏÏÏÏÏÏÏÏÏÏÏ $9.00 $29,700,000 $34,155,000Underwriting discount ÏÏÏÏÏÏÏÏÏÏÏÏÏÏÏÏÏÏÏÏÏÏÏÏÏ $.63 $2,079,000 $2,390,850Proceeds, before expenses, to PLX ÏÏÏÏÏÏÏÏÏÏÏÏÏÏ $8.37 $27,621,000 $31,764,150
Over-allotment Option
We have granted an option to the underwriters, exercisable for 30 days after the dateof this prospectus, to purchase up to an aggregate of an additional 495,000 shares of ourcommon stock at the initial public oÅering price set forth on the cover of this prospectus,less the underwriting discount. The underwriters may exercise this option solely to coverover-allotments, if any, made on the sale of our common stock oÅered hereby. To theextent that the underwriters exercise this option, each underwriter will be obligated topurchase a number of additional shares of our common stock proportionate to suchunderwriter's initial amount reÖected in the foregoing table.
Reserved Shares
At our request, the underwriters have reserved for sale, at the initial public oÅeringprice, up to 100,000 of the shares oÅered hereby to be sold to some of our employees,directors and other persons with relationships with PLX. The number of shares of ourcommon stock available for sale to the general public will be reduced to the extent thatthose persons purchase the reserved shares. Any reserved shares which are not orallyconÑrmed for purchase within one day of the pricing of the oÅering will be oÅered by the
60

underwriters to the general public on the same terms as the other shares oÅered by thisprospectus.
No Sales of Similar Securities
We and our executive oÇcers and directors have agreed not to directly or indirectly
‚ oÅer, pledge, sell, contract to sell, sell any option or contract to purchase, purchaseany option or contract to sell, grant any option, right or warrant for the sale of, lendor otherwise dispose of or transfer any shares of our common stock or securitiesconvertible into or exchangeable or exercisable for or repayable with our commonstock, whether now owned or later acquired by the person executing the agreementor with respect to which the person executing the agreement later acquires thepower of disposition, or Ñle any registration statement under the Securities Actrelating to any shares of our common stock or
‚ enter into any swap or other agreement or any other agreement that transfers, inwhole or in part, the economic consequence of ownership of our common stockwhether any such swap or transaction is to be settled by delivery of our commonstock or other securities, in cash or otherwise, without the prior written consent ofMerrill Lynch on behalf of the underwriters for a period of 180 days after the dateof the prospectus. See ""Shares Eligible for Future Sale.''
Nasdaq National Market Listing
Before this offering, there has been no market for our common stock. The initial publicoffering price will be determined through negotiations between us and the representatives ofthe underwriters. The factors to be considered in determining the initial public offering price,in addition to prevailing market conditions, include the valuation multiples of publicly tradedcompanies that the representatives believe to be comparable to us, some of our financialinformation, the history of, and the prospects for, us and the industry in which we compete,and an assessment of our management, its past and present operations, the prospects for, andtiming of, future revenues of PLX, the present state of our development, the percentageinterest of PLX being sold as compared to the valuation for PLX and the above factors inrelation to market values and various valuation measures of other companies engaged inactivities similar to ours. There can be no assurance that an active trading market will developfor our common stock or that our common stock will trade in the public market subsequent tothe offering at or above the initial public offering price.
Our common stock has been approved for listing on the Nasdaq National Marketunder the symbol ""PLXT.''
The underwriters do not expect sales of our common stock to any accounts over whichthey exercise discretionary authority to exceed 5% of the number of shares being oÅeredunder the prospectus.
Price Stabilization and Short Positions
Until the distribution of our common stock is completed, rules of the Commissionmay limit the ability of the underwriters and selling group members to bid for andpurchase our common stock. As an exception to these rules, the underwriters are permittedto engage in transactions that stabilize the price of our common stock. Such transactions
61
consist of bids or purchases for the purpose of pegging, Ñxing or maintaining the price ofour common stock.
If the underwriters create a short position in our common stock in connection with theoÅering, i.e., if they sell more shares of our common stock than are set forth on the coverpage of this prospectus, the underwriters may reduce that short position by purchasing ourcommon stock in the open market. The underwriters may also elect to reduce any shortposition by exercising all or part of the over-allotment option described above.
Penalty Bids
The underwriters may also impose a penalty bid on other underwriters and sellinggroup members. This means that if the underwriters purchase shares of our common stockin the open market to reduce the their short position or to stabilize the price of ourcommon stock, they may reclaim the amount of the selling concession from theunderwriters and selling group members who sold those shares as part of the oÅering.
In general, purchases of a security for the purpose of stabilization or to reduce a shortposition could cause the price of the security to be higher than it might be in the absenceof such purchases. The imposition of a penalty bid might also have an eÅect on the priceof our common stock to the extent that it discourages resales of our common stock.
Neither we nor any of the underwriters makes any representation or prediction as tothe direction or magnitude of any eÅect that the transactions described above may have onthe price of our common stock. In addition, neither we nor any of the underwriters makesany representation that the representatives will engage in such transactions or that suchtransactions, once commenced, will not be discontinued without notice.
LEGAL MATTERS
The validity of our common stock oÅered hereby will be passed upon for us byMorrison & Foerster LLP, Palo Alto, California. Certain legal matters in connection withthe oÅering will be passed upon for the underwriters by Wilson Sonsini Goodrich &Rosati, Professional Corporation, Palo Alto, California.
EXPERTS
Ernst & Young LLP, independent auditors, have audited our consolidated Ñnancialstatements at December 31, 1997 and 1998, and for each of the three years in the periodended December 31, 1998, included in this prospectus and registration statement, as setforth in their report, which is included in this prospectus and registration statement. Theconsolidated Ñnancial statements are included in reliance on their report given upon theirauthority as experts in accounting and auditing.
WHERE YOU CAN FIND MORE INFORMATION
We have Ñled with the Commission, Washington, D.C. 20549, a RegistrationStatement on Form S-1 under the Securities Act with respect to our common stockoÅered hereby. This prospectus does not contain all of the information set forth in theregistration statement and the exhibits and schedules to the registration statement. Prior to
62

Ñling the Registration Statement on Form S-1, we have not Ñled any reports with theCommission. For further information with respect to PLX and our common stock oÅeredhereby, reference is made to the Registration Statement and the exhibits and schedulesÑled as a part of the Registration Statement. Statements contained in this prospectusconcerning the contents of any contract or any other document are not necessarilycomplete; reference is made in each instance to the copy of such contract or any otherdocument Ñled as an exhibit to the registration statement. Each such statement is qualiÑedin all respects by such reference to such exhibit. The registration statement, includingexhibits and schedules thereto, may be inspected without charge at the Commission'sprincipal oÇce in Washington, D.C., and copies of all or any part thereof may be obtainedfrom the Public Reference Section of the Commission, 450 Fifth Street, N.W.,Washington, D.C. 20549, and at the Commission's regional oÇces located at CiticorpCenter, 500 West Madison Street, Suite 1400, Chicago, Illinois 60661 and at 7 WorldTrade Center, 13th Floor, New York, New York 10048 after payment of fees prescribedby the Commission. You may obtain information on the operation of the Public ReferenceRoom by calling 1-800-SEC-0330. The Commission also maintains a World Wide Website which provides online access to reports, proxy and information statements and otherinformation regarding registrants that Ñle electronically with the Commission at theaddress http://www.sec.gov.
63

GLOSSARY
Architecture A particular methodology for bringing together and utilizingselected computer hardware, systems software and applicationssoftware to achieve an overall objective.
Application SpeciÑc A broad term that refers to integrated circuits that are custom,Integrated Circuit semi-custom or user-programmable.(ASIC)
Bus A common pathway, or channel, between multiple devices.
Central Processing Unit The main processor of the computer.(CPU)
Direct Memory Access Device which moves data between speciÑed system memory(DMA) Controller locations.
Embedded system A computer that performs a dedicated task or set of tasks that isembedded in another product.
Field Programmable A semiconductor device whose logic function can beGate Array (FPGA) programmed by the system manufacturer.
Integrated circuit (IC) Microelectronic semiconductor device consisting of manyinterconnected transistors and other components.
Intelligent I/O (I2O) This standard was developed by the I2O Special Interest Groupto provide a common software messaging standard for high-performance computers.
I/O accelerators Semiconductor devices that incorporate high-level functions toenable eÇcient movement of data in systems.
I/O processors Processors speciÑcally designed to manage I/O tasks eÇciently.
I/O subsystem The circuitry and software that connects the microprocessor, thememory and peripherals and allows for the transfer ofinstructions and data among these functions.
Mbps Megabits per second (1,000,000 bps).
Peripheral Component This standard was developed by the PCI-SIG (Special InterestInterconnect (PCI) Group) to provide a high performance, reliable and cost-eÅective
method of connecting high speed devices together.
64
PLX TECHNOLOGY, INC.
INDEX TO CONSOLIDATED FINANCIAL STATEMENTS
Page
Report of Ernst & Young LLP, Independent AuditorsÏÏÏÏÏÏÏÏÏÏÏÏÏÏÏÏÏÏÏÏÏÏÏÏÏÏ F-2Consolidated Balance Sheets ÏÏÏÏÏÏÏÏÏÏÏÏÏÏÏÏÏÏÏÏÏÏÏÏÏÏÏÏÏÏÏÏÏÏÏÏÏÏÏÏÏÏÏÏÏÏÏ F-3Consolidated Statements of Income ÏÏÏÏÏÏÏÏÏÏÏÏÏÏÏÏÏÏÏÏÏÏÏÏÏÏÏÏÏÏÏÏÏÏÏÏÏÏÏÏÏ F-4Consolidated Statements of Stockholders' Equity ÏÏÏÏÏÏÏÏÏÏÏÏÏÏÏÏÏÏÏÏÏÏÏÏÏÏÏÏÏÏ F-5Consolidated Statements of Cash Flows ÏÏÏÏÏÏÏÏÏÏÏÏÏÏÏÏÏÏÏÏÏÏÏÏÏÏÏÏÏÏÏÏÏÏÏÏÏÏ F-6Notes to Consolidated Financial Statements ÏÏÏÏÏÏÏÏÏÏÏÏÏÏÏÏÏÏÏÏÏÏÏÏÏÏÏÏÏÏÏÏÏÏ F-7
F-1
REPORT OF ERNST & YOUNG LLP, INDEPENDENT AUDITORS
The Board of Directors and StockholdersPLX Technology, Inc.
We have audited the accompanying consolidated balance sheets of PLX Technology,Inc. as of December 31, 1997 and 1998, and the related consolidated statements ofincome, stockholders' equity, and cash Öows for each of the three years in the periodended December 31, 1998. These Ñnancial statements are the responsibility of theCompany's management. Our responsibility is to express an opinion on these Ñnancialstatements based on our audits.
We conducted our audits in accordance with generally accepted auditing standards.Those standards require that we plan and perform the audit to obtain reasonable assuranceabout whether the Ñnancial statements are free of material misstatement. An auditincludes examining, on a test basis, evidence supporting the amounts and disclosures in theÑnancial statements. An audit also includes assessing the accounting principles used andsigniÑcant estimates made by management, as well as evaluating the overall Ñnancialstatement presentation. We believe that our audits provide a reasonable basis for ouropinion.
In our opinion, the consolidated Ñnancial statements referred to above present fairly,in all material respects, the consolidated Ñnancial position of PLX Technology, Inc. atDecember 31, 1997 and 1998, and the consolidated results of its operations and its cashÖows for each of the three years in the period ended December 31, 1998 in conformitywith generally accepted accounting principles.
ERNST & YOUNG LLP
San Jose, CaliforniaJanuary 14, 1999,except for Note 11,as to which the date isMarch 22, 1999
F-2
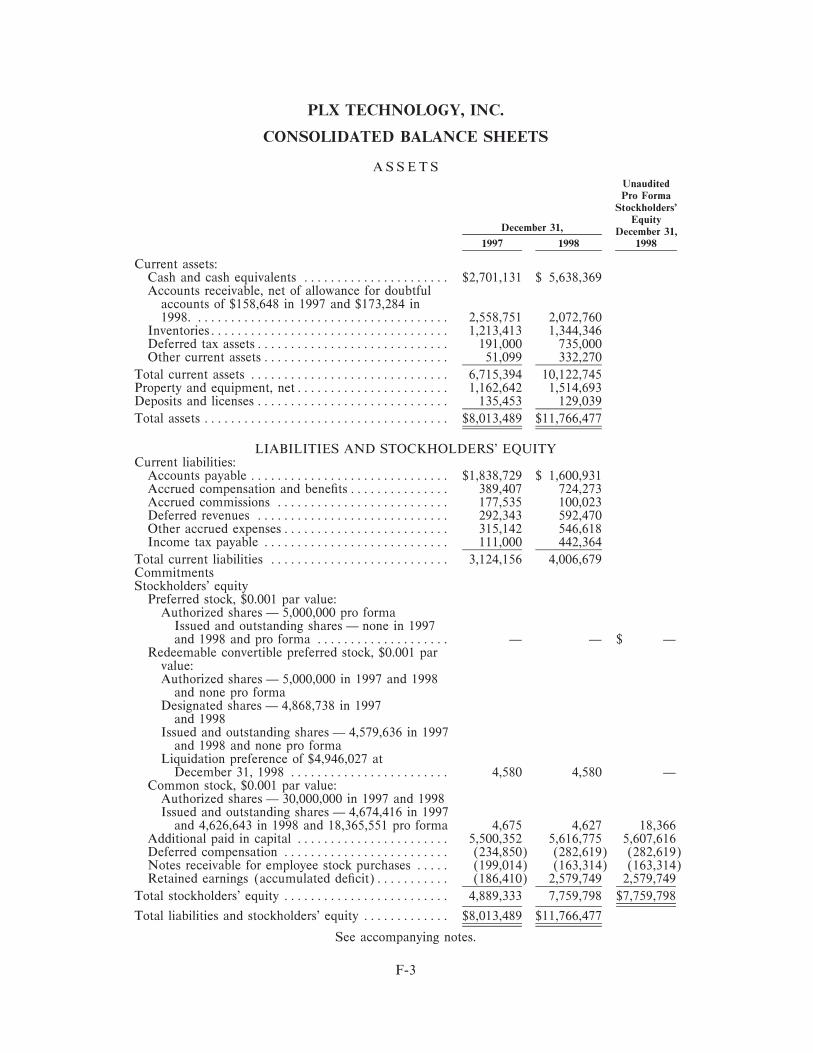
PLX TECHNOLOGY, INC.
CONSOLIDATED BALANCE SHEETS
A S S E T SUnauditedPro Forma
Stockholders'Equity
December 31, December 31,1997 1998 1998
Current assets:Cash and cash equivalents ÏÏÏÏÏÏÏÏÏÏÏÏÏÏÏÏÏÏÏÏÏÏ $2,701,131 $ 5,638,369Accounts receivable, net of allowance for doubtful
accounts of $158,648 in 1997 and $173,284 in1998. ÏÏÏÏÏÏÏÏÏÏÏÏÏÏÏÏÏÏÏÏÏÏÏÏÏÏÏÏÏÏÏÏÏÏÏÏÏÏ 2,558,751 2,072,760
InventoriesÏÏÏÏÏÏÏÏÏÏÏÏÏÏÏÏÏÏÏÏÏÏÏÏÏÏÏÏÏÏÏÏÏÏÏÏ 1,213,413 1,344,346Deferred tax assetsÏÏÏÏÏÏÏÏÏÏÏÏÏÏÏÏÏÏÏÏÏÏÏÏÏÏÏÏÏ 191,000 735,000Other current assets ÏÏÏÏÏÏÏÏÏÏÏÏÏÏÏÏÏÏÏÏÏÏÏÏÏÏÏÏ 51,099 332,270
Total current assets ÏÏÏÏÏÏÏÏÏÏÏÏÏÏÏÏÏÏÏÏÏÏÏÏÏÏÏÏÏÏ 6,715,394 10,122,745Property and equipment, netÏÏÏÏÏÏÏÏÏÏÏÏÏÏÏÏÏÏÏÏÏÏÏ 1,162,642 1,514,693Deposits and licenses ÏÏÏÏÏÏÏÏÏÏÏÏÏÏÏÏÏÏÏÏÏÏÏÏÏÏÏÏÏ 135,453 129,039
Total assets ÏÏÏÏÏÏÏÏÏÏÏÏÏÏÏÏÏÏÏÏÏÏÏÏÏÏÏÏÏÏÏÏÏÏÏÏÏ $8,013,489 $11,766,477
LIABILITIES AND STOCKHOLDERS' EQUITYCurrent liabilities:
Accounts payable ÏÏÏÏÏÏÏÏÏÏÏÏÏÏÏÏÏÏÏÏÏÏÏÏÏÏÏÏÏÏ $1,838,729 $ 1,600,931Accrued compensation and beneÑtsÏÏÏÏÏÏÏÏÏÏÏÏÏÏÏ 389,407 724,273Accrued commissions ÏÏÏÏÏÏÏÏÏÏÏÏÏÏÏÏÏÏÏÏÏÏÏÏÏÏ 177,535 100,023Deferred revenues ÏÏÏÏÏÏÏÏÏÏÏÏÏÏÏÏÏÏÏÏÏÏÏÏÏÏÏÏÏ 292,343 592,470Other accrued expensesÏÏÏÏÏÏÏÏÏÏÏÏÏÏÏÏÏÏÏÏÏÏÏÏÏ 315,142 546,618Income tax payable ÏÏÏÏÏÏÏÏÏÏÏÏÏÏÏÏÏÏÏÏÏÏÏÏÏÏÏÏ 111,000 442,364
Total current liabilities ÏÏÏÏÏÏÏÏÏÏÏÏÏÏÏÏÏÏÏÏÏÏÏÏÏÏÏ 3,124,156 4,006,679CommitmentsStockholders' equity
Preferred stock, $0.001 par value:Authorized shares Ì 5,000,000 pro forma
Issued and outstanding shares Ì none in 1997and 1998 and pro forma ÏÏÏÏÏÏÏÏÏÏÏÏÏÏÏÏÏÏÏÏ Ì Ì $ Ì
Redeemable convertible preferred stock, $0.001 parvalue:Authorized shares Ì 5,000,000 in 1997 and 1998
and none pro formaDesignated shares Ì 4,868,738 in 1997
and 1998Issued and outstanding shares Ì 4,579,636 in 1997
and 1998 and none pro formaLiquidation preference of $4,946,027 at
December 31, 1998 ÏÏÏÏÏÏÏÏÏÏÏÏÏÏÏÏÏÏÏÏÏÏÏÏ 4,580 4,580 ÌCommon stock, $0.001 par value:
Authorized shares Ì 30,000,000 in 1997 and 1998Issued and outstanding shares Ì 4,674,416 in 1997
and 4,626,643 in 1998 and 18,365,551 pro forma 4,675 4,627 18,366Additional paid in capital ÏÏÏÏÏÏÏÏÏÏÏÏÏÏÏÏÏÏÏÏÏÏÏ 5,500,352 5,616,775 5,607,616Deferred compensation ÏÏÏÏÏÏÏÏÏÏÏÏÏÏÏÏÏÏÏÏÏÏÏÏÏ (234,850) (282,619) (282,619)Notes receivable for employee stock purchases ÏÏÏÏÏ (199,014) (163,314) (163,314)Retained earnings (accumulated deÑcit)ÏÏÏÏÏÏÏÏÏÏÏ (186,410) 2,579,749 2,579,749
Total stockholders' equity ÏÏÏÏÏÏÏÏÏÏÏÏÏÏÏÏÏÏÏÏÏÏÏÏÏ 4,889,333 7,759,798 $7,759,798
Total liabilities and stockholders' equity ÏÏÏÏÏÏÏÏÏÏÏÏÏ $8,013,489 $11,766,477
See accompanying notes.
F-3
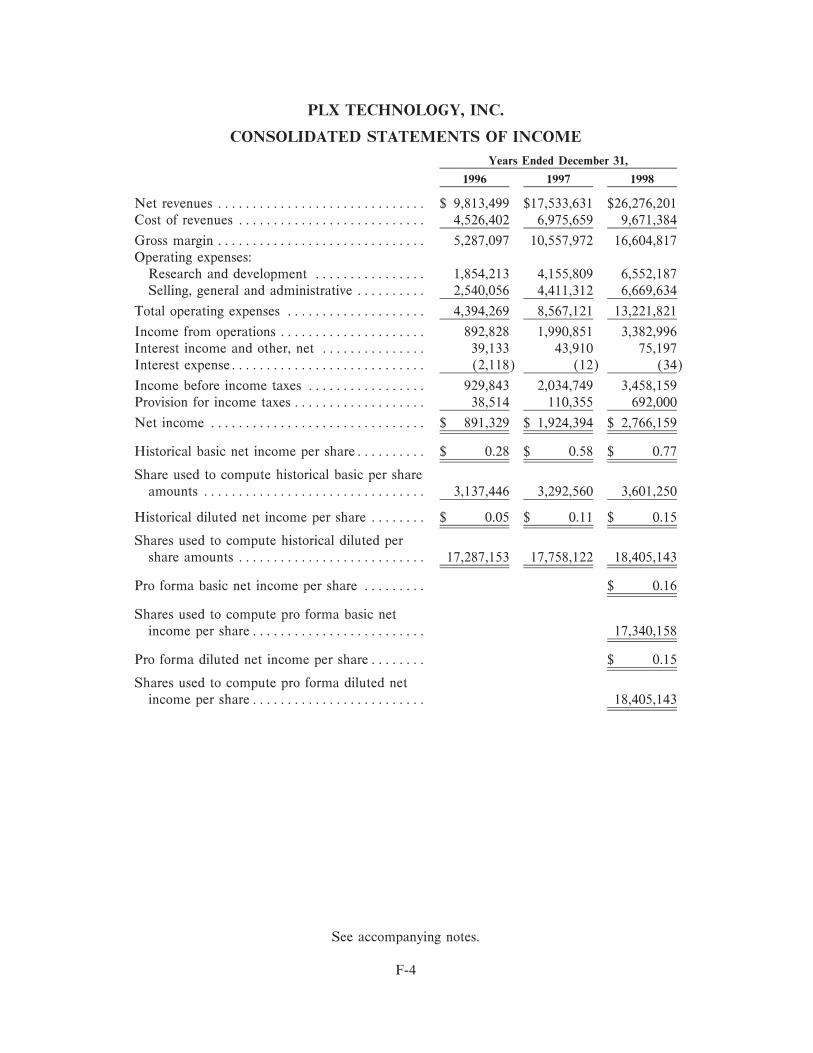
PLX TECHNOLOGY, INC.
CONSOLIDATED STATEMENTS OF INCOME
Years Ended December 31,
1996 1997 1998
Net revenues ÏÏÏÏÏÏÏÏÏÏÏÏÏÏÏÏÏÏÏÏÏÏÏÏÏÏÏÏÏÏ $ 9,813,499 $17,533,631 $26,276,201Cost of revenues ÏÏÏÏÏÏÏÏÏÏÏÏÏÏÏÏÏÏÏÏÏÏÏÏÏÏÏ 4,526,402 6,975,659 9,671,384
Gross margin ÏÏÏÏÏÏÏÏÏÏÏÏÏÏÏÏÏÏÏÏÏÏÏÏÏÏÏÏÏÏ 5,287,097 10,557,972 16,604,817Operating expenses:
Research and development ÏÏÏÏÏÏÏÏÏÏÏÏÏÏÏÏ 1,854,213 4,155,809 6,552,187Selling, general and administrative ÏÏÏÏÏÏÏÏÏÏ 2,540,056 4,411,312 6,669,634
Total operating expenses ÏÏÏÏÏÏÏÏÏÏÏÏÏÏÏÏÏÏÏÏ 4,394,269 8,567,121 13,221,821
Income from operations ÏÏÏÏÏÏÏÏÏÏÏÏÏÏÏÏÏÏÏÏÏ 892,828 1,990,851 3,382,996Interest income and other, net ÏÏÏÏÏÏÏÏÏÏÏÏÏÏÏ 39,133 43,910 75,197Interest expenseÏÏÏÏÏÏÏÏÏÏÏÏÏÏÏÏÏÏÏÏÏÏÏÏÏÏÏÏ (2,118) (12) (34)
Income before income taxes ÏÏÏÏÏÏÏÏÏÏÏÏÏÏÏÏÏ 929,843 2,034,749 3,458,159Provision for income taxes ÏÏÏÏÏÏÏÏÏÏÏÏÏÏÏÏÏÏÏ 38,514 110,355 692,000
Net income ÏÏÏÏÏÏÏÏÏÏÏÏÏÏÏÏÏÏÏÏÏÏÏÏÏÏÏÏÏÏÏ $ 891,329 $ 1,924,394 $ 2,766,159
Historical basic net income per shareÏÏÏÏÏÏÏÏÏÏ $ 0.28 $ 0.58 $ 0.77
Share used to compute historical basic per shareamounts ÏÏÏÏÏÏÏÏÏÏÏÏÏÏÏÏÏÏÏÏÏÏÏÏÏÏÏÏÏÏÏÏ 3,137,446 3,292,560 3,601,250
Historical diluted net income per share ÏÏÏÏÏÏÏÏ $ 0.05 $ 0.11 $ 0.15
Shares used to compute historical diluted pershare amounts ÏÏÏÏÏÏÏÏÏÏÏÏÏÏÏÏÏÏÏÏÏÏÏÏÏÏÏ 17,287,153 17,758,122 18,405,143
Pro forma basic net income per share ÏÏÏÏÏÏÏÏÏ $ 0.16
Shares used to compute pro forma basic netincome per shareÏÏÏÏÏÏÏÏÏÏÏÏÏÏÏÏÏÏÏÏÏÏÏÏÏ 17,340,158
Pro forma diluted net income per shareÏÏÏÏÏÏÏÏ $ 0.15
Shares used to compute pro forma diluted netincome per shareÏÏÏÏÏÏÏÏÏÏÏÏÏÏÏÏÏÏÏÏÏÏÏÏÏ 18,405,143
See accompanying notes.
F-4

PLX TECHNOLOGY, INC.
CONSOLIDATED STATEMENTS OF STOCKHOLDERS' EQUITY
Notes
ReceivableRedeemable for RetainedConvertible Additional Employee Earnings Total
Preferred Stock Common Stock Paid In Deferred Stock (Accumulated Stockholders'
Shares Amount Shares Amount Capital Compensation Purchases DeÑcit) Equity
Balance at January 1, 1996ÏÏÏÏÏÏÏÏ 4,579,636 $4,580 3,039,216 $3,039 $4,991,717 $ Ì $ (7,848) $(3,002,133) $1,989,355
Sales of common stock ÏÏÏÏÏÏÏÏÏ Ì Ì 413,000 413 61,537 Ì (38,960) Ì 22,990
Repurchase of common stockÏÏÏÏ Ì Ì (60,883) (61) (6,698) Ì Ì Ì (6,759)
Warrants exercised related to the
guarantee of line of credit ÏÏÏÏÏ Ì Ì 224,583 225 10,068 Ì Ì Ì 10,293
Reduction of stockholder notes
receivable ÏÏÏÏÏÏÏÏÏÏÏÏÏÏÏÏÏÏ Ì Ì Ì Ì Ì Ì 1,680 Ì 1,680
Net incomeÏÏÏÏÏÏÏÏÏÏÏÏÏÏÏÏÏÏÏ Ì Ì Ì Ì Ì Ì Ì 891,329 891,329
Balance at December 31, 1996ÏÏÏÏÏ 4,579,636 4,580 3,615,916 3,616 5,056,624 Ì (45,128) (2,110,804) 2,908,888
Sales of common stock ÏÏÏÏÏÏÏÏÏ Ì Ì 1,058,500 1,059 208,878 Ì (153,886) Ì 56,051
Unearned compensation related to
stock optionsÏÏÏÏÏÏÏÏÏÏÏÏÏÏÏÏ Ì Ì Ì Ì 234,850 (234,850) Ì Ì Ì
Net incomeÏÏÏÏÏÏÏÏÏÏÏÏÏÏÏÏÏÏÏ Ì Ì Ì Ì Ì Ì Ì 1,924,394 1,924,394
Balance at December 31, 1997ÏÏÏÏÏ 4,579,636 4,580 4,674,416 4,675 5,500,352 (234,850) (199,014) (186,410) 4,889,333
Repurchase of common stockÏÏÏÏ Ì Ì (47,773) (48) (10,027) Ì Ì Ì (10,075)
Unearned compensation related to
stock optionsÏÏÏÏÏÏÏÏÏÏÏÏÏÏÏÏ Ì Ì Ì Ì 126,450 (126,450) Ì Ì Ì
Amortization of unearned
compensation ÏÏÏÏÏÏÏÏÏÏÏÏÏÏÏ Ì Ì Ì Ì Ì 78,681 Ì Ì 78,681
Reduction of stockholder notes
receivable ÏÏÏÏÏÏÏÏÏÏÏÏÏÏÏÏÏÏ Ì Ì Ì Ì Ì Ì 35,700 Ì 35,700
Net incomeÏÏÏÏÏÏÏÏÏÏÏÏÏÏÏÏÏÏÏ Ì Ì Ì Ì Ì Ì Ì 2,766,159 2,766,159
Balance at December 31, 1998ÏÏÏÏÏ 4,579,636 $4,580 4,626,643 $4,627 $5,616,775 $(282,619) $(163,314) $ 2,579,749 $7,759,798
See accompanying notes.
F-5
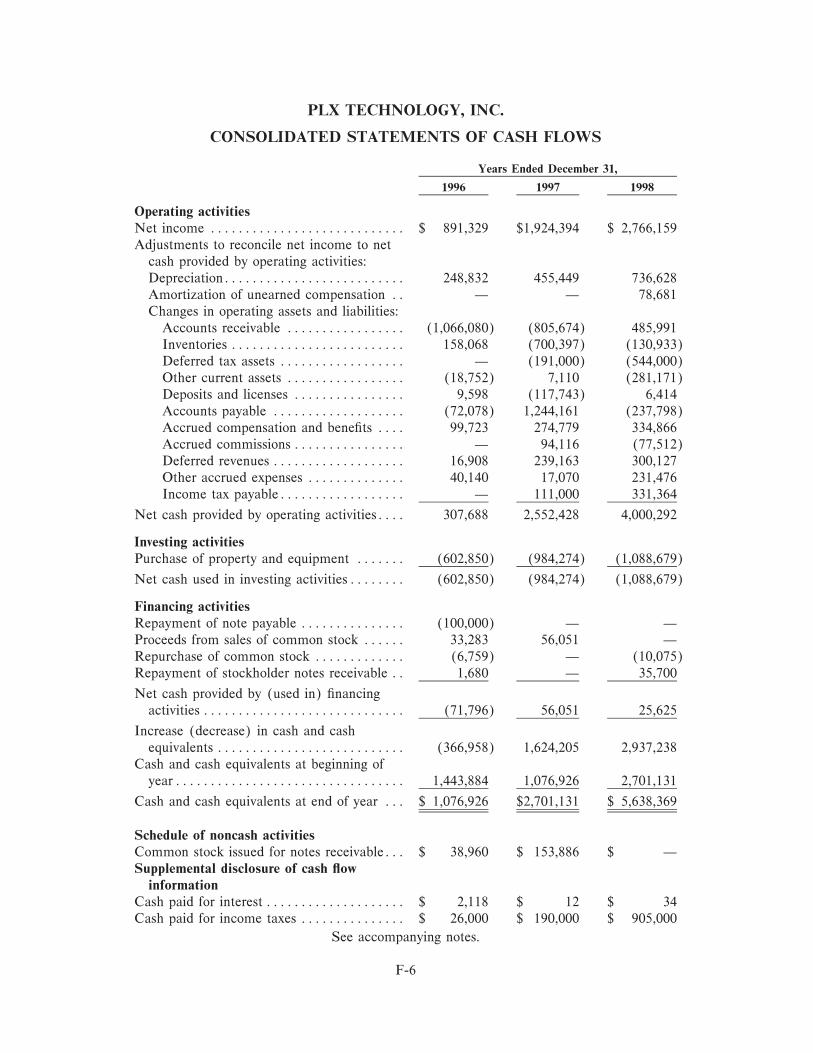
PLX TECHNOLOGY, INC.
CONSOLIDATED STATEMENTS OF CASH FLOWS
Years Ended December 31,
1996 1997 1998
Operating activitiesNet income ÏÏÏÏÏÏÏÏÏÏÏÏÏÏÏÏÏÏÏÏÏÏÏÏÏÏÏÏ $ 891,329 $1,924,394 $ 2,766,159Adjustments to reconcile net income to net
cash provided by operating activities:DepreciationÏÏÏÏÏÏÏÏÏÏÏÏÏÏÏÏÏÏÏÏÏÏÏÏÏÏ 248,832 455,449 736,628Amortization of unearned compensation ÏÏ Ì Ì 78,681Changes in operating assets and liabilities:
Accounts receivable ÏÏÏÏÏÏÏÏÏÏÏÏÏÏÏÏÏ (1,066,080) (805,674) 485,991Inventories ÏÏÏÏÏÏÏÏÏÏÏÏÏÏÏÏÏÏÏÏÏÏÏÏÏ 158,068 (700,397) (130,933)Deferred tax assets ÏÏÏÏÏÏÏÏÏÏÏÏÏÏÏÏÏÏ Ì (191,000) (544,000)Other current assets ÏÏÏÏÏÏÏÏÏÏÏÏÏÏÏÏÏ (18,752) 7,110 (281,171)Deposits and licenses ÏÏÏÏÏÏÏÏÏÏÏÏÏÏÏÏ 9,598 (117,743) 6,414Accounts payable ÏÏÏÏÏÏÏÏÏÏÏÏÏÏÏÏÏÏÏ (72,078) 1,244,161 (237,798)Accrued compensation and beneÑts ÏÏÏÏ 99,723 274,779 334,866Accrued commissions ÏÏÏÏÏÏÏÏÏÏÏÏÏÏÏÏ Ì 94,116 (77,512)Deferred revenues ÏÏÏÏÏÏÏÏÏÏÏÏÏÏÏÏÏÏÏ 16,908 239,163 300,127Other accrued expenses ÏÏÏÏÏÏÏÏÏÏÏÏÏÏ 40,140 17,070 231,476Income tax payableÏÏÏÏÏÏÏÏÏÏÏÏÏÏÏÏÏÏ Ì 111,000 331,364
Net cash provided by operating activitiesÏÏÏÏ 307,688 2,552,428 4,000,292
Investing activitiesPurchase of property and equipment ÏÏÏÏÏÏÏ (602,850) (984,274) (1,088,679)
Net cash used in investing activitiesÏÏÏÏÏÏÏÏ (602,850) (984,274) (1,088,679)
Financing activitiesRepayment of note payable ÏÏÏÏÏÏÏÏÏÏÏÏÏÏÏ (100,000) Ì ÌProceeds from sales of common stock ÏÏÏÏÏÏ 33,283 56,051 ÌRepurchase of common stock ÏÏÏÏÏÏÏÏÏÏÏÏÏ (6,759) Ì (10,075)Repayment of stockholder notes receivable ÏÏ 1,680 Ì 35,700
Net cash provided by (used in) Ñnancingactivities ÏÏÏÏÏÏÏÏÏÏÏÏÏÏÏÏÏÏÏÏÏÏÏÏÏÏÏÏÏ (71,796) 56,051 25,625
Increase (decrease) in cash and cashequivalents ÏÏÏÏÏÏÏÏÏÏÏÏÏÏÏÏÏÏÏÏÏÏÏÏÏÏÏ (366,958) 1,624,205 2,937,238
Cash and cash equivalents at beginning ofyearÏÏÏÏÏÏÏÏÏÏÏÏÏÏÏÏÏÏÏÏÏÏÏÏÏÏÏÏÏÏÏÏÏ 1,443,884 1,076,926 2,701,131
Cash and cash equivalents at end of year ÏÏÏ $ 1,076,926 $2,701,131 $ 5,638,369
Schedule of noncash activitiesCommon stock issued for notes receivableÏÏÏ $ 38,960 $ 153,886 $ ÌSupplemental disclosure of cash Öow
informationCash paid for interest ÏÏÏÏÏÏÏÏÏÏÏÏÏÏÏÏÏÏÏÏ $ 2,118 $ 12 $ 34Cash paid for income taxes ÏÏÏÏÏÏÏÏÏÏÏÏÏÏÏ $ 26,000 $ 190,000 $ 905,000
See accompanying notes.
F-6

PLX TECHNOLOGY, INC.
NOTES TO CONSOLIDATED FINANCIAL STATEMENTS
1. Organization and Summary of SigniÑcant Accounting Policies
Description of Business
PLX Technology, Inc. (the Company) develops and markets I/O interconnectivitysolutions that speed the transfer of data in high-performance embedded systems. TheCompany's principal products are high performance semiconductor devices, as well asrelated software development kits and hardware design kits. Semiconductor devicesaccount for a signiÑcant portion of the Company's net revenues.
Basis of Presentation
The consolidated Ñnancial statements include the accounts of the Company and itssubsidiary. All intercompany transactions and balances have been eliminated.
Cash and Cash Equivalents
The Company considers all highly liquid investments purchased with an originalmaturity of three months or less to be cash equivalents.
The Company accounts for its investments in accordance with Statement of FinancialAccounting Standards No. 115, ""Accounting for Certain Investments in Debt and EquitySecurities'' (FAS 115). Under FAS 115, management determines the appropriateclassiÑcation of debt securities at the time of purchase and reevaluates such designation asof each balance sheet date. At December 31, 1998, all debt securities are designated asavailable-for-sale. Available-for-sale securities are carried at fair value with unrealizedgains and losses reported in a separate component of stockholders' equity. The amortizedcost of debt securities in this category is adjusted for the amortization of premiums andthe accretion of discounts to maturity. Such amortization, as well as any interest earned onthe securities, is included in interest income, net. Realized gains and losses and declines invalue judged to be other-than-temporary on available-for-sale securities are included ininterest income and other, net. The cost of securities sold is based on the speciÑcidentiÑcation method.
As of December 31, 1997 and 1998, the Company's available-for-sale securitiesconsisted of $1,394,119 and $3,817 of money market funds, $150,000 and $0 of treasurynotes, and $0 and $3,980,195 of commercial paper, respectively. There were no unrealizedgains or unrealized losses as of December 31, 1997 or 1998. All such securities areincluded in cash and cash equivalents.
F-7
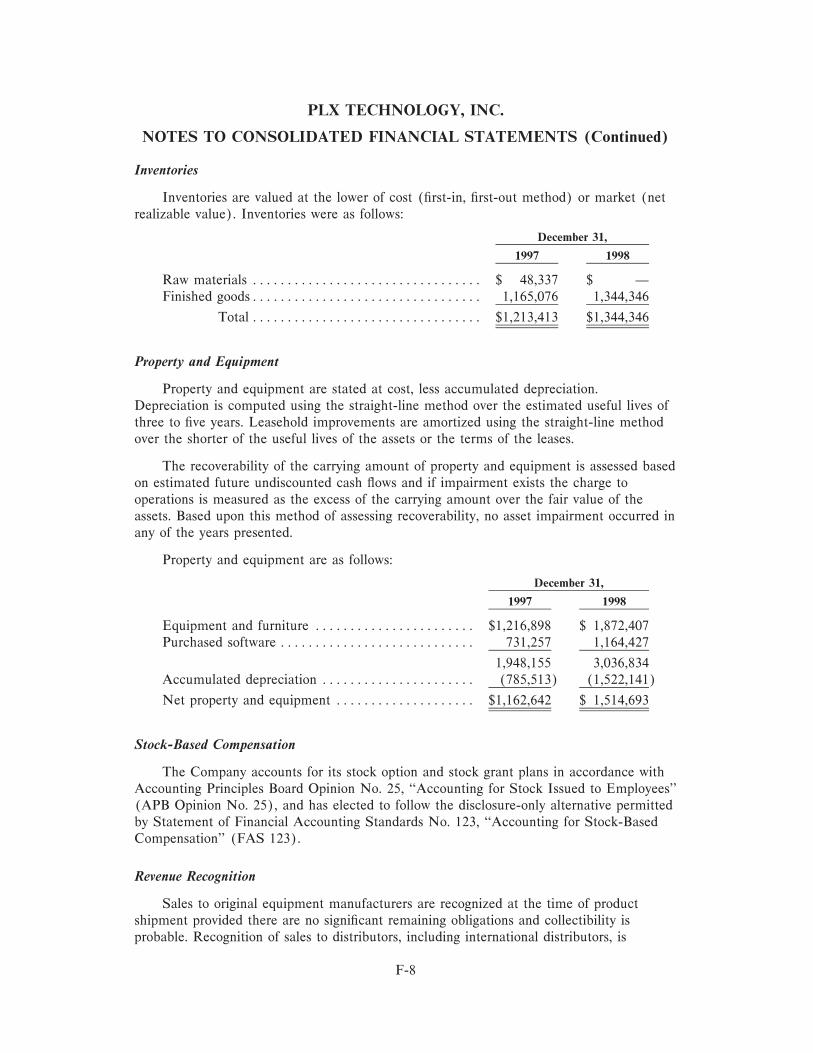
PLX TECHNOLOGY, INC.
NOTES TO CONSOLIDATED FINANCIAL STATEMENTS (Continued)
Inventories
Inventories are valued at the lower of cost (Ñrst-in, Ñrst-out method) or market (netrealizable value). Inventories were as follows:
December 31,
1997 1998
Raw materials ÏÏÏÏÏÏÏÏÏÏÏÏÏÏÏÏÏÏÏÏÏÏÏÏÏÏÏÏÏÏÏÏÏ $ 48,337 $ ÌFinished goodsÏÏÏÏÏÏÏÏÏÏÏÏÏÏÏÏÏÏÏÏÏÏÏÏÏÏÏÏÏÏÏÏÏ 1,165,076 1,344,346
Total ÏÏÏÏÏÏÏÏÏÏÏÏÏÏÏÏÏÏÏÏÏÏÏÏÏÏÏÏÏÏÏÏÏ $1,213,413 $1,344,346
Property and Equipment
Property and equipment are stated at cost, less accumulated depreciation.Depreciation is computed using the straight-line method over the estimated useful lives ofthree to Ñve years. Leasehold improvements are amortized using the straight-line methodover the shorter of the useful lives of the assets or the terms of the leases.
The recoverability of the carrying amount of property and equipment is assessed basedon estimated future undiscounted cash Öows and if impairment exists the charge tooperations is measured as the excess of the carrying amount over the fair value of theassets. Based upon this method of assessing recoverability, no asset impairment occurred inany of the years presented.
Property and equipment are as follows:
December 31,
1997 1998
Equipment and furniture ÏÏÏÏÏÏÏÏÏÏÏÏÏÏÏÏÏÏÏÏÏÏÏ $1,216,898 $ 1,872,407Purchased software ÏÏÏÏÏÏÏÏÏÏÏÏÏÏÏÏÏÏÏÏÏÏÏÏÏÏÏÏ 731,257 1,164,427
1,948,155 3,036,834Accumulated depreciation ÏÏÏÏÏÏÏÏÏÏÏÏÏÏÏÏÏÏÏÏÏÏ (785,513) (1,522,141)
Net property and equipment ÏÏÏÏÏÏÏÏÏÏÏÏÏÏÏÏÏÏÏÏ $1,162,642 $ 1,514,693
Stock-Based Compensation
The Company accounts for its stock option and stock grant plans in accordance withAccounting Principles Board Opinion No. 25, ""Accounting for Stock Issued to Employees''(APB Opinion No. 25), and has elected to follow the disclosure-only alternative permittedby Statement of Financial Accounting Standards No. 123, ""Accounting for Stock-BasedCompensation'' (FAS 123).
Revenue Recognition
Sales to original equipment manufacturers are recognized at the time of productshipment provided there are no signiÑcant remaining obligations and collectibility isprobable. Recognition of sales to distributors, including international distributors, is
F-8

PLX TECHNOLOGY, INC.
NOTES TO CONSOLIDATED FINANCIAL STATEMENTS (Continued)
deferred until the product is resold by the distributors to end users, provided there are nosigniÑcant remaining obligations and collectibility is probable. Net revenues from the saleof software development kits is insigniÑcant for all years presented.
Advertising Expenses
The Company accounts for advertising costs as expenses in the period in which theyare incurred. Advertising expenses for 1996, 1997, and 1998 were $23,158, $28,508, and$70,311, respectively.
Software Development Costs
In accordance with Statement of Financial Accounting Standards No. 86,""Accounting for the Costs of Computer Software to Be Sold, Leased, or OtherwiseMarketed,'' the Company capitalizes eligible computer software costs upon achievement oftechnological feasibility subject to net realizable value considerations. The Company hasdeÑned technological feasibility as completion of a working model. The period between theachievement of technological feasibility and release of the Company's software productshas been of short duration. As of December 31, 1998, such capitalizable costs wereinsigniÑcant. Accordingly the Company has charged all such costs to research anddevelopment expenses in the accompanying consolidated statements of income.
Use of Estimates
The preparation of Ñnancial statements in conformity with generally acceptedaccounting principles requires management to make estimates and assumptions that aÅectthe amounts reported in the Ñnancial statements and accompanying notes. Actual resultscould diÅer from those estimates and such diÅerences may be material to the Ñnancialstatements.
Recent Accounting Pronouncements
The Company has adopted Statement of Financial Accounting Standards No. 130,""Reporting Comprehensive Income'' (FAS 130). FAS 130 requires that all items requiredto be recognized under accounting standards as components of comprehensive income bereported in a Ñnancial statement that is displayed with the same prominence as otherÑnancial statements. The Company's comprehensive net income was the same as its netincome for the years ended December 31, 1996, 1997 and 1998.
EÅective January 1, 1998, the Company adopted Statement of Financial AccountingStandards No. 131, ""Disclosures about Segments of an Enterprise and RelatedInformation'' (FAS 131). FAS 131 superseded Statement of Financial AccountingStandards No. 14, ""Financial Reporting for Segments of a Business Enterprise.'' FAS 131establishes standards for the way that public business enterprises report information aboutoperating segments in annual Ñnancial statements and requires that those enterprises reportselected information about operating segments in interim Ñnancial reports. FAS 131 alsoestablishes standards for related disclosures about products and services, geographic areas,
F-9
PLX TECHNOLOGY, INC.
NOTES TO CONSOLIDATED FINANCIAL STATEMENTS (Continued)
and major customers. The adoption of FAS 131 did not aÅect the Company's results ofoperations or Ñnancial position, and did not aÅect the disclosure of segment information(see Note 9).
In June 1998, the Financial Accounting Standards Board issued Statement ofFinancial Accounting Standards No. 133, ""Accounting for Derivative Instruments andHedging Activities'' (FAS 133). FAS 133 provides a comprehensive and consistentstandard for the recognition and measurement of derivatives and hedging activities.FAS 133 is eÅective for Ñscal years beginning after June 15, 1999 and the Companybelieves that the adoption of FAS 133 will not have a signiÑcant impact on the Company'soperating results or cash Öows.
2. Net Income Per Share and Unaudited Pro Forma Stockholders' Equity
The Company follows the provisions of Statement of Financial Accounting StandardsNo. 128, ""Earnings Per Share.'' Basic net income per share is computed by dividing netincome by the weighted average number of common shares outstanding during the period.Diluted net income per share is calculated using the weighted average number ofoutstanding shares of common stock plus dilutive common stock equivalents.
In February 1998, the SEC issued StaÅ Accounting Bulletin No. 98 which requiresissuances of common stock, options and warrants for nominal consideration in periodspreceding an initial public oÅering to be included in the calculations of earnings per shareas if they were outstanding for all periods presented. To date, the Company has had noissuances of common stock, options, or warrants for nominal consideration.
If the oÅering contemplated by this prospectus is consummated, all of the convertiblepreferred stock outstanding as of the closing date will automatically be converted into13,738,908 shares of common stock based on the shares of convertible preferred stockoutstanding at December 31, 1998. The unaudited pro forma stockholders' equity reÖectsthis conversion.
F-10
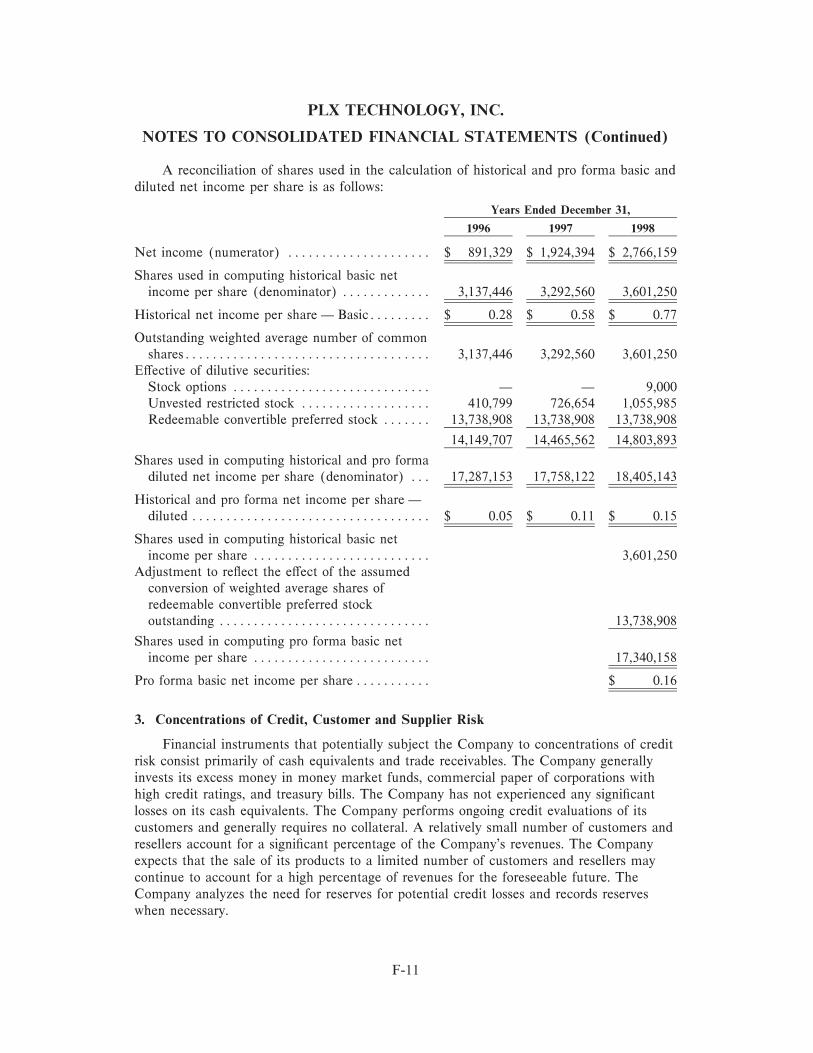
PLX TECHNOLOGY, INC.
NOTES TO CONSOLIDATED FINANCIAL STATEMENTS (Continued)
A reconciliation of shares used in the calculation of historical and pro forma basic anddiluted net income per share is as follows:
Years Ended December 31,
1996 1997 1998
Net income (numerator) ÏÏÏÏÏÏÏÏÏÏÏÏÏÏÏÏÏÏÏÏÏ $ 891,329 $ 1,924,394 $ 2,766,159
Shares used in computing historical basic netincome per share (denominator) ÏÏÏÏÏÏÏÏÏÏÏÏÏ 3,137,446 3,292,560 3,601,250
Historical net income per share Ì BasicÏÏÏÏÏÏÏÏÏ $ 0.28 $ 0.58 $ 0.77
Outstanding weighted average number of commonsharesÏÏÏÏÏÏÏÏÏÏÏÏÏÏÏÏÏÏÏÏÏÏÏÏÏÏÏÏÏÏÏÏÏÏÏÏ 3,137,446 3,292,560 3,601,250
EÅective of dilutive securities:Stock options ÏÏÏÏÏÏÏÏÏÏÏÏÏÏÏÏÏÏÏÏÏÏÏÏÏÏÏÏÏ Ì Ì 9,000Unvested restricted stock ÏÏÏÏÏÏÏÏÏÏÏÏÏÏÏÏÏÏÏ 410,799 726,654 1,055,985Redeemable convertible preferred stock ÏÏÏÏÏÏÏ 13,738,908 13,738,908 13,738,908
14,149,707 14,465,562 14,803,893
Shares used in computing historical and pro formadiluted net income per share (denominator) ÏÏÏ 17,287,153 17,758,122 18,405,143
Historical and pro forma net income per share Ìdiluted ÏÏÏÏÏÏÏÏÏÏÏÏÏÏÏÏÏÏÏÏÏÏÏÏÏÏÏÏÏÏÏÏÏÏÏ $ 0.05 $ 0.11 $ 0.15
Shares used in computing historical basic netincome per share ÏÏÏÏÏÏÏÏÏÏÏÏÏÏÏÏÏÏÏÏÏÏÏÏÏÏ 3,601,250
Adjustment to reÖect the eÅect of the assumedconversion of weighted average shares ofredeemable convertible preferred stockoutstanding ÏÏÏÏÏÏÏÏÏÏÏÏÏÏÏÏÏÏÏÏÏÏÏÏÏÏÏÏÏÏÏ 13,738,908
Shares used in computing pro forma basic netincome per share ÏÏÏÏÏÏÏÏÏÏÏÏÏÏÏÏÏÏÏÏÏÏÏÏÏÏ 17,340,158
Pro forma basic net income per share ÏÏÏÏÏÏÏÏÏÏÏ $ 0.16
3. Concentrations of Credit, Customer and Supplier Risk
Financial instruments that potentially subject the Company to concentrations of creditrisk consist primarily of cash equivalents and trade receivables. The Company generallyinvests its excess money in money market funds, commercial paper of corporations withhigh credit ratings, and treasury bills. The Company has not experienced any signiÑcantlosses on its cash equivalents. The Company performs ongoing credit evaluations of itscustomers and generally requires no collateral. A relatively small number of customers andresellers account for a signiÑcant percentage of the Company's revenues. The Companyexpects that the sale of its products to a limited number of customers and resellers maycontinue to account for a high percentage of revenues for the foreseeable future. TheCompany analyzes the need for reserves for potential credit losses and records reserveswhen necessary.
F-11

PLX TECHNOLOGY, INC.
NOTES TO CONSOLIDATED FINANCIAL STATEMENTS (Continued)
Currently, the Company relies on single source suppliers of materials for thesigniÑcant majority of its product inventory. As a result, should the Company's currentsuppliers not produce and deliver inventory for the Company to sell on a timely basis,operating results may be adversely impacted.
4. Redeemable Convertible Preferred Stock
Shares of Series A, B, C, and D preferred stock are convertible at the option of thestockholder into that number of shares of common stock as determined by dividing $0.167,$0.333, $0.458, and $0.467, respectively, by a conversion price as determined by theprovisions in the Articles of Incorporation, subject to antidilution provisions. AtDecember 31, 1997 and 1998, each share of preferred stock would convert to commonstock on a three-for-one basis. Conversion is mandatory concurrent with a Ñrmunderwritten public oÅering of not less than $10,000,000 with a per share price of not lessthan $1.67. The preferred stockholders have voting rights equal to the voting rights of thecommon stockholders on an as-if-converted basis.
Preferred stockholders are entitled to noncumulative dividends, when and if declaredby the Board of Directors, at an annual amount of $0.05, $0.10, $0.1375, and $0.14 pershare of Series A, B, C, and D preferred stock, respectively. Such dividends have apreference over the payment of dividends on common stock.
In the event of liquidation, the preferred stockholders are entitled to a liquidationpreference distribution of $0.50, $1.00, $1.375, and $1.40 per share of Series A, B, C, andD preferred stock, respectively, plus all declared and unpaid dividends. Aggregateliquidation preferences amounted to $4,946,027 at December 31, 1997 and 1998.
The Company may, at the option of the Board of Directors, redeem the Series A, B,C, or D convertible preferred stock at any time after written request by the holders of atleast 67% of any class of preferred stock outstanding. The Company may redeem that classof preferred stock in whole or in part by paying $0.50, $1.00, $1.375, and $1.40 per shareof Series A, B, C, and D convertible preferred stock, respectively, plus all declared butunpaid dividends.
At December 31, 1997 and 1998, 5,000,000 shares of redeemable convertible preferredstock were authorized. At December 31, 1997 and 1998, designated, issued, andoutstanding redeemable convertible preferred stock by series was as follows:
SharesDesignated Issued and
Series Shares Outstanding
AÏÏÏÏÏÏÏÏÏÏÏÏÏÏÏÏÏÏÏÏÏÏÏÏÏÏÏÏÏÏÏÏÏÏÏÏÏÏÏÏÏÏÏÏÏÏ 1,300,000 1,300,000BÏÏÏÏÏÏÏÏÏÏÏÏÏÏÏÏÏÏÏÏÏÏÏÏÏÏÏÏÏÏÏÏÏÏÏÏÏÏÏÏÏÏÏÏÏÏ 650,000 650,000CÏÏÏÏÏÏÏÏÏÏÏÏÏÏÏÏÏÏÏÏÏÏÏÏÏÏÏÏÏÏÏÏÏÏÏÏÏÏÏÏÏÏÏÏÏÏ 1,418,738 1,418,529DÏÏÏÏÏÏÏÏÏÏÏÏÏÏÏÏÏÏÏÏÏÏÏÏÏÏÏÏÏÏÏÏÏÏÏÏÏÏÏÏÏÏÏÏÏÏ 1,500,000 1,211,107
TotalÏÏÏÏÏÏÏÏÏÏÏÏÏÏÏÏÏÏÏÏÏÏÏÏÏÏÏÏÏÏÏÏÏÏÏÏÏÏÏÏÏÏÏ 4,868,738 4,579,636
F-12

PLX TECHNOLOGY, INC.
NOTES TO CONSOLIDATED FINANCIAL STATEMENTS (Continued)
5. Common Stock
At December 31, 1998, common stock was reserved for future issuance as follows:
Conversion of preferred stock:Series A ÏÏÏÏÏÏÏÏÏÏÏÏÏÏÏÏÏÏÏÏÏÏÏÏÏÏÏÏÏÏÏÏÏÏÏÏÏÏÏÏÏÏÏÏÏÏÏ 3,900,000Series B ÏÏÏÏÏÏÏÏÏÏÏÏÏÏÏÏÏÏÏÏÏÏÏÏÏÏÏÏÏÏÏÏÏÏÏÏÏÏÏÏÏÏÏÏÏÏÏ 1,950,000Series C ÏÏÏÏÏÏÏÏÏÏÏÏÏÏÏÏÏÏÏÏÏÏÏÏÏÏÏÏÏÏÏÏÏÏÏÏÏÏÏÏÏÏÏÏÏÏÏ 4,255,587Series D ÏÏÏÏÏÏÏÏÏÏÏÏÏÏÏÏÏÏÏÏÏÏÏÏÏÏÏÏÏÏÏÏÏÏÏÏÏÏÏÏÏÏÏÏÏÏÏ 3,633,321
Authorized for future option exercises ÏÏÏÏÏÏÏÏÏÏÏÏÏÏÏÏÏÏÏÏÏÏÏÏÏÏ 800,000
14,538,908
On May 7, 1986, the Board of Directors of the Company approved a form ofRestricted Stock Purchase Agreement to be used to sell restricted shares of the Company'scommon stock (the ""Restricted Stock'') to its employees, oÇcers and consultants. Therewas no formal, written plan. From time to time, the Board of Directors reserved shares ofits common stock for grant under the program. At December 31, 1998, a total of 4,402,060shares of Restricted Stock were issued and outstanding pursuant to the program. Theshares were issued at fair market value as determined by the Board of Directors. Therepurchase price of the restricted shares is the original sales price. The shares are subjectto a repurchase option in favor of the Company (the ""Repurchase Option'') that expiresover a period of four years from the date of issuance. Under the program's standard vestingschedule, the number of shares subject to the Repurchase Option is reduced as follows:(i) on the Ñrst anniversary of the date of issuance, the number of shares subject to theRepurchase Option is reduced by 25%; and (ii) each month thereafter, the number ofshares subject to the Repurchase Option is reduced by 2.083% of the total RestrictedStock issued. As consideration for the issuance of such Restricted Stock, each of theoÇcers has paid 20% of the aggregate purchase price of the Restricted Stock issued to himin cash and has executed a promissory note (each, a ""Note'') for the remaining 80% ofthe aggregate purchase price. The Notes bear interest at a rate of 6% per annum andbecome due and payable upon the earlier of (i) four years from the date of issuance or(ii) the eÅectiveness of a registration statement pursuant to which the subject securitiesmay be oÅered and sold by such oÇcers; provided, however, that in the event the oÇcersare restricted by the terms of market stand-oÅ agreements relating to the securities,amounts that would become due under the Notes upon such registration are reduced to theamount that would be covered by sale of shares allowed to be sold. The due dates of theloans did not extend past the Repurchase Option of the Company. The notes are fullrecourse and, in addition, each of the executive oÇcers has pledged the Restricted Stockas collateral to secure the obligations under his Note. The program was terminated uponadoption of our 1998 Incentive Stock Plan on January 15, 1998.
The Company's 1998 Stock Incentive Plan (the 1998 Plan) was approved by theBoard of Directors on January 15, 1998. The 1998 Plan provides for the grant of bothincentive and nonqualiÑed stock options. A total of 800,000 shares of common stock havebeen reserved for issuance under the 1998 Plan. The maximum term of any stock optiongranted under the 1998 Plan is ten years, except that with respect to incentive stockoptions granted to a person possessing more than 10% of the combined voting power of theCompany (a 10% stockholder), the term of such stock options shall be for no more than
F-13

PLX TECHNOLOGY, INC.
NOTES TO CONSOLIDATED FINANCIAL STATEMENTS (Continued)
Ñve years. The exercise price of incentive stock options granted under the 1998 Plan mustbe at least 100% of the fair market value of the common stock on the grant date exceptthat the exercise price of incentive stock options granted to a 10% stockholder must be atleast 110% of such fair market value on the date of grant. The options generally vest overa period of three to four years.
Activity under the 1998 Plan is summarized as follows:
Options Outstanding
Options Aggregate WeightedAvailable Number of Exercise Averagefor Grant Options Price Exercise Price
Balance at January 1, 1998 ÏÏÏÏÏÏÏÏÏÏÏ Ì Ì $ Ì $ ÌOptions authorized ÏÏÏÏÏÏÏÏÏÏÏÏÏÏÏÏ 800,000 Ì Ì $ ÌOptions grantedÏÏÏÏÏÏÏÏÏÏÏÏÏÏÏÏÏÏÏ (660,250) 660,250 3,246,250 $4.92Options canceledÏÏÏÏÏÏÏÏÏÏÏÏÏÏÏÏÏÏ 15,000 (15,000) (75,000) $5.00
Balance at December 31, 1998 ÏÏÏÏÏÏÏÏ 154,750 645,250 $3,171,250 $4.91
The following table summarizes the information about options outstanding atDecember 31, 1998:
Options Outstanding Options Exercisable
WeightedAverage Weighted Weighted
Remaining Average AverageRange Of Number Contractual Exercise Number ExerciseExercise Price Outstanding Life Price Exercisable Price
$3.00ÏÏÏÏÏÏÏÏÏÏÏÏÏÏÏÏÏÏÏÏÏ 27,500 9.08 years $3.00 27,500 $3.00$5.00ÏÏÏÏÏÏÏÏÏÏÏÏÏÏÏÏÏÏÏÏÏ 617,750 9.43 years $5.00 617,750 $5.00
Total ÏÏÏÏÏÏÏÏÏÏÏÏÏÏÏÏÏÏÏÏÏ 645,250 9.42 years $4.91 645,250 $4.91
As of December 31, 1998, there were 60,124 stock options vested at a weightedaverage exercise price of $4.94 per share.
The Company has elected to follow APB Opinion No. 25 and related interpretationsin accounting for its stock grants since the alternative fair market value accountingprovided for under FAS 123 requires use of grant valuation models that were notdeveloped for use in valuing stock grants. Under APB Opinion No. 25, as the exerciseprice of the Company's stock grants and options equals the deemed fair value of theunderlying stock on the date of grant, no compensation expenses are recognized.
During the years ended December 31, 1997 and 1998, the Company recorded aggregatedeferred compensation of $361,300, representing the difference between the grant price andthe deemed fair value of the Company's common stock options granted during these periods.The amortization of deferred compensation is charged to operations and is amortized over thevesting period of the options, which is typically four years. For the years ended December 31,1997 and 1998, the amortization expenses were $0 and $78,681, respectively.
F-14
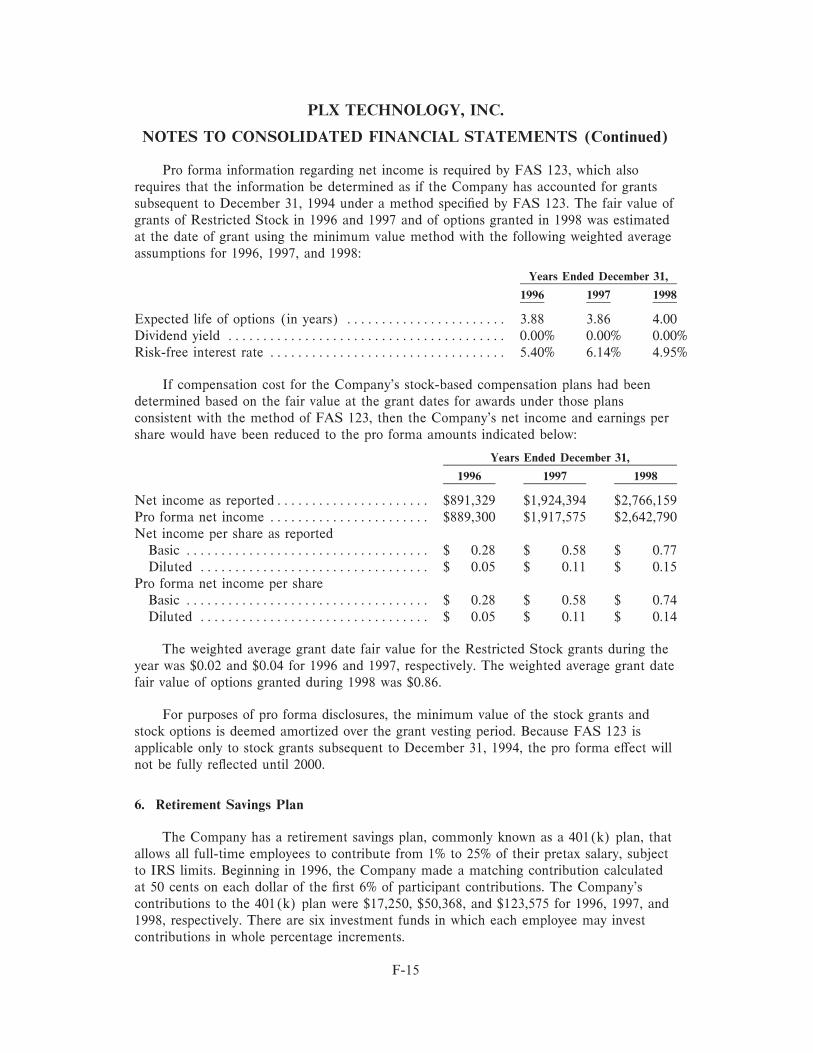
PLX TECHNOLOGY, INC.
NOTES TO CONSOLIDATED FINANCIAL STATEMENTS (Continued)
Pro forma information regarding net income is required by FAS 123, which alsorequires that the information be determined as if the Company has accounted for grantssubsequent to December 31, 1994 under a method speciÑed by FAS 123. The fair value ofgrants of Restricted Stock in 1996 and 1997 and of options granted in 1998 was estimatedat the date of grant using the minimum value method with the following weighted averageassumptions for 1996, 1997, and 1998:
Years Ended December 31,
1996 1997 1998
Expected life of options (in years) ÏÏÏÏÏÏÏÏÏÏÏÏÏÏÏÏÏÏÏÏÏÏÏ 3.88 3.86 4.00Dividend yield ÏÏÏÏÏÏÏÏÏÏÏÏÏÏÏÏÏÏÏÏÏÏÏÏÏÏÏÏÏÏÏÏÏÏÏÏÏÏÏÏ 0.00% 0.00% 0.00%Risk-free interest rate ÏÏÏÏÏÏÏÏÏÏÏÏÏÏÏÏÏÏÏÏÏÏÏÏÏÏÏÏÏÏÏÏÏÏ 5.40% 6.14% 4.95%
If compensation cost for the Company's stock-based compensation plans had beendetermined based on the fair value at the grant dates for awards under those plansconsistent with the method of FAS 123, then the Company's net income and earnings pershare would have been reduced to the pro forma amounts indicated below:
Years Ended December 31,
1996 1997 1998
Net income as reportedÏÏÏÏÏÏÏÏÏÏÏÏÏÏÏÏÏÏÏÏÏÏ $891,329 $1,924,394 $2,766,159Pro forma net income ÏÏÏÏÏÏÏÏÏÏÏÏÏÏÏÏÏÏÏÏÏÏÏ $889,300 $1,917,575 $2,642,790Net income per share as reported
Basic ÏÏÏÏÏÏÏÏÏÏÏÏÏÏÏÏÏÏÏÏÏÏÏÏÏÏÏÏÏÏÏÏÏÏÏ $ 0.28 $ 0.58 $ 0.77Diluted ÏÏÏÏÏÏÏÏÏÏÏÏÏÏÏÏÏÏÏÏÏÏÏÏÏÏÏÏÏÏÏÏÏ $ 0.05 $ 0.11 $ 0.15
Pro forma net income per shareBasic ÏÏÏÏÏÏÏÏÏÏÏÏÏÏÏÏÏÏÏÏÏÏÏÏÏÏÏÏÏÏÏÏÏÏÏ $ 0.28 $ 0.58 $ 0.74Diluted ÏÏÏÏÏÏÏÏÏÏÏÏÏÏÏÏÏÏÏÏÏÏÏÏÏÏÏÏÏÏÏÏÏ $ 0.05 $ 0.11 $ 0.14
The weighted average grant date fair value for the Restricted Stock grants during theyear was $0.02 and $0.04 for 1996 and 1997, respectively. The weighted average grant datefair value of options granted during 1998 was $0.86.
For purposes of pro forma disclosures, the minimum value of the stock grants andstock options is deemed amortized over the grant vesting period. Because FAS 123 isapplicable only to stock grants subsequent to December 31, 1994, the pro forma eÅect willnot be fully reÖected until 2000.
6. Retirement Savings Plan
The Company has a retirement savings plan, commonly known as a 401(k) plan, thatallows all full-time employees to contribute from 1% to 25% of their pretax salary, subjectto IRS limits. Beginning in 1996, the Company made a matching contribution calculatedat 50 cents on each dollar of the Ñrst 6% of participant contributions. The Company'scontributions to the 401(k) plan were $17,250, $50,368, and $123,575 for 1996, 1997, and1998, respectively. There are six investment funds in which each employee may investcontributions in whole percentage increments.
F-15

PLX TECHNOLOGY, INC.
NOTES TO CONSOLIDATED FINANCIAL STATEMENTS (Continued)
7. Income Taxes
The provision for income taxes consists of the following:
Years Ended December 31,
1996 1997 1998
Federal:CurrentÏÏÏÏÏÏÏÏÏÏÏÏÏÏÏÏÏÏÏÏÏÏÏÏÏÏÏÏÏÏÏÏÏÏÏÏ $37,714 $291,000 $1,235,000Deferred ÏÏÏÏÏÏÏÏÏÏÏÏÏÏÏÏÏÏÏÏÏÏÏÏÏÏÏÏÏÏÏÏÏÏÏ Ó (191,000) (544,000)
37,714 100,000 691,000
State:CurrentÏÏÏÏÏÏÏÏÏÏÏÏÏÏÏÏÏÏÏÏÏÏÏÏÏÏÏÏÏÏÏÏÏÏÏÏ 800 10,355 1,000Deferred ÏÏÏÏÏÏÏÏÏÏÏÏÏÏÏÏÏÏÏÏÏÏÏÏÏÏÏÏÏÏÏÏÏÏÏ Ó Ó Ó
800 10,355 1,000
Total ÏÏÏÏÏÏÏÏÏÏÏÏÏÏÏÏÏÏÏÏÏÏÏÏÏÏÏÏÏÏÏÏ $38,514 $110,355 $ 692,000
The provision for income taxes diÅers from the amount of income taxes determinedby applying the U.S. statutory federal income tax rate as follows:
1996 1997 1998
Tax at the U.S. statutory rate ÏÏÏÏÏÏÏÏÏÏÏÏÏÏÏÏÏÏ $325,000 $712,000 $1,210,000BeneÑt of net operating losses ÏÏÏÏÏÏÏÏÏÏÏÏÏÏÏÏÏÏ (249,000) (502,000) ÓImpact of temporary diÅerences ÏÏÏÏÏÏÏÏÏÏÏÏÏÏÏÏ (48,000) 234,000 ÓResearch and development credits ÏÏÏÏÏÏÏÏÏÏÏÏÏÏ Ó (215,000) (226,000)Adjustment of the valuation allowanceÏÏÏÏÏÏÏÏÏÏÏ Ó (191,000) (337,000)Other ÏÏÏÏÏÏÏÏÏÏÏÏÏÏÏÏÏÏÏÏÏÏÏÏÏÏÏÏÏÏÏÏÏÏÏÏÏÏ 10,514 72,355 45,000
$ 38,514 $110,355 $ 692,000
SigniÑcant components of the Company's deferred tax assets are as follows:
December 31,
1997 1998
Deferred tax assets:Reserves and accruals not currently deductibleÏÏÏÏÏÏ $ 434,000 $683,000Research credit carryforwards ÏÏÏÏÏÏÏÏÏÏÏÏÏÏÏÏÏÏÏÏ 70,000 ÓOther individually immaterial items ÏÏÏÏÏÏÏÏÏÏÏÏÏÏÏ 94,000 52,000
Total deferred tax assetsÏÏÏÏÏÏÏÏÏÏÏÏÏÏÏÏÏÏÏÏÏÏÏÏÏÏÏ 598,000 735,000Valuation allowance for deferred tax assets ÏÏÏÏÏÏÏÏÏÏÏ (407,000) Ì
Net deferred tax assetsÏÏÏÏÏÏÏÏÏÏÏÏÏÏÏÏÏÏÏÏÏÏÏÏÏÏÏÏ $ 191,000 $735,000
The valuation allowance decreased by $639,000 and $407,000 in 1997 and 1998,respectively.
8. Lease Commitments
The Company leases its facilities under noncancelable lease agreements, and rentalexpenses for all leases aggregated approximately $217,000, $264,000, and $641,000 for the
F-16

PLX TECHNOLOGY, INC.
NOTES TO CONSOLIDATED FINANCIAL STATEMENTS (Continued)
years ended December 31, 1996, 1997, and 1998, respectively. Future minimum leasepayments at December 31, 1998 are as follows:
1999 ÏÏÏÏÏÏÏÏÏÏÏÏÏÏÏÏÏÏÏÏÏÏÏÏÏÏÏÏÏÏÏÏÏÏÏÏÏÏÏÏÏÏÏÏÏÏ $ 658,3232000 ÏÏÏÏÏÏÏÏÏÏÏÏÏÏÏÏÏÏÏÏÏÏÏÏÏÏÏÏÏÏÏÏÏÏÏÏÏÏÏÏÏÏÏÏÏÏ 685,0402001 ÏÏÏÏÏÏÏÏÏÏÏÏÏÏÏÏÏÏÏÏÏÏÏÏÏÏÏÏÏÏÏÏÏÏÏÏÏÏÏÏÏÏÏÏÏÏ 495,9192002 ÏÏÏÏÏÏÏÏÏÏÏÏÏÏÏÏÏÏÏÏÏÏÏÏÏÏÏÏÏÏÏÏÏÏÏÏÏÏÏÏÏÏÏÏÏÏ 473,4582003 ÏÏÏÏÏÏÏÏÏÏÏÏÏÏÏÏÏÏÏÏÏÏÏÏÏÏÏÏÏÏÏÏÏÏÏÏÏÏÏÏÏÏÏÏÏÏ 493,520Beyond 2003 ÏÏÏÏÏÏÏÏÏÏÏÏÏÏÏÏÏÏÏÏÏÏÏÏÏÏÏÏÏÏÏÏÏÏÏÏÏÏÏ 469,540
Total minimum lease paymentsÏÏÏÏÏÏÏÏÏÏÏÏÏÏÏÏÏÏÏÏÏÏÏÏ $3,275,800
9. Segments of an Enterprise and Related Information
The Company operates in one business segment, the sale of semiconductor devices.The President has been identiÑed as the Chief Operating Decision Maker(CODM) because he has Ñnal authority over resource allocation decisions andperformance assessment. The CODM does not receive discrete Ñnancial information aboutindividual components.
Total net export revenues to regions outside of North America were $2,047,781,$3,903,566, and $8,896,927 for the years ended December 31, 1996, 1997, and 1998,respectively. Revenues by geographic region were as follows:
Years Ended December 31,
1996 1997 1998
Revenues:United StatesÏÏÏÏÏÏÏÏÏÏÏÏÏÏÏÏÏÏÏÏÏÏÏÏÏ $7,130,882 $12,437,302 $16,370,246Other North AmericaÏÏÏÏÏÏÏÏÏÏÏÏÏÏÏÏÏÏ 634,836 1,192,763 1,009,028Europe ÏÏÏÏÏÏÏÏÏÏÏÏÏÏÏÏÏÏÏÏÏÏÏÏÏÏÏÏÏÏ 1,588,893 2,962,959 6,282,975Asia ÏÏÏÏÏÏÏÏÏÏÏÏÏÏÏÏÏÏÏÏÏÏÏÏÏÏÏÏÏÏÏÏ 458,888 940,607 2,613,952
Total ÏÏÏÏÏÏÏÏÏÏÏÏÏÏÏÏÏÏÏÏÏÏÏÏÏÏÏÏÏÏÏÏÏÏ $9,813,499 $17,533,631 $26,276,201
For the year ended December 31, 1996, one customer, a related party, accounted for10% of net revenues. For the year ended December 31, 1997, no customer accounted formore than 10% of net revenues. For the year ended December 31, 1998, two customersaccounted for more than 10% of net revenues. One customer, a U.S. distributor, accountedfor 22% of net revenues and another customer, a European distributor, accounted for 11%of net revenues.
10. Related Party Transactions
The Company and a customer are related parties because the chairman of theCompany's Board of Directors also serves on the customer's Board of Directors. For theyears ended December 31, 1996, 1997, and 1998, net revenues, which were transacted atarms' length prices, to the customer were approximately $962,000, $765,000, and $330,000,respectively.
In June 1997, the Company purchased 892,857 shares of preferred stock of SebringSystems, Inc. for $100,000. The Company expensed this $100,000 in 1997 due to Sebring
F-17
PLX TECHNOLOGY, INC.
NOTES TO CONSOLIDATED FINANCIAL STATEMENTS (Continued)
spending this amount on research and development. This amount is included in researchand development expenses in the 1997 consolidated statement of income. The chairman ofthe Company's Board of Directors is also the chairman of the other company.
11. Subsequent Events
On January 25, 1999, the Company's Board of Directors approved the 1999 StockIncentive Plan (the 1999 Plan). The 1999 Plan provides for the grant of incentive andnonqualiÑed stock options. A total of 1,000,000 shares of common stock have beenreserved for issuance under the 1999 Plan. The maximum term of any stock option grantedunder the 1999 Plan is ten years, except that with respect to incentive stock optionsgranted to a person possessing more than 10% of the combined voting power of theCompany (a 10% Stockholder), the term of such stock options shall be for no more thanÑve years. The exercise price of incentive stock options granted under the 1999 Plan mustbe at least 100% of the fair market value of the common stock on the grant date exceptthat the exercise price of incentive stock options granted to a 10% Stockholder must be atleast 110% of such fair market value on the date of grant.
On January 25, 1999, the Company's Board of Directors approved an increase in thenumber of shares reserved for issuance under the 1998 Plan from 800,000 to 1,300,000.
On March 22, 1999 the Company reincorporated in the State of Delaware. The parvalue of the preferred and common stock is $0.001 per share. The Company's CertiÑcateof Incorporation will be amended to authorize 5,000,000 shares of preferred stock. TheBoard of Directors has the authority to Ñx or alter the designations, powers, preferencesand rights of the shares of each such series. The Company's reincorporation has beenreÖected in the consolidated Ñnancial statements for all periods presented.
F-18
Through and including April 30, 1999 (the 25th day after the date of this prospectus),all dealers eÅecting transactions in these securities, whether or not participating in thisoÅering, may be required to deliver a prospectus. This is in addition to the dealers' obligationto deliver a prospectus when acting as underwriters and with respect to their unsoldallotments or subscriptions.
3,300,000 Shares
Common Stock
PROSPECTUS
Merrill Lynch & Co.
NationsBanc Montgomery Securities LLC
Wit Capital Corporation
April 5, 1999


![[PAGE INTENTIONALLY LEFT BLANK]€¦ · inogen, inc. fiscal 2015 annual report. [page intentionally left blank]](https://img.pdfslide.us/doc/110x75/603dd78a05f41851485839e0/page-intentionally-left-blank-inogen-inc-fiscal-2015-annual-report-page-intentionally.jpg)


![[This space left intentionally blank]](https://img.pdfslide.us/doc/110x75/568159d1550346895dc723b5/this-space-left-intentionally-blank.jpg)