Embed Size (px)
Citation preview
ii
Intensive Quenching Technology for Advanced Weapon Systems
Phase I Report Cooperative Agreement Award:
W15QKN-06-2-0105
Prepared for:
U.S. Army Benet Laboratories
ATTN: AMSRD-AAR-AEW 1 Buffington St.
Watervliet, NY 12189-4000
Prepared by:
IQ Technologies Inc Deformation Control Technology, Inc.
Air Flow Sciences Corporation Benet Laboratories
NexTec Corp. Edison Materials Technology Center
December 18, 2007
ii
Table of Content
PageExecutive Summary……………………………………………………………………….. Vii Introduction………………………………………………………………………………… 1 1. IMPROVEMENT OF EXISTING INTENSIVE QUENCHING EQUIPMENT… 3 1.1 Description of High-Velocity IQ System…………………………………………. 3 1.2 Improvement of High-Velocity IQ System Capabilities………………………….. 5 2. INTENSIVE QUENCHING PROCESS FOR GUN BARRELS…………………. 6 2.1 Foundation for Implementing IQ Process for Gun Barrels………………………… 6 2.2 Material Characterization Study of Gun Barrel Steels……………………………... 9 2.3 Quenching of Actual Small Caliber Gun Barrel Blanks…………………………… 14 2.4 Conceptual Design of IQ System for Large Caliber Cannon Barrels……………….. 16 2.5 Conceptual Design of IQ System for Small Caliber Gun Barrels………………….. 22 2.6 Computer Simulation of Heat Treatment Process for Gun Barrels…………………. 26 3. INTENSIVE QUENCHING PROCESS FOR HELICOPTER GEARS…………… 47 3.1 Foundation for Implementing IQ Process for Helicopter Gears……………………. 47 3.2 Production Quality Control Development for Residual Stress……………………… 49 3.3 Quenching of Test Gears in High-Velocity IQ System……………………………... 56 3.4 Dynamic Load Testing Results……………………………………………………… 60 3.5 Conceptual Design of IQ System for Helicopter Gears……………………………… 60 4. INTENSIVE QUENCHING FOR OTHER WEAPON SYSTEM COMPONENTS 69 4.1 Evaluation of Industrial Capacity for IQ Applications……………………………… 69 4.2 Determination of Feasibility of IQ Process for Different Weapon Systems………... 71 5. CONCLUSIONS AND RECOMMENDATIONS…………………………………….. 87 Appendix A Basics of Intensive Quenching Process…………………………………….. 90 Appendix B Computational Fluid Dynamic and Heat Transfer Analysis for
Optimizing IQ System Designs…………………………………………….. 98 Appendix C AWS Second Annual Program Plan.…………………………….................. 134
iii
List of Figures
Figure 1.1 Photograph of High-Velocity IQ System ................................................................................ 3 Figure 1.2 Schematic of High-Velocity IQ System .................................................................................. 4 Figure 2.1 Fixture for Quenching Ø1”x5” Test Samples ......................................................................... 11 Figure 2.2 Fixture for Quenching Ø4”x6” Test Samples ......................................................................... 11 Figure 2.3 Basket for Transferring Ø4”x6” Samples ................................................................................ 11 Figure 2.4 Hot Ø4”x6” Test Sample Inside Part Holder .......................................................................... 11 Figure 2.5 Fixture for Quenching Actual Small Caliber Gun Barrel Blanks ............................................ 15 Figure 2.6 Fixture for Transferring Actual Small Caliber Gun Barrel Blanks ......................................... 15 Figure 2.7 Large Caliber Cannon Barrel Sketches ................................................................................... 17 Figure 2.8 Quenching of Long Cannon Barrel in IQ System ................................................................... 18 Figure 2.9 Quenching of Short Cannon Barrel in IQ System ................................................................... 19 Figure 2.10 Small Caliber Guns .................................................................................................................. 23 Figure 2.11 IQ Unit for Processing Small Caliber Gun Barrels ................................................................. 24 Figure 2.12 Furnace for Heating Small Caliber Gun Barrels With Loading/Unloading System ............... 24 Figure 2.13 Predicted Residual Stress State for Model 1 ........................................................................... 28 Figure 2.14 Predicted Phase Distributions for Model 1 .............................................................................. 29 Figure 2.15 Profiles of Temperature, Martensite and Hoop Stress at the Time of Maximum Tensile
Stress in Quenched Piece for Model 1 .................................................................................... 29 Figure 2.16 Predicted Residual Stress State for Model 2 ........................................................................... 30 Figure 2.17 Predicted Metallurgical Phase Fractions for Model 2 ............................................................. 31 Figure 2.18 Profiles of Temperature, Martensite and Hoop Stress at the Time of Maximum Tensile
Stress in Quenched Piece for Model 2 .................................................................................... 31 Figure 2.19 Predicted Residual Stress State for Model 3 ........................................................................... 32 Figure 2.20 Profiles of Temperature, Martensite and Hoop Stress at the Time of Maximum Tensile
Stress in Quenched Piece for Model 3 .................................................................................... 33 Figure 2.21 Predicted Distributions of Metallurgical Phases After Intensive Quenching for Model 3 ...... 33 Figure 2.22 Predicted Residual Stress State for Model 4 ........................................................................... 34 Figure 2.23 Profiles of Temperature, Martensite and Hoop Stress at the Time of Maximum Tensile
Stress in Quenched Piece for Model 4 .................................................................................... 35 Figure 2.24 Predicted Metallurgical Phase Distributions After Intensive Quenching for Model 4 ........... 35 Figure 2.25 Predicted Residual Stress State for Model 5 ........................................................................... 36 Figure 2.26 Profiles of Temperature, Martensite and Hoop Stress at the Time of Maximum Tensile
Stress in Quenched Piece for Model 5 .................................................................................... 37 Figure 2.27 Predicted Metallurgical Phase Distributions After Intensive Quenching for Model 5 ........... 37 Figure 2.28 Predicted Residual Stress State for Model 6 ........................................................................... 38 Figure 2.29 Profiles of Temperature, Martensite and Hoop Stress at the Time of Maximum Tensile
Stress in Quenched Piece for Model ....................................................................................... 39 Figure 2.30 Predicted Metallurgical Phase Distributions After Intensive Quenching for Model 6 ........... 39
iv
List of Figures (Continued)
Figure 2.31 Cross Section of Small Caliber Barrel Used for the Baseline Quench Hardening and
Ballistics Models ................................................................................................................... 40 Figure 2.32 Hoop Stress Predicted for the Baseline Oil Quench Hardened M19 Barrel ......................... 41 Figure 2.33 Hoop Stress Generated in Oil Quench Hardened Barrel for an Inner Barrel Pressure of 200
MPa ................................................................................................................................. 41 Figure 2.34 Predicted Hoop Stress for Intensively Quenched M19 Steel Barrel. Both ID and OD
Surfaces are Quenched .......................................................................................................... 42 Figure 2.35 Hoop Stress with the Additional Pressure of 200 MPa Applied on the Bore Surface for the
Intensively Quenched M19 Steel Barrel ................................................................................ 42 Figure 2.36 Predicted Hoop Stress for and M19 Steel Barrel Intensively Quenched Only on the OD
Surface ................................................................................................................................... 43 Figure 2.37 Hoop Stress with the Additional Pressure of 200 MPa Applied on the Bore Surface for the
M19 Steel Barrel Intensively Quenched Only on the OD Surface ........................................ 43 Figure 2.38 Predicted Hoop Stress Distribution from Bore to OD for the Oil Quenched and Intensively
Quenched Conditions for the M19 Barrels ............................................................................ 44 Figure 2.39 Hoop Stress Distribution for the Bore Pressurized Condition for the Oil Quenched or
Intensively Quenched M19 Barrels ....................................................................................... 44 Figure 2.40 Predicted Residual Hoop Stress Resulting from Intensive Quenching of the Baseline
Barrel (~5.8 mm Thick), 15% Thinner (~4.93 mm Thick) and 25% Thinner Barrels (~4.35 mm Thick) ............................................................................................................................. 45
Figure 2.41 Predicted Hoop Stress Resulting from a 200 MPa Bore Pressure Applied to Intensively Quenched Barrels of Baseline Thickness (~5.8 mm Thick), 15% Thinner (~4.93 mm Thick) and 25% Thinner (~4.35 mm Thick) Wall Thickness ................................................ 46
Figure 3.1 Spur Gear Manufactured for the Test Program ..................................................................... 48 Figure 3.2 Example Flow Stabilization Time Sensitivity Plot ................................................................ 50 Figure 3.3 Schematic of Triple-Notched Bar Test Coupon Sensitivity Analyses .................................. 51 Figure 3.4 Triple Notched Test Bar in Intensive Quenching Heat Treating Fixture .............................. 52 Figure 3.5 Comparison of Surface Residual Stress Variation at Three Locations on the Notched
Specimens .............................................................................................................................. 53 Figure 3.6 Comparison of Residual Stress Calculated from XRD and BN Measurements by Location
on IQ Coupon #1 ................................................................................................................... 54 Figure 3.7 Comparison of Residual Stress Calculated from XRD and BN Measurements by Location
on IQ Coupon #2 ................................................................................................................... 54 Figure 3.8 Comparison of Calculated X-Ray and Measured BN Response by Location on IQ Coupon
#3 ............................................................................................................................................ 54 Figure 3.9 Comparison of Calculated X-Ray and Measured BN Response by Location on OQ
Coupon #4 ............................................................................................................................... 55
Figure 3.10 Comparison of Calculated X-Ray and Measured BN Response by Location on OQ Coupon #5 ............................................................................................................................... 55
Figure 3.11 Comparison of Residual Stress Calculated from XRD and BN Measurements by Location on OQ Coupon #6 ................................................................................................................... 55
Figure 3.12 View of the Single Part Quenching Station on the High Velocity Intensive Quenching System .................................................................................................................................... 57
v
List of Figures (Continued)
Figure 3.13 Schematic Showing the Test Gear In the Intensive Quench Station ...................................... 57 Figure 3.14 Photograph of the upper coaxial tubes showing the inner and outer tubes and the sealing
gasket ....................................................................................................................................... 58 Figure 3.15 Cold Test Gear Loaded in the Intensive Quenching Station Showing the Water Flow
Channels in the Bore and Around the Spur Teeth ................................................................... 58 Figure 3.16 Plotted Data for Intensive Quenching 6 Test Gears ................................................................ 59 Figure 3.17 Intensive Quenching Process Data for the 1st Quenched Gear from the Set Shown in Figure
3.6 ............................................................................................................................................ 59 Figure 3.18 Heat Transfer Coefficients Calculated from Water Flow Rates Using Dimensionless
Parameters ............................................................................................................................... 60 Figure 3.19 Helicopter Gears Suitable for Free Quenching ....................................................................... 62 Figure 3.20 Layout of IQ Unit For Free Quenching of Gears .................................................................... 63 Figure 3.21 Quench Chamber Design Providing Radial Water Flow ........................................................ 63 Figure 3.22 Quench Chamber Design Providing Axial Water Flow .......................................................... 63 Figure 3.23 Helicopter Gears Required Press Quenching .......................................................................... 65 Figure 3.24 Smart-Press Quench Unit Die for Ring Gears ........................................................................ 67 Figure 3.25 Smart-Press Quench Unit Die for Spiral Bevel Gears ............................................................ 67 Figure 3.26 Layout of Smart Press Quenching Machine for Spiral Bevel Helicopter Gears ..................... 68 Figure 4.1 Process Flow for Potential Benefits After Various Post Processing Techniques ................... 71 Figure 4.2 M249 machine Gun ................................................................................................................. 77 Figure 4.3 Typical Tool Punch ................................................................................................................. 80 Figure 5.1 Summary of Project Objectives, Challenges, Outcome and Benefits to the Army ................. 88 Figure 5.2 Three-year Program Milestones ..................................................................................... 89 Figure 5.3 Three-year Program Schedule ................................................................................................. 89
vi
List of Tables
Table 2.1 Improvement of Steel Mechanical Properties Due to IQ process ........................................ 7 Table 2.2 Improvement of Part Fatigue Life Due to IQ process .......................................................... 8 Table 2.3 Mechanical Properties for 4130 Steel From Ø1”x5” Test Samples .................................... 12 Table 2.4 Mechanical Properties for M249 Steel From Test samples of OD=22mm, ID=5.5mm and
Length 127mm ..................................................................................................................... 12 Table 2.5 Mechanical Property Data for M256 Steel From Test Samples of Ø1”x5” and Ø4”x6” .... 13 Table 2.6 Mechanical Property Data for MTO Steel From Test Samples of Ø1”x5” and Ø4”x6” ..... 14 Table 2.7 Mechanical Properties for M249 Steel From Actual Gun Barrel Solid Blank of
Ø27x470mm ........................................................................................................................ 15 Table 2.8 Summary of CFD Modeling Results for IQ System for Large Gun Barrels ....................... 21 Table 2.9 Initial Model Conditions ...................................................................................................... 26 Table 2.10 Alloy Ranges for Gun Barrel Steels Tested ......................................................................... 27 Table 3.1 Pyrowear 53 Steel Chemistry ............................................................................................... 47 Table 3.2 Heat Treat Schedules for the Two Sets of Gears ................................................................. 48 Table 3.3 Flow Stabilization Time as a Function of Cylinder Diameter ............................................. 50 Table 3.4 Heat Treat Process Routing used for Pyrowear 53 Transmission Gears ............................. 51 Table 3.5 Measured and Predicted Surface Residual Stress ................................................................ 52 Table 4.1 Total Present Annual Operating Costs (Baseline) for MCS 120mm XM36 Cannon Barrel
Forging ................................................................................................................................. 72 Table 4.2 Total Present Annual Operating Costs for Cannon (NLOS-C) Barrel Forgings (Baseline). 73 Table 4.3 Total Proposed Annual Operating Costs With IQ for FCS MCS 120mm XM36 Cannon
Barrel Forgings .................................................................................................................... 74 Table 4.4 Total Proposed Annual Operating Costs for Cannon (NLOS-C) Barrel Forgings With IQ. 74 Table 4.5 Total Present Annual Quantity & Operating Costs For M249 Barrel (Baseline) ................ 78 Table 4.6 Total Proposed Annual Quantity & Operating Costs (IQ process) for M249 Barrels ......... 78 Table 4.7 Summary of Economic Analysis Results ............................................................................. 86
vii
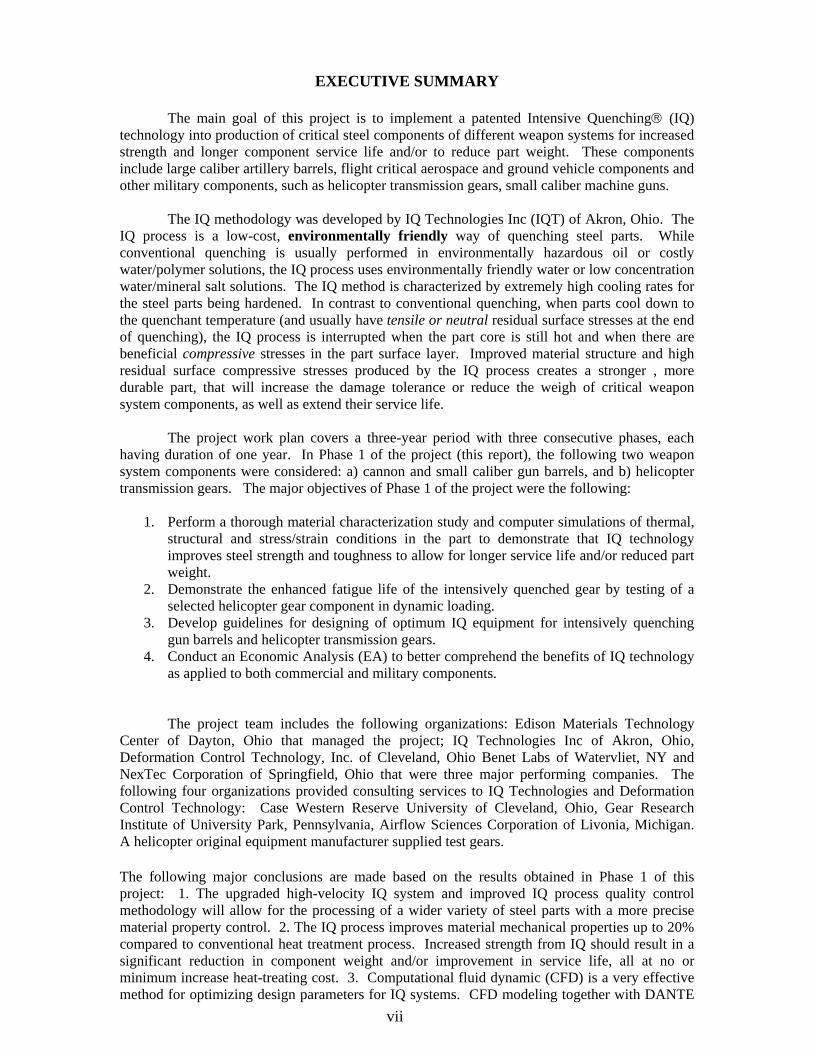
EXECUTIVE SUMMARY
The main goal of this project is to implement a patented Intensive Quenching® (IQ) technology into production of critical steel components of different weapon systems for increased strength and longer component service life and/or to reduce part weight. These components include large caliber artillery barrels, flight critical aerospace and ground vehicle components and other military components, such as helicopter transmission gears, small caliber machine guns.
The IQ methodology was developed by IQ Technologies Inc (IQT) of Akron, Ohio. The
IQ process is a low-cost, environmentally friendly way of quenching steel parts. While conventional quenching is usually performed in environmentally hazardous oil or costly water/polymer solutions, the IQ process uses environmentally friendly water or low concentration water/mineral salt solutions. The IQ method is characterized by extremely high cooling rates for the steel parts being hardened. In contrast to conventional quenching, when parts cool down to the quenchant temperature (and usually have tensile or neutral residual surface stresses at the end of quenching), the IQ process is interrupted when the part core is still hot and when there are beneficial compressive stresses in the part surface layer. Improved material structure and high residual surface compressive stresses produced by the IQ process creates a stronger , more durable part, that will increase the damage tolerance or reduce the weigh of critical weapon system components, as well as extend their service life.
The project work plan covers a three-year period with three consecutive phases, each having duration of one year. In Phase 1 of the project (this report), the following two weapon system components were considered: a) cannon and small caliber gun barrels, and b) helicopter transmission gears. The major objectives of Phase 1 of the project were the following:
1. Perform a thorough material characterization study and computer simulations of thermal,
structural and stress/strain conditions in the part to demonstrate that IQ technology improves steel strength and toughness to allow for longer service life and/or reduced part weight.
2. Demonstrate the enhanced fatigue life of the intensively quenched gear by testing of a selected helicopter gear component in dynamic loading.
3. Develop guidelines for designing of optimum IQ equipment for intensively quenching gun barrels and helicopter transmission gears.
4. Conduct an Economic Analysis (EA) to better comprehend the benefits of IQ technology as applied to both commercial and military components. The project team includes the following organizations: Edison Materials Technology
Center of Dayton, Ohio that managed the project; IQ Technologies Inc of Akron, Ohio, Deformation Control Technology, Inc. of Cleveland, Ohio Benet Labs of Watervliet, NY and NexTec Corporation of Springfield, Ohio that were three major performing companies. The following four organizations provided consulting services to IQ Technologies and Deformation Control Technology: Case Western Reserve University of Cleveland, Ohio, Gear Research Institute of University Park, Pennsylvania, Airflow Sciences Corporation of Livonia, Michigan. A helicopter original equipment manufacturer supplied test gears. The following major conclusions are made based on the results obtained in Phase 1 of this project: 1. The upgraded high-velocity IQ system and improved IQ process quality control methodology will allow for the processing of a wider variety of steel parts with a more precise material property control. 2. The IQ process improves material mechanical properties up to 20% compared to conventional heat treatment process. Increased strength from IQ should result in a significant reduction in component weight and/or improvement in service life, all at no or minimum increase heat-treating cost. 3. Computational fluid dynamic (CFD) is a very effective method for optimizing design parameters for IQ systems. CFD modeling together with DANTE

viii
computer modeling should be an integral part of any design process of IQ units as well as development heat treatment procedures and process parameters. 4. The developed conceptual designs of IQ systems for the large and small caliber gun barrels and for the helicopter gears should be a basis for further implementation of the IQ process for advanced weapon systems in Phase 2 and 3 of this project. 5. The results from the economic analyses conducted for M249 gun barrels, M256 cannon barrels and typical tool punches are very promising for the stakeholders or invertors in terms of net-present value (NPV) benefits and ranking index (RI). Both of these values for all the three economical analyses conducted are clearly above average for typical Army Manufacturing Technology project proposals and merit consideration for future investment (NPV is in the range of 1.1M to 6.4M and RI is in the range of 6.5 to 364).
1
INTRODUCTION
The main goal of this project is to implement a patented Intensive Quenching® (IQ) technology into production of critical steel components of different weapon systems for increased strength and longer component service life and/or to reduce part weight. These components include critical artillery equipment components, critical aerospace and other military vehicle components, such as helicopter transmission gears, tank transmission shafts, etc. Improved material structure and high residual surface compressive stresses produced by the IQ process will increase the damage tolerance in these critical components, as well as increase service life of these components. The project work plan covers a 3-year period and includes three consecutive phases, each having duration of one year.
In Phase 1 of the project (this report), the following two weapon system components are
considered: a) gun and cannon barrels of different calibers, and b) helicopter transmission gears. The objectives of Phase 1 of the project are the following:
o Performa thorough material characterization study to demonstrate that the IQ
technology improves steel strength and toughness that will result in longer life of gun and cannon barrels and/or may allow for reduced part weight, at no increase in heat treat processing costs.
o Perform quench process simulations using DANTE computer simulation software to examine both process variables and alloy composition variations on final hardness, phase distributions, residual stress and distortion for specified barrels.
o Develop performance model and run calculations to simulate the resultant stress state during launch of the projectile (shooting) and evaluate possible barrel weight reductions.
o Demonstrate the enhanced fatigue life of the intensively quenched gears (as compared to oil quenched gears) by testing of a selected helicopter gear component under dynamic loading. The dynamic loading assessment will establish quantitative, comparative design data concerning gear performance enhancements that are available from the application of intensive water quenching versus oil quenching of the gears.
The objective of Phase 2 and Phase 3 of the project is to further implement the IQ method
for the above weapon components and to demonstrate the effectiveness of the IQ process to critical steel components of various other weapon systems (transmission and suspension system components of different military vehicles, tank components, etc.). Implementation will require the construction of specific intensive quenching equipment to realize the full benefits of the IQ process on critical steel components and to facilitate adoption of IQ by the wider heat-treating industry.
The IQ methodology was developed by IQ Technologies, Inc. (IQT) of Akron, Ohio (an
EMTEC member-company). The IQ process is a low cost, environmentally friendly way of quenching steel parts. While conventional quenching is usually performed in environmentally unfriendly oil or costly water/polymer solutions, the IQ process uses environmentally friendly water or a low concentration of mineral salt in a water solution. The IQ method is characterized by extremely high cooling rates of steel parts. In contrast to conventional quenching, when parts cool down to the quenchant temperature and usually have tensile or neutral residual surface stresses at the end of quenching, the IQ process is interrupted when the part core is still hot and when there are beneficial compressive stresses in the part surface layer. A detailed IQ process description with a list of references is presented in Appendix 1.
Over the last several years, IQT has conducted hundreds of intensive quenching trials with a variety of steel products. The Edison Material Technology Center (EMTEC), US Department of Energy, and IQT’s commercial customers funded these IQ demonstrations.
2
Numerous references (see reference list in Appendix A) describe in detail the results of the IQ trials. The major proven IQ process benefits are listed below:
o IQ technology improves the hardened steel’s material structure; the improved
structure results in significant improvements to the steel part’s mechanical properties, such as strength, toughness, wear and fatigue resistance. This IQ process benefit is proven for all types of steels (plain carbon, alloy, carburized grades, etc.) and does not represent any increase in the cost of the heat-treating process over conventional quenching methods.
o IQ processes provide high residual compressive stresses in the part surface layer that further improve steel part performance characteristics. This is in contrast to conventional quenching practices when the residual surface stresses are usually neutral or tensile. Even in oil-quenched case hardened parts, where surface compression is typical, the IQ process provides enhanced compressive surface stress for better part performance.
o The IQ process provides improved control of part distortion compared to conventional quenching. Since the compressed part surface layer works like a “die”, size change associated with quench hardening is more consistent and the shape change that characterizes part distortion is minimized.
o The IQ technique uses plain water instead of hazardous, environmentally unfriendly oil or costly water/polymer solutions. This significantly reduces the heat-treatment cost and the environmental impact.
The above benefits directly relate to the objectives set forth by the Benet Laboratories
(BL) of Watervliet Arsenal regarding R&D efforts to improve materials and manufacturing technologies for weapon systems, while, at the same time, controlling processing costs.
IQ Technologies, Inc. (IQT) of Akron, Ohio, Deformation Control Technology, Inc.
(DCT) of Cleveland, Ohio, and NexTec Corporation (NTC) of Dayton, Ohio, are the three major project participants. Case Western Reserve University (CWRU) of Cleveland, Ohio, and the Gear Research Institute (GRI) of University Park, Pennsylvania, are consultants to DCT. Sikorsky Aircraft Corporation (SAC), an OEM helicopter part manufacturer is the test gear supplier. Airflow Sciences Corporation (ASC) of Livonia, Michigan, is a consultant to IQT. Edison Materials Technology Center (EMTEC) of Dayton, Ohio, manages the project.
3
1. IMPROVEMENT OF EXISTING INTENSIVE QUENCHING EQUIPMENT 1.1 Description of High-Velocity IQ System
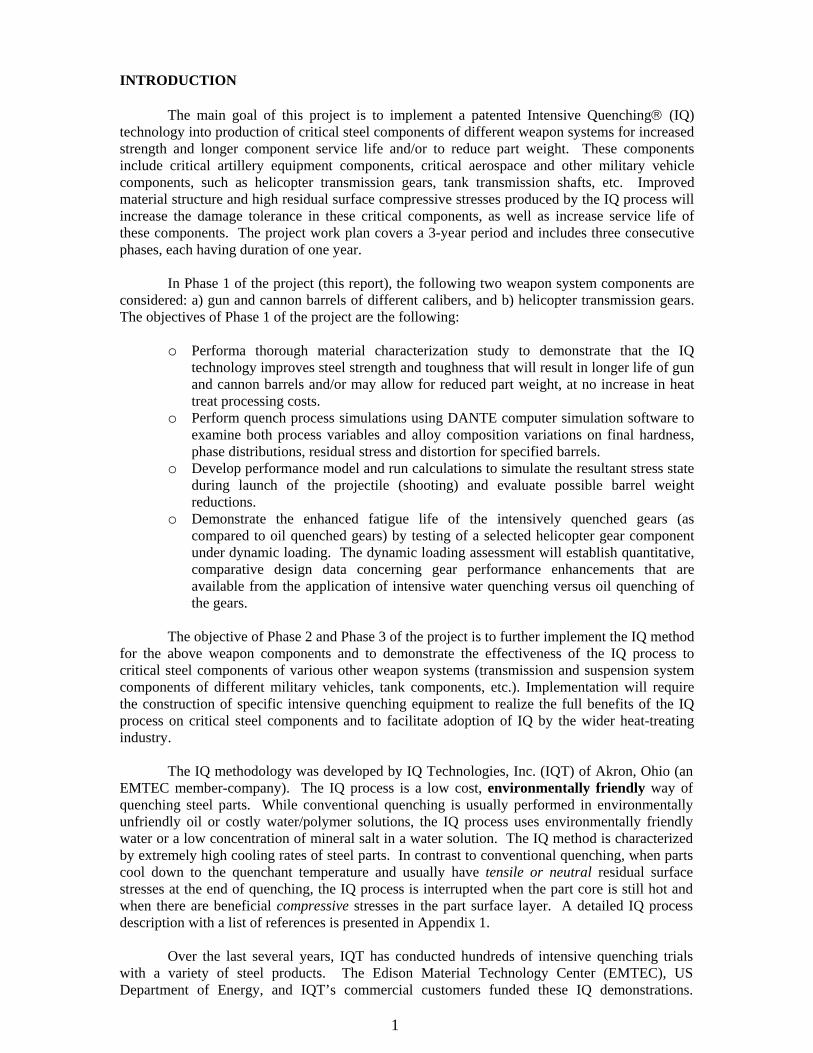
Figure 1.1 presents a picture of the IQ Technologies Inc (IQT) high-velocity IQ system installed at the Center for Intensive Quenching in Akron, Ohio. The IQ system can quench steel parts with a diameter up to 7” and with a length up to 19”, with an “intensive” water flow velocity of up to 20 m/second. The system is able to realize the optimum intensive water quenching conditions for a wide variety of parts made of various steel alloys.
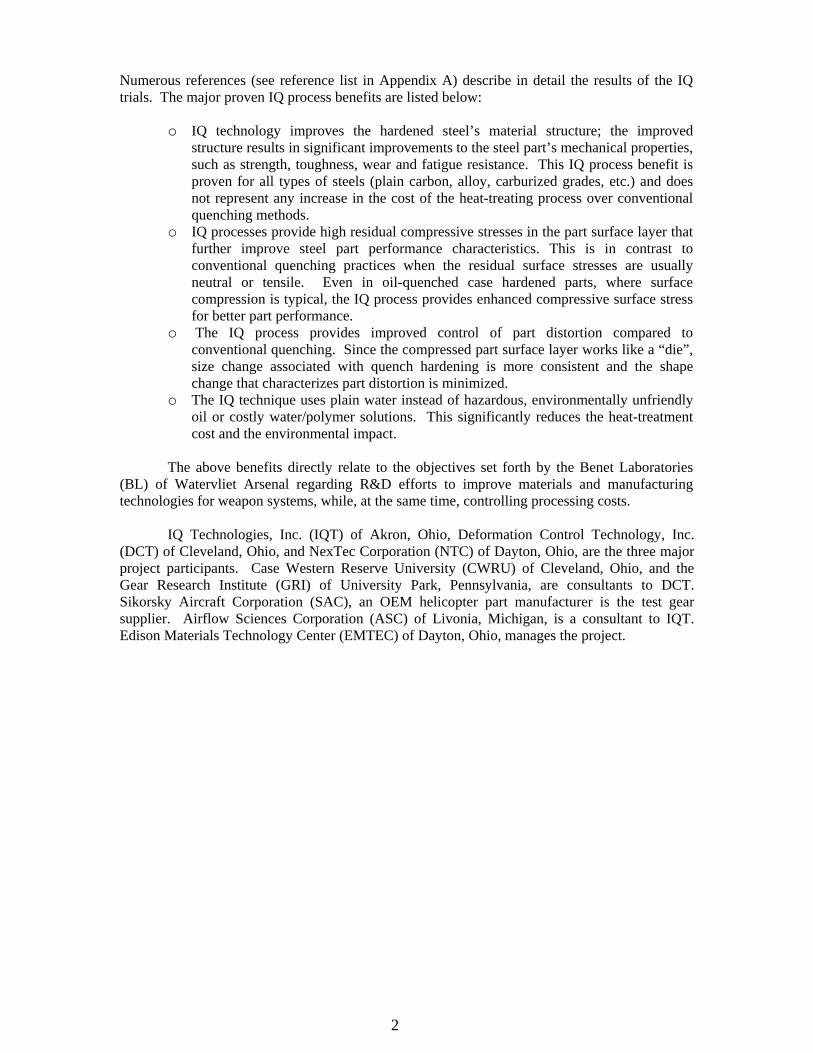
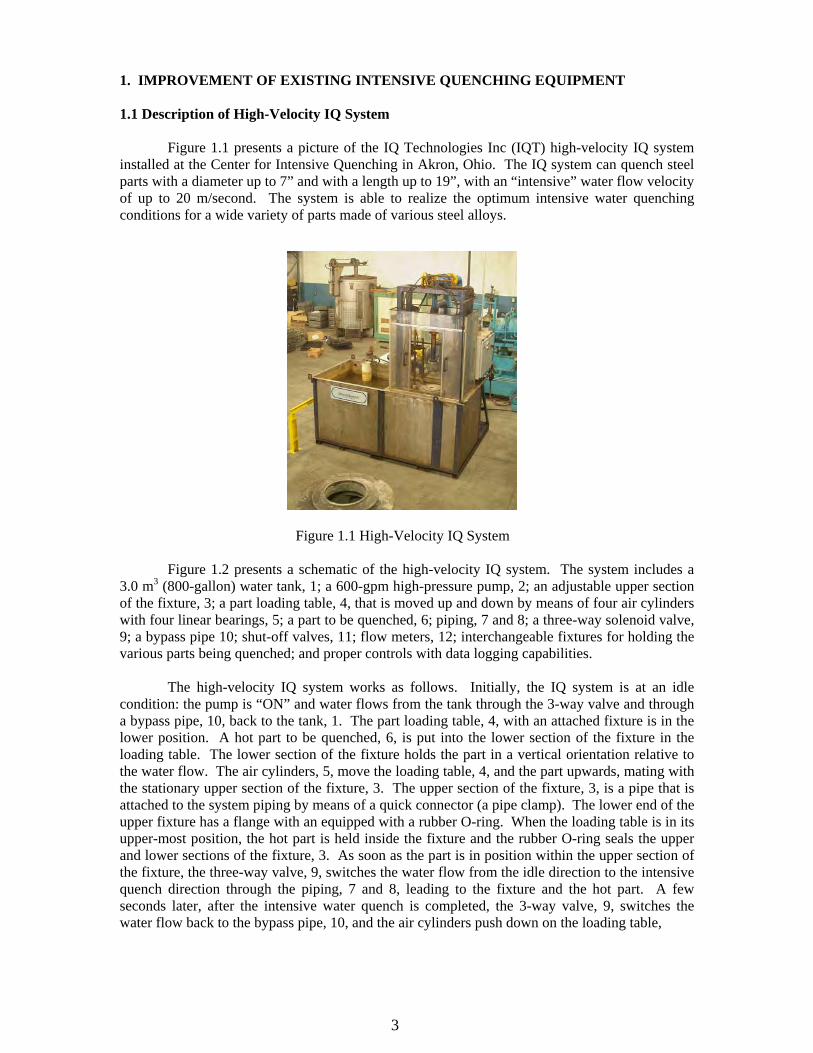
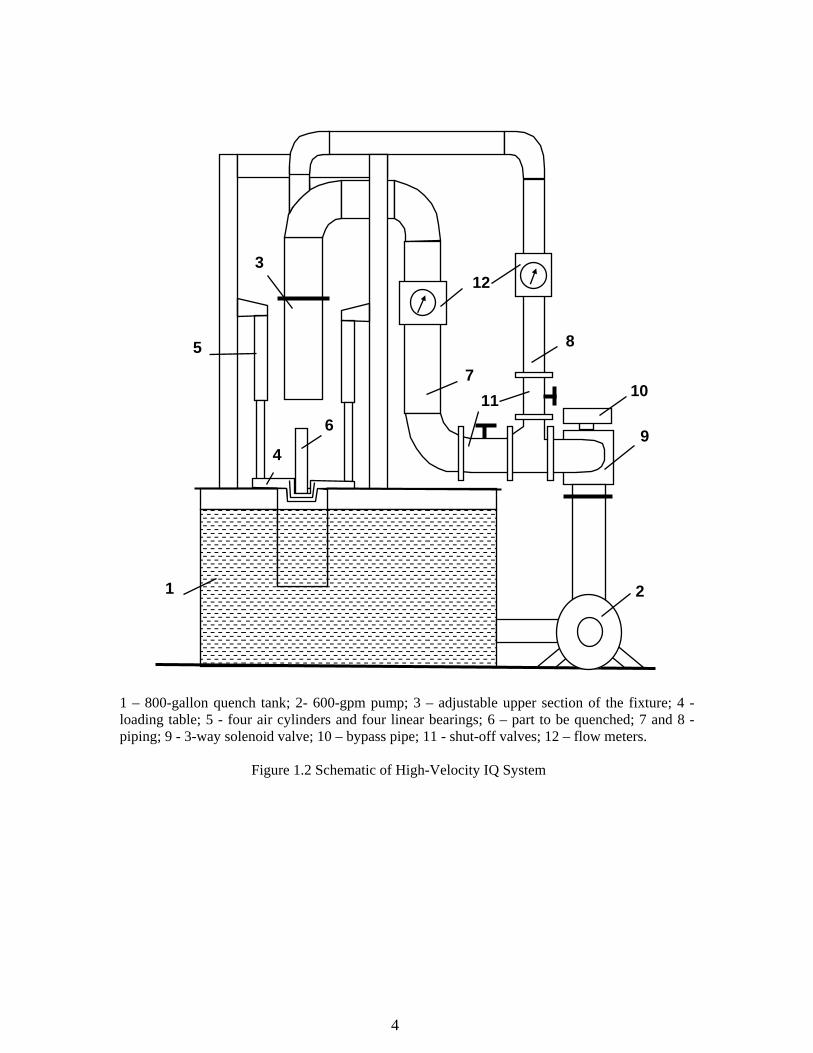
Figure 1.1 High-Velocity IQ System Figure 1.2 presents a schematic of the high-velocity IQ system. The system includes a
3.0 m3 (800-gallon) water tank, 1; a 600-gpm high-pressure pump, 2; an adjustable upper section of the fixture, 3; a part loading table, 4, that is moved up and down by means of four air cylinders with four linear bearings, 5; a part to be quenched, 6; piping, 7 and 8; a three-way solenoid valve, 9; a bypass pipe 10; shut-off valves, 11; flow meters, 12; interchangeable fixtures for holding the various parts being quenched; and proper controls with data logging capabilities.
The high-velocity IQ system works as follows. Initially, the IQ system is at an idle
condition: the pump is “ON” and water flows from the tank through the 3-way valve and through a bypass pipe, 10, back to the tank, 1. The part loading table, 4, with an attached fixture is in the lower position. A hot part to be quenched, 6, is put into the lower section of the fixture in the loading table. The lower section of the fixture holds the part in a vertical orientation relative to the water flow. The air cylinders, 5, move the loading table, 4, and the part upwards, mating with the stationary upper section of the fixture, 3. The upper section of the fixture, 3, is a pipe that is attached to the system piping by means of a quick connector (a pipe clamp). The lower end of the upper fixture has a flange with an equipped with a rubber O-ring. When the loading table is in its upper-most position, the hot part is held inside the fixture and the rubber O-ring seals the upper and lower sections of the fixture, 3. As soon as the part is in position within the upper section of the fixture, the three-way valve, 9, switches the water flow from the idle direction to the intensive quench direction through the piping, 7 and 8, leading to the fixture and the hot part. A few seconds later, after the intensive water quench is completed, the 3-way valve, 9, switches the water flow back to the bypass pipe, 10, and the air cylinders push down on the loading table,
4
1 – 800-gallon quench tank; 2- 600-gpm pump; 3 – adjustable upper section of the fixture; 4 - loading table; 5 - four air cylinders and four linear bearings; 6 – part to be quenched; 7 and 8 - piping; 9 - 3-way solenoid valve; 10 – bypass pipe; 11 - shut-off valves; 12 – flow meters.
Figure 1.2 Schematic of High-Velocity IQ System
1 2
3
4
5
6
7
8
9
10 11
12
5
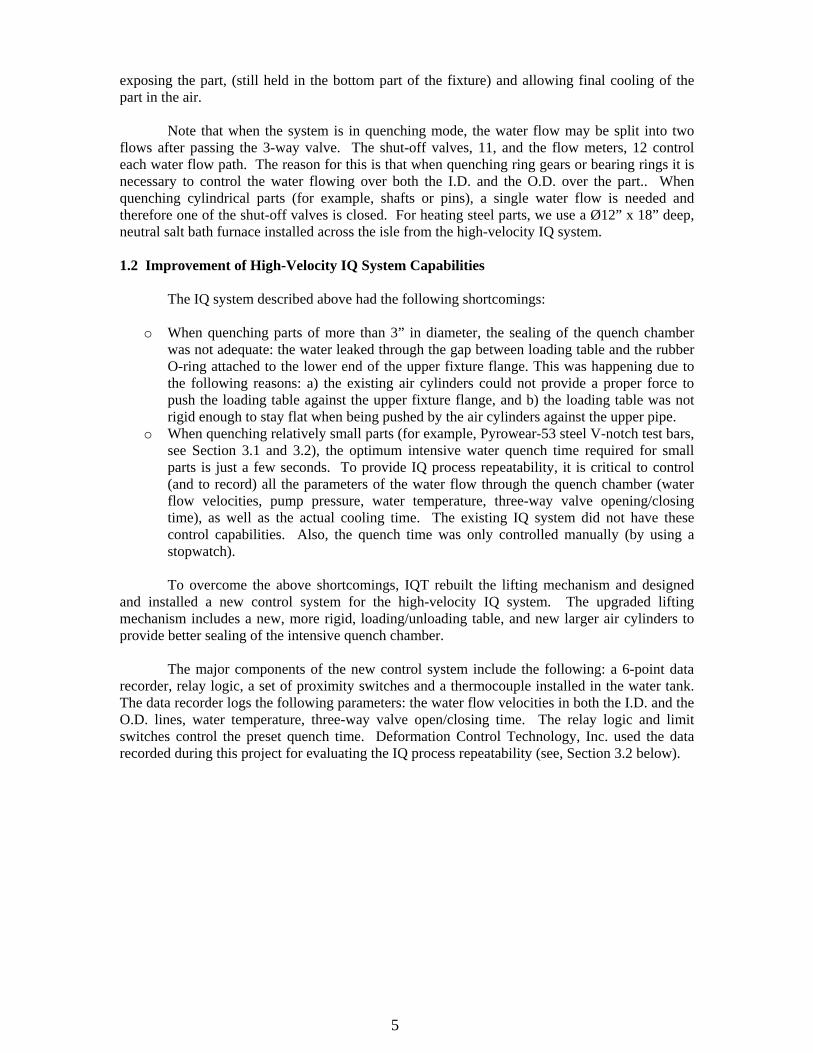
exposing the part, (still held in the bottom part of the fixture) and allowing final cooling of the part in the air.
Note that when the system is in quenching mode, the water flow may be split into two
flows after passing the 3-way valve. The shut-off valves, 11, and the flow meters, 12 control each water flow path. The reason for this is that when quenching ring gears or bearing rings it is necessary to control the water flowing over both the I.D. and the O.D. over the part.. When quenching cylindrical parts (for example, shafts or pins), a single water flow is needed and therefore one of the shut-off valves is closed. For heating steel parts, we use a Ø12” x 18” deep, neutral salt bath furnace installed across the isle from the high-velocity IQ system. 1.2 Improvement of High-Velocity IQ System Capabilities The IQ system described above had the following shortcomings:
o When quenching parts of more than 3” in diameter, the sealing of the quench chamber was not adequate: the water leaked through the gap between loading table and the rubber O-ring attached to the lower end of the upper fixture flange. This was happening due to the following reasons: a) the existing air cylinders could not provide a proper force to push the loading table against the upper fixture flange, and b) the loading table was not rigid enough to stay flat when being pushed by the air cylinders against the upper pipe.
o When quenching relatively small parts (for example, Pyrowear-53 steel V-notch test bars, see Section 3.1 and 3.2), the optimum intensive water quench time required for small parts is just a few seconds. To provide IQ process repeatability, it is critical to control (and to record) all the parameters of the water flow through the quench chamber (water flow velocities, pump pressure, water temperature, three-way valve opening/closing time), as well as the actual cooling time. The existing IQ system did not have these control capabilities. Also, the quench time was only controlled manually (by using a stopwatch).
To overcome the above shortcomings, IQT rebuilt the lifting mechanism and designed
and installed a new control system for the high-velocity IQ system. The upgraded lifting mechanism includes a new, more rigid, loading/unloading table, and new larger air cylinders to provide better sealing of the intensive quench chamber.
The major components of the new control system include the following: a 6-point data
recorder, relay logic, a set of proximity switches and a thermocouple installed in the water tank. The data recorder logs the following parameters: the water flow velocities in both the I.D. and the O.D. lines, water temperature, three-way valve open/closing time. The relay logic and limit switches control the preset quench time. Deformation Control Technology, Inc. used the data recorded during this project for evaluating the IQ process repeatability (see, Section 3.2 below).
6
2. INTENSIVE QUENCHING PROCESS FOR GUN BARRELS 2.1 Foundation for Implementing IQ Process for Gun Barrels
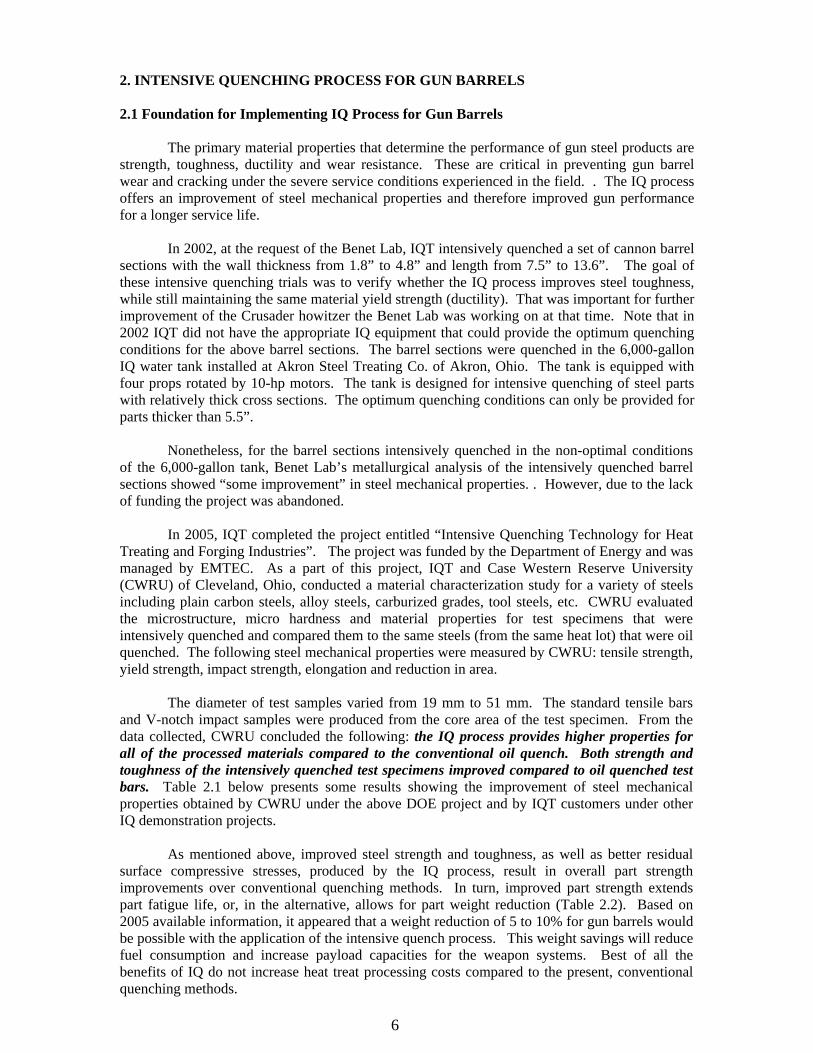
The primary material properties that determine the performance of gun steel products are strength, toughness, ductility and wear resistance. These are critical in preventing gun barrel wear and cracking under the severe service conditions experienced in the field. . The IQ process offers an improvement of steel mechanical properties and therefore improved gun performance for a longer service life.
In 2002, at the request of the Benet Lab, IQT intensively quenched a set of cannon barrel
sections with the wall thickness from 1.8” to 4.8” and length from 7.5” to 13.6”. The goal of these intensive quenching trials was to verify whether the IQ process improves steel toughness, while still maintaining the same material yield strength (ductility). That was important for further improvement of the Crusader howitzer the Benet Lab was working on at that time. Note that in 2002 IQT did not have the appropriate IQ equipment that could provide the optimum quenching conditions for the above barrel sections. The barrel sections were quenched in the 6,000-gallon IQ water tank installed at Akron Steel Treating Co. of Akron, Ohio. The tank is equipped with four props rotated by 10-hp motors. The tank is designed for intensive quenching of steel parts with relatively thick cross sections. The optimum quenching conditions can only be provided for parts thicker than 5.5”.
Nonetheless, for the barrel sections intensively quenched in the non-optimal conditions
of the 6,000-gallon tank, Benet Lab’s metallurgical analysis of the intensively quenched barrel sections showed “some improvement” in steel mechanical properties. . However, due to the lack of funding the project was abandoned.
In 2005, IQT completed the project entitled “Intensive Quenching Technology for Heat
Treating and Forging Industries”. The project was funded by the Department of Energy and was managed by EMTEC. As a part of this project, IQT and Case Western Reserve University (CWRU) of Cleveland, Ohio, conducted a material characterization study for a variety of steels including plain carbon steels, alloy steels, carburized grades, tool steels, etc. CWRU evaluated the microstructure, micro hardness and material properties for test specimens that were intensively quenched and compared them to the same steels (from the same heat lot) that were oil quenched. The following steel mechanical properties were measured by CWRU: tensile strength, yield strength, impact strength, elongation and reduction in area.
The diameter of test samples varied from 19 mm to 51 mm. The standard tensile bars
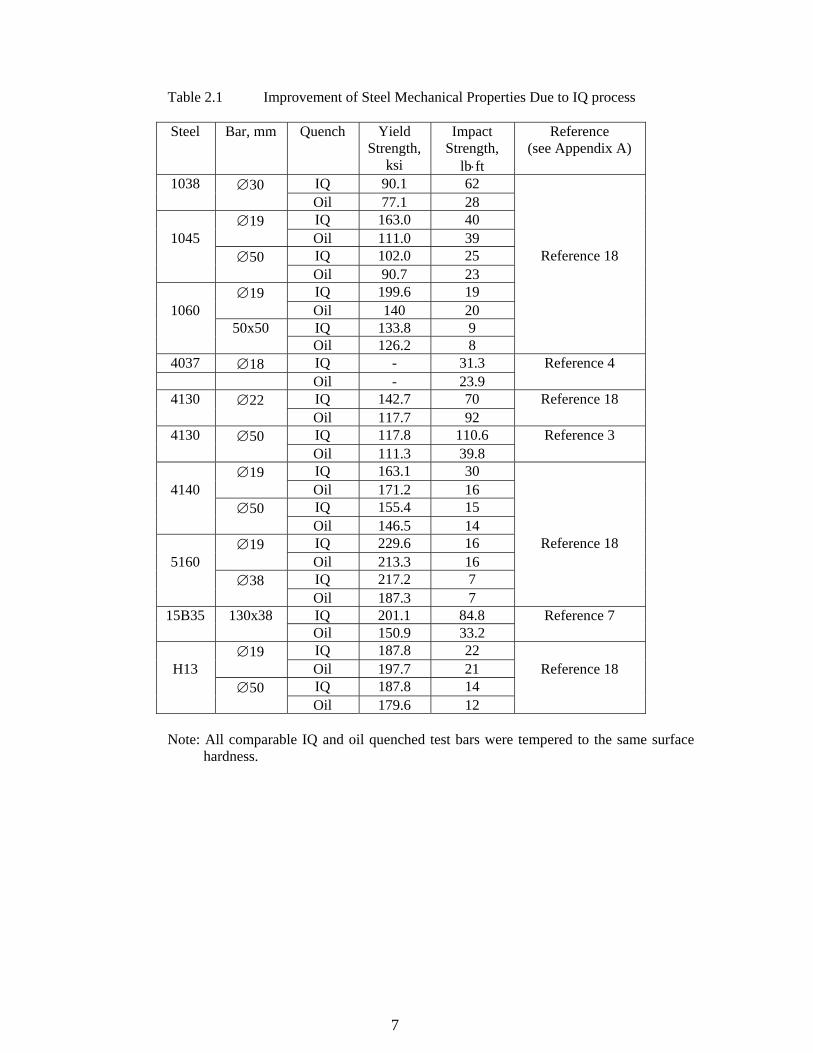
and V-notch impact samples were produced from the core area of the test specimen. From the data collected, CWRU concluded the following: the IQ process provides higher properties for all of the processed materials compared to the conventional oil quench. Both strength and toughness of the intensively quenched test specimens improved compared to oil quenched test bars. Table 2.1 below presents some results showing the improvement of steel mechanical properties obtained by CWRU under the above DOE project and by IQT customers under other IQ demonstration projects.
As mentioned above, improved steel strength and toughness, as well as better residual
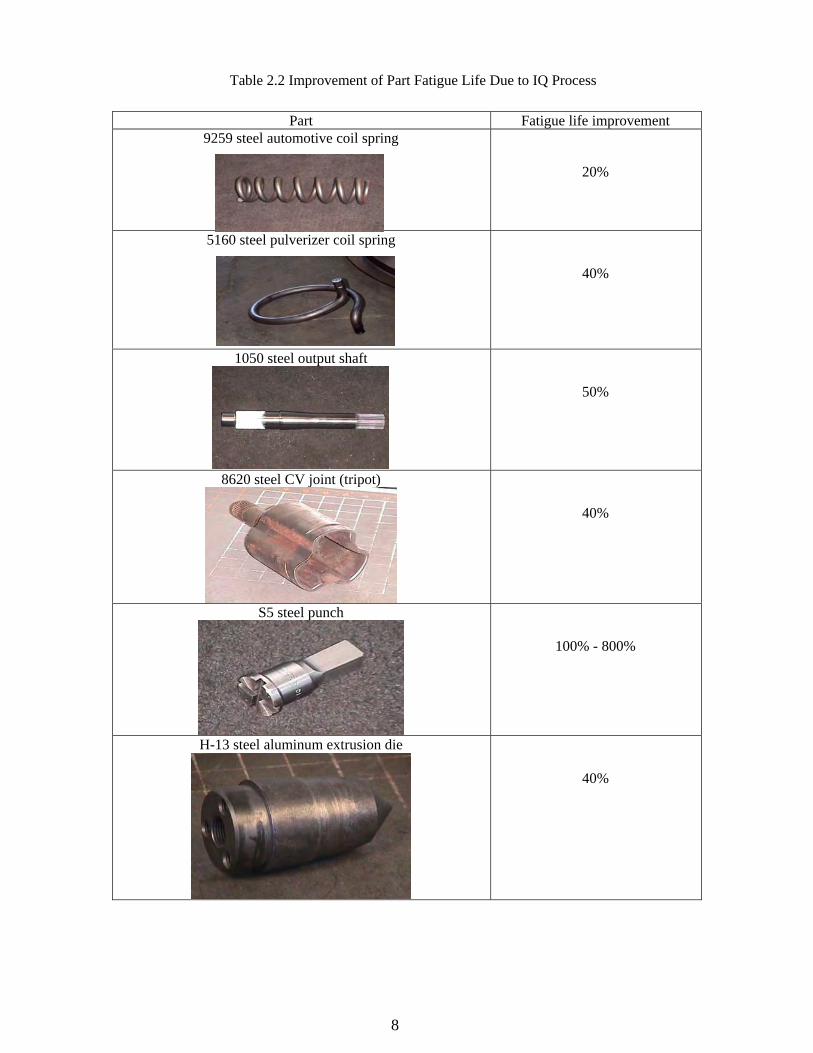
surface compressive stresses, produced by the IQ process, result in overall part strength improvements over conventional quenching methods. In turn, improved part strength extends part fatigue life, or, in the alternative, allows for part weight reduction (Table 2.2). Based on 2005 available information, it appeared that a weight reduction of 5 to 10% for gun barrels would be possible with the application of the intensive quench process. This weight savings will reduce fuel consumption and increase payload capacities for the weapon systems. Best of all the benefits of IQ do not increase heat treat processing costs compared to the present, conventional quenching methods.
7
Table 2.1 Improvement of Steel Mechanical Properties Due to IQ process Steel Bar, mm Quench Yield
Strength, ksi
Impact Strength,
lb⋅ft
Reference (see Appendix A)
1038 ∅30 IQ 90.1 62 Oil 77.1 28 ∅19 IQ 163.0 40
1045 Oil 111.0 39 ∅50 IQ 102.0 25 Reference 18 Oil 90.7 23 ∅19 IQ 199.6 19
1060 Oil 140 20 50x50 IQ 133.8 9 Oil 126.2 8
4037 ∅18 IQ - 31.3 Reference 4 Oil - 23.9
4130 ∅22 IQ 142.7 70 Reference 18 Oil 117.7 92
4130 ∅50 IQ 117.8 110.6 Reference 3 Oil 111.3 39.8 ∅19 IQ 163.1 30
4140 Oil 171.2 16 ∅50 IQ 155.4 15 Oil 146.5 14 ∅19 IQ 229.6 16 Reference 18
5160 Oil 213.3 16 ∅38 IQ 217.2 7 Oil 187.3 7
15B35 130x38 IQ 201.1 84.8 Reference 7 Oil 150.9 33.2 ∅19 IQ 187.8 22
H13 Oil 197.7 21 Reference 18 ∅50 IQ 187.8 14 Oil 179.6 12
Note: All comparable IQ and oil quenched test bars were tempered to the same surface
hardness.
8
Table 2.2 Improvement of Part Fatigue Life Due to IQ Process
Part Fatigue life improvement 9259 steel automotive coil spring
20%
5160 steel pulverizer coil spring
40%
1050 steel output shaft
50%
8620 steel CV joint (tripot)
40%
S5 steel punch
100% - 800%
H-13 steel aluminum extrusion die
40%
9
2.2 Material Characterization Study of Gun Barrel Steels
The goal of the study was to document the mechanical properties and analyze alloy steels commonly used for gun barrels (small, medium and large caliber) resulting from the application of the IQ process. Benet Labs supplied test samples for intensive quenching. IQ Technologies Inc processed the samples in its IQ equipment. Benet Labs conducted material characterization of the quenched test specimens.
2.2.1 Selection of Steels and Mechanical Properties for IQ Process Evaluation
Benet Labs selected the following steels for evaluating of an effect of the IQ process on
material mechanical properties:
o 4130 steel used for MK19 grenade launcher barrel. o M249 steel used for small caliber barrels for 7.62 mm M249 machine gun. o M256 steel used for large caliber barrels for 120 mm Abrams tank cannon. o MTO (ultra strength steel) being currently evaluated by Benet Labs for the use for large
caliber gun barrels for future combat systems.
Benet Labs suggested using the following test samples for the IQ trials:
o For 4130 material - cylindrical specimens of Ø1”x5”. o For M249 material – hollow cylindrical samples of OD=22mm, ID=5mm and length of
127mm representing a small caliber gun barrel. o For M256 and MTO materials – cylindrical samples of Ø1”x5” representing a muzzle
end of large gun barrels and cylindrical samples of Ø4”x6” representing a breech end of large gun barrels. Benet Labs requested to attempt to achieve three different strength levels for each
individual alloy by processing several test bars per steel. On the intensive quenched bar samples, Benet Labs performed a non-destructive magnetic particle inspection to quantify if any indication features were present prior to destructive analysis. The destructive analysis conducted included the following tasks:
o Analyze material composition. o Conduct mechanical property testing to quantify material properties (two Tensile and two
Charpy samples were tested per bar). o Conduct fracture toughness testing to verify the effects of the IQ process on the
toughness of the materials (two fracture toughness samples per Ø4”x6” bar only). o Prepare, etch and examine metallographic specimens on the sample materials to identify
component microstructures. o Perform micro hardness testing as necessary to further quantify hardness values across
the entire cross-sections of the samples. Photograph as appropriate.
2.2.2 Intensive Quenching of Test Samples
IQT designed and built special fixtures for quenching of the specified test samples in its high-velocity IQ system (see Figure 1.1 above). The IQT computer model was used for determining optimum water flow velocities required by the IQ process for the above test samples and for optimizing the quench fixture annuluses for providing these velocities using the existing IQ system pump. The above computer model was also used for calculating the cooling times for the test bars for obtaining the optimum material mechanical properties.
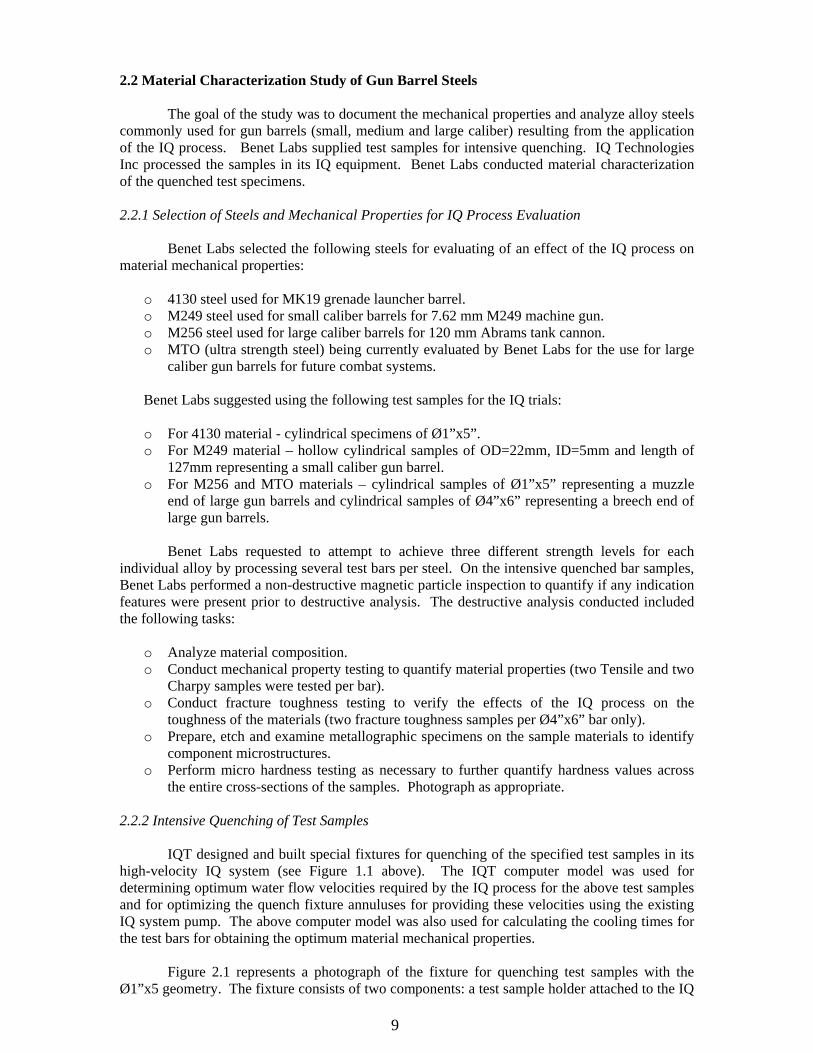
Figure 2.1 represents a photograph of the fixture for quenching test samples with the
Ø1”x5 geometry. The fixture consists of two components: a test sample holder attached to the IQ
10
system loading/unloading table and an upper pipe. Figure 2.1 shows the test specimen inside the part holder. The quenching procedure was as follows. The hot sample was manually transferred with the tongs from the neutral salt bath furnace to the IQ system. The specimen was placed in vertical orientation into the test sample holder. The quench cycle started after the loading/unloading table moved up towards the upper pipe locking the quench chamber. After the quench process was completed, the loading/unloading table moved down and the part was removed from the test sample holder for further tempering. Note that the design of the fixture for quenching of M249 steel hollow test samples was similar to the design described above. The only difference was in the sample holder and upper pipe dimensions.
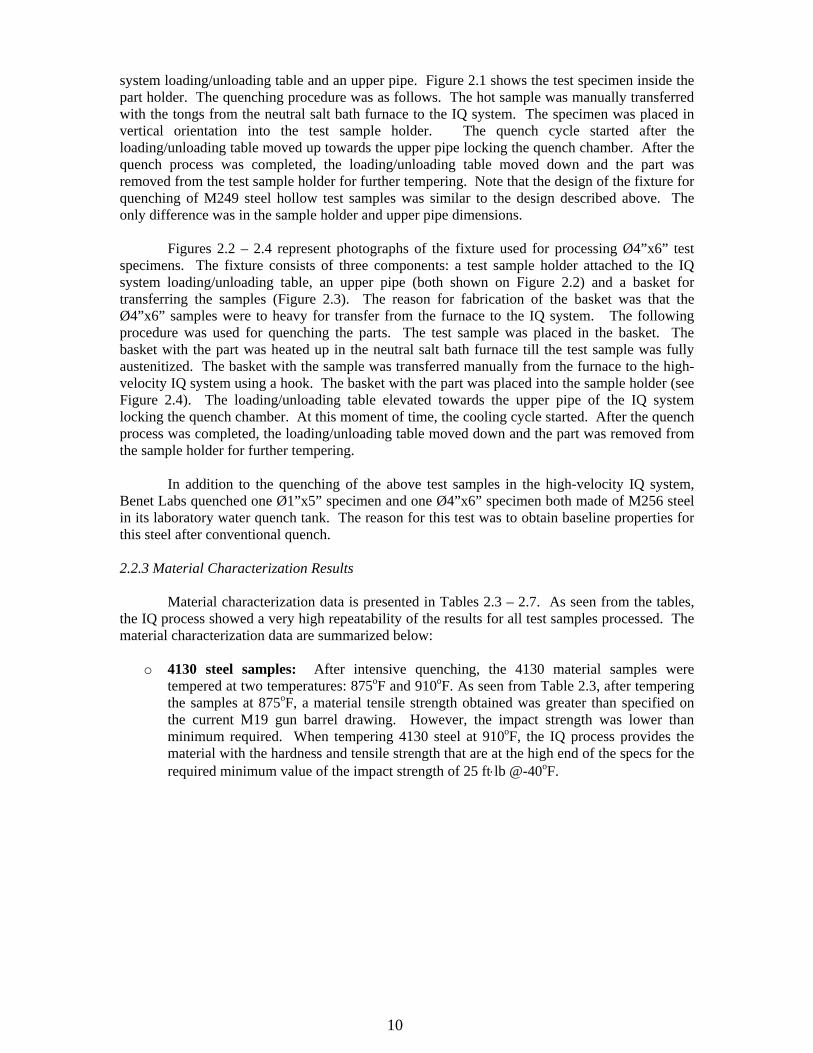
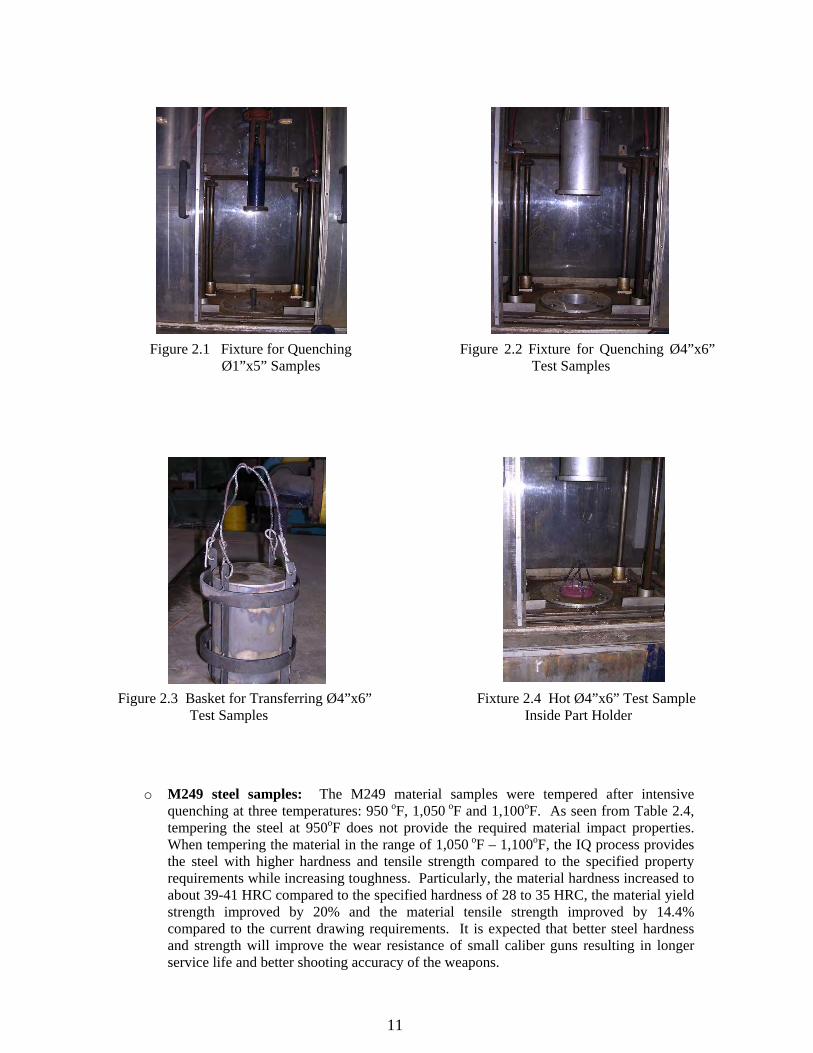
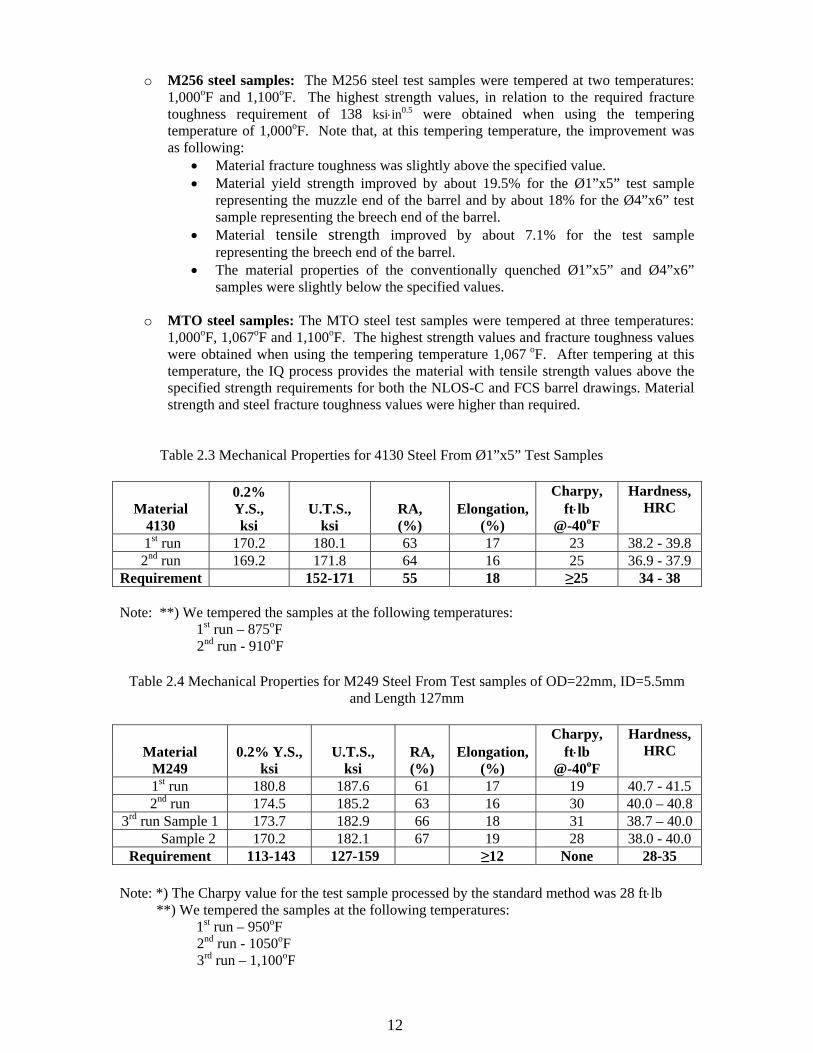
Figures 2.2 – 2.4 represent photographs of the fixture used for processing Ø4”x6” test
specimens. The fixture consists of three components: a test sample holder attached to the IQ system loading/unloading table, an upper pipe (both shown on Figure 2.2) and a basket for transferring the samples (Figure 2.3). The reason for fabrication of the basket was that the Ø4”x6” samples were to heavy for transfer from the furnace to the IQ system. The following procedure was used for quenching the parts. The test sample was placed in the basket. The basket with the part was heated up in the neutral salt bath furnace till the test sample was fully austenitized. The basket with the sample was transferred manually from the furnace to the high-velocity IQ system using a hook. The basket with the part was placed into the sample holder (see Figure 2.4). The loading/unloading table elevated towards the upper pipe of the IQ system locking the quench chamber. At this moment of time, the cooling cycle started. After the quench process was completed, the loading/unloading table moved down and the part was removed from the sample holder for further tempering.
In addition to the quenching of the above test samples in the high-velocity IQ system,
Benet Labs quenched one Ø1”x5” specimen and one Ø4”x6” specimen both made of M256 steel in its laboratory water quench tank. The reason for this test was to obtain baseline properties for this steel after conventional quench. 2.2.3 Material Characterization Results Material characterization data is presented in Tables 2.3 – 2.7. As seen from the tables, the IQ process showed a very high repeatability of the results for all test samples processed. The material characterization data are summarized below:
o 4130 steel samples: After intensive quenching, the 4130 material samples were tempered at two temperatures: 875oF and 910oF. As seen from Table 2.3, after tempering the samples at 875oF, a material tensile strength obtained was greater than specified on the current M19 gun barrel drawing. However, the impact strength was lower than minimum required. When tempering 4130 steel at 910oF, the IQ process provides the material with the hardness and tensile strength that are at the high end of the specs for the required minimum value of the impact strength of 25 ft⋅lb @-40oF.
11
o M249 steel samples: The M249 material samples were tempered after intensive quenching at three temperatures: 950 oF, 1,050 oF and 1,100oF. As seen from Table 2.4, tempering the steel at 950oF does not provide the required material impact properties. When tempering the material in the range of 1,050 oF – 1,100oF, the IQ process provides the steel with higher hardness and tensile strength compared to the specified property requirements while increasing toughness. Particularly, the material hardness increased to about 39-41 HRC compared to the specified hardness of 28 to 35 HRC, the material yield strength improved by 20% and the material tensile strength improved by 14.4% compared to the current drawing requirements. It is expected that better steel hardness and strength will improve the wear resistance of small caliber guns resulting in longer service life and better shooting accuracy of the weapons.
Figure 2.1 Fixture for Quenching Ø1”x5” Samples
Figure 2.2 Fixture for Quenching Ø4”x6” Test Samples
Figure 2.3 Basket for Transferring Ø4”x6” Test Samples
Fixture 2.4 Hot Ø4”x6” Test Sample Inside Part Holder
12
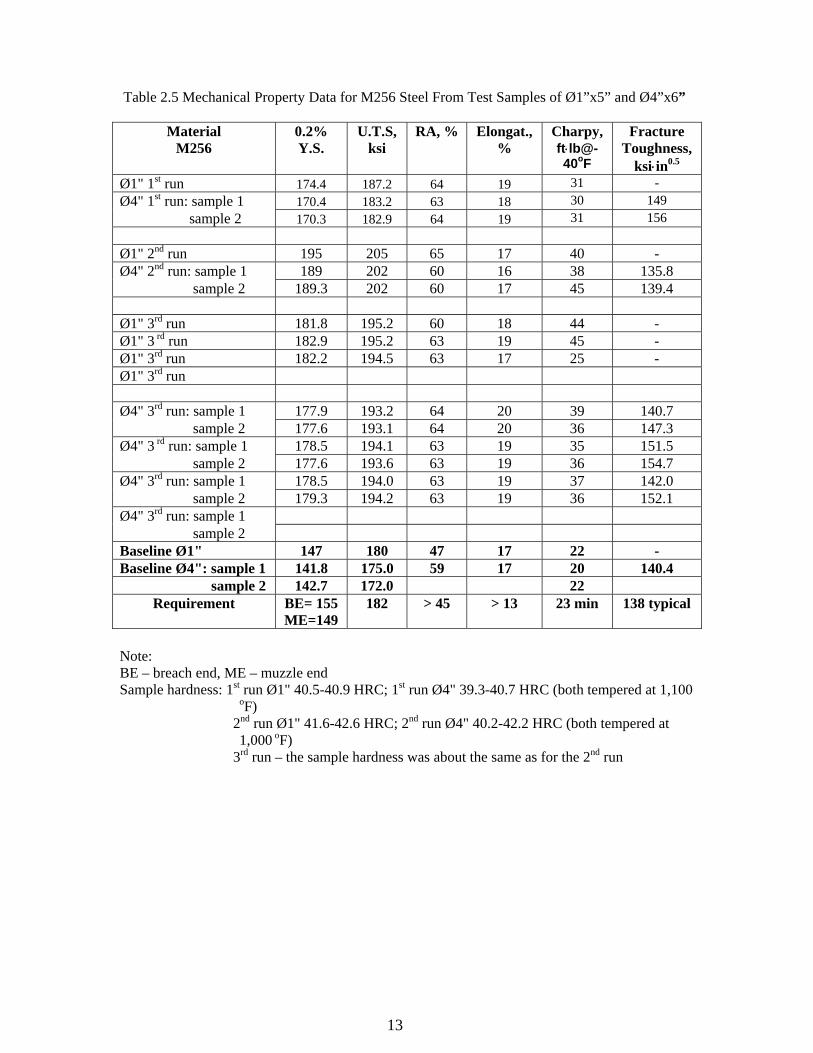
o M256 steel samples: The M256 steel test samples were tempered at two temperatures: 1,000oF and 1,100oF. The highest strength values, in relation to the required fracture toughness requirement of 138 ksi⋅in0.5 were obtained when using the tempering temperature of 1,000oF. Note that, at this tempering temperature, the improvement was as following:
• Material fracture toughness was slightly above the specified value. • Material yield strength improved by about 19.5% for the Ø1”x5” test sample
representing the muzzle end of the barrel and by about 18% for the Ø4”x6” test sample representing the breech end of the barrel.
• Material tensile strength improved by about 7.1% for the test sample representing the breech end of the barrel.
• The material properties of the conventionally quenched Ø1”x5” and Ø4”x6” samples were slightly below the specified values.
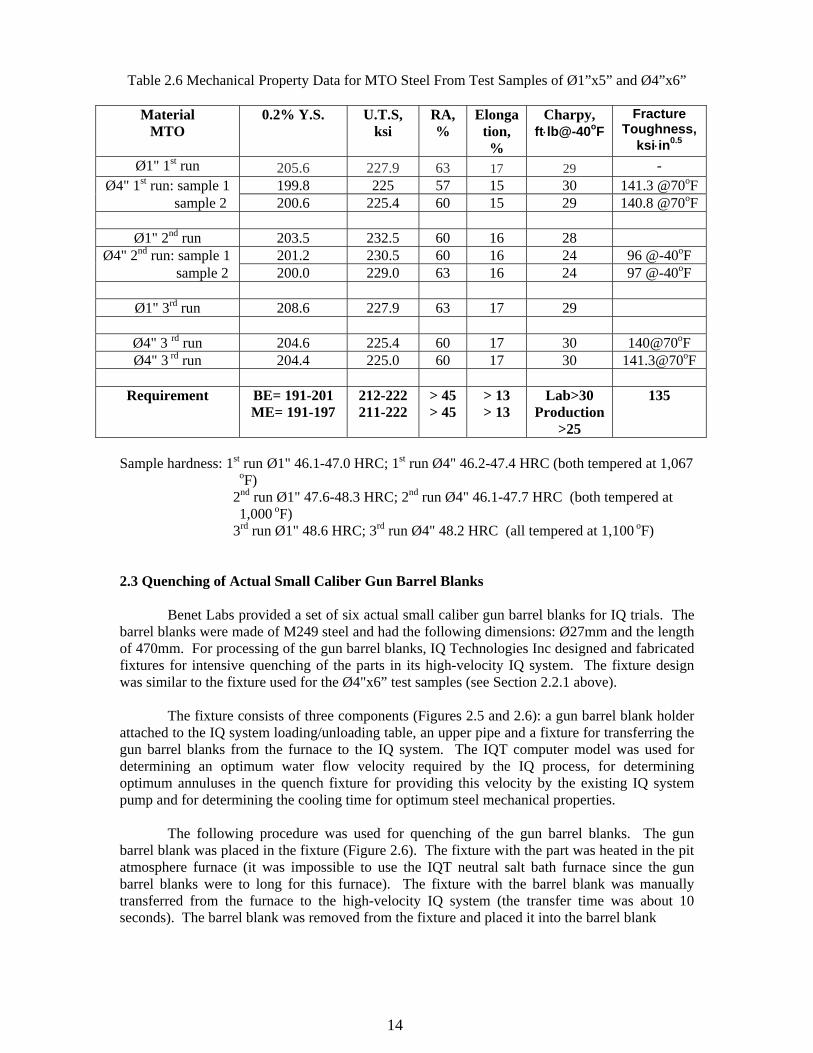
o MTO steel samples: The MTO steel test samples were tempered at three temperatures:
1,000oF, 1,067oF and 1,100oF. The highest strength values and fracture toughness values were obtained when using the tempering temperature 1,067 oF. After tempering at this temperature, the IQ process provides the material with tensile strength values above the specified strength requirements for both the NLOS-C and FCS barrel drawings. Material strength and steel fracture toughness values were higher than required.
Table 2.3 Mechanical Properties for 4130 Steel From Ø1”x5” Test Samples
Material 0.2% Y.S., U.T.S., RA, Elongation,
Charpy, ft⋅lb
Hardness, HRC
4130 ksi ksi (%) (%) @-40oF 1st run 170.2 180.1 63 17 23 38.2 - 39.8 2nd run 169.2 171.8 64 16 25 36.9 - 37.9
Requirement 152-171 55 18 ≥25 34 - 38 Note: **) We tempered the samples at the following temperatures: 1st run – 875oF 2nd run - 910oF
Table 2.4 Mechanical Properties for M249 Steel From Test samples of OD=22mm, ID=5.5mm and Length 127mm
Material 0.2% Y.S., U.T.S., RA, Elongation,Charpy,
ft⋅lb Hardness,
HRC M249 ksi ksi (%) (%) @-40oF 1st run 180.8 187.6 61 17 19 40.7 - 41.5 2nd run 174.5 185.2 63 16 30 40.0 – 40.8
3rd run Sample 1 173.7 182.9 66 18 31 38.7 – 40.0 Sample 2 170.2 182.1 67 19 28 38.0 - 40.0 Requirement 113-143 127-159 ≥12 None 28-35
Note: *) The Charpy value for the test sample processed by the standard method was 28 ft⋅lb **) We tempered the samples at the following temperatures: 1st run – 950oF 2nd run - 1050oF 3rd run – 1,100oF
13
Table 2.5 Mechanical Property Data for M256 Steel From Test Samples of Ø1”x5” and Ø4”x6”
Material M256
0.2% Y.S.
U.T.S, ksi
RA, % Elongat., %
Charpy, ft⋅lb@-40oF
Fracture Toughness,
ksi⋅in0.5 Ø1" 1st run 174.4 187.2 64 19 31 - Ø4" 1st run: sample 1 170.4 183.2 63 18 30 149 sample 2 170.3 182.9 64 19 31 156 Ø1" 2nd run 195 205 65 17 40 - Ø4" 2nd run: sample 1 189 202 60 16 38 135.8 sample 2 189.3 202 60 17 45 139.4 Ø1" 3rd run 181.8 195.2 60 18 44 - Ø1" 3 rd run 182.9 195.2 63 19 45 - Ø1" 3rd run 182.2 194.5 63 17 25 - Ø1" 3rd run Ø4" 3rd run: sample 1 177.9 193.2 64 20 39 140.7 sample 2 177.6 193.1 64 20 36 147.3 Ø4" 3 rd run: sample 1 178.5 194.1 63 19 35 151.5 sample 2 177.6 193.6 63 19 36 154.7 Ø4" 3rd run: sample 1 178.5 194.0 63 19 37 142.0 sample 2 179.3 194.2 63 19 36 152.1 Ø4" 3rd run: sample 1 sample 2 Baseline Ø1" 147 180 47 17 22 - Baseline Ø4": sample 1 141.8 175.0 59 17 20 140.4 sample 2 142.7 172.0 22
Requirement
BE= 155 ME=149
182 > 45 > 13 23 min 138 typical
Note: BE – breach end, ME – muzzle end Sample hardness: 1st run Ø1" 40.5-40.9 HRC; 1st run Ø4" 39.3-40.7 HRC (both tempered at 1,100
oF) 2nd run Ø1" 41.6-42.6 HRC; 2nd run Ø4" 40.2-42.2 HRC (both tempered at
1,000 oF) 3rd run – the sample hardness was about the same as for the 2nd run
14
Table 2.6 Mechanical Property Data for MTO Steel From Test Samples of Ø1”x5” and Ø4”x6”
Material MTO
0.2% Y.S. U.T.S, ksi
RA, %
Elongation, %
Charpy, ft⋅lb@-40oF
Fracture Toughness,
ksi⋅in0.5 Ø1" 1st run 205.6 227.9 63 17 29 -
Ø4" 1st run: sample 1 199.8 225 57 15 30 141.3 @70oF sample 2 200.6 225.4 60 15 29 140.8 @70oF
Ø1" 2nd run 203.5 232.5 60 16 28
Ø4" 2nd run: sample 1 201.2 230.5 60 16 24 96 @-40oF sample 2 200.0 229.0 63 16 24 97 @-40oF
Ø1" 3rd run 208.6 227.9 63 17 29
Ø4" 3 rd run 204.6 225.4 60 17 30 140@70oF Ø4" 3 rd run 204.4 225.0 60 17 30 141.3@70oF
Requirement
BE= 191-201 ME= 191-197
212-222 211-222
> 45 > 45
> 13 > 13
Lab>30 Production
>25
135
Sample hardness: 1st run Ø1" 46.1-47.0 HRC; 1st run Ø4" 46.2-47.4 HRC (both tempered at 1,067
oF) 2nd run Ø1" 47.6-48.3 HRC; 2nd run Ø4" 46.1-47.7 HRC (both tempered at
1,000 oF) 3rd run Ø1" 48.6 HRC; 3rd run Ø4" 48.2 HRC (all tempered at 1,100 oF) 2.3 Quenching of Actual Small Caliber Gun Barrel Blanks
Benet Labs provided a set of six actual small caliber gun barrel blanks for IQ trials. The
barrel blanks were made of M249 steel and had the following dimensions: Ø27mm and the length of 470mm. For processing of the gun barrel blanks, IQ Technologies Inc designed and fabricated fixtures for intensive quenching of the parts in its high-velocity IQ system. The fixture design was similar to the fixture used for the Ø4"x6” test samples (see Section 2.2.1 above).
The fixture consists of three components (Figures 2.5 and 2.6): a gun barrel blank holder
attached to the IQ system loading/unloading table, an upper pipe and a fixture for transferring the gun barrel blanks from the furnace to the IQ system. The IQT computer model was used for determining an optimum water flow velocity required by the IQ process, for determining optimum annuluses in the quench fixture for providing this velocity by the existing IQ system pump and for determining the cooling time for optimum steel mechanical properties.
The following procedure was used for quenching of the gun barrel blanks. The gun
barrel blank was placed in the fixture (Figure 2.6). The fixture with the part was heated in the pit atmosphere furnace (it was impossible to use the IQT neutral salt bath furnace since the gun barrel blanks were to long for this furnace). The fixture with the barrel blank was manually transferred from the furnace to the high-velocity IQ system (the transfer time was about 10 seconds). The barrel blank was removed from the fixture and placed it into the barrel blank
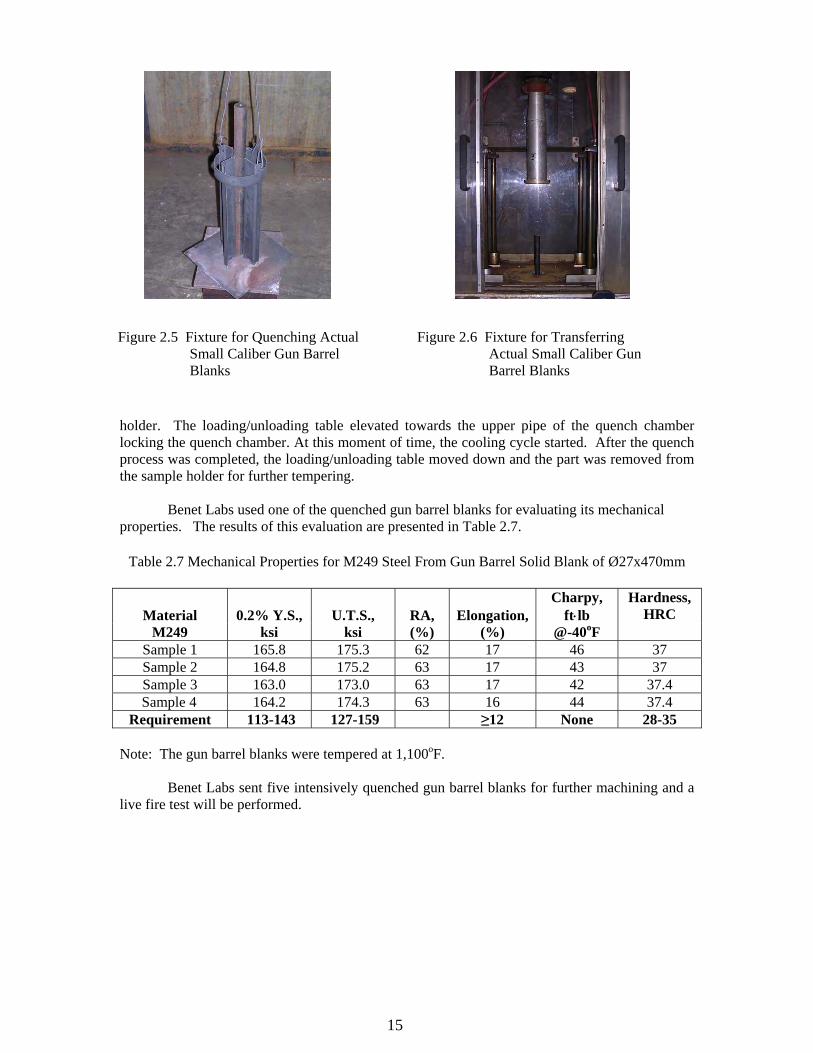
15
holder. The loading/unloading table elevated towards the upper pipe of the quench chamber locking the quench chamber. At this moment of time, the cooling cycle started. After the quench process was completed, the loading/unloading table moved down and the part was removed from the sample holder for further tempering.
Benet Labs used one of the quenched gun barrel blanks for evaluating its mechanical
properties. The results of this evaluation are presented in Table 2.7.
Table 2.7 Mechanical Properties for M249 Steel From Gun Barrel Solid Blank of Ø27x470mm
Material 0.2% Y.S., U.T.S., RA, Elongation,Charpy,
ft⋅lb Hardness,
HRC M249 ksi ksi (%) (%) @-40oF
Sample 1 165.8 175.3 62 17 46 37 Sample 2 164.8 175.2 63 17 43 37 Sample 3 163.0 173.0 63 17 42 37.4
Sample 4 164.2 174.3 63 16 44 37.4 Requirement 113-143 127-159 ≥12 None 28-35
Note: The gun barrel blanks were tempered at 1,100oF.
Benet Labs sent five intensively quenched gun barrel blanks for further machining and a live fire test will be performed.
Figure 2.5 Fixture for Quenching Actual Small Caliber Gun Barrel Blanks
Figure 2.6 Fixture for Transferring Actual Small Caliber Gun Barrel Blanks
16
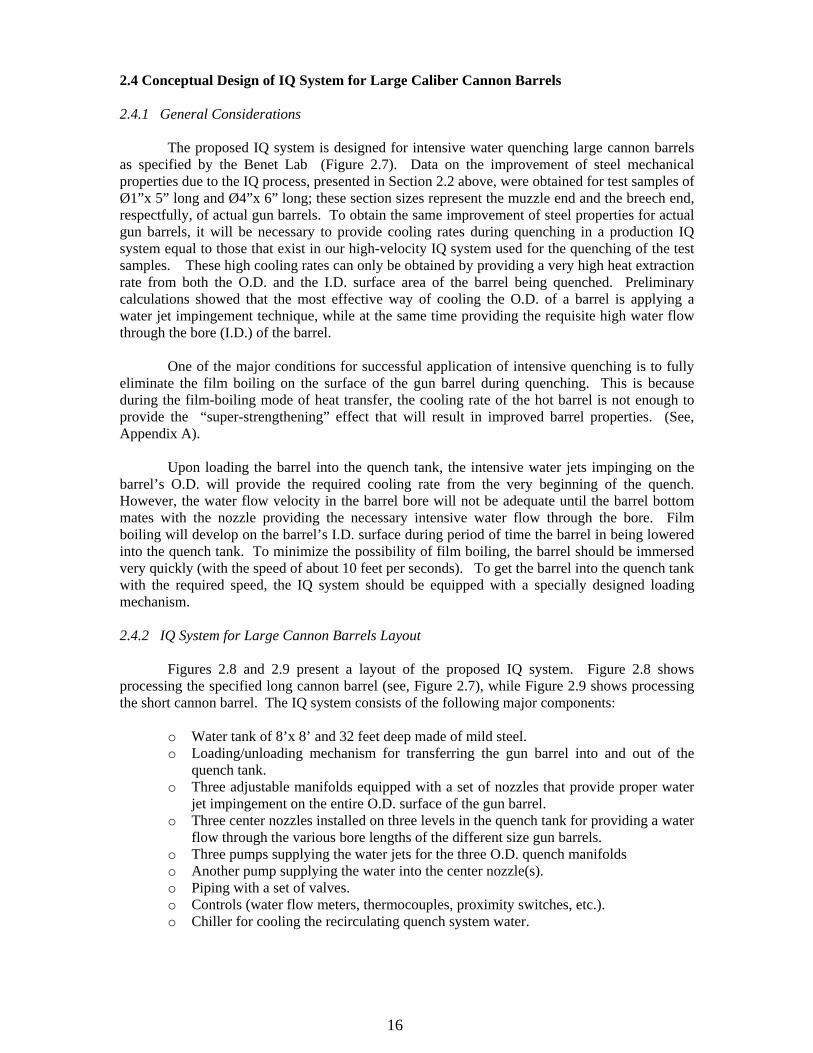
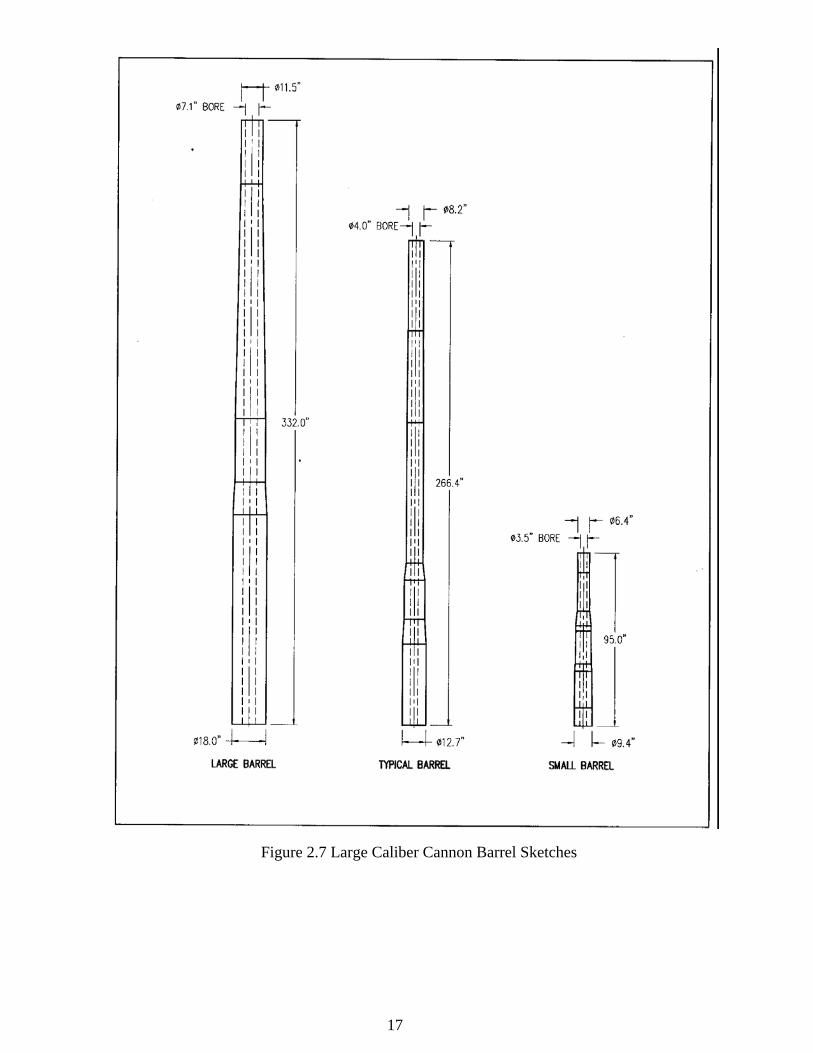
2.4 Conceptual Design of IQ System for Large Caliber Cannon Barrels 2.4.1 General Considerations The proposed IQ system is designed for intensive water quenching large cannon barrels as specified by the Benet Lab (Figure 2.7). Data on the improvement of steel mechanical properties due to the IQ process, presented in Section 2.2 above, were obtained for test samples of Ø1”x 5” long and Ø4”x 6” long; these section sizes represent the muzzle end and the breech end, respectfully, of actual gun barrels. To obtain the same improvement of steel properties for actual gun barrels, it will be necessary to provide cooling rates during quenching in a production IQ system equal to those that exist in our high-velocity IQ system used for the quenching of the test samples. These high cooling rates can only be obtained by providing a very high heat extraction rate from both the O.D. and the I.D. surface area of the barrel being quenched. Preliminary calculations showed that the most effective way of cooling the O.D. of a barrel is applying a water jet impingement technique, while at the same time providing the requisite high water flow through the bore (I.D.) of the barrel. One of the major conditions for successful application of intensive quenching is to fully eliminate the film boiling on the surface of the gun barrel during quenching. This is because during the film-boiling mode of heat transfer, the cooling rate of the hot barrel is not enough to provide the “super-strengthening” effect that will result in improved barrel properties. (See, Appendix A).
Upon loading the barrel into the quench tank, the intensive water jets impinging on the barrel’s O.D. will provide the required cooling rate from the very beginning of the quench. However, the water flow velocity in the barrel bore will not be adequate until the barrel bottom mates with the nozzle providing the necessary intensive water flow through the bore. Film boiling will develop on the barrel’s I.D. surface during period of time the barrel in being lowered into the quench tank. To minimize the possibility of film boiling, the barrel should be immersed very quickly (with the speed of about 10 feet per seconds). To get the barrel into the quench tank with the required speed, the IQ system should be equipped with a specially designed loading mechanism. 2.4.2 IQ System for Large Cannon Barrels Layout
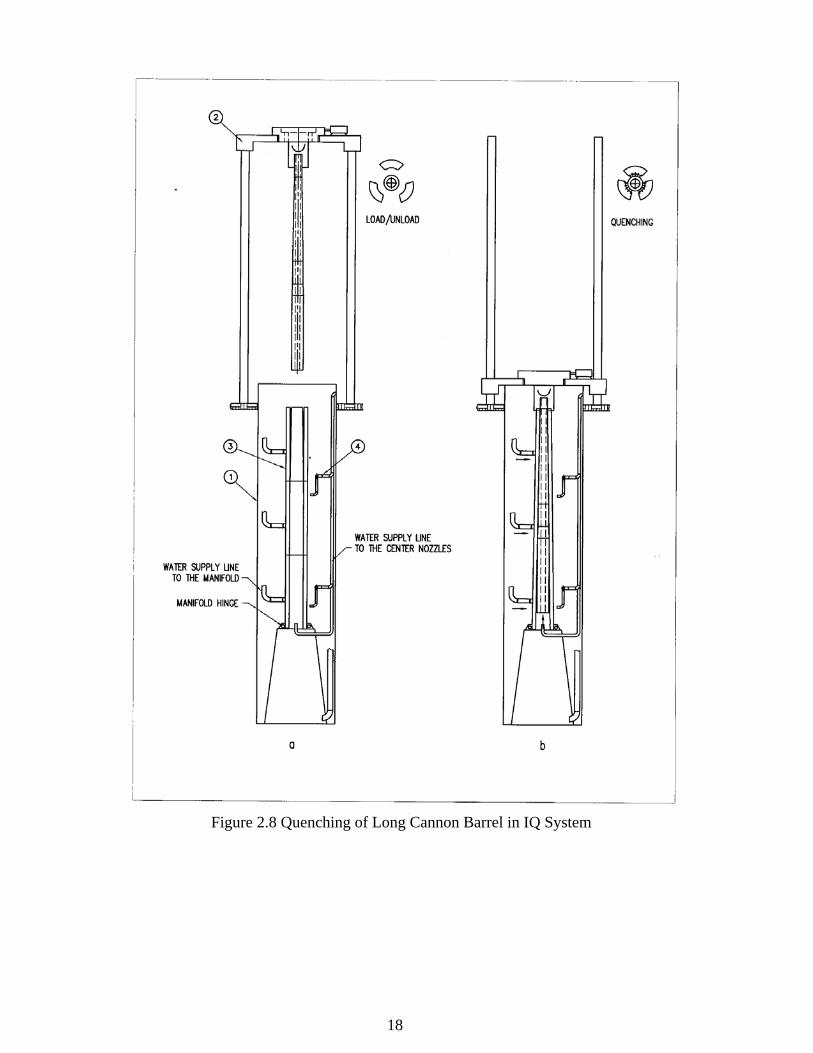
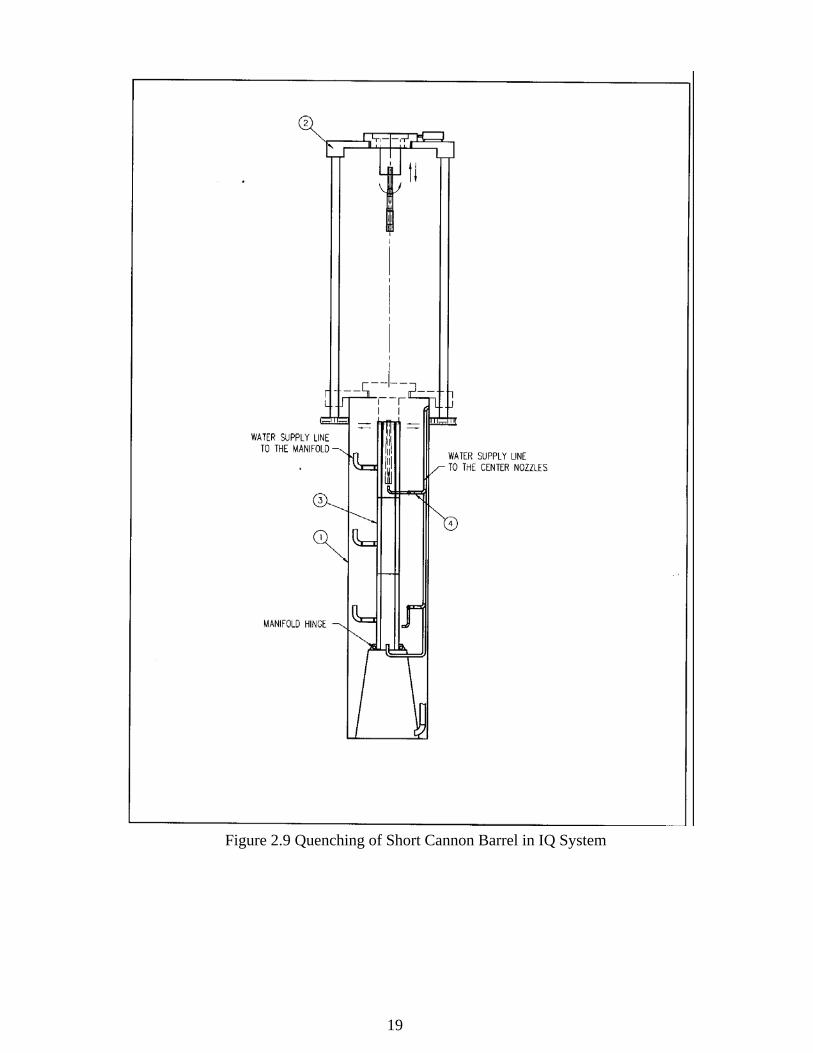
Figures 2.8 and 2.9 present a layout of the proposed IQ system. Figure 2.8 shows processing the specified long cannon barrel (see, Figure 2.7), while Figure 2.9 shows processing the short cannon barrel. The IQ system consists of the following major components:
o Water tank of 8’x 8’ and 32 feet deep made of mild steel. o Loading/unloading mechanism for transferring the gun barrel into and out of the
quench tank. o Three adjustable manifolds equipped with a set of nozzles that provide proper water
jet impingement on the entire O.D. surface of the gun barrel. o Three center nozzles installed on three levels in the quench tank for providing a water
flow through the various bore lengths of the different size gun barrels. o Three pumps supplying the water jets for the three O.D. quench manifolds o Another pump supplying the water into the center nozzle(s). o Piping with a set of valves. o Controls (water flow meters, thermocouples, proximity switches, etc.). o Chiller for cooling the recirculating quench system water.
17
o
Figure 2.7 Large Caliber Cannon Barrel Sketches
18
Figure 2.8 Quenching of Long Cannon Barrel in IQ System
19
Figure 2.9 Quenching of Short Cannon Barrel in IQ System
20
2.4.3 Loading/Unloading Mechanism
The barrel loading/unloading mechanism consists of a platform for holding the gun barrel, two electric trolleys attached to the platform that move up and down along two columns attached to the floor. A special mechanism to rotate the gun barrel during quenching is installed on the platform to insure uniformity of cooling over the entire barrel surface. 2.4.4 Adjustable Manifolds Each manifold rests on a pivot hinge allowing the manifold to move towards the tapered gun barrel surface. The articulated manifolds will provide for the proper distance between the nozzles and the O.D. surface of the barrel. An air cylinder (not shown on Figures 2.8 and 2.9) attached to the top of the manifold moves the manifold toward the barrel at the beginning of the quench and away from the barrel at the end of the intensive quench. Note that the manifolds are in a vertical position during loading of the gun barrel into the quench tank. (See, Figure 2.8a.) When the gun barrel is fully immersed into the tank, the manifolds lean towards the gun barrel like petals of a flower. (See, Figures 2.8b) The articulation of the manifolds insures that barrels of various tapers and varying thickness along their length will uniformly see the proper water velocities to obtain the benefits of intensive quenching.
Each manifold consists of three sections for more uniform water distribution along the entire height of the manifold. (See, Figures 2.8 and 2.9.) When quenching the shortest gun barrel (see, Figure 2.7), the water is introduced only through the jets in the upper section of the manifolds. When quenching a typical or a large barrel, the jets in the top, middle and bottom sections of the manifolds are working.
A computational fluid dynamic (CFD) modeling was used for determining the optimal
nozzle size, and arrangement, as well as, the distance between the nozzles and the gun barrel’s surfaces for uniformly providing the required heat extraction rates during quenching of gun barrels. Air Flow Science Corporation (AFS) conducted the CFD modeling, and their detailed results are presented in Appendix B.
Note that the required heat transfer rates on the barrel’s O.D. surface (needed for
implementing the IQ process) depend on the barrel wall thickness. To determine the required heat extraction rates to be provided in the production IQ system, we used our proprietary computer models, as well as, experimental data from quenching the test samples in our high-velocity IQ system. (See, Section 2.2). AFS used the same data for their CFD modeling (as detailed in Appendix B).
When conducting the CFD modeling, it was found that a staggered arrangement of the
nozzles provides better uniformity of cooling for the barrel O.D. AFS conducted a series of computer simulations to try to determine an optimum nozzle arrangement and size. As a result of these calculations, we selected nozzles of Ø10 mm for the upper sections of the manifolds, and the nozzles of Ø15 mm for the two lower sections of the manifolds. The distance between the nozzles is X and Y mm respectfully.
Figures B8-B35 in the Appendix B present the water flow velocity distribution and heat
flux distribution around three different size gun barrels. . Note that CFD modeling was conducted mainly to prove one possible concept of the
proposed design of the IQ system. The optimum nozzle size and arrangement, as well as, details of the manifold design for providing a uniform water distribution throughout all nozzles, will be determined in the next phase of the project. Table 2.8 summarizes the CFD modeling results.
21
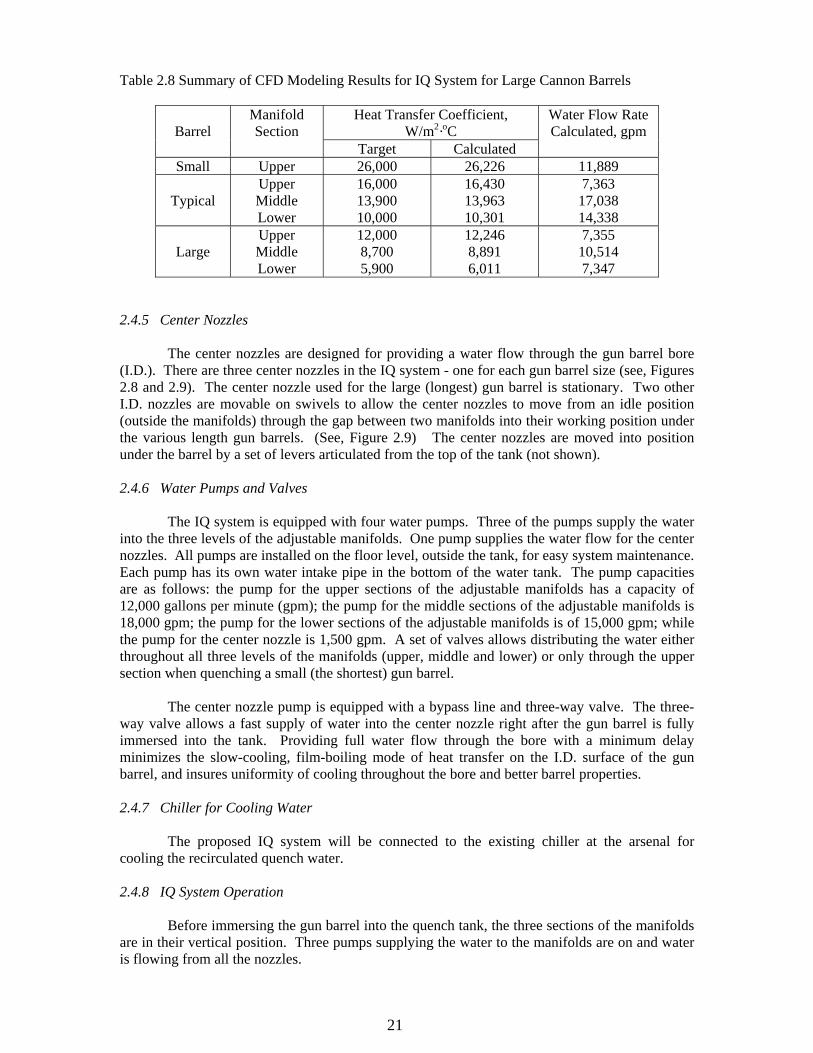
Table 2.8 Summary of CFD Modeling Results for IQ System for Large Cannon Barrels
Barrel
Manifold Section
Heat Transfer Coefficient, W/m2·oC
Water Flow Rate Calculated, gpm
Target Calculated Small Upper 26,000 26,226 11,889
Typical
Upper Middle Lower
16,000 13,900 10,000
16,430 13,963 10,301
7,363 17,038 14,338
Large
Upper Middle Lower
12,000 8,700 5,900
12,246 8,891 6,011
7,355 10,514 7,347
2.4.5 Center Nozzles The center nozzles are designed for providing a water flow through the gun barrel bore (I.D.). There are three center nozzles in the IQ system - one for each gun barrel size (see, Figures 2.8 and 2.9). The center nozzle used for the large (longest) gun barrel is stationary. Two other I.D. nozzles are movable on swivels to allow the center nozzles to move from an idle position (outside the manifolds) through the gap between two manifolds into their working position under the various length gun barrels. (See, Figure 2.9) The center nozzles are moved into position under the barrel by a set of levers articulated from the top of the tank (not shown). 2.4.6 Water Pumps and Valves
The IQ system is equipped with four water pumps. Three of the pumps supply the water into the three levels of the adjustable manifolds. One pump supplies the water flow for the center nozzles. All pumps are installed on the floor level, outside the tank, for easy system maintenance. Each pump has its own water intake pipe in the bottom of the water tank. The pump capacities are as follows: the pump for the upper sections of the adjustable manifolds has a capacity of 12,000 gallons per minute (gpm); the pump for the middle sections of the adjustable manifolds is 18,000 gpm; the pump for the lower sections of the adjustable manifolds is of 15,000 gpm; while the pump for the center nozzle is 1,500 gpm. A set of valves allows distributing the water either throughout all three levels of the manifolds (upper, middle and lower) or only through the upper section when quenching a small (the shortest) gun barrel.
The center nozzle pump is equipped with a bypass line and three-way valve. The three-
way valve allows a fast supply of water into the center nozzle right after the gun barrel is fully immersed into the tank. Providing full water flow through the bore with a minimum delay minimizes the slow-cooling, film-boiling mode of heat transfer on the I.D. surface of the gun barrel, and insures uniformity of cooling throughout the bore and better barrel properties. 2.4.7 Chiller for Cooling Water
The proposed IQ system will be connected to the existing chiller at the arsenal for
cooling the recirculated quench water.
2.4.8 IQ System Operation Before immersing the gun barrel into the quench tank, the three sections of the manifolds
are in their vertical position. Three pumps supplying the water to the manifolds are on and water is flowing from all the nozzles.
22
The proper center nozzle (depending on barrel length) is moved into its working position (for the longest gun barrel, both movable center nozzles are at the idle position - outside the manifolds, see Figure 2.8a). The center nozzle pump is ON, but it pumps the water through a bypass line.
The platform of the loading mechanism is at its down position (at a floor level). A crane
transfers a holder with a hot barrel from the furnace to the IQ system and lines it up with the center axis of the IQ tank. The platform moves up and picks up the holder with the hot barrel. The crane releases the holder. A rotation mechanism starts rotating the holder with the hot barrel. The platform moves down. Before the breech end of the gun barrel reaches its down position, the electric trolleys moving the platform slow down. The trolleys stop when the distance between the bottom end of the barrel is approximately 2” above the (appropriate) center nozzle. (The position of the gun barrel is controlled by proximity switches). At this time, the three-way valve for the center nozzle pump redirects the water flow from “by-pass” to “quench” mode and water begins to flow up the bore of the barrel. The water flowing through the center nozzle quenches the entire length of the gun barrel bore. At the same time, all three manifolds are tilted towards the barrel’s tapered O.D. surface to a pre-determined distance.
After the quench cycle is completed, the manifolds are moved back into a vertical
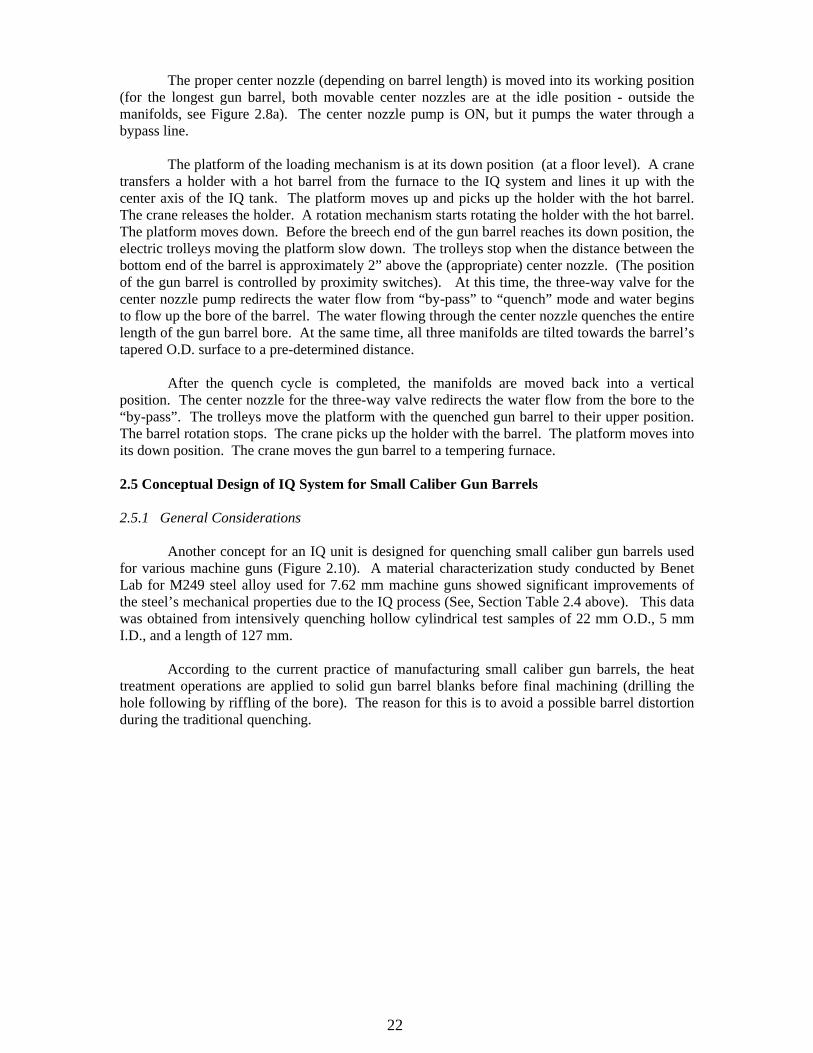
position. The center nozzle for the three-way valve redirects the water flow from the bore to the “by-pass”. The trolleys move the platform with the quenched gun barrel to their upper position. The barrel rotation stops. The crane picks up the holder with the barrel. The platform moves into its down position. The crane moves the gun barrel to a tempering furnace. 2.5 Conceptual Design of IQ System for Small Caliber Gun Barrels 2.5.1 General Considerations Another concept for an IQ unit is designed for quenching small caliber gun barrels used for various machine guns (Figure 2.10). A material characterization study conducted by Benet Lab for M249 steel alloy used for 7.62 mm machine guns showed significant improvements of the steel’s mechanical properties due to the IQ process (See, Section Table 2.4 above). This data was obtained from intensively quenching hollow cylindrical test samples of 22 mm O.D., 5 mm I.D., and a length of 127 mm.
According to the current practice of manufacturing small caliber gun barrels, the heat treatment operations are applied to solid gun barrel blanks before final machining (drilling the hole following by riffling of the bore). The reason for this is to avoid a possible barrel distortion during the traditional quenching.
23
To obtain the same improvement of steel properties for actual small caliber gun barrels, it
is necessary to provide cooling rates for gun barrel blanks quenched in a production IQ system the same as they were in our high-velocity IQ system used for quenching the above test samples. Preliminary calculations showed that the most cost effective way of cooling a small caliber barrel blank is by providing a high-velocity water flow along the part surface. 2.5.2 IQ System for Small Caliber Barrels Layout
Benet Lab specified the following dimensions of gun barrel blanks to be quenched in the IQ system: barrel diameter – 0.75 to 1.5”, barrel length – up to 36”. Figures 2.11 and 2.12 present layouts of the proposed IQ system for processing small caliber gun barrel blanks, as well as the furnace for heating barrel blanks prior to quenching equipped with a loading/unloading mechanism.
2.5.3 Furnace for Heating Small Caliber Barrel Blanks
Virtually any type of furnace can be used for heating parts prior to intensive quenching
(atmosphere furnaces, salt bath furnaces, induction heating units, etc.). From a practical point of view, the use of a neutral salt bath furnace for austenitizing the small caliber gun barrels before intensive quenching is recommended. The advantages of this type of furnace for the application considered are the following:
o The heating time is relatively short o Salt bath heating is very uniform over the entire barrel o No part surface oxidation o Barrels can be easily removed from the furnace one by one for intensive quenching o Standard salt bath furnaces are available for processing the parts of the above
dimensions
Figure 2.10 Small Caliber Guns
24
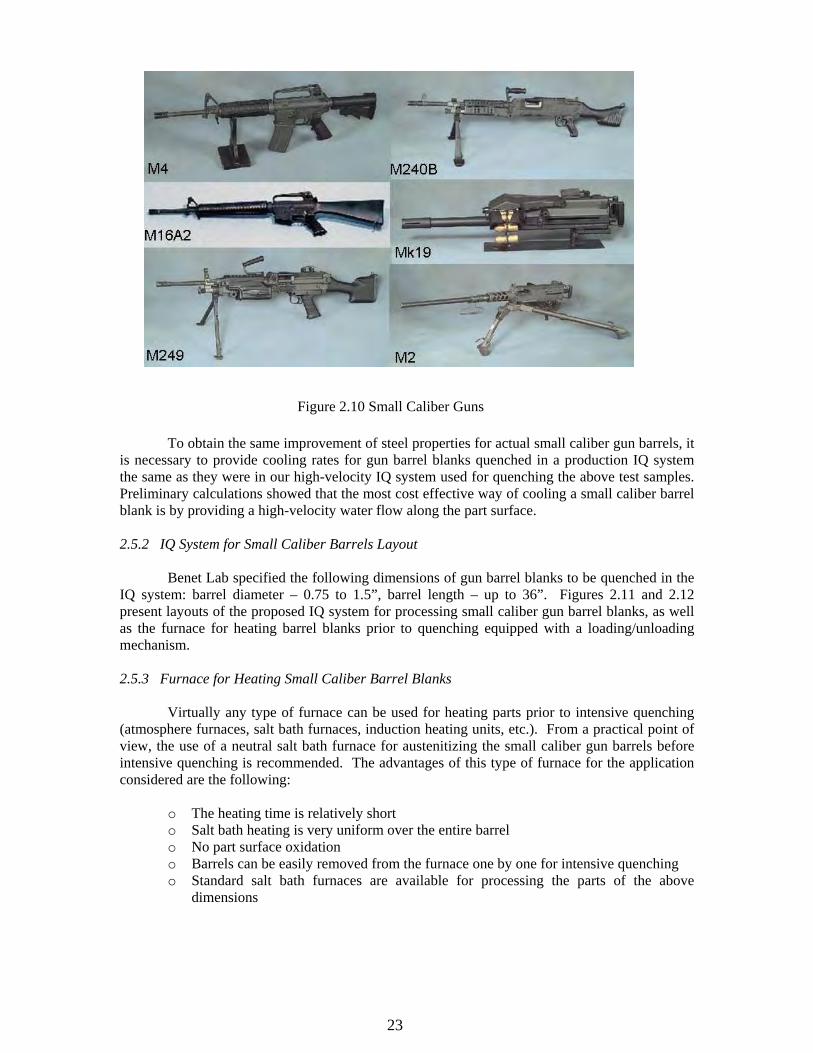
Figure 2.11 IQ Unit for Processing Small Gun Barrels
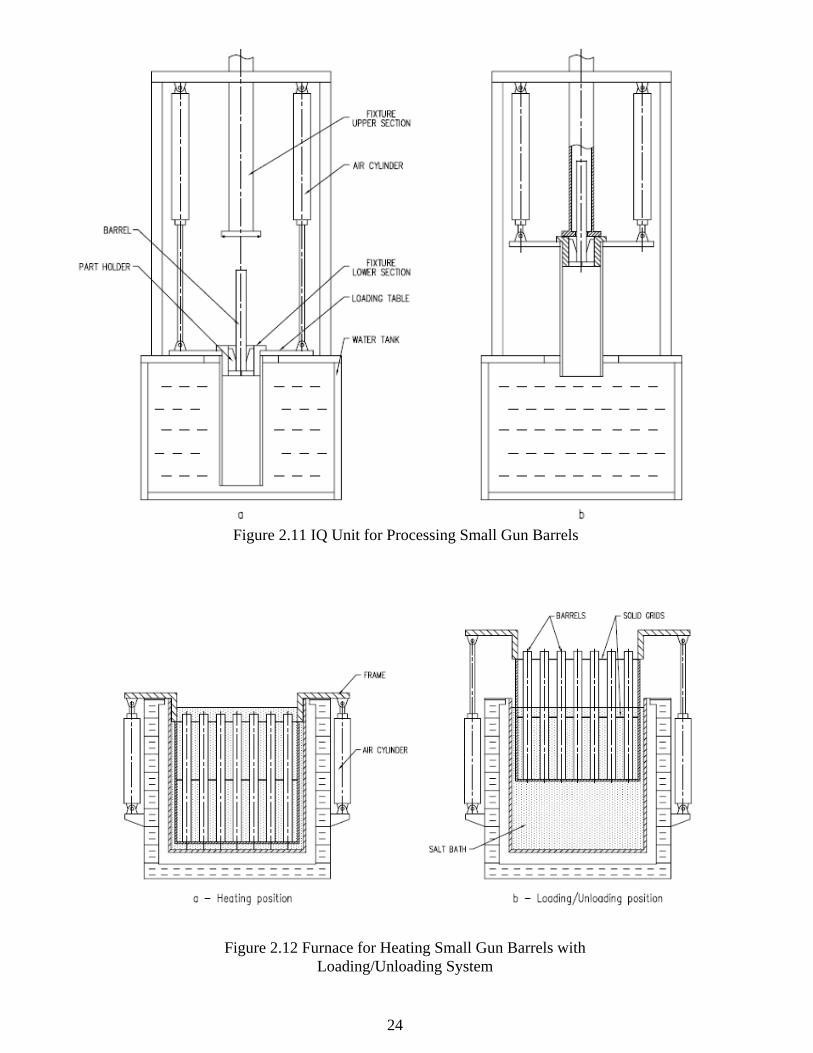
Figure 2.12 Furnace for Heating Small Gun Barrels with Loading/Unloading System
25
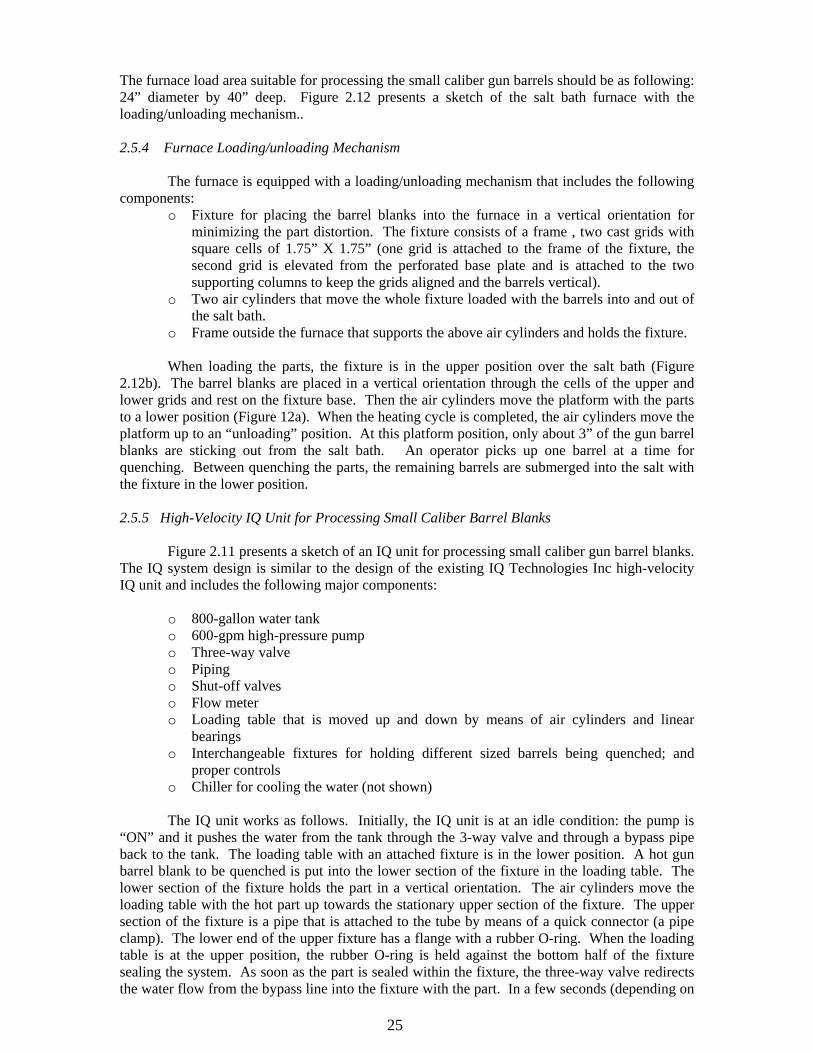
The furnace load area suitable for processing the small caliber gun barrels should be as following: 24” diameter by 40” deep. Figure 2.12 presents a sketch of the salt bath furnace with the loading/unloading mechanism..
2.5.4 Furnace Loading/unloading Mechanism
The furnace is equipped with a loading/unloading mechanism that includes the following components:
o Fixture for placing the barrel blanks into the furnace in a vertical orientation for minimizing the part distortion. The fixture consists of a frame , two cast grids with square cells of 1.75” X 1.75” (one grid is attached to the frame of the fixture, the second grid is elevated from the perforated base plate and is attached to the two supporting columns to keep the grids aligned and the barrels vertical).
o Two air cylinders that move the whole fixture loaded with the barrels into and out of the salt bath.
o Frame outside the furnace that supports the above air cylinders and holds the fixture. When loading the parts, the fixture is in the upper position over the salt bath (Figure
2.12b). The barrel blanks are placed in a vertical orientation through the cells of the upper and lower grids and rest on the fixture base. Then the air cylinders move the platform with the parts to a lower position (Figure 12a). When the heating cycle is completed, the air cylinders move the platform up to an “unloading” position. At this platform position, only about 3” of the gun barrel blanks are sticking out from the salt bath. An operator picks up one barrel at a time for quenching. Between quenching the parts, the remaining barrels are submerged into the salt with the fixture in the lower position. 2.5.5 High-Velocity IQ Unit for Processing Small Caliber Barrel Blanks
Figure 2.11 presents a sketch of an IQ unit for processing small caliber gun barrel blanks. The IQ system design is similar to the design of the existing IQ Technologies Inc high-velocity IQ unit and includes the following major components:
o 800-gallon water tank o 600-gpm high-pressure pump o Three-way valve o Piping o Shut-off valves o Flow meter o Loading table that is moved up and down by means of air cylinders and linear
bearings o Interchangeable fixtures for holding different sized barrels being quenched; and
proper controls o Chiller for cooling the water (not shown)
The IQ unit works as follows. Initially, the IQ unit is at an idle condition: the pump is
“ON” and it pushes the water from the tank through the 3-way valve and through a bypass pipe back to the tank. The loading table with an attached fixture is in the lower position. A hot gun barrel blank to be quenched is put into the lower section of the fixture in the loading table. The lower section of the fixture holds the part in a vertical orientation. The air cylinders move the loading table with the hot part up towards the stationary upper section of the fixture. The upper section of the fixture is a pipe that is attached to the tube by means of a quick connector (a pipe clamp). The lower end of the upper fixture has a flange with a rubber O-ring. When the loading table is at the upper position, the rubber O-ring is held against the bottom half of the fixture sealing the system. As soon as the part is sealed within the fixture, the three-way valve redirects the water flow from the bypass line into the fixture with the part. In a few seconds (depending on
26
the IQ recipe) the intensive water quench is completed, and the 3-way valve redirects the water flow back to the bypass pipe. The air cylinders push the loading table with the part down for unloading and allowing the part to finish cooling in air. 2.6 Computer Simulation of Heat Treatment Process for Gun Barrels
Simulations of the intensive quenching process were developed and run to investigate the sensitivity of the process to steel chemistry (hardenability), barrel or section thickness, and process variables such as valve opening timing, water flow rate and the corresponding heat transfer. The computer software used for these models was DANTE®, a product of Deformation Control Technology, Inc. Heat treatment of steel is more than just meeting a hardness specification. It must also produce a desirable residual stress state, proper metallurgical phase distribution, and correct dimensions. The DANTE® software aids the heat treater and designer in predicting the effects of chemistry and process variables on these parameters.
2.6.1 Assessment of Barrel Steels and Sizes for Intensive Quenching
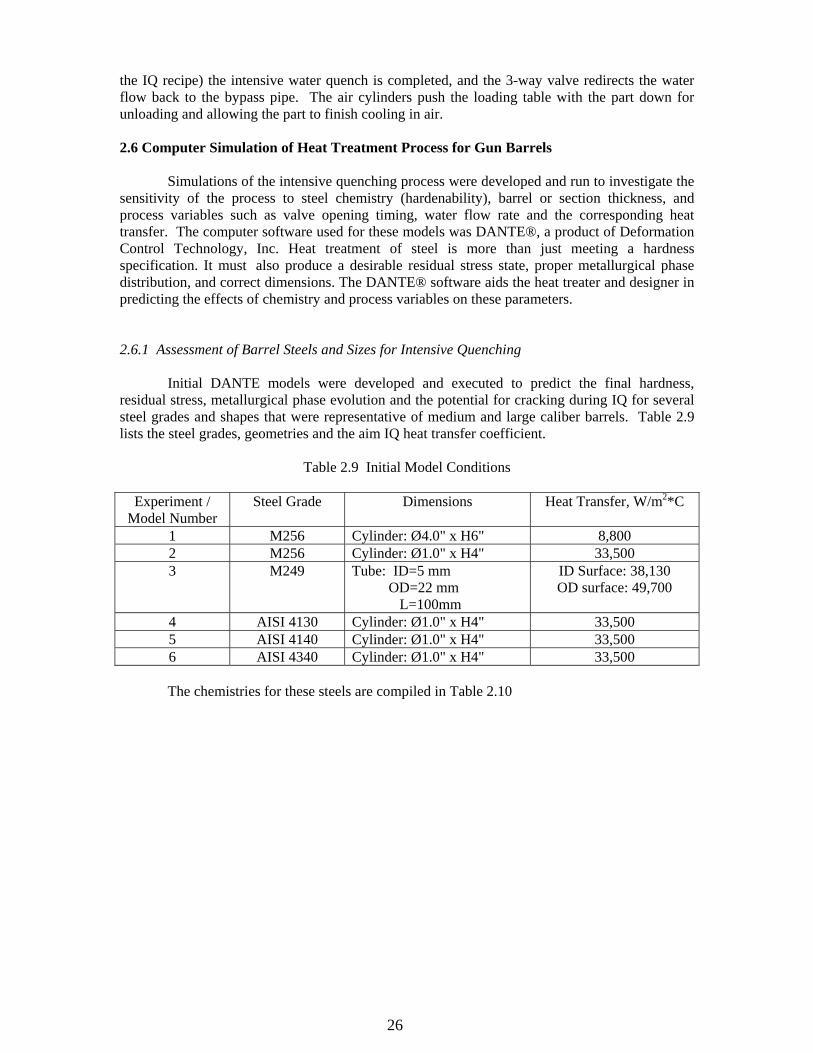
Initial DANTE models were developed and executed to predict the final hardness, residual stress, metallurgical phase evolution and the potential for cracking during IQ for several steel grades and shapes that were representative of medium and large caliber barrels. Table 2.9 lists the steel grades, geometries and the aim IQ heat transfer coefficient.
Table 2.9 Initial Model Conditions
Experiment / Model Number
Steel Grade Dimensions Heat Transfer, W/m2*C
1 M256 Cylinder: Ø4.0" x H6" 8,800 2 M256 Cylinder: Ø1.0" x H4" 33,500 3 M249 Tube: ID=5 mm
OD=22 mm L=100mm
ID Surface: 38,130 OD surface: 49,700
4 AISI 4130 Cylinder: Ø1.0" x H4" 33,500 5 AISI 4140 Cylinder: Ø1.0" x H4" 33,500 6 AISI 4340 Cylinder: Ø1.0" x H4" 33,500
The chemistries for these steels are compiled in Table 2.10
27
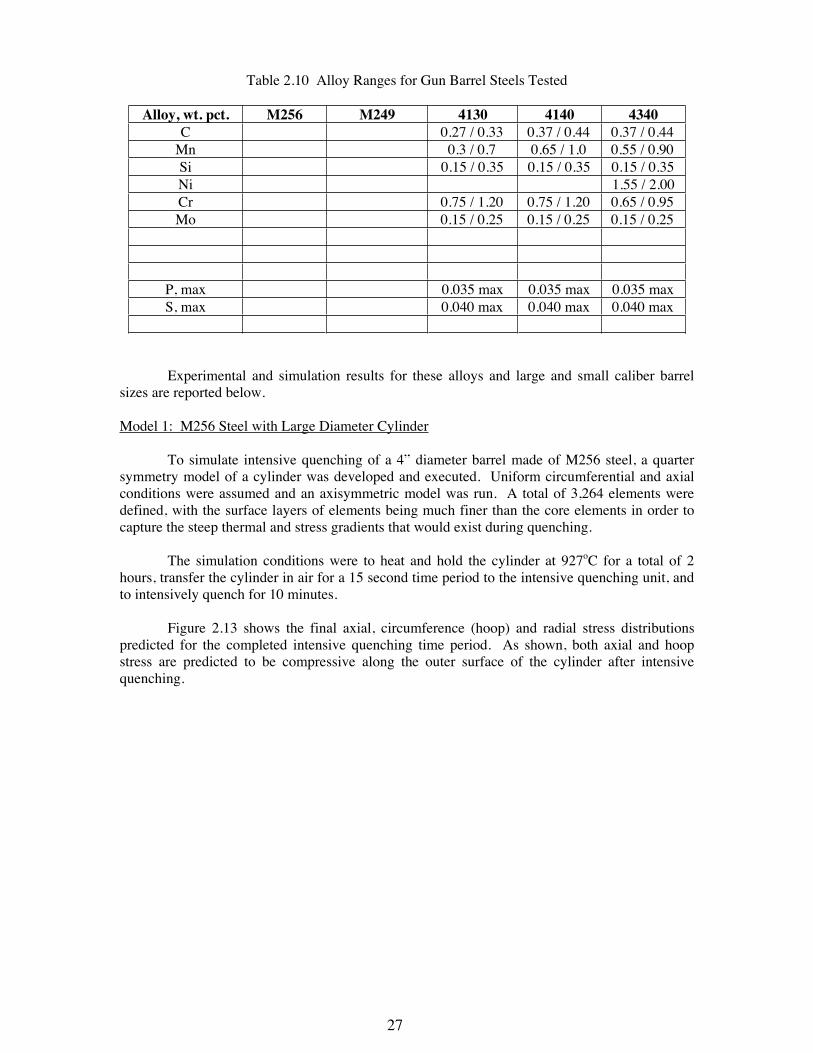
Table 2.10 Alloy Ranges for Gun Barrel Steels Tested
Alloy, wt. pct. M256 M249 4130 4140 4340 C 0.27 / 0.33 0.37 / 0.44 0.37 / 0.44
Mn 0.3 / 0.7 0.65 / 1.0 0.55 / 0.90 Si 0.15 / 0.35 0.15 / 0.35 0.15 / 0.35 Ni 1.55 / 2.00 Cr 0.75 / 1.20 0.75 / 1.20 0.65 / 0.95 Mo 0.15 / 0.25 0.15 / 0.25 0.15 / 0.25
P, max 0.035 max 0.035 max 0.035 max S, max 0.040 max 0.040 max 0.040 max
Experimental and simulation results for these alloys and large and small caliber barrel sizes are reported below.
Model 1: M256 Steel with Large Diameter Cylinder
To simulate intensive quenching of a 4” diameter barrel made of M256 steel, a quarter symmetry model of a cylinder was developed and executed. Uniform circumferential and axial conditions were assumed and an axisymmetric model was run. A total of 3,264 elements were defined, with the surface layers of elements being much finer than the core elements in order to capture the steep thermal and stress gradients that would exist during quenching.
The simulation conditions were to heat and hold the cylinder at 927oC for a total of 2 hours, transfer the cylinder in air for a 15 second time period to the intensive quenching unit, and to intensively quench for 10 minutes.
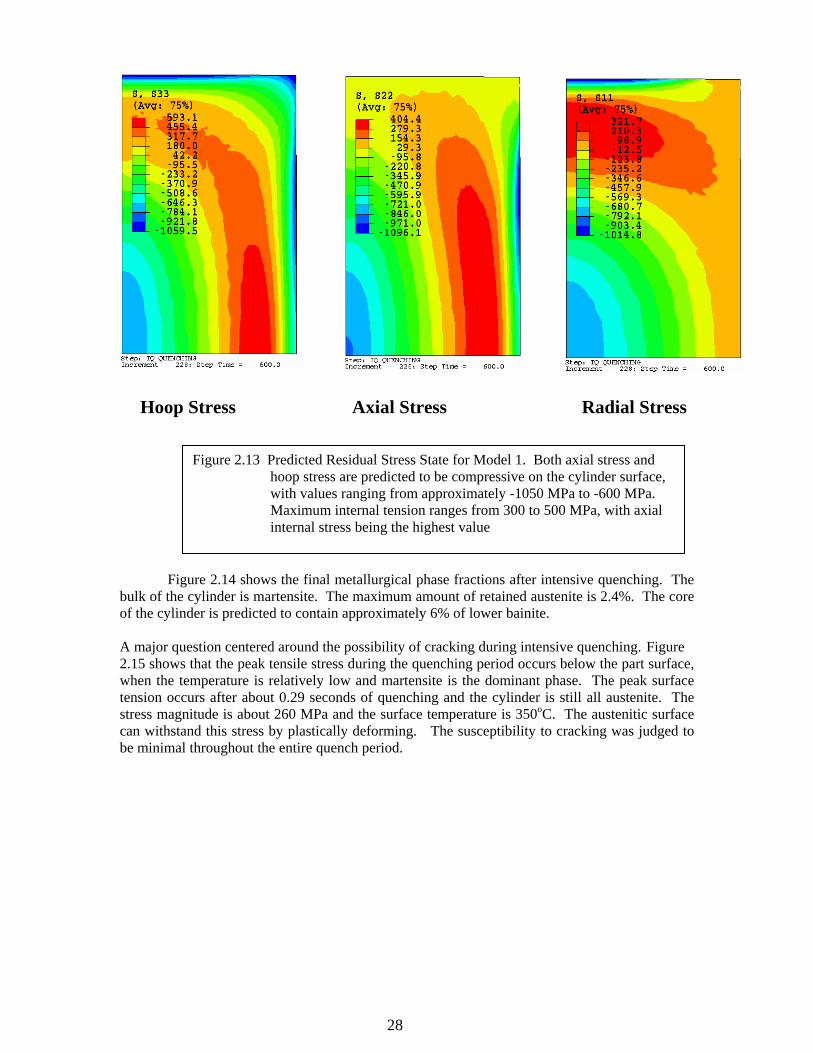
Figure 2.13 shows the final axial, circumference (hoop) and radial stress distributions predicted for the completed intensive quenching time period. As shown, both axial and hoop stress are predicted to be compressive along the outer surface of the cylinder after intensive quenching.
28
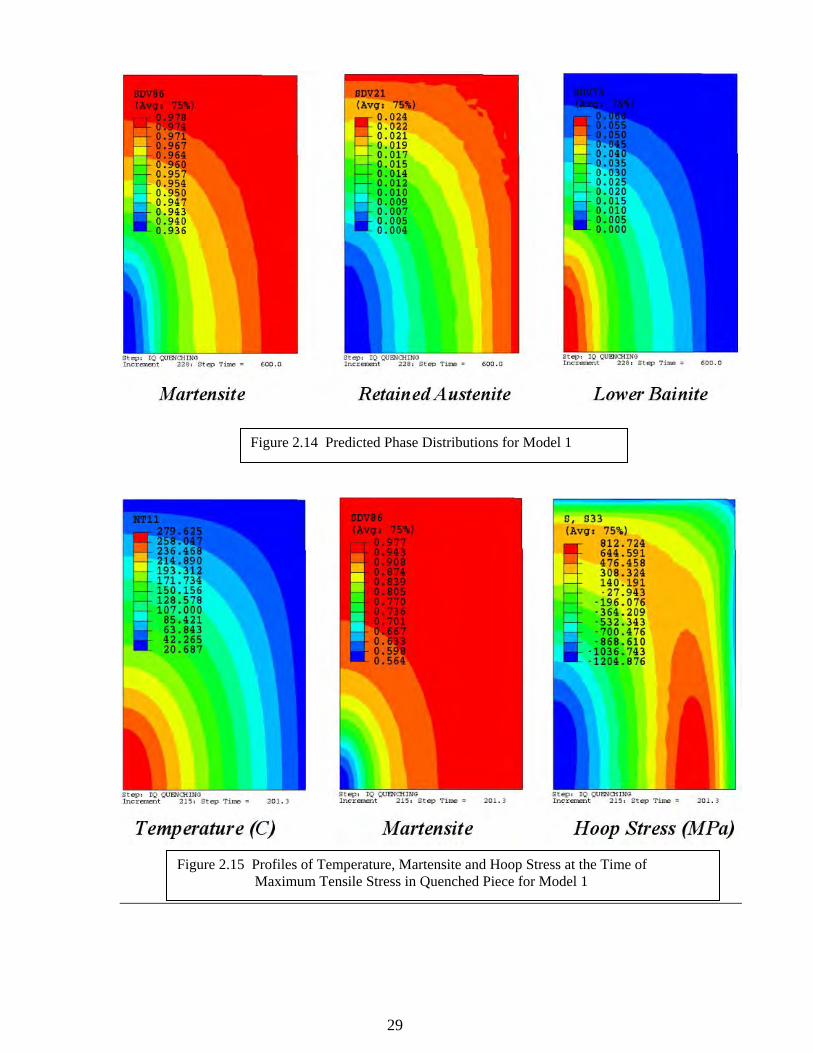
Figure 2.14 shows the final metallurgical phase fractions after intensive quenching. The bulk of the cylinder is martensite. The maximum amount of retained austenite is 2.4%. The core of the cylinder is predicted to contain approximately 6% of lower bainite. A major question centered around the possibility of cracking during intensive quenching. Figure 2.15 shows that the peak tensile stress during the quenching period occurs below the part surface, when the temperature is relatively low and martensite is the dominant phase. The peak surface tension occurs after about 0.29 seconds of quenching and the cylinder is still all austenite. The stress magnitude is about 260 MPa and the surface temperature is 350oC. The austenitic surface can withstand this stress by plastically deforming. The susceptibility to cracking was judged to be minimal throughout the entire quench period.
Figure 2.13 Predicted Residual Stress State for Model 1. Both axial stress and hoop stress are predicted to be compressive on the cylinder surface, with values ranging from approximately -1050 MPa to -600 MPa. Maximum internal tension ranges from 300 to 500 MPa, with axial internal stress being the highest value
Hoop Stress Axial Stress Radial Stress
29
Figure 2.14 Predicted Phase Distributions for Model 1
Figure 2.15 Profiles of Temperature, Martensite and Hoop Stress at the Time of Maximum Tensile Stress in Quenched Piece for Model 1
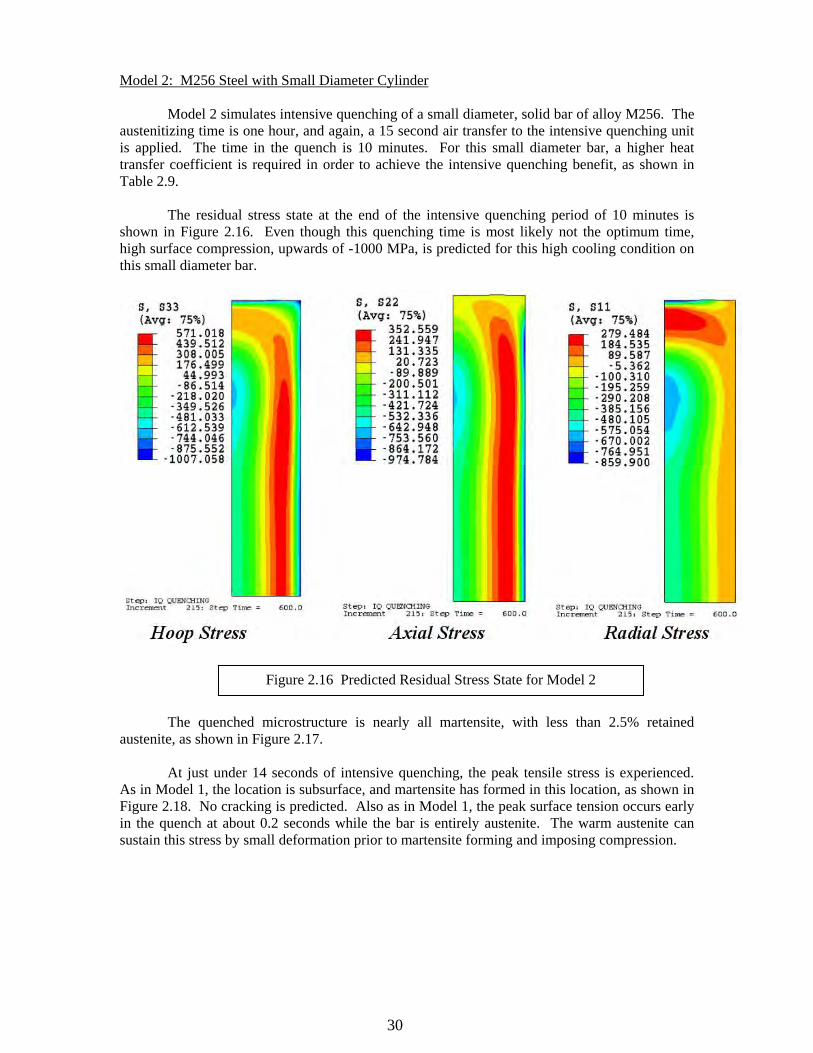
30
Model 2: M256 Steel with Small Diameter Cylinder
Model 2 simulates intensive quenching of a small diameter, solid bar of alloy M256. The austenitizing time is one hour, and again, a 15 second air transfer to the intensive quenching unit is applied. The time in the quench is 10 minutes. For this small diameter bar, a higher heat transfer coefficient is required in order to achieve the intensive quenching benefit, as shown in Table 2.9.
The residual stress state at the end of the intensive quenching period of 10 minutes is shown in Figure 2.16. Even though this quenching time is most likely not the optimum time, high surface compression, upwards of -1000 MPa, is predicted for this high cooling condition on this small diameter bar.
The quenched microstructure is nearly all martensite, with less than 2.5% retained austenite, as shown in Figure 2.17.
At just under 14 seconds of intensive quenching, the peak tensile stress is experienced. As in Model 1, the location is subsurface, and martensite has formed in this location, as shown in Figure 2.18. No cracking is predicted. Also as in Model 1, the peak surface tension occurs early in the quench at about 0.2 seconds while the bar is entirely austenite. The warm austenite can sustain this stress by small deformation prior to martensite forming and imposing compression.
Figure 2.16 Predicted Residual Stress State for Model 2
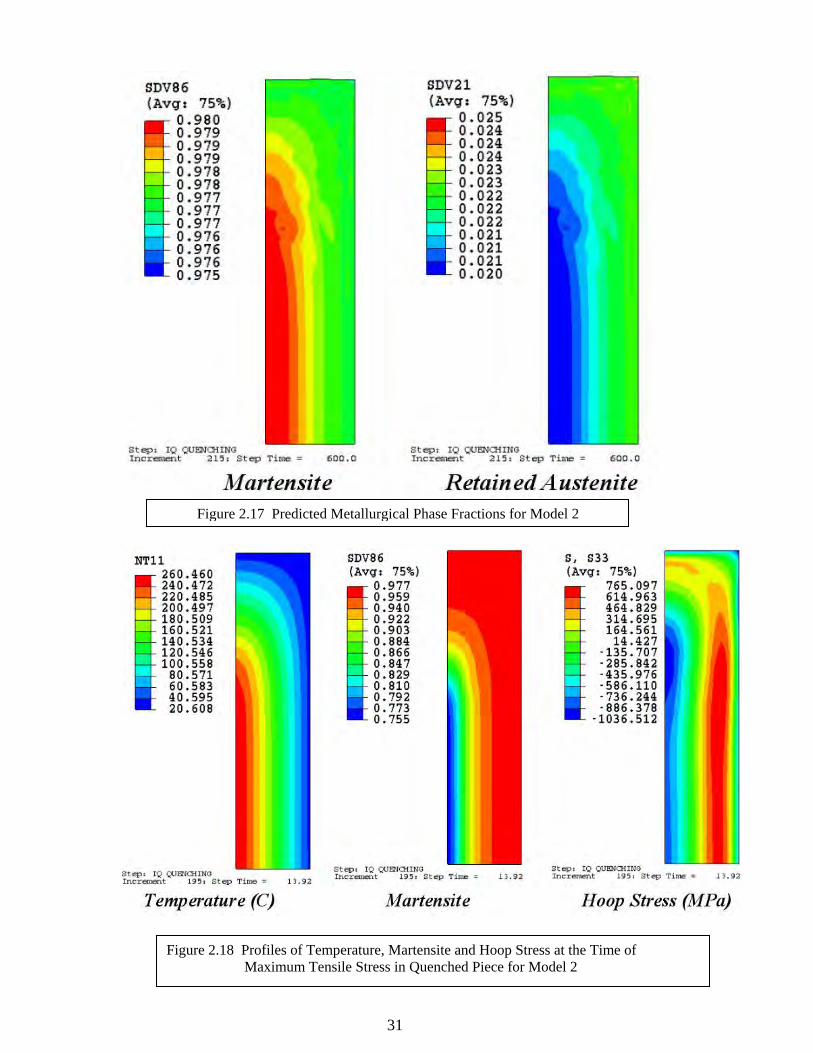
31
Figure 2.17 Predicted Metallurgical Phase Fractions for Model 2
Figure 2.18 Profiles of Temperature, Martensite and Hoop Stress at the Time of Maximum Tensile Stress in Quenched Piece for Model 2
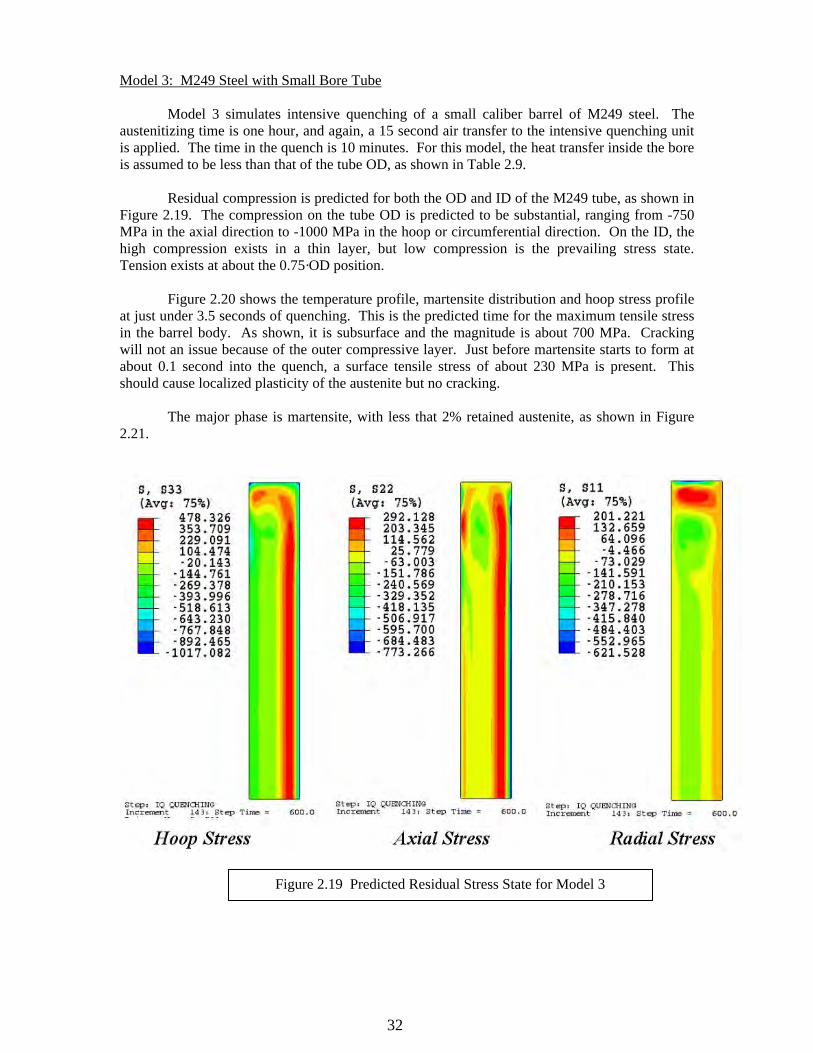
32
Model 3: M249 Steel with Small Bore Tube
Model 3 simulates intensive quenching of a small caliber barrel of M249 steel. The austenitizing time is one hour, and again, a 15 second air transfer to the intensive quenching unit is applied. The time in the quench is 10 minutes. For this model, the heat transfer inside the bore is assumed to be less than that of the tube OD, as shown in Table 2.9.
Residual compression is predicted for both the OD and ID of the M249 tube, as shown in Figure 2.19. The compression on the tube OD is predicted to be substantial, ranging from -750 MPa in the axial direction to -1000 MPa in the hoop or circumferential direction. On the ID, the high compression exists in a thin layer, but low compression is the prevailing stress state. Tension exists at about the 0.75·OD position.
Figure 2.20 shows the temperature profile, martensite distribution and hoop stress profile at just under 3.5 seconds of quenching. This is the predicted time for the maximum tensile stress in the barrel body. As shown, it is subsurface and the magnitude is about 700 MPa. Cracking will not an issue because of the outer compressive layer. Just before martensite starts to form at about 0.1 second into the quench, a surface tensile stress of about 230 MPa is present. This should cause localized plasticity of the austenite but no cracking.
The major phase is martensite, with less that 2% retained austenite, as shown in Figure 2.21.
Figure 2.19 Predicted Residual Stress State for Model 3
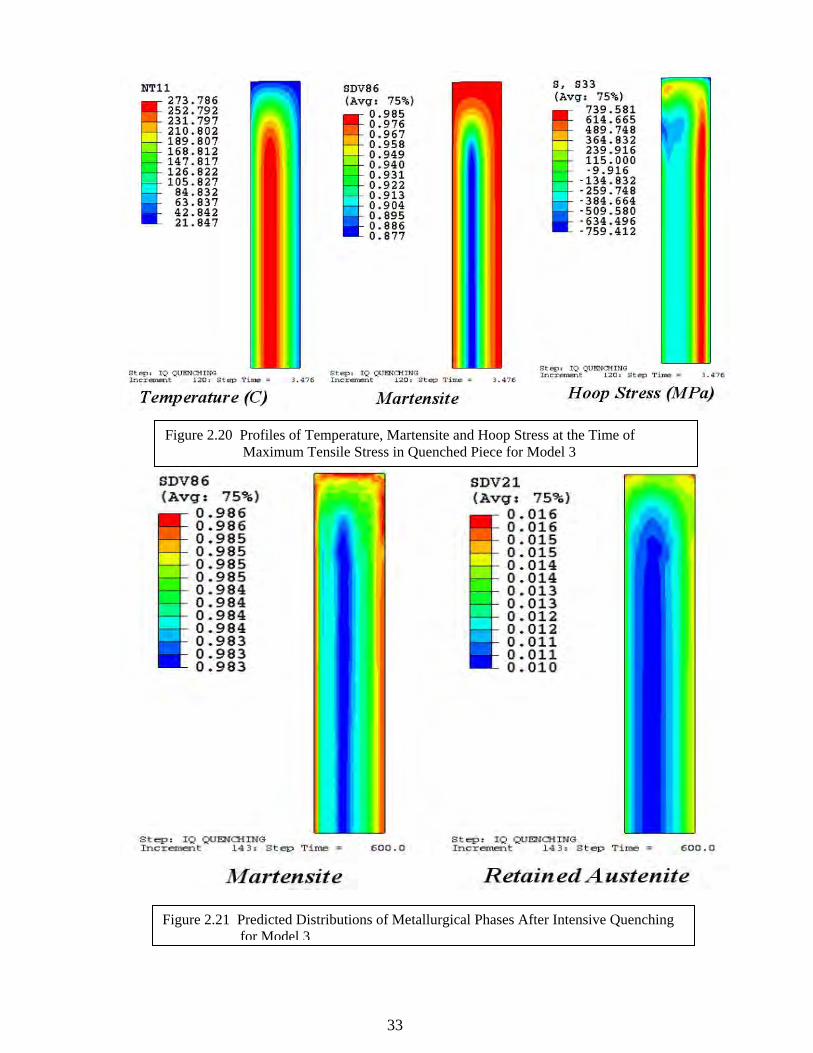
33
Figure 2.20 Profiles of Temperature, Martensite and Hoop Stress at the Time of Maximum Tensile Stress in Quenched Piece for Model 3
Figure 2.21 Predicted Distributions of Metallurgical Phases After Intensive Quenching for Model 3
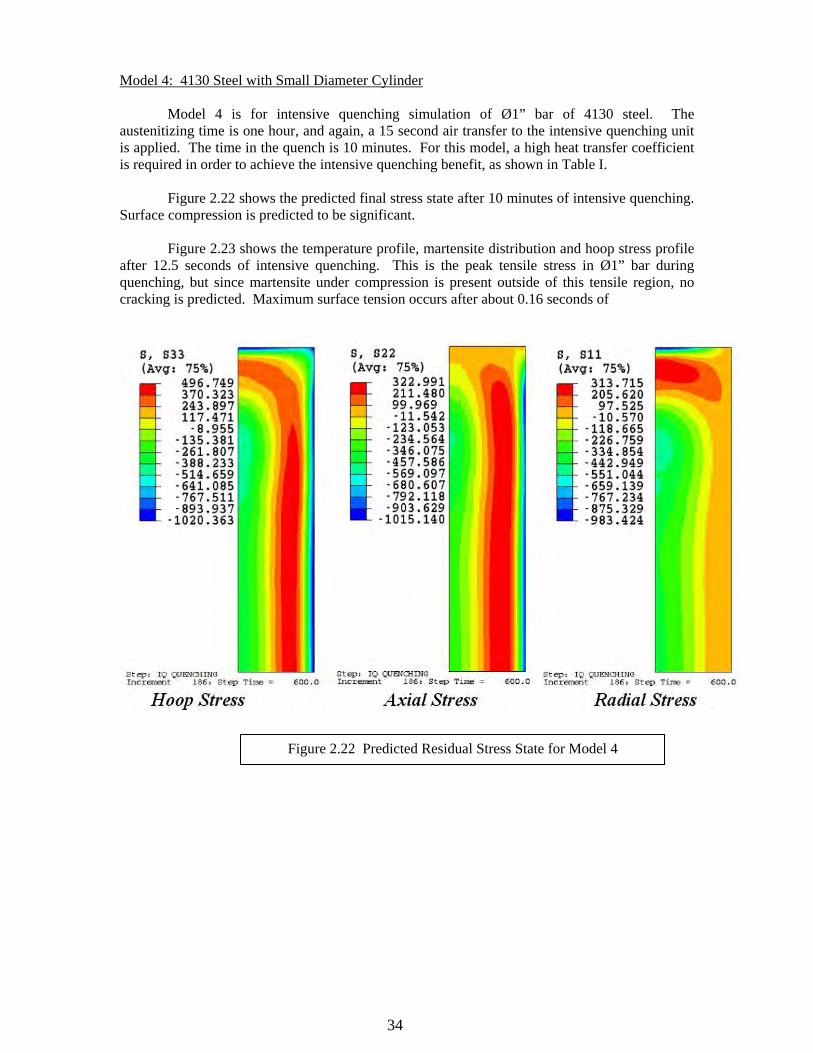
34
Model 4: 4130 Steel with Small Diameter Cylinder
Model 4 is for intensive quenching simulation of Ø1” bar of 4130 steel. The austenitizing time is one hour, and again, a 15 second air transfer to the intensive quenching unit is applied. The time in the quench is 10 minutes. For this model, a high heat transfer coefficient is required in order to achieve the intensive quenching benefit, as shown in Table I.
Figure 2.22 shows the predicted final stress state after 10 minutes of intensive quenching. Surface compression is predicted to be significant.
Figure 2.23 shows the temperature profile, martensite distribution and hoop stress profile after 12.5 seconds of intensive quenching. This is the peak tensile stress in Ø1” bar during quenching, but since martensite under compression is present outside of this tensile region, no cracking is predicted. Maximum surface tension occurs after about 0.16 seconds of
Figure 2.22 Predicted Residual Stress State for Model 4
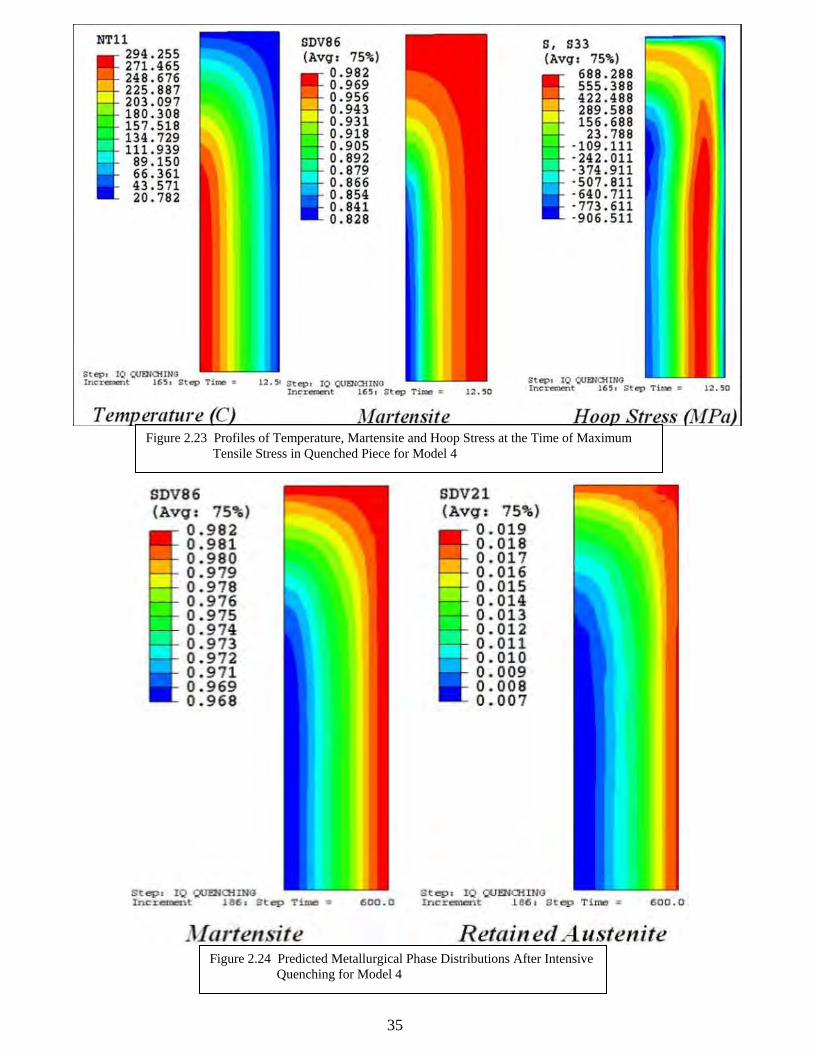
35
Figure 2.23 Profiles of Temperature, Martensite and Hoop Stress at the Time of Maximum Tensile Stress in Quenched Piece for Model 4
Figure 2.24 Predicted Metallurgical Phase Distributions After Intensive Quenching for Model 4
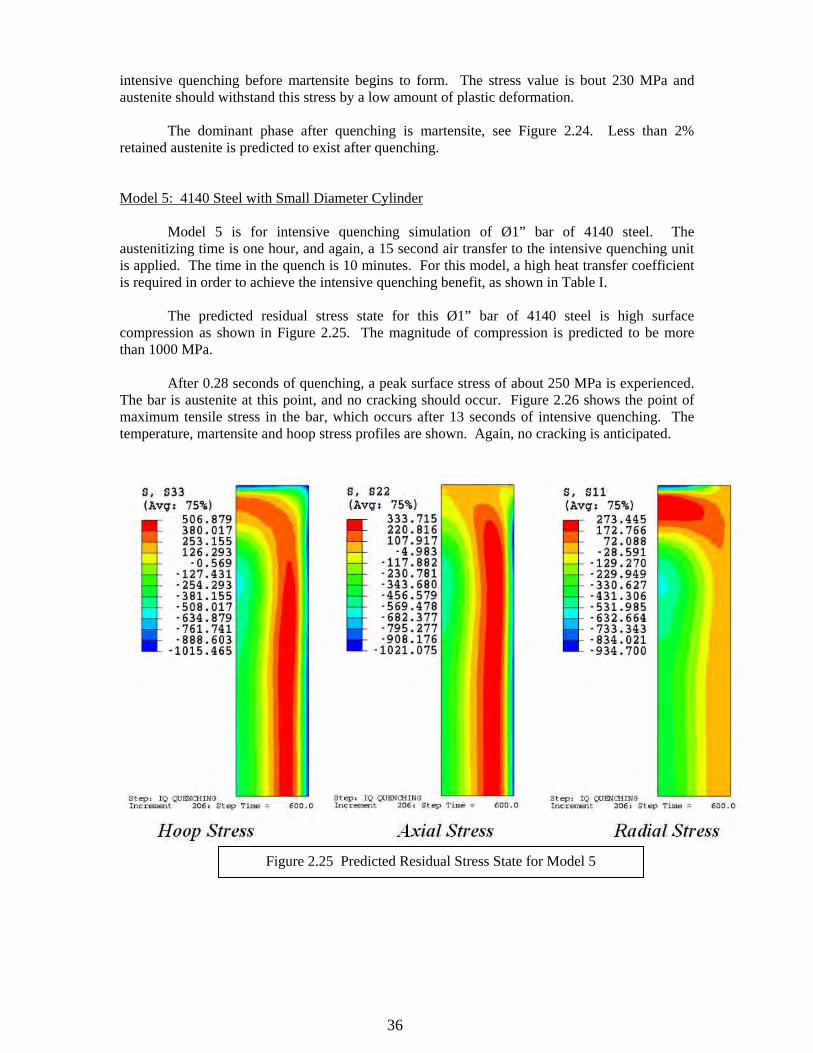
36
intensive quenching before martensite begins to form. The stress value is bout 230 MPa and austenite should withstand this stress by a low amount of plastic deformation.
The dominant phase after quenching is martensite, see Figure 2.24. Less than 2% retained austenite is predicted to exist after quenching. Model 5: 4140 Steel with Small Diameter Cylinder
Model 5 is for intensive quenching simulation of Ø1” bar of 4140 steel. The austenitizing time is one hour, and again, a 15 second air transfer to the intensive quenching unit is applied. The time in the quench is 10 minutes. For this model, a high heat transfer coefficient is required in order to achieve the intensive quenching benefit, as shown in Table I.
The predicted residual stress state for this Ø1” bar of 4140 steel is high surface compression as shown in Figure 2.25. The magnitude of compression is predicted to be more than 1000 MPa.
After 0.28 seconds of quenching, a peak surface stress of about 250 MPa is experienced. The bar is austenite at this point, and no cracking should occur. Figure 2.26 shows the point of maximum tensile stress in the bar, which occurs after 13 seconds of intensive quenching. The temperature, martensite and hoop stress profiles are shown. Again, no cracking is anticipated.
Figure 2.25 Predicted Residual Stress State for Model 5
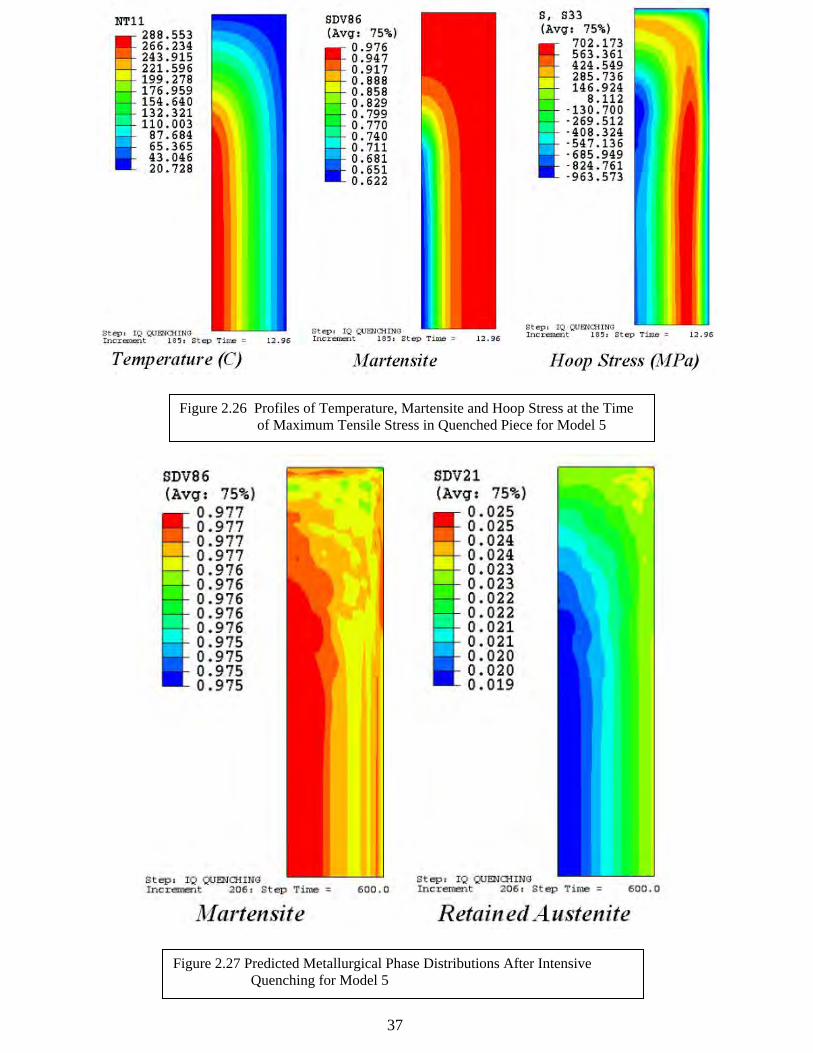
37
Figure 2.27 Predicted Metallurgical Phase Distributions After Intensive
Quenching for Model 5
Figure 2.26 Profiles of Temperature, Martensite and Hoop Stress at the Time of Maximum Tensile Stress in Quenched Piece for Model 5
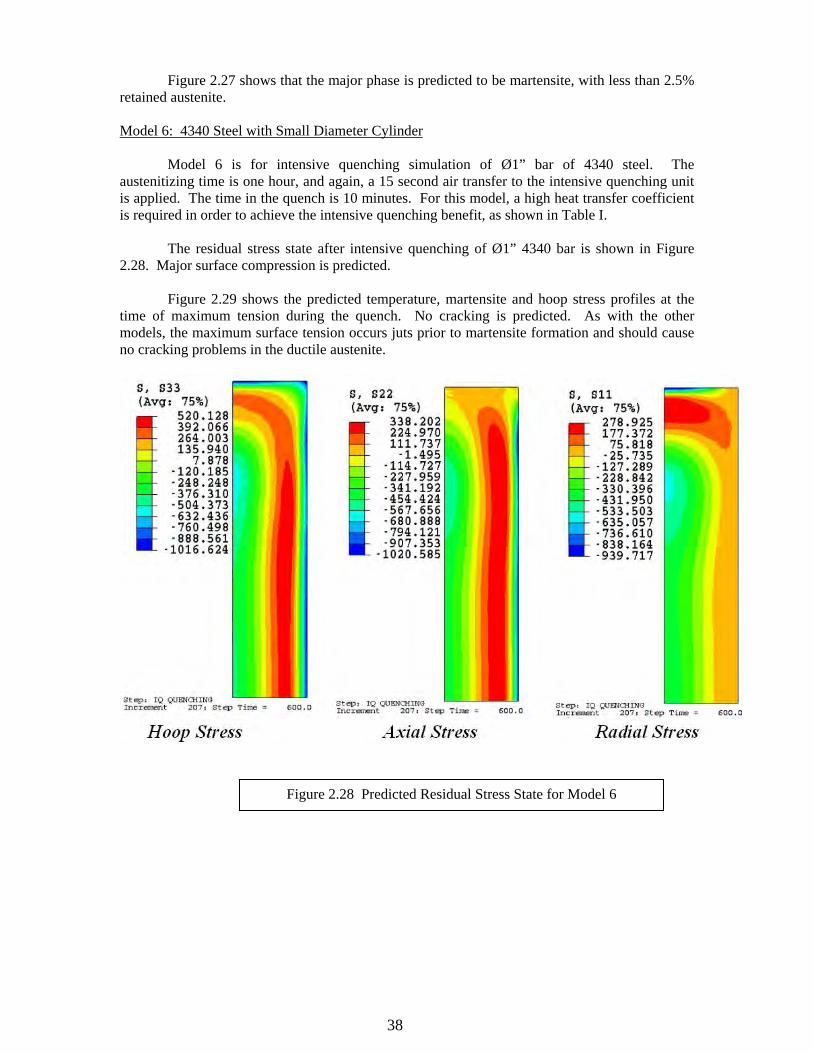
38
Figure 2.27 shows that the major phase is predicted to be martensite, with less than 2.5% retained austenite. Model 6: 4340 Steel with Small Diameter Cylinder
Model 6 is for intensive quenching simulation of Ø1” bar of 4340 steel. The austenitizing time is one hour, and again, a 15 second air transfer to the intensive quenching unit is applied. The time in the quench is 10 minutes. For this model, a high heat transfer coefficient is required in order to achieve the intensive quenching benefit, as shown in Table I.
The residual stress state after intensive quenching of Ø1” 4340 bar is shown in Figure 2.28. Major surface compression is predicted.
Figure 2.29 shows the predicted temperature, martensite and hoop stress profiles at the time of maximum tension during the quench. No cracking is predicted. As with the other models, the maximum surface tension occurs juts prior to martensite formation and should cause no cracking problems in the ductile austenite.
Figure 2.28 Predicted Residual Stress State for Model 6
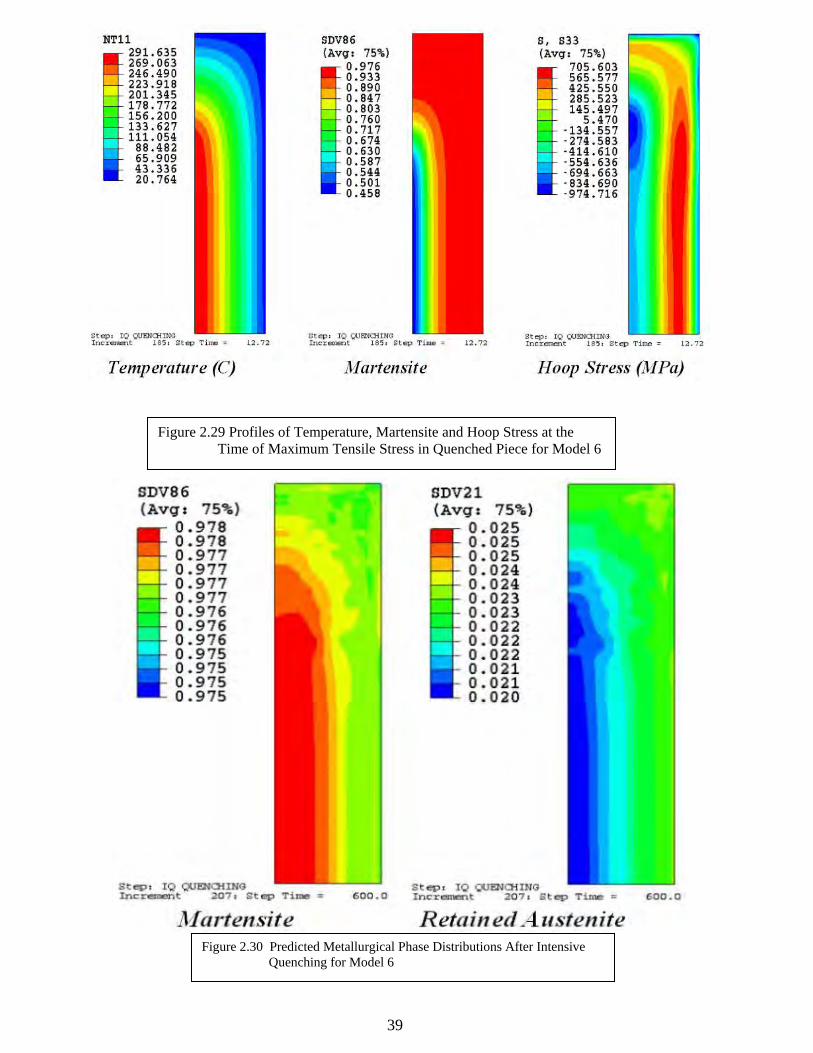
39
Figure 2.29 Profiles of Temperature, Martensite and Hoop Stress at the Time of Maximum Tensile Stress in Quenched Piece for Model 6
Figure 2.30 Predicted Metallurgical Phase Distributions After Intensive Quenching for Model 6
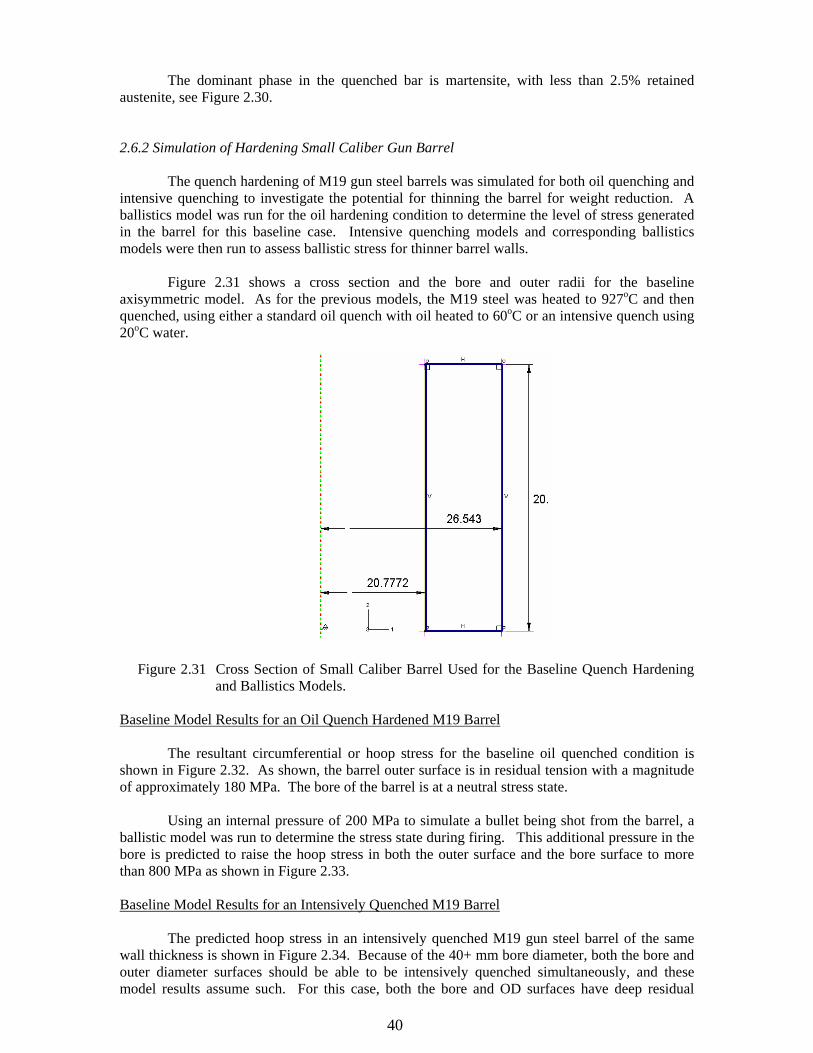
40
The dominant phase in the quenched bar is martensite, with less than 2.5% retained austenite, see Figure 2.30. 2.6.2 Simulation of Hardening Small Caliber Gun Barrel
The quench hardening of M19 gun steel barrels was simulated for both oil quenching and intensive quenching to investigate the potential for thinning the barrel for weight reduction. A ballistics model was run for the oil hardening condition to determine the level of stress generated in the barrel for this baseline case. Intensive quenching models and corresponding ballistics models were then run to assess ballistic stress for thinner barrel walls.
Figure 2.31 shows a cross section and the bore and outer radii for the baseline axisymmetric model. As for the previous models, the M19 steel was heated to 927oC and then quenched, using either a standard oil quench with oil heated to 60oC or an intensive quench using 20oC water.
Figure 2.31 Cross Section of Small Caliber Barrel Used for the Baseline Quench Hardening and Ballistics Models.
Baseline Model Results for an Oil Quench Hardened M19 Barrel
The resultant circumferential or hoop stress for the baseline oil quenched condition is shown in Figure 2.32. As shown, the barrel outer surface is in residual tension with a magnitude of approximately 180 MPa. The bore of the barrel is at a neutral stress state.
Using an internal pressure of 200 MPa to simulate a bullet being shot from the barrel, a ballistic model was run to determine the stress state during firing. This additional pressure in the bore is predicted to raise the hoop stress in both the outer surface and the bore surface to more than 800 MPa as shown in Figure 2.33. Baseline Model Results for an Intensively Quenched M19 Barrel
The predicted hoop stress in an intensively quenched M19 gun steel barrel of the same wall thickness is shown in Figure 2.34. Because of the 40+ mm bore diameter, both the bore and outer diameter surfaces should be able to be intensively quenched simultaneously, and these model results assume such. For this case, both the bore and OD surfaces have deep residual
41
compressive stresses, with values of nearly -700 MPa at the bore and -400 MPa at the OD surface.
The addition of an internal pressure of 200 MPa to simulate firing a round raises the surface stress level of the intensively quenched barrel, but only to levels of 150 to 200 MPa, as shown in Figure 2.35.
Figure 2.33 Hoop Stress Generated in Oil Quench Hardened Barrel for an Inner Barrel Pressure of 200 MPa.
Figure 2.32 Hoop Stress Predicted for the Baseline Oil Quench Hardened M19 Barrel.
42
In the case that intensive quenching involves only external surface quenching, with the bore cooling solely by conduction to the external surface, Figure 2.36 shows that the barrel hoop stress is predicted to be very compressive on the OD, i.e. -1000 MPa, but tensile on the bore
Figure 2.34 Predicted Hoop Stress for Intensively Quenched M19 Steel Barrel. Both ID and OD Surfaces are Quenched.
Figure 2.35 Hoop Stress with the Additional Pressure of 200 MPa Applied on the Bore Surface for the Intensively Quenched M19 Steel Barrel.
43
surface, i.e. 200 MPa. When a bore pressure of 200 MPa is added in this case, the bore stress is predicted to rise to a tensile stress of 900 MPa, but the OD remains in hoop compression at about -350 MPa.
Comparisons of hoop stress through the barrel thickness for the as-quenched condition and the quenched plus bore pressurized conditions are shown in Figure 2.38 and 2.39,
Figure 2.36 Predicted Hoop Stress for and M19 Steel Barrel Intensively Quenched Only on the OD Surface.
Figure 2.37 Hoop Stress with the Additional Pressure of 200 MPa Applied on the Bore Surface for the M19 Steel Barrel Intensively Quenched Only on the OD Surface.
44
Figure 2.38 Predicted Hoop Stress Distribution from Bore to OD for the Oil Quenched and Intensively Quenched Conditions for the M19 Barrels.
BORE OD
respectively. In these figures, the curve labeled “IQ Quench” involves quenching of both the bore and OD surfaces, while the curve labeled “IQ2 Quench” involves quenching only the OD surface. From Figure 2.38 which is for the as- heat treated condition, it is clear that intensive quenching puts the surfaces that are quenched in compression while conventional oil quenching leaves the barrel in a nearly neutral stress state with low tension at the OD surface.
In Figure 2.39 which shows the addition of a 200 MPa ballistic pressure in the bore, The entire cross section of the oil quenched barrel is at high tension. In the case of intensively quenching both the bore and OD surfaces of the barrel, low surface tension is predicted to exist. If only the OD surface is intensively quenched, the OD surface is predicted to remain in relatively deep compression even though the barrel bore and interior sections will endure hoop tension.
BORE OD
Figure 2.39 Hoop Stress Distribution for the Bore Pressurized Condition for the Oil Quenched or Intensively Quenched M19 Barrels.
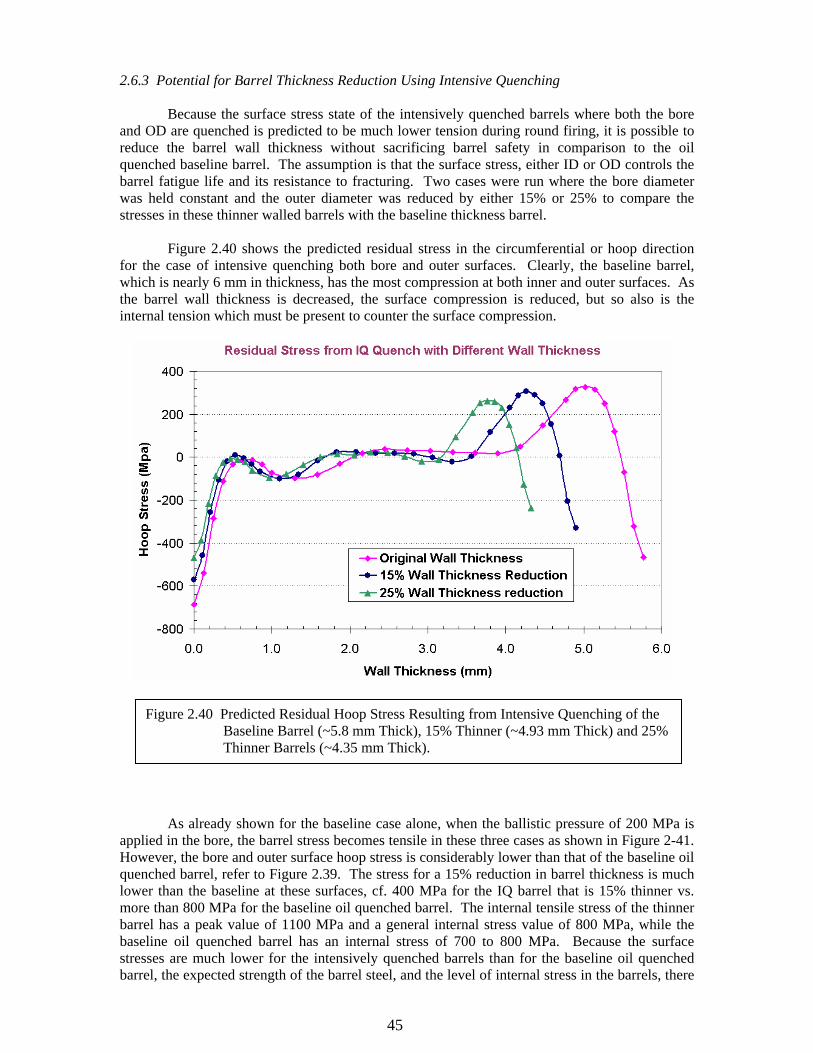
45
2.6.3 Potential for Barrel Thickness Reduction Using Intensive Quenching
Because the surface stress state of the intensively quenched barrels where both the bore and OD are quenched is predicted to be much lower tension during round firing, it is possible to reduce the barrel wall thickness without sacrificing barrel safety in comparison to the oil quenched baseline barrel. The assumption is that the surface stress, either ID or OD controls the barrel fatigue life and its resistance to fracturing. Two cases were run where the bore diameter was held constant and the outer diameter was reduced by either 15% or 25% to compare the stresses in these thinner walled barrels with the baseline thickness barrel.
Figure 2.40 shows the predicted residual stress in the circumferential or hoop direction for the case of intensive quenching both bore and outer surfaces. Clearly, the baseline barrel, which is nearly 6 mm in thickness, has the most compression at both inner and outer surfaces. As the barrel wall thickness is decreased, the surface compression is reduced, but so also is the internal tension which must be present to counter the surface compression.
As already shown for the baseline case alone, when the ballistic pressure of 200 MPa is applied in the bore, the barrel stress becomes tensile in these three cases as shown in Figure 2-41. However, the bore and outer surface hoop stress is considerably lower than that of the baseline oil quenched barrel, refer to Figure 2.39. The stress for a 15% reduction in barrel thickness is much lower than the baseline at these surfaces, cf. 400 MPa for the IQ barrel that is 15% thinner vs. more than 800 MPa for the baseline oil quenched barrel. The internal tensile stress of the thinner barrel has a peak value of 1100 MPa and a general internal stress value of 800 MPa, while the baseline oil quenched barrel has an internal stress of 700 to 800 MPa. Because the surface stresses are much lower for the intensively quenched barrels than for the baseline oil quenched barrel, the expected strength of the barrel steel, and the level of internal stress in the barrels, there
Figure 2.40 Predicted Residual Hoop Stress Resulting from Intensive Quenching of the Baseline Barrel (~5.8 mm Thick), 15% Thinner (~4.93 mm Thick) and 25% Thinner Barrels (~4.35 mm Thick).
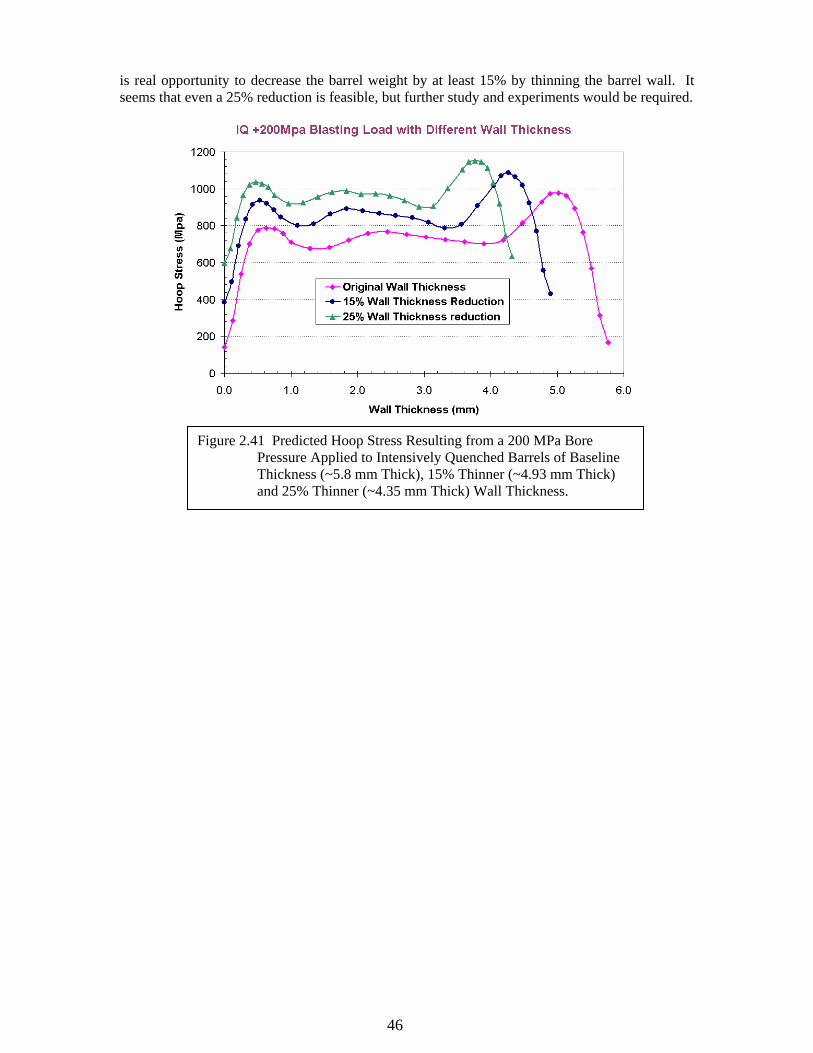
46
is real opportunity to decrease the barrel weight by at least 15% by thinning the barrel wall. It seems that even a 25% reduction is feasible, but further study and experiments would be required.
Figure 2.41 Predicted Hoop Stress Resulting from a 200 MPa Bore Pressure Applied to Intensively Quenched Barrels of Baseline Thickness (~5.8 mm Thick), 15% Thinner (~4.93 mm Thick) and 25% Thinner (~4.35 mm Thick) Wall Thickness.
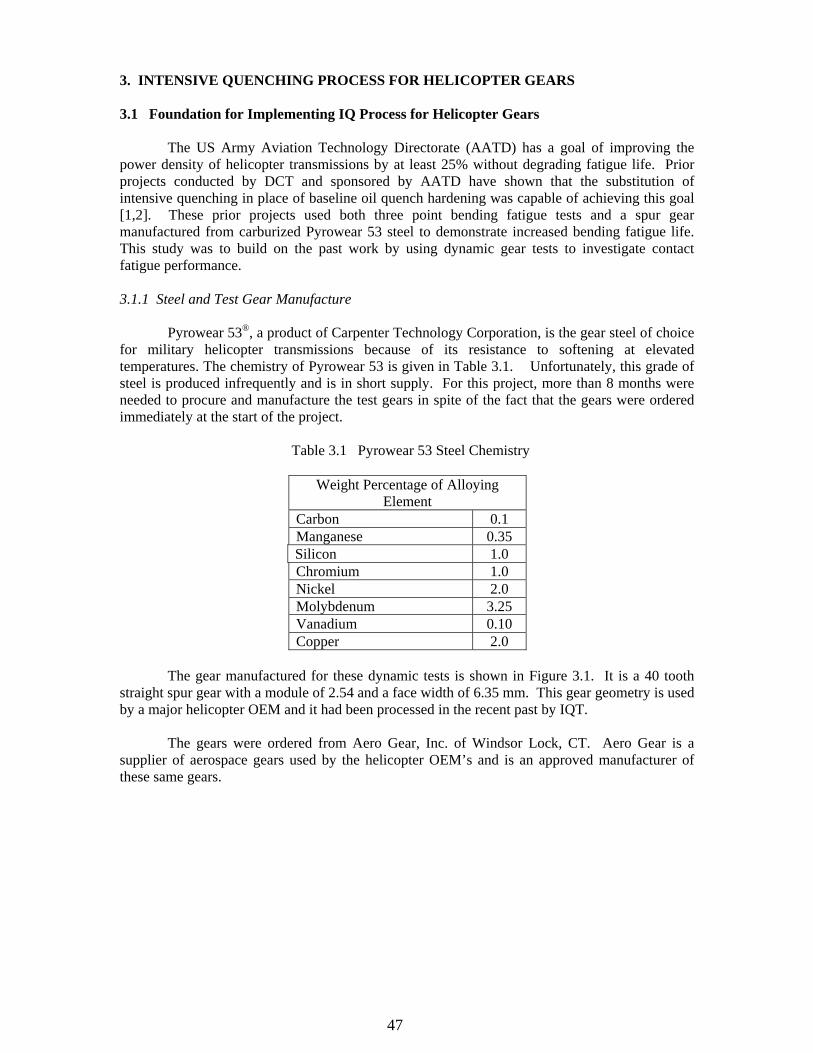
47
3. INTENSIVE QUENCHING PROCESS FOR HELICOPTER GEARS 3.1 Foundation for Implementing IQ Process for Helicopter Gears
The US Army Aviation Technology Directorate (AATD) has a goal of improving the power density of helicopter transmissions by at least 25% without degrading fatigue life. Prior projects conducted by DCT and sponsored by AATD have shown that the substitution of intensive quenching in place of baseline oil quench hardening was capable of achieving this goal [1,2]. These prior projects used both three point bending fatigue tests and a spur gear manufactured from carburized Pyrowear 53 steel to demonstrate increased bending fatigue life. This study was to build on the past work by using dynamic gear tests to investigate contact fatigue performance. 3.1.1 Steel and Test Gear Manufacture
Pyrowear 53®, a product of Carpenter Technology Corporation, is the gear steel of choice for military helicopter transmissions because of its resistance to softening at elevated temperatures. The chemistry of Pyrowear 53 is given in Table 3.1. Unfortunately, this grade of steel is produced infrequently and is in short supply. For this project, more than 8 months were needed to procure and manufacture the test gears in spite of the fact that the gears were ordered immediately at the start of the project. Table 3.1 Pyrowear 53 Steel Chemistry
Weight Percentage of Alloying Element
Carbon 0.1 Manganese 0.35 Silicon 1.0 Chromium 1.0 Nickel 2.0 Molybdenum 3.25 Vanadium 0.10 Copper 2.0
The gear manufactured for these dynamic tests is shown in Figure 3.1. It is a 40 tooth
straight spur gear with a module of 2.54 and a face width of 6.35 mm. This gear geometry is used by a major helicopter OEM and it had been processed in the recent past by IQT.
The gears were ordered from Aero Gear, Inc. of Windsor Lock, CT. Aero Gear is a supplier of aerospace gears used by the helicopter OEM’s and is an approved manufacturer of these same gears.
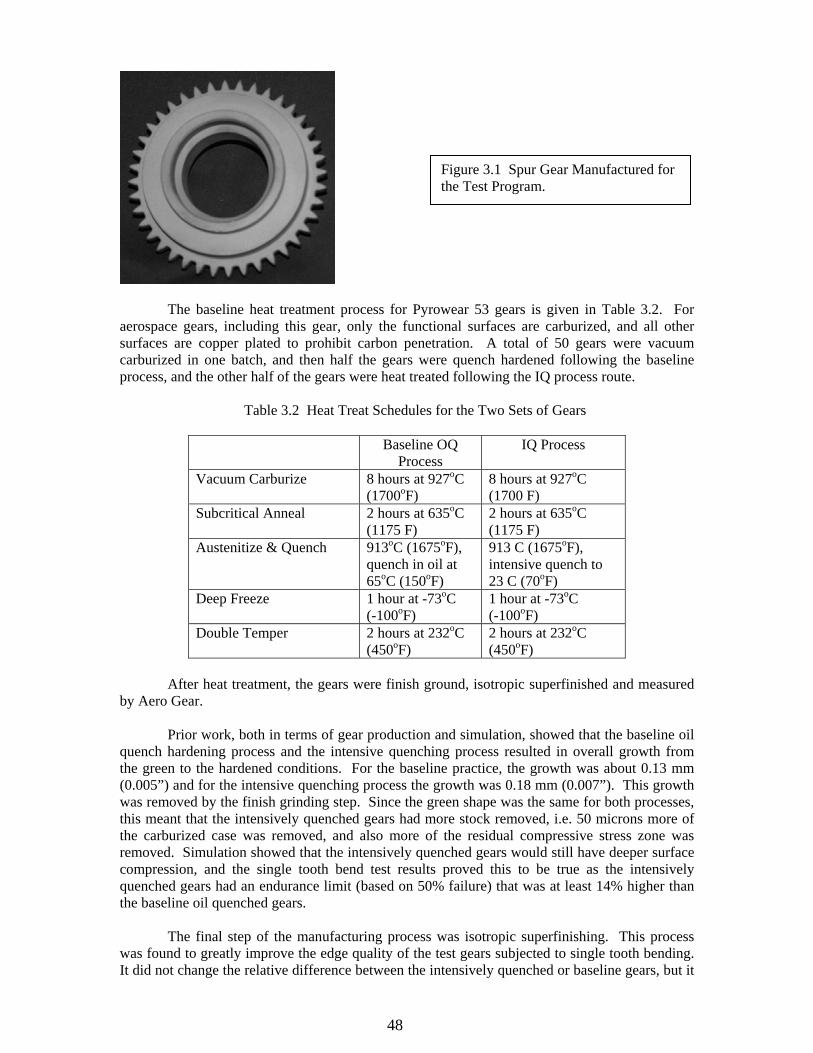
48
The baseline heat treatment process for Pyrowear 53 gears is given in Table 3.2. For aerospace gears, including this gear, only the functional surfaces are carburized, and all other surfaces are copper plated to prohibit carbon penetration. A total of 50 gears were vacuum carburized in one batch, and then half the gears were quench hardened following the baseline process, and the other half of the gears were heat treated following the IQ process route. Table 3.2 Heat Treat Schedules for the Two Sets of Gears
Baseline OQ Process
IQ Process
Vacuum Carburize 8 hours at 927oC (1700oF)
8 hours at 927oC (1700 F)
Subcritical Anneal 2 hours at 635oC (1175 F)
2 hours at 635oC (1175 F)
Austenitize & Quench 913oC (1675oF), quench in oil at 65oC (150oF)
913 C (1675oF), intensive quench to 23 C (70oF)
Deep Freeze 1 hour at -73oC (-100oF)
1 hour at -73oC (-100oF)
Double Temper 2 hours at 232oC (450oF)
2 hours at 232oC (450oF)
After heat treatment, the gears were finish ground, isotropic superfinished and measured
by Aero Gear.
Prior work, both in terms of gear production and simulation, showed that the baseline oil quench hardening process and the intensive quenching process resulted in overall growth from the green to the hardened conditions. For the baseline practice, the growth was about 0.13 mm (0.005”) and for the intensive quenching process the growth was 0.18 mm (0.007”). This growth was removed by the finish grinding step. Since the green shape was the same for both processes, this meant that the intensively quenched gears had more stock removed, i.e. 50 microns more of the carburized case was removed, and also more of the residual compressive stress zone was removed. Simulation showed that the intensively quenched gears would still have deeper surface compression, and the single tooth bend test results proved this to be true as the intensively quenched gears had an endurance limit (based on 50% failure) that was at least 14% higher than the baseline oil quenched gears.
The final step of the manufacturing process was isotropic superfinishing. This process
was found to greatly improve the edge quality of the test gears subjected to single tooth bending. It did not change the relative difference between the intensively quenched or baseline gears, but it
Figure 3.1 Spur Gear Manufactured for the Test Program.
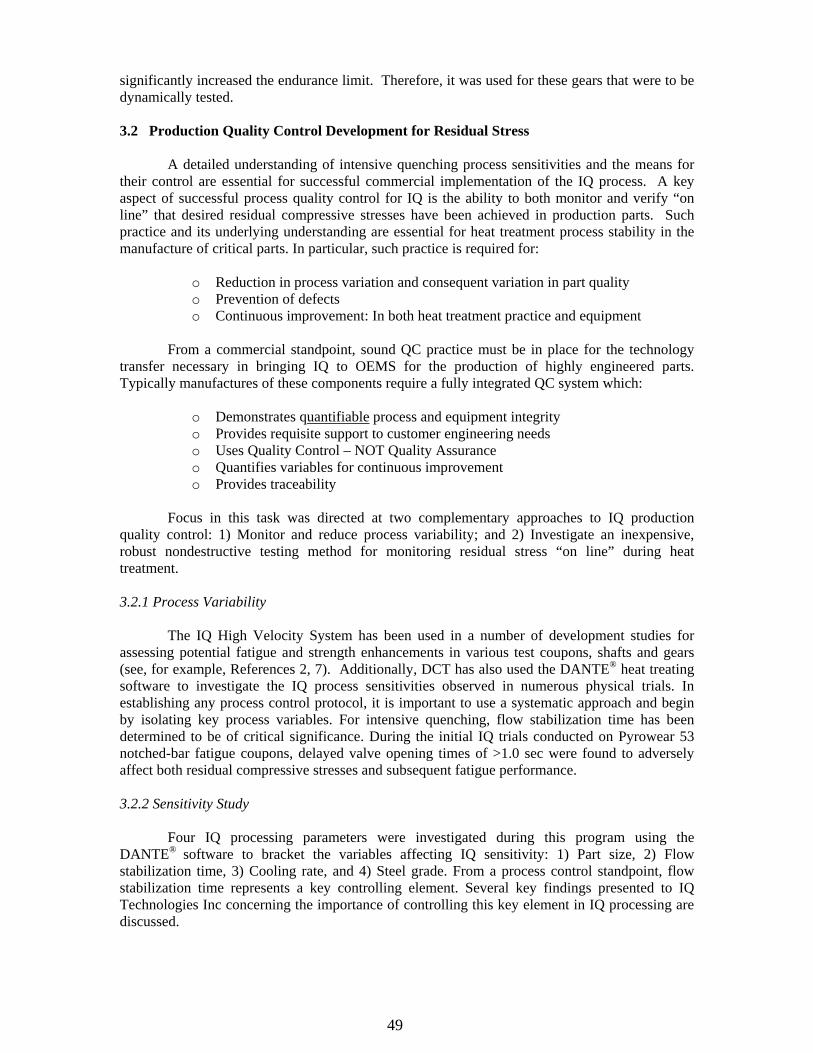
49
significantly increased the endurance limit. Therefore, it was used for these gears that were to be dynamically tested. 3.2 Production Quality Control Development for Residual Stress
A detailed understanding of intensive quenching process sensitivities and the means for their control are essential for successful commercial implementation of the IQ process. A key aspect of successful process quality control for IQ is the ability to both monitor and verify “on line” that desired residual compressive stresses have been achieved in production parts. Such practice and its underlying understanding are essential for heat treatment process stability in the manufacture of critical parts. In particular, such practice is required for:
o Reduction in process variation and consequent variation in part quality o Prevention of defects o Continuous improvement: In both heat treatment practice and equipment
From a commercial standpoint, sound QC practice must be in place for the technology
transfer necessary in bringing IQ to OEMS for the production of highly engineered parts. Typically manufactures of these components require a fully integrated QC system which:
o Demonstrates quantifiable process and equipment integrity o Provides requisite support to customer engineering needs o Uses Quality Control – NOT Quality Assurance o Quantifies variables for continuous improvement o Provides traceability
Focus in this task was directed at two complementary approaches to IQ production
quality control: 1) Monitor and reduce process variability; and 2) Investigate an inexpensive, robust nondestructive testing method for monitoring residual stress “on line” during heat treatment. 3.2.1 Process Variability
The IQ High Velocity System has been used in a number of development studies for assessing potential fatigue and strength enhancements in various test coupons, shafts and gears (see, for example, References 2, 7). Additionally, DCT has also used the DANTE® heat treating software to investigate the IQ process sensitivities observed in numerous physical trials. In establishing any process control protocol, it is important to use a systematic approach and begin by isolating key process variables. For intensive quenching, flow stabilization time has been determined to be of critical significance. During the initial IQ trials conducted on Pyrowear 53 notched-bar fatigue coupons, delayed valve opening times of >1.0 sec were found to adversely affect both residual compressive stresses and subsequent fatigue performance. 3.2.2 Sensitivity Study
Four IQ processing parameters were investigated during this program using the DANTE® software to bracket the variables affecting IQ sensitivity: 1) Part size, 2) Flow stabilization time, 3) Cooling rate, and 4) Steel grade. From a process control standpoint, flow stabilization time represents a key controlling element. Several key findings presented to IQ Technologies Inc concerning the importance of controlling this key element in IQ processing are discussed.
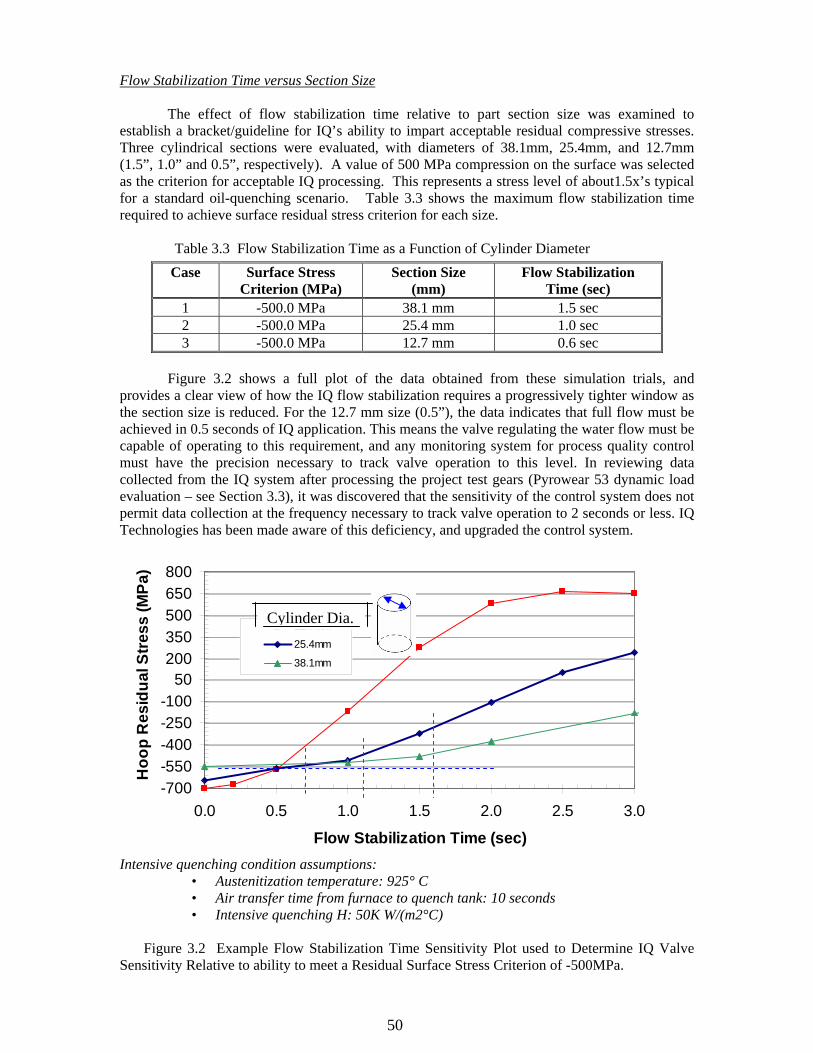
50
Flow Stabilization Time versus Section Size
The effect of flow stabilization time relative to part section size was examined to establish a bracket/guideline for IQ’s ability to impart acceptable residual compressive stresses. Three cylindrical sections were evaluated, with diameters of 38.1mm, 25.4mm, and 12.7mm (1.5”, 1.0” and 0.5”, respectively). A value of 500 MPa compression on the surface was selected as the criterion for acceptable IQ processing. This represents a stress level of about1.5x’s typical for a standard oil-quenching scenario. Table 3.3 shows the maximum flow stabilization time required to achieve surface residual stress criterion for each size. Table 3.3 Flow Stabilization Time as a Function of Cylinder Diameter
Figure 3.2 shows a full plot of the data obtained from these simulation trials, and
provides a clear view of how the IQ flow stabilization requires a progressively tighter window as the section size is reduced. For the 12.7 mm size (0.5”), the data indicates that full flow must be achieved in 0.5 seconds of IQ application. This means the valve regulating the water flow must be capable of operating to this requirement, and any monitoring system for process quality control must have the precision necessary to track valve operation to this level. In reviewing data collected from the IQ system after processing the project test gears (Pyrowear 53 dynamic load evaluation – see Section 3.3), it was discovered that the sensitivity of the control system does not permit data collection at the frequency necessary to track valve operation to 2 seconds or less. IQ Technologies has been made aware of this deficiency, and upgraded the control system.
-700-550-400-250-100
50200350500650800
0.0 0.5 1.0 1.5 2.0 2.5 3.0
Flow Stabilization Time (sec)
Hoo
p R
esid
ual S
tress
(MPa
)
12.7mm25.4mm
38.1mm
Intensive quenching condition assumptions:
• Austenitization temperature: 925° C • Air transfer time from furnace to quench tank: 10 seconds • Intensive quenching H: 50K W/(m2°C)
Figure 3.2 Example Flow Stabilization Time Sensitivity Plot used to Determine IQ Valve
Sensitivity Relative to ability to meet a Residual Surface Stress Criterion of -500MPa.
Case Surface Stress Criterion (MPa)
Section Size (mm)
Flow Stabilization Time (sec)
1 -500.0 MPa 38.1 mm 1.5 sec 2 -500.0 MPa 25.4 mm 1.0 sec 3 -500.0 MPa 12.7 mm 0.6 sec
Cylinder Dia.
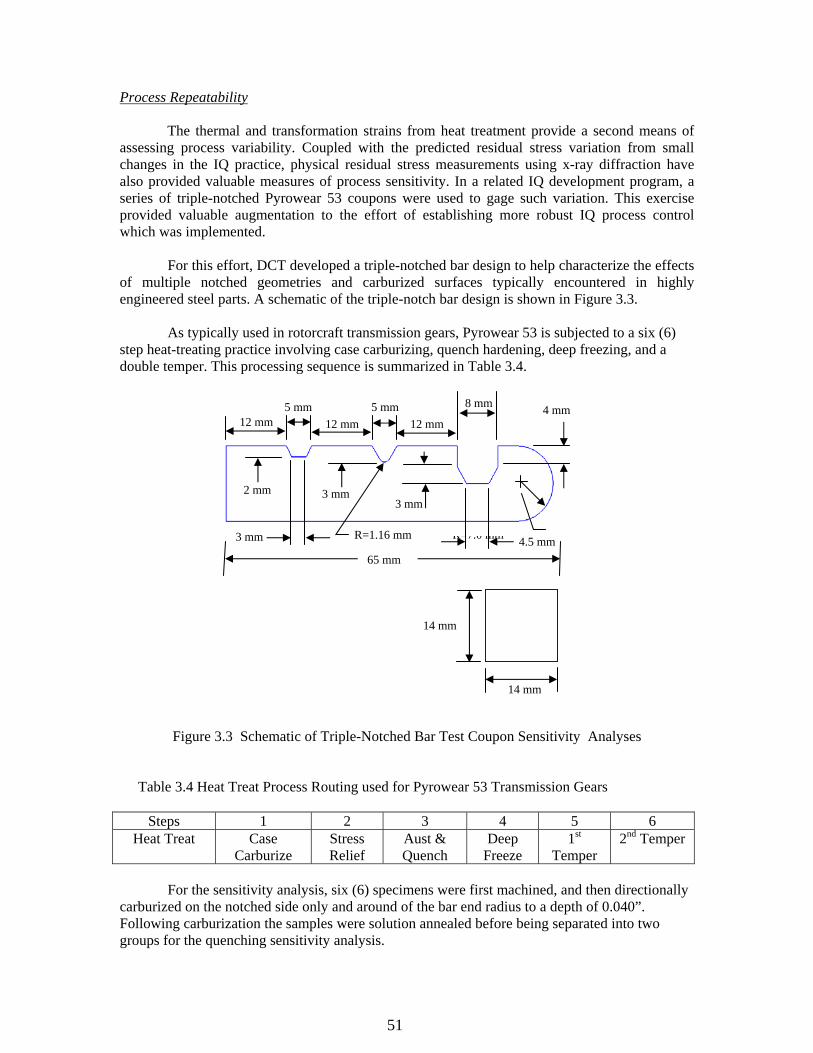
51
Process Repeatability The thermal and transformation strains from heat treatment provide a second means of assessing process variability. Coupled with the predicted residual stress variation from small changes in the IQ practice, physical residual stress measurements using x-ray diffraction have also provided valuable measures of process sensitivity. In a related IQ development program, a series of triple-notched Pyrowear 53 coupons were used to gage such variation. This exercise provided valuable augmentation to the effort of establishing more robust IQ process control which was implemented.
For this effort, DCT developed a triple-notched bar design to help characterize the effects of multiple notched geometries and carburized surfaces typically encountered in highly engineered steel parts. A schematic of the triple-notch bar design is shown in Figure 3.3.
As typically used in rotorcraft transmission gears, Pyrowear 53 is subjected to a six (6) step heat-treating practice involving case carburizing, quench hardening, deep freezing, and a double temper. This processing sequence is summarized in Table 3.4.
Figure 3.3 Schematic of Triple-Notched Bar Test Coupon Sensitivity Analyses Table 3.4 Heat Treat Process Routing used for Pyrowear 53 Transmission Gears
Steps 1 2 3 4 5 6 Heat Treat Case
Carburize Stress Relief
Aust & Quench
Deep Freeze
1st Temper
2nd Temper
For the sensitivity analysis, six (6) specimens were first machined, and then directionally
carburized on the notched side only and around of the bar end radius to a depth of 0.040”. Following carburization the samples were solution annealed before being separated into two groups for the quenching sensitivity analysis.
R=7.0 mm
14 mm
14 mm
65 mm 4.5 mm R=1.16 mm 3 mm
2 mm
12 mm 12 mm 12 mm
3 mm
8 mm 4 mm
3 mm
5 mm 5 mm
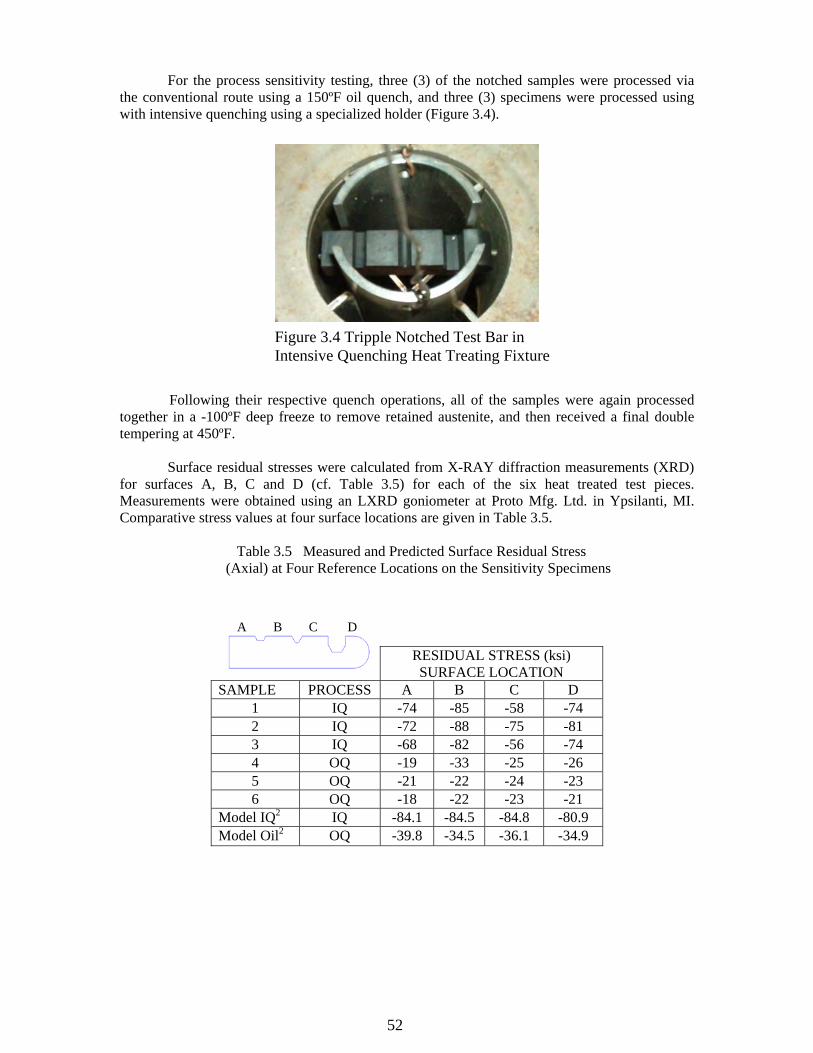
52
For the process sensitivity testing, three (3) of the notched samples were processed via the conventional route using a 150ºF oil quench, and three (3) specimens were processed using with intensive quenching using a specialized holder (Figure 3.4). Following their respective quench operations, all of the samples were again processed together in a -100ºF deep freeze to remove retained austenite, and then received a final double tempering at 450ºF.
Surface residual stresses were calculated from X-RAY diffraction measurements (XRD) for surfaces A, B, C and D (cf. Table 3.5) for each of the six heat treated test pieces. Measurements were obtained using an LXRD goniometer at Proto Mfg. Ltd. in Ypsilanti, MI. Comparative stress values at four surface locations are given in Table 3.5. Table 3.5 Measured and Predicted Surface Residual Stress (Axial) at Four Reference Locations on the Sensitivity Specimens
RESIDUAL STRESS (ksi) SURFACE LOCATION
SAMPLE PROCESS A B C D 1 IQ -74 -85 -58 -74 2 IQ -72 -88 -75 -81 3 IQ -68 -82 -56 -74 4 OQ -19 -33 -25 -26 5 OQ -21 -22 -24 -23 6 OQ -18 -22 -23 -21
Model IQ2 IQ -84.1 -84.5 -84.8 -80.9 Model Oil2 OQ -39.8 -34.5 -36.1 -34.9
A B C D
Figure 3.4 Tripple Notched Test Bar in Intensive Quenching Heat Treating Fixture
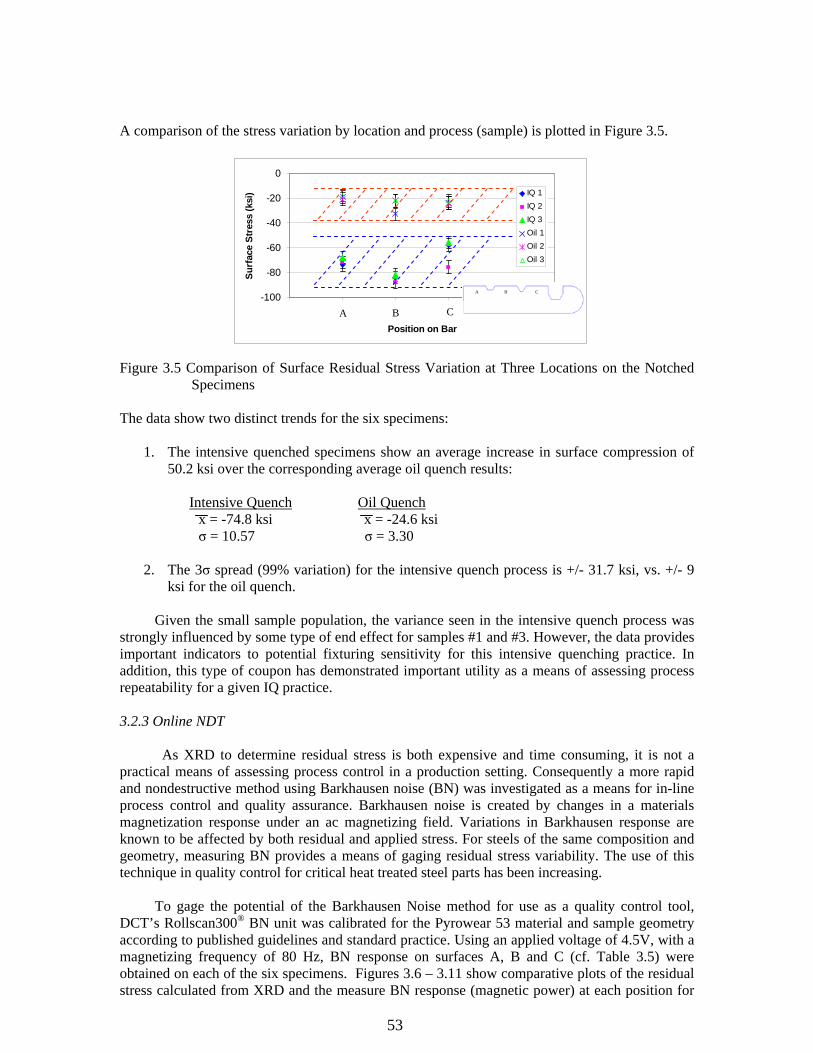
53
A comparison of the stress variation by location and process (sample) is plotted in Figure 3.5.
Figure 3.5 Comparison of Surface Residual Stress Variation at Three Locations on the Notched
Specimens The data show two distinct trends for the six specimens:
1. The intensive quenched specimens show an average increase in surface compression of 50.2 ksi over the corresponding average oil quench results:
Intensive Quench Oil Quench x = -74.8 ksi x = -24.6 ksi σ = 10.57 σ = 3.30 2. The 3σ spread (99% variation) for the intensive quench process is +/- 31.7 ksi, vs. +/- 9
ksi for the oil quench. Given the small sample population, the variance seen in the intensive quench process was strongly influenced by some type of end effect for samples #1 and #3. However, the data provides important indicators to potential fixturing sensitivity for this intensive quenching practice. In addition, this type of coupon has demonstrated important utility as a means of assessing process repeatability for a given IQ practice. 3.2.3 Online NDT As XRD to determine residual stress is both expensive and time consuming, it is not a practical means of assessing process control in a production setting. Consequently a more rapid and nondestructive method using Barkhausen noise (BN) was investigated as a means for in-line process control and quality assurance. Barkhausen noise is created by changes in a materials magnetization response under an ac magnetizing field. Variations in Barkhausen response are known to be affected by both residual and applied stress. For steels of the same composition and geometry, measuring BN provides a means of gaging residual stress variability. The use of this technique in quality control for critical heat treated steel parts has been increasing. To gage the potential of the Barkhausen Noise method for use as a quality control tool, DCT’s Rollscan300® BN unit was calibrated for the Pyrowear 53 material and sample geometry according to published guidelines and standard practice. Using an applied voltage of 4.5V, with a magnetizing frequency of 80 Hz, BN response on surfaces A, B and C (cf. Table 3.5) were obtained on each of the six specimens. Figures 3.6 – 3.11 show comparative plots of the residual stress calculated from XRD and the measure BN response (magnetic power) at each position for
-100
-80
-60
-40
-20
0
0 1 2 3 4 5
Position on Bar
Surf
ace
Stre
ss (k
si) IQ 1
IQ 2IQ 3Oil 1Oil 2Oil 3
1 2 3 A B C
A B C
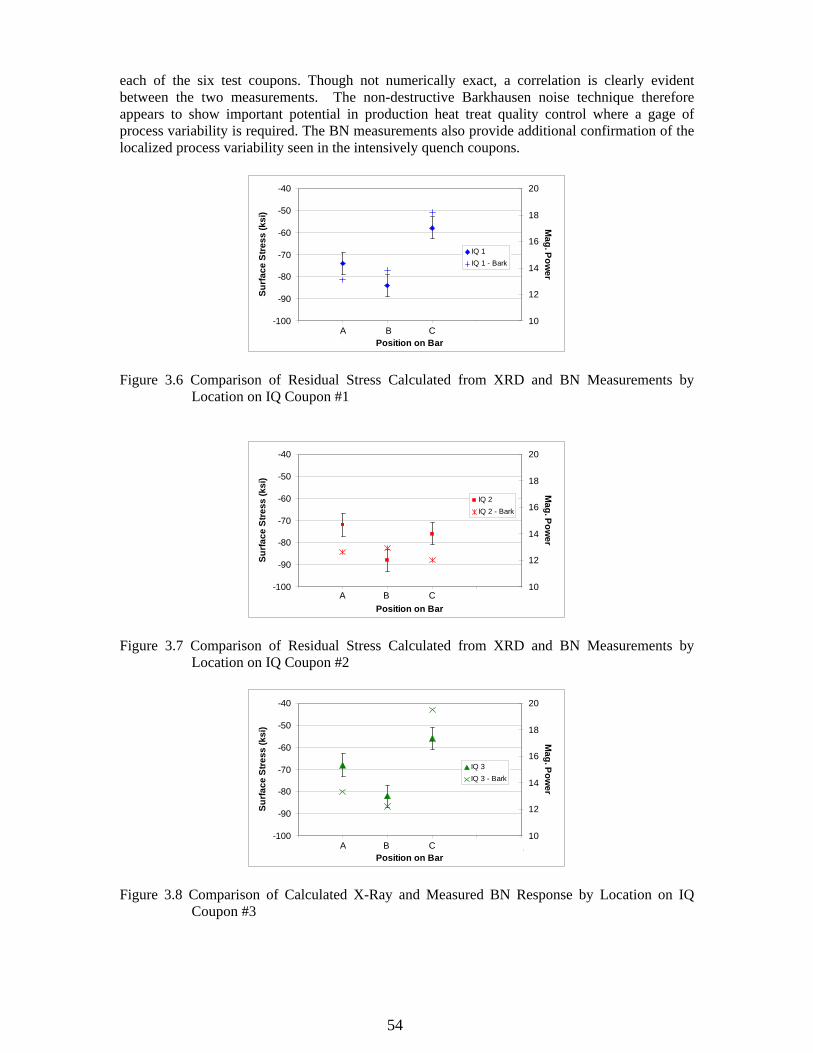
54
each of the six test coupons. Though not numerically exact, a correlation is clearly evident between the two measurements. The non-destructive Barkhausen noise technique therefore appears to show important potential in production heat treat quality control where a gage of process variability is required. The BN measurements also provide additional confirmation of the localized process variability seen in the intensively quench coupons.
-100
-90
-80
-70
-60
-50
-40
0 1 2 3 4 5Position on Bar
Surfa
ce S
tress
(ksi
)
10
12
14
16
18
20
Mag. Pow
erIQ 1IQ 1 - Bark
A B C
Figure 3.6 Comparison of Residual Stress Calculated from XRD and BN Measurements by
Location on IQ Coupon #1
-100
-90
-80
-70
-60
-50
-40
0 1 2 3 4 5Position on Bar
Surfa
ce S
tress
(ksi
)
10
12
14
16
18
20
Mag. Pow
er
IQ 2IQ 2 - Bark
A B C
Figure 3.7 Comparison of Residual Stress Calculated from XRD and BN Measurements by
Location on IQ Coupon #2
-100
-90
-80
-70
-60
-50
-40
0 1 2 3 4 5Position on Bar
Surfa
ce S
tress
(ksi
)
10
12
14
16
18
20
Mag. Pow
er
IQ 3IQ 3 - Bark
A B C
Figure 3.8 Comparison of Calculated X-Ray and Measured BN Response by Location on IQ
Coupon #3
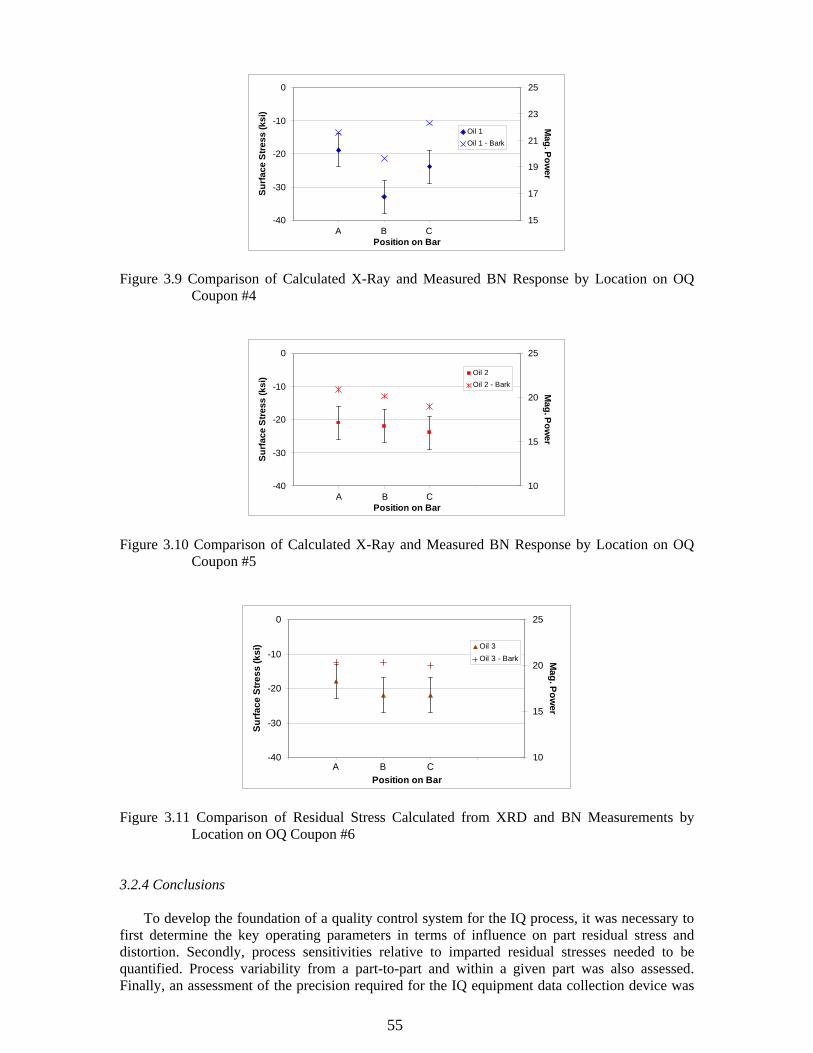
55
-40
-30
-20
-10
0
0 1 2 3 4 5Position on Bar
Surf
ace
Stre
ss (k
si)
15
17
19
21
23
25
Mag. P
ower
Oil 1Oil 1 - Bark
BA C
Figure 3.9 Comparison of Calculated X-Ray and Measured BN Response by Location on OQ
Coupon #4
-40
-30
-20
-10
0
0 1 2 3 4 5Position on Bar
Surf
ace
Stre
ss (k
si)
10
15
20
25
Mag. P
ower
Oil 2Oil 2 - Bark
A B C
Figure 3.10 Comparison of Calculated X-Ray and Measured BN Response by Location on OQ
Coupon #5
-40
-30
-20
-10
0
0 1 2 3 4 5Position on Bar
Surfa
ce S
tress
(ksi
)
10
15
20
25
Mag. Pow
er
Oil 3Oil 3 - Bark
A B C
Figure 3.11 Comparison of Residual Stress Calculated from XRD and BN Measurements by
Location on OQ Coupon #6 3.2.4 Conclusions To develop the foundation of a quality control system for the IQ process, it was necessary to first determine the key operating parameters in terms of influence on part residual stress and distortion. Secondly, process sensitivities relative to imparted residual stresses needed to be quantified. Process variability from a part-to-part and within a given part was also assessed. Finally, an assessment of the precision required for the IQ equipment data collection device was
56
also undertaken. Findings and recommendations arising from this task are summarized as follows: Key Operating Parameters and Recommendations for QC Implementation The following operating parameters have been shown to have key influence of residual stress and distortion response in IQ:
o Flow Stabilization Time – The time at which fully developed flow is achieved in the system is critical for obtaining the required surface heat transfer coefficient and necessary thermal gradients to realize the residual stress benefits of intensive quenching. Physical trials have shown this time to decrease with decreasing section size. In all examined cases the time was less than 1.5 seconds.
o Online data collection and monitoring of water flow for the IQ system must be utilized in a regular and systematic manner to ensure achievement of required heat transfer. The precision of the valve and monitor must have sensitivity to track timing for fully developed flow to 0.5 seconds. 1000Hz data collection is recommended.
o Fully developed flow must be achieved as uniformly as possible over the part surface. Use of computational fluid dynamics in all IQ equipment and fixture design is strongly recommended to assure optimal flow characteristics.
o Acquisition of a Barkhausen Noise unit for regular QA inspection will aid in reduction of process variability, provide an additional means of tracking process variation, and facilitate tighter process capability.
3.3 Quenching of Test Gears in High-Velocity IQ System
The test gears were quenched one-at-a-time using the high velocity intensive quenching system. The procedures for this were to heat the gears in a salt pot set at 927oC for 15 minutes. These gears had already been through the carburization and the intercritical annealing steps. The salt pot protected the surface from both oxidation and decarburization. The gears were processed through the salt pot in batches of three, with the first gear being removed from the pot after 15 minutes, and the third gear being removed for quenching after approximately 20 minutes. The single gear was hand carried to the quenching station with the transfer time being under 6 seconds. The stage was raised to seal the flow tube and the system was activated, i.e. the 3-way valve was opened to allow the water to flow down past the hot gear to quench it. The quench was completed in about 20 seconds, and the cold gear was removed, dried and stored for batch deep freezing in liquid nitrogen.
Figure 3.12 shows the intensive quenching station. Beside this station there is a large water reservoir, a powerful pump and tubing for withdrawing and returning water to the reservoir. A critical component on the withdrawal tube is an air activated 3-way valve that directs water flow either directly back into the reservoir or to the intensive quenching station. The critical components of the station in Figure 3.12 are the following:
o The movable platform that holds the gear fixture; o The four hydraulic cylinders that lift and hold the platform against the water
supply tube; and o The inner and outer supply tubes that deliver water to the quenching position.
A schematic sketch of the quench station in the closed position is shown in Figure 3.13.
The amount of water flowing through the bore or around the outside of the gear are controlled separately by a diverter valve, and thus the purpose of the inner and outer tubes, see Figure 3.14 for the actual photograph of the coaxial tubes. This arrangement allows the quenching of the bore and teeth to be controlled separately. In this case the focus is on cooling the teeth as quickly and uniformly as possible, so the water flow in the outer tube is purposefully higher. The
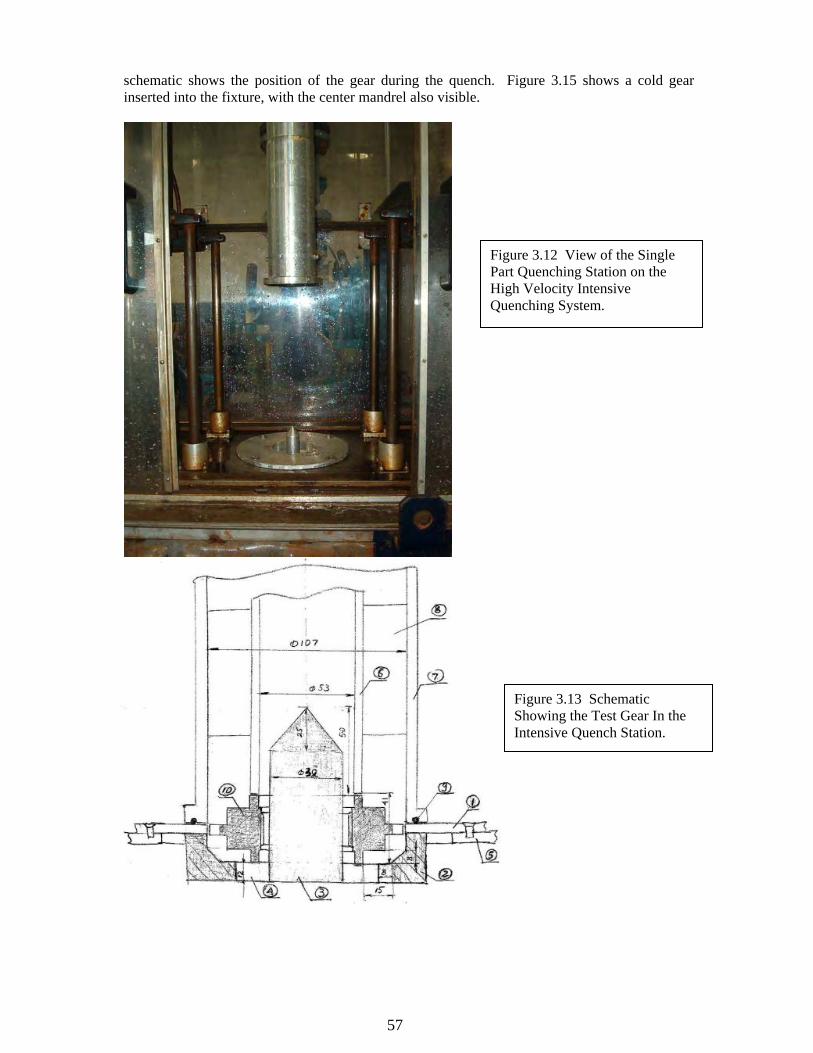
57
schematic shows the position of the gear during the quench. Figure 3.15 shows a cold gear inserted into the fixture, with the center mandrel also visible.
Figure 3.12 View of the Single Part Quenching Station on the High Velocity Intensive Quenching System.
Figure 3.13 Schematic Showing the Test Gear In the Intensive Quench Station.
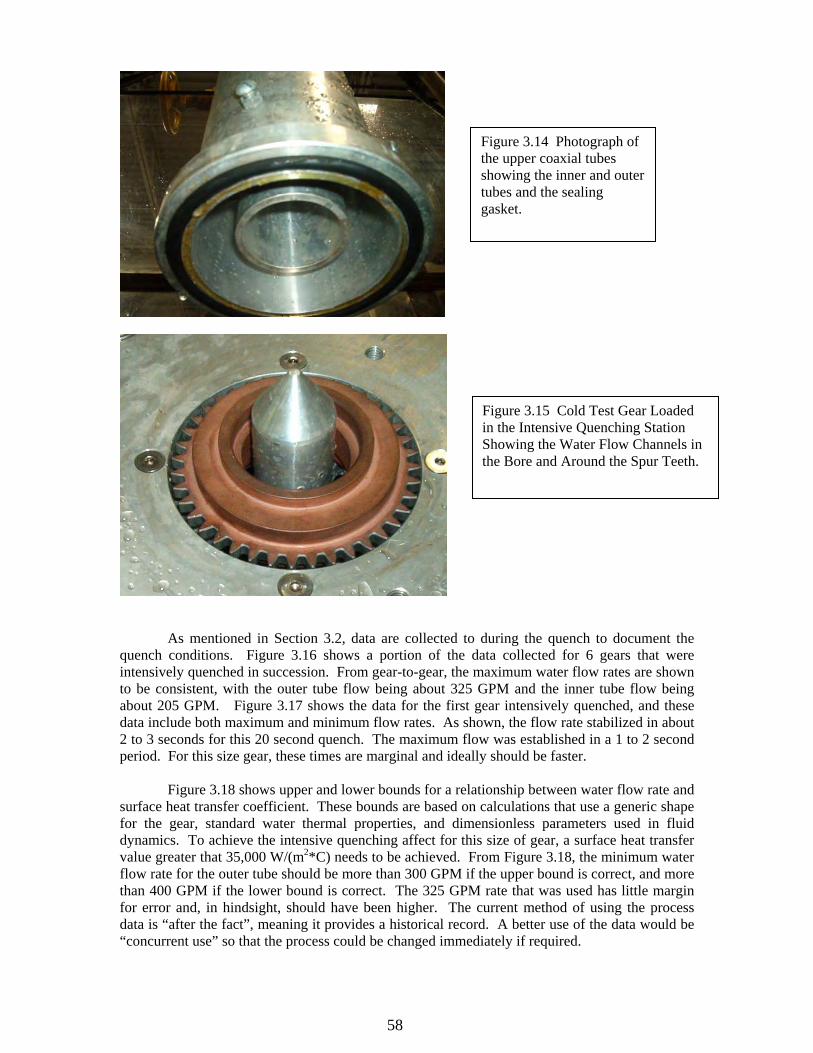
58
As mentioned in Section 3.2, data are collected to during the quench to document the quench conditions. Figure 3.16 shows a portion of the data collected for 6 gears that were intensively quenched in succession. From gear-to-gear, the maximum water flow rates are shown to be consistent, with the outer tube flow being about 325 GPM and the inner tube flow being about 205 GPM. Figure 3.17 shows the data for the first gear intensively quenched, and these data include both maximum and minimum flow rates. As shown, the flow rate stabilized in about 2 to 3 seconds for this 20 second quench. The maximum flow was established in a 1 to 2 second period. For this size gear, these times are marginal and ideally should be faster.
Figure 3.18 shows upper and lower bounds for a relationship between water flow rate and surface heat transfer coefficient. These bounds are based on calculations that use a generic shape for the gear, standard water thermal properties, and dimensionless parameters used in fluid dynamics. To achieve the intensive quenching affect for this size of gear, a surface heat transfer value greater that 35,000 W/(m2*C) needs to be achieved. From Figure 3.18, the minimum water flow rate for the outer tube should be more than 300 GPM if the upper bound is correct, and more than 400 GPM if the lower bound is correct. The 325 GPM rate that was used has little margin for error and, in hindsight, should have been higher. The current method of using the process data is “after the fact”, meaning it provides a historical record. A better use of the data would be “concurrent use” so that the process could be changed immediately if required.
Figure 3.14 Photograph of the upper coaxial tubes showing the inner and outer tubes and the sealing gasket.
Figure 3.15 Cold Test Gear Loaded in the Intensive Quenching Station Showing the Water Flow Channels in the Bore and Around the Spur Teeth.
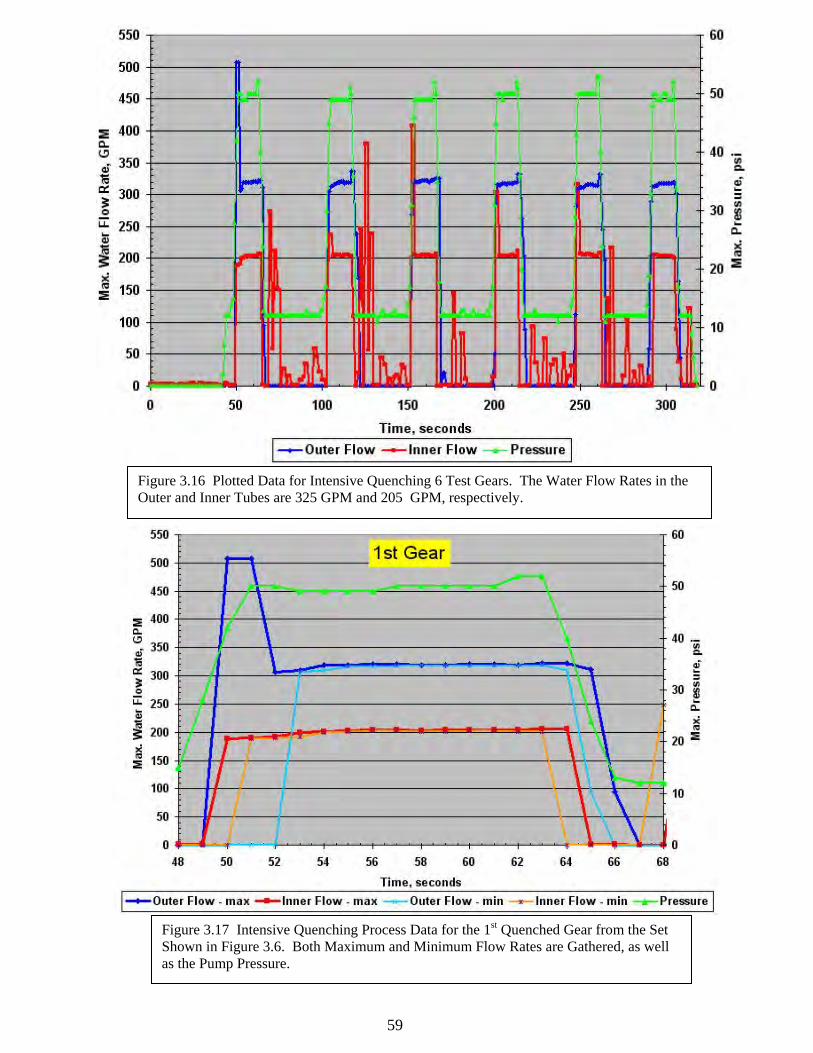
59
Figure 3.16 Plotted Data for Intensive Quenching 6 Test Gears. The Water Flow Rates in the Outer and Inner Tubes are 325 GPM and 205 GPM, respectively.
Figure 3.17 Intensive Quenching Process Data for the 1st Quenched Gear from the Set Shown in Figure 3.6. Both Maximum and Minimum Flow Rates are Gathered, as well as the Pump Pressure.
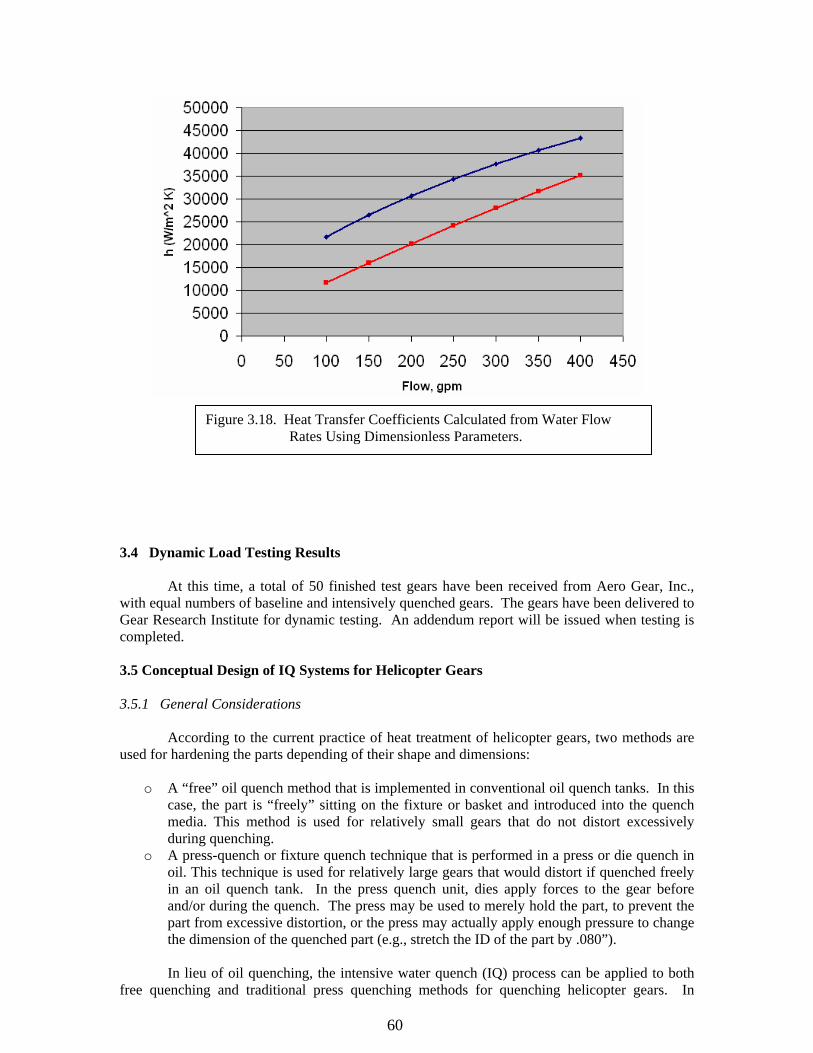
60
3.4 Dynamic Load Testing Results
At this time, a total of 50 finished test gears have been received from Aero Gear, Inc., with equal numbers of baseline and intensively quenched gears. The gears have been delivered to Gear Research Institute for dynamic testing. An addendum report will be issued when testing is completed. 3.5 Conceptual Design of IQ Systems for Helicopter Gears 3.5.1 General Considerations According to the current practice of heat treatment of helicopter gears, two methods are used for hardening the parts depending of their shape and dimensions:
o A “free” oil quench method that is implemented in conventional oil quench tanks. In this case, the part is “freely” sitting on the fixture or basket and introduced into the quench media. This method is used for relatively small gears that do not distort excessively during quenching.
o A press-quench or fixture quench technique that is performed in a press or die quench in oil. This technique is used for relatively large gears that would distort if quenched freely in an oil quench tank. In the press quench unit, dies apply forces to the gear before and/or during the quench. The press may be used to merely hold the part, to prevent the part from excessive distortion, or the press may actually apply enough pressure to change the dimension of the quenched part (e.g., stretch the ID of the part by .080”).
In lieu of oil quenching, the intensive water quench (IQ) process can be applied to both
free quenching and traditional press quenching methods for quenching helicopter gears. In
Figure 3.18. Heat Transfer Coefficients Calculated from Water Flow Rates Using Dimensionless Parameters.
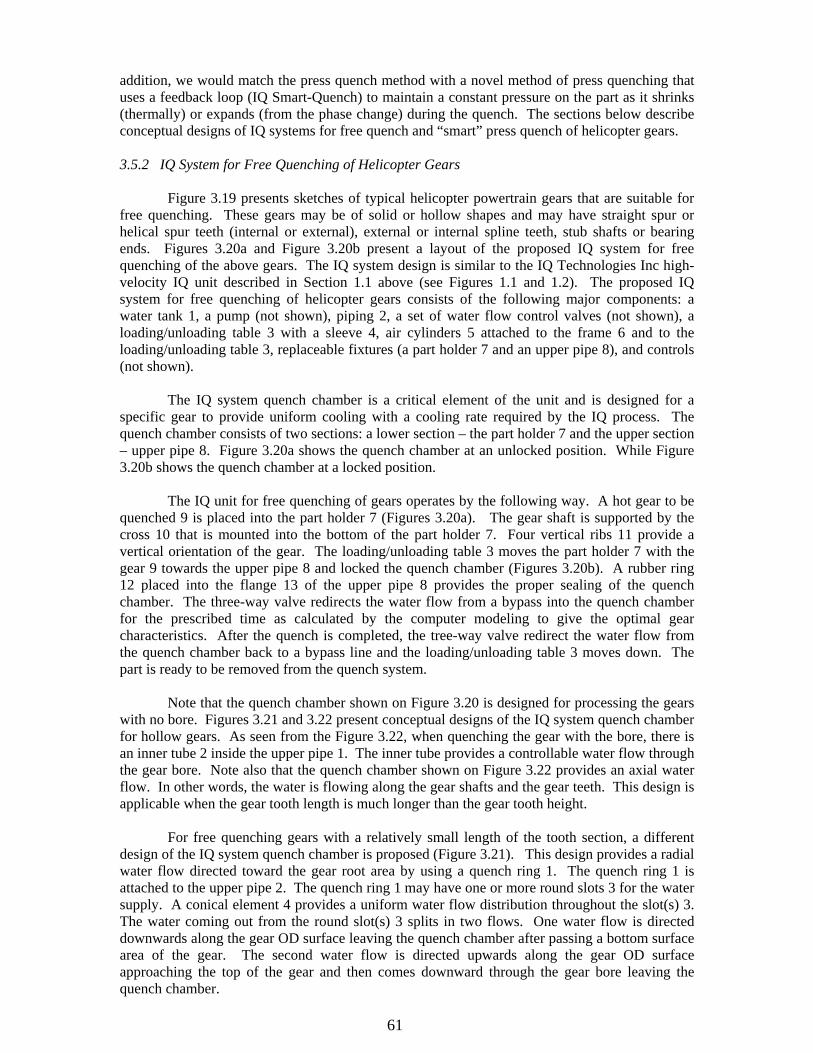
61
addition, we would match the press quench method with a novel method of press quenching that uses a feedback loop (IQ Smart-Quench) to maintain a constant pressure on the part as it shrinks (thermally) or expands (from the phase change) during the quench. The sections below describe conceptual designs of IQ systems for free quench and “smart” press quench of helicopter gears. 3.5.2 IQ System for Free Quenching of Helicopter Gears
Figure 3.19 presents sketches of typical helicopter powertrain gears that are suitable for free quenching. These gears may be of solid or hollow shapes and may have straight spur or helical spur teeth (internal or external), external or internal spline teeth, stub shafts or bearing ends. Figures 3.20a and Figure 3.20b present a layout of the proposed IQ system for free quenching of the above gears. The IQ system design is similar to the IQ Technologies Inc high-velocity IQ unit described in Section 1.1 above (see Figures 1.1 and 1.2). The proposed IQ system for free quenching of helicopter gears consists of the following major components: a water tank 1, a pump (not shown), piping 2, a set of water flow control valves (not shown), a loading/unloading table 3 with a sleeve 4, air cylinders 5 attached to the frame 6 and to the loading/unloading table 3, replaceable fixtures (a part holder 7 and an upper pipe 8), and controls (not shown).
The IQ system quench chamber is a critical element of the unit and is designed for a
specific gear to provide uniform cooling with a cooling rate required by the IQ process. The quench chamber consists of two sections: a lower section – the part holder 7 and the upper section – upper pipe 8. Figure 3.20a shows the quench chamber at an unlocked position. While Figure 3.20b shows the quench chamber at a locked position.
The IQ unit for free quenching of gears operates by the following way. A hot gear to be
quenched 9 is placed into the part holder 7 (Figures 3.20a). The gear shaft is supported by the cross 10 that is mounted into the bottom of the part holder 7. Four vertical ribs 11 provide a vertical orientation of the gear. The loading/unloading table 3 moves the part holder 7 with the gear 9 towards the upper pipe 8 and locked the quench chamber (Figures 3.20b). A rubber ring 12 placed into the flange 13 of the upper pipe 8 provides the proper sealing of the quench chamber. The three-way valve redirects the water flow from a bypass into the quench chamber for the prescribed time as calculated by the computer modeling to give the optimal gear characteristics. After the quench is completed, the tree-way valve redirect the water flow from the quench chamber back to a bypass line and the loading/unloading table 3 moves down. The part is ready to be removed from the quench system.
Note that the quench chamber shown on Figure 3.20 is designed for processing the gears
with no bore. Figures 3.21 and 3.22 present conceptual designs of the IQ system quench chamber for hollow gears. As seen from the Figure 3.22, when quenching the gear with the bore, there is an inner tube 2 inside the upper pipe 1. The inner tube provides a controllable water flow through the gear bore. Note also that the quench chamber shown on Figure 3.22 provides an axial water flow. In other words, the water is flowing along the gear shafts and the gear teeth. This design is applicable when the gear tooth length is much longer than the gear tooth height.
For free quenching gears with a relatively small length of the tooth section, a different
design of the IQ system quench chamber is proposed (Figure 3.21). This design provides a radial water flow directed toward the gear root area by using a quench ring 1. The quench ring 1 is attached to the upper pipe 2. The quench ring 1 may have one or more round slots 3 for the water supply. A conical element 4 provides a uniform water flow distribution throughout the slot(s) 3. The water coming out from the round slot(s) 3 splits in two flows. One water flow is directed downwards along the gear OD surface leaving the quench chamber after passing a bottom surface area of the gear. The second water flow is directed upwards along the gear OD surface approaching the top of the gear and then comes downward through the gear bore leaving the quench chamber.
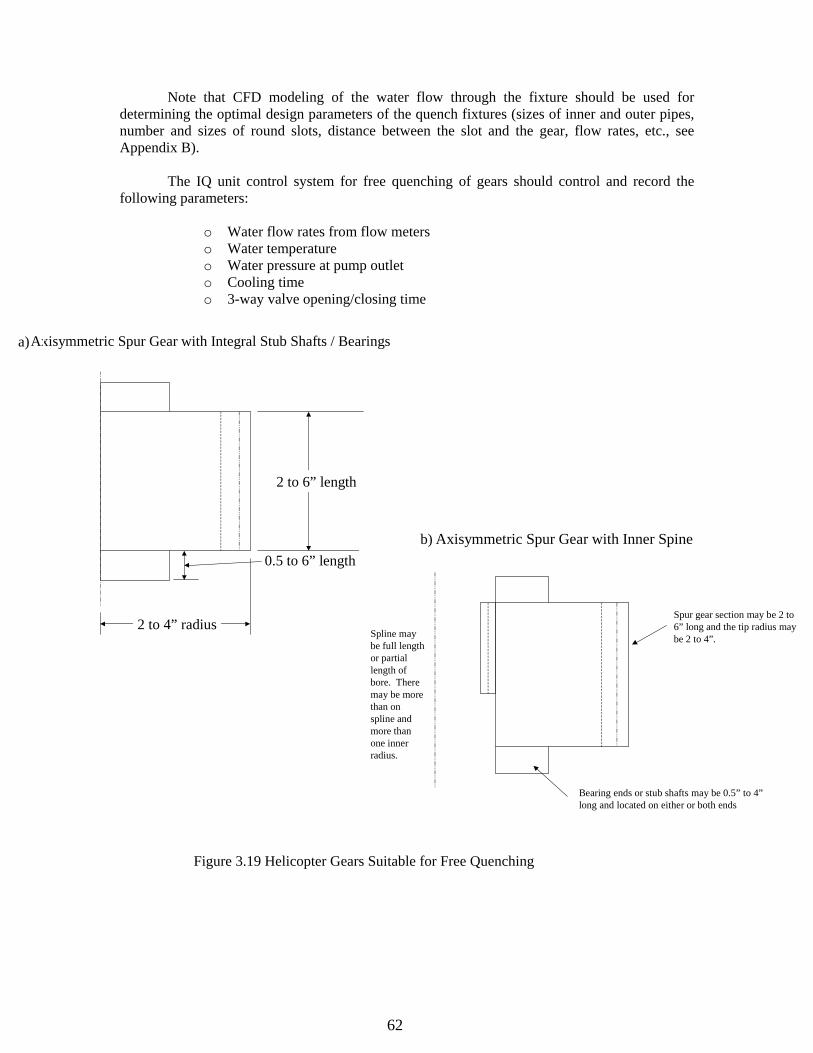
62
Note that CFD modeling of the water flow through the fixture should be used for
determining the optimal design parameters of the quench fixtures (sizes of inner and outer pipes, number and sizes of round slots, distance between the slot and the gear, flow rates, etc., see Appendix B).
The IQ unit control system for free quenching of gears should control and record the
following parameters:
o Water flow rates from flow meters o Water temperature o Water pressure at pump outlet o Cooling time o 3-way valve opening/closing time
Figure 3.19 Helicopter Gears Suitable for Free Quenching
Axisymmetric Spur Gear with Integral Stub Shafts / Bearings
2 to 4” radius
0.5 to 6” length
2 to 6” length
a)
Axisymmetric Spur Gear with Inner Spine
Bearing ends or stub shafts may be 0.5” to 4” long and located on either or both ends
Spur gear section may be 2 to 6” long and the tip radius may be 2 to 4”.Spline may
be full length or partial length of bore. There may be more than on spline and more than one inner radius.
b)
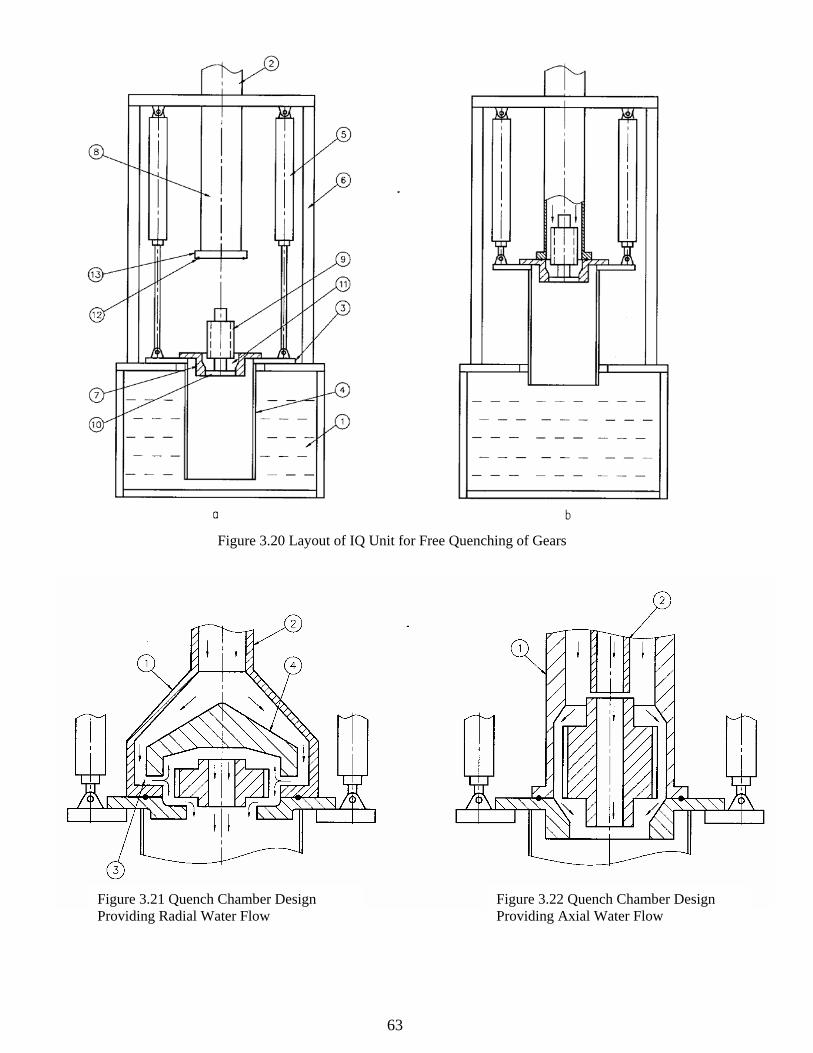
63
Figure 3.20 Layout of IQ Unit for Free Quenching of Gears
Figure 3.21 Quench Chamber Design Providing Radial Water Flow
Figure 3.22 Quench Chamber Design Providing Axial Water Flow
64
3.5.2 IQ System for Press Quenching of Helicopter Gears
Figure 3.23 presents sketches of typical helicopter ring gears and spiral bevel gears that require the use of a press quench method to minimize the part distortion during quenching. For gears that cannot be free quenched with IQ, we can apply intensive water quenching in a press quench system. A major component of a conventional oil quench press system is the press quench die. The press quench die provides proper oil flow while holding the critical dimensions of the part being quenched by contacting the part and pressing on it mechanically. Note that the pressure on the part can occur before quenching, while the part is still hot and plastic, or continue throughout the entire oil quench process. At this stage of the process, the press eliminates the part distortion caused by heating. During quenching, both the uniform distribution of oil through the channels in the die and the mechanical pressure exerted on the part help prevent part distortion caused by part cooling (shrinkage) and by phase transformations (part swelling). Quench pressing also controls the oil flow rate that affects the cooling rate in and around the part.
Note that with traditional press quenching every specific part requires its own specific die. Press quench equipment can provide a tolerance of 0.001” to 0.002” for roundness and flatness for ring gears, bearing rings, etc. Modern press quench machines are fully automated and are usually equipped with a transfer mechanism to transfer the hot part from the furnace to the press. Some quench presses include a washing machine to wash the oil from the parts after the quench.
The intensive water quench (IQ) process can be used in traditional (oil) press quench operations. To implement the IQ method on gears that require press quenching, it will be necessary to do the following:
o Substitute currently used quenchants (oil or polymer) with water. o Redesign quenchant supply channels in the dies for providing optimum water flows
around the parts being quenched since the patterns of the oil passages may not be optimum for intensive water quench.
o Upgrade the press quench unit control system for more precise control of the cooling cycle and water flow parameters required by the IQ process.
To implement the above tasks, it is necessary to use CFD modeling of water flows within
the press quench unit and to apply DANTE modeling of the time/temperature, structural and stress/strain conditions for the specific gears to be quenched.
While, in general, the existing press quench machines could be modified to use the IQ process, we believe that the superior method of processing helicopter gears would be the use of a novel, patent pending press quenching technique developed by Sterling Engineering and Manufacturing Co. of Royal Oak, Michigan, -- the Sterling Smart-Die (Reference X). The Sterling Smart-Die quench systems have been applied to the oil quenching of bearing rings/races.
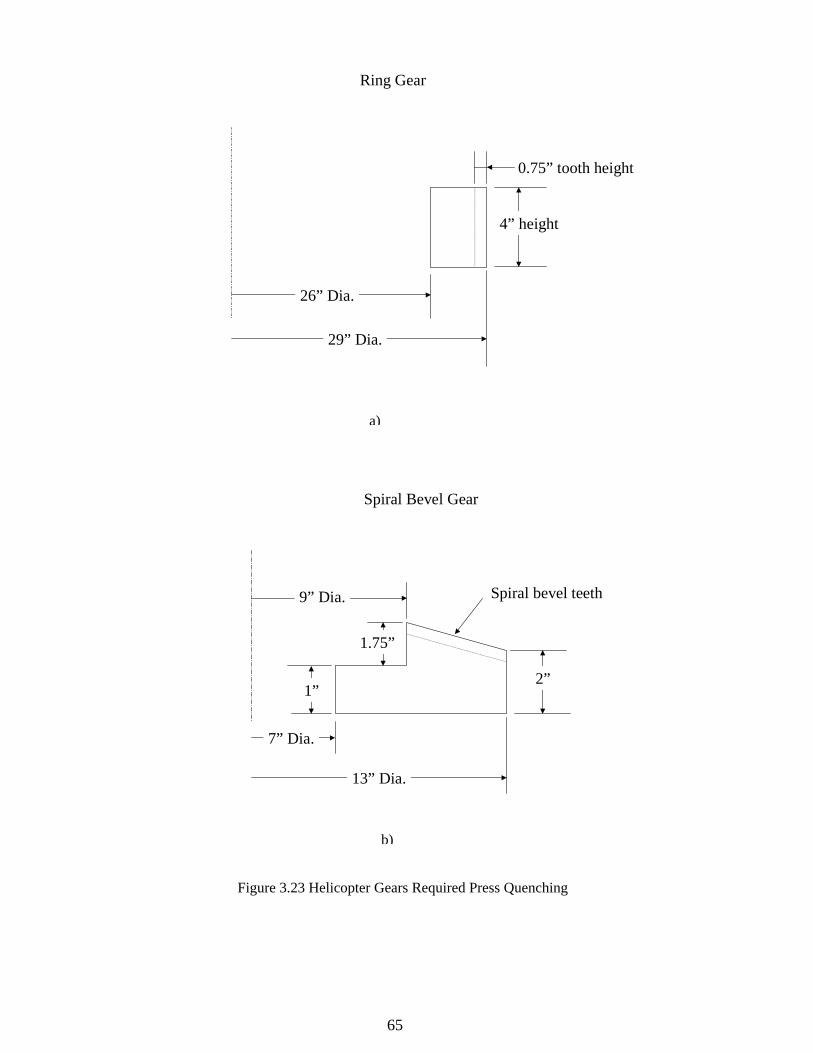
65
Figure 3.23 Helicopter Gears Required Press Quenching
Ring Gear
26” Dia.
29” Dia.
0.75” tooth height
4” height
Spiral Bevel Gear
13” Dia.
2”1”
1.75”
7” Dia.
9” Dia. Spiral bevel teeth
a)
b)
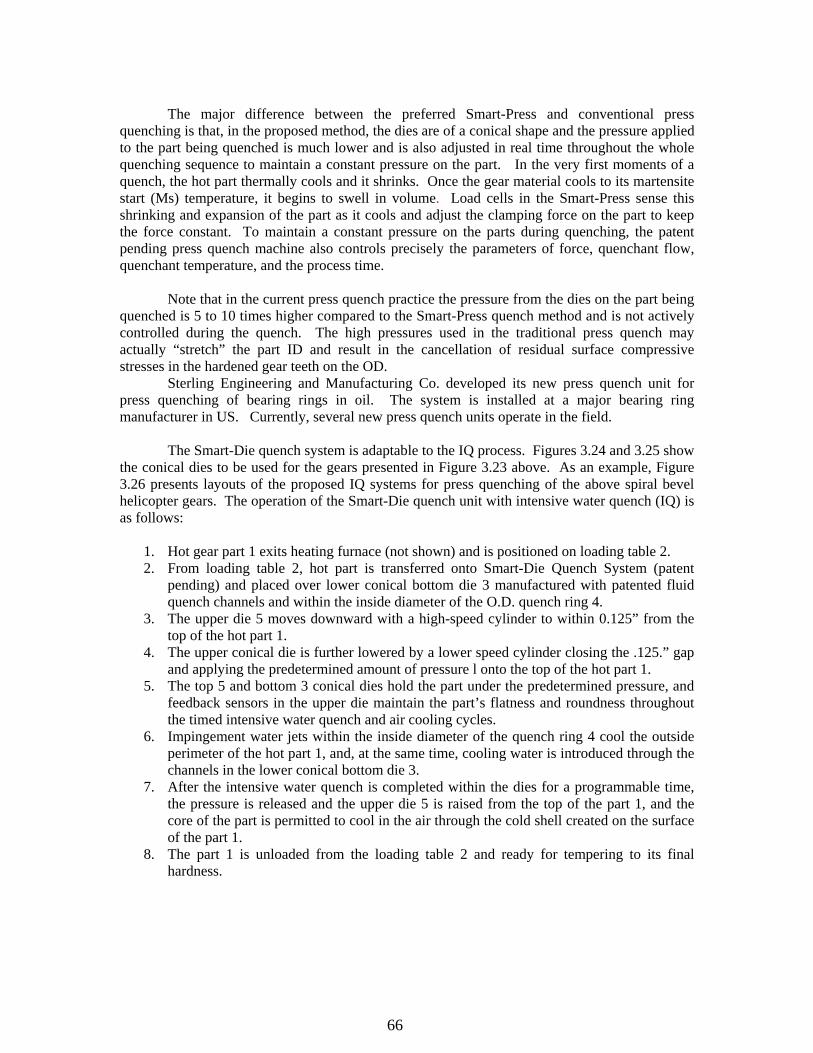
66
The major difference between the preferred Smart-Press and conventional press
quenching is that, in the proposed method, the dies are of a conical shape and the pressure applied to the part being quenched is much lower and is also adjusted in real time throughout the whole quenching sequence to maintain a constant pressure on the part. In the very first moments of a quench, the hot part thermally cools and it shrinks. Once the gear material cools to its martensite start (Ms) temperature, it begins to swell in volume. Load cells in the Smart-Press sense this shrinking and expansion of the part as it cools and adjust the clamping force on the part to keep the force constant. To maintain a constant pressure on the parts during quenching, the patent pending press quench machine also controls precisely the parameters of force, quenchant flow, quenchant temperature, and the process time.
Note that in the current press quench practice the pressure from the dies on the part being
quenched is 5 to 10 times higher compared to the Smart-Press quench method and is not actively controlled during the quench. The high pressures used in the traditional press quench may actually “stretch” the part ID and result in the cancellation of residual surface compressive stresses in the hardened gear teeth on the OD.
Sterling Engineering and Manufacturing Co. developed its new press quench unit for press quenching of bearing rings in oil. The system is installed at a major bearing ring manufacturer in US. Currently, several new press quench units operate in the field.
The Smart-Die quench system is adaptable to the IQ process. Figures 3.24 and 3.25 show
the conical dies to be used for the gears presented in Figure 3.23 above. As an example, Figure 3.26 presents layouts of the proposed IQ systems for press quenching of the above spiral bevel helicopter gears. The operation of the Smart-Die quench unit with intensive water quench (IQ) is as follows:
1. Hot gear part 1 exits heating furnace (not shown) and is positioned on loading table 2. 2. From loading table 2, hot part is transferred onto Smart-Die Quench System (patent
pending) and placed over lower conical bottom die 3 manufactured with patented fluid quench channels and within the inside diameter of the O.D. quench ring 4.
3. The upper die 5 moves downward with a high-speed cylinder to within 0.125” from the top of the hot part 1.
4. The upper conical die is further lowered by a lower speed cylinder closing the .125.” gap and applying the predetermined amount of pressure l onto the top of the hot part 1.
5. The top 5 and bottom 3 conical dies hold the part under the predetermined pressure, and feedback sensors in the upper die maintain the part’s flatness and roundness throughout the timed intensive water quench and air cooling cycles.
6. Impingement water jets within the inside diameter of the quench ring 4 cool the outside perimeter of the hot part 1, and, at the same time, cooling water is introduced through the channels in the lower conical bottom die 3.
7. After the intensive water quench is completed within the dies for a programmable time, the pressure is released and the upper die 5 is raised from the top of the part 1, and the core of the part is permitted to cool in the air through the cold shell created on the surface of the part 1.
8. The part 1 is unloaded from the loading table 2 and ready for tempering to its final hardness.
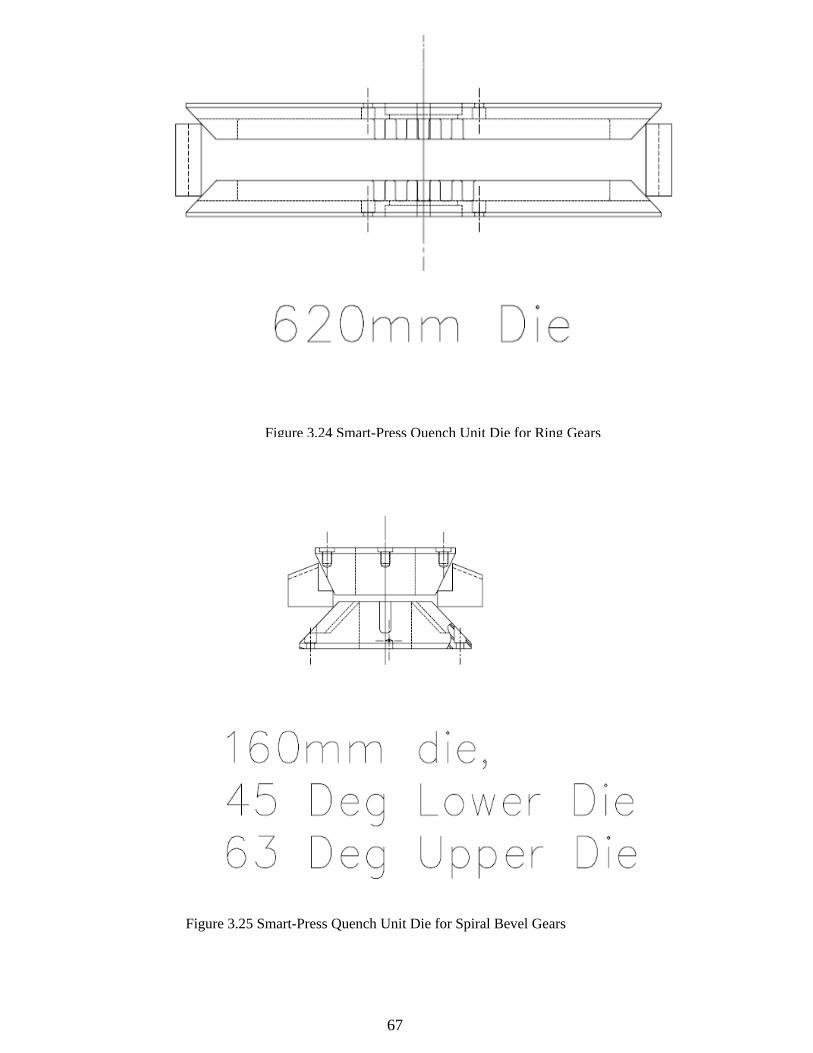
67
Figure 3.24 Smart-Press Quench Unit Die for Ring Gears
Figure 3.25 Smart-Press Quench Unit Die for Spiral Bevel Gears
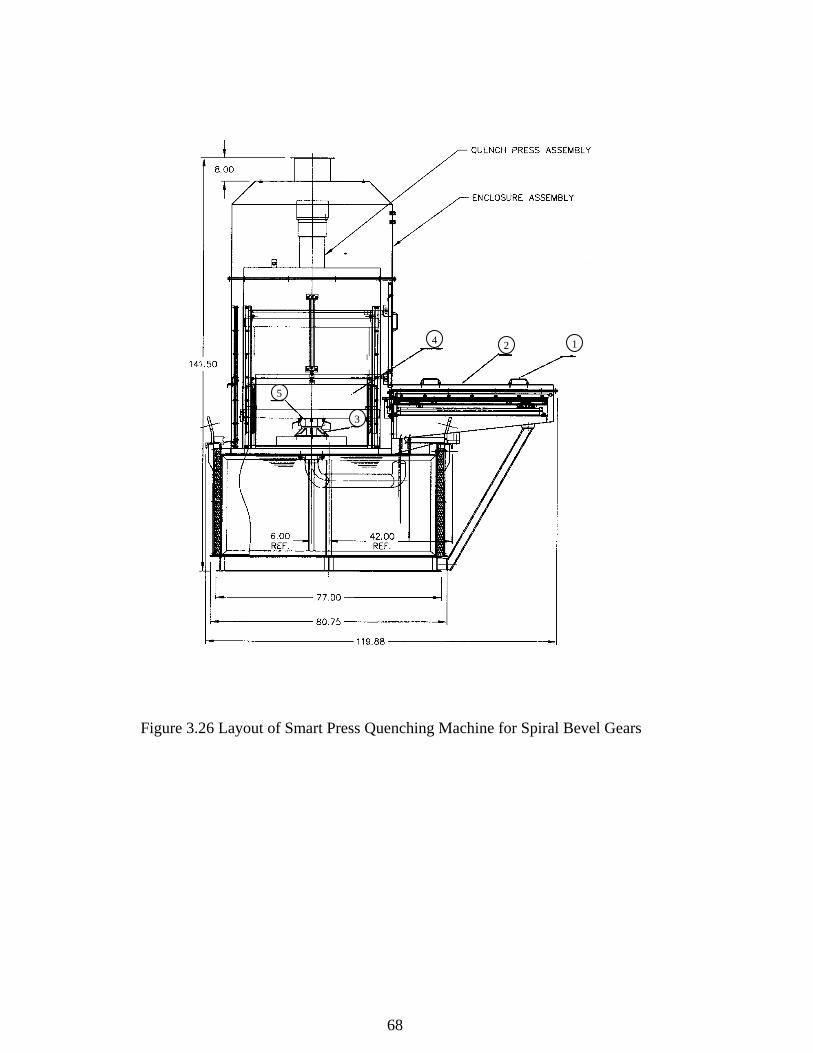
68
Figure 3.26 Layout of Smart Press Quenching Machine for Spiral Bevel Gears
1 2 4
5
3
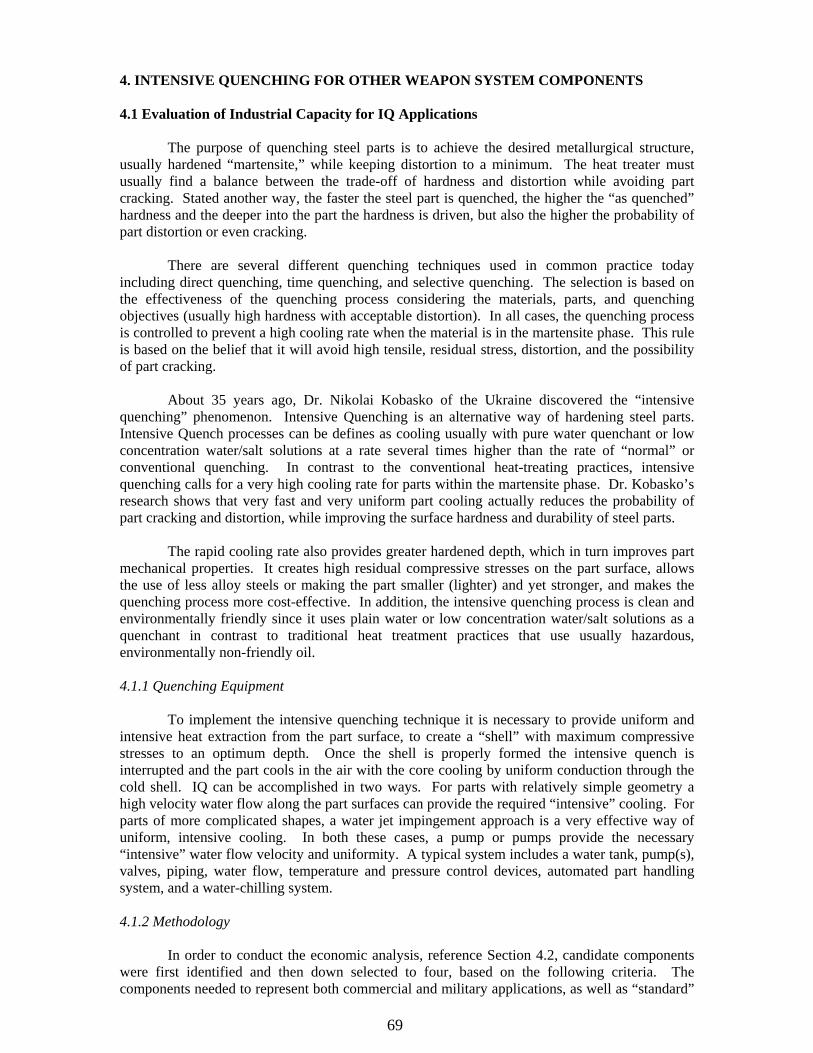
69
4. INTENSIVE QUENCHING FOR OTHER WEAPON SYSTEM COMPONENTS
4.1 Evaluation of Industrial Capacity for IQ Applications
The purpose of quenching steel parts is to achieve the desired metallurgical structure, usually hardened “martensite,” while keeping distortion to a minimum. The heat treater must usually find a balance between the trade-off of hardness and distortion while avoiding part cracking. Stated another way, the faster the steel part is quenched, the higher the “as quenched” hardness and the deeper into the part the hardness is driven, but also the higher the probability of part distortion or even cracking.
There are several different quenching techniques used in common practice today including direct quenching, time quenching, and selective quenching. The selection is based on the effectiveness of the quenching process considering the materials, parts, and quenching objectives (usually high hardness with acceptable distortion). In all cases, the quenching process is controlled to prevent a high cooling rate when the material is in the martensite phase. This rule is based on the belief that it will avoid high tensile, residual stress, distortion, and the possibility of part cracking.
About 35 years ago, Dr. Nikolai Kobasko of the Ukraine discovered the “intensive quenching” phenomenon. Intensive Quenching is an alternative way of hardening steel parts. Intensive Quench processes can be defines as cooling usually with pure water quenchant or low concentration water/salt solutions at a rate several times higher than the rate of “normal” or conventional quenching. In contrast to the conventional heat-treating practices, intensive quenching calls for a very high cooling rate for parts within the martensite phase. Dr. Kobasko’s research shows that very fast and very uniform part cooling actually reduces the probability of part cracking and distortion, while improving the surface hardness and durability of steel parts.
The rapid cooling rate also provides greater hardened depth, which in turn improves part mechanical properties. It creates high residual compressive stresses on the part surface, allows the use of less alloy steels or making the part smaller (lighter) and yet stronger, and makes the quenching process more cost-effective. In addition, the intensive quenching process is clean and environmentally friendly since it uses plain water or low concentration water/salt solutions as a quenchant in contrast to traditional heat treatment practices that use usually hazardous, environmentally non-friendly oil. 4.1.1 Quenching Equipment
To implement the intensive quenching technique it is necessary to provide uniform and intensive heat extraction from the part surface, to create a “shell” with maximum compressive stresses to an optimum depth. Once the shell is properly formed the intensive quench is interrupted and the part cools in the air with the core cooling by uniform conduction through the cold shell. IQ can be accomplished in two ways. For parts with relatively simple geometry a high velocity water flow along the part surfaces can provide the required “intensive” cooling. For parts of more complicated shapes, a water jet impingement approach is a very effective way of uniform, intensive cooling. In both these cases, a pump or pumps provide the necessary “intensive” water flow velocity and uniformity. A typical system includes a water tank, pump(s), valves, piping, water flow, temperature and pressure control devices, automated part handling system, and a water-chilling system. 4.1.2 Methodology
In order to conduct the economic analysis, reference Section 4.2, candidate components were first identified and then down selected to four, based on the following criteria. The components needed to represent both commercial and military applications, as well as “standard”
70
and specialized components. As the IQ process has the ability to extend part life, at least one of the components needed to have a substantial life cycle. Finally, a variety of steel types would need to be selected to determine the applicability of the process on different carbon content materials. Therefore, the components chosen were two military gun barrels, a helicopter gear made out of exotic steel (pyrowear), and finally a punch used in a commercial production environment. Unfortunately, the data for the helicopter gear was not available in time to conduct the economic analysis. 4.1.3 Application.
Each of the four selected components will be analyzed using a matrix that will qualitatively identify material improvements due to the IQ process, as well as quantitatively identify the cost savings associated with the process. Concurrently, the same components processed with standard quenching processes were studied, and a comparison made. The outcome of the process will be a matrix that shows overall cost net present value and ranking index over the life of each product. In order to identify cost savings using the intensive quench process and justify the application for industry practice the following information was collected for each component:
o Unit cost o Quantity procured each year o Cost to quench component using standard quenching o Cost to quench using IQ o Quenching cost savings o Component life cycle with standard quenching o Component life cycle with IQ o Life cycle cost savings o Material reduction savings due to part redesign o Total savings per component
4.1.4 Summary of Intensive Quenching Process Benefits
IQ processes have been shown to increase part hardness and strength, while at the same time providing less part distortion on typical products made of various steel alloys. When considering IQ processing the component post processing requirements must be evaluated since some of the IQ benefits may be reduced or eliminated completely by a post process procedure. The figure below represents a process flow of the potential benefits after various post processing techniques are applied to a part. Some of the proven advantages of intensive quenching are shown below:
o Elimination of cracking o Minimize distortion and associated costs o High residual compressive surface stresses for greater part durability o Reduction or elimination of carburization cycles o Improved mechanical properties o Reduction of part size/weight with comparable physical properties o Longer part life with no cost penalty o Usage of lower alloy steels while maintaining physical properties o Replacement of hazardous quench oil with environmentally friendly water o Better integration of the heat-treating process into the production process flow
71
Intensive QuenchIntensive Quench
•Grinding•Machining•Tempering•Honing•Autofretage•Shot Peening
Mechanical Property
Improvements / Benefits
Mechanical & Compressive
Stress Improvements /
Benefits
Post Processing
Post Processing
• No Post Processing
• Coating / Plating
• Polishing• Laser Peening• Roll
Burnishing• Water Peening
•Mechanical Properties Plus
•High Cycle Fatigue
•Stress Corrosion Cracking
•Surface finish
• Yield Strength• Ultimate
Strength• Fracture
Toughness• ..........
Post Processing
Post Processing
Post Processing
Post Processing
Figure 4.1 Process Flow for Potential Benefits After Various Post Processing Techniques 4.1.5 Intensive Quenching Limitations
While standard batch quenching processes utilize hazardous and costly oils, these processes have one significant advantage over the intensive quench technique. Batch quenching in oil allows a part of virtually any size and shape to be processed with no or minimal setup. Intensive water quenching on the other hand requires specialized setup and IQ tank alterations and water flow optimization. This can include the use of specific agitation props and motors, impingement nozzles, and fixtures. In addition, small parts (with the thickness of less than 1”) made of alloy non-carburized grades of steel cannot be processed in batches in IQ water tanks. This is because the temperature gradient in such thin parts during quenching is not great enough to develop high current surface compressive stresses that prevent part from cracking. Note, that thin carburized parts can be processed in batches in IQ water tanks due to high compressive stresses developed in the carburized case. Additionally, there are certain limitations for the part geometry when using a single part intensive quenching method since the part sections having different thickness require different cooling times. 4.2 Determination of Feasibility (EA) of IQ Processing for Different Weapon Systems
The purpose of this Section is to conduct an Economic Analysis (EA) on the Intensive Quench (IQ) process and compare the results to standard quenching processes or the current component baseline. A comparison of the cost and benefits of IQ processing for several components was made. Throughout the project the Team collected data and performed the necessary analysis to document performance, cost, and benefits of the IQ process. In this Section we will apply that data in a DOD approved systematic approach used to identify, analyze and compare IQ cost, benefits and alternative courses of action to achieve a given set of objectives. This approach is taken to determine the most efficient and effective manner to employ resources. In the broad sense, the systematic approach called Economic Analysis applies to new programs as well as to the analysis of ongoing actions. EA is a process that is scientific and deliberate, leading to reasonable and quantifiable information for the decision making process. An EA can best aid the decision process by providing a strong analytical framework for evaluating alternatives, documenting baselines, identifying issues, and identifying variables that drive results. These factors, along with the costs of current component baselines are identified in the EA calculations.
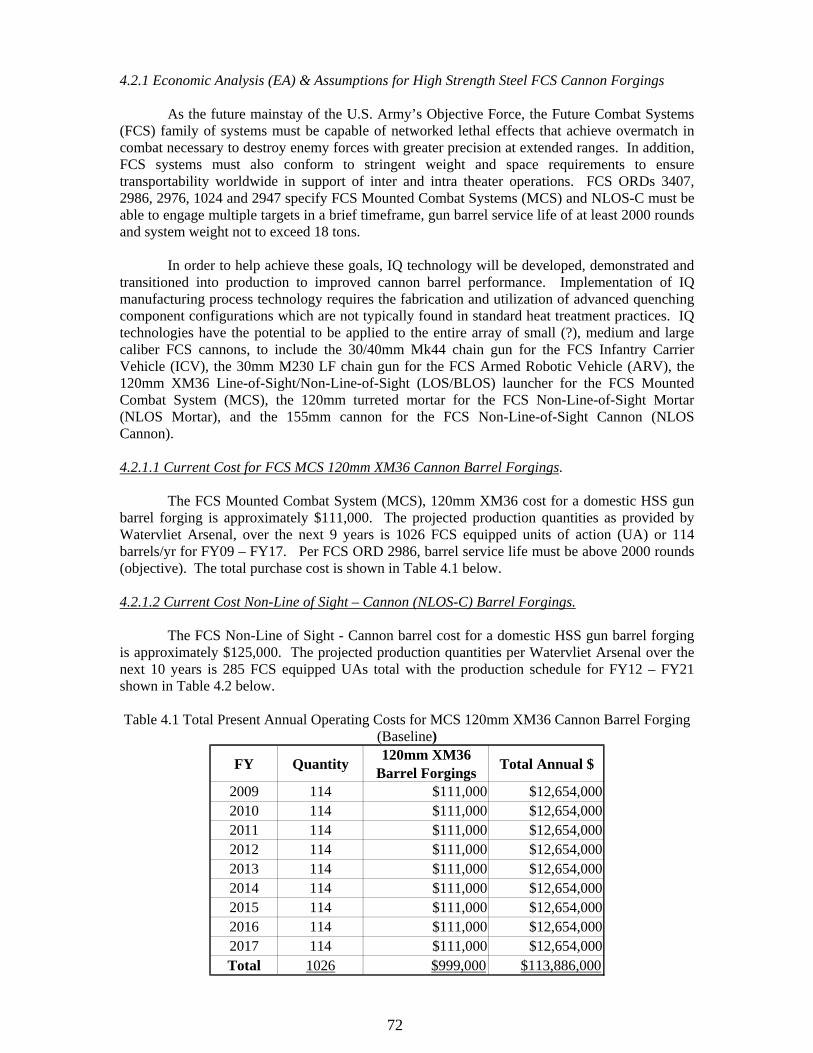
72
4.2.1 Economic Analysis (EA) & Assumptions for High Strength Steel FCS Cannon Forgings
As the future mainstay of the U.S. Army’s Objective Force, the Future Combat Systems (FCS) family of systems must be capable of networked lethal effects that achieve overmatch in combat necessary to destroy enemy forces with greater precision at extended ranges. In addition, FCS systems must also conform to stringent weight and space requirements to ensure transportability worldwide in support of inter and intra theater operations. FCS ORDs 3407, 2986, 2976, 1024 and 2947 specify FCS Mounted Combat Systems (MCS) and NLOS-C must be able to engage multiple targets in a brief timeframe, gun barrel service life of at least 2000 rounds and system weight not to exceed 18 tons.
In order to help achieve these goals, IQ technology will be developed, demonstrated and
transitioned into production to improved cannon barrel performance. Implementation of IQ manufacturing process technology requires the fabrication and utilization of advanced quenching component configurations which are not typically found in standard heat treatment practices. IQ technologies have the potential to be applied to the entire array of small (?), medium and large caliber FCS cannons, to include the 30/40mm Mk44 chain gun for the FCS Infantry Carrier Vehicle (ICV), the 30mm M230 LF chain gun for the FCS Armed Robotic Vehicle (ARV), the 120mm XM36 Line-of-Sight/Non-Line-of-Sight (LOS/BLOS) launcher for the FCS Mounted Combat System (MCS), the 120mm turreted mortar for the FCS Non-Line-of-Sight Mortar (NLOS Mortar), and the 155mm cannon for the FCS Non-Line-of-Sight Cannon (NLOS Cannon). 4.2.1.1 Current Cost for FCS MCS 120mm XM36 Cannon Barrel Forgings.
The FCS Mounted Combat System (MCS), 120mm XM36 cost for a domestic HSS gun barrel forging is approximately $111,000. The projected production quantities as provided by Watervliet Arsenal, over the next 9 years is 1026 FCS equipped units of action (UA) or 114 barrels/yr for FY09 – FY17. Per FCS ORD 2986, barrel service life must be above 2000 rounds (objective). The total purchase cost is shown in Table 4.1 below. 4.2.1.2 Current Cost Non-Line of Sight – Cannon (NLOS-C) Barrel Forgings.
The FCS Non-Line of Sight - Cannon barrel cost for a domestic HSS gun barrel forging is approximately $125,000. The projected production quantities per Watervliet Arsenal over the next 10 years is 285 FCS equipped UAs total with the production schedule for FY12 – FY21 shown in Table 4.2 below. Table 4.1 Total Present Annual Operating Costs for MCS 120mm XM36 Cannon Barrel Forging
(Baseline)
FY Quantity 120mm XM36 Barrel Forgings Total Annual $
2009 114 $111,000 $12,654,000 2010 114 $111,000 $12,654,000 2011 114 $111,000 $12,654,000 2012 114 $111,000 $12,654,000 2013 114 $111,000 $12,654,000 2014 114 $111,000 $12,654,000 2015 114 $111,000 $12,654,000 2016 114 $111,000 $12,654,000 2017 114 $111,000 $12,654,000 Total 1026 $999,000 $113,886,000
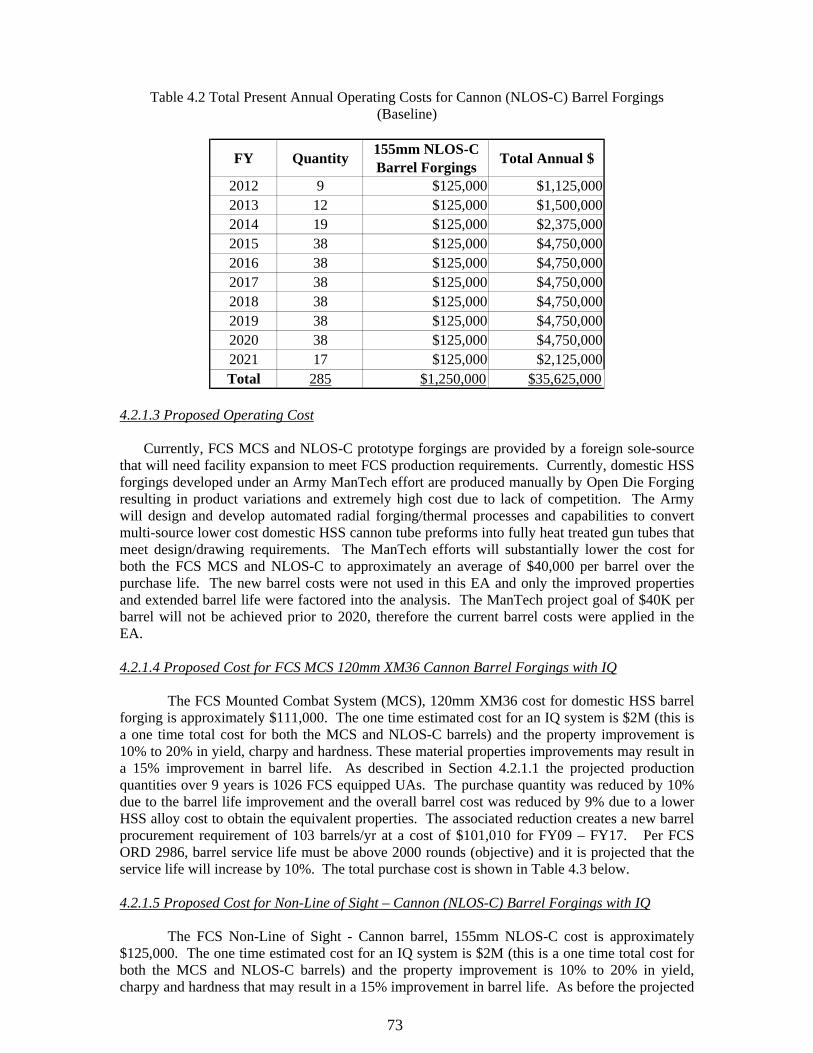
73
Table 4.2 Total Present Annual Operating Costs for Cannon (NLOS-C) Barrel Forgings
(Baseline)
FY Quantity 155mm NLOS-C Barrel Forgings Total Annual $
2012 9 $125,000 $1,125,000 2013 12 $125,000 $1,500,000 2014 19 $125,000 $2,375,000 2015 38 $125,000 $4,750,000 2016 38 $125,000 $4,750,000 2017 38 $125,000 $4,750,000 2018 38 $125,000 $4,750,000 2019 38 $125,000 $4,750,000 2020 38 $125,000 $4,750,000 2021 17 $125,000 $2,125,000 Total 285 $1,250,000 $35,625,000
4.2.1.3 Proposed Operating Cost Currently, FCS MCS and NLOS-C prototype forgings are provided by a foreign sole-source that will need facility expansion to meet FCS production requirements. Currently, domestic HSS forgings developed under an Army ManTech effort are produced manually by Open Die Forging resulting in product variations and extremely high cost due to lack of competition. The Army will design and develop automated radial forging/thermal processes and capabilities to convert multi-source lower cost domestic HSS cannon tube preforms into fully heat treated gun tubes that meet design/drawing requirements. The ManTech efforts will substantially lower the cost for both the FCS MCS and NLOS-C to approximately an average of $40,000 per barrel over the purchase life. The new barrel costs were not used in this EA and only the improved properties and extended barrel life were factored into the analysis. The ManTech project goal of $40K per barrel will not be achieved prior to 2020, therefore the current barrel costs were applied in the EA. 4.2.1.4 Proposed Cost for FCS MCS 120mm XM36 Cannon Barrel Forgings with IQ
The FCS Mounted Combat System (MCS), 120mm XM36 cost for domestic HSS barrel forging is approximately $111,000. The one time estimated cost for an IQ system is $2M (this is a one time total cost for both the MCS and NLOS-C barrels) and the property improvement is 10% to 20% in yield, charpy and hardness. These material properties improvements may result in a 15% improvement in barrel life. As described in Section 4.2.1.1 the projected production quantities over 9 years is 1026 FCS equipped UAs. The purchase quantity was reduced by 10% due to the barrel life improvement and the overall barrel cost was reduced by 9% due to a lower HSS alloy cost to obtain the equivalent properties. The associated reduction creates a new barrel procurement requirement of 103 barrels/yr at a cost of $101,010 for FY09 – FY17. Per FCS ORD 2986, barrel service life must be above 2000 rounds (objective) and it is projected that the service life will increase by 10%. The total purchase cost is shown in Table 4.3 below. 4.2.1.5 Proposed Cost for Non-Line of Sight – Cannon (NLOS-C) Barrel Forgings with IQ
The FCS Non-Line of Sight - Cannon barrel, 155mm NLOS-C cost is approximately $125,000. The one time estimated cost for an IQ system is $2M (this is a one time total cost for both the MCS and NLOS-C barrels) and the property improvement is 10% to 20% in yield, charpy and hardness that may result in a 15% improvement in barrel life. As before the projected
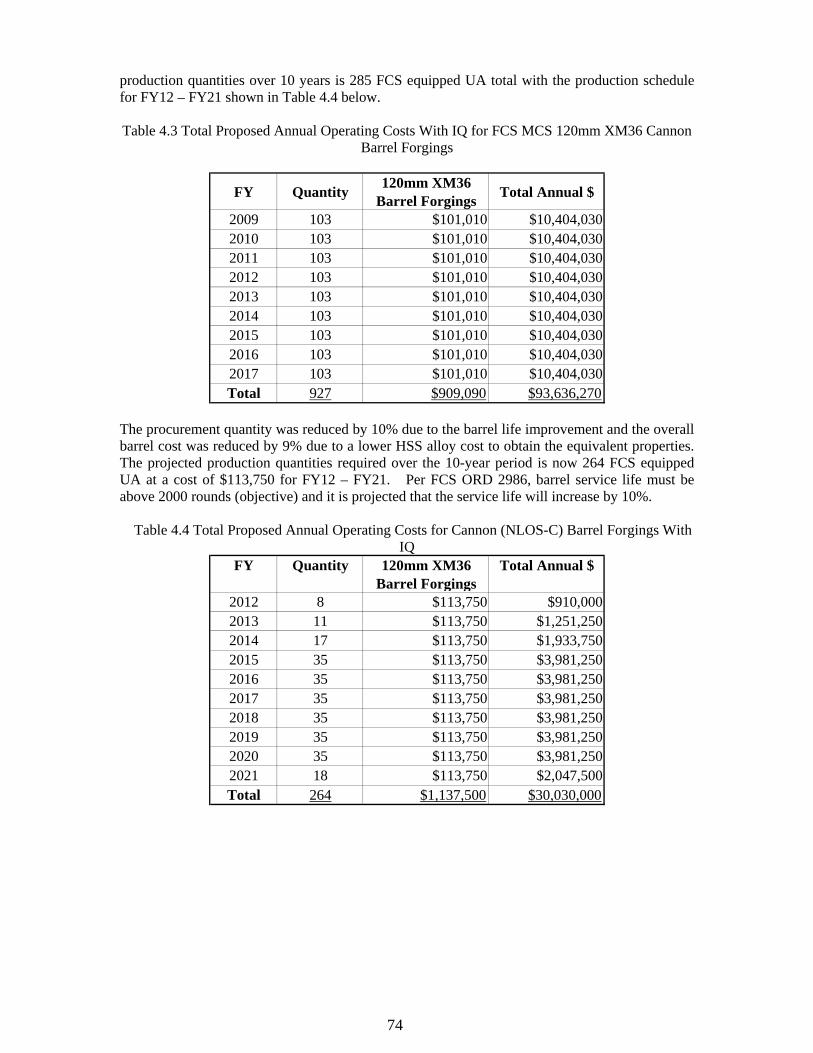
74
production quantities over 10 years is 285 FCS equipped UA total with the production schedule for FY12 – FY21 shown in Table 4.4 below.
Table 4.3 Total Proposed Annual Operating Costs With IQ for FCS MCS 120mm XM36 Cannon
Barrel Forgings
FY Quantity 120mm XM36 Barrel Forgings Total Annual $
2009 103 $101,010 $10,404,030 2010 103 $101,010 $10,404,030 2011 103 $101,010 $10,404,030 2012 103 $101,010 $10,404,030 2013 103 $101,010 $10,404,030 2014 103 $101,010 $10,404,030 2015 103 $101,010 $10,404,030 2016 103 $101,010 $10,404,030 2017 103 $101,010 $10,404,030 Total 927 $909,090 $93,636,270
The procurement quantity was reduced by 10% due to the barrel life improvement and the overall barrel cost was reduced by 9% due to a lower HSS alloy cost to obtain the equivalent properties. The projected production quantities required over the 10-year period is now 264 FCS equipped UA at a cost of $113,750 for FY12 – FY21. Per FCS ORD 2986, barrel service life must be above 2000 rounds (objective) and it is projected that the service life will increase by 10%.
Table 4.4 Total Proposed Annual Operating Costs for Cannon (NLOS-C) Barrel Forgings With
IQ FY Quantity 120mm XM36
Barrel ForgingsTotal Annual $
2012 8 $113,750 $910,000 2013 11 $113,750 $1,251,250 2014 17 $113,750 $1,933,750 2015 35 $113,750 $3,981,250 2016 35 $113,750 $3,981,250 2017 35 $113,750 $3,981,250 2018 35 $113,750 $3,981,250 2019 35 $113,750 $3,981,250 2020 35 $113,750 $3,981,250 2021 18 $113,750 $2,047,500 Total 264 $1,137,500 $30,030,000
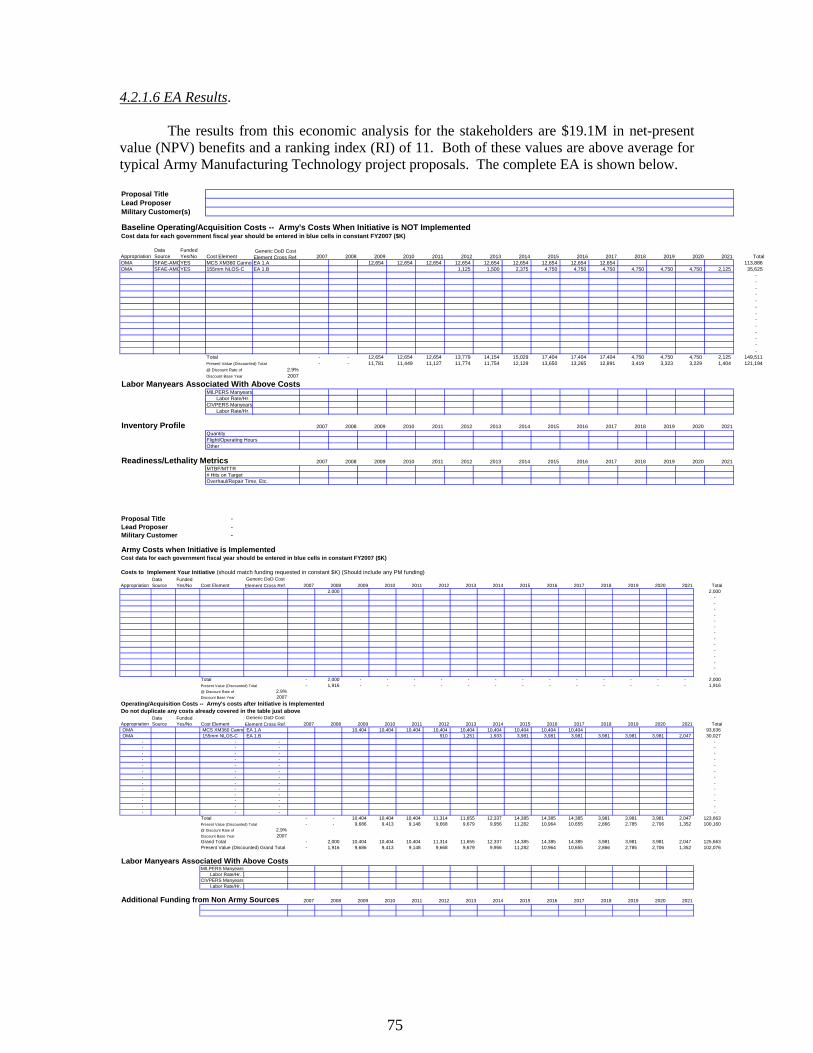
75
4.2.1.6 EA Results.
The results from this economic analysis for the stakeholders are $19.1M in net-present value (NPV) benefits and a ranking index (RI) of 11. Both of these values are above average for typical Army Manufacturing Technology project proposals. The complete EA is shown below. Proposal TitleLead ProposerMilitary Customer(s)
Baseline Operating/Acquisition Costs -- Army's Costs When Initiative is NOT Implemented Cost data for each government fiscal year should be entered in blue cells in constant FY2007 ($K)
AppropriationData Source
Funded Yes/No Cost Element
Generic DoD Cost Element Cross Ref. 2007 2008 2009 2010 2011 2012 2013 2014 2015 2016 2017 2018 2019 2020 2021 Total
OMA SFAE-AMOYES MCS XM360 CannonEA 1.A 12,654 12,654 12,654 12,654 12,654 12,654 12,654 12,654 12,654 113,886 OMA SFAE-AMOYES 155mm NLOS-C EA 1.B 1,125 1,500 2,375 4,750 4,750 4,750 4,750 4,750 4,750 2,125 35,625
- - - - - - - - - - - - -
Total - - 12,654 12,654 12,654 13,779 14,154 15,029 17,404 17,404 17,404 4,750 4,750 4,750 2,125 149,511 Present Value (Discounted) Total - - 11,781 11,449 11,127 11,774 11,754 12,129 13,650 13,265 12,891 3,419 3,323 3,229 1,404 121,194 @ Discount Rate of 2.9%Discount Base Year 2007
Labor Manyears Associated With Above CostsMILPERS Manyears Labor Rate/Hr.CIVPERS Manyears Labor Rate/Hr.
Inventory Profile 2007 2008 2009 2010 2011 2012 2013 2014 2015 2016 2017 2018 2019 2020 2021QuantityFlight/Operating HoursOther
Readiness/Lethality Metrics 2007 2008 2009 2010 2011 2012 2013 2014 2015 2016 2017 2018 2019 2020 2021MTBF/MTTR# Hits on TargetOverhaul/Repair Time, Etc.
Proposal Title - Lead Proposer - Military Customer -
Army Costs when Initiative is ImplementedCost data for each government fiscal year should be entered in blue cells in constant FY2007 ($K)
Costs to Implement Your Initiative (should match funding requested in constant $K) (Should include any PM funding)
AppropriationData Source
Funded Yes/No Cost Element
Generic DoD Cost Element Cross Ref. 2007 2008 2009 2010 2011 2012 2013 2014 2015 2016 2017 2018 2019 2020 2021 Total
2,000 2,000 - - - - - - - - - - - - - -
Total - 2,000 - - - - - - - - - - - - - 2,000 Present Value (Discounted) Total - 1,916 - - - - - - - - - - - - - 1,916 @ Discount Rate of 2.9%Discount Base Year 2007
Operating/Acquisition Costs -- Army's costs after Initiative is ImplementedDo not duplicate any costs already covered in the table just above
AppropriationData Source
Funded Yes/No Cost Element
Generic DoD Cost Element Cross Ref. 2007 2008 2009 2010 2011 2012 2013 2014 2015 2016 2017 2018 2019 2020 2021 Total
OMA MCS XM360 Canno EA 1.A 10,404 10,404 10,404 10,404 10,404 10,404 10,404 10,404 10,404 93,636 OMA 155mm NLOS-C EA 1.B 910 1,251 1,933 3,981 3,981 3,981 3,981 3,981 3,981 2,047 30,027
- - - - - - - - - - - - - - - - - - - - - - - - - - - - - - - - - - - - - - - - - - - - - - - - - - - -
Total - - 10,404 10,404 10,404 11,314 11,655 12,337 14,385 14,385 14,385 3,981 3,981 3,981 2,047 123,663 Present Value (Discounted) Total - - 9,686 9,413 9,148 9,668 9,679 9,956 11,282 10,964 10,655 2,866 2,785 2,706 1,352 100,160 @ Discount Rate of 2.9%Discount Base Year 2007Grand Total - 2,000 10,404 10,404 10,404 11,314 11,655 12,337 14,385 14,385 14,385 3,981 3,981 3,981 2,047 125,663 Present Value (Discounted) Grand Total - 1,916 9,686 9,413 9,148 9,668 9,679 9,956 11,282 10,964 10,655 2,866 2,785 2,706 1,352 102,076
Labor Manyears Associated With Above CostsMILPERS Manyears Labor Rate/Hr.CIVPERS Manyears Labor Rate/Hr.
Additional Funding from Non Army Sources 2007 2008 2009 2010 2011 2012 2013 2014 2015 2016 2017 2018 2019 2020 2021
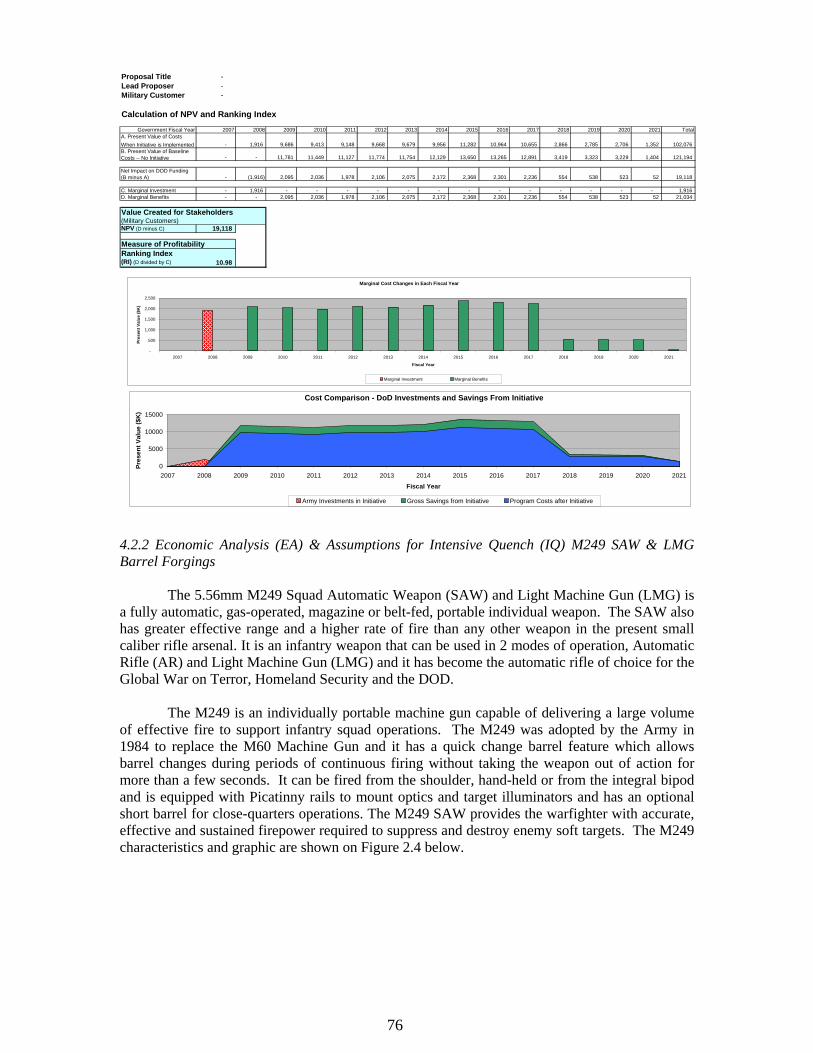
76
Proposal Title - Lead Proposer - Military Customer -
Calculation of NPV and Ranking IndexGovernment Fiscal Year 2007 2008 2009 2010 2011 2012 2013 2014 2015 2016 2017 2018 2019 2020 2021 Total
A. Present Value of Costs When Initiative is Implemented - 1,916 9,686 9,413 9,148 9,668 9,679 9,956 11,282 10,964 10,655 2,866 2,785 2,706 1,352 102,076 B. Present Value of Baseline Costs -- No Initiative - - 11,781 11,449 11,127 11,774 11,754 12,129 13,650 13,265 12,891 3,419 3,323 3,229 1,404 121,194
Net Impact on DOD Funding (B minus A) - (1,916) 2,095 2,036 1,978 2,106 2,075 2,172 2,368 2,301 2,236 554 538 523 52 19,118
C. Marginal Investment - 1,916 - - - - - - - - - - - - - 1,916 D. Marginal Benefits - - 2,095 2,036 1,978 2,106 2,075 2,172 2,368 2,301 2,236 554 538 523 52 21,034
Value Created for Stakeholders(Military Customers)NPV (D minus C) 19,118
Measure of ProfitabilityRanking Index(RI) (D divided by C) 10.98
Marginal Cost Changes in Each Fiscal Year
-
500
1,000
1,500
2,000
2,500
2007 2008 2009 2010 2011 2012 2013 2014 2015 2016 2017 2018 2019 2020 2021
Fiscal Year
Pres
ent V
alue
($K
)
Marginal Investment Marginal Benefits
Cost Comparison - DoD Investments and Savings From Initiative
0
5000
10000
15000
2007 2008 2009 2010 2011 2012 2013 2014 2015 2016 2017 2018 2019 2020 2021
Fiscal Year
Pres
ent V
alue
($K
)
Army Investments in Initiative Gross Savings from Initiative Program Costs after Initiative
4.2.2 Economic Analysis (EA) & Assumptions for Intensive Quench (IQ) M249 SAW & LMG Barrel Forgings
The 5.56mm M249 Squad Automatic Weapon (SAW) and Light Machine Gun (LMG) is a fully automatic, gas-operated, magazine or belt-fed, portable individual weapon. The SAW also has greater effective range and a higher rate of fire than any other weapon in the present small caliber rifle arsenal. It is an infantry weapon that can be used in 2 modes of operation, Automatic Rifle (AR) and Light Machine Gun (LMG) and it has become the automatic rifle of choice for the Global War on Terror, Homeland Security and the DOD.
The M249 is an individually portable machine gun capable of delivering a large volume of effective fire to support infantry squad operations. The M249 was adopted by the Army in 1984 to replace the M60 Machine Gun and it has a quick change barrel feature which allows barrel changes during periods of continuous firing without taking the weapon out of action for more than a few seconds. It can be fired from the shoulder, hand-held or from the integral bipod and is equipped with Picatinny rails to mount optics and target illuminators and has an optional short barrel for close-quarters operations. The M249 SAW provides the warfighter with accurate, effective and sustained firepower required to suppress and destroy enemy soft targets. The M249 characteristics and graphic are shown on Figure 2.4 below.
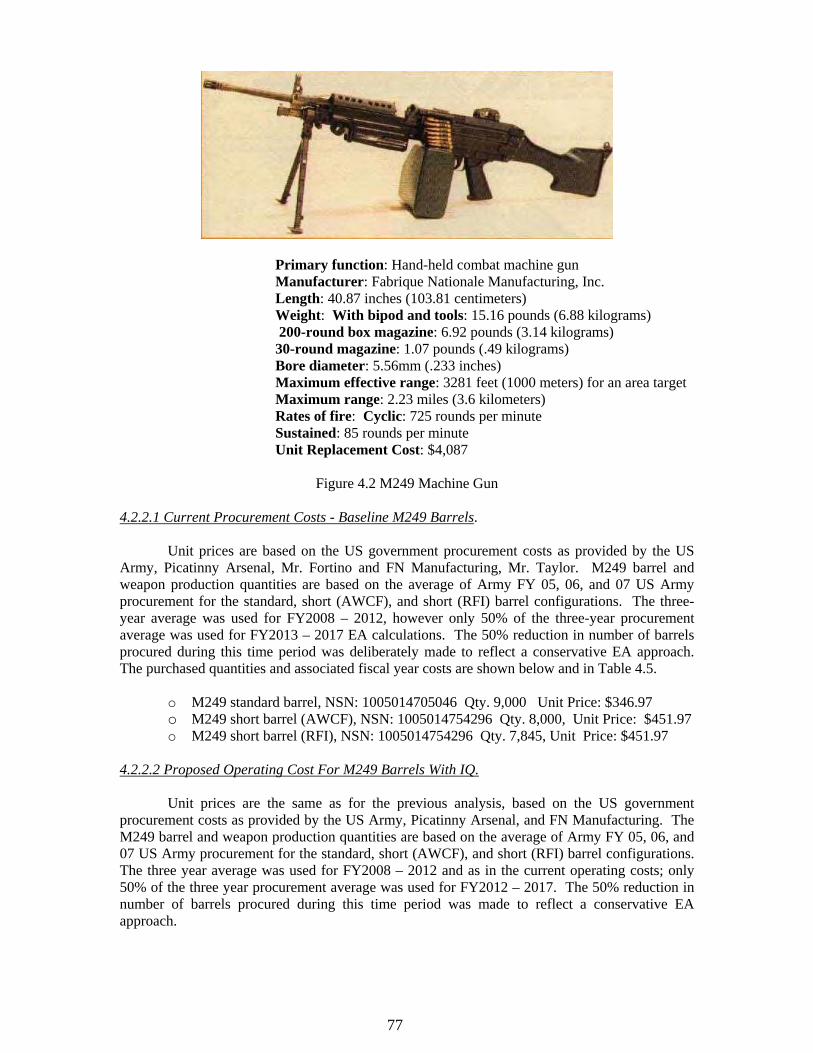
77
Primary function: Hand-held combat machine gun Manufacturer: Fabrique Nationale Manufacturing, Inc. Length: 40.87 inches (103.81 centimeters) Weight: With bipod and tools: 15.16 pounds (6.88 kilograms) 200-round box magazine: 6.92 pounds (3.14 kilograms) 30-round magazine: 1.07 pounds (.49 kilograms) Bore diameter: 5.56mm (.233 inches) Maximum effective range: 3281 feet (1000 meters) for an area target Maximum range: 2.23 miles (3.6 kilometers) Rates of fire: Cyclic: 725 rounds per minute Sustained: 85 rounds per minute Unit Replacement Cost: $4,087
Figure 4.2 M249 Machine Gun
4.2.2.1 Current Procurement Costs - Baseline M249 Barrels.
Unit prices are based on the US government procurement costs as provided by the US Army, Picatinny Arsenal, Mr. Fortino and FN Manufacturing, Mr. Taylor. M249 barrel and weapon production quantities are based on the average of Army FY 05, 06, and 07 US Army procurement for the standard, short (AWCF), and short (RFI) barrel configurations. The three-year average was used for FY2008 – 2012, however only 50% of the three-year procurement average was used for FY2013 – 2017 EA calculations. The 50% reduction in number of barrels procured during this time period was deliberately made to reflect a conservative EA approach. The purchased quantities and associated fiscal year costs are shown below and in Table 4.5.
o M249 standard barrel, NSN: 1005014705046 Qty. 9,000 Unit Price: $346.97 o M249 short barrel (AWCF), NSN: 1005014754296 Qty. 8,000, Unit Price: $451.97 o M249 short barrel (RFI), NSN: 1005014754296 Qty. 7,845, Unit Price: $451.97
4.2.2.2 Proposed Operating Cost For M249 Barrels With IQ.
Unit prices are the same as for the previous analysis, based on the US government procurement costs as provided by the US Army, Picatinny Arsenal, and FN Manufacturing. The M249 barrel and weapon production quantities are based on the average of Army FY 05, 06, and 07 US Army procurement for the standard, short (AWCF), and short (RFI) barrel configurations. The three year average was used for FY2008 – 2012 and as in the current operating costs; only 50% of the three year procurement average was used for FY2012 – 2017. The 50% reduction in number of barrels procured during this time period was made to reflect a conservative EA approach.
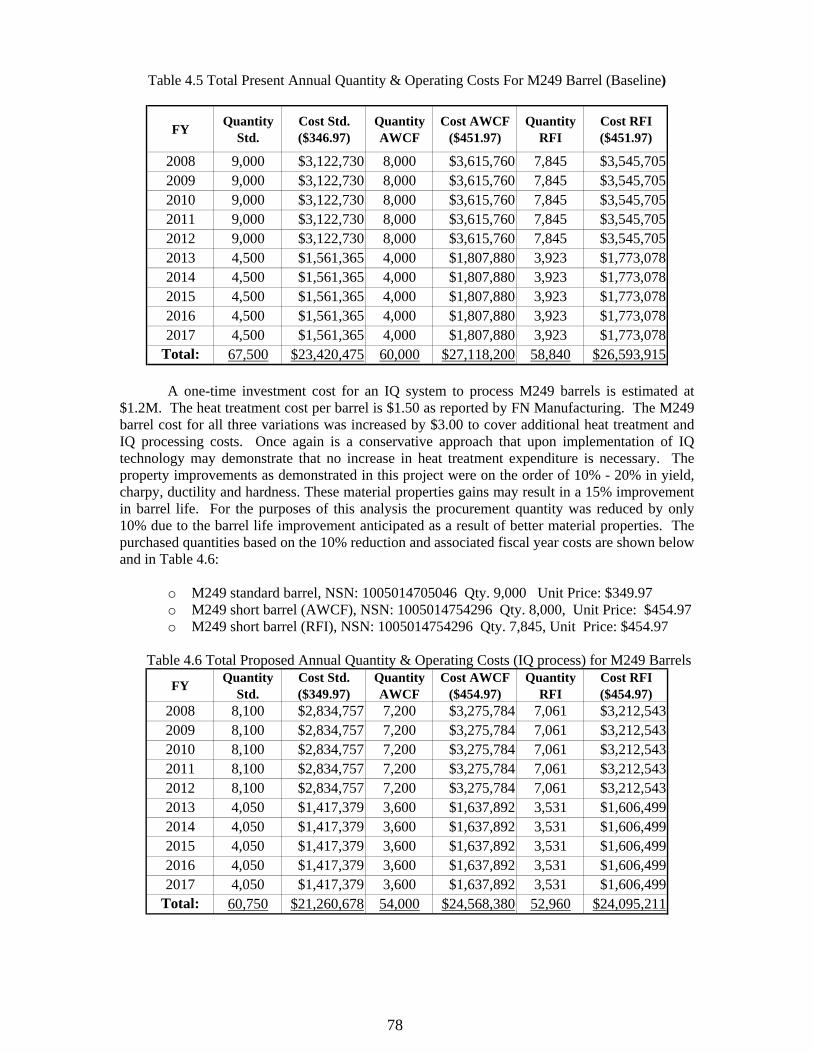
78
Table 4.5 Total Present Annual Quantity & Operating Costs For M249 Barrel (Baseline)
FY Quantity Std.
Cost Std. ($346.97)
Quantity AWCF
Cost AWCF ($451.97)
Quantity RFI
Cost RFI ($451.97)
2008 9,000 $3,122,730 8,000 $3,615,760 7,845 $3,545,705 2009 9,000 $3,122,730 8,000 $3,615,760 7,845 $3,545,705 2010 9,000 $3,122,730 8,000 $3,615,760 7,845 $3,545,705 2011 9,000 $3,122,730 8,000 $3,615,760 7,845 $3,545,705 2012 9,000 $3,122,730 8,000 $3,615,760 7,845 $3,545,705 2013 4,500 $1,561,365 4,000 $1,807,880 3,923 $1,773,078 2014 4,500 $1,561,365 4,000 $1,807,880 3,923 $1,773,078 2015 4,500 $1,561,365 4,000 $1,807,880 3,923 $1,773,078 2016 4,500 $1,561,365 4,000 $1,807,880 3,923 $1,773,078 2017 4,500 $1,561,365 4,000 $1,807,880 3,923 $1,773,078
Total: 67,500 $23,420,475 60,000 $27,118,200 58,840 $26,593,915
A one-time investment cost for an IQ system to process M249 barrels is estimated at $1.2M. The heat treatment cost per barrel is $1.50 as reported by FN Manufacturing. The M249 barrel cost for all three variations was increased by $3.00 to cover additional heat treatment and IQ processing costs. Once again is a conservative approach that upon implementation of IQ technology may demonstrate that no increase in heat treatment expenditure is necessary. The property improvements as demonstrated in this project were on the order of 10% - 20% in yield, charpy, ductility and hardness. These material properties gains may result in a 15% improvement in barrel life. For the purposes of this analysis the procurement quantity was reduced by only 10% due to the barrel life improvement anticipated as a result of better material properties. The purchased quantities based on the 10% reduction and associated fiscal year costs are shown below and in Table 4.6:
o M249 standard barrel, NSN: 1005014705046 Qty. 9,000 Unit Price: $349.97 o M249 short barrel (AWCF), NSN: 1005014754296 Qty. 8,000, Unit Price: $454.97 o M249 short barrel (RFI), NSN: 1005014754296 Qty. 7,845, Unit Price: $454.97
Table 4.6 Total Proposed Annual Quantity & Operating Costs (IQ process) for M249 Barrels
FY Quantity Std.
Cost Std. ($349.97)
Quantity AWCF
Cost AWCF ($454.97)
Quantity RFI
Cost RFI ($454.97)
2008 8,100 $2,834,757 7,200 $3,275,784 7,061 $3,212,543 2009 8,100 $2,834,757 7,200 $3,275,784 7,061 $3,212,543 2010 8,100 $2,834,757 7,200 $3,275,784 7,061 $3,212,543 2011 8,100 $2,834,757 7,200 $3,275,784 7,061 $3,212,543 2012 8,100 $2,834,757 7,200 $3,275,784 7,061 $3,212,543 2013 4,050 $1,417,379 3,600 $1,637,892 3,531 $1,606,499 2014 4,050 $1,417,379 3,600 $1,637,892 3,531 $1,606,499 2015 4,050 $1,417,379 3,600 $1,637,892 3,531 $1,606,499 2016 4,050 $1,417,379 3,600 $1,637,892 3,531 $1,606,499 2017 4,050 $1,417,379 3,600 $1,637,892 3,531 $1,606,499
Total: 60,750 $21,260,678 54,000 $24,568,380 52,960 $24,095,211
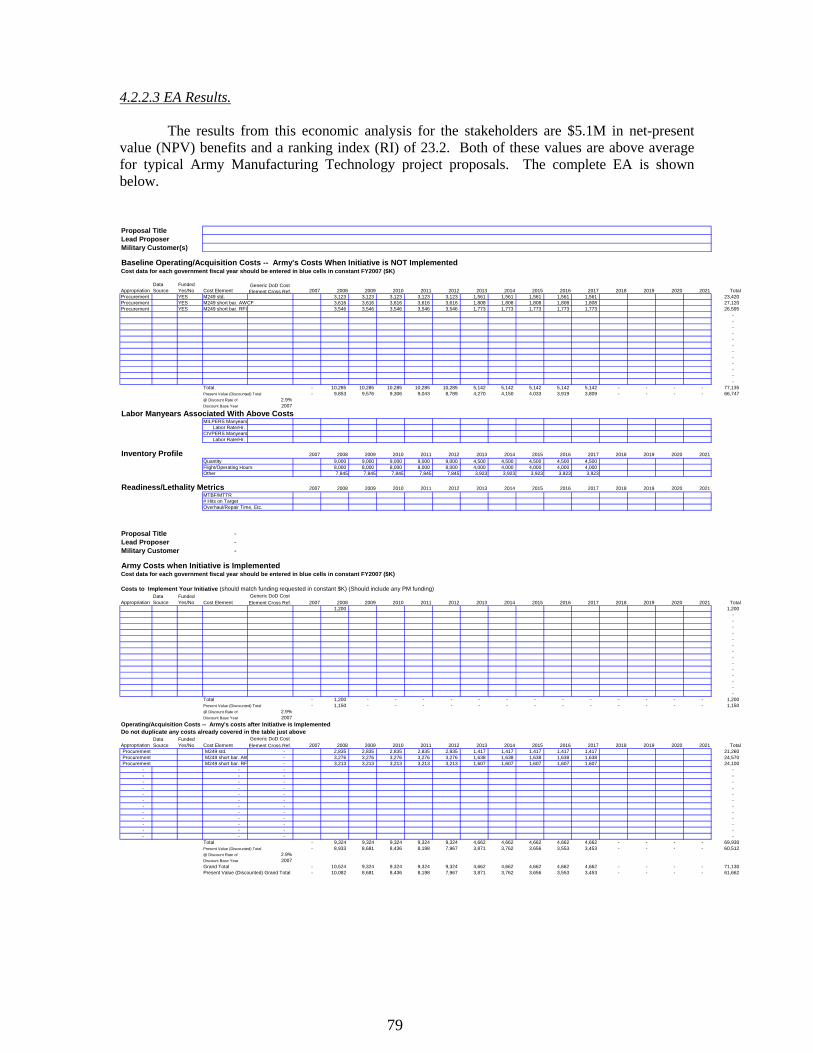
79
4.2.2.3 EA Results.
The results from this economic analysis for the stakeholders are $5.1M in net-present value (NPV) benefits and a ranking index (RI) of 23.2. Both of these values are above average for typical Army Manufacturing Technology project proposals. The complete EA is shown below. Proposal TitleLead ProposerMilitary Customer(s)
Baseline Operating/Acquisition Costs -- Army's Costs When Initiative is NOT Implemented Cost data for each government fiscal year should be entered in blue cells in constant FY2007 ($K)
AppropriationData Source
Funded Yes/No Cost Element
Generic DoD Cost Element Cross Ref. 2007 2008 2009 2010 2011 2012 2013 2014 2015 2016 2017 2018 2019 2020 2021 Total
Procurement YES M249 std. 3,123 3,123 3,123 3,123 3,123 1,561 1,561 1,561 1,561 1,561 23,420 Procurement YES M249 short bar. AWCF 3,616 3,616 3,616 3,616 3,616 1,808 1,808 1,808 1,808 1,808 27,120 Procurement YES M249 short bar. RFI 3,546 3,546 3,546 3,546 3,546 1,773 1,773 1,773 1,773 1,773 26,595
- - - - - - - - - - - -
Total - 10,285 10,285 10,285 10,285 10,285 5,142 5,142 5,142 5,142 5,142 - - - - 77,135 Present Value (Discounted) Total - 9,853 9,576 9,306 9,043 8,789 4,270 4,150 4,033 3,919 3,809 - - - - 66,747 @ Discount Rate of 2.9%Discount Base Year 2007
Labor Manyears Associated With Above CostsMILPERS Manyears Labor Rate/Hr.CIVPERS Manyears Labor Rate/Hr.
Inventory Profile 2007 2008 2009 2010 2011 2012 2013 2014 2015 2016 2017 2018 2019 2020 2021Quantity 9,000 9,000 9,000 9,000 9,000 4,500 4,500 4,500 4,500 4,500 Flight/Operating Hours 8,000 8,000 8,000 8,000 8,000 4,000 4,000 4,000 4,000 4,000 Other 7,845 7,845 7,845 7,845 7,845 3,923 3,923 3,923 3,923 3,923
Readiness/Lethality Metrics 2007 2008 2009 2010 2011 2012 2013 2014 2015 2016 2017 2018 2019 2020 2021MTBF/MTTR# Hits on TargetOverhaul/Repair Time, Etc.
Proposal Title - Lead Proposer - Military Customer -
Army Costs when Initiative is ImplementedCost data for each government fiscal year should be entered in blue cells in constant FY2007 ($K)
Costs to Implement Your Initiative (should match funding requested in constant $K) (Should include any PM funding)
AppropriationData Source
Funded Yes/No Cost Element
Generic DoD Cost Element Cross Ref. 2007 2008 2009 2010 2011 2012 2013 2014 2015 2016 2017 2018 2019 2020 2021 Total
1,200 1,200 - - - - - - - - - - - - - -
Total - 1,200 - - - - - - - - - - - - - 1,200 Present Value (Discounted) Total - 1,150 - - - - - - - - - - - - - 1,150 @ Discount Rate of 2.9%Discount Base Year 2007
Operating/Acquisition Costs -- Army's costs after Initiative is ImplementedDo not duplicate any costs already covered in the table just above
AppropriationData Source
Funded Yes/No Cost Element
Generic DoD Cost Element Cross Ref. 2007 2008 2009 2010 2011 2012 2013 2014 2015 2016 2017 2018 2019 2020 2021 Total
Procurement M249 std. - 2,835 2,835 2,835 2,835 2,835 1,417 1,417 1,417 1,417 1,417 21,260 Procurement M249 short bar. AW - 3,276 3,276 3,276 3,276 3,276 1,638 1,638 1,638 1,638 1,638 24,570 Procurement M249 short bar. RF - 3,213 3,213 3,213 3,213 3,213 1,607 1,607 1,607 1,607 1,607 24,100
- - - - - - - - - - - - - - - - - - - - - - - - - - - - - - - - - - - - - - - - - - - - - - - -
Total - 9,324 9,324 9,324 9,324 9,324 4,662 4,662 4,662 4,662 4,662 - - - - 69,930 Present Value (Discounted) Total - 8,933 8,681 8,436 8,198 7,967 3,871 3,762 3,656 3,553 3,453 - - - - 60,512 @ Discount Rate of 2.9%Discount Base Year 2007Grand Total - 10,524 9,324 9,324 9,324 9,324 4,662 4,662 4,662 4,662 4,662 - - - - 71,130 Present Value (Discounted) Grand Total - 10,082 8,681 8,436 8,198 7,967 3,871 3,762 3,656 3,553 3,453 - - - - 61,662
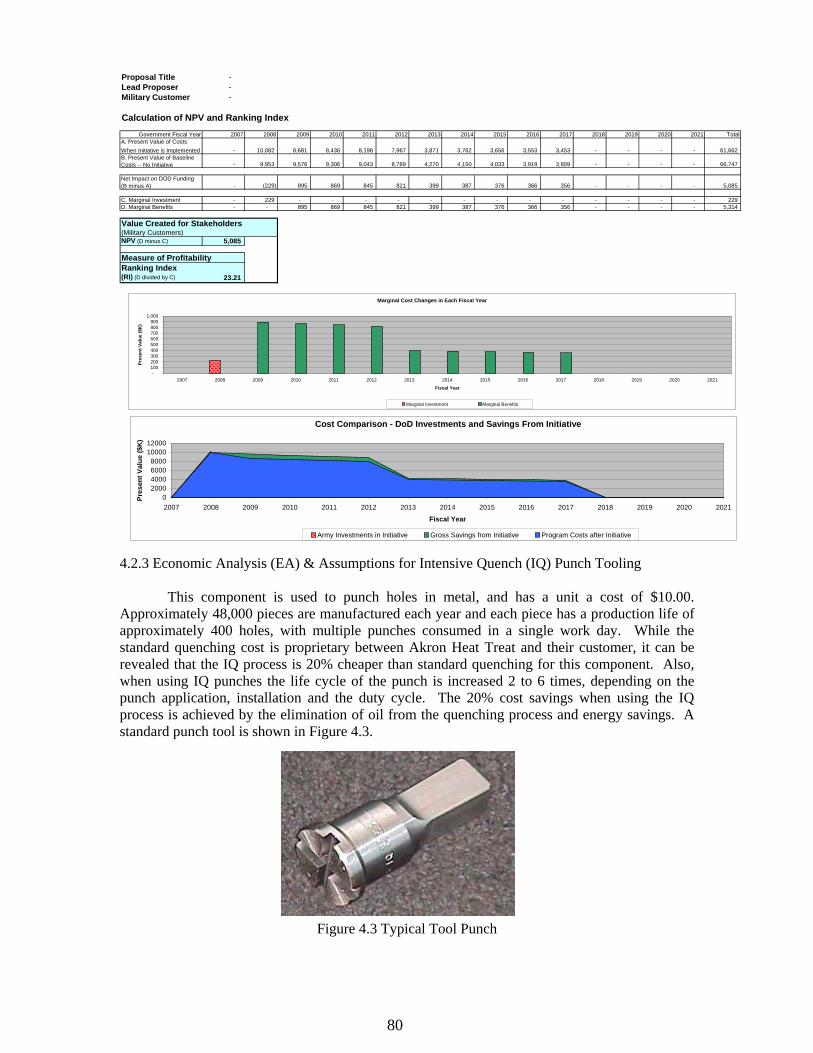
80
Proposal Title - Lead Proposer - Military Customer -
Calculation of NPV and Ranking IndexGovernment Fiscal Year 2007 2008 2009 2010 2011 2012 2013 2014 2015 2016 2017 2018 2019 2020 2021 Total
A. Present Value of Costs When Initiative is Implemented - 10,082 8,681 8,436 8,198 7,967 3,871 3,762 3,656 3,553 3,453 - - - - 61,662 B. Present Value of Baseline Costs -- No Initiative - 9,853 9,576 9,306 9,043 8,789 4,270 4,150 4,033 3,919 3,809 - - - - 66,747
Net Impact on DOD Funding (B minus A) - (229) 895 869 845 821 399 387 376 366 356 - - - - 5,085
C. Marginal Investment - 229 - - - - - - - - - - - - - 229 D. Marginal Benefits - - 895 869 845 821 399 387 376 366 356 - - - - 5,314
Value Created for Stakeholders(Military Customers)NPV (D minus C) 5,085
Measure of ProfitabilityRanking Index(RI) (D divided by C) 23.21
Marginal Cost Changes in Each Fiscal Year
-100200300400500600700800900
1,000
2007 2008 2009 2010 2011 2012 2013 2014 2015 2016 2017 2018 2019 2020 2021
Fiscal Year
Pres
ent V
alue
($K
)
Marginal Investment Marginal Benefits
Cost Comparison - DoD Investments and Savings From Initiative
02000400060008000
1000012000
2007 2008 2009 2010 2011 2012 2013 2014 2015 2016 2017 2018 2019 2020 2021
Fiscal Year
Pres
ent V
alue
($K
)
Army Investments in Initiative Gross Savings from Initiative Program Costs after Initiative
4.2.3 Economic Analysis (EA) & Assumptions for Intensive Quench (IQ) Punch Tooling
This component is used to punch holes in metal, and has a unit a cost of $10.00. Approximately 48,000 pieces are manufactured each year and each piece has a production life of approximately 400 holes, with multiple punches consumed in a single work day. While the standard quenching cost is proprietary between Akron Heat Treat and their customer, it can be revealed that the IQ process is 20% cheaper than standard quenching for this component. Also, when using IQ punches the life cycle of the punch is increased 2 to 6 times, depending on the punch application, installation and the duty cycle. The 20% cost savings when using the IQ process is achieved by the elimination of oil from the quenching process and energy savings. A standard punch tool is shown in Figure 4.3.
Figure 4.3 Typical Tool Punch
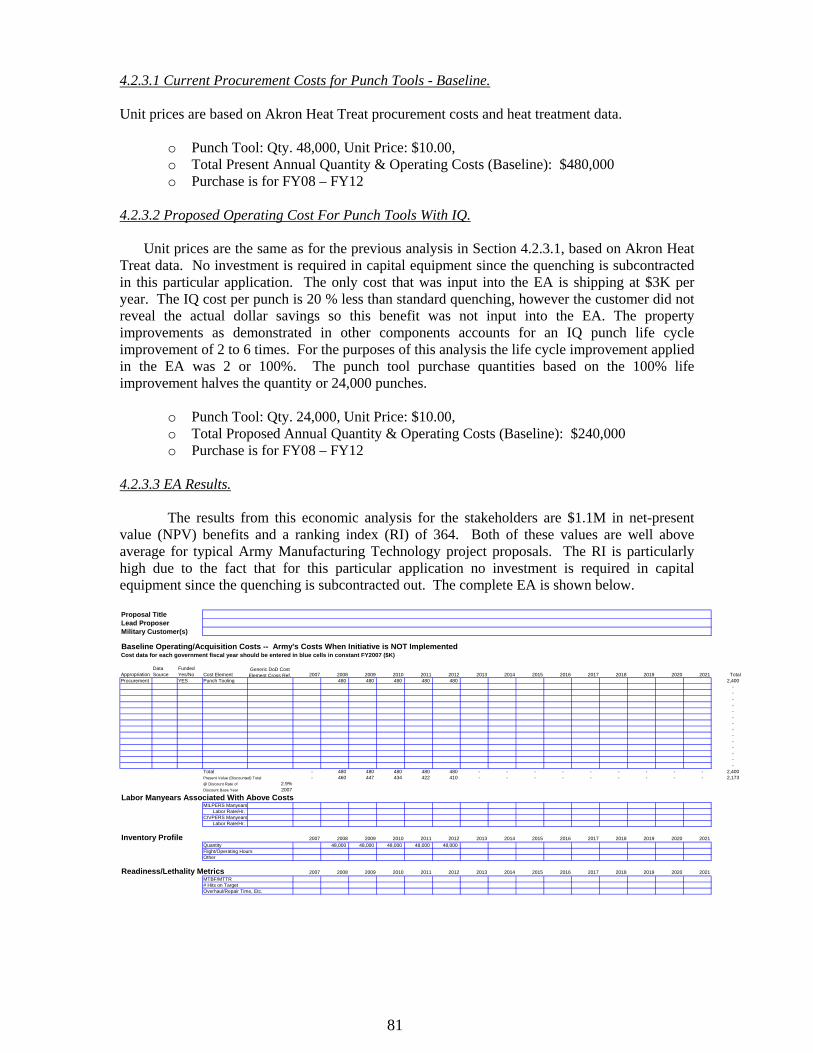
81
4.2.3.1 Current Procurement Costs for Punch Tools - Baseline. Unit prices are based on Akron Heat Treat procurement costs and heat treatment data.
o Punch Tool: Qty. 48,000, Unit Price: $10.00, o Total Present Annual Quantity & Operating Costs (Baseline): $480,000 o Purchase is for FY08 – FY12
4.2.3.2 Proposed Operating Cost For Punch Tools With IQ. Unit prices are the same as for the previous analysis in Section 4.2.3.1, based on Akron Heat Treat data. No investment is required in capital equipment since the quenching is subcontracted in this particular application. The only cost that was input into the EA is shipping at $3K per year. The IQ cost per punch is 20 % less than standard quenching, however the customer did not reveal the actual dollar savings so this benefit was not input into the EA. The property improvements as demonstrated in other components accounts for an IQ punch life cycle improvement of 2 to 6 times. For the purposes of this analysis the life cycle improvement applied in the EA was 2 or 100%. The punch tool purchase quantities based on the 100% life improvement halves the quantity or 24,000 punches.
o Punch Tool: Qty. 24,000, Unit Price: $10.00, o Total Proposed Annual Quantity & Operating Costs (Baseline): $240,000 o Purchase is for FY08 – FY12
4.2.3.3 EA Results.
The results from this economic analysis for the stakeholders are $1.1M in net-present value (NPV) benefits and a ranking index (RI) of 364. Both of these values are well above average for typical Army Manufacturing Technology project proposals. The RI is particularly high due to the fact that for this particular application no investment is required in capital equipment since the quenching is subcontracted out. The complete EA is shown below. Proposal TitleLead ProposerMilitary Customer(s)
Baseline Operating/Acquisition Costs -- Army's Costs When Initiative is NOT Implemented Cost data for each government fiscal year should be entered in blue cells in constant FY2007 ($K)
AppropriationData Source
Funded Yes/No Cost Element
Generic DoD Cost Element Cross Ref. 2007 2008 2009 2010 2011 2012 2013 2014 2015 2016 2017 2018 2019 2020 2021 Total
Procurement YES Punch Tooling 480 480 480 480 480 2,400 - - - - - - - - - - - - - -
Total - 480 480 480 480 480 - - - - - - - - - 2,400 Present Value (Discounted) Total - 460 447 434 422 410 - - - - - - - - - 2,173 @ Discount Rate of 2.9%Discount Base Year 2007
Labor Manyears Associated With Above CostsMILPERS Manyears Labor Rate/Hr.CIVPERS Manyears Labor Rate/Hr.
Inventory Profile 2007 2008 2009 2010 2011 2012 2013 2014 2015 2016 2017 2018 2019 2020 2021Quantity 48,000 48,000 48,000 48,000 48,000 Flight/Operating HoursOther
Readiness/Lethality Metrics 2007 2008 2009 2010 2011 2012 2013 2014 2015 2016 2017 2018 2019 2020 2021MTBF/MTTR# Hits on TargetOverhaul/Repair Time, Etc.
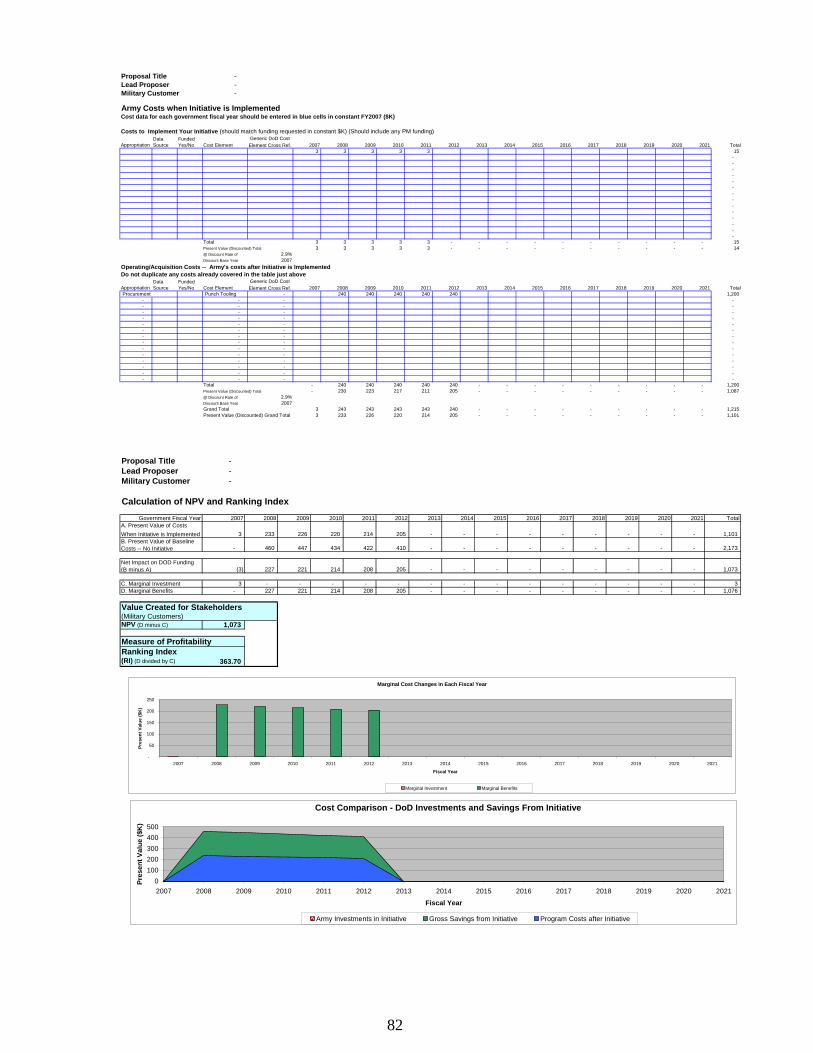
82
Proposal Title - Lead Proposer - Military Customer -
Army Costs when Initiative is ImplementedCost data for each government fiscal year should be entered in blue cells in constant FY2007 ($K)
Costs to Implement Your Initiative (should match funding requested in constant $K) (Should include any PM funding)
AppropriationData Source
Funded Yes/No Cost Element
Generic DoD Cost Element Cross Ref. 2007 2008 2009 2010 2011 2012 2013 2014 2015 2016 2017 2018 2019 2020 2021 Total
3 3 3 3 3 15 - - - - - - - - - - - - - -
Total 3 3 3 3 3 - - - - - - - - - - 15 Present Value (Discounted) Total 3 3 3 3 3 - - - - - - - - - - 14 @ Discount Rate of 2.9%Discount Base Year 2007
Operating/Acquisition Costs -- Army's costs after Initiative is ImplementedDo not duplicate any costs already covered in the table just above
AppropriationData Source
Funded Yes/No Cost Element
Generic DoD Cost Element Cross Ref. 2007 2008 2009 2010 2011 2012 2013 2014 2015 2016 2017 2018 2019 2020 2021 Total
Procurement Punch Tooling - 240 240 240 240 240 1,200 - - - - - - - - - - - - - - - - - - - - - - - - - - - - - - - - - - - - - - - - - - - - - - - - - - - - - - - -
Total - 240 240 240 240 240 - - - - - - - - - 1,200 Present Value (Discounted) Total - 230 223 217 211 205 - - - - - - - - - 1,087 @ Discount Rate of 2.9%Discount Base Year 2007Grand Total 3 243 243 243 243 240 - - - - - - - - - 1,215 Present Value (Discounted) Grand Total 3 233 226 220 214 205 - - - - - - - - - 1,101
Proposal Title - Lead Proposer - Military Customer -
Calculation of NPV and Ranking IndexGovernment Fiscal Year 2007 2008 2009 2010 2011 2012 2013 2014 2015 2016 2017 2018 2019 2020 2021 Total
A. Present Value of Costs When Initiative is Implemented 3 233 226 220 214 205 - - - - - - - - - 1,101 B. Present Value of Baseline Costs -- No Initiative - 460 447 434 422 410 - - - - - - - - - 2,173
Net Impact on DOD Funding (B minus A) (3) 227 221 214 208 205 - - - - - - - - - 1,073
C. Marginal Investment 3 - - - - - - - - - - - - - - 3 D. Marginal Benefits - 227 221 214 208 205 - - - - - - - - - 1,076
Value Created for Stakeholders(Military Customers)NPV (D minus C) 1,073
Measure of ProfitabilityRanking Index(RI) (D divided by C) 363.70
Marginal Cost Changes in Each Fiscal Year
-
50
100
150
200
250
2007 2008 2009 2010 2011 2012 2013 2014 2015 2016 2017 2018 2019 2020 2021
Fiscal Year
Pres
ent V
alue
($K
)
Marginal Investment Marginal Benefits
Cost Comparison - DoD Investments and Savings From Initiative
0100200300400500
2007 2008 2009 2010 2011 2012 2013 2014 2015 2016 2017 2018 2019 2020 2021
Fiscal Year
Pres
ent V
alue
($K
)
Army Investments in Initiative Gross Savings from Initiative Program Costs after Initiative
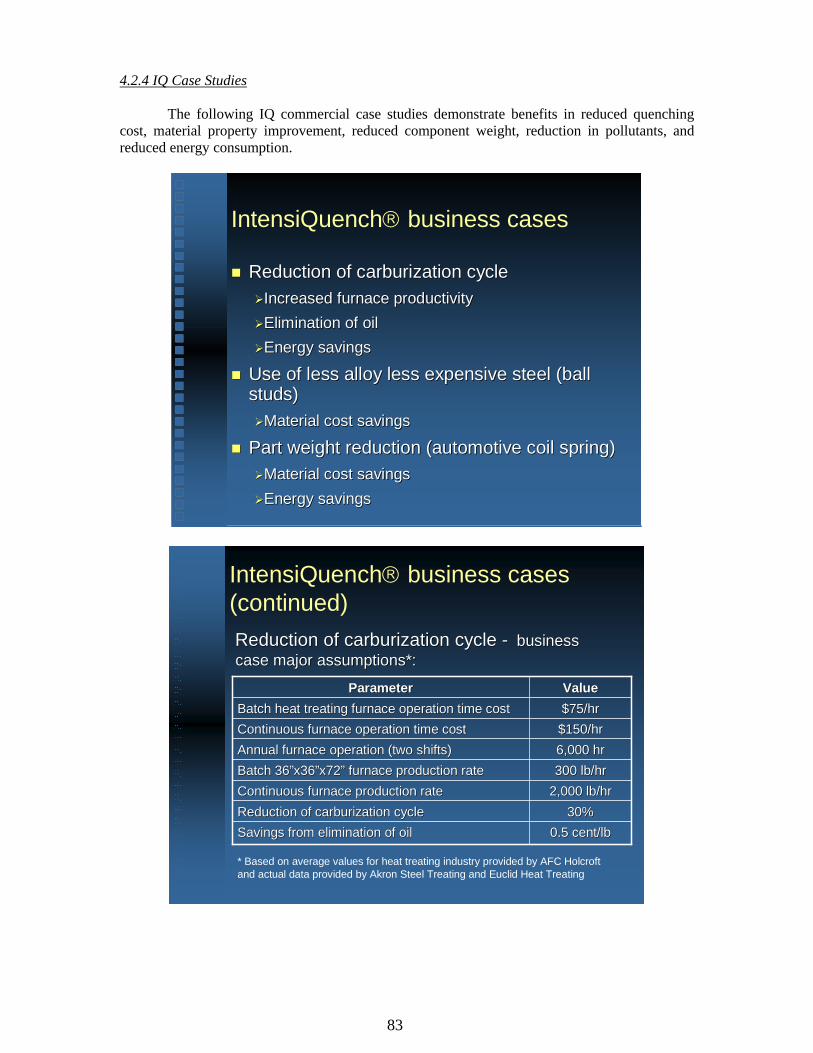
83
4.2.4 IQ Case Studies
The following IQ commercial case studies demonstrate benefits in reduced quenching cost, material property improvement, reduced component weight, reduction in pollutants, and reduced energy consumption.
IntensiQuench® business cases
Reduction of carburization cycleReduction of carburization cycleIncreased furnace productivityIncreased furnace productivityElimination of oilElimination of oilEnergy savingsEnergy savings
Use of less alloy less expensive steel (ball Use of less alloy less expensive steel (ball studs)studs)
Material cost savingsMaterial cost savings
Part weight reduction (automotive coil spring)Part weight reduction (automotive coil spring)Material cost savingsMaterial cost savingsEnergy savingsEnergy savings
IntensiQuench® business cases (continued)Reduction of carburization cycle Reduction of carburization cycle -- business business case major assumptions*:case major assumptions*:
6,000 hr6,000 hrAnnual furnace operation (two shifts)Annual furnace operation (two shifts)
0.5 cent/lb0.5 cent/lbSavings from elimination of oilSavings from elimination of oil
2,000 lb/hr2,000 lb/hrContinuous furnace production rateContinuous furnace production rate30%30%Reduction of carburization cycleReduction of carburization cycle
300 lb/hr300 lb/hrBatch 36Batch 36””x36x36””x72x72”” furnace production ratefurnace production rate
$150/hr$150/hrContinuous furnace operation time costContinuous furnace operation time cost$75/hr$75/hrBatch heat treating furnace operation time costBatch heat treating furnace operation time costValueValueParameterParameter
* Based on average values for heat treating industry provided by AFC Holcroft and actual data provided by Akron Steel Treating and Euclid Heat Treating
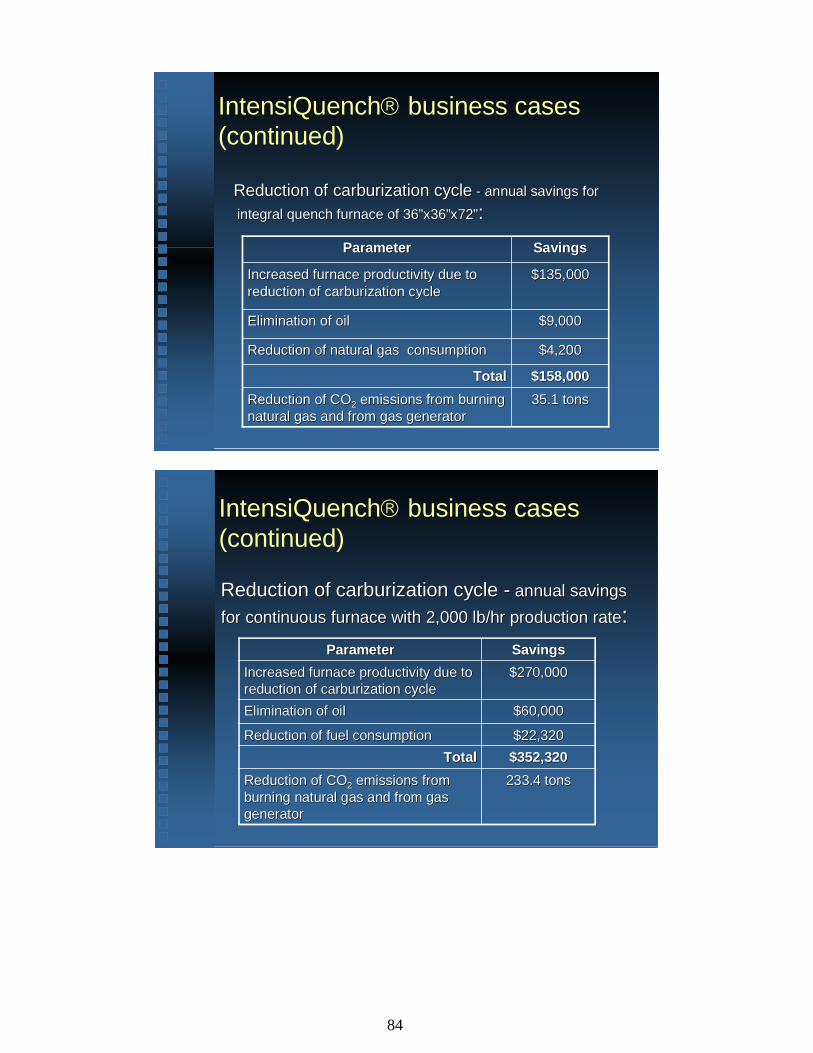
84
IntensiQuench® business cases (continued)
Reduction of carburization cycleReduction of carburization cycle -- annual savings for annual savings for
integral quench furnace of 36”x36”x72”integral quench furnace of 36”x36”x72”::
$158,000$158,000TotalTotal35.1 tons35.1 tons
$4,200$4,200
$9,000$9,000
$135,000$135,000
SavingsSavings
Reduction of COReduction of CO22 emissions from burning emissions from burning natural gas and from gas generatornatural gas and from gas generator
Reduction of natural gas consumptionReduction of natural gas consumption
Elimination of oilElimination of oil
Increased furnace productivity due to Increased furnace productivity due to reduction of carburization cyclereduction of carburization cycle
ParameterParameter
IntensiQuench® business cases (continued)
Reduction of carburization cycle Reduction of carburization cycle -- annual savings annual savings for continuous furnace with 2,000 lb/hr production ratefor continuous furnace with 2,000 lb/hr production rate::
$352,320$352,320TotalTotalReduction of COReduction of CO22 emissions from emissions from burning natural gas and from gas burning natural gas and from gas generatorgenerator
Reduction of fuel consumptionReduction of fuel consumption
Elimination of oilElimination of oil
Increased furnace productivity due to Increased furnace productivity due to reduction of carburization cyclereduction of carburization cycle
ParameterParameter
233.4 tons233.4 tons
$22,320$22,320
$60,000$60,000
$270,000$270,000SavingsSavings
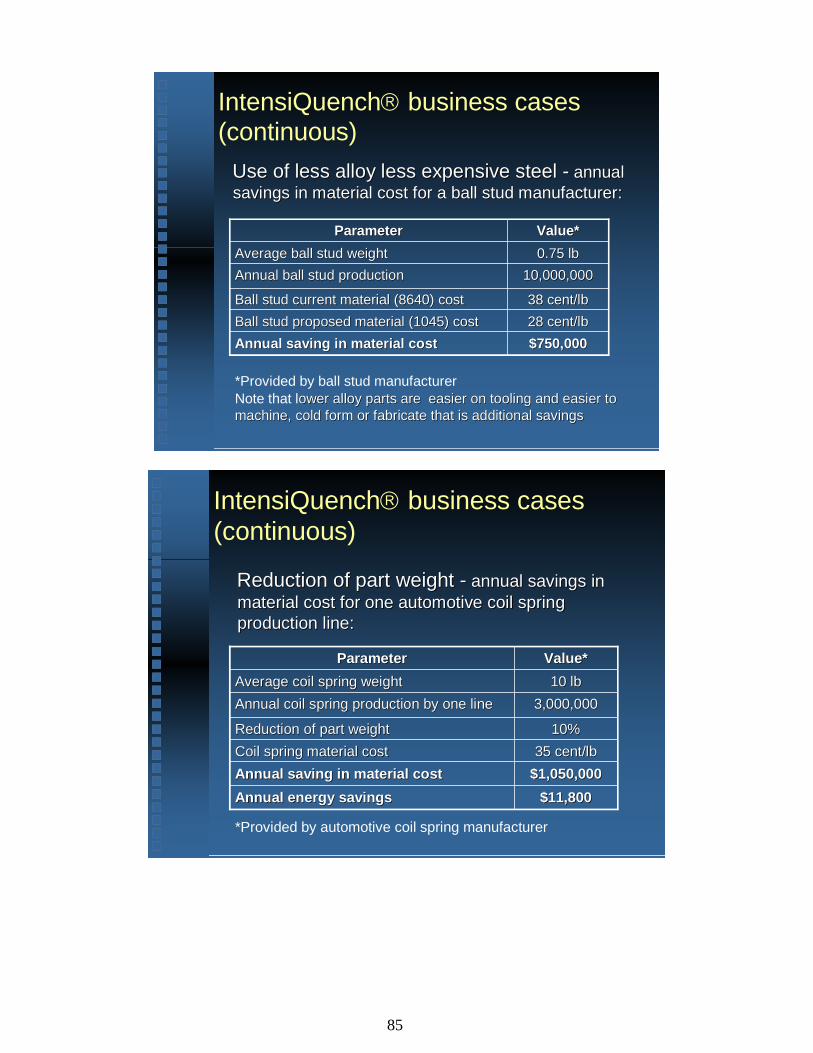
85
IntensiQuench® business cases (continuous)
Use of less alloy less expensive steel Use of less alloy less expensive steel -- annual annual savings in material cost for a ball stud manufacturer:savings in material cost for a ball stud manufacturer:
38 cent/lb38 cent/lbBall stud current material (8640) costBall stud current material (8640) cost
$750,000$750,000Annual saving in material costAnnual saving in material costBall stud proposed material (1045) costBall stud proposed material (1045) cost
Annual ball stud productionAnnual ball stud productionAverage ball stud weightAverage ball stud weight
ParameterParameter
28 cent/lb28 cent/lb
10,000,00010,000,0000.75 lb0.75 lbValue*Value*
*Provided by ball stud manufacturer Note that lower alloy parts are easier on tooling and easier to ower alloy parts are easier on tooling and easier to machine, cold form or fabricate that is additional savingsmachine, cold form or fabricate that is additional savings
IntensiQuench® business cases (continuous)
Reduction of part weight Reduction of part weight -- annual savings in annual savings in material cost for one automotive coil spring material cost for one automotive coil spring production line:production line:
10%10%Reduction of part weightReduction of part weight
$1,050,000$1,050,000Annual saving in material costAnnual saving in material cost$11,800$11,800Annual energy savingsAnnual energy savings
Coil spring material costCoil spring material cost
Annual coil spring production by one lineAnnual coil spring production by one lineAverage coil spring weightAverage coil spring weight
ParameterParameter
35 cent/lb35 cent/lb
3,000,0003,000,00010 lb10 lb
Value*Value*
*Provided by automotive coil spring manufacturer
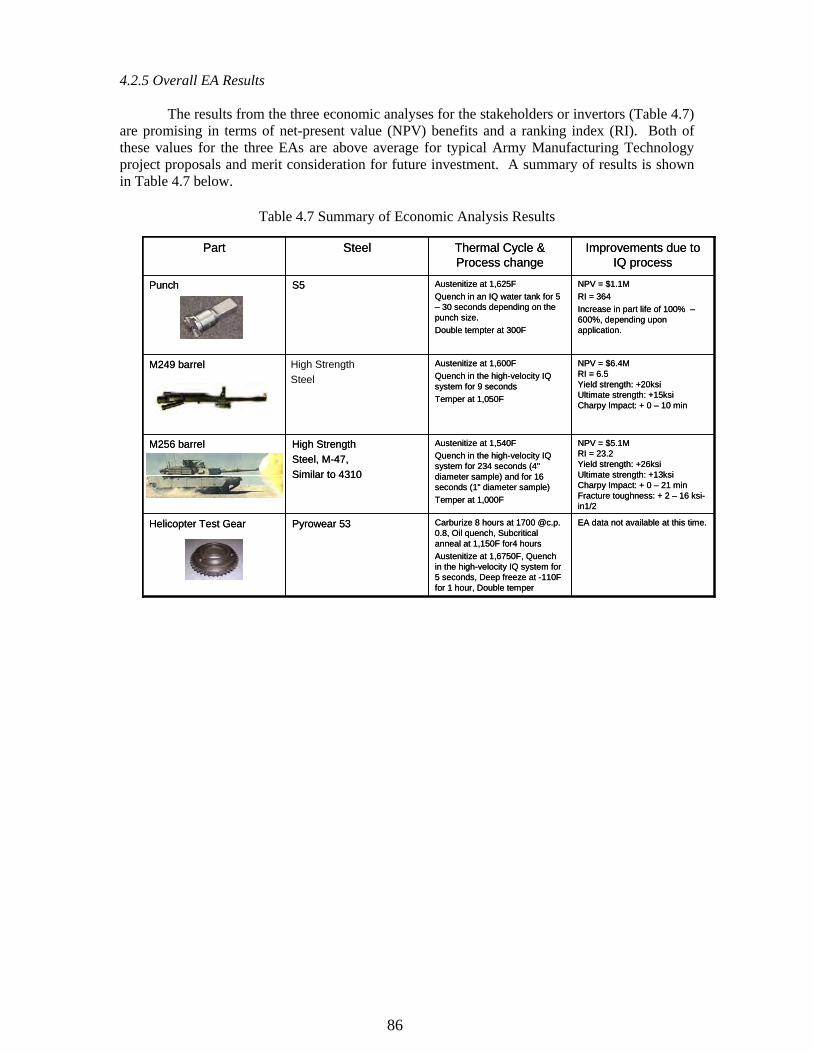
86
4.2.5 Overall EA Results
The results from the three economic analyses for the stakeholders or invertors (Table 4.7) are promising in terms of net-present value (NPV) benefits and a ranking index (RI). Both of these values for the three EAs are above average for typical Army Manufacturing Technology project proposals and merit consideration for future investment. A summary of results is shown in Table 4.7 below.
Table 4.7 Summary of Economic Analysis Results
EA data not available at this time.Carburize 8 hours at 1700 @c.p. 0.8, Oil quench, Subcriticalanneal at 1,150F for4 hoursAustenitize at 1,6750F, Quench in the high-velocity IQ system for 5 seconds, Deep freeze at -110F for 1 hour, Double temper
Pyrowear 53Helicopter Test Gear
NPV = $5.1MRI = 23.2Yield strength: +26ksiUltimate strength: +13ksiCharpy Impact: + 0 – 21 minFracture toughness: + 2 – 16 ksi-in1/2
Austenitize at 1,540FQuench in the high-velocity IQ system for 234 seconds (4" diameter sample) and for 16 seconds (1" diameter sample)Temper at 1,000F
High Strength Steel, M-47, Similar to 4310
M256 barrel
NPV = $6.4MRI = 6.5Yield strength: +20ksiUltimate strength: +15ksiCharpy Impact: + 0 – 10 min
Austenitize at 1,600FQuench in the high-velocity IQ system for 9 seconds Temper at 1,050F
M249 barrel
NPV = $1.1MRI = 364Increase in part life of 100% –600%, depending upon application.
Austenitize at 1,625FQuench in an IQ water tank for 5 – 30 seconds depending on the punch size.Double tempter at 300F
S5Punch
Improvements due to IQ process
Thermal Cycle & Process change
SteelPart
High Strength Steel
87
5. CONCLUSIONS AND RECOMMENDATIONS
Figure 5.1 presents a summary of the project objectives, project challenges, outcome and benefits to the Army. The goals stated for Phase 1 of the project have been accomplished. Namely, the project team completed the following work:
1. Upgrade of the IQ Technologies Inc high-velocity IQ system allowing the control and monitoring of the major IQ process parameter (water flow velocities, time, etc.).
2. Conducted material characterization study for four gun barrel steels: 4130 steel used for grenade launchers; M249 steel used for small caliber barrels for 7.62 mm machine guns; M256 steel used for large caliber barrels for the 120 mm Abrams tank cannon; and MTO (ultra high-strength steel) being currently evaluated by the Benet Lab for use in large caliber gun barrels for future combat systems. The following material mechanical properties after intensive quenching were evaluated and compared to the properties obtained from traditional quenching methods: tensile and yield strength, elongation, reduction in area, impact strength and fracture toughness.
3. Conducted heat treat process simulations for small caliber gun barrels using the DANTE computer program and demonstrated the potential for weight reduction in small caliber barrels up to 20-25% due to improved material strength and the presence of high residual surface compressive stresses after the IQ process.
4. Quenched intensively actual small caliber gun barrel blanks for further evaluation of the gun barrel service life improvement.
5. Developed quality control methodology for controlling the IQ process in production and introduces a method for assessing residual surface compressive stresses using Barkhausen magnetic flux measurement testing equipment.
6. Manufactured a set of standardized helicopter test gears made of Pyrowear-53 material; designed and fabricated fixtures for processing the test gears in the IQ Technologies Inc high-velocity IQ system; quenched intensively 24 test gears for further dynamic fatigue testing at the Gear Research Institute (the dynamic fatigue testing is still in progress due to a delay of the test gear final polishing required for dynamic fatigue testing. The results of the dynamic fatigue testing will be presented in an addendum to this report).
7. Developed conceptual designs for the following production IQ equipment: IQ unit for quenching large gun barrels; IQ system for quenching small caliber gun barrels; IQ unit for free quenching small helicopter gears, and IQ “smart” press quench unit for intensively quenching large helicopter gears.
8. Evaluated the implementation of the IQ system to other weapon system components : a. Four candidate components representing both military and commercial
applications were identified (two gun barrels, a helicopter gear and a punch used in a commercial production environment).
b. Each of the four selected components were analyzed using a matrix that qualitatively identified material improvements due to the IQ process, as well as quantitatively identified the cost savings associated with the process. Concurrently, the same components processed with standard quenching processes were studied, and a comparison made.
c. A matrix that shows overall cost net present value and ranking index over the life of each product was produced.
The following major conclusions are made based on the results obtained: 1. The upgraded IQ Technologies Inc high-velocity IQ system and developed quality
control methodology for controlling the IQ process allow the processing of a variety of steel parts with a precise control of the IQ process parameters. The upgraded IQ system will be used in Phase 2 and Phase 3 of the project for further demonstrations of the IQ process for various advanced weapon system components.
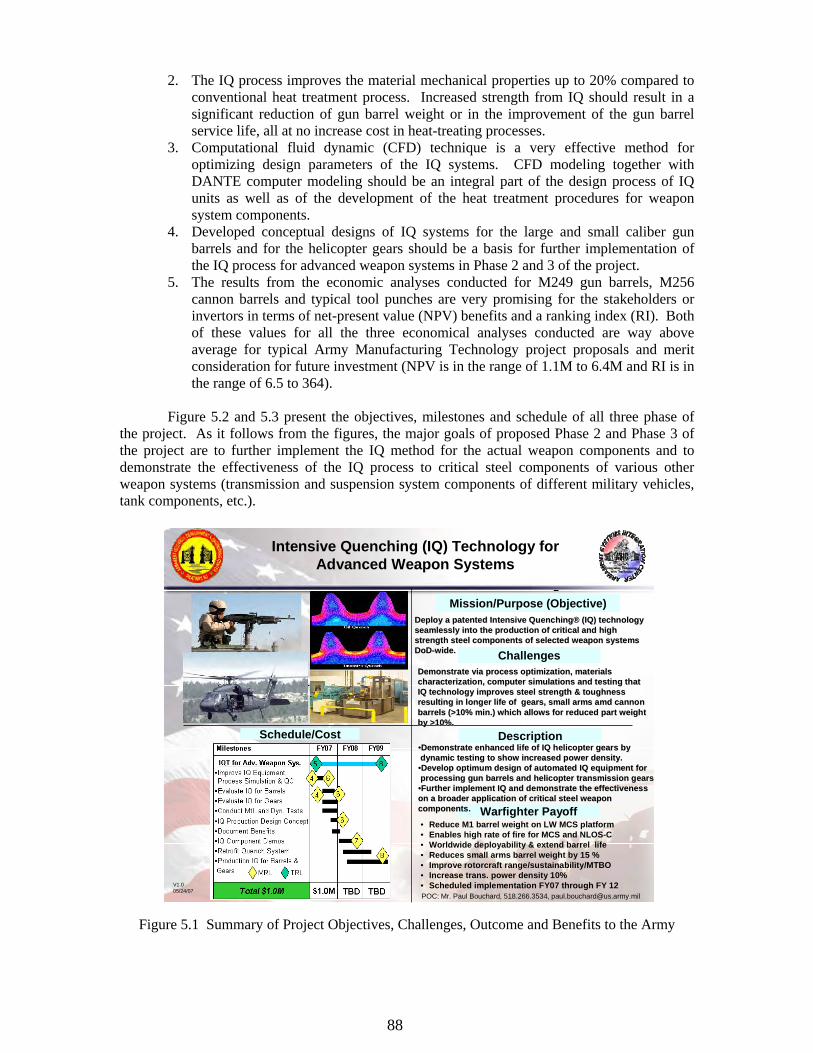
88
2. The IQ process improves the material mechanical properties up to 20% compared to conventional heat treatment process. Increased strength from IQ should result in a significant reduction of gun barrel weight or in the improvement of the gun barrel service life, all at no increase cost in heat-treating processes.
3. Computational fluid dynamic (CFD) technique is a very effective method for optimizing design parameters of the IQ systems. CFD modeling together with DANTE computer modeling should be an integral part of the design process of IQ units as well as of the development of the heat treatment procedures for weapon system components.
4. Developed conceptual designs of IQ systems for the large and small caliber gun barrels and for the helicopter gears should be a basis for further implementation of the IQ process for advanced weapon systems in Phase 2 and 3 of the project.
5. The results from the economic analyses conducted for M249 gun barrels, M256 cannon barrels and typical tool punches are very promising for the stakeholders or invertors in terms of net-present value (NPV) benefits and a ranking index (RI). Both of these values for all the three economical analyses conducted are way above average for typical Army Manufacturing Technology project proposals and merit consideration for future investment (NPV is in the range of 1.1M to 6.4M and RI is in the range of 6.5 to 364).
Figure 5.2 and 5.3 present the objectives, milestones and schedule of all three phase of
the project. As it follows from the figures, the major goals of proposed Phase 2 and Phase 3 of the project are to further implement the IQ method for the actual weapon components and to demonstrate the effectiveness of the IQ process to critical steel components of various other weapon systems (transmission and suspension system components of different military vehicles, tank components, etc.).
Figure 5.1 Summary of Project Objectives, Challenges, Outcome and Benefits to the Army
Click to edit Master title style
• Click to edit Master text styles– Second level
• Third level– Fourth level
» Fifth level
2
DescriptionSchedule/Cost
Mission/Purpose (Objective)
Challenges
Warfighter Payoff
POC: Mr. Paul Bouchard, 518.266.3534, [email protected]
Intensive Quenching (IQ) Technology for Advanced Weapon Systems
V1.005/24/07
• Reduce M1 barrel weight on LW MCS platform• Enables high rate of fire for MCS and NLOS-C• Worldwide deployability & extend barrel life• Reduces small arms barrel weight by 15 %• Improve rotorcraft range/sustainability/MTBO• Increase trans. power density 10%• Scheduled implementation FY07 through FY 12
••Demonstrate enhanced life of IQ helicopter gears by Demonstrate enhanced life of IQ helicopter gears by dynamic testing to show increased power density.dynamic testing to show increased power density.••Develop optimum design of automated IQ equipment for Develop optimum design of automated IQ equipment for processing gun barrels and helicopter transmission gearsprocessing gun barrels and helicopter transmission gears••Further implement IQ and demonstrate the effectiveness Further implement IQ and demonstrate the effectiveness on a broader application of critical steel weapon on a broader application of critical steel weapon components.components.
Demonstrate via process optimization, materials Demonstrate via process optimization, materials characterization, computer simulations and testing that characterization, computer simulations and testing that IQ technology improves steel strength & toughness IQ technology improves steel strength & toughness resulting in longer life of gears, small arms resulting in longer life of gears, small arms amdamd cannon cannon barrels (>10% min.) which allows for reduced part weight barrels (>10% min.) which allows for reduced part weight by >10%.by >10%.
Deploy a patented Intensive QuenchingDeploy a patented Intensive Quenching®® (IQ) technology (IQ) technology seamlessly into the production of critical and high seamlessly into the production of critical and high strength steel components of selected weapon systems strength steel components of selected weapon systems DoDDoD--wide.wide.
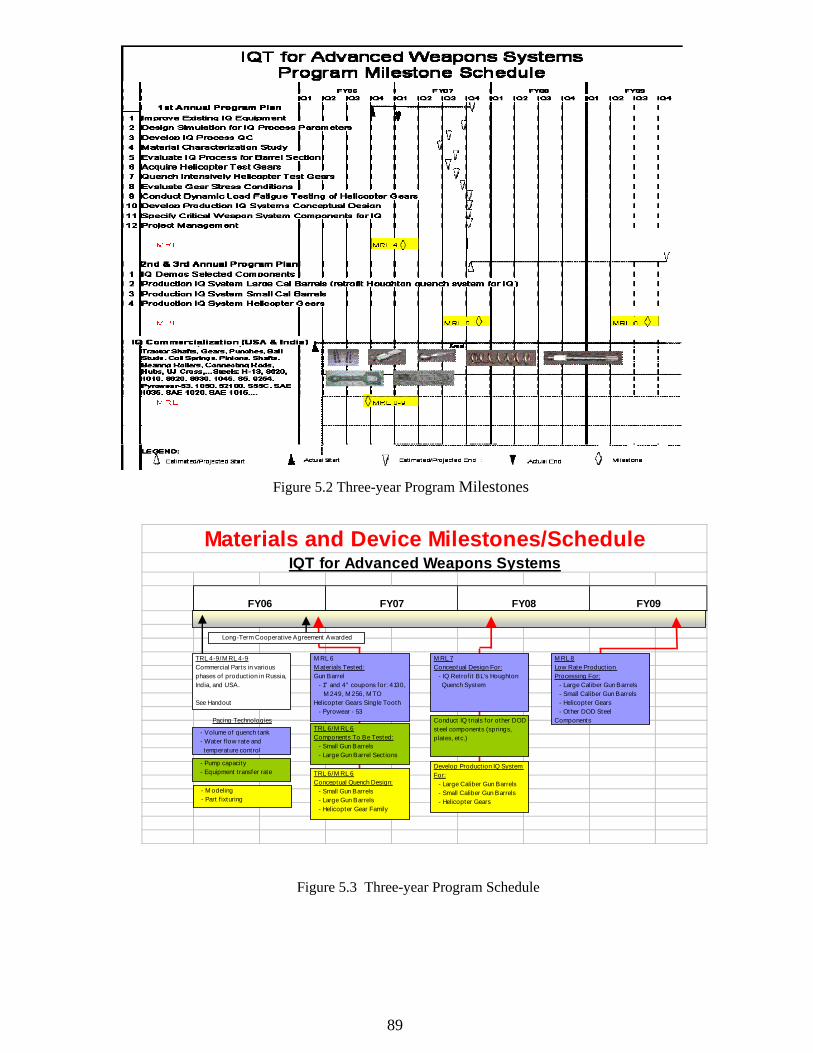
89
Figure 5.2 Three-year Program Milestones
Materials and Device Milestones/ScheduleIQT for Advanced Weapons Systems
FY06 FY07 FY08 FY09
M RL 6M aterials Tested:Gun Barrel - 1" and 4" coupons for: 4130, M 249, M 256, M TOHelicopter Gears Single Tooth - Pyrowear - 53
M RL 7Conceptual Design For: - IQ Retrof it BL's Houghton Quench System
- Volume of quench tank - Water f low rate and temperature control
- M odeling - Part f ixturing
TRL 6/M RL 6Components To Be Tested: - Small Gun Barrels - Large Gun Barrel Sect ions
TRL 6/M RL 6Conceptual Quench Design: - Small Gun Barrels - Large Gun Barrels - Helicopter Gear Family
Develop Product ion IQ System For: - Large Caliber Gun Barrels - Small Caliber Gun Barrels - Helicopter Gears
Conduct IQ trials for other DOD steel components (springs, plates, etc.)
- Pump capacity - Equipment transfer rate
M RL 8Low Rate Product ion Processing For: - Large Caliber Gun Barrels - Small Caliber Gun Barrels - Helicopter Gears - Other DOD Steel ComponentsPacing Technologies
Long-Term Cooperat ive Agreement Awarded
TRL 4-9/M RL 4-9Commercial Parts in various phases of product ion in Russia, India, and USA.
See Handout
Figure 5.3 Three-year Program Schedule
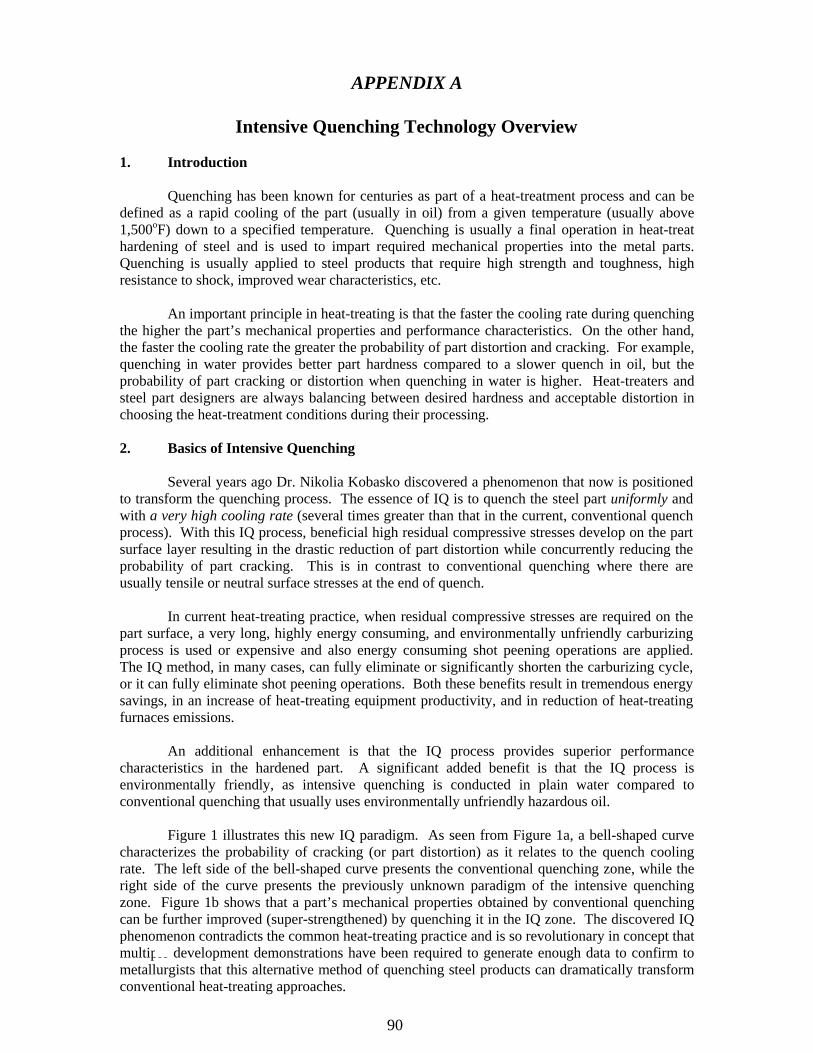
90
APPENDIX A
Intensive Quenching Technology Overview 1. Introduction
Quenching has been known for centuries as part of a heat-treatment process and can be defined as a rapid cooling of the part (usually in oil) from a given temperature (usually above 1,500oF) down to a specified temperature. Quenching is usually a final operation in heat-treat hardening of steel and is used to impart required mechanical properties into the metal parts. Quenching is usually applied to steel products that require high strength and toughness, high resistance to shock, improved wear characteristics, etc.
An important principle in heat-treating is that the faster the cooling rate during quenching the higher the part’s mechanical properties and performance characteristics. On the other hand, the faster the cooling rate the greater the probability of part distortion and cracking. For example, quenching in water provides better part hardness compared to a slower quench in oil, but the probability of part cracking or distortion when quenching in water is higher. Heat-treaters and steel part designers are always balancing between desired hardness and acceptable distortion in choosing the heat-treatment conditions during their processing. 2. Basics of Intensive Quenching
Several years ago Dr. Nikolia Kobasko discovered a phenomenon that now is positioned to transform the quenching process. The essence of IQ is to quench the steel part uniformly and with a very high cooling rate (several times greater than that in the current, conventional quench process). With this IQ process, beneficial high residual compressive stresses develop on the part surface layer resulting in the drastic reduction of part distortion while concurrently reducing the probability of part cracking. This is in contrast to conventional quenching where there are usually tensile or neutral surface stresses at the end of quench.
In current heat-treating practice, when residual compressive stresses are required on the part surface, a very long, highly energy consuming, and environmentally unfriendly carburizing process is used or expensive and also energy consuming shot peening operations are applied. The IQ method, in many cases, can fully eliminate or significantly shorten the carburizing cycle, or it can fully eliminate shot peening operations. Both these benefits result in tremendous energy savings, in an increase of heat-treating equipment productivity, and in reduction of heat-treating furnaces emissions.
An additional enhancement is that the IQ process provides superior performance characteristics in the hardened part. A significant added benefit is that the IQ process is environmentally friendly, as intensive quenching is conducted in plain water compared to conventional quenching that usually uses environmentally unfriendly hazardous oil.
Figure 1 illustrates this new IQ paradigm. As seen from Figure 1a, a bell-shaped curve characterizes the probability of cracking (or part distortion) as it relates to the quench cooling rate. The left side of the bell-shaped curve presents the conventional quenching zone, while the right side of the curve presents the previously unknown paradigm of the intensive quenching zone. Figure 1b shows that a part’s mechanical properties obtained by conventional quenching can be further improved (super-strengthened) by quenching it in the IQ zone. The discovered IQ phenomenon contradicts the common heat-treating practice and is so revolutionary in concept that multiple development demonstrations have been required to generate enough data to confirm to metallurgists that this alternative method of quenching steel products can dramatically transform conventional heat-treating approaches.
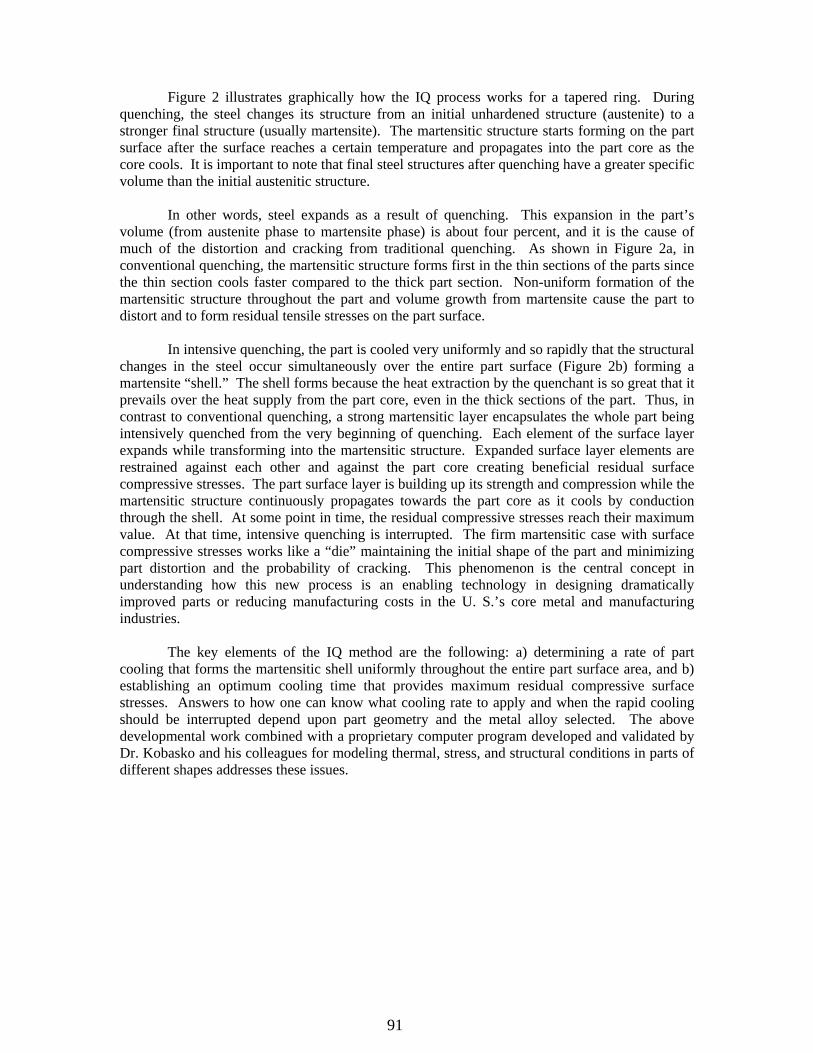
91
Figure 2 illustrates graphically how the IQ process works for a tapered ring. During
quenching, the steel changes its structure from an initial unhardened structure (austenite) to a stronger final structure (usually martensite). The martensitic structure starts forming on the part surface after the surface reaches a certain temperature and propagates into the part core as the core cools. It is important to note that final steel structures after quenching have a greater specific volume than the initial austenitic structure.
In other words, steel expands as a result of quenching. This expansion in the part’s volume (from austenite phase to martensite phase) is about four percent, and it is the cause of much of the distortion and cracking from traditional quenching. As shown in Figure 2a, in conventional quenching, the martensitic structure forms first in the thin sections of the parts since the thin section cools faster compared to the thick part section. Non-uniform formation of the martensitic structure throughout the part and volume growth from martensite cause the part to distort and to form residual tensile stresses on the part surface.
In intensive quenching, the part is cooled very uniformly and so rapidly that the structural changes in the steel occur simultaneously over the entire part surface (Figure 2b) forming a martensite “shell.” The shell forms because the heat extraction by the quenchant is so great that it prevails over the heat supply from the part core, even in the thick sections of the part. Thus, in contrast to conventional quenching, a strong martensitic layer encapsulates the whole part being intensively quenched from the very beginning of quenching. Each element of the surface layer expands while transforming into the martensitic structure. Expanded surface layer elements are restrained against each other and against the part core creating beneficial residual surface compressive stresses. The part surface layer is building up its strength and compression while the martensitic structure continuously propagates towards the part core as it cools by conduction through the shell. At some point in time, the residual compressive stresses reach their maximum value. At that time, intensive quenching is interrupted. The firm martensitic case with surface compressive stresses works like a “die” maintaining the initial shape of the part and minimizing part distortion and the probability of cracking. This phenomenon is the central concept in understanding how this new process is an enabling technology in designing dramatically improved parts or reducing manufacturing costs in the U. S.’s core metal and manufacturing industries.
The key elements of the IQ method are the following: a) determining a rate of part cooling that forms the martensitic shell uniformly throughout the entire part surface area, and b) establishing an optimum cooling time that provides maximum residual compressive surface stresses. Answers to how one can know what cooling rate to apply and when the rapid cooling should be interrupted depend upon part geometry and the metal alloy selected. The above developmental work combined with a proprietary computer program developed and validated by Dr. Kobasko and his colleagues for modeling thermal, stress, and structural conditions in parts of different shapes addresses these issues.
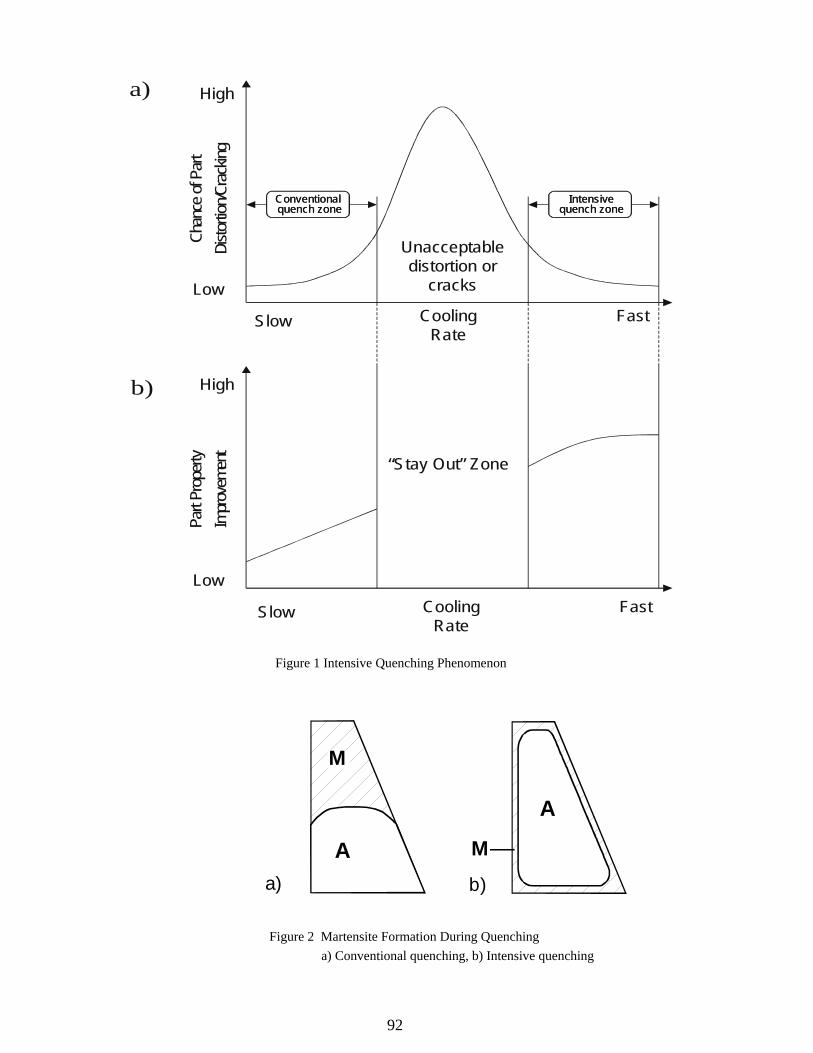
92
CoolingRate
FastSlow
CoolingRate
FastSlow
“Stay Out” Zone
Unacceptabledistortion or
cracksLow
High
Low
High
a)
b)
Conventional quench zone
Intensivequench zone
Conventional quench zone
Intensivequench zone
Chan
ceof
Part
Disto
rtion/C
rack
ingPa
rtPr
oper
tyIm
prov
emen
t
Figure 1 Intensive Quenching Phenomenon
Figure 2 Martensite Formation During Quenching a) Conventional quenching, b) Intensive quenching
A
M
a)
A
M
b)
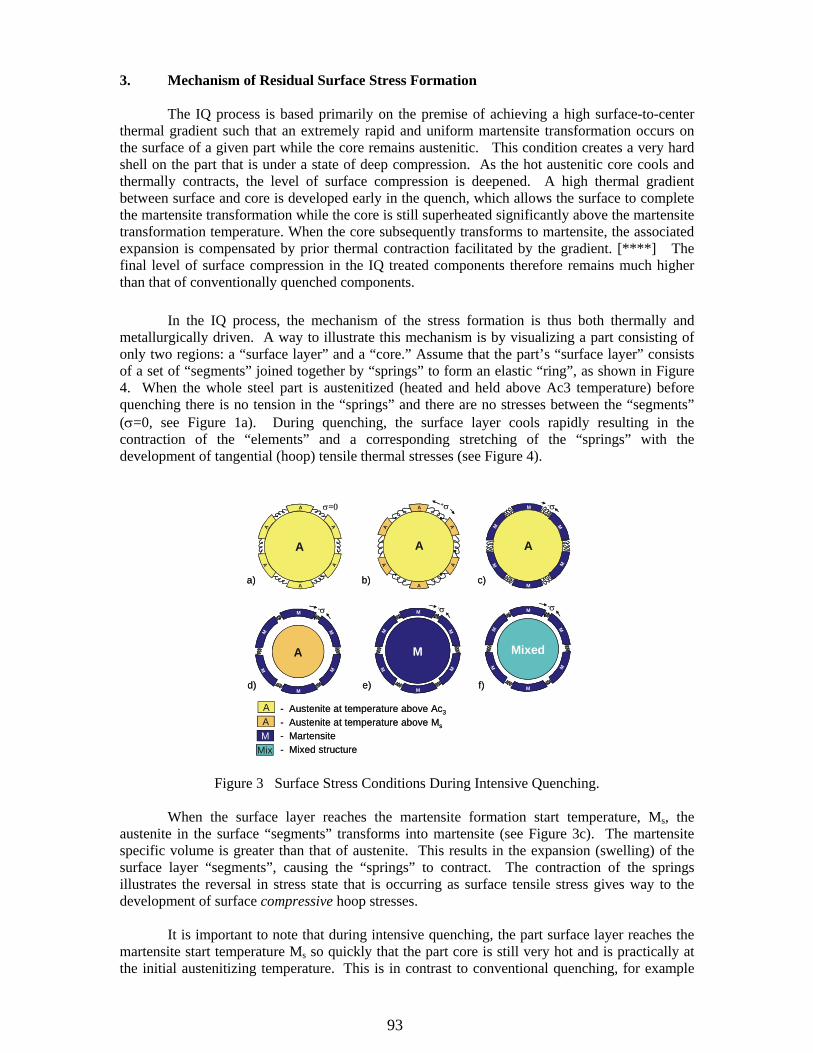
93
3. Mechanism of Residual Surface Stress Formation
The IQ process is based primarily on the premise of achieving a high surface-to-center thermal gradient such that an extremely rapid and uniform martensite transformation occurs on the surface of a given part while the core remains austenitic. This condition creates a very hard shell on the part that is under a state of deep compression. As the hot austenitic core cools and thermally contracts, the level of surface compression is deepened. A high thermal gradient between surface and core is developed early in the quench, which allows the surface to complete the martensite transformation while the core is still superheated significantly above the martensite transformation temperature. When the core subsequently transforms to martensite, the associated expansion is compensated by prior thermal contraction facilitated by the gradient. [****] The final level of surface compression in the IQ treated components therefore remains much higher than that of conventionally quenched components.
In the IQ process, the mechanism of the stress formation is thus both thermally and
metallurgically driven. A way to illustrate this mechanism is by visualizing a part consisting of only two regions: a “surface layer” and a “core.” Assume that the part’s “surface layer” consists of a set of “segments” joined together by “springs” to form an elastic “ring”, as shown in Figure 4. When the whole steel part is austenitized (heated and held above Ac3 temperature) before quenching there is no tension in the “springs” and there are no stresses between the “segments” (σ=0, see Figure 1a). During quenching, the surface layer cools rapidly resulting in the contraction of the “elements” and a corresponding stretching of the “springs” with the development of tangential (hoop) tensile thermal stresses (see Figure 4).
A
A
A
AA
AA
A
A
A
AA
A
A
σσ=0=0 ++σσ
A
M
M
MM
MM
--σσ
M
M
M
MM
MM
--σσ
Mixed
M
M
MM
MM
--σσ
a) b) c)
d) e) f)
AAM
Mix
- Austenite at temperature above Ac3
- Austenite at temperature above Ms
- Martensite- Mixed structure
A
M
--σσM
M
M M
M
A
A
A
AA
AA
A
A
A
AA
A
A
σσ=0=0 ++σσ
A
M
M
MM
MM
--σσ
M
M
M
MM
MM
--σσ
Mixed
M
M
MM
MM
--σσ
a) b) c)
d) e) f)
AAM
Mix
- Austenite at temperature above Ac3
- Austenite at temperature above Ms
- Martensite- Mixed structure
A
M
--σσM
M
M M
M
Figure 3 Surface Stress Conditions During Intensive Quenching.
When the surface layer reaches the martensite formation start temperature, Ms, the austenite in the surface “segments” transforms into martensite (see Figure 3c). The martensite specific volume is greater than that of austenite. This results in the expansion (swelling) of the surface layer “segments”, causing the “springs” to contract. The contraction of the springs illustrates the reversal in stress state that is occurring as surface tensile stress gives way to the development of surface compressive hoop stresses.
It is important to note that during intensive quenching, the part surface layer reaches the martensite start temperature Ms so quickly that the part core is still very hot and is practically at the initial austenitizing temperature. This is in contrast to conventional quenching, for example
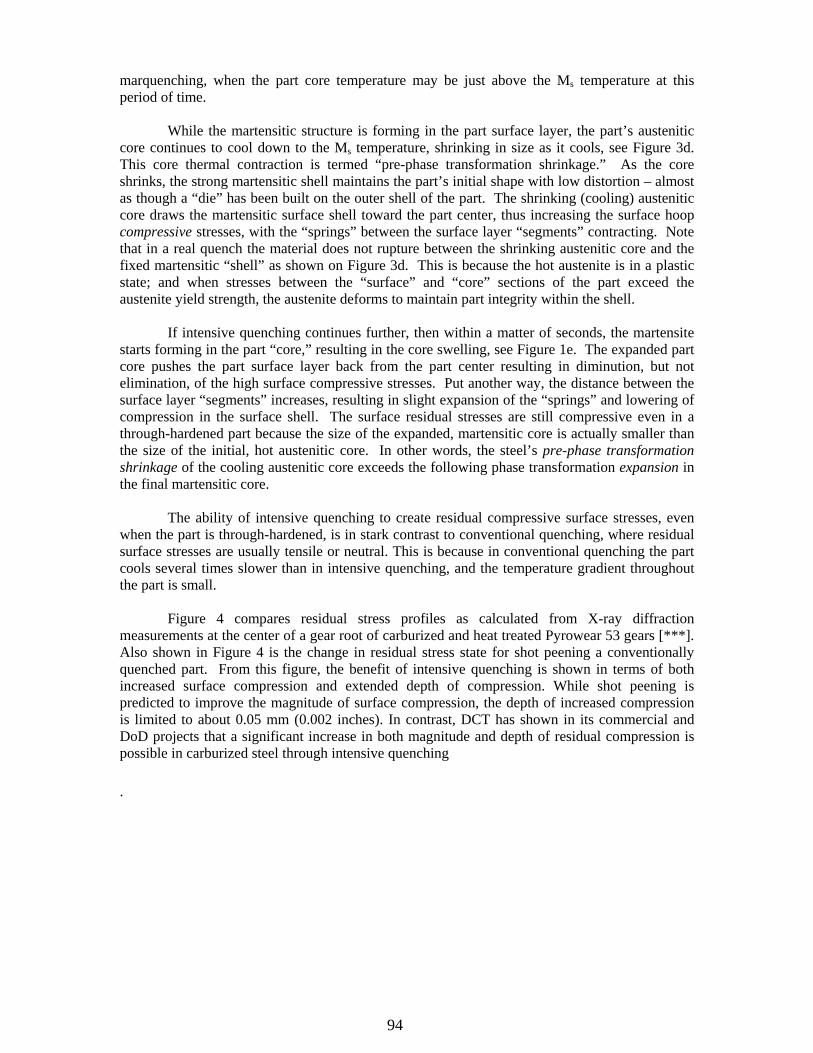
94
marquenching, when the part core temperature may be just above the Ms temperature at this period of time.
While the martensitic structure is forming in the part surface layer, the part’s austenitic core continues to cool down to the Ms temperature, shrinking in size as it cools, see Figure 3d. This core thermal contraction is termed “pre-phase transformation shrinkage.” As the core shrinks, the strong martensitic shell maintains the part’s initial shape with low distortion – almost as though a “die” has been built on the outer shell of the part. The shrinking (cooling) austenitic core draws the martensitic surface shell toward the part center, thus increasing the surface hoop compressive stresses, with the “springs” between the surface layer “segments” contracting. Note that in a real quench the material does not rupture between the shrinking austenitic core and the fixed martensitic “shell” as shown on Figure 3d. This is because the hot austenite is in a plastic state; and when stresses between the “surface” and “core” sections of the part exceed the austenite yield strength, the austenite deforms to maintain part integrity within the shell.
If intensive quenching continues further, then within a matter of seconds, the martensite starts forming in the part “core,” resulting in the core swelling, see Figure 1e. The expanded part core pushes the part surface layer back from the part center resulting in diminution, but not elimination, of the high surface compressive stresses. Put another way, the distance between the surface layer “segments” increases, resulting in slight expansion of the “springs” and lowering of compression in the surface shell. The surface residual stresses are still compressive even in a through-hardened part because the size of the expanded, martensitic core is actually smaller than the size of the initial, hot austenitic core. In other words, the steel’s pre-phase transformation shrinkage of the cooling austenitic core exceeds the following phase transformation expansion in the final martensitic core.
The ability of intensive quenching to create residual compressive surface stresses, even
when the part is through-hardened, is in stark contrast to conventional quenching, where residual surface stresses are usually tensile or neutral. This is because in conventional quenching the part cools several times slower than in intensive quenching, and the temperature gradient throughout the part is small.
Figure 4 compares residual stress profiles as calculated from X-ray diffraction measurements at the center of a gear root of carburized and heat treated Pyrowear 53 gears [***]. Also shown in Figure 4 is the change in residual stress state for shot peening a conventionally quenched part. From this figure, the benefit of intensive quenching is shown in terms of both increased surface compression and extended depth of compression. While shot peening is predicted to improve the magnitude of surface compression, the depth of increased compression is limited to about 0.05 mm (0.002 inches). In contrast, DCT has shown in its commercial and DoD projects that a significant increase in both magnitude and depth of residual compression is possible in carburized steel through intensive quenching
.
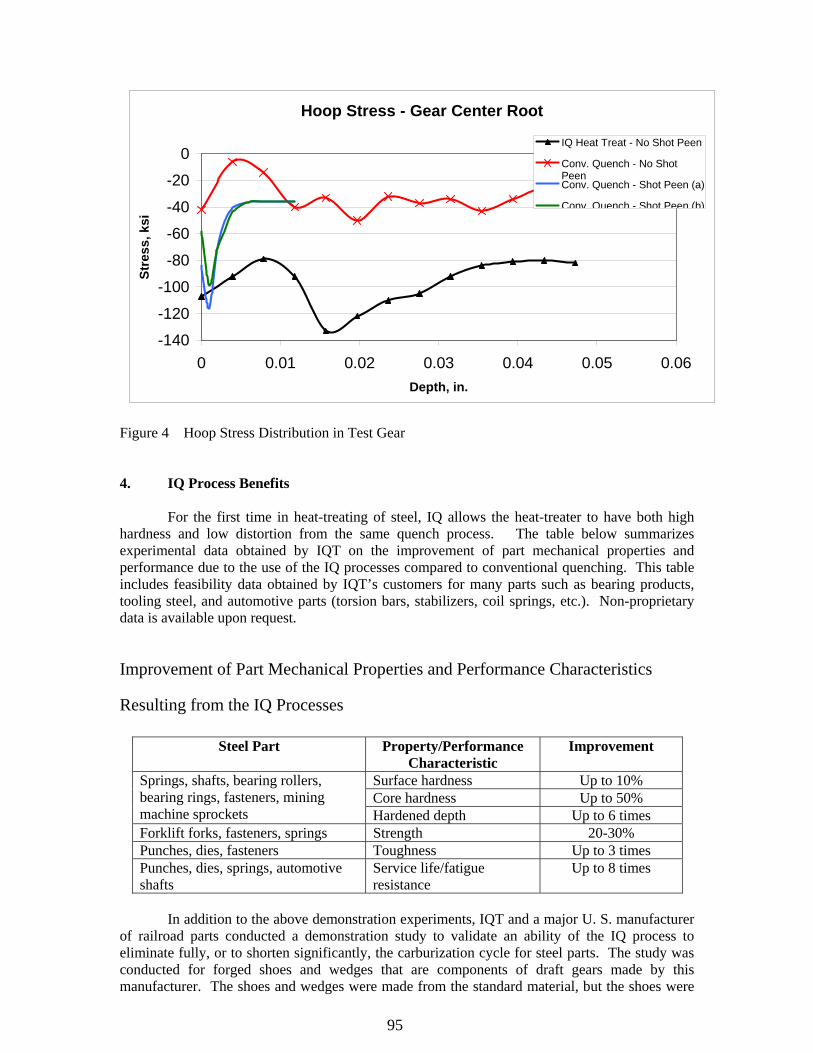
95
Figure 4 Hoop Stress Distribution in Test Gear 4. IQ Process Benefits
For the first time in heat-treating of steel, IQ allows the heat-treater to have both high hardness and low distortion from the same quench process. The table below summarizes experimental data obtained by IQT on the improvement of part mechanical properties and performance due to the use of the IQ processes compared to conventional quenching. This table includes feasibility data obtained by IQT’s customers for many parts such as bearing products, tooling steel, and automotive parts (torsion bars, stabilizers, coil springs, etc.). Non-proprietary data is available upon request.
Improvement of Part Mechanical Properties and Performance Characteristics
Resulting from the IQ Processes
Steel Part Property/Performance Characteristic
Improvement
Surface hardness Up to 10% Core hardness Up to 50%
Springs, shafts, bearing rollers, bearing rings, fasteners, mining machine sprockets Hardened depth Up to 6 times Forklift forks, fasteners, springs Strength 20-30% Punches, dies, fasteners Toughness Up to 3 times Punches, dies, springs, automotive shafts
Service life/fatigue resistance
Up to 8 times
In addition to the above demonstration experiments, IQT and a major U. S. manufacturer
of railroad parts conducted a demonstration study to validate an ability of the IQ process to eliminate fully, or to shorten significantly, the carburization cycle for steel parts. The study was conducted for forged shoes and wedges that are components of draft gears made by this manufacturer. The shoes and wedges were made from the standard material, but the shoes were
Hoop Stress - Gear Center Root
-140
-120
-100
-80
-60
-40
-20
0
0 0.01 0.02 0.03 0.04 0.05 0.06Depth, in.
Stre
ss, k
siIQ Heat Treat - No Shot Peen
Conv. Quench - No ShotPeenConv. Quench - Shot Peen (a)
Conv Quench - Shot Peen (b)
96
not carburized at all while the wedges were carburized to a half of their standard case depth. The results of the load and fatigue tests performed by the customer showed that the performance characteristics of the intensively quenched non-carburized shoes and partially carburized wedges were the same or better than the performance characteristics of the carburized shoes and wedges that were conventionally quenched.
IQT’s experiences show that the process can be effectively applied to steel parts right after forging operations are completed using the part residual heat. The studies showed that, in this application, the IQ method not only saves energy, but also improves part mechanical properties.
The IQ technology provides the following benefits:
o Reduced energy consumption in heat-treating and forging operations o Higher production rates of heating and quenching equipment, shorter cycle times, and
reduced lead times o Reduced part distortion and less post-heat-treat processing o Cleaner and safer working environment; reduced hazardous waste generation in heat-
treating operations (no oil) o Improved market competitiveness for USA’s equipment manufacturers, part
suppliers, and heat- treaters o Products with improved quality and performance characteristics (better metal
hardness, strength, wear resistance, and service life, lighter but yet stronger product, etc.)
References 1. Aronov, M. A., Kobasko, N. I., Powell, J.A., Wallace, and J. F., Schwam, D., “Experimental
Validation of The Intensive Quenching Technology for Steel Parts”, Proceedings of The 18th ASM Heat Treating Conference, Chicago, Illinois, 1998.
2. Aronov, M. A., Kobasko, N. I., Powell, J.A., Wallace, et al., “Experimental Study of Intensive Quenching of Punches”, Proceedings of 19th ASM Heat Treating Conference, Cincinnati, Ohio, 1999.
3. Aronov, M.A., Kobasko, N.I., Powell, J.A., John Young, ”Practical Application of Intensive Quenching Technology for Steel Parts and Real Time Quench Tank Mapping”, Proceedings of 19th ASM Heat Treating Conference, Cincinnati, Ohio, 1999.
4. Aronov, M.A., Kobasko, N.I., Powell, J.A., “Practical Application of Intensive Quenching Process for Steel Parts”, Proceedings of 20th ASM Heat Treating Conference, St. Louse, Missouri, 2000.
5. Kobasko, N.I., “Three Types of Intensive Water Quenching and Their Future Applications”, Proceedings of 20th ASM Heat Treating Conference, St. Louse, Missouri, 2000.
6. Aronov, M.A., Kobasko, N.I., Powell, J.A., “Practical Application of Intensive Quenching Process for Steel Parts”, Proceedings of 12th IFHTSE Congress, Melbourne, Australia, November 2000.
7. Aronov, M.A., Kobasko, N.I., Powell, J.A., “Application of Intensive Quenching Methods for Steel Parts”, Proceedings of 21st ASM Heat Treating Conference, Indianapolis, Indiana, November 2001.
8. Aronov, M.A., Kobasko, N.I., Powell, J.A., “Basic Principals, Properties and Metallurgy of Intensive Quenching”, Proceedings of SAE Heat Treating Conference, Las Vegas, Nevada, 2002.
9. Aronov, M.A., Kobasko, N.I., Powell, J.A., “Application of Intensive Quenching Technology for Steel Parts”, Proceedings of SAE Heat Treating Conference, Las Vegas, Nevada, 2002.

97
10. Ferguson, B.L., Freborg, A.M., Petrus, G.J., “Comparison of Quenching Processes for Hardening a Coil Spring”, Presentation to SAE Heat Treating Conference, Las Vegas, Nevada, 2002.
11. Aronov, M.A., Kobasko, N.I., Powell, J.A., “Basic Principals and Metallurgy of Intensive Quenching Methods”, Proceedings of 13th IFHTSE Congress, Columbus, Ohio, October 2002.
12. Aronov, M.A., Kobasko, N.I., Powell, J.A., “Review of Practical Application of Intensive Quenching Methods for Steel Parts”, Proceedings of 13th IFHTSE Congress, Columbus, Ohio, October 2002.
13. Aronov, M.A., Kobasko, N.I., Powell, J.A., “Intensive Quenching Technology for Tool Steels”, Proceedings of 13th IFHTSE Congress, Columbus, Ohio, October 2002.
14. Aronov, M.A., Kobasko, N.I., Powell, J.A., Lipnicki, D.V., “Peculiarity of Intensive Quenching Processes and Equipment”, Proceedings of 13th IFHTSE Congress, Columbus, Ohio, October 2002.
15. Freborg, A.M., Ferguson, B.L., Aronov, M.A., Kobasko, N.I., Powell, “Intensive Quenching Theory and Application for Imparting High Residual Surface Compressive Stresses in Pressure Vessel Components”, Journal of Pressure Vessels Technology, ASME, May 2003
16. Aronov, M.A., Kobasko, N.I., Powell, J.A., Pratap Ghorpade, D. Gopal, “Application of Intensive Quenching Processes for Carburized Parts”, Proceedings of 22nd ASM Heat Treating Conference, Indianapolis, Indiana, 2003.
17. Lipniki, D.V., “Production Intensive Quenching System”, Presentation to 22nd ASM Heat Treating Conference, Indianapolis, Indiana, 2003.
18. Aronov, M. A., Kobasko, N. I., Powell, J.A., Wallace, and Zhu, Y., “Effect of Intensive Quenching on Mechanical Properties of Carbon and Alloy Steels”, Proceedings of The 23rd ASM Heat Treating Conference, Pittsburgh, Pennsylvania, 2005.
19. Hubbard, C.R., Tang, F., Aronov, M. A., Kobasko, N. I., Powell, Ferguson, B.L., “effect of Intensive Quenching on Residual Stress”, Proceedings of The 23rd ASM Heat Treating Conference, Pittsburgh, Pennsylvania, 2005.
20. Freborg, A.M., Ferguson, B.L., Li, Z., Schaw, D., “Improving the Bending Fatigue Strength of Carburized Gears”, Proceedings of The 23rd ASM Heat Treating Conference, Pittsburgh, Pennsylvania, 2005.
98
APPENDIX B
Computational Fluid Dynamic and Heat Transfer Analysis for Optimizing IQ System Designs
Overview
The intensive quenching process is predicated on achieving a certain degree of heat transfer on the surface of the parts to be quenched. In addition, the heat flux rates need to be sufficiently uniform to avoid internal stresses that may result in distortion of, in extreme cases, cracking.
The heat transfer rate that will be obtained is highly dependent on the velocity distribution of water flowing past the surface of the part. While it may be possible to obtain the desired level and uniformity of heat flux for simple shapes, that process becomes daunting for more complex shapes.
Computational Fluid Dynamics (CFD) offers a way of determining the heat flux rates that will result from a given intensive quenching fixture design. If that fixture design does not provide the required heat flux rates, CFD provides the insight to develop improvements and verify their performance prior to fabrication.
CFD methods were applied to both gun barrel quenching systems and the quenching of individual helicopter gears. For the gun barrels, the focus was on providing sufficient and uniform heat flux rates on the outside of the barrel. The less critical inside of the barrel will be quenched by pumping water through the barrel. The outside of the gun barrel will be quenched by a series of water jets emanating from manifolds and impinging on the surface of the barrel. CFD design work was performed to:
o Ensure that the exit water flow did not deflect the jets o Optimize the spacing of the jets and the distance from the manifold to the barrel
surface o Ensure that good performance would be achieved for the range of gun barrels to be
processed.
The CFD design work that was performed indicated that the initial quench system design would not achieve the quenching goals, due primarily to the large spacing between the fixed manifolds and the surface of the barrels. That led to the development of a system of moveable manifolds that would provide near optimal spacing for the range of barrels to be quenched. A combination of staggered jet spacing and rotation of the gun barrel provides very uniform heat flux rates.
CFD analysis of gear quenching focused on the development of quenching fixtures that would provide the desired heat flux rates and uniformity while operating within the capabilities of the existing IQ system. Most of this design work was performed for conditions that exist near the start of the quench, when the part is hottest, under steady state conditions.
Since it was suspected that the uniformity of heat flux might vary through the duration of the quench cycle, the ability to provide full transient results was also desired. Since the computational resources needed to perform a transient simulation with sufficient resolution are excessive, a method was developed in which the transient behavior can be predicted from two steady-state simulations.
99
1. Gun Barrel Quenching System
CFD was utilized for the evaluation of various manifold configurations. CFD modeling allowed for the analysis of several designs in a relatively short period of time. The optimal manifold geometry was based on the typical barrel and modeled with the large and small barrels to verify performance. Design goals focused on maximizing barrel heat transfer uniformity while minimizing the amount of water used during the quench process.
A full model of the typical barrel was created to determine if a smaller subsection could be simulated. Figure B.1 shows an overview of this model. Model outlet surfaces are colored red and model inlets are blue. Each manifold is divided by the outlet surfaces into nine sections. Actual geometry of the holes in the manifolds was not included for this initial model due to the required resolution. Instead, flow entered the domain through the entire inlet surface area. The inlet velocity was scaled so as to attain the correct mass flow rate.
Figures B.2 and B.3 show the vertical velocity component through various planes in the model. In general, there is no strong tendency for the water to flow vertically along the barrel. This indicated that a subsection of the full domain could be simulated with the assumption that flow only exits the domain through the outlet surfaces shown in Figure B.1. This assumption was implemented using symmetric boundary conditions at the upper and lower extents of each modeled subsection.
Figure B.4 is a front view of the detailed baseline model. An upper subsection of the typical barrel is shown. Actual hole geometry was included to determine the effects of individual water jets on the surface of the barrel. Figures B.5 and B.6 are plots of total velocity and heat transfer coefficient along the barrel. It is apparent from these results that the jets are not able to impinge on the barrel. Heat transfer is very non-uniform due to the complicated interaction between water jets.
Figure B.7 details the flow pattern of the water jets and confirms that they are not able to reach the barrel. The jets do not have sufficient momentum to make contact with the barrel and instead mix with the bulk flow. The initial designs that followed the baseline case attempted to improve heat transfer by increasing the water inlet velocity. It was concluded from subsequent CFD simulations that the inlet velocity required an increase of greater than 50% to impinge on the barrel. This design path was abandoned and new manifold geometry was created.
After several design iterations, a final configuration was determined based on the typical barrel geometry. A redesigned manifold layout was provided by IQ Technologies Inc. The corresponding hole layout was derived from handbook relationships that minimize water mass flow rate for a given average heat transfer rate. Three unique hole layouts were created that correspond to the upper, middle, and lower regions of the manifolds. Inlet velocity was then adjusted for each model to reach target heat transfer goals.
Figures B.8 through B.11 detail the CFD results for an upper section of the typical barrel. The staggered hole pattern improves uniformity by equally distributing flow along the height of the rotating barrel. Figures B.9 and B.10 present the velocity and heat transfer profiles for the final design. The profile is significantly improved over the baseline case as the water jets are now able to impinge on the surface of the barrel.
Figure B.11 is a line plot that displays normalized average values of heat transfer coefficient as a function of vertical distance along the barrel. The results have been calculated in this way to approximate the effects of the barrel rotation. It was assumed for modeling purposes that the barrel is rotating at 6 RPM. The line plot shows that average heat transfer varies less than 10% for the majority of the section.
100
The average heat transfer results in Figure B.11 show a sharp drop at the top and bottom edges of the modeled section. This can be explained by examining Figures B.9 and B.10. The staggered hole pattern is not able to completely fill in the upper and lower corners of the barrel. This was later remedied by adding one hole to each corner of the manifold. Not all of the models were simulated with these additional holes, but they are recommended for all sections of the manifold.
Figures B.12 through B.15 present results for a middle section of the typical barrel. The figures are similar to those for the previous model. Figure B.12 shows the two additional holes in the manifold that improve heat transfer uniformity. The improvements can be seen qualitatively in Figures B.13 and B.14. The surface area of the barrel is well-covered by the water jets. Figure B.15 quantifies this improvement with a line plot of average heat transfer coefficient. The size of the regions with low heat transfer near the upper and lower boundaries of the section have been minimized.
Similar results follow for all of the subsections modeled with the final design configuration. Three sections were modeled for each of the typical and large barrels, and one section was modeled for the small barrel. Figure B.36 provides a table that summarizes the simulation results. Average heat transfer coefficient is reported for each model, as well as the corresponding inlet velocity. Mass and volumetric flow rates are also given for each modeled section. 2. Helicopter Gear Quenching Systems
Two previous IQ gear quenching fixtures had been developed during previous projects. One, shown in Figure B.37, features a water flow that is axial both around the periphery of the gear and down through the gear bore, and was applied to a helicopter test gear designed by Sikorsky. After that fixture had been developed, single tooth quenching and bending tests suggested that impingement water flow onto the gear face would provide better results. Thus, the radial gear fixture, shown in Figure B.38 was developed to provide that impinging flow. That fixture was initially applied to a NASA test gear
The first task in the development of the gear IQ systems was the analysis of the existing fixtures. The flow field results are shown in Figures B.39 and B.40 for sections passing through both the tip and root of the gear teeth. The resultant heat flux rates for this fixture are shown for segments of the gear in Figures B.41 (top side) and B.42 (bottom side). These figures show that the peak heat flux rates occur on the top corners of the gear teeth, and that there is significant asymmetry between the top and bottom of the gear.
Flow field results for the NASA test gear in the radial fixture are shown in Figures B.43 and B.44 for sections through the tooth and root, respectively. While the radial design of the fixture might suggest that more uniform treatment of the gear, a greater portion of the flow ends up passing below the gear rather than above it, leading to an asymmetry in the velocity pattern. As shown in Figures B.45 and B.46, this asymmetry in velocities results in a similar imbalance in the heat flux rates, this time with the highest values on the bottom corners of the teeth.
Given the improved performance of the radial fixture over the axial design, the next task involved the development of a radial quench fixture for the Sikorsky test gear. Several designs were considered, and initial simulations were performed in 2D in order to speed up the design process.
The first design considered enclosed the tooth area in a channel. The intent of this design was to provide more equal treatment of the entire gear tooth face. In the NASA radial fixture, it was noted that a significant portion of the flow passes through the relatively larger opening present between gear teeth. By lengthening the channel, this effect would be prevented.
101
The flow field for this design is shown in Figures B.47 and B.48 for the root and tip of
the gear. A full 3D model was then constructed, and the heat flux rates were calculated. While this design resulted in improved heat transfer rates over the axial fixture, the highest heat flux rates did not occur on the tooth faces, but rather on the hub, where the channeled flow impinged.
The second design considered used a radial slot that was smaller than the gear face width and position further out from the gear teeth. In this design, a high velocity jet of water emanates from the slot and impinges on the gear face, providing high heat transfer rates. While the jet is initially smaller than the gear face, it expands as it approaches the face, and good heat transfer rates are achieved across the entire face. The flow field for this design is shown in Figures B.49 and B.50 while the heat flux rates are shown in Figures B.51 and B.52.
The pressure loss through this design is 153 ft of water, which compares well to the pressure loss of 176 ft of water through the axial flow fixture. A pressure plot through the fixture, shown in Figure B.53, also suggests that additional pressure savings could be obtained by opening up the portion of the fixture that surrounds the gear teeth.
The last task that was performed for the helicopter gear quench fixture involved a transient simulation of the quenching process. While steady-state analyses are sufficient for quench fixture design, a full transient simulation is needed in order to predict the properties of the quenched part via DANTE modeling. The challenge to providing those transient heat flux rates is that the grid resolution needed to accurately predict heat flux rates on a complex 3D part results in a large model that can take excessive computer run time for a transient solution to complete. Thus, a method was sought that would provide good transient results without requiring a transient solution.
In order to investigate the potential prediction methods, a full transient model was performed for a 2D situation that shares many of the characteristics of the radial gear quench fixture. In this case, the item to be quenched is not a gear but a gear-like disk (similar to a gear blank before it has been hobbed). Figure B.54 shows the flow field in this domain, which is essentially the same as for the NASA radial quench fixture. Heat flux rates and heat transfer coefficients are shown in Figure B.55 for three representative points on the gear blank. As shown in this figure, these values change considerably over the course of the quench cycle. In addition, the values change in different ways for all three points (i.e., it is not possible to have a single “time scaling function” that can be applied to all the points on the gear surface).
The equation shown below was ultimately found to provide a good correlation to the transient results by using the conditions predicted for the hot part (beginning of quench cycle) and the isothermal condition, when the part has been completely cooled:
Note that the local heat transfer coefficients used in equation 1 differ from those
presented in Figure B.55. In Figure B.55, the temperature differential is between the surface and the fluid inlet temperature, while the temperature differential for the local heat transfer coefficient is between the surface and the near surface fluid temperature.
The first term in this equation provides a blending from the initial local heat transfer coefficient to the final value, while the second term provides the temperature differential, including a blending of the near surface liquid temperature from the initial to final values. Three variables in this equation are obtained from the CFD simulations. h0 and T0 are obtained from a steady-state simulation with the part surface held at its initial temperature, while hf is obtained from a steady-state simulation with the part surface at the water inlet temperature. These values
(1)
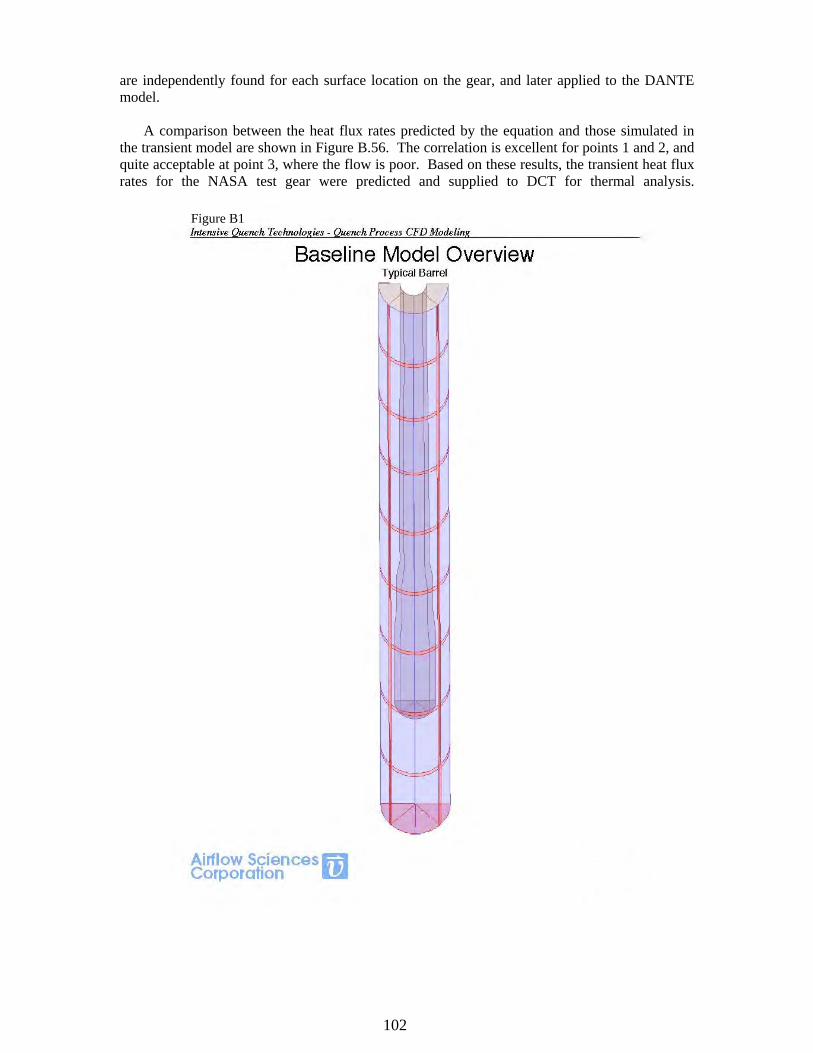
102
are independently found for each surface location on the gear, and later applied to the DANTE model.
A comparison between the heat flux rates predicted by the equation and those simulated in the transient model are shown in Figure B.56. The correlation is excellent for points 1 and 2, and quite acceptable at point 3, where the flow is poor. Based on these results, the transient heat flux rates for the NASA test gear were predicted and supplied to DCT for thermal analysis.
Figure B1

103
Figure B3
Figure B2
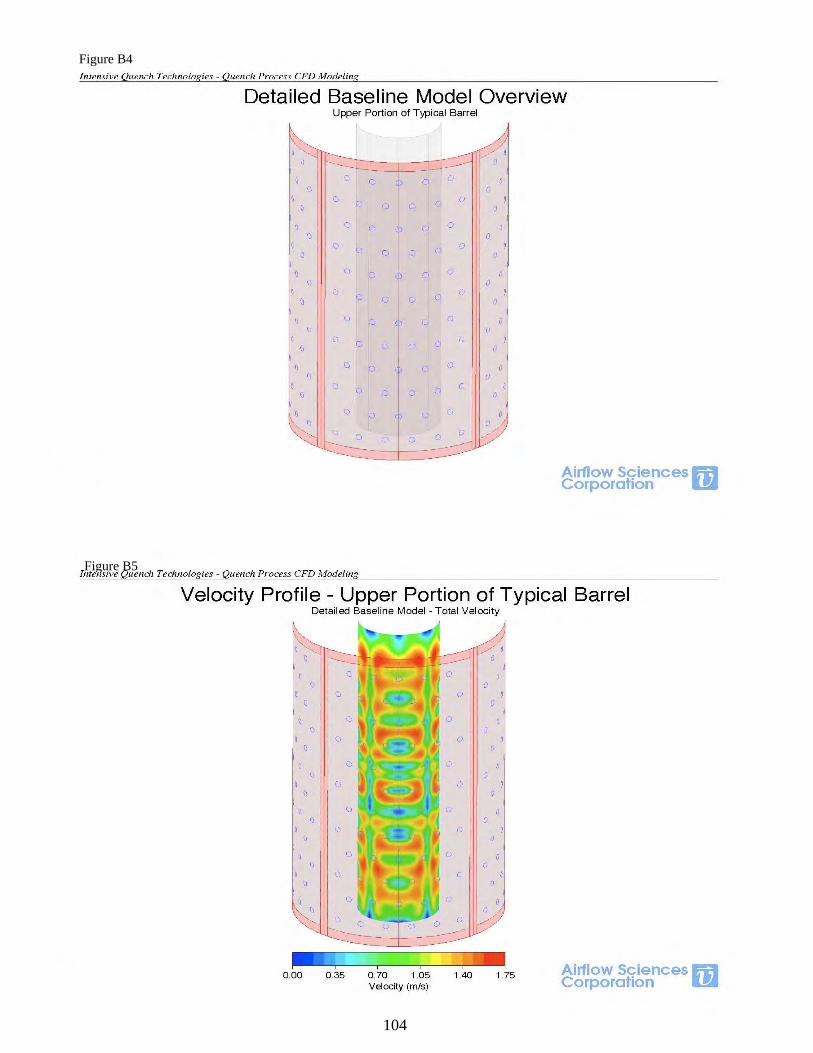
104
Figure B4
Figure B5
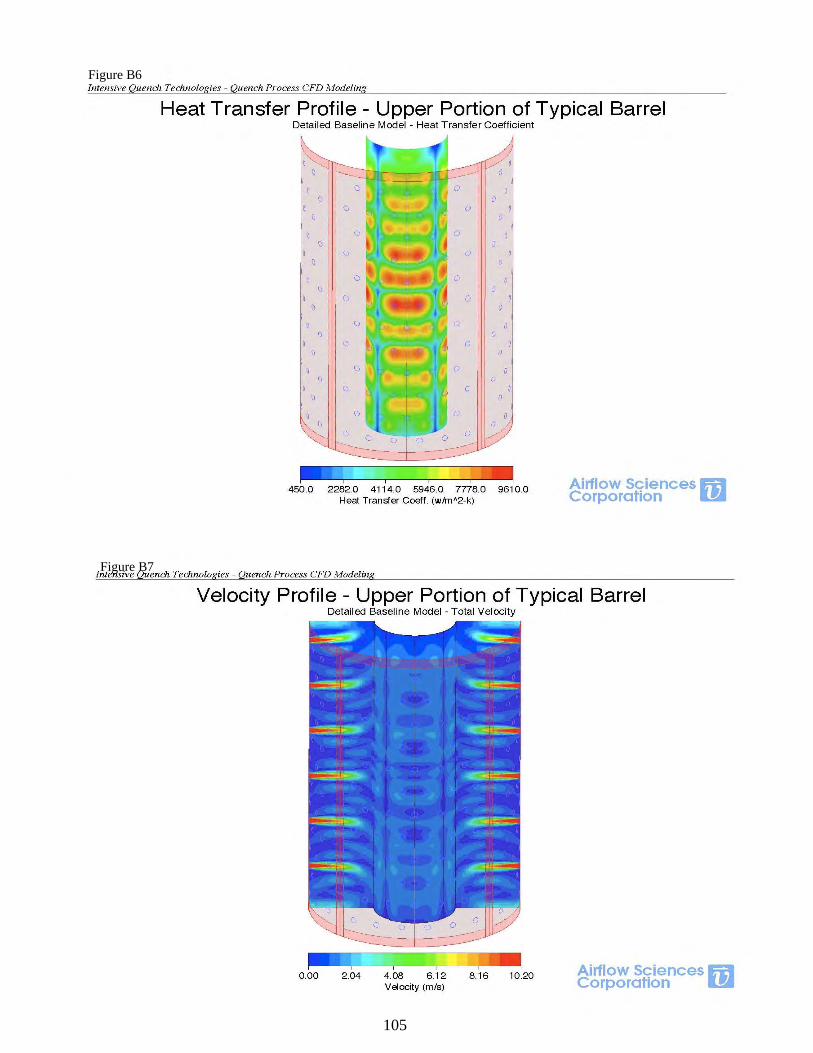
105
Figure B6
Figure B7
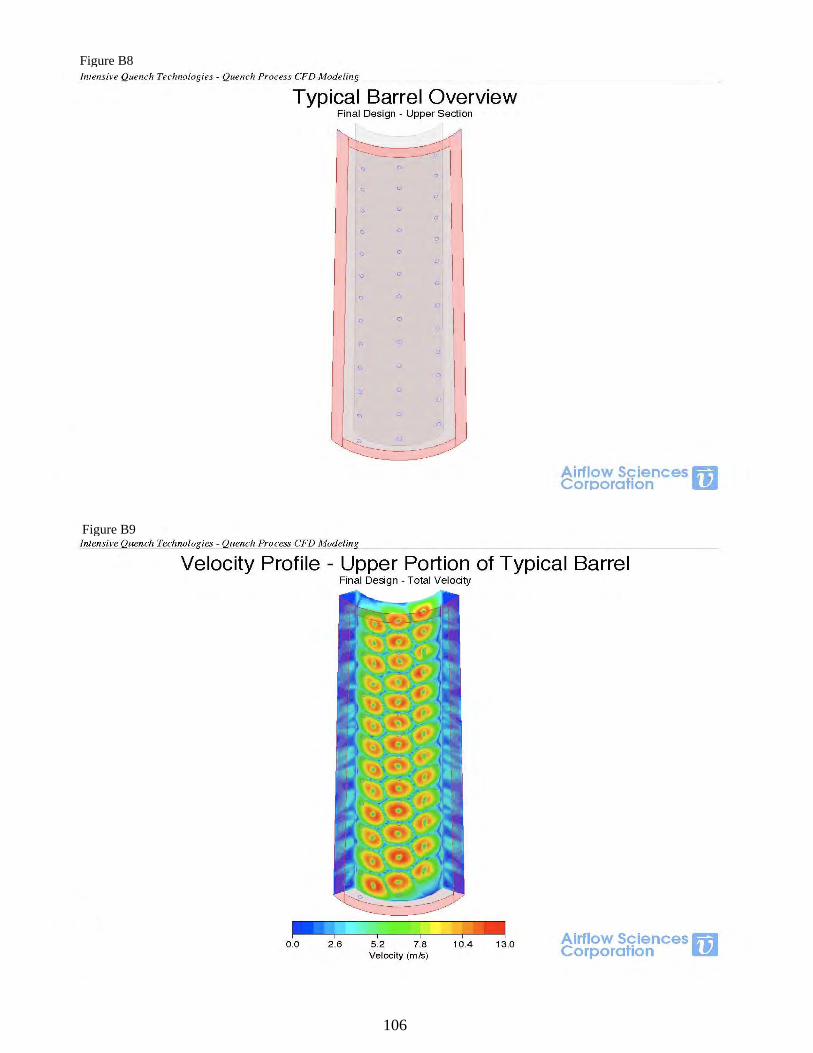
106
Figure B8
Figure B9
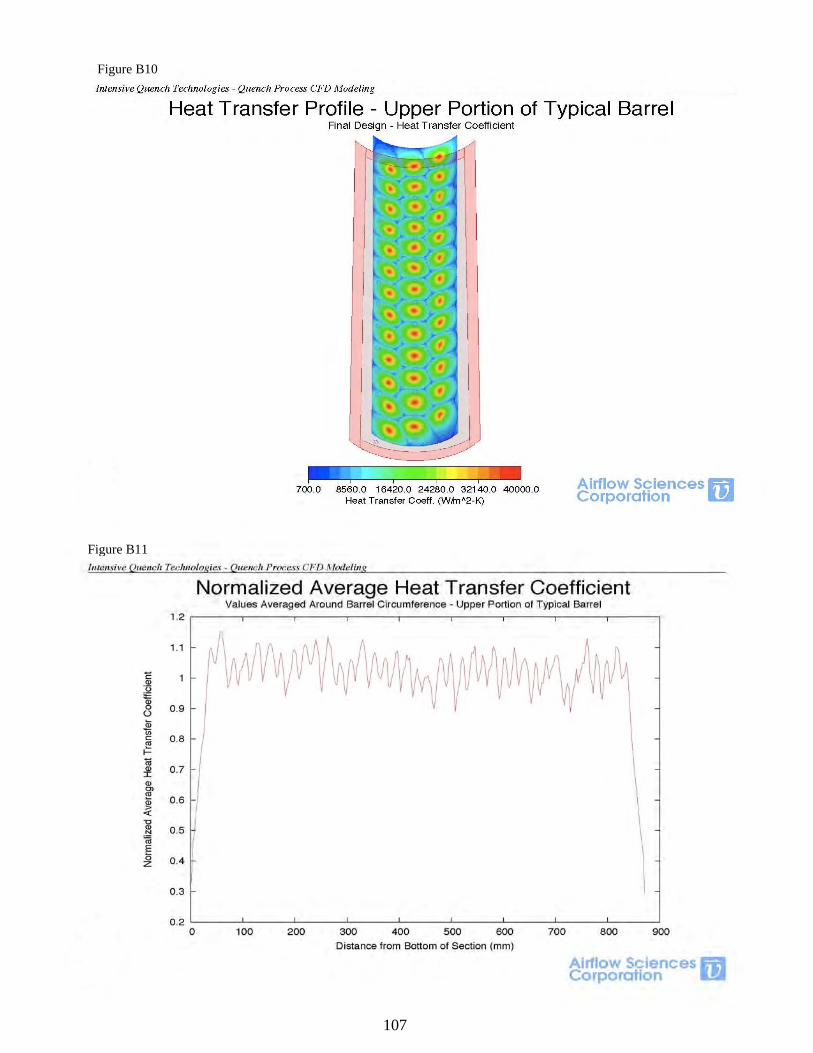
107
Figure B10
Figure B11
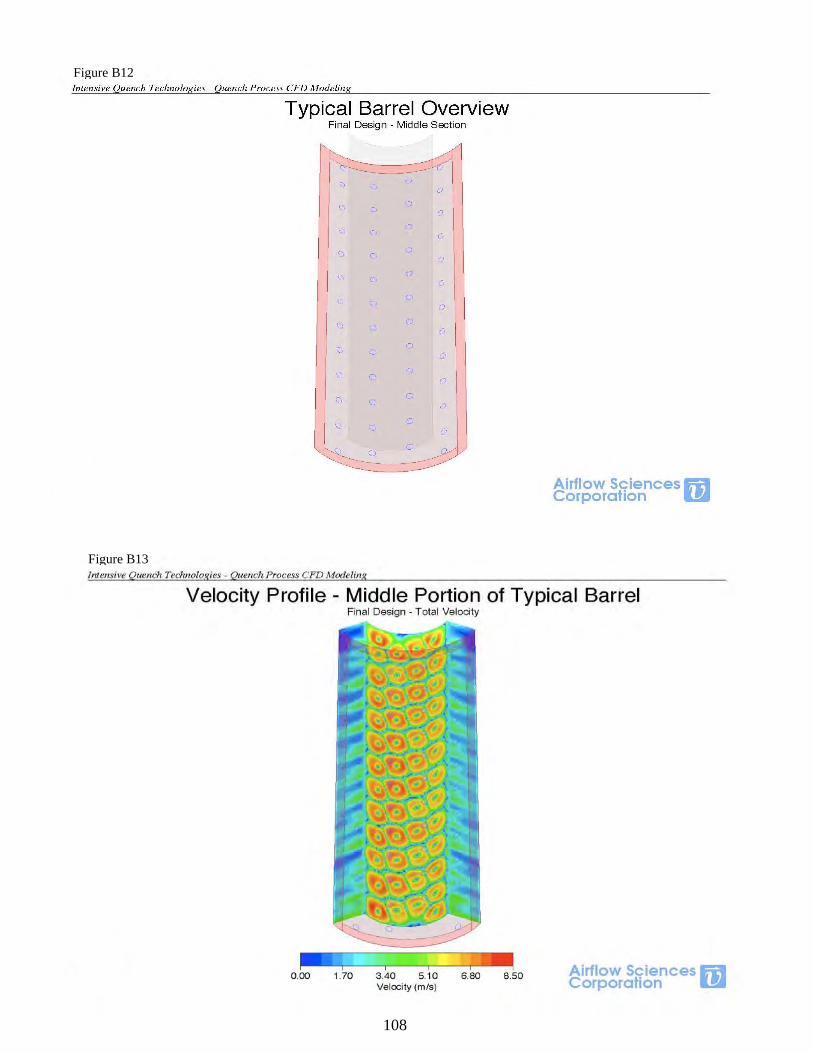
108
Figure B12
Figure B13
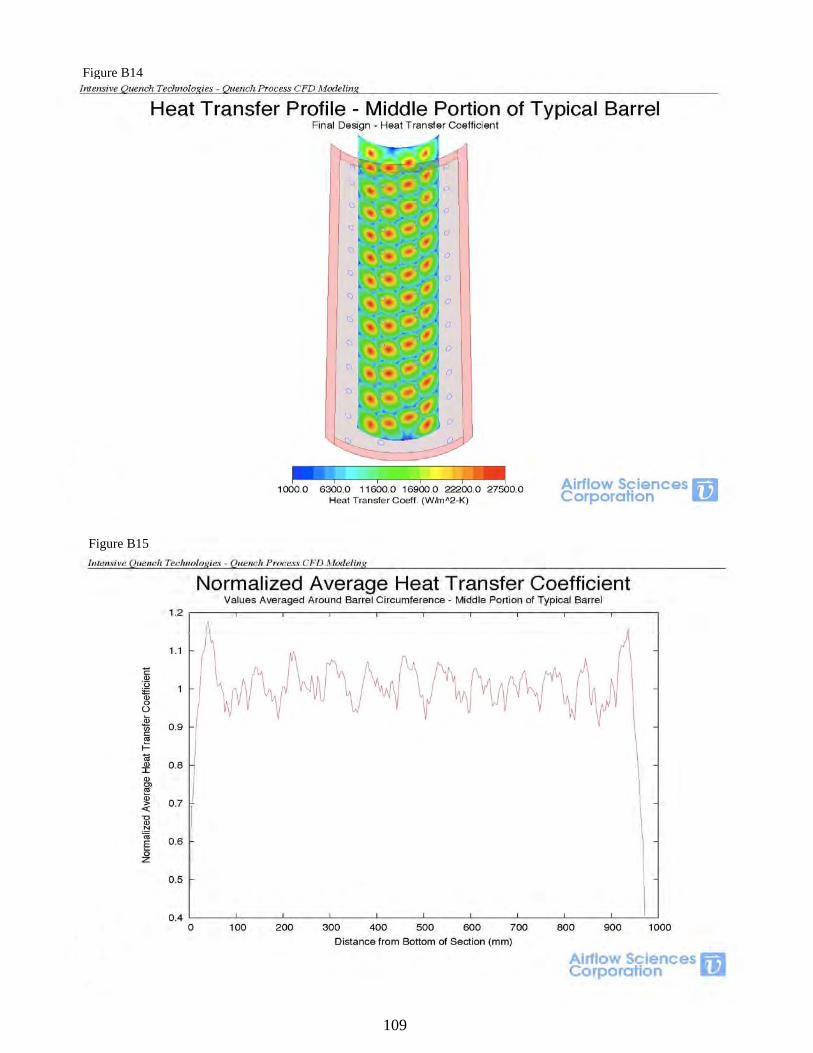
109
Figure B14
Figure B15
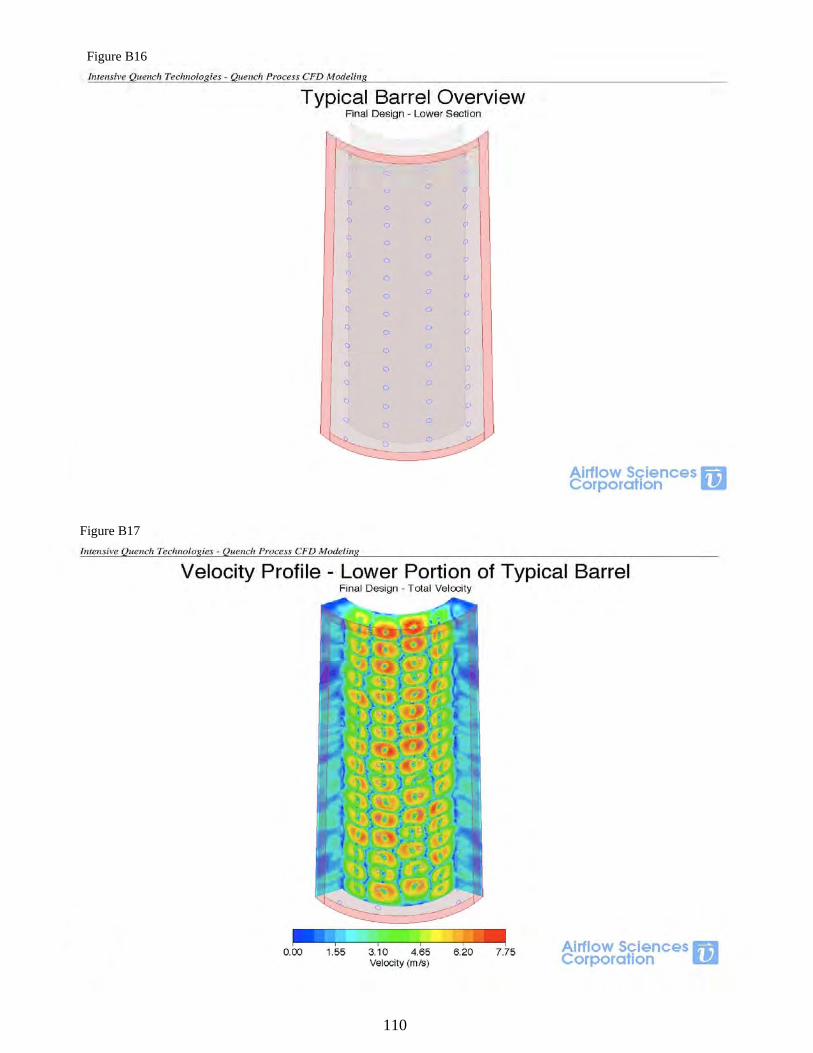
110
Figure B16
Figure B17
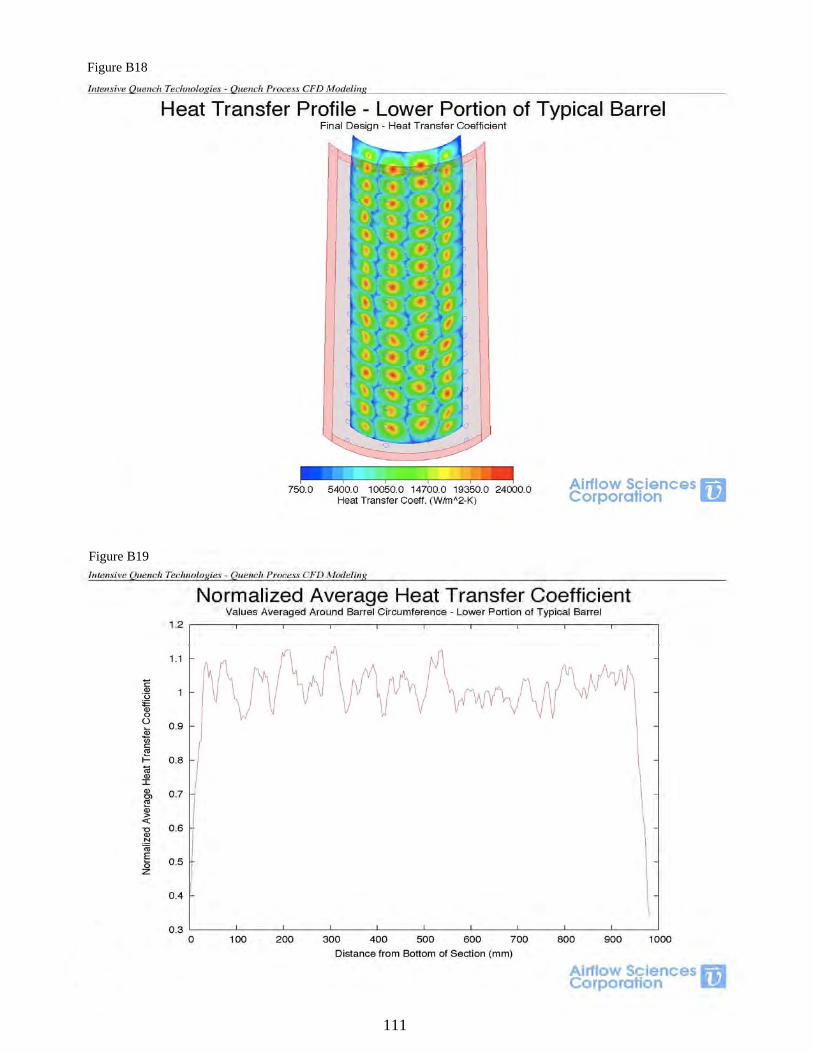
111
Figure B18
Figure B19
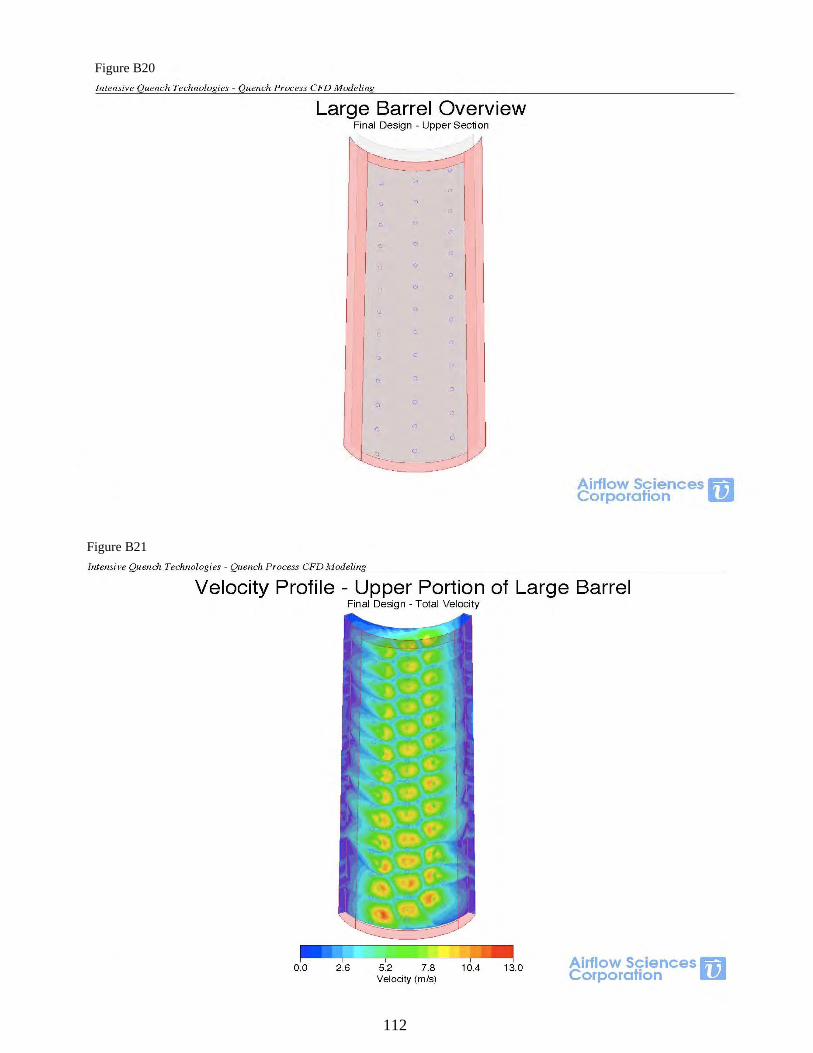
112
Figure B20
Figure B21
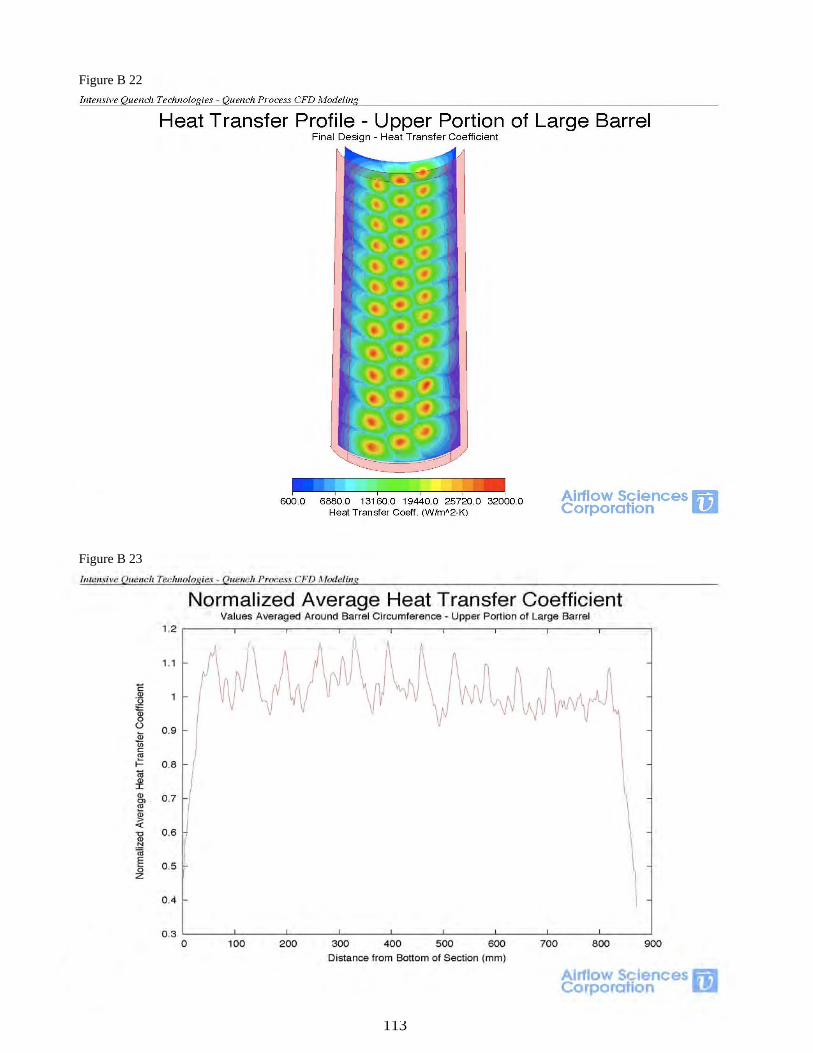
113
Figure B 22
Figure B 23
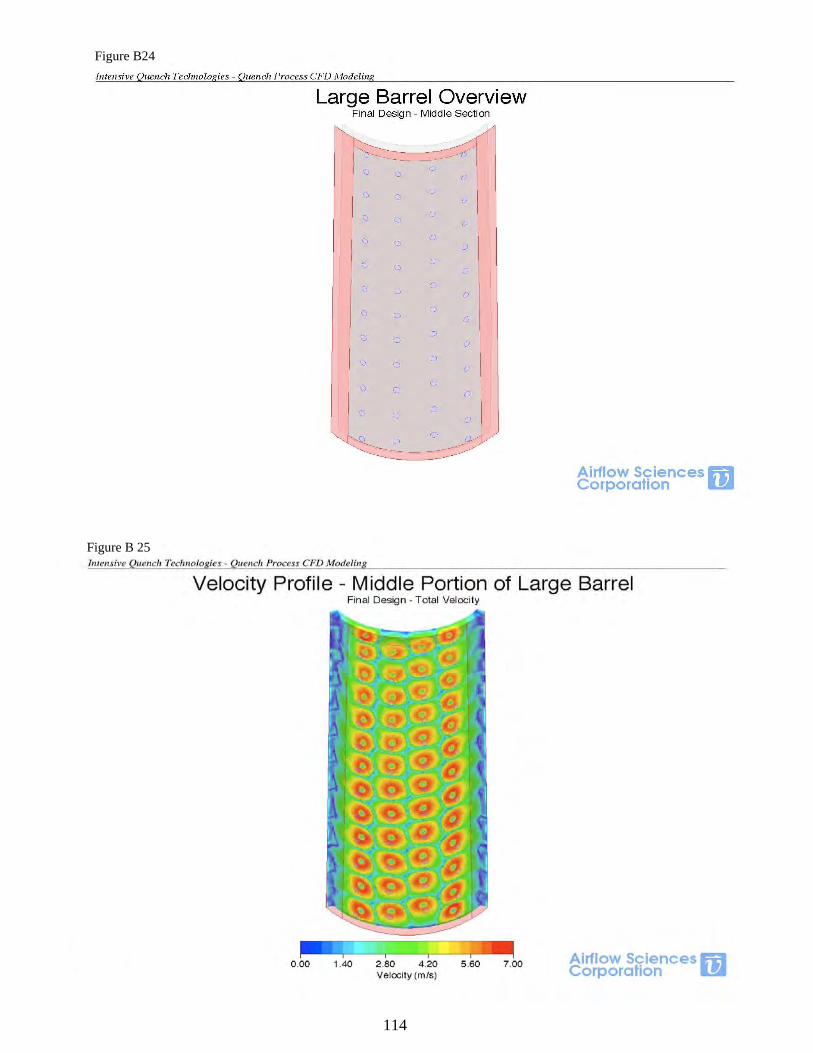
114
Figure B24
Figure B 25
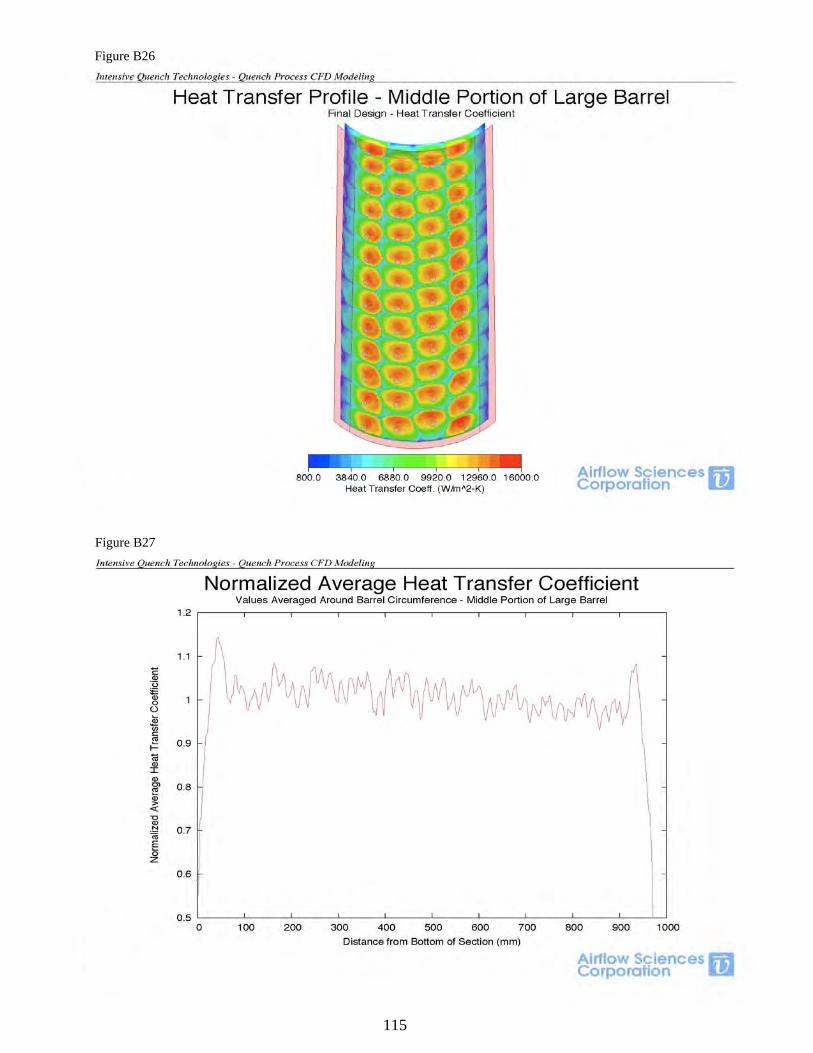
115
Figure B26
Figure B27
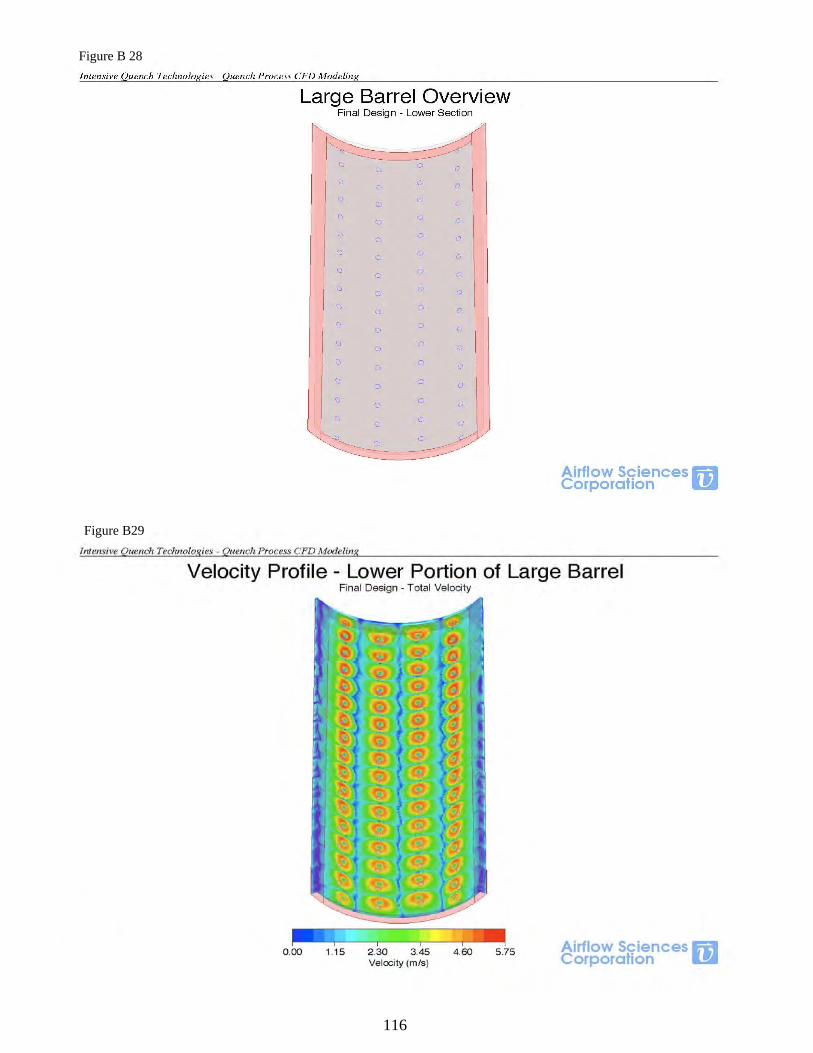
116
Figure B 28
Figure B29
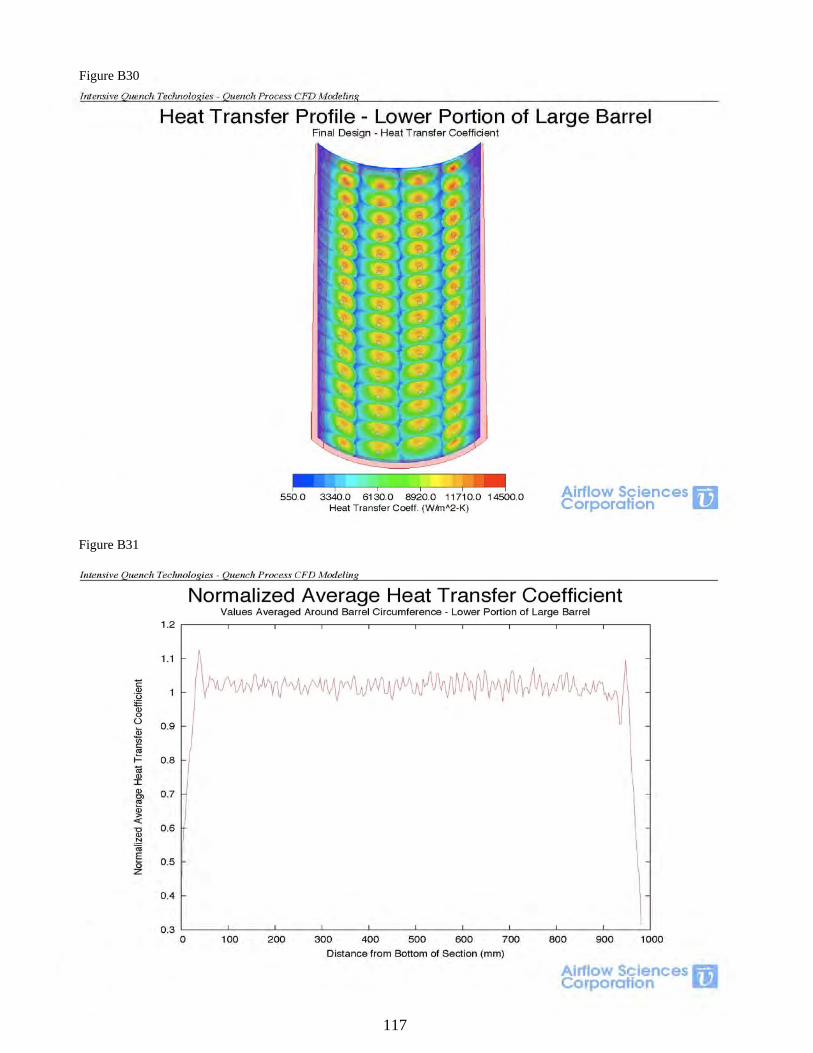
117
Figure B30
Figure B31
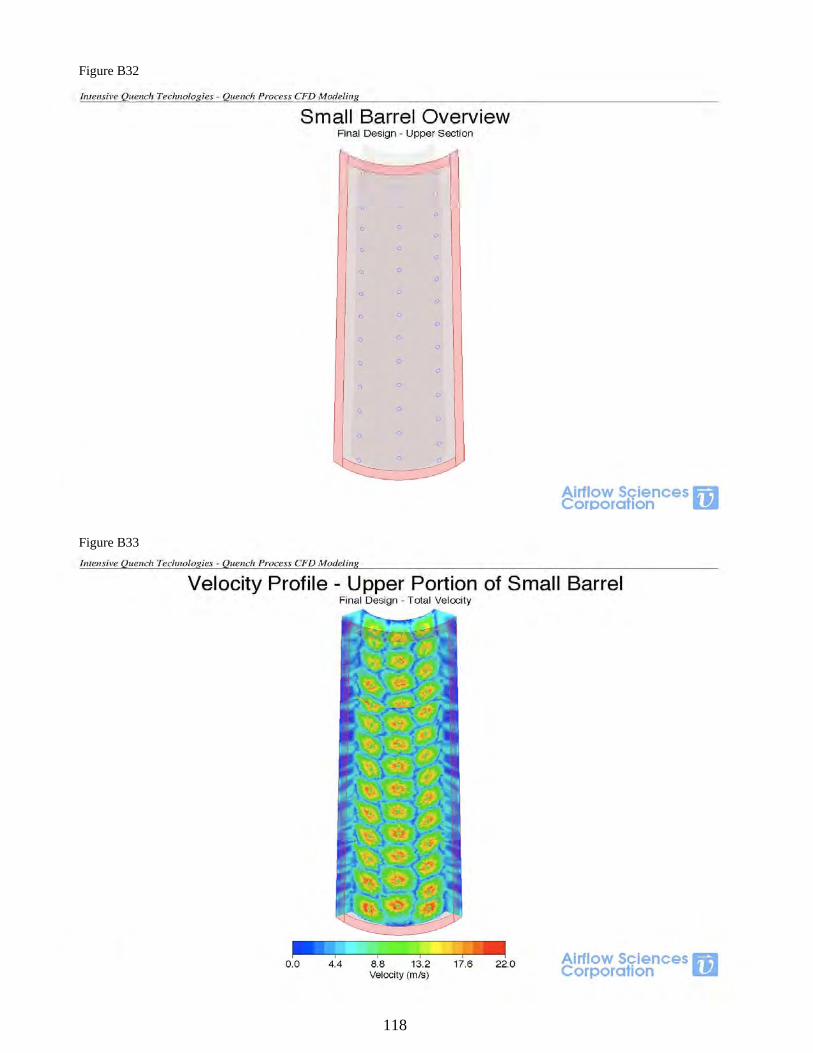
118
Figure B32
Figure B33
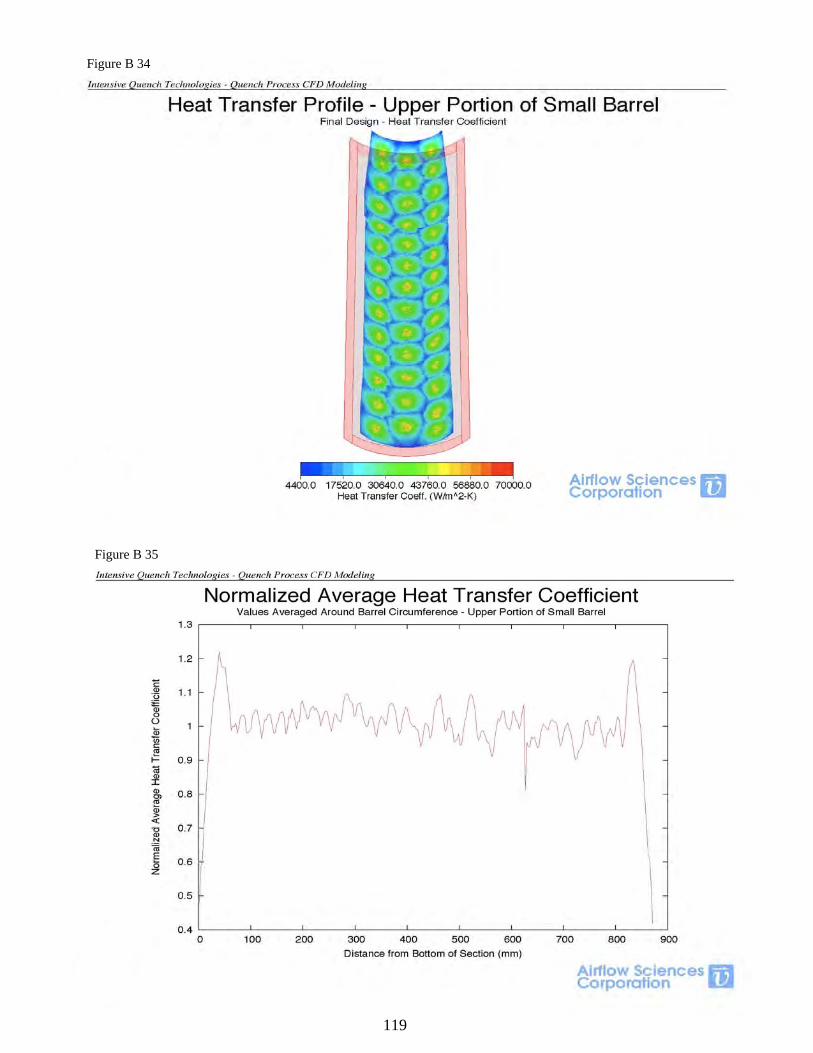
119
Figure B 34
Figure B 35
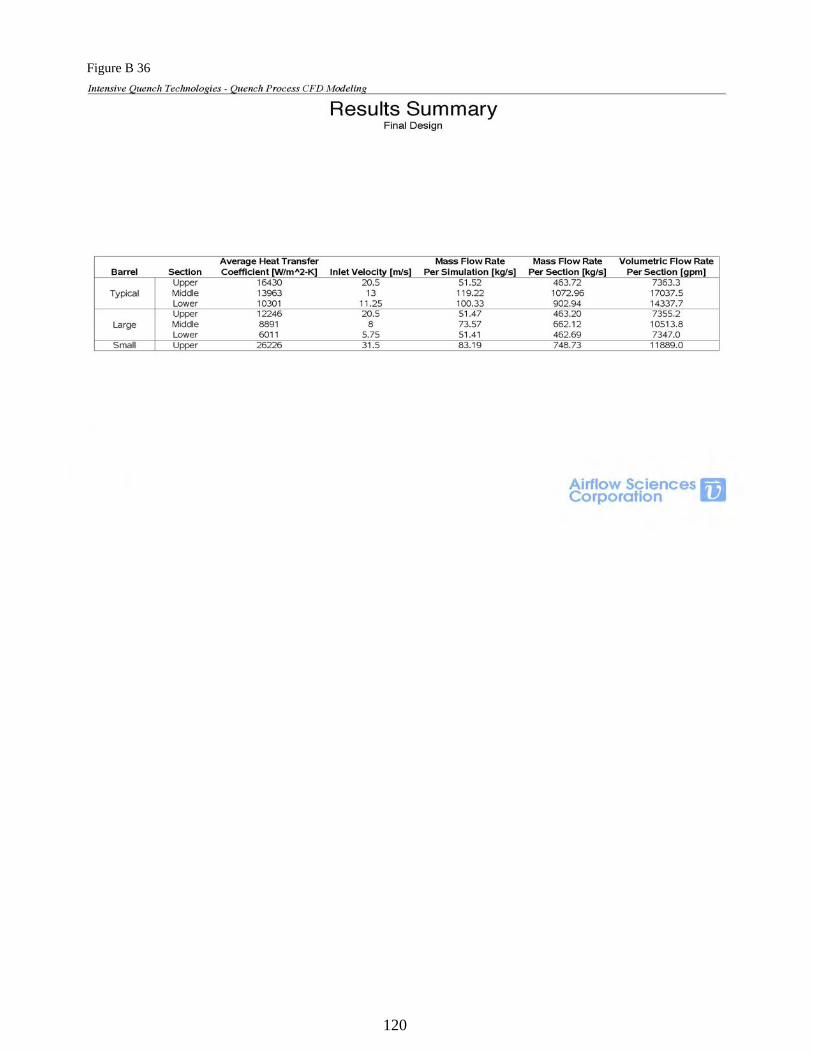
120
Figure B 36
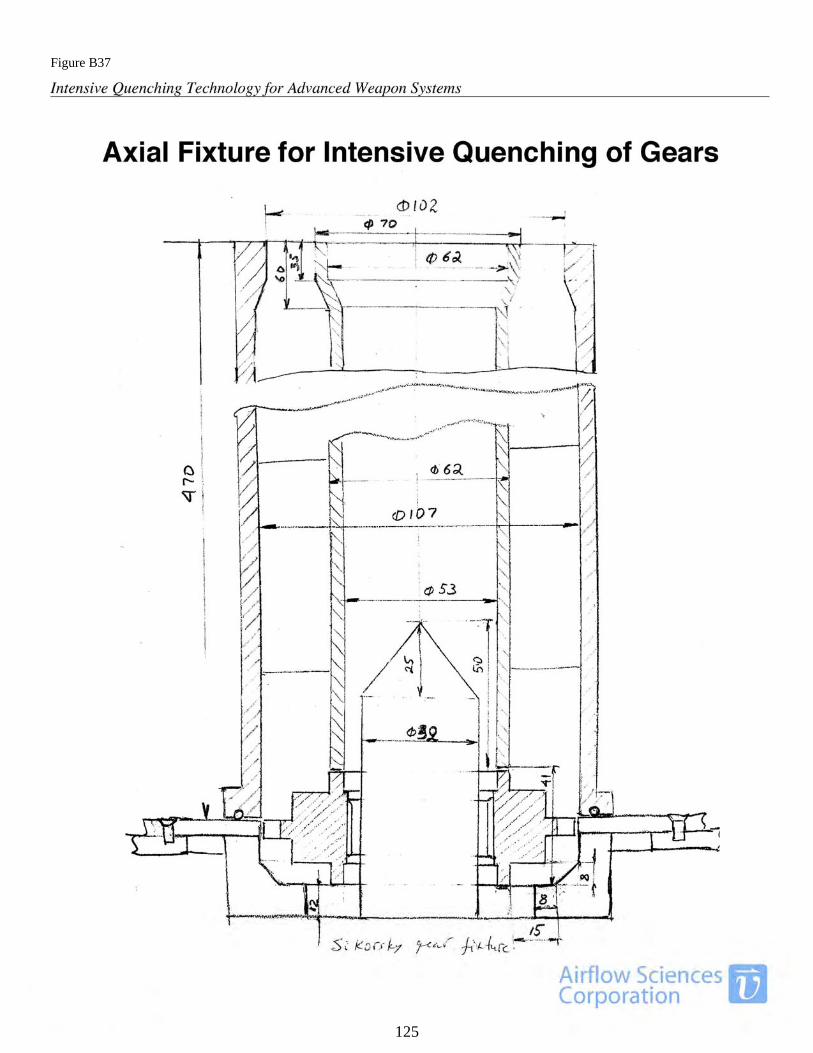
121
Figure B37
125
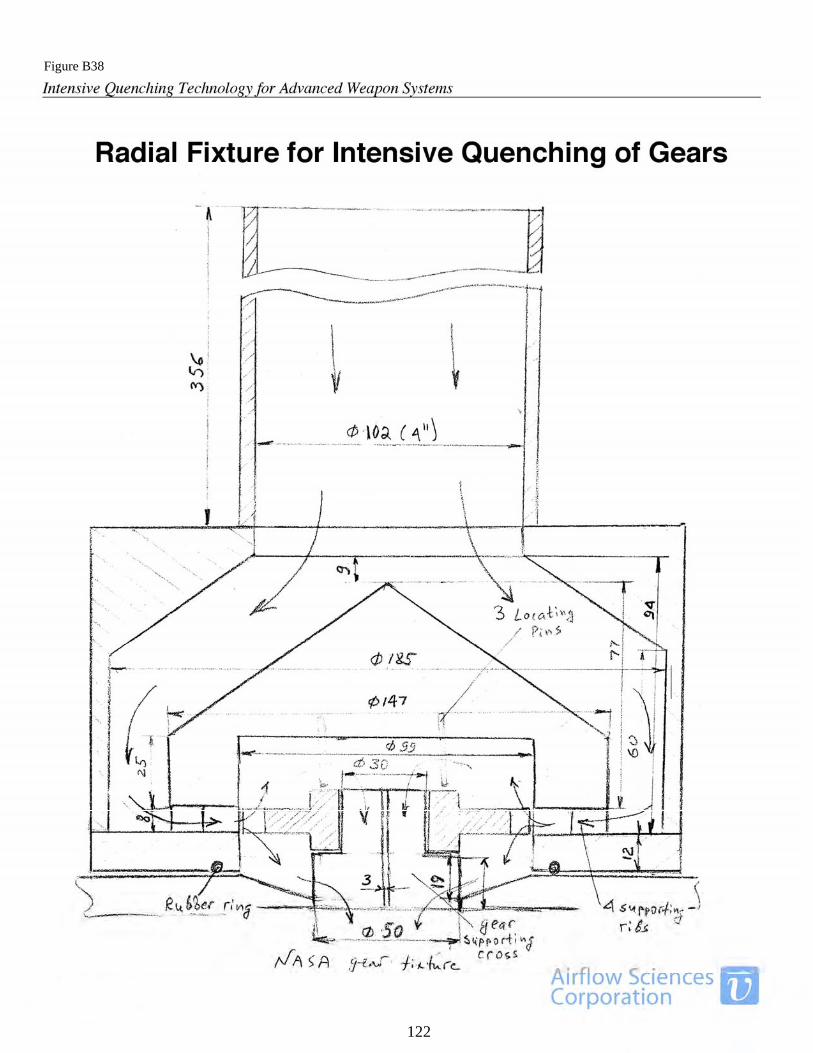
122
Figure B38
122
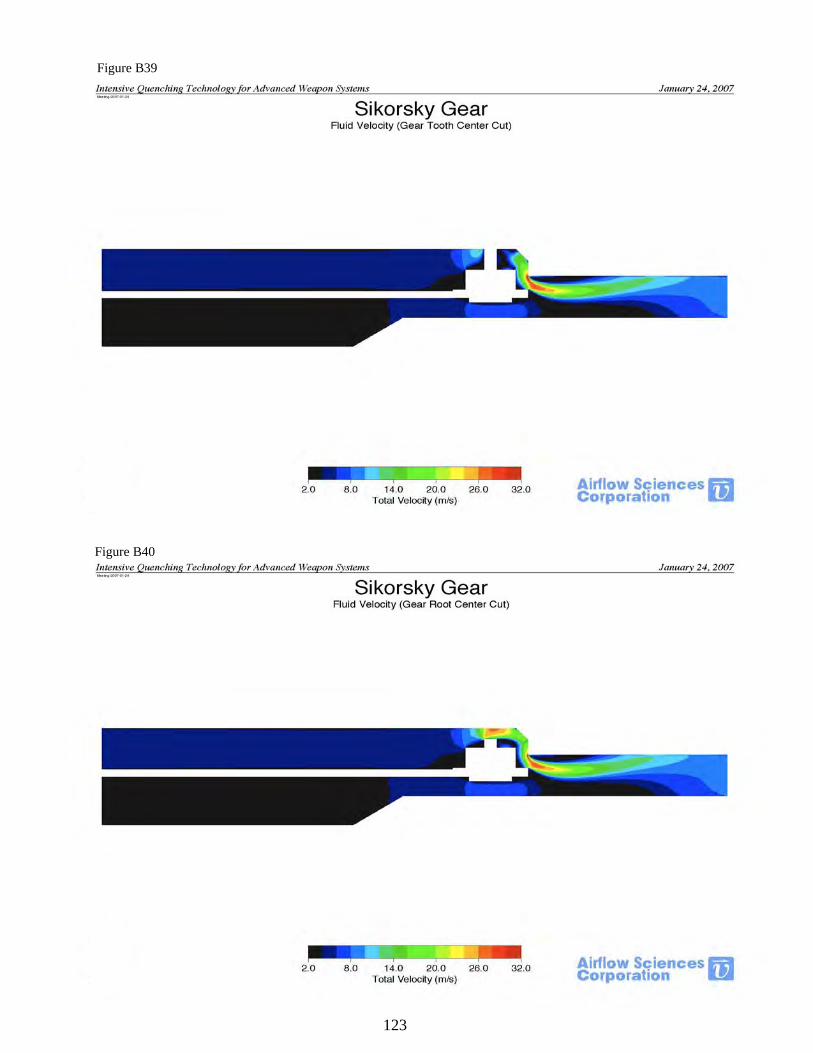
123
Figure B39
Figure B40
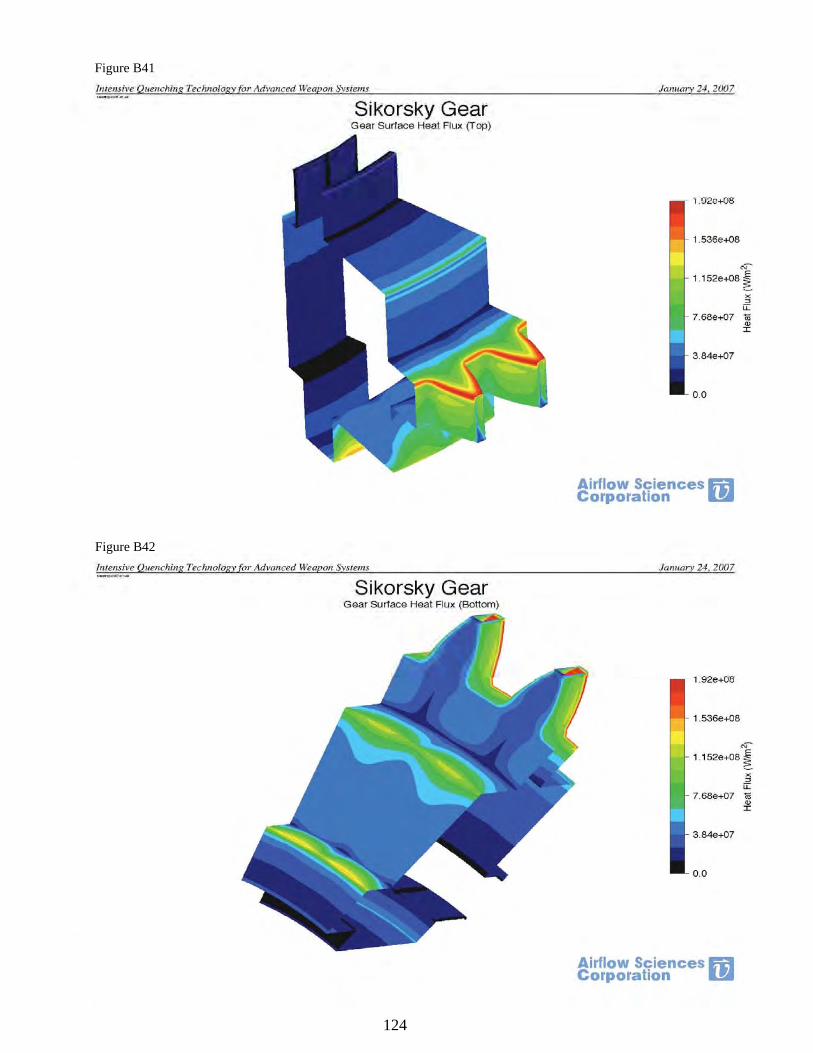
124
Figure B41
Figure B42
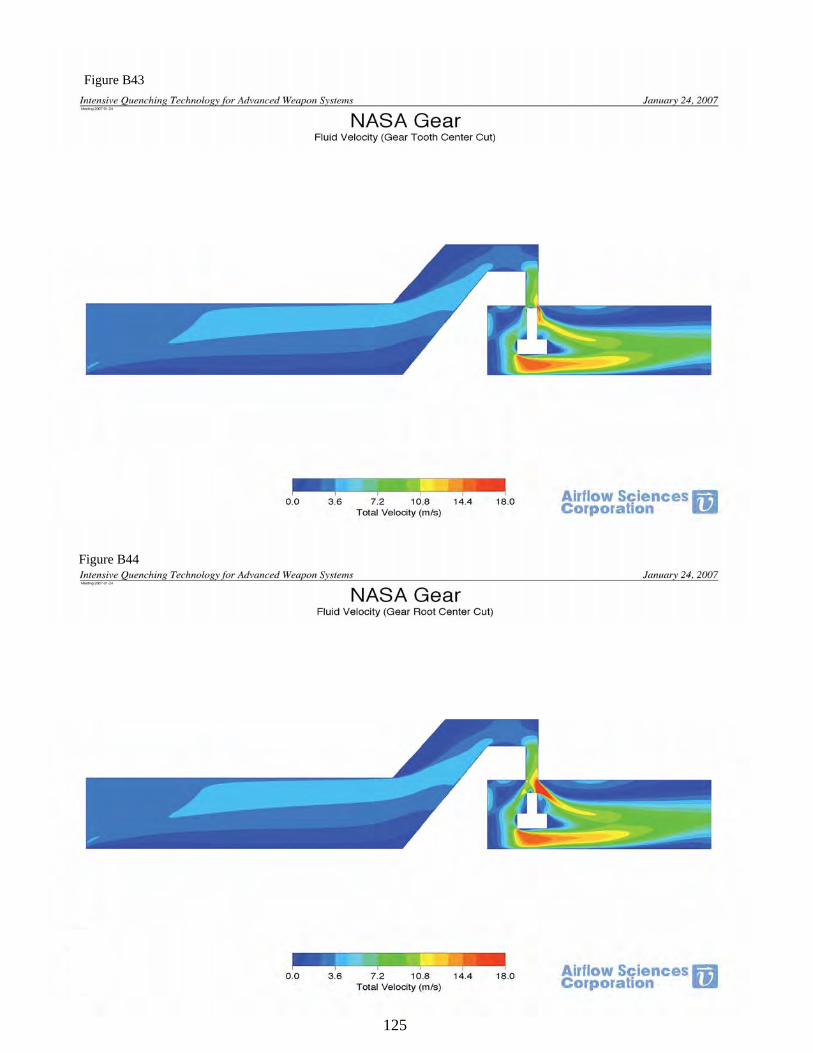
125
Figure B43
Figure B44
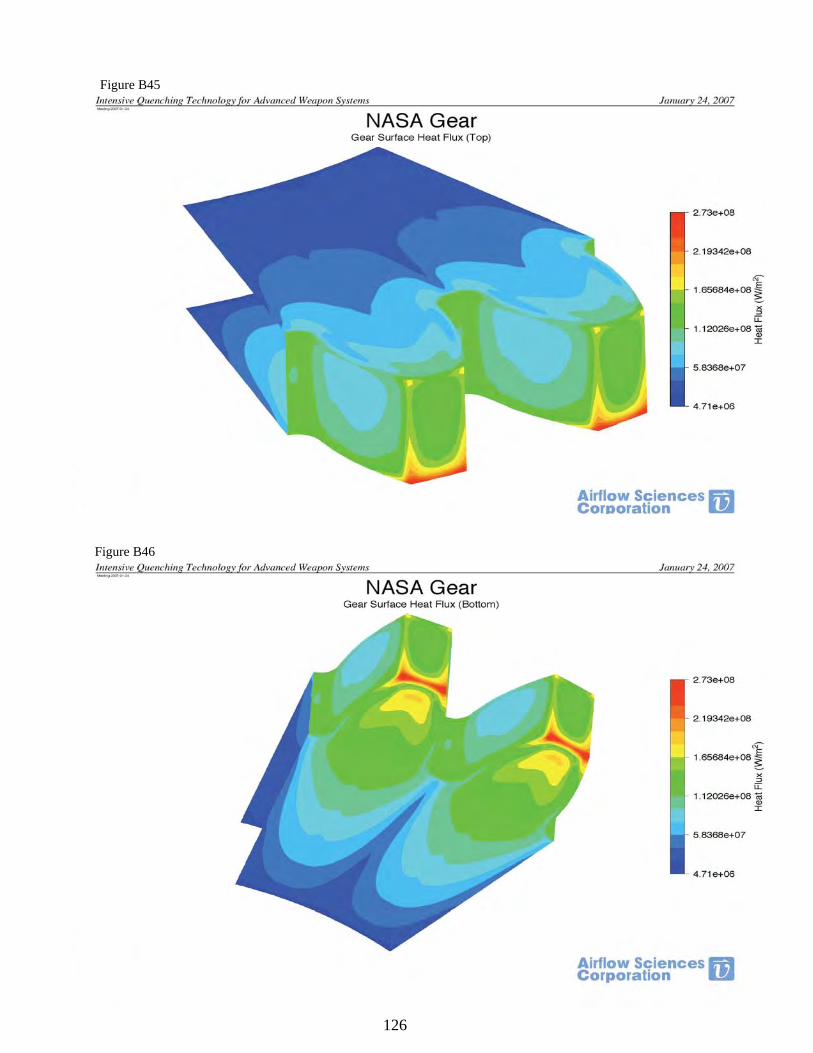
126
Figure B45
Figure B46
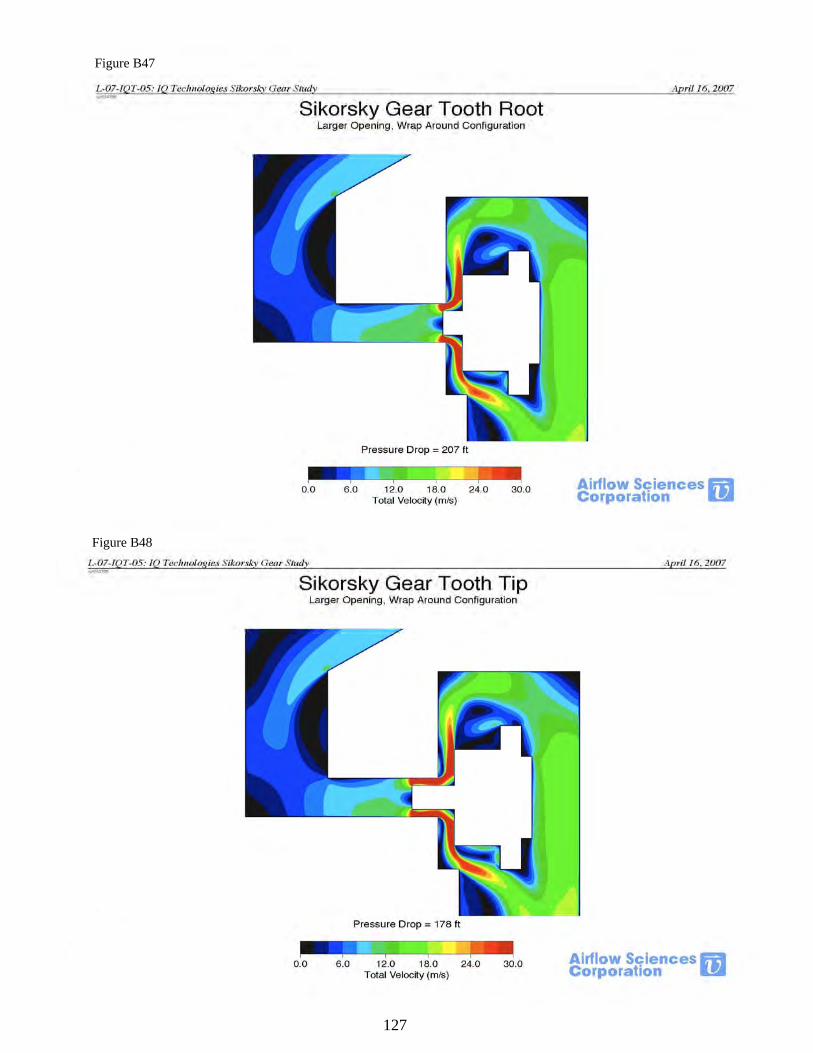
127
Figure B47
Figure B48
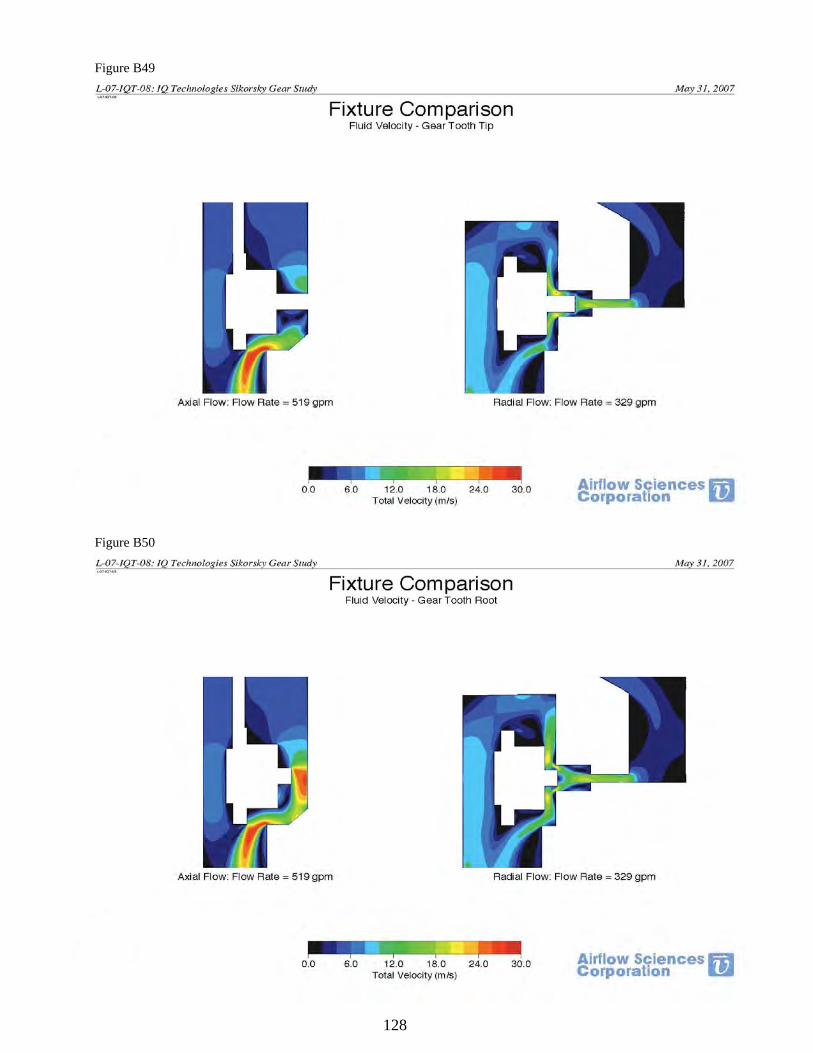
128
Figure B49
Figure B50
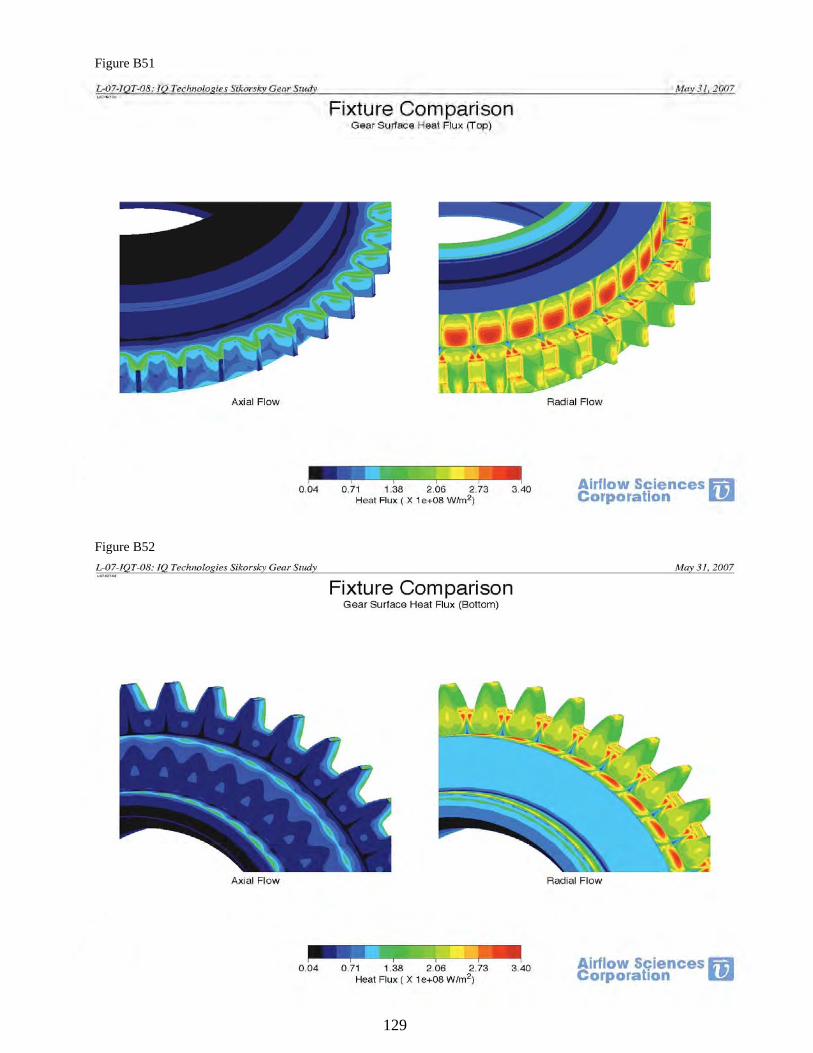
129
Figure B51
Figure B52
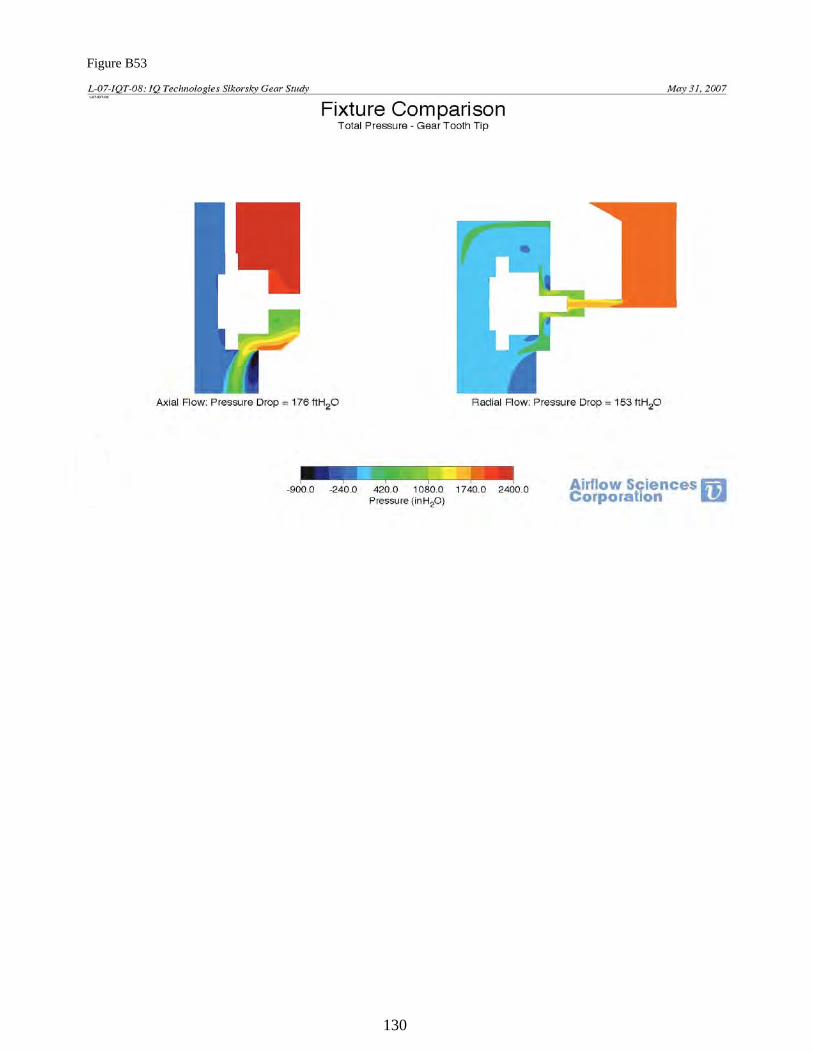
130
Figure B53
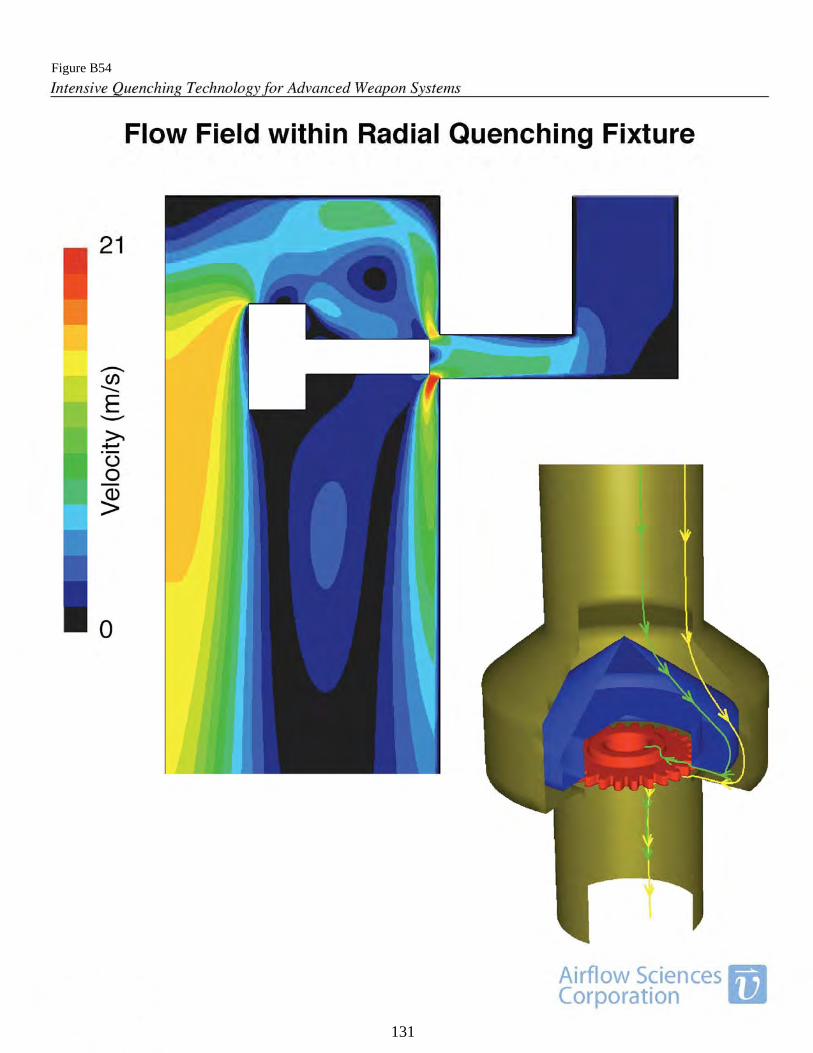
131
Figure B54
131
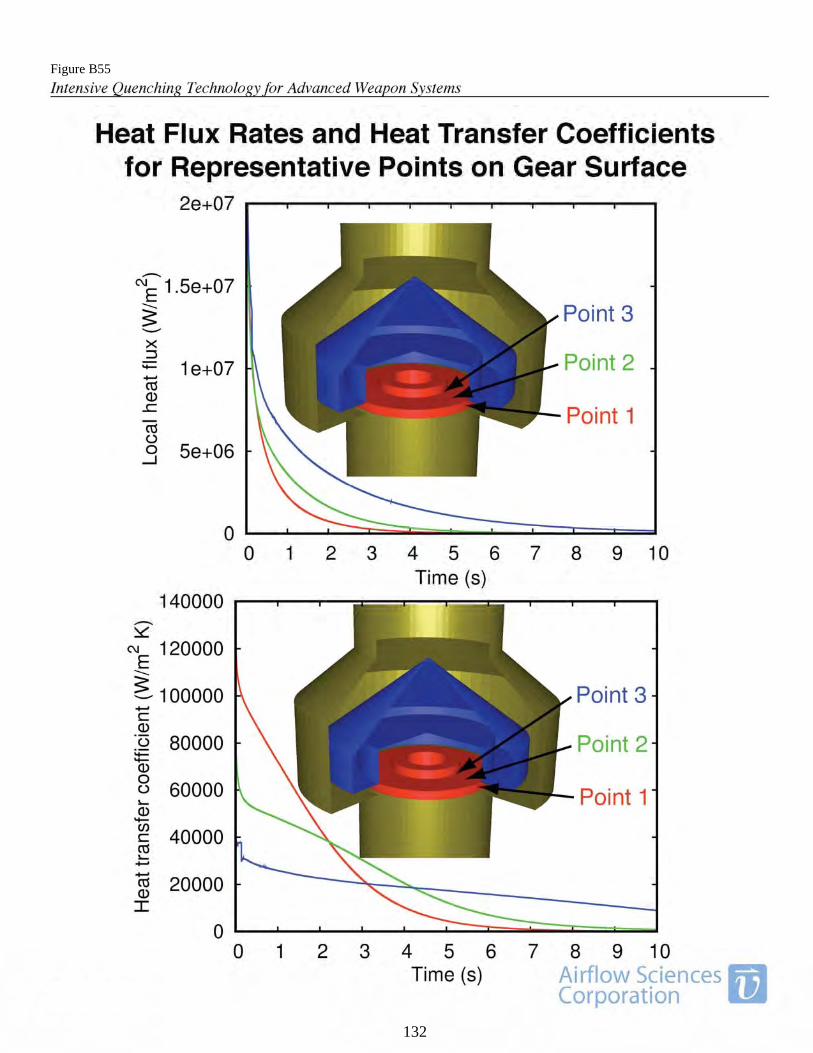
132
Figure B55
132
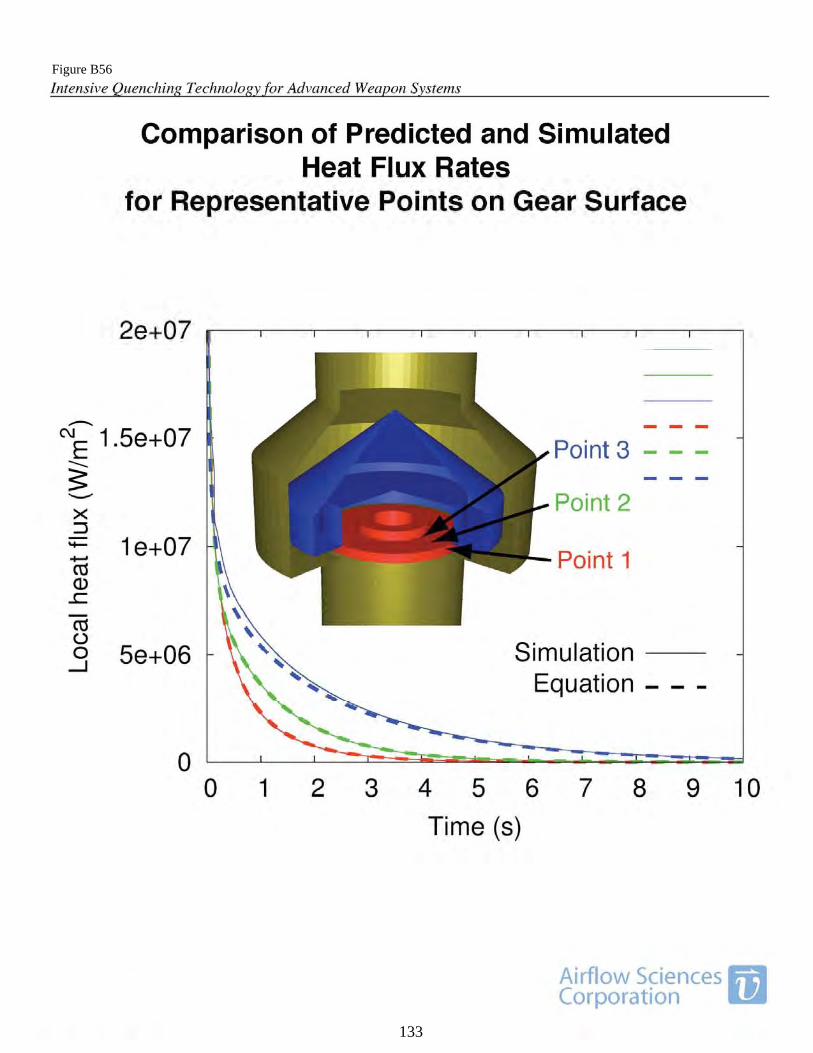
133
Figure B56
133
134
APPENDIX C
Intensive Quenching Process for Advanced Weapon Systems
Second Annual Program Plan (2nd APP) 1. INTRODUCTION
The main goal of the project is to implement a patented Intensive Quenching® (IQ) technology into production of critical steel components of different weapon systems. These components include critical artillery equipment components, critical aerospace and other military vehicle components, such as helicopter transmission gears, tank transmission shafts, etc. Improved material structure and high residual surface compressive stresses produced by the IQ process will increase the damage tolerance in these critical components, as well as service life of the component. The project work plan covers a 3-year period and includes three consecutive phases having duration of one year each. Over the first six months of Phase 1 of the project, the project team has completed the following work: o Improved capabilities of the existing high-velocity IQ system (installed new controls,
modified hydraulic components, etc.). o Conducted a series of IQ demonstrations for four gun barrel steels (4130, M249, M256,
MTO) o Demonstrated that the IQ process improves significantly mechanical properties of steels used
for small caliber and large caliber gun barrels that may result in a weight reduction of large caliber barrels and in improvement of performance characteristics for small caliber barrels.
o Developed CFD modeling procedure to be used for optimizing the design parameters of IQ systems for different steel component configurations.
o Developed a production quality control procedure for controlling residual surface compressive stresses after the IQ process is completed.
The following project Phase 1 work is currently in progress:
o Design simulations for quench flow, heat transfer and heat-treating processes. o Quenching of small caliber gun barrel sections. o Quenching of helicopter test gears. o Develop conceptual designs of production IQ systems for intensive quenching of gun barrels
and helicopter gears.
2. SECOND ANNUAL PROGRAM Plan (2nd APP)
The second annual program plan includes two directions of work: o Continuation of the intensive quenching (IQ) process demonstrations for selected weapon
system components. o Development of full-scale production IQ systems for processing: a) large caliber and small
caliber gun barrels, and b) specified helicopter gears. The program includes the following four tasks spanned over a one-year time period. Task 1 - Continue IQ Demonstrations for Selected Weapon System Components
The objective of this task is to evaluate an effect of the IQ process on steel components of various weapon systems with the major goal to make these components stronger, to improve their wear resistance and fatigue life, or to make these components lighter for the same performance
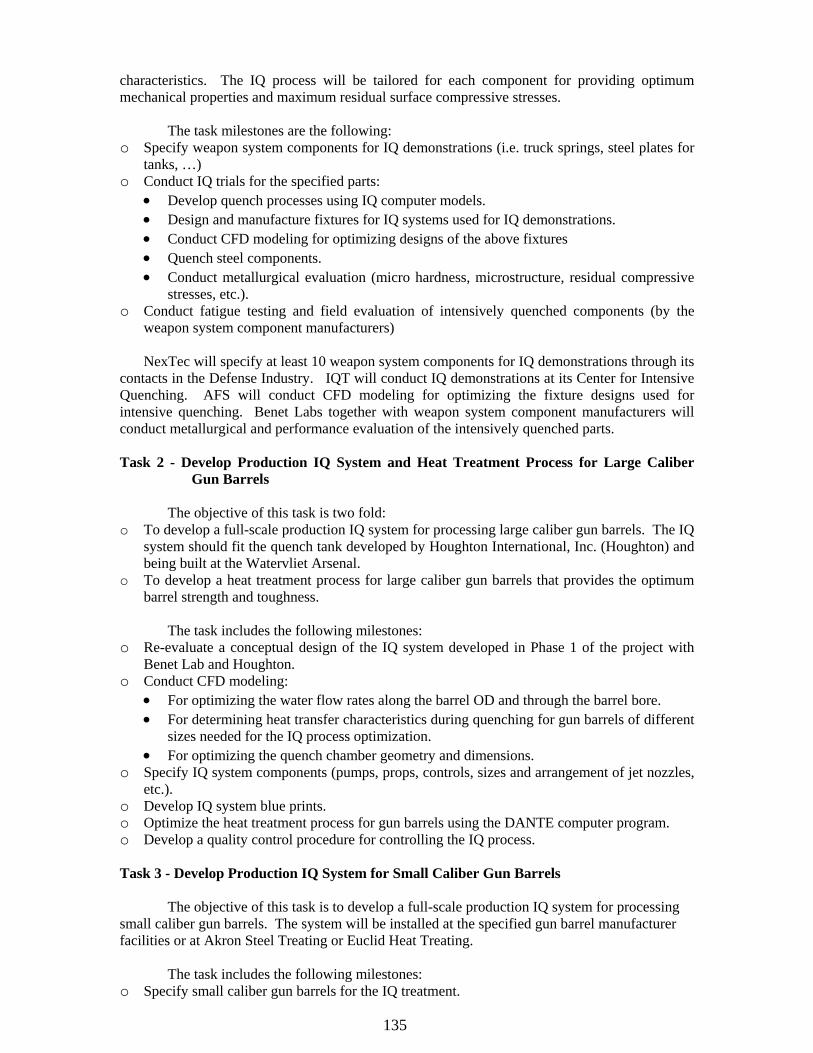
135
characteristics. The IQ process will be tailored for each component for providing optimum mechanical properties and maximum residual surface compressive stresses.
The task milestones are the following:
o Specify weapon system components for IQ demonstrations (i.e. truck springs, steel plates for tanks, …)
o Conduct IQ trials for the specified parts: • Develop quench processes using IQ computer models. • Design and manufacture fixtures for IQ systems used for IQ demonstrations. • Conduct CFD modeling for optimizing designs of the above fixtures • Quench steel components. • Conduct metallurgical evaluation (micro hardness, microstructure, residual compressive
stresses, etc.). o Conduct fatigue testing and field evaluation of intensively quenched components (by the
weapon system component manufacturers) NexTec will specify at least 10 weapon system components for IQ demonstrations through its
contacts in the Defense Industry. IQT will conduct IQ demonstrations at its Center for Intensive Quenching. AFS will conduct CFD modeling for optimizing the fixture designs used for intensive quenching. Benet Labs together with weapon system component manufacturers will conduct metallurgical and performance evaluation of the intensively quenched parts.
Task 2 - Develop Production IQ System and Heat Treatment Process for Large Caliber
Gun Barrels
The objective of this task is two fold: o To develop a full-scale production IQ system for processing large caliber gun barrels. The IQ
system should fit the quench tank developed by Houghton International, Inc. (Houghton) and being built at the Watervliet Arsenal.
o To develop a heat treatment process for large caliber gun barrels that provides the optimum barrel strength and toughness.
The task includes the following milestones:
o Re-evaluate a conceptual design of the IQ system developed in Phase 1 of the project with Benet Lab and Houghton.
o Conduct CFD modeling: • For optimizing the water flow rates along the barrel OD and through the barrel bore. • For determining heat transfer characteristics during quenching for gun barrels of different
sizes needed for the IQ process optimization. • For optimizing the quench chamber geometry and dimensions.
o Specify IQ system components (pumps, props, controls, sizes and arrangement of jet nozzles, etc.).
o Develop IQ system blue prints. o Optimize the heat treatment process for gun barrels using the DANTE computer program. o Develop a quality control procedure for controlling the IQ process. Task 3 - Develop Production IQ System for Small Caliber Gun Barrels
The objective of this task is to develop a full-scale production IQ system for processing small caliber gun barrels. The system will be installed at the specified gun barrel manufacturer facilities or at Akron Steel Treating or Euclid Heat Treating.
The task includes the following milestones:
o Specify small caliber gun barrels for the IQ treatment.
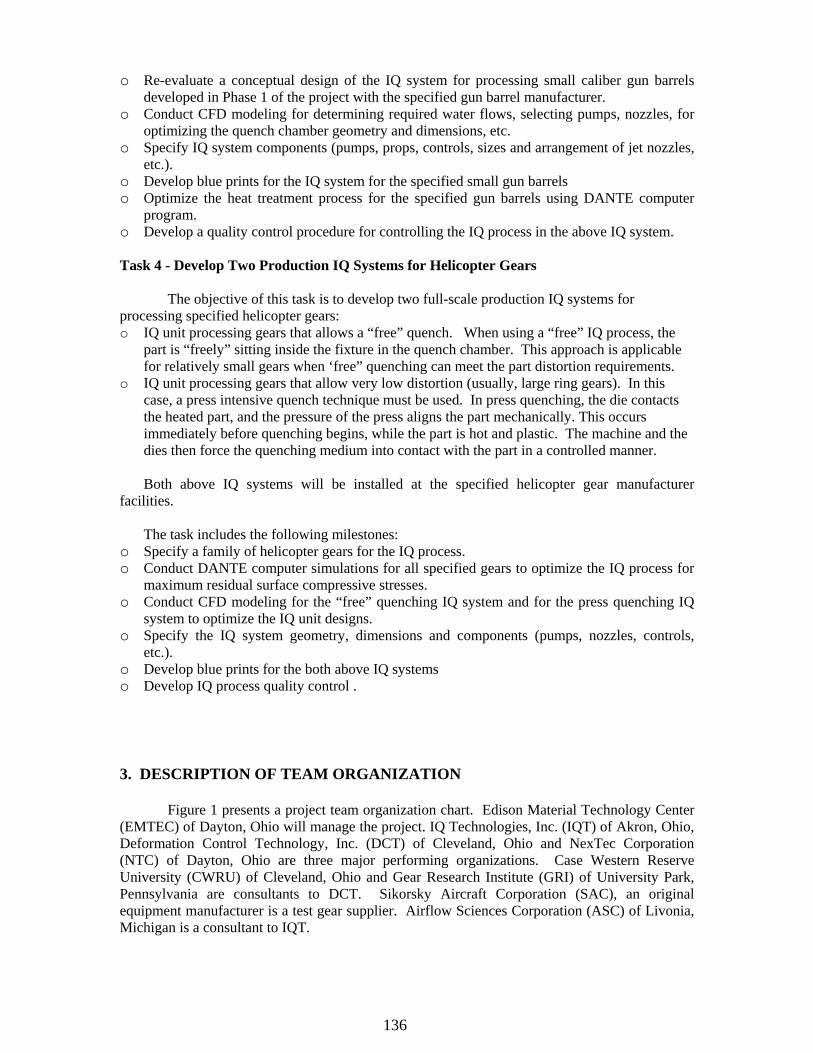
136
o Re-evaluate a conceptual design of the IQ system for processing small caliber gun barrels developed in Phase 1 of the project with the specified gun barrel manufacturer.
o Conduct CFD modeling for determining required water flows, selecting pumps, nozzles, for optimizing the quench chamber geometry and dimensions, etc.
o Specify IQ system components (pumps, props, controls, sizes and arrangement of jet nozzles, etc.).
o Develop blue prints for the IQ system for the specified small gun barrels o Optimize the heat treatment process for the specified gun barrels using DANTE computer
program. o Develop a quality control procedure for controlling the IQ process in the above IQ system. Task 4 - Develop Two Production IQ Systems for Helicopter Gears
The objective of this task is to develop two full-scale production IQ systems for processing specified helicopter gears: o IQ unit processing gears that allows a “free” quench. When using a “free” IQ process, the
part is “freely” sitting inside the fixture in the quench chamber. This approach is applicable for relatively small gears when ‘free” quenching can meet the part distortion requirements.
o IQ unit processing gears that allow very low distortion (usually, large ring gears). In this case, a press intensive quench technique must be used. In press quenching, the die contacts the heated part, and the pressure of the press aligns the part mechanically. This occurs immediately before quenching begins, while the part is hot and plastic. The machine and the dies then force the quenching medium into contact with the part in a controlled manner.
Both above IQ systems will be installed at the specified helicopter gear manufacturer
facilities. The task includes the following milestones:
o Specify a family of helicopter gears for the IQ process. o Conduct DANTE computer simulations for all specified gears to optimize the IQ process for
maximum residual surface compressive stresses. o Conduct CFD modeling for the “free” quenching IQ system and for the press quenching IQ
system to optimize the IQ unit designs. o Specify the IQ system geometry, dimensions and components (pumps, nozzles, controls,
etc.). o Develop blue prints for the both above IQ systems o Develop IQ process quality control . 3. DESCRIPTION OF TEAM ORGANIZATION
Figure 1 presents a project team organization chart. Edison Material Technology Center
(EMTEC) of Dayton, Ohio will manage the project. IQ Technologies, Inc. (IQT) of Akron, Ohio, Deformation Control Technology, Inc. (DCT) of Cleveland, Ohio and NexTec Corporation (NTC) of Dayton, Ohio are three major performing organizations. Case Western Reserve University (CWRU) of Cleveland, Ohio and Gear Research Institute (GRI) of University Park, Pennsylvania are consultants to DCT. Sikorsky Aircraft Corporation (SAC), an original equipment manufacturer is a test gear supplier. Airflow Sciences Corporation (ASC) of Livonia, Michigan is a consultant to IQT.
137
Figure 1 Project Team organization Chart
EMTEC is a member based not-for-profit Ohio Edison Center located in Dayton, Ohio, that has successfully managed multiple collaborative projects and consortia over the past nineteen years with an enviable record of commercial successes, startups, and spin-offs. EMTEC is focused on improving manufacturing and processing of materials and on the commercialization of potentially high-growth materials technology. EMTEC has over 120 industry members, 12 university members and several federal labs involved in its projects. During the past seven years EMTEC has been actively working with IQT in the development and wider acceptance of the IQ environmentally friendly alternative way of quenching steel parts.
IQT is a technology transfer company specializing in heat-treating process engineering,
research and development. IQT owns the patented IQ technology and the software package that is used for calculating IQ cooling recipes. The company has extensive experience in designing IQ systems for various applications. In 2005, IQT established a Center for Intensive Quenching at Akron Steel Treating Company facilities. The Center includes a variety of IQ equipment capable of quenching different steel products.
DCT is a small business focusing on materials manufacturing and performance
technologies. Providing metallurgical engineering services to the metals processing sector, the company specializes in process simulation and computer-based analysis of thermal and mechanical processes, such as, heat treatment, casting, forging, rolling, extrusion and powder consolidation. The company also provides technical services in the areas of comprehensive material characterization and metallurgical failure analysis. Founded in 1982 to service the metalworking community, DCT’s engineers are leaders in applying computer simulation methods to optimize thermal and mechanical processes; these areas include simulation of heat treatment involving phase transformations, analysis of deformation processes, and thermal-stress analysis of engineered materials components in service.
NTC has extensive experience with surface treatment technology, manufacturing process
development, technology insertion, technical and industrial base analysis, and multi-faceted program management expertise. In 1996, NexTec personnel conducted the Air Force’s first analysis of laser shock peening (LSP), titled “Laser Shock Peening vs. Shot Peening – A Damage Tolerance Investigation.” This study launched follow-on development and subsequent implementation of LSP as a surface enhancement technique. Based on the team’s involvement in shot peening and LSP, we have the knowledge and expertise to objectively evaluate IQ surface treatment benefits (residual compressive stresses) and applications to other DOD weapon systems.
EMTECProject
Management
IQT Process/ Equipment
Optimization
DCTModeling & Simulation
NTCEconomic
Analysis & T2
CWRU ASCGRI SAC
EMTECProject
Management
IQT Process/ Equipment
Optimization
DCTModeling & Simulation
NTCEconomic
Analysis & T2
CWRU ASCGRI SAC
138
GRI is affiliated with the Pennsylvania State University. The facility is equipped with a number of gear testing capabilities. These include rolling contact fatigue (RCF) testers for low- and high-temperature roller testing, power circulating (PC) gear testers for parallel axis gears with a 4-inch center distance (testers can be modified to accommodate other center distances), single tooth fatigue (STF) testers for spur and helical gears, gear tooth impact tester, and worm gear testers with 1.75 and 4-inch center distances.
SAC is actively involved in pursuing strategies for increasing rotorcraft transmission power to weight ratio – increasing the “power density.” Methodologies to achieve this include among others, enhancing Hertzian endurance limits and gear tooth bending strength. Some innovative technologies that are being investigated through active projects are near net shape forging and superfinishing. DCT, Inc. and IQ Technologies have been working with Sikorsky to achieve significant increase in bending fatigue strength of rotorcraft gears. Most of Sikorsky’s newer helicopter transmissions (S-92, RDS-21) and all of the planned future models (CH-53X, etc.) use Pyrowear® 53 gears. Pyrowear® 53 has significantly higher bending and Hertzian endurance levels, compared to the traditional 9310 steel. This has already resulted in a higher power-to-weight ratio for the transmissions. Gear tooth surface engineering, such as Diamond-Like-Carbon (DLC) coatings and Superfinishing have been shown to provide moderate increases in the baseline Hertzian endurance limit. The proposed Army project of providing a 25% increase in bending endurance limit through significant, controlled enhancement of residual compressive stresses will enable rotorcraft industries such as Sikorsky to significantly increase the power ratings of current and future helicopter drive systems without modifications to the design or envelope of the gearboxes. Increasing the power density of a weapon system is one of the most cost effective ways to obtain higher overall performance.
CWRU is a leading university in materials science and engineering. Its Materials Science
Department has state-of-the-art facilities for conducting a wide variety of metallurgical analyses. CWRU will be contracted for metallurgical support consultation, and to perform and assist in metallurgical testing, metallography and surface characterization work.
ASC is an engineering consulting firm. Since 1975, ASC has provided practical
solutions to industrial customers in the areas of fluid flow, heat transfer, and mass transfer. ASC uses a variety of methods to solve its' customers' problems, including field-testing, laboratory testing, and numerical simulation. ASC engineers specialize in the development and application of numerical simulation methods. Computational Fluid Dynamics (CFD) techniques have been used to solve a wide variety of engineering problems involving flow, heat transfer, and chemical reaction.