Embed Size (px)
Citation preview

1
Assessment Office (808) 956‐4283Hawai‘i Hall 107 2500 Campus Road, (808) 956‐6669Honolulu, HI 96822 manoa.hawaii.edu/assessment
You may use these materials only for nonprofit educational purposes. Please give credit/cite appropriately
HOW GOOD IS YOUR MULTIPLE-CHOICE TEST?
Making Program Assessment Happen Workshop Series
1INTENDED OUTCOMES1. Articulate the purpose and need of item analysis
2. Define the statistics below in either words or math functions.
1. Item facility
2. Difference index
3. B-index
3. Explain the function of distractor analysis
4. Calculate item analysis indices in Excel
5. Identify the proper index to use in pre- & post-test and contrasting group scenarios.
6. Evaluate items based on analysis results.
2

2
Assessment Office (808) 956‐4283Hawai‘i Hall 107 2500 Campus Road, (808) 956‐6669Honolulu, HI 96822 manoa.hawaii.edu/assessment
You may use these materials only for nonprofit educational purposes. Please give credit/cite appropriately
WORKSHOP AGENDA1. Purpose of item analysis
2. Introducing item facility, difference index, & B-index
3. Excel practice 1
4. Introducing distractor analysis
5. Excel practice 2
6. Introducing item analysis software
7. Questions & Evaluation
3
Mission: Improve student learning through program assessment
4

3
Assessment Office (808) 956‐4283Hawai‘i Hall 107 2500 Campus Road, (808) 956‐6669Honolulu, HI 96822 manoa.hawaii.edu/assessment
You may use these materials only for nonprofit educational purposes. Please give credit/cite appropriately
Learning Outcomes
Learning Opportunities
Collection & Analysis of EvidenceAssessment Results
Improvement Plan
PROGRAM ASSESSMENT OVERVIEW
Assessment Cycle
5
WHY SCRUTINIZETEST ITEMS?• Ensure accurate measurement of
knowledge/skill
• Increase confidence in drawing conclusions
• Outcome achievement
• Student knowledge/skill level
• Teaching effectiveness
• Enhance student learning
• Increase student engagement
• Avoid demoralizing students
6
4
Assessment Office (808) 956‐4283Hawai‘i Hall 107 2500 Campus Road, (808) 956‐6669Honolulu, HI 96822 manoa.hawaii.edu/assessment
You may use these materials only for nonprofit educational purposes. Please give credit/cite appropriately
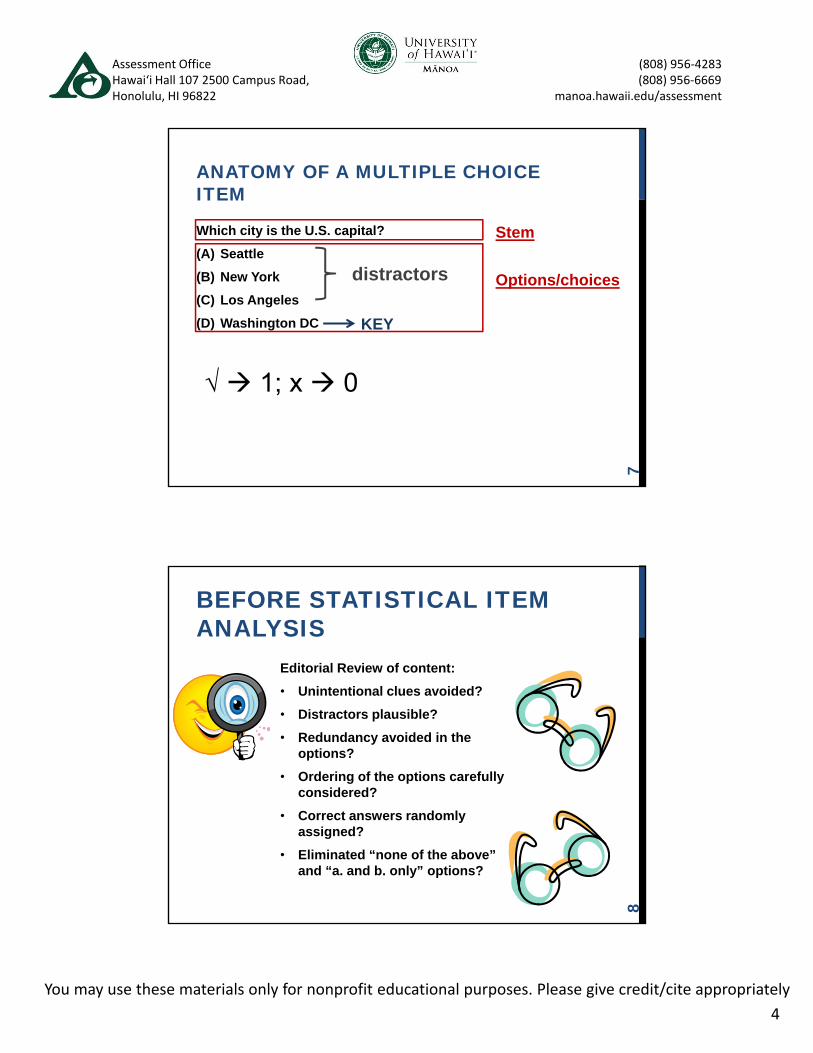
ANATOMY OF A MULTIPLE CHOICE ITEM
Which city is the U.S. capital?
(A) Seattle
(B) New York
(C) Los Angeles
(D) Washington DC
Stem
Options/choicesdistractors
KEY
√ 1; x 0
7
BEFORE STATISTICAL ITEM ANALYSIS
Editorial Review of content:
• Unintentional clues avoided?
• Distractors plausible?
• Redundancy avoided in the options?
• Ordering of the options carefully considered?
• Correct answers randomly assigned?
• Eliminated “none of the above” and “a. and b. only” options?
8
5
Assessment Office (808) 956‐4283Hawai‘i Hall 107 2500 Campus Road, (808) 956‐6669Honolulu, HI 96822 manoa.hawaii.edu/assessment
You may use these materials only for nonprofit educational purposes. Please give credit/cite appropriately
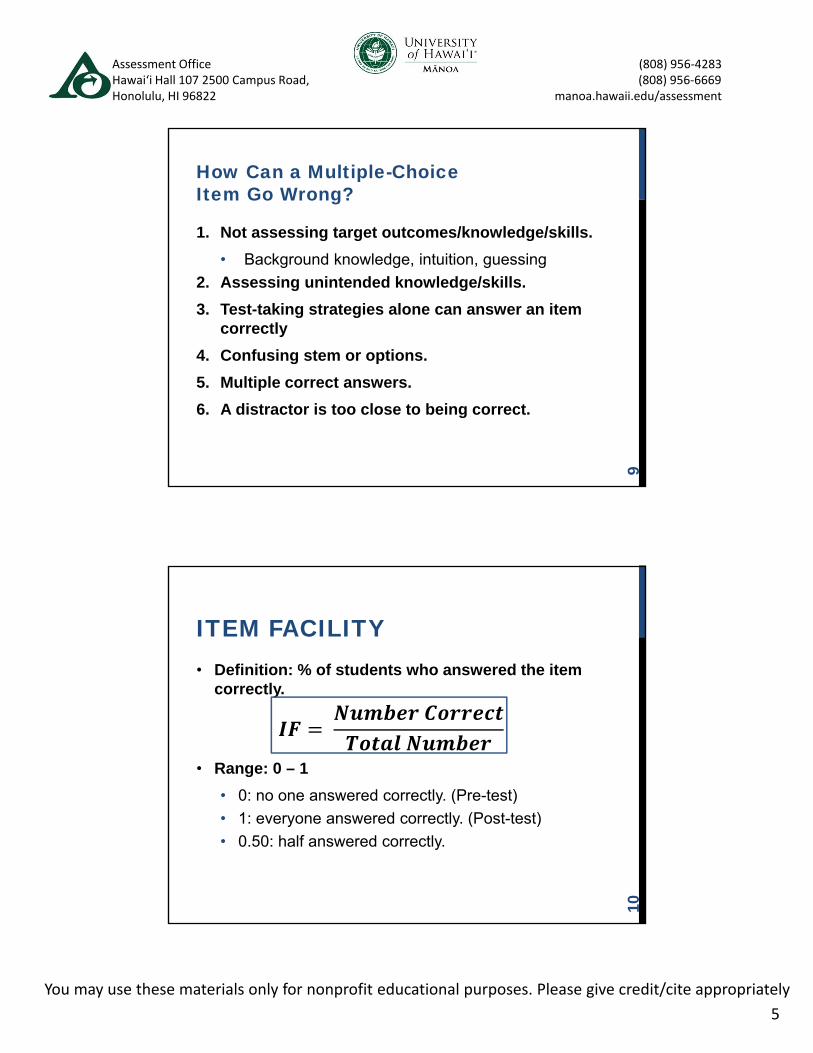
How Can a Multiple-Choice Item Go Wrong?
1. Not assessing target outcomes/knowledge/skills.
• Background knowledge, intuition, guessing
2. Assessing unintended knowledge/skills.
3. Test-taking strategies alone can answer an item correctly
4. Confusing stem or options.
5. Multiple correct answers.
6. A distractor is too close to being correct.
9ITEM FACILITY• Definition: % of students who answered the item
correctly.
• Range: 0 – 1
• 0: no one answered correctly. (Pre-test)
• 1: everyone answered correctly. (Post-test)
• 0.50: half answered correctly.
10

6
Assessment Office (808) 956‐4283Hawai‘i Hall 107 2500 Campus Road, (808) 956‐6669Honolulu, HI 96822 manoa.hawaii.edu/assessment
You may use these materials only for nonprofit educational purposes. Please give credit/cite appropriately
ITEM FACILITY = NO. CORRECT / TOTAL
Students Item1 Item2 Item3 Item4 Item501_Robert 1 1 1 1 102_Millie 1 0 1 1 103_Dean 1 0 0 1 104_Shenan 1 1 0 1 105_Cuny 1 1 1 1 106_Corky 1 0 1 1 107_Randy 1 1 0 1 108_Jeanne 1 1 0 0 109_Iliana 1 1 1 0 110_Lindsey 0 0 0 0 1Item Facility = 0.9 0.6 0.5 0.7 1.0
910
9/10
11
COMPARING PERFORMANCE ON ITEMS• Pre- and post-test comparison – Difference
index
• Contrasting group comparison – B-index
12

7
Assessment Office (808) 956‐4283Hawai‘i Hall 107 2500 Campus Road, (808) 956‐6669Honolulu, HI 96822 manoa.hawaii.edu/assessment
You may use these materials only for nonprofit educational purposes. Please give credit/cite appropriately
DIFFERENCE INDEX (DI)• Definition: The difference in item facility between
the pre- and post-tests.
• Possible range: - 1 to 1
• -1: Post – all x; Pre – all √
• 1 : Post – all √; Pre – all x
• Acceptable value: higher than 0
DI = IFpost - IFpre
13DIFFERENCE INDEX = IFPOST - IFPRE
Items 1 2 3 4 5
Pre Post Pre Post Pre Post Pre Post Pre Post
Monica 0 1 1 1 0 0 1 0 0 1
Yao 0 1 0 1 0 0 1 0 1 1
Dick 0 1 1 1 0 0 1 0 0 1
Karen 0 1 0 1 0 0 1 0 0 1
IF
DI
0.0 1.0 0.5 1.0 0.0 0.0 1.0 0.0 0.25 1.0
1.0 0.5 0.0 -1.0 0.75
14

8
Assessment Office (808) 956‐4283Hawai‘i Hall 107 2500 Campus Road, (808) 956‐6669Honolulu, HI 96822 manoa.hawaii.edu/assessment
You may use these materials only for nonprofit educational purposes. Please give credit/cite appropriately
B-INDEX• Definition: The difference of item facility between the
those who succeeded (masters) and those who failed the test (non-masters).
• Possible range: - 1 to 1
• -1: Masters – all x; Non-masters – all √
• 1 : Masters – all √; Non-masters – all x
• Acceptable value: higher than 0
B-index = IFmaster – IFnon-master
15
B-INDEX = IFMASTER – IFNON-MASTERStudents Item1 Item2 Item3 Item4 Total01_Robert 1 0 1 1 90
02_Millie 1 0 1 1 85
03_Dean 1 0 1 1 80
04_Shenan 1 0 0 1 80
05_Cuny 1 0 1 1 70
06_Jeanne 0 1 0 1 60
07_Iliana 0 1 1 1 40
08_Lindsey 0 1 0 1 20
IFmaster
IFnonmasterB‐index 1.0 -1.0 0.5 0.0
1.0 0.0 0.8 1.00.0 1.0 0.3 1.0
70% cut-point
16

9
Assessment Office (808) 956‐4283Hawai‘i Hall 107 2500 Campus Road, (808) 956‐6669Honolulu, HI 96822 manoa.hawaii.edu/assessment
You may use these materials only for nonprofit educational purposes. Please give credit/cite appropriately
EXCEL PRACTICE 1
17DISTRACTOR ANALYSIS• Function of a distractor: to attract students who
do not know the correct answer.
• Attribute: plausible but incorrect
• Distractor efficiency index: % who select that option
• A good distractor will:
• Attract none of the masters, or fewer masters than non-masters
• Attract non-masters at a random chance level (33% for a 4-choice item)
18

10
Assessment Office (808) 956‐4283Hawai‘i Hall 107 2500 Campus Road, (808) 956‐6669Honolulu, HI 96822 manoa.hawaii.edu/assessment
You may use these materials only for nonprofit educational purposes. Please give credit/cite appropriately
DISTRACTOR ANALYSIS EXERCISE
HANDOUT 1
19
EXCEL PRACTICE 2
20

11
Assessment Office (808) 956‐4283Hawai‘i Hall 107 2500 Campus Road, (808) 956‐6669Honolulu, HI 96822 manoa.hawaii.edu/assessment
You may use these materials only for nonprofit educational purposes. Please give credit/cite appropriately
ITEM ANALYSIS SOFTWARE- TAP (free):
http://www.ohio.edu/people/brooksg/tap_download.htm
- CITAS (free): http://www.assess.com/xcart/product.php?productid=407
- Iteman 4 (demo version limited to 50 items and 50 examinees): http://www.assess.com/xcart/product.php?productid=417&download=1&url=Iteman4212.zip
- Web-based Attainment Calculator: http://attainmentcalculator.fancyfoxpublications.net/Start.aspx
2122

12
Assessment Office (808) 956‐4283Hawai‘i Hall 107 2500 Campus Road, (808) 956‐6669Honolulu, HI 96822 manoa.hawaii.edu/assessment
You may use these materials only for nonprofit educational purposes. Please give credit/cite appropriately
Input keys for each itemNumber of options per item
“Y” to include items for analysis
2324

13
Assessment Office (808) 956‐4283Hawai‘i Hall 107 2500 Campus Road, (808) 956‐6669Honolulu, HI 96822 manoa.hawaii.edu/assessment
You may use these materials only for nonprofit educational purposes. Please give credit/cite appropriately
25ALTERNATIVE TERMS• Item Facility item difficulty, p (proportion) value
• Difference Index Instruction sensitive item analysis (Crocker & Algina, 2008), intervention strategy (Brown, 1996)
• B-index Differential group strategy (Brown, 1996)
• Distractor analysis distractor efficiency analysis
26

Assessment Office Item Analysis Workshop Mar 1, 2013
Excel Practice 1
Part 1: Calculating Item Facility (IF)
1. Open the sheet IF_Data in your data file: Item_Analysis_Practice1.
2. Prepare your data. Student names or IDs should be in Column A. Each item occupies a column.
An item is scored 1 if it is correctly answered and 0 for an incorrect answer. The last column
shows the total score for each student.
3. Sort the data on the Total variable in the descending order (largest to smallest).
4. There are several ways to calculate item facility in Excel. The more intuitive way is to use
formula: = SUM(B2:B17)/16. An Excel formula starts with the equal sign ( = ). SUM is a
function to add up all the values specified in the parenthesis. B2:B17 specifies the data range
starting from B2 and ending at B17. The column ( : ) translates as “to.” The back slash ( / )is a
division symbol. Enter this formula in Cell B18. Copy and paste this cell to C18 to K18.
5. Examine the results and identify the best and worst items if these items are used on a post‐test.
Part 2: Calculating Difference Index
1. Open the sheet ID_Data in your data file.
2. The IFs are already calculated for the pre‐ and post‐tests. Calculate the difference by entering
the following formula for Item 1 in Cell F3: =B3‐D3. The formula says: deduct the value in D3
from the value in B3.
3. Copy the formula in Cell F3 to the rest of the items (ranging from F4 to F22).
4. Examine the results and identify the best and worst items.
Part 3: Calculating B‐Index
1. Open the sheet B‐Index_Data in your data file.
2. Observe that the students’ scores are already sorted in the descending order. Those who passed
the course and those who failed have been identified and separated into two groups: masters
and non‐masters.
3. Calculate IFmaster for Item 1: In Cell B25, type the formula: =AVERAGE(B4:B17).
4. Calculate IFnon‐master for Item 1: In Cell B26, type the formula: =AVERAGE(B19:B24).
5. Calculate B‐index for Item 1: In Cell B27, type the formula: =B25‐B26
6. Select cells B25, B26, and B27, copy, and paste to the cells for the rest of the items.
7. Examine the results and identify the best and worst items.

Assessment Office Item Analysis Workshop Mar 1, 2013
Excel Practice II: Distractor Analysis
1. Open the sheet distractor in the file distractor analysis template. This sheet has the raw data.
2. Copy the data including ids and responses for Item 1 to Item 10. Be sure to include the first row
with column headers. Paste the data in the top portion of the second sheet
calculation_template. You can see the results automatically updated at the bottom portion.
3. The sheet calculation_template was split into two windows. The top window from Row 1 to
Row 1001 is the section that you can paste your own data. The template allows for up to 1000
examinees and up to 300 items. The distractor efficiency indices are calculated automatically in
row 1008 to Row 111.
4. Copy the distractor efficiency indices (Row 1008 to Row 1011) and paste special as values and
number format + Transpose in the sheet Report.

Assessment Office Item Analysis Workshop Mar 1, 2013
Distractor Analysis Exercise Handout
Distractor Efficiency
Options
Item Number IF Group a. b. c. d.
1 0.94 High 1.00* 0.00 0.00 0.00
Low 0.80* 0.20 0.00 0.00
2 0.56 High 0.40 0.00 0.60* 0.00
Low 0.13 0.07 0.60* 0.20
3 0.44 High 0.12 0.60* 0.13 0.15
Low 0.21 0.20* 0.27 0.32
4 0.50 High 1.00* 0.00 0.00 0.00
Low 0.00* 0.34 0.32 0.34
5 1.00 High 0.00 0.00 0.00 1.00*
Low 0.00 0.00 0.00 1.00*
6 0.44 High 0.06 0.00 0.80* 0.11
Low 0.49 0.00 0.20* 0.31
7 0.50 High 0.00* 0.80 0.08 0.12
Low 1.00* 0.00 0.00 0.00
8 0.63 High 0.08 0.12 0.80* 0.00
Low 0.20 0.19 0.40* 0.21
9 0.38 High 0.72 0.08 0.00 0.20*
Low 0.13 0.13 0.14 0.60*
10 0.00 High 0.84 0.00* 0.13 0.03
Low 0.17 0.00* 0.37 0.46
*Correct option. Adapted from Brown (1996, p. 72).

Assessment Office Item Analysis Workshop Mar 1, 2013
List of Item Analysis Indices Covered in the Workshop
Item Analysis Index
Definition in Words Calculation Formula
Item Facility (IF) % of students who answered the item correctly
Difference Index (DI)
Difference in IFs between the pre and post‐tests
= IFpost ‐ IFpre
B‐Index Difference in IFs between the masters and non‐masters
= IFmaster – IFnon‐master
Distractor Efficiency Index
% of examines who chose that option
List of Excel Formulas Covered in the workshop
Formula Example Explanation
=SUM(DATA RANGE) =SUM(B2:B17) Add up the values in the data range from B2 to B17
=AVERAGE(DATA RANGE) =AVERAGE(B2:B17) Average the values in the data range from B2 to B17
=COUNTA(DATA RANGE) =COUNTA(B2:B17) Count the number of text values in the data range from B2 to B17.
=COUNTIF(DATA RANGE,CRITERION)
=COUNTIF(B2:B17,”A”) Count all the ocurrencies of text A in the data range from B2 to B17. If the criterion is a number, don’t use the quotation mark around it.
=CELL A/CELL B =B2/B17 The value in B2 divided by the value in B17 Common rules of Excel formula:
1. Always start with the equal sign ( = ). 2. Specify data range in the parenthesis.
Resources
Brown, J.D. (1996). Testing in language programs. Upper Saddle River, NJ: Prentice Hall.
Crocker, L., & Algina, J. (2008). Introduction to classical & modern test theory. Mason, OH: Cengage
Learning.
Elvin, C.(n.d.). Test item analysis using Microsoft Excel spreadsheet program. Retrieved from
http://www.eflclub.com/elvin/publications/2003/itemanalysis.html
Fulcher, G. (n.d.). Excel spreadsheets for classical test analysis. Retrieved from
http://languagetesting.info/statistics/excel.html
Matlock‐Hetzel, S. (1997). Basic concepts in item and test analysis. Retrieved from
http://www.ericae.net/ft/tamu/Espy.htm
Quirante, S. (n.d.). Item & distracter analysis[PowerPoint slides]. Retrieved from
http://www.slideshare.net/suequirante/item‐and‐distractor‐analysis
![Untitled Page 002 [manoa.hawaii.edu]manoa.hawaii.edu/hpicesu/book/1988_chap/18.pdf · challenge to their survival. Most alien plants evolved in continental ecosys- tems where competition](https://img.pdfslide.us/doc/110x75/5e39f4371c5dc308ff337f40/untitled-page-002-manoa-manoa-challenge-to-their-survival-most-alien-plants.jpg)


![Untitled Page 002 [manoa.hawaii.edu]manoa.hawaii.edu/hpicesu/book/1988_chap/10.pdf · Untitled_Page_002.jpg Author: Admin Created Date: 11/24/2004 2:03:18 PM](https://img.pdfslide.us/doc/110x75/5f642285fd4df30c1b6c5285/untitled-page-002-manoa-manoa-untitledpage002jpg-author-admin-created-date.jpg)
![Untitled Page 002 [manoa.hawaii.edu]manoa.hawaii.edu/hpicesu/book/1988_chap/03.pdf · Azonal Soils Soil and Watershed Management Grazing Animals Forestation Important References](https://img.pdfslide.us/doc/110x75/5b8356c47f8b9a315b8cfea6/untitled-page-002-manoa-manoa-azonal-soils-soil-and-watershed-management.jpg)