Embed Size (px)
Citation preview
INDC- Vulnerability Report 2015
REPORT
Intended Nationally Determined Contributions
Template for Vulnerability Assessment, Mitigation and Adaptation
Government of India
Ministry of Water Resources, River Development and Ganga Rejuvenation
National Water Mission
. . . . . . . .
INDC- Vulnerability Report 2015
Page I
Table of Contents Table of Figures ...................................................................................................................................... II
List of Tables .......................................................................................................................................... II
Chapter 1: Introduction ............................................................................................................................. 1
1.1 IPCC 5th Assessment Report summary – Water Sector ...................................................................... 1
1.2 India‘s Second National Communication to UNFCCC -water sector ................................................... 1
Chapter 2: India‘s GHG Emission Sources (with respect to water sector) ..................................................... 2
2.1 Waste ............................................................................................................................................. 3
2.1.1 Domestic waste water................................................................................................................ 3
2.1.2 Industrial waste water................................................................................................................ 4
2.2 Agriculture ..................................................................................................................................... 4
2.3 Energy ............................................................................................................................................ 5
2.4 Desalination .................................................................................................................................... 6
Chapter 3: Water resources........................................................................................................................ 6
3.1 Surface Water ................................................................................................................................. 6
3.1.1 Rivers....................................................................................................................................... 6
3.1.2 Water Bodies .......................................................................................................................... 10
3.1.3 Glaciers .................................................................................................................................. 11
3.2 Ground Water ............................................................................................................................... 12
Chapter 4: Vulnerability of Water Resources ............................................................................................ 14
4.1 Precipitation.................................................................................................................................. 14
4.2 Droughts....................................................................................................................................... 17
4.3 Floods .......................................................................................................................................... 18
4.4 Salination ..................................................................................................................................... 20
Chapter 5: Impacts of Climate change on Water Availability and Demand ................................................. 20
Chapter 6: Strategies for Adaptation ........................................................................................................ 23
6.1 National Water Policy.................................................................................................................... 23
6.2 National Water Mission ................................................................................................................. 25
6.3 Surface water ................................................................................................................................ 26
6.4 Ground water ................................................................................................................................ 29
6.5 National Mission for Clean Ganga .................................................................................................. 31
5.6 Mitigation and Adaptation measures to aim for................................................................................ 32
Chapter 7: Constraints, Gaps and Related Financial, Technical and Capacity Needs .................................... 34
Chapter 8: BIBLIOGRAPHY .................................................................................................................. 36
Template for INDC – Adaptation............................................................................................................. 38
ANNEXURE 1: Potential impacts on water sector - IPCC ......................................................................... 69

INDC- Vulnerability Report 2015
Page II
Table of Figures Figure 1: Basin wise distribution of Estimated Utilizable surface ................................................................. 8
Figure 2: Categorization of Ground water Blocks (2011) ........................................................................... 13
Figure 3: Change in precipitation towards the 2030s and 2080s with respect to 1970s ................................. 15
Figure 4: change in water yield towards 2030s and 2080s with respect to 1970s.......................................... 16
Figure 5: Change in Evapo-transpiration (crop water demand) towards 2030s and 2080s with respect to 1970s
.............................................................................................................................................................. 17
Figure 6: Change in monsoon draught weeks towards 2030s and 2080s with respect to 1970s...................... 18
Figure 7: Change in stream flow towards 2030s and 2080s with respect to 1970s stream discharge at 99th
percentile - extremely high flow .............................................................................................................. 19
List of Tables Table 1: India‘s GHG emissions, by sector (2000) ...................................................................................... 2
Table 2: Greenhouse gas emissions: Waste sector (2000) ............................................................................ 3
Table 3: India‘s Domestic waste water potential and treatment capacity gaps................................................ 3
Table 4: River-wise sewage treatment capacity and utilization ..................................................................... 4
Table 5: India's industrial waste water potential and treatment gap (2005) .................................................... 4
Table 6: Greenhouse gas emission, agriculture sector (2000) ....................................................................... 4
Table 7: Green House gas emission breakup for Rice cultivation, India, (2000) ............................................ 5
Table 8: Water resources potential of river basins of India ........................................................................... 7
Table 9: Percentage of water Resources Potential in Major Basins ............................................................... 8
Table 10: Per Capita Average Annual Water Availability ............................................................................ 9
Table 11: Live Storage Capacities of Reservoirs, Basin wise ....................................................................... 9
Table 14: Inland water resources of India ................................................................................................. 10
Table 12: Ground Water Statistics of India, 2011 ...................................................................................... 12
Table 13: Categorization of Blocks/Mandals/Firkka Talukas ..................................................................... 12
Table 15 Vulnerability scale of Water Availability by basin – 2040, 2070, 2100 ......................................... 21
Table 16: Sector-Wise Water Demand for 2010, 2025, 2050...................................................................... 21
Table 18: Irrigation Potential of India....................................................................................................... 23
INDC- Vulnerability Report 2015
Page 1
Chapter 1: Introduction India is one of the stakeholders to the United Nations Framework Convention on Climate Change (UNFCCC)
and the Government of India attaches great importance to climate change issues. The Convention aims to
stabilize greenhouse gas concentrations in the atmosphere at levels that would prevent dangerous
anthropogenic interference with the climate system. India is a vast country covering 3.28 million km² with
diverse surface features. It occupies only 2.4 percent of the world‘s geographical area, but supports 17.5 per
cent of the global human population. India is endowed with varied soils, climate, biodiversity and ecological
regimes.
This report is a submission of India‘s Intended Nationally Determined Contributions (INDC) in respect to the
water sector. The report includes a detailed account of the country‘s water resources, vulnerability analysis of
climate change to water sector in India as well as schemes of Ministry of Water Resources, River
Development and Ganga Rejuvenation provided as templates of ‗Mitigation‘ and ‗Adaptation‘ as per format
provided by the Ministry of Environment, Forests and Climate Change, Government of India. International
and National as well as private sector organization reports have been studied to formulate a well-established
understanding of sectors related to water and their extent of impact due to Climate Change.
1.1 IPCC 5th Assessment Report summary – Water Sector IPCC
1 considers how impacts and risks related to climate change can be reduced and managed through
Adaptation and Mitigation measures. Impacts of such climate related extremes include alteration of
ecosystem, disruption of food production and water supply, damage to infrastructure and settlement and
consequences for human well-being. Potential Impacts on fresh water resources, ground water, energy
production, Municipal services and water uses in agriculture, as highlighted in the IPCC report have been
included as ANNEXURE 1.
1.2 India’s Second National Communication to UNFCCC -water sector As per India‘s Second National Communication to UNFCCC
2 (2012), India identifies water as the most
critical component of life support system. According to the UN World Population database, India shares
nearly 17.5% of the global population, but it has only 4% of the total freshwater resources. India is a land of
many rivers. There are 12 major river basins in the country, the total catchment area of which is 252.8 million
hectare (MHA), covering more than 75% of the total area of the country. The rivers in India are classified as
the Himalayan Rivers, Peninsular Rivers, Coastal Rivers, and Inland Drainage Basin.
Groundwater is another major component of the total available water resources. Findings in India‘s Second
National Communication to UNFCCC (2012 report) suggest, in the coming years, the groundwater utilization
for expansion of irrigated agriculture and achievement of national targets of food production is likely to
increase manifold. Although groundwater resource is replenished annually, its spatio-temporal availability is
not uniform. Extraction of large volumes of ground water without equivalent replenishment leads to faster
depletion of water table, affecting water quality. Also more energy is needed to pump out water from a deeper
water table.
India has reasons to be concerned about climate change. The estimated utilizable water resources stand at
1123 km³, with the surface water resources contributing 60% and the groundwater resources contributing the
rest. Its large population depends upon climate-sensitive sectors like agriculture and forestry for its livelihood.
Any adverse impact on water availability due to recession of glaciers, decrease in rainfall and increased
flooding in certain pockets would threaten food security and adversely impact the coastal system due to sea-
1Intergovernmental panel on Climate Change - Fifth Assessment Synthesis Report – Adopted Nov. 2014
2Second National Communication to the United Nations Framework Convention on Climate Change – Ministry of
Environment and Forests and Climate Change (MoEF & CC), Government of India 2012

INDC- Vulnerability Report 2015
Page 2
level rise and increased extreme events. This aside, achievement of vital national development goals related to
other systems such as Habitats, Health, Energy Demand and Infrastructure investments would be adversely
affected.
Chapter 2: India’s GHG Emission Sources (with respect to water sector) As per India‘s Communication to UNFCCC (2012 report), in 2000, India emitted 1,523,777.44 Gg CO₂ eq.
(1523.78Mt of CO₂ eq.) from the energy, industrial processes & product use, agriculture, and waste
management sectors. The summary of the emissions of GHG by each sector is presented below –
Table 1: India’s GHG emissions, by sector (2000)3
GREENHOUS E GAS EMISS IONS, BY S ECTOR, 2000
CO₂ Emission
(Gg)
CO₂ Removal
(Gg)
CH₄ (Gg)
N₂O
(Gg)
HFC
-
134a
(Gg)
HFC
– 23
(Gg)
CF₄
(Gg)
C₂F₆
(Gg)
SF₆
(Gg)
CO₂ equivalent
(Gg)
1. Energy 952,212.06 2991.42 38.66 1,027,016.4
8
2. Industrial
Processes and
product use
72,560.78 5.39 12.80 0.22
0
0.42
0
0.87
0
0.08
7
0.01
3
88,608.07
3. Agriculture 14,088.3
0
192.7
3
355,600.60
4. Waste 2,307.19 13.23 52,552.29
Total (excluding
LULUCF)
1,024,772.8
4
19,392.3
0
257.4
2
0.22
0
0.42
0
0.87
0
0.08
7
0.01
3
1,523,777.4
4
Total (With
LULUCF)
236,257.4
3
552.38 6.74 1,301,209.3
9
International
Bunkers
3,467.12 0.05 0.10 3,498.86
Aviation 3,194.12 0.02 0.089 3,222.13
Maritime/navigati
on
273.00 0.03 0.010 276.73
CO₂ from biomass 376,005.00 376,005.00
Calculated using Global Warming Potential
CO₂ - Carbon Dioxide; CH₄ - Methane; N₂O – Nitrous Oxide; HFC – Hydrofluorocarbon; CF₄ -
Tetrafluoromethane; C₂F₆ - Hexafluoroethane; SF₆ - Sulphur Hexafluoride
The emissions of CO₂ from the energy sector relative to the total GHG emissions, excluding LULUCF, were
by far the largest in 2000. The contribution of CO₂ was 92.7% of the total emissions from the energy sector.
The agriculture sector mainly accounted for the emissions of CH₄ and N₂O, with 73.0% of the total CH₄ and
75.0% of the total N₂O emitted in 2000 being attributed to the agriculture sector. The synthetic gases (HFCs,
PFCs, and SF₆) were entirely emitted from the industrial processes.
Sector-wise Description
As per the IPCC report, India‘s Communication for UNFCCC (2012 report) data and reports published by
Govt. departments, the following broad heads have been identified to indicate GHG emissions in the water
sector. The data for overall GHG emissions is a constraint in compilation and has been identified in ‗Chapter
6: Constraints, Gaps and Related Financial, Technical and Capacity Needs‘.
3 Second National Communicat ion to the United Nations Framework Convention on Climate Change – Ministry of
Environment and Forests and Climate Change (MoEF & CC), Government of India, 2012
INDC- Vulnerability Report 2015
Page 3
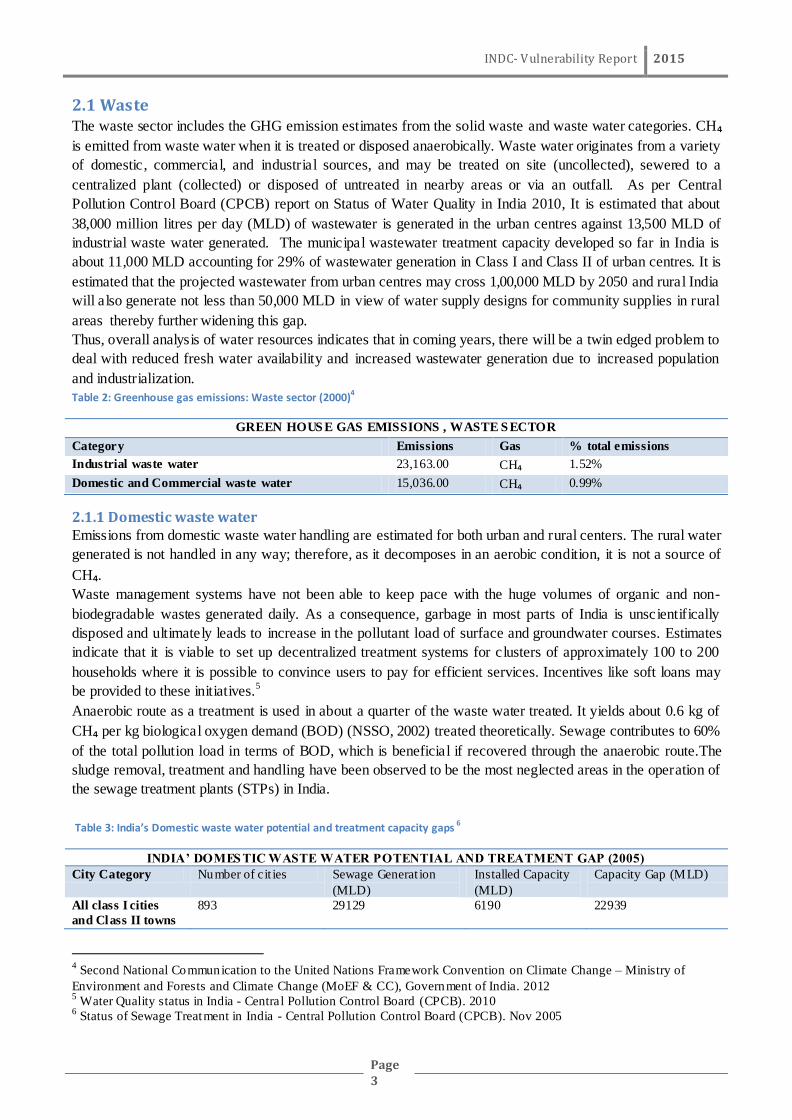
2.1 Waste The waste sector includes the GHG emission estimates from the solid waste and waste water categories. CH₄
is emitted from waste water when it is treated or disposed anaerobically. Waste water originates from a variety
of domestic, commercial, and industrial sources, and may be treated on site (uncollected), sewered to a
centralized plant (collected) or disposed of untreated in nearby areas or via an outfall. As per Central
Pollution Control Board (CPCB) report on Status of Water Quality in India 2010, It is estimated that about
38,000 million litres per day (MLD) of wastewater is generated in the urban centres against 13,500 MLD of
industrial waste water generated. The municipal wastewater treatment capacity developed so far in India is
about 11,000 MLD accounting for 29% of wastewater generation in Class I and Class II of urban centres. It is
estimated that the projected wastewater from urban centres may cross 1,00,000 MLD by 2050 and rural India
will also generate not less than 50,000 MLD in view of water supply designs for community supplies in rural
areas thereby further widening this gap.
Thus, overall analysis of water resources indicates that in coming years, there will be a twin edged problem to
deal with reduced fresh water availability and increased wastewater generation due to increased population
and industrialization.
Table 2: Greenhouse gas emissions: Waste sector (2000)4
GREEN HOUS E GAS EMISSIONS , WASTE S ECTOR
Category Emissions Gas % total emissions
Industrial waste water 23,163.00 CH₄ 1.52%
Domestic and Commercial waste water 15,036.00 CH₄ 0.99%
2.1.1 Domestic waste water Emissions from domestic waste water handling are estimated for both urban and rural centers. The rural water
generated is not handled in any way; therefore, as it decomposes in an aerobic condition, it is not a source of
CH₄.
Waste management systems have not been able to keep pace with the huge volumes of organic and non-
biodegradable wastes generated daily. As a consequence, garbage in most parts of India is unscientifically
disposed and ultimately leads to increase in the pollutant load of surface and groundwater courses. Estimates
indicate that it is viable to set up decentralized treatment systems for clusters of approximately 100 to 200
households where it is possible to convince users to pay for efficient services. Incentives like soft loans may
be provided to these initiatives.5
Anaerobic route as a treatment is used in about a quarter of the waste water treated. It yields about 0.6 kg of
CH₄ per kg biological oxygen demand (BOD) (NSSO, 2002) treated theoretically. Sewage contributes to 60%
of the total pollution load in terms of BOD, which is beneficial if recovered through the anaerobic route.The
sludge removal, treatment and handling have been observed to be the most neglected areas in the operation of
the sewage treatment plants (STPs) in India.
Table 3: India’s Domestic waste water potential and treatment capacity gaps 6
INDIA’ DOMES TIC WASTE WATER POTENTIAL AND TREATMENT GAP (2005)
City Category Number of cit ies Sewage Generat ion
(MLD)
Installed Capacity
(MLD)
Capacity Gap (MLD)
All class I cities
and Class II towns
893 29129 6190 22939
4 Second National Communication to the United Nations Framework Convention on Climate Change – Ministry of
Environment and Forests and Climate Change (MoEF & CC), Government of India. 2012 5 Water Quality status in India - Central Pollution Control Board (CPCB). 2010
6 Status of Sewage Treatment in India - Central Pollution Control Board (CPCB). Nov 2005

INDC- Vulnerability Report 2015
Page 4
As per CPCB report on Performance Evaluation of Sewage Treatment Plants, 2013, the following is the river
wise sewage treatment capacity and utilized capacity. It is observed that STP‘s along Ganga need
improvement in capacity utilization.
Table 4: River-wise sewage treatment capacity and utilization 7
RIVER-WIS E S EWAGE TREATMENT CAPACITY AND UTILIZATION
Discharge to river Designed capacity Utilized capacity % of treatment
Ganga 587 322 55
Godavari 151 129 85
Hindon 164 138 84
Musi 541 480 89
Satluj 588 564 96
Yamuna River 754 562 75
Others 393 249 63
Land/Irrigation 1538 682 44
Total 4716 3126 66
2.1.2 Industrial waste water
CH₄ emission from waste water has been estimated based on the waste water produced in industries, using the
IPCC 2006 Guidelines. Emission factors are based on CH₄ emission per tonne of product used and are taken
from industry sources. Steel, fertilizer, beer, meat production, sugar, coffee, soft drinks, pulp and paper,
petroleum refineries, rubber, and tannery industries accounting for more than 95% of CH₄ from this category
have been included for estimating CH₄ from industrial waste water.
The Industrial waste water treatment potential of India as opposed to the generation of industrial waste water
is provided as per the table below. The following analysis can provide a general view of status of industrial
waste water treatment and capture potential in India. Treated Industrial waste water from CETP‘s is disposed
in the rivers.
Table 5: India's industrial waste water potential and treatment gap (2005)8
INDIA’ INDUSTRIAL WAS TE WATER POTENTIAL AND TREATMENT GAP
Number of CETP
installed
Estimated Effluent Generat ion
MLD)
Installed Capacity (MLD) Capacity Gap (MLD)
88 13,500 550 12950
2.2 Agriculture As per India‘s Communication for UNFCCC report (2012 report), the estimation of the GHG emissions from
the agriculture sector is from the following source categories:
Table 6: Greenhouse gas emission, agriculture sector (2000) 9
GREEN HOUS E GAS EMISSIONS, AGRICULTURE S ECTOR
Sub-sector CH₄ (Gg) N₂O (Gg) CO₂ equivalent (Gg) % share
Enteric Fermentation 10,068.07 211,429.43 59.5%
Rice Cultivation 3,540.98 74,360.58 20.9%
Agriculture soils 186.49 57,810.47 16.3%
Field burning of crop Residue 238.06 6.17 6,911.96 1.9%
7 Performance Evaluation of Sewage Treatment Plants – Central Pollution Control Board (CPCB). 2013.
8 Performance status of CETP in India - Central Po llution control board (CPCB) 2005
9 Second National Communication to the United Nations Framework Convention on Climate Change – Ministry of
Environment and Forests and Climate Change (MoEF & CC), Government of India, 2012
INDC- Vulnerability Report 2015
Page 5
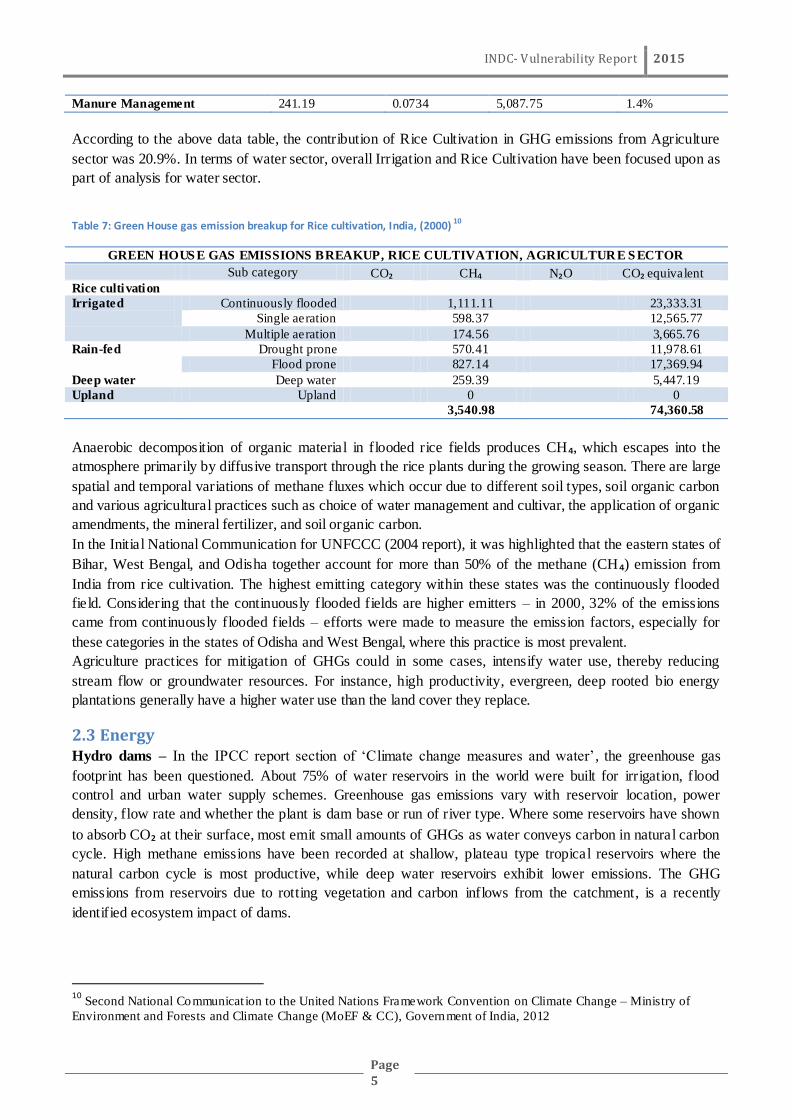
Manure Management 241.19 0.0734 5,087.75 1.4%
According to the above data table, the contribution of Rice Cultivation in GHG emissions from Agriculture
sector was 20.9%. In terms of water sector, overall Irrigation and Rice Cultivation have been focused upon as
part of analysis for water sector.
Table 7: Green House gas emission breakup for Rice cultivation, India, (2000) 10
GREEN HOUS E GAS EMISSIONS BREAKUP, RICE CULTIVATION, AGRICULTURE S ECTOR
Sub category CO₂ CH₄ N₂O CO₂ equivalent
Rice cultivation
Irrigated
Continuously flooded 1,111.11 23,333.31
Single aeration 598.37 12,565.77
Multiple aeration 174.56 3,665.76
Rain-fed
Drought prone 570.41 11,978.61
Flood prone 827.14 17,369.94
Deep water Deep water 259.39 5,447.19
Upland Upland 0 0
3,540.98 74,360.58
Anaerobic decomposition of organic material in flooded rice fields produces CH₄, which escapes into the
atmosphere primarily by diffusive transport through the rice plants during the growing season. There are large
spatial and temporal variations of methane fluxes which occur due to different soil types, soil organic carbon
and various agricultural practices such as choice of water management and cultivar, the application of organic
amendments, the mineral fertilizer, and soil organic carbon.
In the Initial National Communication for UNFCCC (2004 report), it was highlighted that the eastern states of
Bihar, West Bengal, and Odisha together account for more than 50% of the methane (CH₄) emission from
India from rice cultivation. The highest emitting category within these states was the continuously flooded
field. Considering that the continuously flooded fields are higher emitters – in 2000, 32% of the emissions
came from continuously flooded fields – efforts were made to measure the emission factors, especially for
these categories in the states of Odisha and West Bengal, where this practice is most prevalent.
Agriculture practices for mitigation of GHGs could in some cases, intensify water use, thereby reducing
stream flow or groundwater resources. For instance, high productivity, evergreen, deep rooted bio energy
plantations generally have a higher water use than the land cover they replace.
2.3 Energy Hydro dams – In the IPCC report section of ‗Climate change measures and water‘, the greenhouse gas
footprint has been questioned. About 75% of water reservoirs in the world were built for irrigation, flood
control and urban water supply schemes. Greenhouse gas emissions vary with reservoir location, power
density, flow rate and whether the plant is dam base or run of river type. Where some reservoirs have shown
to absorb CO₂ at their surface, most emit small amounts of GHGs as water conveys carbon in natural carbon
cycle. High methane emissions have been recorded at shallow, plateau type tropical reservoirs where the
natural carbon cycle is most productive, while deep water reservoirs exhibit lower emissions. The GHG
emissions from reservoirs due to rotting vegetation and carbon inflows from the catchment, is a recently
identified ecosystem impact of dams.
10
Second National Communicat ion to the United Nations Framework Convention on Climate Change – Ministry of
Environment and Forests and Climate Change (MoEF & CC), Government of India, 2012

INDC- Vulnerability Report 2015
Page 6
Irrigation - India currently uses 26 million groundwater pumps for irrigation. Diesel generators are
commonly used when grid power is unavailable, a not uncommon occurrence. And the power used for
pumping irrigation water is also one of the largest strains on the Indian power grid. Pumping water is critical
for Indian agriculture, which otherwise relies on seasonal rain. It's also very contentious—Indian farmers are
currently drawing more water than is sustainable, removing about 212 million megalitres from the ground
each year to irrigate about 35 million hectares.11
2.4 Desalination In the IPCC report section of ‗Climate change measures and water‘, Desalination is also an identified GHG
emission sector. In water scarce regions water supply may take place by desalinization of saline water. Such a
process requires energy and this implies generation of GHG emissions in case of fossil fuel utilization. India
has a long coastline of 7,600 kilometres and is most likely to witness high growth ratios in desalinating water
in the future. Unequal water distribution exists within our country and fresh water desalination technology is
getting concentrated more on water scarce areas such as Gujarat, Tamil Nadu and Rajasthan. Besides
producing desalted water for human consumption and Industrial requirement these technologies are also found
to be advantageous in the recovery of water from waste streams. As per the Indian Desalination Association
there are more than 1000 membrane based desalination plants of various capacities ranging from 20 m³/day to
10,000 m³/day.
Chapter 3: Water resources Changes in key climate variables; namely temperature, precipitation and humidity, may have significant long
term implications for the quality and quantity of water. As per India‘s Communication for UNFCCC (2012)
impacts of climate change and climate variability on the water resources are likely to affect irrigated
agriculture, installed power capacity, environmental flows in the dry season and higher flows during the wet
season, thereby further aggravating droughts and flood in various part of the country.
3.1 Surface Water The main water sources of India consist of precipitation on the Indian Territory which is estimated to be
around 4000km³/year (BCM), including transboundary flows. As per CWC12
estimates (1993), out of the total
precipitation (including snowfall), the availability from surface water and replenishable groundwater is
estimated to be 1869 billion cubic meters. It is estimated that owing to topographic, hydrological and other
constraints, the utilizable water available is only about 1123 BCM (690 BCM from surface water and 433
BCM from replenishable groundwater resources) that can be put to beneficial use. To utilize this water by
prolonging its stay on land, infrastructure such as dams, barrages and other related structures have been built
and further development in this regard is underway.
3.1.1 Rivers The basin-wise details of catchment area, average water resources potential and utilizable surface water
resources are given below –
11
Water in India: Situation and prospects - UNICEF, FAO, and SaciWATERs, 2013 12
Central Water Commission – Ministry of Water Resources, River Development and Ganga Rejuvenation

INDC- Vulnerability Report 2015
Page 7
Table 8: Water resources potential of river basins of India 13
WATER RESOURCES POTENTIAL OF RIVER BAS INS OF INDIA
S.
N
o.
River Basin Catchment area
(Sq. Km)
Average Water
Resources Potential
(BCM)14
Utilizable surface water
resources
(BCM)15
1 Indus 321289 73.3 46
2 Ganga-Brahmaputra-Meghna
(a) Ganga 861452 525 250
(b) Brahmaputra 194413 537.2 24
(c) Barak & others 41723 48.4
3 Godavari 312812 110.5 76.3
4 Krishna 258948 78.1 58
5 Cauvery 81155 21.4 19
6 Subernarekha 29196 12.4 6.8
7 Brahmani-Baitarni 51822 28.5 18.3
8 Mahanadi 141589 66.9 50
9 Pennar 55213 6.3 6.9
10 Mahi 34842 11 3.1
11 Sabarmati 21674 3.8 1.9
12 Narmada 98796 45.6 34.5
13 Tapi 65145 14.9 14.5
14 West Flowing Rivers from Tapi
to Tadri
55940 87.4 11.9
15 West Flowing Rivers from Tadri
to Kanyakumari
56177 113.5 24.3
16 East Flowing Rivers between
Mahanadi and Pennar
86643 22.5 13.1
17 East Flowing Rivers between
Pennar & Kanyakumari
100139 16.5 16.5
18 West Flowing Rivers of Kutch
and Saurashtra including Luni
321851 15.1 15
19 Area of In land Drainage in
Rajasthan
--- Negl. --
20 Minor Rivers draining into
Myanmar (Burma) and
Bangladesh
36302 31 --
Total
1,869.4 690
Of the major basins, the Ganga-Brahmaputra-Meghna is the largest in respect of catchment area of about 11
lakh sq km. The other major rivers with catchment area about one lakh sq km or more are: Indus, Godavari,
Krishna, Mahanadi and Narmada.
The table above shows the total water resources potential on an average during a year is 1869 BCM and
utilizable surface water is 690 BCM. Ganga-Brahmaputra-Meghna basin has annual water resources potential
of 1111 BCM out of total 1869 BCM in the country. So far as utilizable surface water is concerned, the
proportion of utilizable surface water resources to water resources potential is very high in smaller basins
except in Mahi and West Flowing Rivers basins between Tapi and Tadri.
13
Data by Central Water Commission (CW C) – Ministry of Water Resources, River Development and Ganga
Rejuvenation 14
Reassessment of Water Resources Potential of India – Central Water Commission (CWC).1993 15
Water resources of India – Central Water Commission (CWC).1988

INDC- Vulnerability Report 2015
Page 8
The proportion of utilizable surface water to average water resources potential is found minimum in
Brahmaputra sub-basin. The distribution of estimated utilizable surface water in the country has been
presented in figure below. It shows the spread of utilizable surface water resources in the country.
Figure 1: Basin wise distribution of Estimated Utilizable surface 16
Table 9: Percentage of water Resources Potential in Major Basins17
PERCENTAGE OF WATER RESOURCES POTENTIAL IN MAJOR BAS INS
River Basin Water resources Potential (% to
total 1869 BCM)
Utilizable Surface water (% to total
690 BCM)
Ganga – Brahmaputra - Meghna 59.4 39.7
Indus (up to border) 3.9 6.7
Godavari 5.9 11.1
Krishna 4.2 8.4
Mahanadi 3.6 7.2
Narmada 2.4 5.0
Others 20.6 21.9
About 40% of utilizable surface water resources are available in the Ganga-Brahmaputra-Meghna basin.
Extreme conditions of floods and droughts are a common feature, affecting the availability of water for
various purposes. As per India‘s Second National Communication to UNFCCC, 2012 it has been estimated
that 40 million hectares (MHA) of area is flood-prone, and this constitutes 12% of the total geographical area
of the country. It has been found that 51 MHA of area is drought prone, and this constitutes 16% of the total
geographical area. Added to this is the growing demand for water.
The per capita average water availability in the country is progressively decreasing because of increase in
population and requirement for various uses. The average annual per capita availability of water in the country
taking into consideration the population of the country as per the 2001 and 2011 census and the population
projections for the year 2025 and 2050 is as under:
16
Water and Related Statistics – Central Water Commission (CW C). 2015 17
Water and Related Statistics – Central Water Commission (CWC). 2015

INDC- Vulnerability Report 2015
Page 9
Table 10: Per Capita Average Annual Water Availability 18
PER CAPITA AVERAGE ANNUAL WATER AVAILABILITY
Year Population (In Million) Per capita Average Annual
Availability (m3/year)
Remarks
2001 1029 (2001 census) 1816
2011 1210 (2011 census) 1545 water stressed condition*
2025 1394 (Projected) 1340 water stressed condition*
2050 1640 (Projected) 1140 water stressed condition*
*According to the Falkenmark Water Stress Indicator, a per capita availability of less than 1700 cubic metres (m3) is
termed as a water-stressed condition, while if per capita availability falls below 1000 m3, it is termed as a water scarcity
condition.
The per capita availability in the country will be 1140 cu m in the year 2050 against 1608 cu m during 2010. It
may be noted that while the national per capita annual availability of water was 1816 cu m in 2001, it was
1545 cu m in 2011. The estimated per capita average availability during the year 2010 in Ganga-Brahmaputra-
Meghna system was 20136 cu m while it was as low as 263 cu m in Sabarmati basin. Any situation of
availability of less than 1000 cu m per capita is considered by international agencies as scarcity conditions.
Krishna, Cauvery, Subernarekha, Pennar, Mahi, Sabarmati, Tapi, East Flowing Rivers and West Flowing
Rivers of Kutch and Saurashtra including Luni are some of the basins, which fall into this category- out of
which Cauvery, Pennar, Sabarmati and East Flowing rivers and West Flowing Rivers of Kutch and Saurashtra
including Luni are facing more acute water scarcity with per capita availability of water less than or around
500 cu m.
River basin is considered as the basic hydrologic unit for the planning and development of water resources.
There are 21 river basins as per CWC. A total storage capacity of about 253.4 BCM has been created in the
country through completion of major & medium irrigation project. The projects under construction will
contribute to additional 51 BCM. Thus likely storage available will be 304.3 BCM once the projects under
construction are completed against the utilizable surface water availability of 690 BCM in the river basins of
the country.
Maximum storage lies in the Ganga Basin followed by Krishna, Godavari and Narmada. Pennar is the leading
basin in terms of storage capacities as percentage of average annual flow. The storage capacities as percentage
of average annual flow exceed 50% for Krishna, Tapi and Narmada basins while for Ganga and Brahmaputra
sub-basins the corresponding figures are 11% and 0.5 % respectively.
The live storage capacities of Reservoirs – Basinwise are given below –
Table 11: Live Storage Capacities of Reservoirs, Basin wise19
LIVE STORAGE CAPACITIES OF RES ERVOIRS, BAS IN WIS E
S.No Basin Average Annual
Flow
Live Storage Capacities (BCM)
Completed
Project
Project under
Construction
Total
1 Indus 73.31 16.222 0.100 16.322
2 a. Ganga 525.02 48.748 7.703 56.451
b. Brahmaputra 537.24 1.710 0.690 2.400
18
Data by Central Water Commission (CWC) – Ministry of Water Resources, River Development and Ganga
Rejuvenation 19
Water and Related Statistics – Central Water Commission (CWC). 2015
INDC- Vulnerability Report 2015
Page 10
c. Barak and others 48.36 0.322 8.988 9.310
3 Godavari 110.54 35.434 8.228 43.662
4. Krishna 78.12 50.117 4.287 54.404
5. Cauvery 21.36 8.978 0.015 8.993
6. Pennar 6.32 2.809 0.440 3.249
7. EFR from Mahanadi to
Godavari and Krishna and
pennar
22.52 2.821 1.165 3.986
8. EFR B/W Pennar and
Kanyakumari
16.46 1.602 1.703 3.305
9 Mahanadi 66.88 12.779 1.465 14.244
10 Brahmani and Baitarn i 28.48 5.070 0.465 5.535
11. Subernarekha 12.37 0.764 2.388 3.152
12. Sabarmati 3.81 1.567 0.110 1.677
13. Mahi 11.02 5.015 0.160 5.175
14. WFR of Kutch, saurashtra
including Luni
15.1 6.825 0.509 7.334
15 Narmada 45.64 17.806 6.835 24.641
16 Tapi 14.88 9.088 1.555 10.643
17 WFR from tapi to tadri 87.41 14.267 2.329 16.596
18 WFR from Tadri to
kanyakumari
113.53 11.013 1.418 12.431
19 Area of In land drainage of
Rajasthan
- - - 0.000
20 Minor River Basins draining
into Myanmar and
Bangladesh
31 0.405 0.184 0.589
21 Drainage areas of Andaman
and Nicobar island
- 0.019 0.000 0.019
Grand total in BCM 1869.350 253.388 50.959 304.347
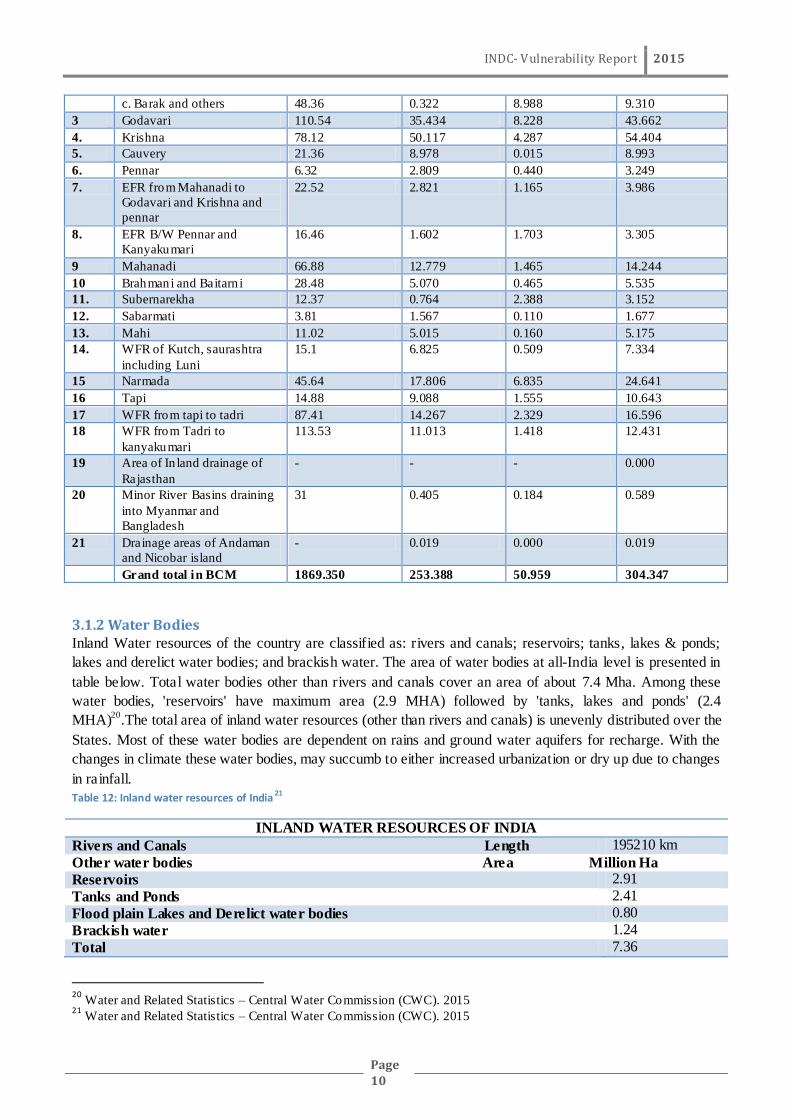
3.1.2 Water Bodies Inland Water resources of the country are classified as: rivers and canals; reservoirs; tanks, lakes & ponds;
lakes and derelict water bodies; and brackish water. The area of water bodies at all-India level is presented in
table below. Total water bodies other than rivers and canals cover an area of about 7.4 Mha. Among these
water bodies, 'reservoirs' have maximum area (2.9 MHA) followed by 'tanks, lakes and ponds' (2.4
MHA)20
.The total area of inland water resources (other than rivers and canals) is unevenly distributed over the
States. Most of these water bodies are dependent on rains and ground water aquifers for recharge. With the
changes in climate these water bodies, may succumb to either increased urbanization or dry up due to changes
in rainfall.
Table 12: Inland water resources of India 21
INLAND WATER RESOURCES OF INDIA
Rivers and Canals Length 195210 km
Other water bodies Area Million Ha
Reservoirs 2.91
Tanks and Ponds 2.41
Flood plain Lakes and Derelict water bodies 0.80
Brackish water 1.24
Total 7.36
20
Water and Related Statistics – Central Water Commission (CWC). 2015 21
Water and Related Statistics – Central Water Commission (CWC). 2015

INDC- Vulnerability Report 2015
Page 11
3.1.3 Glaciers22 As per National Institute of Hydrology, there are about 9575 glaciers in the Indian Himalayas. Majority of the
rivers originating from the Himalayas have their upper catchment in the snow covered and glaciated areas.
The Indus, Ganga and Brahamputra river system, which receive a substantial amount of melt water from the
Himalayas, are considered as the life line of the Indian sub-continent. These mighty rivers support about 170
million people in the region for their agricultural and economic activities. Accurate assessment and
forecasting of total availability of water, melt rate and its distribution in time is considered very essential for
the management of water resources. Flood control, reservoir operation, agriculture planning, and hydroelectric
production are directly related to the management of water resources. Since the 1970s, the glaciers have been
melting at a staggering rate; in conjunction with a decrease in the summer monsoon rainfall in the Indo-
Gangetic Plain, the region has been facing major environmental problems. The impacts of retreating glaciers
on the ecosystems, human well-being, water availability and food security, are of broad societal concern.
As per Central Water Commission Data, the studies carried out by Geological Survey of India (GSI) have
revealed that the majority of Himalayan glaciers are passing through a phase of recession, which is a
worldwide phenomenon. The recession of glaciers is a part of the natural cyclic process of changes in size and
other attributes of the glaciers. An inventory of the snow cover and glacier extent, using satellite based
mapping across glaciated regions was conducted in Indus, Ganga and Bramhaputra river basins. Under this
study, 2767 glaciers were monitored, of which 2184 are retreating, 435 are advancing, and 148 glaciers do not
show any change. Further studies covering other areas of Himalayan glaciers are underway. The rate of
melting of Himalayan glaciers (15 metres per year) is the highest in the world.
The causative factors are stated to be subnormal snowfall, higher temperature during summer, less severe
winter or a combination of all them. Thus, even the reduction in the snowfall in the catchment may lead to
recession of the glaciers without any appreciable change in the melting regime. The recession of the glaciers
alone may not necessarily mean release of excess water in the Glacier-fed Himalayan Rivers. GSI has further
stated that if the recession is only due to higher melting of the Glacier, then there may be some increase in the
river discharge. Formation of and/or increasing size of the glacial lakes pose threat of lake burst which may
release huge amounts of water and debris in the downstream causing serious flood hazard. Negative impacts,
including seasonal shifts in water supply, flood risks and increased precipitation variability, will eventually
offset benefits incurred by short term increases in runoff from glacier melt.
Tibetan ice-fields and glaciers are critical resources. They sustain dry-period low flows for major rivers, such
as the Indus, Ganges and Brahmaputra Rivers, in the south western Himalaya. As per the IPCC Technical
report II (Asia chapter), the surface area of glaciers across the Tibetan Plateau is projected to decrease from
500,000 square kilometres measured in 1995 to 100,000 square kilometres in 2030, thereby threatening
regional rivers and water resources. With glacial and snow retreat, many of the semi-arid mountains, inhabited
by some 170 million people, will lose several of their local springs and streams, so essential to villages and
livestock grazing. In addition, increasing flash floods and rockslides degrade roads and trails. The impacts are
aggravated by the fact that some 94 percent of the energy demand is still met by traditional means as fuel
wood and animal dung or biomass in India, Pakistan, Bhutan, Nepal, Tibet, and most other regions in Asia.
22
Data by – Central Water Commission (CWC) and Nat ional Institute of Hydrology (NIH)
INDC- Vulnerability Report 2015
Page 12
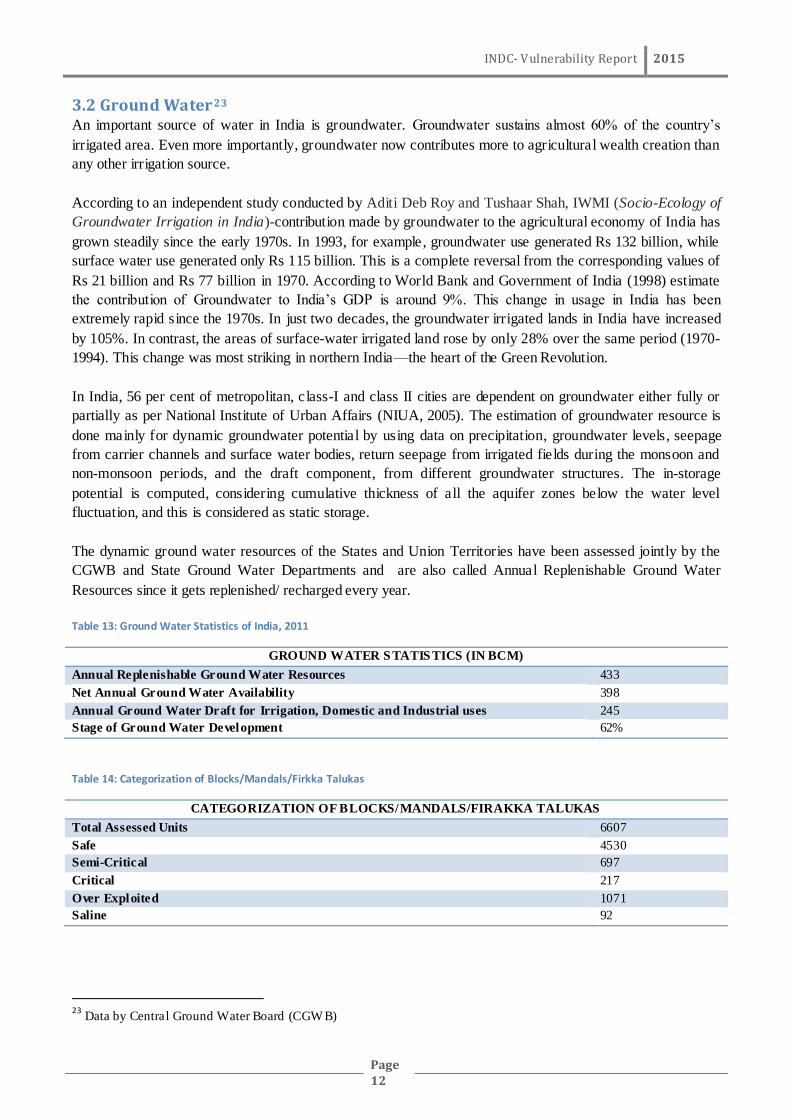
3.2 Ground Water23 An important source of water in India is groundwater. Groundwater sustains almost 60% of the country‘s
irrigated area. Even more importantly, groundwater now contributes more to agricultural wealth creation than
any other irrigation source.
According to an independent study conducted by Aditi Deb Roy and Tushaar Shah, IWMI (Socio-Ecology of
Groundwater Irrigation in India)-contribution made by groundwater to the agricultural economy of India has
grown steadily since the early 1970s. In 1993, for example, groundwater use generated Rs 132 billion, while
surface water use generated only Rs 115 billion. This is a complete reversal from the corresponding values of
Rs 21 billion and Rs 77 billion in 1970. According to World Bank and Government of India (1998) estimate
the contribution of Groundwater to India‘s GDP is around 9%. This change in usage in India has been
extremely rapid since the 1970s. In just two decades, the groundwater irrigated lands in India have increased
by 105%. In contrast, the areas of surface-water irrigated land rose by only 28% over the same period (1970-
1994). This change was most striking in northern India—the heart of the Green Revolution.
In India, 56 per cent of metropolitan, class-I and class II cities are dependent on groundwater either fully or
partially as per National Institute of Urban Affairs (NIUA, 2005). The estimation of groundwater resource is
done mainly for dynamic groundwater potential by using data on precipitation, groundwater levels, seepage
from carrier channels and surface water bodies, return seepage from irrigated fields during the monsoon and
non-monsoon periods, and the draft component, from different groundwater structures. The in-storage
potential is computed, considering cumulative thickness of all the aquifer zones below the water level
fluctuation, and this is considered as static storage.
The dynamic ground water resources of the States and Union Territories have been assessed jointly by the
CGWB and State Ground Water Departments and are also called Annual Replenishable Ground Water
Resources since it gets replenished/ recharged every year.
Table 13: Ground Water Statistics of India, 2011
GROUND WATER S TATIS TICS (IN BCM)
Annual Replenishable Ground Water Resources 433
Net Annual Ground Water Availability 398
Annual Ground Water Draft for Irrigation, Domestic and Industrial uses 245
Stage of Ground Water Development 62%
Table 14: Categorization of Blocks/Mandals/Firkka Talukas
CATEGORIZATION OF BLOCKS/MANDALS/FIRAKKA TALUKAS
Total Assessed Units 6607
Safe 4530
Semi-Critical 697
Critical 217
Over Exploited 1071
Saline 92
23
Data by Central Ground Water Board (CGW B)

INDC- Vulnerability Report 2015
Page 13
Figure 2: Categorization of Ground water Blocks (2011)24
The present status of the dynamic groundwater potential of India is estimated as 433 BCM against which the
groundwater development was only 115 BCM in 1995 but increased to 245 BCM in 2011. In addition to the
dynamic groundwater resources available in the zone of fluctuation, which gets annually replenished from
rainfall, there exists a sizable amount of groundwater below the zone of fluctuation in the unconfined aquifer
as well as in the deeper confined aquifers. The in-storage potential computed up to a depth of 450 m in
alluvial areas and 200m in hard rock areas as a first approximation works out to the tune of 10,812 BCM, of
which more than 90% lies in the alluvial aquifers of Ganga, Indus, and Brahmaputra basins.
Ground water levels are being monitored throughout the Country by Central Ground Water Board and State
Ground Water departments. The long term decline in ground water level has been assessed by comparing the
Pre-monsoon water level data of 2014 with the decadal average (2004-2013). From the analysis of data, it has
been observed that, in the states/UTs of Assam, Daman & Diu, Meghalaya, Pondicherry, Tamil Nadu, Tripura
and Uttarakhand more than 50% of the wells have registered decline in ground water level, when compared
with decadal average of (2004-2013). Decline of more than 4 m has also been observed in pockets in the states
of Delhi, Gujarat, Haryana, Karnataka, Meghalaya, Rajasthan and Tamil Nadu.
Also highlighted in India‘s Communication for UNFCCC 2012, a detailed groundwater recharge study of four
water-stressed basins – Lower Indus, Sabarmati, Cauvery, and Godavari – indicates substantial increase in
24
Data by Central Ground Water Board, CGWB.

INDC- Vulnerability Report 2015
Page 14
groundwater development over the past 10 years. Two of the river basins – Sabarmati and Indus – have
recorded groundwater development of more than 100% of the annual replenishment in some areas. In such
over-exploited areas, the water table shows continuous decline. Also, groundwater development in the coastal
areas of Cauvery and Sabarmati basins will induce saline ingress; therefore, groundwater development in such
critical areas would have to be regulated. Changes in rainfall pattern induced by climate change will influence
the dynamic potential of some areas, leading to a change in the hydrodynamics of the unconfined aquifer
system of different geological formations and may further affect the storage potential. Under the changed
scenario, new groundwater management practices will need to be adopted, giving emphasis on utilizing
monsoon run-off to create sub-surface storages wherever natural recharge has decreased.
Given that groundwater utilization is increasing at the rate of 2.5–4% throughout the country, it is pertinent to
undertake detailed groundwater balance study and parameter estimation in terms of various inputs and outputs
to quantify the impact of climate change under various scenarios. What has been studied thus far is a step
towards the better understanding of the possible recharge potential during monsoon and non-monsoon period
under different scenario of rainfall intensity and the hydrogeology of the area. The recharge from other
sources can be added to the recharge potential calculated based on the same percentage between the monsoon
and non-monsoon recharge and the recharge from other sources, based on the present groundwater
assessment.
Chapter 4: Vulnerability of Water Resources
4.1 Precipitation As per the report of the National Commission on Integrated Water Resources Development (NCIWRD-1999),
India has roughly four percent of the world‘s fresh water resources. India receives an average rainfall of about
1170 mm which corresponds to an annual precipitation of 4000 BCM including snowfall. There is
considerable variation in rainfall both temporally and spatially. Nearly 75% of this i.e. 3000 BCM occurs
during the monsoon season confined to 3 to 4 months (June to September) in a year.25
The demand for water has already increased manifold over the years due to urbanization, agriculture
expansion, increasing population, rapid industrialization, and economic development. At present, changes in
the cropping pattern and land-use pattern, overexploitation of water resources, and changes in irrigation and
drainage systems are modifying the hydrological cycle in many climatic regions and river basins of India.
As per the working group presentation of the IPCC 5th
Assessment report, there is medium confidence that the
Indian summer monsoon circulation will weaken, but this is compensated by increased atmospheric moisture
content, leading to more precipitation. There is medium confidence that the increase of the Indian summer
monsoon rainfall and its extremes throughout the 21st century will be the largest among all monsoons. Studies
based on the observed precipitation records of India Meteorological Department (IMD) have shown that the
occurrence of extreme precipitation events and their variability has already gone up in many parts of India.
In India‘s Second National Communication with UNFCCC, 2012, the possible impacts of climate change on
water resources of the river basins of India have been assessed using the hydrologic model SWAT (soil and
water assessment tool). The model requires information on terrain, soil profile, and land use of the area as
input, which have been obtained from the global sources. These three elements are assumed to be static for
future as well. The weather conditions (for model input) have been provided by the IITM Pune (PRECIS
outputs).
25
Water and Related Statistics – Central Water Commission (CWC). 2015

INDC- Vulnerability Report 2015
Page 15
Simulated climate outputs from PRECIS regional climate model for present /baseline (1961–90, BL), near
term (2021–50, MC), and long term (2071–98, EC) for A1B IPCC SRES socio-economic scenario have been
used. Q14 QUMP ensemble has been used for simulation. The potential impacts of climate change on water
yield and other hydrologic budget components are quantified by performing SWAT hydrological modelling
with current and future climate scenarios for the regional systems.
Detailed outputs have been analyzed with respect to the two major water balance components of water yield
and actual evapo-transpiration that are highly influenced by the weather conditions dictated by temperature
and allied parameters. Majority of the river systems show increase in the precipitation at the basin level.
Figure 3: Change in precipitation towards the 2030s and 2080s with respect to 1970s 26
According to the findings of India‘s Second National Communication for UNFCCC (2012), only
Brahmaputra, Cauvery and Pennar show marginal decrease in precipitation under MC. The situation under EC
improves, wherein all the river systems exhibit an increase in precipitation. The change in evapo-transpiration
under the MC scenario exhibits an appreciable increase (close to 10%) for the Brahmaputra, Indus and Luni
river basins. All other systems show marginal increase or decrease. Only two river basins - Cauvery and
Krishna -show some decrease in ET under the EC. For a majority of the river systems, the ET has increased
by more than 40%. The major reason for such an increase in ET is on two accounts:
(i) increase in the temperature and
(ii) increase in precipitation, which enhances the opportunity of ET.
26
Second National Communicat ion to the United Nations Framework Convention on Climate Change – Ministry of
Environment and Forests and Climate Change (MoEF & CC), Government of India, 2012

INDC- Vulnerability Report 2015
Page 16
The implications of changes in precipitation have also been quantified in the form of resulting water yields
through the SWAT modeling exercise. The response of water yield is dependent on a combination of factors
such as terrain, land use, soil type, and weather conditions. It is found that despite the increase in precipitation
from MC to EC scenario, the Krishna river system is showing reduction in the water yield. This can be on
account of higher evapo-transpiration (because of increased temperatures). It may also be observed that in the
case of Cauvery river system, although there is an improvement in the average water yield from MC to EC
scenario, there are some sub-basins that show reduction in water yield.
Figure 4: change in water yield towards 2030s and 2080s with respect to 1970s 27
Evapo-transpiration is a very important component of water balance with respect to the biomass and
agricultural activities. The potential evapo-transpiration is driven by the weather conditions, but the actual
evapo-transpiration is also dependent on the moisture conditions prevalent under the weather conditions
(assuming that the land-use and soil characteristics are not changing). The outcome of actual evapo-
transpiration has been obtained after the continuous simulation on daily basis for all the sub-basins of various
river systems by using SWAT model, and the changes in evapo-transpiration values in percentage are shown
in Figure 3 for all the sub-basins under the MC and EC scenarios. In general, majority of the northern river
systems show increase in evapo-transpiration under the MC scenario, whereas majority of the southern river
systems show marginal reduction in evapo-transpiration despite increase in precipitation.
27
Second National Communicat ion to the United Nations Framework Convention on Climate Change – Ministry of
Environment and Forests and Climate Change (MoEF & CC), Government of India, 2012

INDC- Vulnerability Report 2015
Page 17
Figure 5: Change in Evapo-transpiration (crop water demand) towards 2030s and 2080s with respect to 1970s 28
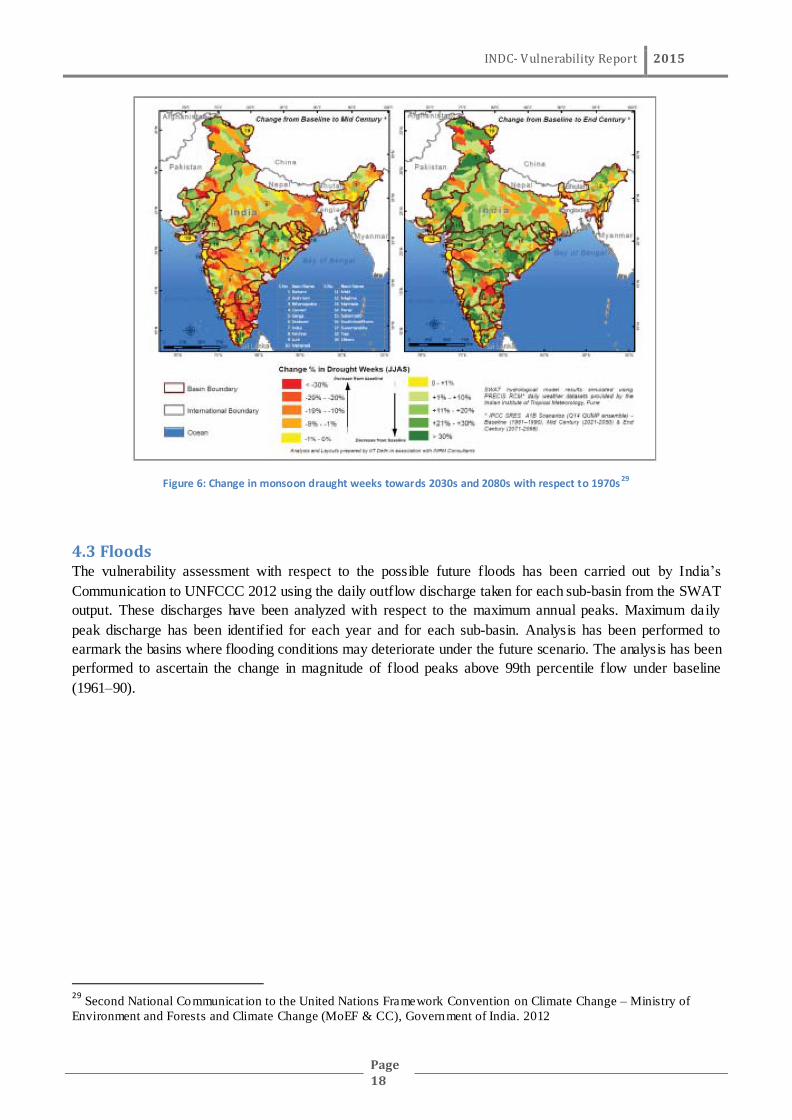
4.2 Droughts Drought indices are widely used for the assessment of drought severity by indicating relative dryness or
wetness affecting water-sensitive economies. India‘s Communication for UNFCCC (2012) shows that there is
an increase in the moderate drought development (Scale 1) for Krishna, Narmada, Pennar, Cauvery, and
Brahmini basins, which have either predicted decrease in precipitation or have enhanced level of evapo-
transpiration for the MC scenario. It is also evident from the depiction that the moderate to extreme drought
severity (Scale 2) has been pronounced for the Baitarni, Sabarmati, Mahi, and Ganga river systems, where the
increase is ranging between 5% and 20% for many areas despite the overall increase in precipitation. The
situation of moderate drought (Scale 1) is expected to improve under the EC scenario for almost all the river
systems except Tapi river system, which shows about5% increase in drought weeks. However, the situation
for moderate to extreme droughts (Scale 2) does not appreciably improve much under the EC scenario despite
the increase in precipitation.
28
Second National Communicat ion to the United Nations Framework Convention on Climate Change – Ministry of
Environment and Forests and Climate Change (MoEF & CC), Government of India, 2012
INDC- Vulnerability Report 2015
Page 18
Figure 6: Change in monsoon draught weeks towards 2030s and 2080s with respect to 1970s 29
4.3 Floods The vulnerability assessment with respect to the possible future floods has been carried out by India‘s
Communication to UNFCCC 2012 using the daily outflow discharge taken for each sub-basin from the SWAT
output. These discharges have been analyzed with respect to the maximum annual peaks. Maximum daily
peak discharge has been identified for each year and for each sub-basin. Analysis has been performed to
earmark the basins where flooding conditions may deteriorate under the future scenario. The analysis has been
performed to ascertain the change in magnitude of flood peaks above 99th percentile flow under baseline
(1961–90).
29
Second National Communicat ion to the United Nations Framework Convention on Climate Change – Ministry of
Environment and Forests and Climate Change (MoEF & CC), Government of India. 2012

INDC- Vulnerability Report 2015
Page 19
Figure 7: Change in stream flow towards 2030s and 2080s with respect to 1970s stream discharge at 99th percentile - extremely high flow30
Figure 8: Change in stream flow towards 2030s and 2080s with respect to 1970s (stream discharge at 10th percentile – 90 %
dependable flow) 31
30
Second National Communicat ion to the United Nations Framework Convention on Climate Change – Ministry of
Environment and Forests and Climate Change (MoEF & CC), Government of India. 2012
31
Second National Communicat ion to the United Nations Framework Convention on Climate Change – Ministry of
Environment and Forests and Climate Change (MoEF & CC), Government of India. 2012

INDC- Vulnerability Report 2015
Page 20
As per CWC, in view of heavy and disastrous floods that occurred in the period after 1990 and in those basins
like Jhelum in J&K, Krishna in Andhra Pradesh, Upper reaches of Ganga in Uttarakhand and even in
Rajasthan which were earlier not identified as flood prone, an updated data base is needed to be used for
reference. The Central Water Commission issues flood forecasts on major interstate rivers and their tributaries
in India. For this purpose, it maintains a network of 878 data collection stations out which flood forecast are
issued at 175 stations which consists of 147 Level Forecasts stations and 28 Inflow Forecasts Stations.
CWC has also undertaken modernisation of its network and has put in place automatic system at 445 stations
for data collection through sensor based equipment, satellite based and VSAT based transmission of data and
has also set up three Earth receiving Stations at New Delhi, Jaipur ( Rajasthan) and Burla ( Odisha) besides
establishing 21 Modelling Centres in the country for expeditious transmission of data, quick flood forecast
simulation and speedy dissemination of flood forecasts to the local and other agencies to enable them in taking
timely measures for safety of people.
During XII Plan, CWC has proposed additional 100 Flood Forecasting Stations for covering more areas under
its network. Considering recent devastating floods of 2013 in Uttarakhand and 2014 in J&K, CWC has also
revamped its flood forecasting network in these States. Under long term plans, CWC also has perspectives
plans for development of rainfall runoff based flood forecasting system with further value addition to its
services by starting inundation forecasts through which forecast of specific areas likely to be inundated would
become possible. In order to manage floods through structural measures like embankments etc., besides the
storage dams constructed or wherever feasible, Government of India has been supplementing the efforts of the
States to enable them to have effective measures in critical areas.
Structural measures are costly and not always feasible from an economic point of view. Their operation and
management is not always guaranteed and they are less robust in view of future uncertainties. They are also
likely to harm the ecological integrity and socio-cultural function of flood plains, rivers and estuaries.
Therefore, they may have to be supplemented by non-structural measures such as special planning, floodplain
zoning, flood early warning, provision of refuge areas and evacuation, ecosystem based protection measures
and flood insurance and compensation programmes. The effectiveness of these measures is likely to be
enhanced with community participation in the planning, design and implementation of flood control measures.
4.4 Salination Coastal erosion and inundation of coastal lowland as sea level continues to rise can lead to flooding of homes
of millions of people living in low lying areas. In India, potential impacts of 1m sea-level rise include
inundation of 5,763 km² of areas as well as significant losses of coastal ecosystems, affecting the aquaculture
industry, particularly in heavily-populated mega-deltas. Variation in salinity of ground water in coastal tracts
of India is a complex phenomenon. Ground water salinity is a combined effort of a) inherent formation water
salinity, sea water ingress, tidal water, saline water percolation in low lying marshy lands inundated by sea
water, e) irrigation with saline water and f) salt laden winds.32
Unequal water distribution already exists within
our country and fresh water salination due to sea water ingress will get concentrated more on coastal water
scarce areas such as Gujarat, Tamil Nadu and Rajasthan.
Chapter 5: Impacts of Climate change on Water Availability and Demand The impacts of climate change on water availability and the current water demand at national level for the
irrigation, domestic, and industry sectors were assessed. Projections of water demand for these sectors were
made till 2040, under the present climate scenario, and taking into consideration the projected climate change
32
Status of Ground Water Quality in coastal aquifers of India – Central Ground Water board (CGWB). 2014

INDC- Vulnerability Report 2015
Page 21
scenario with respect to temperature and rainfall. Climate data is essential to the design of water resource
systems so as to take into account two aspects of hydrological processes: the extremes and the averages. The
extremes, both floods and droughts, are the end results of climatic and hydrological causes.
CWC has estimated Water Resources potential of River Basins of India (1993), details of which can be
referred from Table 8. MoEF & CC has further classified vulnerability scale of river basins in three different
scenarios for the period of 2040, 2070 and 2100.
Table 15 Vulnerability scale of Water Availability by basin – 2040, 2070, 210033
VULNERABILITY SCALE OF WATER AVAILABILITY BY BAS IN, IN THREE DIFFERENT SCENARIOS
FOR THE PERIOD OF 2040, 2070 AND 2100
Year 2040 2070 2100
Ganga Ups tream SV V V
Ganga Downstream HV HV HV
Mahanadi SV V SI
Brahmani V V SI
Brahmaputra HV HV HV
Surma Imphal HV HV HV
V- Vulnerable, SV – Semi-Vulnerable, HV – Highly Vulnerable, SI – Semi Invulnerable
Water Resource potential for River Basins for the current period is being estimated by CWC. However, based
on per capita average annual availability CWC has projected water stressed conditions in the year 2011, 2025
and 2050 as well. Details of the projections can be referred to from Table 10.
With the increasing population as well as all round development in the country, the competing demand for
water for irrigation, domestic use and power generation sectors are exerting enormous pressure on our water
resources. According to ‗Water related Statistics (CWC), the actual utilization of surface and ground water,
was about 20% and 10%, respectively of the utilizable potential in 1951. In 1997 - 1998, the utilization of
surface and ground water increased to about 57.8% (329 BCM) and about 53.2% (230 BCM), respectively, of
the utilizable potential. The precarious balance between growing demands and supplies brings forth the
importance of recycling and reuse of water so that same water can be used for multiple uses thereby reducing
demand for fresh supplies.
The requirement of various sectors has been assessed by MoWR‘s ―Standing Committee for Assessment of
Availability and Requirement of Water‖ in the year 2000 and by the National Commission on Integrated
Water Resources Development (NCIWRD) in the year 1999.
Table 16: Sector-Wise Water Demand for 2010, 2025, 2050 34
SECTOR – WIS E WATER DEMAND FOR 2010, 2025, 2050
Sector Water Demand in Cubic km (or BCM)
Standing Sub-Committee of MoWR NCIWRD
Year 2010 2025 2050 2010 2025 2050
Irrigation 688 910 1072 557 611 807
Drinking 56 73 102 43 62 111
33
Second National Communicat ion to the United Nations Framework Convention on Climate Change – Ministry of
Environment and Forests and Climate Change (MoEF & CC), Government of India. 2012 34
Standing Committee for Assessment of Availability and Requirement of Water – Ministry of Water Resources, River
Development and Ganga rejuvenation (2000) & Nat ional Commission on Integrated Water Resources Development
(NCIW RD)(1999)

INDC- Vulnerability Report 2015
Page 22
Water
Industry 12 23 63 37 67 81
Energy 5 15 130 19 33 70
Others 52 72 80 54 70 111
Total 813 1093 1447 710 843 1180
Irrigation requirement estimated by NCIWRD is on a lower side as compared to that estimated by the
Standing sub-committee because NCIWRD assumed that the irrigation efficiency will increase to 60% from
the present level of 35 to 40%. The working group on Water Resources for the XI Five Year Plan (2007-12)
accepted the recommendation of NCIWRD in view of the likely improvement in irrigation efficiency.
Amarsinghe et al. report examines the implications of future water supply demand of India under Business as
Usual (BaU) scenario trends of key water demand drivers and also under possible divergences. The
assumptions of the growth of key drivers in the BaU scenario in this report differ significantly from the
assumptions of the scenarios of NCIWRD. The assessment of BaU scenario uses the methodology of
PODIUMSIM model policy dialogue model simulation for projecting India‘s water future. The PODIUMSIM
is a tool for simulating the alternative scenarios of food and water demand drivers. The model has four major
components, which can assess food and water demand at various temporal and spatial scales: crop demand
(annual and state/river basins/ national), crop production (seasonal and districts/state/river basins), water
demand (monthly and districts/state/river basins) and water accounting (annual and river basins). The
projections are below:
Table 17: India's water supply and demand (BaU scenario)35
INDIA’S WATER SUPPLY AND DEMAND (BAU SCENARIO)
Sector 2000 2025 2050 Total (BCM)
% from Ground Water
Total (BCM)
% from Ground Water
Total (BCM)
% from Ground Water
Irrigation 605 45 675 45 637 51 Domestic* 34 50 66 45 101 50
Industrial** 42 30 92 30 161 30
Total 680 44 833 43 900 47 *– Domestic withdrawals include those for livestock water demand ** – Industrial water demands include cooling needs for power generation.
The food requirement of the growing population will be about 450 million tons in 2050 as against the present
highest food grain production of around 198 million tons. Two-third of this is obtained from irrigated food
grain production areas. Thus, irrigation water requirements of the country are likely to exert tremendous
pressure on our water resources in the future.36
Power generation is another sector which exerts ever increasing pressure on our water resources as our major
power plants are coal-based that consume significant quantity of water in their cooling systems. Our
dependency on coal-based power plant will have to continue for long time. This entails an ever-increasing
demand of water for power generation.
Currently, agriculture accounts for more than 80% of India‘s water use. But growing demand from other uses
such as municipal and industrial, is leading to increased competition among uses, especially near urban areas.
As per the ‗Water in India: Situation and Prospects‘ report37
, the 2050 projections show aggregate water
35
India‘s water supply and demand from 2025 to 2050. Business as usual scenario and issues. - Upali A. Amarsinghe,
Tushaar Shah and B.K Anand, IWMI 36
Status of Sewage Treatment plants in India - Central Po llution Control Board (CPCB). 2005 37
Water in India: Situation and Prospects - UNICEF, FAO and SaciWATERs, 2013.

INDC- Vulnerability Report 2015
Page 23
demand increasing to 1,447 km3; while agriculture retains its relative dominance, other uses are projected to
increase their relative share. As surface water has become over-allocated, the reliance on groundwater for
agriculture (as well as domestic supply) has increased dramatically.
The Ultimate Irrigation Potential (UIP) of the country has been estimated to be 139.9 Million hectares
(MHA). Till the end of the XIth Plan (2012), an irrigation potential of 113.53 MHA (provisional) had been
created. The details are as follows –
Table 18: Irrigation Potential of India 38
IRRIGATION POTENTIAL OF INDIA
S. No. Sector Ult imate
Irrigation
Potential
(UIP)
Potential
created up to
end of XIth
Plan* (IPC)
Irrigation
Potential
Utilized
(IPU)*
Gap in IPC
and IPU
Balance
Irrigation
potential to be
created (UIP-
IPC)
1 Surface water – Major
and Medium
Irrigation
58.47 47.97 34.95 13.02 10.50
2 Surface Water –
Minor Irrigation and
Ground Water
81.43 65.56 52.91 12.65 15.87
3 Total 139.9 113.53 87.86 25.67 26.37
* Still under Consolidation
A balance of 26.37 MHA of irrigation potential remains to be created to achieve the target of Ultimate
Irrigation Potential. There is also a gap of 25.67 MHA or irrigation potential that has been created and utilized
till the end of XIth Plan. This is a major area of challenge and various measures through AIBP and CAD, as
outlined in the Chapter on ‗Strategies for Adaptation‘, are being taken to bridge this gap. An additional
irrigation potential of 35 MHA is envisaged to be created through transfer of water from water surplus basins
to water stressed basins through Inter-linking of Rivers.
Chapter 6: Strategies for Adaptation
6.1 National Water Policy The National Water Policy, 2012 was adopted by the National Water Resources Council at its meeting held on
28.12.2012. The National Water Policy stipulates that National Water Board should prepare a plan of action
based on the National Water Policy, as approved by the National Water Resources Council, and to regularly
monitor its implementation.
A scarce natural resource, water is fundamental to life, livelihood, food security and sustainable development.
India has more than 18 % of the world‘s population, but has only 4% of world‘s renewable water resources
and 2.4% of world‘s land area. There are further limits on utilizable quantities of water owing to uneven
distribution over time and space. In addition, there are challenges of frequent floods and droughts in one or the
other part of the country. With a growing population and rising needs of a fast developing nation as well as the
given indications of the impact of climate change, availability of utilizable water will be under further strain in
future with the possibility of deepening water conflicts among different user groups. Low consciousness about
the scarcity of water and its life sustaining and economic value results in its mismanagement, wastage, and
inefficient use, as also pollution and reduction of flows below minimum ecological needs. In addition, there
38
Water and Related Statistics – Central Water Commission (CWC). 2015

INDC- Vulnerability Report 2015
Page 24
are inequities in distribution and lack of a unified perspective in planning, management and use of water
resources. The objective of the National Water Policy is to take cognizance of the existing situation, to
propose a framework for creation of a system of laws and institutions and for a plan of action with a unified
national perspective.
The present scenario of water resources and their management in India has given rise to several concerns,
important amongst them are –
i) Large parts of India have already become water stressed.
ii) Issues related to water governance need to be addressed.
iii) Need to address wide temporal and spatial variation in water availability of water.
iv) Increased sea levels can lead to salinity intrusion.
v) Inadequate access to safe water for drinking and other domestic needs.
vi) Over-exploitation of groundwater in several areas.
vii) Inter-regional, inter-state, intra-state, as also inter-sectoral dispute in sharing of water.
viii) Inadequate maintenance of existing irrigation infrastructure
ix) Groundwater recharge zones are often blocked.
x) Growing pollution of water sources,
xi) Low consciousness about the overall scarcity and economic value of water results in its wastage
and inefficient use.
xii) Inadequate trained personnel for scientific planning
xiii) A holistic and inter-disciplinary approach is required
To address the above issues National Water Policy has the following basic principals –
(i) Planning, development and management of water resources need to be governed by common
integrated perspective considering local, regional, State and national context, having an
environmentally sound basis, keeping in view the human, social and economic needs.
(ii) Principle of equity and social justice must inform use and allocation of water.
(iii) Good governance through transparent informed decision making is crucia l to the objectives of
equity, social justice and sustainability. Meaningful intensive participation, transparency and
accountability should guide decision making and regulation of water resources.
(iv) Water needs to be managed as a common pool community resource held, by the state, under public
trust doctrine to achieve food security, support livelihood, and ensure equitable and sustainable
development for all.
(v) Water is essential for sustenance of eco-system, and therefore, minimum ecological needs should be
given due consideration.
(vi) Safe Water for drinking and sanitation should be considered as pre-emptive needs, followed by high
priority allocation for other basic domestic needs (including needs of animals), achieving food
security, supporting sustenance agriculture and minimum eco-system needs. Available water, after
meeting the above needs, should be allocated in a manner to promote its conservation and efficient
use.
(vii) All the elements of the water cycle, i.e., evapo-transpiration, precipitation, runoff, river, lakes, soil
moisture, and ground water, sea, etc., are interdependent and the basic hydrological unit is the river
basin, which should be considered as the basic hydrological unit for planning.
(viii) Given the limits on enhancing the availability of utilizable water resources and increased variability
in supplies due to climate change, meeting the future needs will depend more on demand
management, and hence, this needs to be given priority, especially through (a) evolving an
agricultural system which economizes on water use and maximizes value from water, and (b)
bringing in maximum efficiency in use of water and avoiding wastages.
(ix) Water quality and quantity are interlinked and need to be managed in an integrated manner,

INDC- Vulnerability Report 2015
Page 25
consistent with broader environmental management approaches inter-alia including the use of
economic incentives and penalties to reduce pollution and wastage.
(x) The impact of climate change on water resources availability must be factored into water
management related decisions. Water using activities need to be regulated keeping in mind the local
geo climatic and hydrological situation.
The Ministry of Water Resources constituted a committee to prepare a Roadmap for implementation of National
Water Policy (2012) comprising of members of the Drafting Committee. The Committee, first identified
goals/points of implementation for each section of the National water Policy (2012) and then suggested agencies
and action plan for achieving these goals. Since implementation of policy recommendations would require
different perspectives to be taken by different stakeholders, such as Central/State Governments, Local
Governing bodies, Non Governmental Organizations etc. emphasis has been laid on actions to be taken by
Ministry of Water Resources, other Central Ministries and State Governments. The report also groups for better
understanding of the roles to be played by each stakeholder in proper implementation of the National Water
Policy (2012).
The Ministry of Water Resources, River Development and Ganga Rejuvenation has been impressing upon the
States/Union Territories to formulate their State Water Policies in accordance with the National Water Policy
(2012). The states which have formulated their State Water policies are Andhra Pradesh, Chhattisgarh, Goa,
Himachal Pradesh, Jharkhand, Karnataka, Kerala, Madhya Pradesh, Maharashtra, Odisha, Rajasthan, Sikkim,
Tamil Nadu and Uttar Pradesh.
6.2 National Water Mission In order to achieve a sustainable development path that simultaneously advances economic and environmental
objectives, India's National Action Plan for Climate Change (NAPCC) contains eight national missions,
representing multi-pronged, long-term and integrated strategies for achieving key goals in the context of
climate change. The National water mission under the Ministry of Water Resources, River Development and
Ganga Rejuvenation is one of India‘s 8 missions.
The main objective of the National Water Mission is ―conservation of water, minimizing wastage and
ensuring its more equitable distribution both across and within States through integrated water resources
development and management‖. The five identified goals of the Mission are: (a) comprehensive water data
base in public domain and assessment of impact of climate change on water resource; (b) promotion of citizen
and state action for water conservation, augmentation and preservation; (c) focused attention to vulnerable
areas including over-exploited areas; (d) increasing water use efficiency by 20%, and (e) promotion of basin
level integrated water resources management.
Various strategies for achieving the goals have been identified which lead to integrated planning for
sustainable development and efficient management with active participation of the stakeholders after
identifying and evaluating the development scenario and management practices towards better acceptability
on the basis of assessment of the impacts of climate change on water resources based on reliable data and
information.
For achieving the objectives of the National Water Mission, long-term sustained efforts both in terms of time
bound completion of identified activities and ensuring the implementation of identified policies and enactment
of necessary legislation through persuasion at different levels with the State Governments have been
envisaged. Some of the important activities which are planned to be completed in a time bound manner on
priority are as under–
Goal 1:
Comprehensive water data base in public domain and assessment of the impact of climate change on
water resources.
All data and entire informat ion (except data of sensitive and classified nature) would be p laced in

INDC- Vulnerability Report 2015
Page 26
public domain.
Review and establishment of network for collection of addit ional necessary data.
The init ial projections of the impact of climate change on water resources including the likely
changes in the water availability in time and space are targeted.
Reassessment of basin wise water situation.
Goal 2: Promotion of citizen and state actions for water conservation, augmentation and preservation.
Empowerment and involvement of Panchayati Raj Institutions, urban local bodies, Water Users‘
Associations and primary stake holders in management of water resources with focus on water
conservation, augmentation and preservation.
Promote participatory irrigation management
Encourage participation of NGOs in various activities related to water resources management,
particularly in planning, capacity build ing and mass awareness
Involve and encourage corporate sector / industries to take up support and promote water
conservation, augmentation and preservation within the industry and as part of corporate social
responsibility
Sensitizat ion of all Panchayat members and their functionaries in dark and grey blocks will be
completed.
Goal 3: Focused attention to vulnerable areas including over-exploi ted areas
Comprehensive assessment of ground water in the country will be made.
The revised master plan for art ificial recharge to ground water would be in public domain for the
entire country
All over-explo ited areas will be covered by recharge of ground water
Expeditious implementation of water resources projects particularly the multipurpose projects with
carry over storages benefitting drought prone and rain deficit areas
Promotion of trad itional system of water conservation
Physical sustainability of g roundwater resources
Conservation and preservation of wetland
Systematic approach for coping with floods – mapping of areas likely to experience floods,
establishing hydraulic and hydrological models and developing comprehensive schemes for flood
management and reservoir sedimentation.
Goal 4: Increasing water use efficiency by 20%
The gap of about 15% between the irrigation potential created and the irrigation potential utilized
would be reduced by half
Development of guidelines for incentivizing recycling of water including wastewater.
Promotion of water efficient techniques and technologies including (a) p romotion of micro
irrigation techniques such as sprinkler and drip irrigation and (b) expansion of ―Farmers‘
Participatory Action Research Programme‖
Undertake Pilot projects for improvement in water use efficiency in collaboration with States.
Promote Water Regulatory Authorities for ensuring equitable water distribution and rational
charges for water facilit ies
Promote mandatory water audit including those for drinking water purposes
Adequate provision for operation & maintenance of water resources projects
Incentive through award for water conservation & efficient use of water
Incentivize use of efficient irrigation practices and fully utilize the created facilit ies
Goal 5: Promotion of basin level integrated water resources management
Ministry of Water Resources will rev iew the National Water Policy to move towards basin
development
Guidelines for different uses of water e.g., irrigation, drinking, industrial etc. particu larly in context
of basin wise situations.
6.3 Surface water Planning Commission constituted a Steering Committee and eight Working Groups related to water resources
and sanitation for XII Five Year Plan. The Working Groups inter alia, include the Working Group on ―Major
& Medium Irrigation and Command Area Development (MMI & CAD)‖.

INDC- Vulnerability Report 2015
Page 27
Considering the high variability in the yield of the rivers both temporally and spatially, conservation of water
resources becomes very important. As per available information, a total of about 225 billion cubic metre
(BCM) of surface water storage have been created. Further due emphasis has been laid on water conservation
through rainwater harvesting and artificial recharge to the groundwater. However, the per capita storage of
about 190 cubic meters in the country is miniscule as compared to per capita storages in countries like USA,
Australia, Brazil & China which are about 5961, 4717, 3388 and 2486 cubic meters respectively. Due
emphasis has to be laid on conservation of water, recycling of water into utilizable water, introducing efficient
methods and better management practices. This is more so to meet the increasing demand of water for various
purposes in view of growing population, industrialization and urbanization.
Considering from XII Plan onwards, the demand gap could be of the order of 250 BCM for irrigation by 2050.
Even if a fair percentage of this additional demand is borne by groundwater, the extra burden on surface
irrigation will be of the order of 150 BCM to achieve self-sufficiency by 2050. The need and urgency about
creating more storage through Major & Medium Irrigation sector in the country is apparent
Major & medium irrigation sector has therefore, been at the core of many of the activities envisaged to
provide a sustainable solution for food security and agricultural growth. The created irrigation potential in
respect of major and medium projects increased from 9.72 MHA in preplan period to 46.24 MHA (tentative)
including 4.60 MHA anticipated to be created in XI Plan. In the corresponding period the potential utilization
has increased from 9.70 MHA during pre plan period to 35.10 MHA (including 1.36 MHA anticipated during
XI plan).
Time and cost overruns have been a major cause for worry with MMI projects. Overall, the escalation is
influenced strongly by local conditions and cost overruns occur due to time overruns and consequent price
escalation over time. This indicates that implementation strategies adopted by the individual project
authorities need detailed study and specific solutions for prevention of further escalation in the costs.
Provision of financial resources in a timely fashion with adequate capacity to manage them by the
implementing departments is the need of the hour.
Command Area Development and Water Management
Cumulative Command Area covered in respect of field channels till X Plan is 18.06 MHA. For the XI Plan, an
achievement of 0.394 and 0.429 MHA have been made during 2007-08 and 2008-09 respectively.
Reclamation of Water logged Areas under the Centrally Sponsored Command Area Development Programme,
579 schemes of 9 states, have been approved for reclamation of 78.81 th. ha. water logged area. Out of this,
an area of 52.11 th. ha. has been reported to be reclaimed.
Ministry of Water Resources brought out a model act to be adopted by the State Legislatures for enacting new
Acts/ amending the existing irrigation Acts for facilitating the Participatory Irrigation Management (PIM).
The participation of farmers in the management of irrigation would include transfer responsibility for
operation & maintenance and also collection of water charges to the Water Users‘ Association in their
respective jurisdiction. So far 63167 Water Users‘ Associations have been formed in various States covering
an area of 14.623 M.ha. under various commands of irrigation projects.
Institutional Reforms
In the revised system of water management, consisting of representative bodies, there would be need for an
organization between the field level (FOs and WUAs) and the river basin level. There have been suggestions
to form a body consisting entirely of either State or the local government representatives or of water users or
to have a government body above that of water users. Various proposals and its representative characters and
details have to be ironed out in the National Water Resources Council (NWRC), before legislation is initiated.
INDC- Vulnerability Report 2015
Page 28
Historically, the role of Water Resources Departments have been resource assessment, planning and
construction centric with downstream developmental activities in the fields of Agriculture being left to
agricultural extension services and associated departments. Over the passage of time, the synergies have been
lost and now a need is being felt to set up a multi disciplinary mechanism under one umbrella to look into all
aspects of a major/ medium project management. Over the time increase in focus on efficient O & M
implementation is also being felt acutely.
MMI sector
The focus of the strategies for the XII P lan has to be on: (a) full utilization of the created facilities; (b)
improving water use efficiencies; and (c) completion of ongoing projects in a time bound mannered approach
is needed covering the entire gamut of MMI sector commencing from the Planning and implementation of
projects to establishment of last mile facilities of CAD and setting up of institutional mechanism for sustained
efficient operation of the assets created.
i. Improving Efficiency & reform measures
A very important target for XII Plan is to improve the efficiency of the irrigation project by at
least 20%. The present level of efficiency of major and medium irrigation project has been
assessed to be about 30% and it is planned to improve the existing level of efficiency of major
and medium irrigation projects by 20% (from present level of about 30% to targeted 36%).
ii. Improvement in Management Practice and Reform Measures
The reform measures should inter-alia include: (a) rationalization of water charges; (b)
establishment of regulatory mechanism; (c) comprehensive capacity building programme for
project management personnel including the field level workers; and (d) adoption of modern
management tools etc. The management practices should, inter-alia, include:
a) establishment of minimum Irrigation Service Fee (ISF) at a reasonable level, as prescribed by the
Thirteenth Finance Commission;
b) promotion of Participatory Irrigation Management through WUAs at outlet and distributary level;
c) maximization of the collection of ISF from users through WUAs, among other things, by
allowing WUAs to retain at least 50 percent of ISF collected for maintenance of the distribution
system;
d) undertaking, in a campaign mode, a program to close the gap between IPC and IPU through
farmer-participatory CAD works;
e) enhancing the resources available to the MMI departments for improving O&M of irrigation
systems through technological improvements such as automation and use of ITES;
f) broadening the disciplinary skill-set available with irrigation departments to include social
science and agriculture extension skills; and
g) substantially improving the amount and quality of training and capacity building opportunities
for MMI staff at all levels.
iii. Higher Studies, Research, Capacity Building, and Mass Awareness programme
It is suggested that higher studies and research covering all aspects of water resources
management should be provided. Similarly capacity building and career development
programmes for water resources professional including those associated with water management
at the field level are also recommended.

INDC- Vulnerability Report 2015
Page 29
Dams
Dams are critical infrastructure for multipurpose uses such as irrigation, power generation, flood moderation
and supply of water for drinking and industrial purposes, which are constructed with large investments. Other
physical assets, such as, hydro power plants, irrigation network, drinking and industrial network, municipal
supplies etc., are also linked with the dams. Safety of the dams is a very important aspect which has to be
given priority on a continuous basis for safeguarding the national investment and the benefits derived by the
nation from the projects. In addition, an unsafe dam (with high possibilities of failure and sudden release of
huge quantities of stored water) constitutes a hazard to human life as well as animal life. Safety of dam is a
matter of great concern to the general public as very large number of human life gets involved.
Over the last fifty years, India has invested substantially in infrastructure necessary to store surface runoff in
reservoirs formed by large, medium, and small dams with associated appurtenances. There are about 4857
completed large dams in the country (as per National Register of Large Dams), and many of them have
structural deficiencies and shortcomings in operation and monitoring facilities on account of ageing; and some
of them do not meet the present design standards – both structurally and hydrologically. About 75% of the
completed dams – i.e. about 3700 in numbers – are more than 25 years old, out of which about 164 dams are
more than 100 years old. These 3700 ageing dams are in need of different levels of rehabilitation
interventions; and such (commonly) observed interventions include:
Treatment of leakage through masonry and concrete dams and reduction of seepage through earth
dams and their foundations, and improving dam drainage;
Improving the ability to withstand higher floods, including additional flood handling facilities, if
needed, accompanied by structural strengthening of dams;
Rehabilitation and improvement of spillways, head regulators, draw-off gates and their operating
mechanisms, stilling basins, and downstream channels;
Increasing spillway capacity as required by hydrological re-assessments, in those cases where this is
physically possible, otherwise non-structural measures to be designed;
Improving approach roads; communication facilities, and improving dam safety instrumentation.
6.4 Ground water
National Aquifer Mapping and Management Program
Aquifer Mapping is one of the components of Scheme of Ground Water Management & Regulation. Aquifer
Mapping is a multidisciplinary scientific process wherein a combination of geologic, geophysical,
hydrogeologic, hydrologic, and water quality data are integrated to characterize the quantity, quality, and
distribution of ground water in aquifers in 3- Dimension along with their characterization on 1:50,000 scale.
This is followed up by formulation of Aquifer Management Plan for different aquifers for facilitating
sustainable management of ground water resources at regional and local level through participatory approach.
Target for XIIth
Plan: 8.89 lakh sq.km in priority area like Over-exploited, Critical, Semi-critical, water stress
quality affected area. Remaining area of the country will be taken up during XIIIth
Plan.
Rain Water Harvesting and M.A.R Initiatives
Keeping in view the present ground water scenario, Rainwater harvesting and Artificial Recharge to ground
water is one of most feasible techniques to restore ground water levels and provide sustainability to the
resources. Government of India is promoting rainwater harvesting and artificial recharge measures in the
Country, by supplementing the efforts of State Governments through technical and financial support under
various schemes. Water being a State subject, necessary measures is being undertaken by the State

INDC- Vulnerability Report 2015
Page 30
Governments for rainwater harvesting and artificial recharge to ground water. Out of 6607 assessment units
(Firkas/Blocks/ Mandals/ Talukas/ Districts) in the country, 1071 units in 16 States and 2 UTs have been
categorized as ‗Over-exploited‘, apart from 217 ‗Critical‘, 697 Semi- Critical and 4530 Safe assessment units.
The stage of ground water development in the country has been assessed as 62%.
Initiatives for roof top rain water harvesting, water conservation and artificial recharge are being undertaken
by the Governments which, inter-alia, include conservation of water resources in the reservoirs and traditional
water bodies, roof top rainwater harvesting and artificial recharge of ground water.
Central Ground Water Board (CGWB), under the Ministry of Water Resources, RD & GR has prepared a
conceptual document entitled ―Master Plan for Artificial Recharge to Ground Water in India‖ during the year
2013, which envisages construction of different types of Artificial Recharge and Rainwater Harvesting
structures including 37 lakh roof top rain water harvesting structures for urban areas of the Country.
Master Plan suggests Artificial Recharge and Rainwater Harvesting structures in an area of 9,41,541 square
km by harnessing surplus monsoon runoff to augment ground water resources at an estimated cost of
Rs.79,718 Crores. The Master Plan has been circulated to all State Governments for implementation.
Standard designs have been prepared by CGWB for model roof top rain water harvesting and artificial
recharge structures. These designs have been circulated to all State Governments/UTs, Ministry of Rural
Development, Planning Commission etc so that the State Governments and UTs can take up the construction
of artificial recharge structures. These designs are also being used for water conservation and recharge projects
taken up under MGNREGA.
Regulatory Measures Taken By the Government for Promoting Rain Water Harvesting
Ministry of Water Resources had circulated a ‗Model Bill‘ in the year 1970 which was re-circulated in 1992
and again in 1996 to all the States & UT‘s to enable them to enact suitable legislation for regulation and
control of ground water development. The Bill was modified incorporating provision for rain water harvesting
and was re-circulated in 2005. So far 15 States/ UTs viz. Assam, Andhra Pradesh, Bihar, Chandigarh, Dadra
& Nagar Haveli, Himachal Pradesh, Goa, Jammu & Kashmir, Karnataka, Kerala, Lakshadweep, Maharashtra,
Pondicherry, Telangana and West Bengal have enacted legislation.
Central Ground Water Authority (CGWA), constituted under Section 3(3) of the Environment (Protection)
Act, 1986 has notified 162 areas (Districts, Blocks, Mandals, Talukas, Municipal areas, etc.)in the country for
regulation of ground water development and management.
Mass awareness, Training And Capacity Building Programs
So far CGWB has conducted 455 mass awareness programmes on Rain Water Harvesting and Artificial
Recharge of ground water throughout the country involving Central/State Organizations/ NGO‘s, VO‘s,
welfare organizations, educational institutions, industries and individuals.
A total of 397 training programmes have been conducted so far to train resource persons as a measure of
capacity building for designing rain water harvesting structures to augment ground water in different terrains
and diverse hydrogeological conditions.
Realizing the need to provide trainings to ground water professionals, sub-professional and other stake holders
the RGNGWT&RI has embarked upon a three tier training program. The objective of these trainings is to
develop a pool of trained resource persons who would be working towards sustainability of ground water
resource. In Tier- I Training, the trainings are provided in core ground water areas with scientific input to
state and central level ground water professionals and sub-professionals in the Institute at Raipur. The Institute
has been organizing state level trainings to ground water professionals and sub-professionals under its Tier II

INDC- Vulnerability Report 2015
Page 31
Training program. It has been envisaged to carry out Ground Water Management through a Participatory
approach. In order to train grass-root level stake holders in basic skills of ground water data collection and
assistance in field studies Tier- III Block Level trainings are being organized by the Institute through CGWB
Regional and State Unit Offices.
Rajiv Gandhi National Ground Water Training & Research Institute (RGNGWTRI) under HRD and Capacity
Building Plan Scheme is implementing a three tiered training programme since 2012-13 to provide training to
professionals/ sub-professionals on various aspects of ground water including water conservation at State and
Block Level. The target groups of such trainings are State Govt. Officials, NGOs, PRIs and other stakeholders
at grassroots level. During 2012-15 a total of 354 State level (Tier II) and Block Level (Tier III) training
programmes were conducted in which 37143 persons were imparted trainings.
CGWA is conducting awareness programmes under the Information, Education and Communication scheme
of the Ministry of Water Resources throughout the country. CGWB also conducts paint ing competitions for
school children to spread the message of water conservation and so far 5 such painting competitions have been
organized since 2010-11. During 2014-15, more than 17.30 lakhs students participated in the painting
competition across the India.
6.5 National Mission for Clean Ganga The Ministry of Water Resources, River Development and Ganga rejuvenation informed that the 'National
River Conservation Plan' is a new scheme included in the budget of their Ministry during the financial year
2014-15. An Integrated Ganga Conservation Mission namely, ‘Namami Gange’, programme has been worked
out as per the provisions made in the Union Budget 2014-15.
‗NamamiGange‘ is a comprehensive program with the approach underpinned by socio-economic benefits that
the program is expected to deliver in terms of job creation, improved livelihoods and health benefits to the
vast population that is dependent on the river. Namami Gange focuses on cleaning of river Ganga in short
term but also has a comprehensive vision with 7 main thrust areas – that includes maintenance of flow, River
Front Development, Capacity Building, Research & Monitoring, Biodiversity Conservation and
communication & public outreach. There are 21 action points which fall under each of these thrust areas – that
are essential for comprehensive rejuvenation of River Ganga. The major activities on which Namami Gange
will focus on in next few years includes rehabilitation of existing STPs, creation of new STP, complete
sanitation coverage for gram panchayats, development of model cremation/dhobhighats. There are 118 towns
identified for complete coverage of sewerage infrastructure. Also, there is a focus on tackling the river surface
pollution through innovative technologies such as installation of trash skimmer boats/ trash boom/ aerators (at
the major Ghats of River Ganga).
CPCB has been approached for setting up environmental monitoring stations (porta cabin) at major drain-river
confluence points. CPCB to install real time water quality monitoring stations at 113 locations on Ganga, 10
have already been set on pilot scale. Solar panels are to be installed on the ghats. Zero Liquid Discharge to be
implemented by all Grossly Polluting Industries located in 5 basin states.
Proposed Programmes for Adaptation Measures between years 2020-2030:
Additional treatment capacity for Class I & II towns in 11 basin states of Ganga Basin
100% sanitation coverage targeted for 1657 Gram Panchayats along Ganga Basin. Identification of 3-4
villages to be developed as ‗Ganga Grams‘ in 66 districts lying along Ganga river for which criteria has
been defined by NMCG in coordination with MoDWS.

INDC- Vulnerability Report 2015
Page 32
Biogas plants to be installed for electricity generation –using bio gas generated in septic tanks, and
treatment plants
Waste to energy conversion
Utilization of biogas from anaerobic treatment to be mandatory
Organic farming to be mandatory for all villages along Ganga river
Sludge to compost conversion to be mandatory
GIS based decision support system with all details of Ganga with possibility of analysis, project and
evaluating scenarios
National Mission for Clean Ganga has so far sanctioned a total 93 projects in 55 towns in Ganga States
costing Rs. 7350.38 crore under NGRBA Program including Externally Aided Projects (EAP) component
with the assistance of Japan International Agency (JICA) and the World Bank. These include projects of Rs
2406.96 crore in Uttar Pradesh, of Rs 2155.62 crore in Bihar, of Rs 99.36 crore in Jharkhand, of Rs 1352.51
crore in West Bengal and of Rs 378.29 crore in Uttarakhand for laying of sewage networks, treatment plants,
development of river fronts, etc. These sanctioned projects also include three CPCB projects worth Rs 198.48
crore on Pollution Inventorization, Assessment and Surveillance (PIAS) on river Ganga Strengthening of
Environmental Regulator (SER)-CPCB and a project of setting up the Ganga Knowledge Centre (GKC) in
NMCG (Rs.48.54 crore). Further, for projects related to biodiversity conservation, afforestation, and
assessment of special properties of Ganga and communication & awareness for Dolphin conservation Rs
11.24 Crores have been sanctioned. An amount of Rs.1414.54 crore (as on 31st March 2015) has been
released by both Centre and the States for implementation of the sanctioned projects.
Union Budget 2014-15 has taken cognizance of the substantial amount of money spent in the conservation and
improvement of the Ganga, which has a very special place in a collective consciousness of this country.
Accordingly, an Integrated Ganga Conservation Mission called ―NamamiGange‖ has been proposed to be set
up and a sum of Rs. 2,037 crores has been set aside for this purpose. In addition a sum of Rs. 100 crores has
been allocated for developments of Ghats and beautification of River Fronts at Kedarnath, Haridwar, Kanpur,
Varanasi, Allahabad, Patna and Delhi in the current financial year.
Accordingly, NamamiGange approaches Ganga Rejuvenation by consolidating the existing ongoing efforts
and planning for a concrete action plan for future. The interventions at Ghats and River fronts will facilitate
better citizen connect and set the tone for river centric urban planning process.
5.6 Mitigation and Adaptation measures to aim for. The following are possible strategies working towards an ideal situation which can be further analyzed.
Detailed studies on the same may help formulate schemes for future provisions in the water sector.
MITIGATION AND ADAPTATION STRATEGIES
Category Sub-category GHG emission
category
Possible strategies
Energy
Electricity
usage
Lift Irrigation
Schemes
Mitigation
Use of solar pumps
Minimum Command area of lift irrigation schemes
Electricity coupon systems for water ext raction
Sewage
treatment plants
100% power backup to Sewage Treatment plants.
All STP‘s with captive methane generation to mit igate energy
usage.
Electricity
Generation
Hydropower
Dams/Reservoirs
Adaptation
Reservoir operation should be revised to consider utilizat ion
of storage including live storage

INDC- Vulnerability Report 2015
Page 33
All future reservoirs to have carry over storages along with
sluices to utilize dead storage.
For existing dams creat ion of sluices under dam
rehabilitation.
Proper soil moisture utilization guidelines to grow fodder in
reservoir capped areas where moisture is available for cattle.
Thermal power Mitigation
R&D in the area of ultra-super-critical boilers for coal-based
thermal plants, use of integrated gasification combined cycle
(IGCC) technology to make coal-based power generation
more efficient.
Industrial
processes and
product use
Water usage
Water intensive
industries
Mitigation
Ground water metering in water intensive industries
Industry specific water supply – coupon system
Moving of industries from residential land use/ core city
areas to outside to separate water supply zones
Agriculture
Ground water
pumping
Rice
Cult ivation
Largest emission
from ground
water pumping
Maximum
generation from
Flooded fields
Mitigation
100% measurement of irrigation by volumetric method
Crops particular to the region to be grown – checked by water
usage
Field specific water requirement metering
Use of Alternate irrigation techniques
Adaptation
Shift to sustainable agriculture practices according to agro
climatic zones
Micro irrigation systems with solar pumps
Waste
Domestic waste Mitigation
100% coverage of domestic waste pipelines to Sewage
Treatment Plants.
Adaptation
Treated waste water for reuse strategies
Industrial waste
Reuse of waste water through eco-cluster industries
formation.
100% t reatment of waste water in industrial estates and reuse
within itself for sustainable development
Separation of effluent water in case of decentralized
industries from domestic sewage and transport to Effluent
treatment plants
100% implementation of zero effluent industry
Water
Resources
Water Supply
Urban
100% shift from non-supply areas to supply zones without
slippage in water delivery
No internal drainage congestion
Areas dependent on Ground water supply and with fluoride,
arsenic contamination, provided with fresh domestic water
supply.
Rural 100% coverage of drinking water supply
Surface Water Revival of water body for areas along coast to check ingress
of sea-water
Ground water Priorit ization of over-explo ited blocks
Sanitation Urban 100% coverage with sanitation facilities with 500m influence
zones.
Decentralized p lants for waste water reuse in flushing.
INDC- Vulnerability Report 2015
Page 34
Precip itation
Rainfall
100% coverage of Rainwater Harvesting structures in urban
settlement
100% Rain water Harvesting structure coverage in
institutional areas
Storm water
drainage
Storm water lines to be separated from sewage lines and
water reused in landscaping or artificial water body recharge
Sea water
ingress
Revival of coastal in land water bodies to check sea water
ingress
Other sectors
Transmission
losses
Canal supply All possible efforts to reduce evaporation losses in
transmission
Research and
Systematic
Observation
Comprehensive water data base in public domain and
assessment of the impact of climate change on water resource
As part of the strategies in terms of water sector, National Water Mission has been working towards schemes
and programmes through its well defined goals to mitigate and adapt to impacts of climate change.
Chapter 7: Constraints, Gaps and Related Financial, Technical and Capacity
Needs Water sector is a multi-faceted sector which has its inputs and outputs in almost all other consequent sectors.
Be it mitigation or adaptation, the relevance of water overlays as direct and indirect impacts spanning over a
broad range of subjects, like energy, agriculture etc. To capture the true correlation between water and climate
change, it would require not only an understanding of a wide range of inter-related coexisting subjects but also
technical abilities to extract relevant information for water sector.
Since water is a state subject in India, each state has its own strategy to deal with its water sector, which
becomes a challenge because rivers and ground water aquifers are trans-boundary. Agrarian States depend on
major ground water extractions and energy use for their irrigation needs, thus depleting ground water aquifers
Studying the potential socio-economic impacts of climate change involves comparing two future scenarios:
one with and the other without climate change. Uncertainties involved in such an assessment include (i) the
timing, magnitude, and nature of climate change; (ii) the ability of the ecosystems to adapt either naturally or
through managed intervention to the change; (iii) future increase in population and economic activities and
their impacts on natural resources systems; and (iv) how society adapts through the normal responses of
individuals, businesses, and policy changes. The uncertainties, long periods involved, and the potential for
catastrophic and irreversible impacts on natural resources systems raise questions as to how to evaluate
climate impacts and other policies that would affect or be affected by changes in the climate.
At present, few climate impact models explicitly consider how climate variability and change would affect
groundwater recharge. Groundwater is poorly represented in the land-surface models (LSMs) incorporated in
GCMs. Groundwater fluxes operating at a range of spatio-temporal scales require consideration. These fluxes
include: (i) capillary flow from the water table to the root zone to sustain evapo-transpiration during dry
periods, (ii) shallow groundwater discharge to local stream networks and other surface water bodies (lakes and
wetlands), (iii) deeper regional groundwater discharge to downstream river and wetlands, and (iv) submarine
discharge in the coastal areas. Failure to consider groundwater fluxes as mentioned above can lead to errors in
simulate driver discharge and soil moisture in LSMs and offline hydrological models.
Fundamental constraints to both the representation of groundwater in climate models and the consideration of
climate impact on groundwater, includes limited groundwater observations in time and space. There is

INDC- Vulnerability Report 2015
Page 35
therefore an urgent need to remove the above barriers through a concerted effort at the modelling levels, so as
to enhance our understanding of the projected changes in groundwater estimations.
The quantitative estimates and Impact patterns of climate change in India still have large uncertainties
associated with them. Further research is needed to strengthen assessments and reduce uncertainty in
predictive models. Specifically, additional research is required to:
Improve the models by minimizing the known biases in simulating observed regional climatic
patterns, especially the Indian summer monsoon;
Develop an ensemble of plausible scenarios in the regional context;
Improve spatial resolution for regional/local manifestations of climate change impacts;
Develop sensitivity studies for regional/local manifestations of climate change impacts;
Develop predictive models that focus on short term variations as well as longer-term change, to help
guide policy making over time.
The state governments have been requested to create detailed state action plans for climate change specific to
water sector. The elements identified for the water sector are exhaustive and would provide a much detailed
outlook of state level scenarios. The integrated database model will also provide a unique basis for states to
understand trans-boundary issues and water needs, while creating their own action plans for climate change.
The state action plans together with the integrated database would help in clearly demarcating the problem
areas and would give a baseline review of ongoing strategies and policies at state and national level.
The policy strategies as highlighted in chapter 5 ‗Vulnerability assessment and adaptation strategies‘ are
indicative of ideal situations and will provide a goal to work towards. National water mission has been
initiated to provide the same with a detailed list of goals to work towards mitigation and adaptation strategies
for climate change. The initiative will look towards achieving its goals in a phased manner and has been
included as part of strategical output along with existing schemes of Ministry of Water Resources, River
development and Ganga Rejuvenation, in adaptation and mitigation templates submitted as Intended
Nationally Determined Contribution.

INDC- Vulnerability Report 2015
Page 36
Chapter 8: BIBLIOGRAPHY
REFERENCES
1. Intergovernmental panel on Climate change – IPCC – Fifth Assessment Synthesis Report – Adopted
Nov 2014.
2. Second National Communication to the United Nations Framework Convention Report – Ministry of
Environment and Forests, Government of India, 2012
3. Status of Sewage Treatment in India – Central Pollution Control Board (CPCB) , Report Nov 2005
4. Performance status of CETP in India – Central Pollution Control Board (CPCB) , Report 2005
5. Water In India: Situation and prospects – UNICEF, FAO and SaciWATERS, 2013
6. Water Related Statistics – 2010, 2013, 2015, CWC
7. Standing Sub-Committee for Assessment of Availability and Requirement of Water - Ministry of
Water Resources, River Development and Ganga Rejuvenation. 2000
8. National Commission for Integrated Water Resource Development (NCIWRD) 1999
9. Working group on Water Resources for the XIth Year Plan (2007-2012) – Ministry of Water
Resources, River Development and Ganga Rejuvenation. December 2006
10. Impact of melting glaciers in Himalaya – Professor Syed Iqbal Hasnain, The Energy and Resources
Institute (TERI), New Delhi , 2009
11. Report on status of ground water quality in coastal aquifers of India – Central Ground Water Board,
2014
12. Multi-model climate change projections for India under representative concentration pathways, -
Rajiv Kumar Chaturvedi (Centre for Sustainable Technologies, Indian Institute of Science,
Bangalore), Jaideep Joshi (Indian Institute of Technology, Mumbai), MathangiJayaraman (Centre
for Sustainable Technologies, Indian Institute of Science, Bangalore), G. Bala (Centre for
Atmospheric and Oceanic Sciences and Divecha Centre for Climate Change, Indian Institute of
Science, Bangalore) and N. H. Ravindranath (Centre for Sustainable Technologies, Indian Institute
of Science, Bangalore), 2012
13. Minor Irrigation Census - with reference year 2000-01
14. Grail Research, 2009
15. India‘s Water Economy: Bracing for a Turbulent Future. Report No. 34750-IN - World Bank
Agriculture and Rural Development Unit, South Asia Region - World Bank, 2005.
16. Status of Water Supply, Wastewater Generation and Treatment in Class I Cities and Class II Towns
of India - Central Pollution Control Board, 2010. CPCB Report Series: CUPS/70/2009-10, India
17. Urban Wastewater and Agricultural Reuse Challenges in India. International Water Management
Institute (IWMI) Research Report 147 - Amerasinghe, P., Bhardwaj, R.M., Scott, C., Jella, K., and
Marshall, F. 2013.
18. India‘s Urban Awakening: Building Inclusive Cities, Sustaining Economic Growth - McKinsey
Global Institute, 2010.
19. Wastewater use for agriculture in India: A background Review – Abhijeet Banerjee, GIZ – India
20. Annual Report 2013-14 – Central Water Commission, Ministry of Water resources, River
development & Ganga Rejuvenation
21. Report on Status of Ground water Quality in Coastal Aquifers of India – Central Ground water
Board, February 2014
22. Annual Report 2011-12 – Central Pollution Control Board, Ministry of Environment and Forests
23. Dynamic Ground water resources of India (as on 31st March 2011- Central ground water Board, July
2014

INDC- Vulnerability Report 2015
Page 37
24. Assessment of Ground water resources – A review of International Practices – Central Ground water
board, 2014
25. Water and waste water treatment opportunity in India – Avalon Global Research 2011
26. Wastewater production, treatment and use in India – R Kaur (Water Technology center, Indian
Agricultural research Institute, New Delhi) SP wani (International Crops Research Institute for the semi
– Arid Tropics, Hyderabad), AK singh(Indian Council of Agriculture research, New Delhi), K lal(Water
Technology center, Indian Agricultural research Institute, New Delhi)

INDC- Vulnerability Report 2015
Page 38
Template for INDC – Adaptation
PROGRAM BRIEFS
Program 1: DWRIS
Comprehensive water data base in public domain and assessment of the impact of climate change on water
resources is one of the major Goal of National Water Mission under National Action Plan on climate
Change. Central Water Commission, Ministry of Water Resources, River Development and Ganga
Rejuvenation is implementing a scheme viz. ‗Development of Water Resources Information System
(DWRIS)‘ as a recommended strategy to achieve the objective of assessment of impact of climate change
on water resources. Water scarcity is fast becoming a critical issue and climate change impacts will further
intensify the water related problems spatially and temporally in India. The need of the hour is to develop,
manage, update, and maintain a centralized national level water resources information system and provide
standardized data and value added services to all stake holders for its management and sustainable
development. Setting up of additional observation stations and strengthening of the existing CWC
observation network to meet data gap as well as to prepare for climate change adaptation is required more
intensive data both in terms of quantity and quality. The existing Hydrological Observations (HO) stations,
numbering 878, are far below scientific requirement and international norm. However, keeping in view the
sites being maintained by the various States and other organizations, CWC proposed to setup 1917 new
HO stations (including Snow and Met. Stations) covering all rivers of significance in India in addition to
the existing 878 stations. National Water Informatics Centre (NWIC) is proposed to be set up as an
independent statutory organization comprising professionals from the specialized fields, namely, Water
Resources, GIS, Remote Sensing, Computer Science and other related disciplines to manage the large
volume of data on water resources and allied fields generated under India-WRIS project and also to update
these periodically for proper decision making through development of decision support system as per the
requirement of various Central/State Governments and Water Disputes Tribunals. Considering the large
geographical area of the country, large network of rivers, wide temporal and spatial variation in
precipitation, wide variation in topography and geology combined with the possibility of climate change
being predicted in future, this scheme envisages expansion of the hydrological network of CWC in all river
basins of India to 2795 stations including existing 878 stations. This scheme also envisages the collection
of reservoir water level of 120 reservoirs having live storage capacity more than two-third of total live
storage capacity developed and to generate weekly bulletin on live storage status of these reservoirs,
Creation of an integrated data bank to tackle coastal erosion in a scientific manner and keeping in view the
long term perspective and challenges of climate change. It also envisages to provide firm database in
respect of Minor Irrigation Schemes including Repair Renovation & Restoration (RRR) of water bodies in
the country at periodic intervals, carry out monitoring of Major & Medium Irrigation projects including
RRR of water bodies to ensure completion of the irrigation projects as per schedule, continue to maintain
secretariat services to water quality assessment and ensure proper upkeep of the books and to make
complete automation of library activities so that fast as well as accurate retrieval of information available
in the library is possible.
INDC- Vulnerability Report 2015
Page 39
Program 2: Flood Forecasting (FF)
Coping with flood is one of the major goal of national water mission under NAPCC. Climate change may
alter the precipitation pattern significantly. It has been observed that extreme rainfall events followed by
floods with increase in both frequency and intensity in many parts of India. Climate change will also
change snow distribution and snowmelt patterns of Himalayans regions, which will have a severe effect on
reservoir and rivers in the form of floods in adjoining area.
Central Water Commission, Ministry of Water Resources, River Development & Ganga Rejuvenation has
been started activities of flood forecasting comprises Level Forecasting and Inflow Forecasting. The
purpose of a flood forecasting is to detect threatening flood events so that the public can be alerted in
advance and can undertake appropriate responses to minimise the impact of the event. The level forecasts
help the local administration and other agencies in deciding mitigating measures like evacuation of people
and their movable property to safer locations. Flood Forecasts may also be made to help decision-makers
model how an event is likely to develop, how significant it will be upon arrival, and what sections of the
population are likely to be at risk. The Inflow Forecasting is used by various reservoir/dam authorities in
optimum operation of reservoirs for safe passage of flood downstream as well as to ensure adequate
storage in the reservoirs for meeting the demand during the non-monsoon period. The formulation of a
forecast requires effective means of real time data communication network between the forecasting
stations and the base stations. CWC by Annually, about 6000 flood forecasts are issued during floods with
more than 96% accuracy which is a milestone in the area of scientific flood forecasting. Presently, Flood
forecasts are issued by CWC at 175 stations (28 Inflow Forecast Stations + 147 Level Forecast Stations).
The process of flood forecasting consists of Data Collection, Transmission of Data to the Flood
Forecasting Division / Modeling Centre, Formulation of Flood Forecasts Dissemination of Flood Forecasts
to the Local Administration / user Agency and Daily Flood Bulletins publication.
Further, there are many activities for flood forecasting and climate adaption like forecasting flood in flood
prone areas of all the rivers by developing digital elevation models, Systematic approach for coping with
floods by Mapping of areas likely to experience floods, developing schemes to manage floods, establishing
hydraulic and hydrological models and developing comprehensive approach to flood management &
reservoir sedimentation, encourage and enforce flood plain zoning in flood prone rivers.
Program 3: National Hydrology Project (HP III)
The twelfth plan working group on flood management estimates that in the period of 1953-2010, on an
average, an area of 7.208 mha and a population of 3.19 million were affected by floods every year. The
average annual flood damage to crops, houses and public utilities at constant (2010-11) prices works out to
about Rs. 6976 crores. As per assessment of ground water by CGWB in 2011, out of 6607 assessment units
(Blocks/Mandals/Talukas/Firkas) in the country, 1071 units in various states have been categorized as
‗over-exploited‘ i.e. the annual ground water extraction exceeds the net annual ground water availability.
The country needs to adopt Integrated Water Resources Management (IWRM) approach. i.e take up the
entire river basin for holistic management of water resources so as to address the issues like availability of
water for drinking, agriculture, industrial purposes, etc. floods, droughts, operation of water resources
structures like dams, barrages, canals etc. IWRM is being gradually adopted the world over.
National hydrology project has been envisaged by this Ministry. It is a follow-up and extension of
Hydrology Project Phase-I and Phase-II with pan-India coverage.
The four main components broadly comprise the following:

INDC- Vulnerability Report 2015
Page 40
Setting up of Hydro-metrological Monitoring Stations on river systems to collect data of water
level, discharge, Gauge levels of river systems, climatic parameters like precipitation (including
snow) temperature, humidity, sunshine etc. and water quality parameters etc.
The data captured by the Hydro-Metereological Stations would be transmitted to a National
Water Resources Information System. [Already in place with the organizations like CWC and
CGWB in this Ministry.
Development of Decision Support systems to analyze the data stored in the National Water
Information system shall aid in flood, forecasting, reservoir operations, conjunctive use of
surface and ground water, estimation of water resource availability and operation of canals, etc.
The data so generated under National Hydrology project (NHP) would also assist in designing
water resource structures such as dams, barrages, canals etc.
The other components include the capacity Building of officers of MoWR and the State Governments for
integrating the data collected from Hydro-metrological stations till the decision making process.
Program 4: Ground Water Management and Regulation (GWMR)
Objectives of the scheme are to:
Evolve strategies for scientific planning, development and management of ground water resources
under different hydro geological environs.
Develop and operationalize area - specific techniques / technologies for ground water development,
augmentation and management.
Regulate and control the development and management of ground water resources.
Conduct Research & development studies including up gradation of technological capabilities and
infrastructural base of the Central Ground Water Board to meet the upcoming challenges in ground
water and transfer of knowledge and education in hydro-geological research and ground water
management. Also increase capacity building in all aspects of ground water development and
management through information dissemination, education, awareness and training.
Increase coordination with concerned central / state govt. organizations for sustainable ground water
development and management
Program 5: Research and Development (R&D)
The objectives of the scheme are
to find practical solutions to the country‘s water resources related problems and to improve available
technology and engineering methods and procedures, particularly to take up research studies for
improvement of the efficiency of the existing facilities,
to create / upgrade research facilities of the premier organizations/institutions at National level to keep
pace with the state-of-art technology, and
to support research works to be taken up by the various institutions in water sector.
Program 6: HRD/Capacity Building
Coordination work related to Human Resources Development & Capacity Building Scheme. This new
scheme launched during Financial Year 2013-14 comprises of five components viz:-
National Water Academy
INDC- Vulnerability Report 2015
Page 41
Information, Education and Communication
Rajiv Gandhi Institute of Training and Research
Capacity Building Programme
Training of the Ministry of Water Resources Officers.
INFORMATION, EDUCATION AND COMMUNICATION
The Information, Education and Communication (IEC) was launched for implementation during the XI
Five Year Plan with the aim of creating awareness among various target groups about the importance of
development and management of water resources in a holistic manner with due emphasis on a
coordinated effort for addressing various water related issues. During the XII Plan Period (2012-2017),
the IEC Scheme was merged with HRD and Capacity Building Scheme.
The objectives of the scheme are as under :-
(i) To create awareness for optimal sustainable development, maintenance of quality and efficient use of
country‘s water resources to match the growing demands on this precious natural resource with active
involvement of all stakeholders in order to achieve accelerated, equitable, economic development of
the country.
(ii) To create awareness for urgent need for mutual cooperation and adopting integrated planning and
participatory approach in management.
(iii) To create awareness among the people about necessity of water conservation.
(iv) To promote advocacy on the tenets of National Water Policy with focus on learning, documenting and
dissemination of knowledge of water science and technology and issues concerning sustained
development of water resources.
(v) To create awareness about necessity of adopting measures for rainwater harvesting and artificial
recharge of ground water to meet present and future needs of water.
(vi) To strengthen awareness infrastructure specially campaign mechanism and support structure.
HUMAN RESOURCES DEVELOPMENT AND CAPACITY BUILDING IN CWC
The Central Water Commission (CWC), in pursuit of meeting its objectives as an apex national
organization in the Water Resources Sector and in order to meet the existing and emerging challenges in
the water resources sector in the country makes continuous efforts to impart trainings on various aspects
of water resources development to its engineers.
The National Water Academy (NWA) set up by the MoWR is envisaged to function as a ‗Centre of
Excellence’ for capacity building in Water Sector. The mandate of NWA initially was to impart training
to the in-service engineers of various State and Central organizations involved in the Development and
Management of Water Resources. Subsequently, the mandate of NWA was widened to also cater to the
training needs of other stakeholder groups of water sector. Accordingly, since October 2010, the
Academy‘s programs are also available to Public Sector Undertakings, Private Sectors, Academic
Institutions, Media Personnel, NGOs, Foreign Nationals and Individuals, thus reaching out to almost
every stakeholder.
NWA conducts training program on all aspects of water resources development and management.
Initially, the NWA started with training in technology areas, but as of now have also expanded their
range to include non-technical topics like Socio, Economic and Environmental aspects of Water
Resources Projects; Contractual & Financial Issues; Water related Law; and development of Soft Skills
like Management Development Programs etc. NWA is also mandated to form linkages with National &
International Institutions in the field of science and technology and WRD&M as a part of the overall

INDC- Vulnerability Report 2015
Page 42
responsibility of capacity building assigned to NWA by the Ministry. NWA has started conducting tailor-
made programs for various client organizations, and also participants from foreign countries including
programs under India-Africa Forum Summit at the behest of MEA.
Although the training needs of CWC engineers is largely catered by National Water Academy (NWA),
Pune, for training on technical matters of higher specialization and on non-technical matters and
managerial aspects, the CWC engineers need to be deputed to various training programs organized by
other organizations/ institutions of eminence in India and abroad, in addition to participation in various
conferences, symposia, workshops, technical visits, etc organized by various national and international
bodies for updating of knowledge and skills.
HUMAN RESOURCES DEVELOPMENT AND CAPACITY BUILDING IN CGWB
Rajiv Gandhi Institute of Training and Research
Rajiv Gandhi National Ground Water Training and Research Institute (RGNGWTRI) located at Raipur,
Chhattisgarh caters to the training requirements of Central Ground Water Board and training
requirements of various Central and State Government organizations, Academic institutes, NGOs etc.
During XII Plan, RGNGWTRI, under HRD and Capacity Building Scheme of MoWR, RD & GR is
implementing a three tiered training programme keeping in view the requirements of the National Project
on Aquifer Management. As also to disseminate the water issues, in general, and ground water issues, in
particular, to the stakeholders. These trainings will enable creation of a trained workforce for
implementation of National Project on Aquifer Management and overall sustainable development of
ground water resources. Total outlay for RGNGWTRI for XII Plan is Rs. 90.00 Crore.
During the entire plan period, as a part of this three-tiered programme. A total of 174 Tier I (National
Level) training courses are proposed in which professionals from Central/State Government departments,
Academic Institutes etc. are to be trained. In addition to above, Under Tier II (State Level) training
programmes, a total 222 courses are proposed in which ground water professionals, NGOs, VOs, PRIs
etc. are proposed to be trained. Further under Tier III (Block Level) training programmes, a total
1250courses are proposed in which NGOs, PRIs, Progressive farmers and other stakeholders at grassroots
level are to be trained.
By the end of March 2015, during this P lan period, RGNGWTRI has completed 451 training
programmes including 97 National Level (Tier I), 122 State Level (Tier II) and 232 Block (Tier III)
training programmes. While the Tier I (National Level) Training programmes were conducted at
RGNGWTRI , Raipur, the State and Block Level training programmes were conducted at various places
in different States through the Regional Offices of CGWB.
Objectives
To be an international centre of excellence in Training, Research and Development in the
groundwater sector
To provide training to ground water professionals and sub-professionals in various fields of ground
water
To train NGO, PRIs and other stake holders of ground water
To train various stake holders for taking up ground water monitoring and data collection work for
Aquifer Mapping under Participatory Ground Water Management Program of National Project on
Aquifer Management (NAQUIM)
To undertake Research and development works in Ground Water Sector

INDC- Vulnerability Report 2015
Page 43
Program 7: River Basin Management (RBM)
This newly named scheme has been formulated during financial year 2013-14 by merging two ongoing
schemes, namely, River Basin Organization and Investigation of Water Resources Development Scheme.
The scheme also includes, restructuring of CWC and activities of Brahmaputra Board under following sub-
schemes:-
River Basin Organizations: The objective of the scheme is to provide a forum to all the co-basin states
for taking up necessary studies, evaluation etc. for finding optimum method for development and
utilization of water resources within that basin and meeting the aspirations of all stake-holders.
Investigation of Water Resources Development Scheme: The objective of the scheme is to carry out
the activities related to survey, field investigation, preparation of pre-feasibility/feasibility report (FRs)
& detailed project report (DPRs) of the schemes for Inter Basin transfer of Water, intra-State links and
to carry out other studies & activities considered necessary incidental, supplementary or conducive to
attainment of above objectives.
Re-structuring of CWC: Scheme is under approval stage
Brahmaputra Board: The main objective of Brahmaputra Board are Survey, Investigation &
preparation of Master Plan, DPRs for Drainage Development Schemes & DPRs for Multipurpose
project, Operation & maintenance & up gradation of NEHARI, construction of H.Q. Complex & R&M
of assets created by the Board, Up gradation of IT&GIS, Climate Change Studies etc. Execution of (i)
Drainage Development Schemes, (ii) Anti-erosion schemes & Flood Management Schemes, (iii)
Construction of raised platform.
Program 8: River management Activities and works related to Border Rivers (RMAWBR)
It covers the on-going river management activities on common rivers with Nepal, Bhutan China and
Bangladesh. Besides, some new developmental works in border areas are envisaged under this scheme to
provide 100% Central assistance to the concerned States for their timely completion.
Under the scheme, works of (i) finalization of Detailed Project Report (DPR) of Pancheshwar
Multipurpose Project (PMP), proposed on the Mahakali river at Indo-Nepal Border (ii) Survey &
Investigation of Kosi High Dam Project at Barahkshetra in Nepal (iii) Detailed Investigation of Naumure
Storage Project (Nepal) on river Rapti (iv) Hydrological observations on common rivers with Nepal,
Bhutan, China and Bangladesh (v) Maintenance of flood protection works of Kosi and Gandak barrages in
the Nepal territory (vi) Establishment cost of Ganga Flood Control Commission and (vii) new river bank
protection works on common/ border rivers with Bangladesh and Pakistan proposed by West Bengal,
Tripura & J & K states were taken up during XI Plan period.
In addition, Brahmaputra Board, Guwahati is provided grant-in-aid for establishment cost besides urgent
flood protection works in critical reaches, in Brahmaputra & Barak basin including protection of Majuli
Island from river erosion.
Three Bank Protection/ flood control works on Mahananda River in West Bengal along international
border with Bangladesh have been completed. Ten Bank Protection works in West Bengal and two Bank
Protection works in Tripura are under various stages of completion. In addition, central assistance has been
provided to the state Government of Tripura for undertaking three more bank protection works along
international border with Bangladesh.
During XII Plan, the scheme covers the hydrological observations and flood forecasting on common
border rivers with neighboring countries, survey & investigations for WR projects in neighboring
countries, activities of Ganga Flood Control Commission (GFCC), 100% grant-in-aid to river bank

INDC- Vulnerability Report 2015
Page 44
protection works on common/ border rivers with Bangladesh and Pakistan proposed by West Bengal,
Tripura & J&K States and 100%
Program 9: National Water Mission (NWM)
The main objective of the National Water Mission is ―conservation of water, minimizing wastage and
ensuring its more equitable distribution both across and within States through integrated water resources
development and management‖. The five identified goals of the Mission are: (a) comprehensive water data
base in public domain and assessment of impact of climate change on water resource; (b) promotion of
citizen and state action for water conservation, augmentation and preservation; (c) focused attention to
vulnerable areas including over-exploited areas; (d) increasing water use efficiency by 20%, and (e)
promotion of basin level integrated water resources management.
Various strategies for achieving the goals have been identified which lead to integrated planning for
sustainable development and efficient management with active participation of the stakeholders after
identifying and evaluating the development scenario and management practices towards better
acceptability on the basis of assessment of the impacts of climate change on water resources based on
reliable data and information.
The National Water Mission aims at integrated water resource management to conserve water minimize
wastage and ensure more equitable distribution both across and within states. The Mission will take into
account the provisions of the National Water Policy and develop a framework to optimize water use by
increasing water use efficiency by 20% through regulatory mechanisms with differential entitlements and
pricing. It will seek to ensure that a considerable share of the water needs of urban areas are met through
recycling of waste water, and ensuring that the water requirements of coastal cities with inadequate
alternative sources of water are met through adoption of new and appropriate technologies such as low
temperature desalination technologies that allow for the use of ocean water.
The National Water Policy would be revisited in consultation with States to ensure basin level
management strategies to deal with variability in rainfall and river flows due to climate change. This will
include enhanced storage both above and below ground, rainwater harvesting, coupled with equitable and
efficient management structures.
The Mission will seek to develop new regulatory structures, combined with appropriate entitlements and
pricing. It will seek to optimize the efficiency of existing irrigation systems, including rehabilitation of
systems that have been run down and also expand irrigation, where feasible, with a special effort to
increase storage capacity. Incentive structures will be designed to promote water-neutral or water positive
technologies, recharging of underground water sources and adoption of large scale irrigation programmes
which rely on sprinklers, drip irrigation and ridge and furrow irrigation.
Program 10: Irrigation Management Plan
Irrigation Management Programme‘ is a new scheme introduced in the XII Five Year Plan to incentivize
states to undertake water sector reforms with the total outlay of Rs.6000.00 crores. It is proposed to evolve
benchmarks for State Specific Water Sector Reforms and Methodology for Assessment of States
Performance based on a suitable framework, identifying the injudicious inter-sectoral and intra-sectoral
distribution of water amongst various categories of water users, low water use efficiency, fragmented
approach to water resources planning and development, low water user charges and meager recovery as
some of the major problems associated with the management of water resources in the country. The details
of the scheme are under finalization
INDC- Vulnerability Report 2015
Page 45
Program 11: Dam Rehabilitation Improvement Project (DRIP)
Dams are critical infrastructure for multipurpose uses such as irrigation, power generation, flood
moderation and supply of water for drinking and industrial purposes, which are constructed with large
investments. Other physical assets, such as, hydro power plants, irrigation network, drinking and industrial
network, municipal supplies etc., are also linked with the dams. Safety of the dams is a very important
aspect which has to be given priority on a continuous basis for safeguarding the national investment and
the benefits derived by the nation from the projects. In addition, an unsafe dam (with high possibilities of
failure and sudden release of huge quantities of stored water) constitutes a hazard to human life as well as
animal life. Safety of dam is a matter of great concern to the general public as very large number of human
life gets involved.
Over the last fifty years, India has invested substantially in infrastructure necessary to store surface runoff
in reservoirs formed by large, medium, and small dams with associated appurtenances. There are about
4857 completed large dams in the country (as per National Register of Large Dams), and many of them
have structural deficiencies and shortcomings in operation and monitoring facilities on account of ageing;
and some of them do not meet the present design standards – both structurally and hydrologically. About
75% of the completed dams – i.e. about 3700 in numbers – are more than 25 years old, out of which about
164 dams are more than 100 years old. These 3700 ageing dams are in need of different levels of
rehabilitation interventions; and such (commonly) observed interventions include:
Treatment of leakage through masonry and concrete dams and reduction of seepage through earth dams
and their foundations, and improving dam drainage;
Improving the ability to withstand higher floods, including additional flood handling facilities, if needed,
accompanied by structural strengthening of dams;
Rehabilitation and improvement of spillways, head regulators, draw-off gates and their operating
mechanisms, stilling basins, and downstream channels;
Increasing spillway capacity as required by hydrological re-assessments, in those cases where this is
physically possible, otherwise non-structural measures to be designed;
Improving approach roads; communication facilities, and improving dam safety instrumentation.
As part of continuous strengthening of the dam safety activities in India, the Union Government with
World Bank assistance has taken up a project titled ―Dam Rehabilitation and Improvement Project (DRIP)
under which distress conditions of about 230 existing dams in 7 states (Madhya Pradesh, Odisha, Kerala,
Tamil Nadu, Karnataka, Uttarakhand and Jharkhand) have been identified for necessary strengthening and
rehabilitation measures. Besides, institutional strengthening measures (for dam safety) will also be taken
up in Central Water Commission and in all the project implementing agencies. With an estimated cost of
Rs. 2100 crore, this six-year project has become effective since 18th April 2012.
Considering the average cost of dam rehabilitation (including essential institutional strengthening) of about
Rs. 7.0 Crore per dam as per trends seen in DRIP, the total cost of rehabilitation of 3700 ageing dams (25
years and above) would be about Rs. 26000 Crore. So far, the State Governments have not been able to
give due priority for the maintenance and strengthening of ageing dams, largely due to factors of resource
crunch.
CWC is of the view that DRIP initiative can be expanded further as an externally aided scheme with
Central assistance and in consultation with the concerned states having dams in distressed conditions.
However, an early decision in this regard needs to be arrived at by MoWR in consultation with Ministry of
Finance and the interested states. If agreeable, a new plan scheme can be formulated by CWC, for which a
tentative estimate amounting to Rs. 26,000 Crores for implementation during 2020-30.

INDC- Vulnerability Report 2015
Page 46
Program 12: National Mission for Clean Ganga (NMCG)
National Mission for Clean Ganga has so far sanctioned a total 93 projects in 55 towns in Ganga States
costing Rs. 7350.38 crore under NGRBA Program including Externally Aided Projects (EAP) component
with the assistance of Japan International Agency (JICA) and the World Bank. These include projects of
Rs 2406.96 crore in Uttar Pradesh, of Rs 2155.62 crore in Bihar, of Rs 99.36 crore in Jharkhand, of Rs
1352.51 crore in West Bengal and of Rs 378.29 crore in Uttarakhand for laying of sewage networks,
treatment plants, development of river fronts, etc. These sanctioned projects also include three CPCB
projects worth Rs 198.48 crore on Pollution Inventorization, Assessment and Surveillance (PIAS) on river
Ganga Strengthening of Environmental Regulator (SER)-CPCB and a project of setting up the Ganga
Knowledge Centre (GKC) in NMCG (Rs.48.54 crore). Further, for projects related to biodiversity
conservation, afforestation, and assessment of special properties of Ganga and communication &
awareness for Dolphin conservation Rs 11.24 Crores have been sanctioned. An amount of Rs.1414.54
crore (as on 31st March 2015) has been released by both Centre and the States for implementation of the
sanctioned projects.
Union Budget 2014-15 has taken cognizance of the substantial amount of money spent in the conservation
and improvement of the Ganga, which has a very special place in a collective consciousness of this
country. Accordingly, an Integrated Ganga Conservation Mission called ―NamamiGange‖ has been
proposed to be set up and a sum of Rs. 2,037 crores has been set aside for this purpose. In addition a sum
of Rs. 100 crores has been allocated for developments of Ghats and beautification of River Fronts at
Kedarnath, Haridwar, Kanpur, Varanasi, Allahabad, Patna and Delhi in the current financial year.
Accordingly, NamamiGange approaches Ganga Rejuvenation by consolidating the existing ongoing
efforts and planning for a concrete action plan for future. The interventions at Ghats and River fronts will
facilitate better citizen connect and set the tone for river centric urban planning process.
Program 13: Interlinking of rivers
The Ministry of Water Resources, River Development and Ganga Rejuvenation has formulated a National
Perspective Plan (NPP) for Water Resources Development in 1980 envisaging inter-basin transfer of water
from surplus basins to deficit basins/areas. National Water Development Agency (NWDA) has identified
30 links under the NPP. Based on the concurrence of the concerned States, Detailed Project Reports (DPR)
for Ken-Betwa Link, Damanganga - Pinjal links have been completed by NWDA.
NPP on implementation would provide additional irrigation benefits of 35 million hectare over and above
the ultimate irrigation potential of 140 million hectare from Major, Medium & Minor projects and
generation of 34,000 MW of power, apart from the benefits of flood control, navigation, water supply,
fisheries, salinity and pollution control etc. Thus, ILR projects would address the problem of flood and
drought in various parts of the country.
In addition, out of 46 proposals of intra-state links received by NWDA from 9 States, the Burhi Gandak-
Noon-Baya- Ganga Link of Bihar, Kosi-Mechi Link of Bihar, Ponnair- Palar Link of Tamil Nadu,
Wainganga-Nalganga Link of Maharashtra and Barakar-Damodar-Subernarekha Link of Jharkhand have
also been taken up for preparation of DPRs by the NWDA on the request made by the concerned States.
The DPRs of two intra-state links i.e. Burhi Gandak- Noon-Baya-Ganga Link Project and Kosi-Mechi Link
Project have been completed and sent to Government of Bihar in December, 2013 and March, 2014
respectively.
INDC- Vulnerability Report 2015
Page 47
Program 14: Accelerated Irrigation Benefits Programme (AIBP)
Irrigation is a state subject and irrigation projects are formulated, executed and funded by the State
Governments themselves from their own resources. Central assistance is released in the form of block
loans and grants not tied to any sector of development or project. A large number of major and medium
irrigation projects in the country are languishing due to various reasons, the most important of them being
inadequate provision of funds by the concerned State Governments. As a result, large amount of funds
spent on these projects are locked up and the benefits envisaged at the time of formulation of project
reports could not be achieved. This is a cause for concern to the nation and initiative is required at the
national level to remedy the situation. Since the irrigation projects are capital intensive, and states with
limited resources at their disposal find themselves unable to meet the desired fund demands of all the
projects, the implementation of these projects get delayed.
Keeping the above in view, Central Govt., during 1996-97, launched an Accelerated Irrigation Benefits
Programme (AIBP) to provide Central Loan Assistance (CLA) to major/medium irrigation projects in the
country, with the objective to accelerate the implementation of those projects which were beyond resource
capability of the states or were in advanced stage of completion. While selecting the projects, special
emphasis was to be given to Pre-fifth and Fifth Plan projects. Priorities were also given to those projects
which were benefiting Tribal and Drought Prone Areas. However, under the revised AIBP Guidelines
from the year 1999-2000 onwards, Central Loan Assistance under AIBP could also be extended to minor
surface irrigation projects of special category states (N.E. States & Hilly States of H. P., Sikkim, J&K,
Uttaranchal and projects benefiting KBK districts of Orissa).
The balance cost of the project as the State‘s share is to be arranged by the State Govt from its own
resources. The earlier guideline stipulating completion of an ongoing project under AIBP for including a
new project under AIBP has been relaxed for projects benefiting a) drought prone areas, b) tribal areas, c)
States with lower irrigation development as compared to National average, and d) districts identified under
the PM‘s Package for agrarian distress districts. The relaxation in criteria of AIBP is expected to expedite
the completion of pending irrigation projects.
During the 12th Plan, the AIBP guidelines has been further re-modified and implemented from October,
2013. As per the new guidelines, the pari-passu implementation of Command Area Development (CAD)
works was given more stresses for the potential utilization. The eligibility criteria for new projects was
continued but the advanced stage of construction has been defined in terms of at least 50% of physical and
financial progress on essential works like Head-Works, Earth Works, Land Acquisition, R&R etc. Further,
funding pattern and mode of disbursement has been slightly modified during XII Plan.
Program 15: Pradhan Mantri Krishi Sinchai Yojana (PMKSY)
Government of India proposes to launch Pradhan Mantri Krishi Sinchan Yojana during 2014-15 of XII
Plan. This programme will be somewhat similar to existing surface Minor Irrigation schemes under AIBP
with two major policy changes. At present, under AIBP, the surface minor irrigation schemes are eligible
for central assistance only in the Special category states, hilly states and undivided Koraput, Bolangir &
Kalahandi (KBK) districts and surface minor irrigation schemes benefitting tribal areas, drought prone
areas, desert development programme (DDP) areas, Left Wing Extremists areas in Non-special category
states. The assistance is in the ratio of 90:10 (centre:state) in ongoing surface minor irrigation schemes.
The new schemes will cover areas not currently being covered and will come into effect from 1.4.2015.
The second change i.e. the funding pattern for the general category states/areas will be limited to 50% of
the total cost of the project. An additional potential of 5 lakh hectare is anticipated in the last two years of
XII Plan. An additional outlay of Rs. 5,000 crore is required for this scheme

INDC- Vulnerability Report 2015
Page 48
Program 16: Flood Management Programme (FMP)
Devastation by floods is a recurrent annual phenomenon in India. Almost every year, some or the other
part of the country is affected by floods. Floods cause enormous damage to life, property-public and
private, and disruptions to infrastructure, besides psychological and emotional instability amongst the
people. Rashtriya Barh Ayog (RBA) had estimated in 1980, total flood-prone area in the country as 40
million hectare (m ha) which was revised further to 45.64 m ha by the Working Group on Flood
Management set up by the Planning Commission for the 11th Five-Year Plan, based upon the information
furnished by the State Governments.
Proper management of floods constitutes an important element in national‘s development activities. In
order to protect human life, land and property from flood fury in the country; the state governments had
been engaged in flood management works for last 5 decades and a total of 18.22 MHA area has been
provided a reasonable degree of protection by the end of 10th Plan.
The Working Group on Water Resources constituted by Planning Commission has set a target to protect an
additional area of 2.18 million hectare during the XI Plan. Government of India has also been assisting the
flood prone states in flood management and anti-erosion works for critical reaches, by providing financial
assistance to the state Governments through a number of centrally sponsored schemes.
In order to provide financial assistance to the State Governments for undertaking flood management works
in critical areas a state sector scheme, namely, ―Flood Management Programme‖ (FMP) was launched by
Ministry of Water Resources under Central Plan, at a total cost of Rs. 8,000 crore. The Government of
India has approved continuation of this Programme during XII Plan with an outlay of Rs. 10,000 crore
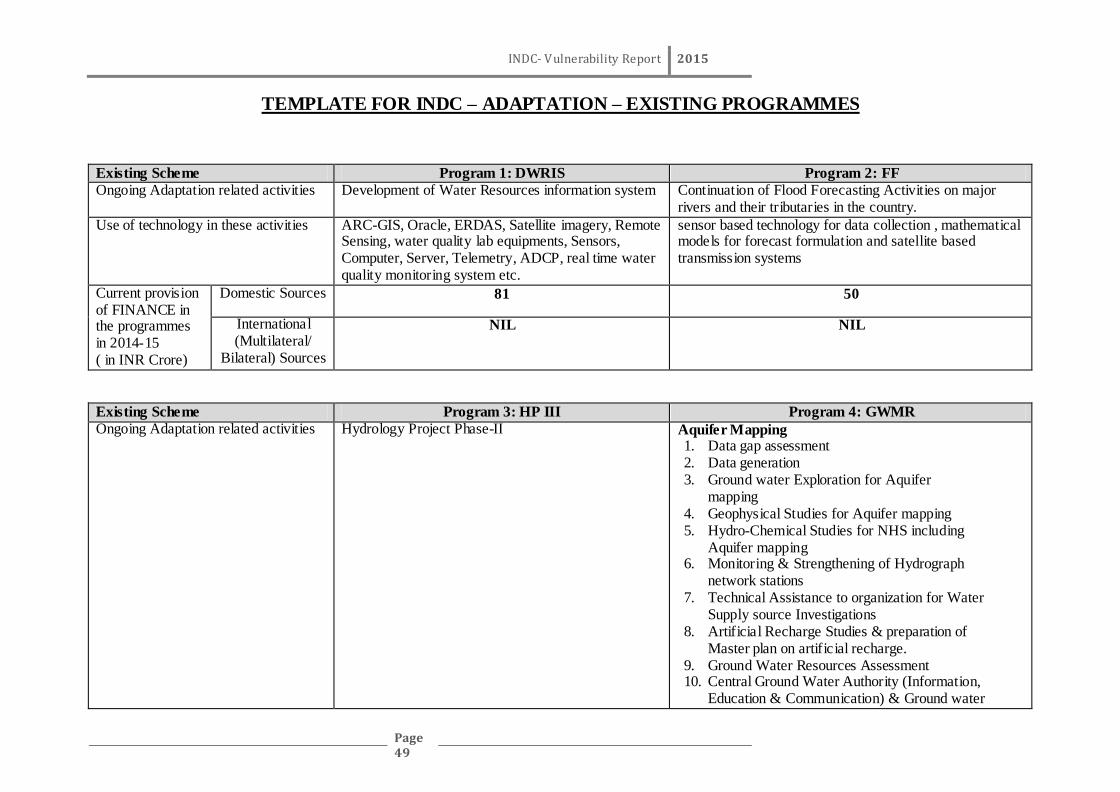
INDC- Vulnerability Report 2015
Page 49
TEMPLATE FOR INDC – ADAPTATION – EXISTING PROGRAMMES
Existing Scheme Program 1: DWRIS Program 2: FF
Ongoing Adaptation related activities Development of Water Resources information system Continuation of Flood Forecasting Activities on major rivers and their tributaries in the country.
Use of technology in these activities ARC-GIS, Oracle, ERDAS, Satellite imagery, Remote Sensing, water quality lab equipments, Sensors, Computer, Server, Telemetry, ADCP, real time water quality monitoring system etc.
sensor based technology for data collection , mathematical models for forecast formulation and satellite based transmission systems
Current provision of FINANCE in the programmes in 2014-15 ( in INR Crore)
Domestic Sources 81 50
International (Multilateral/
Bilateral) Sources
NIL NIL
Existing Scheme Program 3: HP III Program 4: GWMR
Ongoing Adaptation related activities Hydrology Project Phase-II Aquifer Mapping 1. Data gap assessment 2. Data generation 3. Ground water Exploration for Aquifer
mapping 4. Geophysical Studies for Aquifer mapping 5. Hydro-Chemical Studies for NHS including
Aquifer mapping 6. Monitoring & Strengthening of Hydrograph
network stations 7. Technical Assistance to organization for Water
Supply source Investigations 8. Artificial Recharge Studies & preparation of
Master plan on artificial recharge. 9. Ground Water Resources Assessment 10. Central Ground Water Authority (Information,
Education & Communication) & Ground water

INDC- Vulnerability Report 2015
Page 50
Regulation.
Use of technology in these activities Establishment of Real Time Data Acquisition Systems for hydro-meteorological data in respect of surface water, ground water, water quality, meteorological etc., development of web based data storage and analysis software, development of Decision support Systems for flood forecasting, reservoir operations, water resources management etc. for selected river basins/sub-basins etc. in 13 States and 8 Central Organizations.
Geophysical tools and Techniques Transient Electro Magnetic (TEM)
Electrical Resistivity Imaging
Ground Penetration Radar
Multi- channel seismograph
Heliborne TEM and magnetic survey Major Chemical equipments available with CGWB Labs
Atomic Absorption Spectrophotometer
Digital Conductivity meter microprocessor control
Micro-processor based flame photometer with Na ,K (Li) filters compressor and manuals
UV-VIS Spectrophotometer
Gas Chromatograph
Radon Analyser etc Web-based Data Access.
The data and information generated by CGWB is disseminated to the stakeholders through the website of CGWB (GW Data Access) and also available on the India-WRIS website.
NABL Labs.
GIS, Groundwater Modelling Current provision of FINANCE in the programmes in 2014-15 ( in INR Crore)
Domestic Sources 4.55 for central organizations
188
International (Multilateral/
Bilateral) Sources
0.90 for central organizations
NIL
Existing Scheme Program 5: R & D Program 6: HRD/Capacity Building
(CWC) (CGWB)
Ongoing Adaptation related activities The Basic Research, Applied Research and Action Research activities in the field of Water Resources through three Indian National Committees (INCs) viz: on Surface Water, Ground Water and Climate Change. R&D in apex organisations at national level,
Training in relevant technology areas to concerned officers and awareness campaigning
Capacity building of professionals from different organizations. Awareness and capacity building of other

INDC- Vulnerability Report 2015
Page 51
Benchmarking and Upgradation of the Infrastructure and Capacity Building
stakeholders including stakeholders at grassroots level for overall sustainable development of ground water resources. R&D studies related to groundwater
Use of technology in these activities State of art infrastructure, equipment of the apex institutions and their qualified manpower
The training and awareness programs will be scaled up substantially to achieve the target as per requirement
RGI blends traditional classroom tools with modern audio-visuals aids for imparting trainings. Trainings using state-of-the art techniques, tools and software for groundwater studies are important.
Current provision of FINANCE in the programmes in 2014-15 ( in INR Crore)
Domestic Sources 50 20.39 ( Works - 0.50 ; Training-
19.89 )
7
International (Multilateral/
Bilateral) Sources
NIL NIL NIL
Existing Scheme Program 7: RBM Program 8: RMAWBR
Ongoing Adaptation related activities MoWR,RD&GR has formulated a National Perspective Plan (NPP) for Water Resources Development envisaging inter-basin transfer of water from surplus basins to deficit basins/ areas. Based on surveys, investigations and detailed studies, National Water Development Agency (NWDA) has prepared pre-feasibility reports which facilitated identification of 30 links under the NPP. Approximately 35 million hectare of additional irrigation potential and 34000 megawatts (MW) hydro power generation are the
Hydrological data collection and flood forecasting in border areas and survey / investigations

INDC- Vulnerability Report 2015
Page 52
likely benefits envisaged under NPP apart from the incidental benefits of flood moderation, navigation, drinking water supply, fisheries, salinity and pollution control, ground water recharge, drought mitigation etc. The proposals under NPP will be effectively addressing the adverse effects, if any, due to the temporal and spatial variability in the rainfall pattern due to climate change. Programme is being implemented under the guidance of Special Committee on inter linking of rivers under the chairmanship of Hon‘ble Union Minister for Water Resources, River Development & Ganga Rejuvenation. DPRs of the water resources projects are also being prepared to identify the storages of water to have water security and to mitigate the adverse effect, if any, of climate variability. Further, Master plans for the flood management of the Brahamputra basin are also being prepared and updated. Same are being implemented, as per the need, to minimize the losses to the life and property
Use of technology in these activities State of art Technology and methodologies are adopted as per international practices but in Indian context.
State of the art technologies and flood forecasting, survey and investigations
Current provision of FINANCE in the programmes in 2014-15 ( in INR Crore)
Domestic Sources 250 102
International (Multilateral/
Bilateral) Sources
NIL NIL
Existing Scheme Program 9: NWM Program 11: DRIP
Ongoing Adaptation related activities Achieving various strategies outlined for 5 goals of National water Mission: (a) comprehensive water data base in public domain and assessment of impact of climate change on water resource; (b) promotion of citizen and state action for water conservation,
Dam safety and performance

INDC- Vulnerability Report 2015
Page 53
augmentation and preservation; (c) focused attention to vulnerable areas including over-exploited areas; (d) increasing water use efficiency by 20%, and (e) promotion of basin level integrated water resources management.
Use of technology in these activities Geographical Information System, Remote Sensing, Web-GIS, Soil Aquifer Treatment, Arsenic remediation, Desalination
New techniques and innovation at par with the international practices for the rehabilitation of the dams
Current provision of FINANCE in the programmes in 2014-15 ( in INR Crore)
Domestic Sources 40 81
International (Multilateral/
Bilateral) Sources
NIL 326
Existing Scheme Program 12: NMCG Program 14: AIBP
Ongoing Adaptation related activities Creating additional treatment capacity for 11 priority towns;
Implementation of Zero Liquid Discharge (ZLD) for all Grossly Polluting Industries located in 5 basin states of Ganga Basin;
Promoting recycle and reuse of treated wastewater;
Establishment of 113 Real-Time Water Quality Monitoring Stations
Major, Medium and National projects, Extension, Renovation and Modernisation (ERM) of major & medium projects and Flood Management Programme (FMP). Surface minor irrigation (MI), Command Area Development and Water Management (CAD&WM) programme, Repair, Renovation and Restoration (RRR) of water bodies and other proposals of States.
Use of technology in these activities Innovative Treatment Technologies, new technologies to be used in Industries for achieving ZLD; GIS; Spatial Technology; Real-time Water Quality Monitoring; IT technology
Collaboration with specialized institutions Best practice techniques regarding micro-irrigation, water use efficiency, volumetric water measurement, watershed management, conservation & application of water bodies
Current provision of FINANCE in the programmes in 2014-15 ( in INR Crore)
Domestic Sources 2137 3261
International (Multilateral/
Bilateral) Sources
NIL NIL

INDC- Vulnerability Report 2015
Page 54
Existing Scheme Program 15: PMKSY Program 16: FMP
Ongoing Adaptation related activities Scheme was in the mode of preparation Structural measures of flood management
Use of technology in these activities - Existing technologies of planning, investigation, design and construction to continue
Current provision of FINANCE in the programmes in 2014-15 ( in INR Crore)
Domestic Sources 0- 201
International (Multilateral/
Bilateral) Sources
- NIL

INDC- Vulnerability Report 2015
Page 55
TEMPLATE FOR INDC – ADAPTATION MEASURES BY THE YEAR 2020
Proposed Scheme for Adaption Measures by
the year 2020
Program 1: DWRIS Program 2: FF
Assessment of Adaptation measures to be undertaken by the year 2020
Development of Water Resources information system
Continuation of Flood Forecasting Activities on major rivers and their tributaries in the country.
Assessment of TECHNOLOGICAL NEEDS for adaptation Measures by the year 2020 in the programmes
ARC-GIS, Oracle, ERDAS, Satellite imagery, Remote Sensing, water quality lab equipments, Sensors, Computer, Server, Telemetry, ADCP, real time water quality monitoring system etc.
Telemetry, V-SAT, Sensor, Mathematical models for flood forecasting, Computers, Server etc.
Assessment of CAPACITY BUILDING NEEDS for adaptation Measures by the year 2020 in the programmes
International/National training/ Workshop Modernisation, expansion of Flood Forcasting Network of CWC and inundation forecasting needs have been assessed.
Assessment of FINANCE required ( in INR Crore) by the year 2020
Domestic Sources 1500 500 International (Multilateral/ Bilateral) Sources
NIL
1.0 (for international capacity building courses)
Proposed Scheme for Adaption Measures by
the year 2020
Program 3: HPIII Program 4: GWMR
Assessment of Adaptation measures to be undertaken by the year 2020
National Hydrology Project (being proposed)
Aquifer Mapping 1. Data gap assessment 2. Data generation 3. Ground water Exploration for Aquifer
mapping 4. Geophysical Studies for Aquifer mapping 5. Hydro-Chemical Studies for NHS including
Aquifer mapping 6. Monitoring & Strengthening of Hydrograph
network stations 7. Technical Assistance to organization for
Water Supply source Investigations
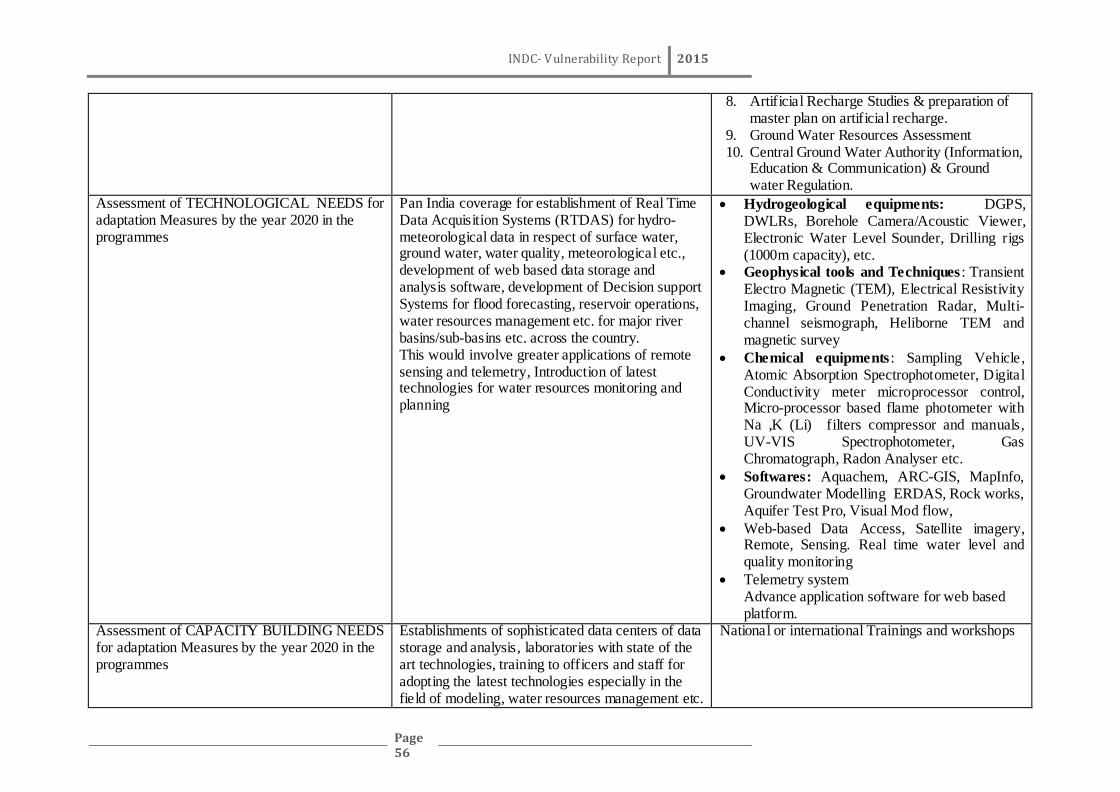
INDC- Vulnerability Report 2015
Page 56
8. Artificial Recharge Studies & preparation of master plan on artificial recharge.
9. Ground Water Resources Assessment 10. Central Ground Water Authority (Information,
Education & Communication) & Ground water Regulation.
Assessment of TECHNOLOGICAL NEEDS for adaptation Measures by the year 2020 in the programmes
Pan India coverage for establishment of Real Time Data Acquisition Systems (RTDAS) for hydro-meteorological data in respect of surface water, ground water, water quality, meteorological etc., development of web based data storage and analysis software, development of Decision support Systems for flood forecasting, reservoir operations, water resources management etc. for major river basins/sub-basins etc. across the country. This would involve greater applications of remote sensing and telemetry, Introduction of latest technologies for water resources monitoring and planning
Hydrogeological equipments: DGPS, DWLRs, Borehole Camera/Acoustic Viewer, Electronic Water Level Sounder, Drilling rigs (1000m capacity), etc.
Geophysical tools and Techniques : Transient Electro Magnetic (TEM), Electrical Resistivity Imaging, Ground Penetration Radar, Multi- channel seismograph, Heliborne TEM and magnetic survey
Chemical equipments : Sampling Vehicle, Atomic Absorption Spectrophotometer, Digital Conductivity meter microprocessor control, Micro-processor based flame photometer with Na ,K (Li) filters compressor and manuals, UV-VIS Spectrophotometer, Gas Chromatograph, Radon Analyser etc.
Softwares: Aquachem, ARC-GIS, MapInfo, Groundwater Modelling ERDAS, Rock works, Aquifer Test Pro, Visual Mod flow,
Web-based Data Access, Satellite imagery, Remote, Sensing. Real time water level and quality monitoring
Telemetry system Advance application software for web based platform.
Assessment of CAPACITY BUILDING NEEDS for adaptation Measures by the year 2020 in the programmes
Establishments of sophisticated data centers of data storage and analysis, laboratories with state of the art technologies, training to officers and staff for adopting the latest technologies especially in the field of modeling, water resources management etc.
National or international Trainings and workshops

INDC- Vulnerability Report 2015
Page 57
Assessment of FINANCE required ( in INR Crore) by the year 2020
Domestic Sources 1820 (upto year 2023)
6100
International (Multilateral/ Bilateral) Sources
1820 (upto year 2023)
50
Proposed Scheme for Adaption Measures by
the year 2020
Program 5: R & D Program 6: HRD / CAPACITY BUILDING
CWC CGWB
Assessment of Adaptation measures to be undertaken by the year 2020
The outcome of the Basic Research, Applied Research and Action Research in the field of Water Resources and Climate Change will be utilised for the Assessment of Adaptation Measures
Organizing in-house workshops/ training programs at the Headquarter and at the various field offices of CWC for subordinate staffs of CWC imparting sufficient training/ skill development on the specific activities carried out by CWC
Developing RGNGWTRI as a Centre of Excellence in Ground Water. Capacity Building of professionals as well as stakeholders to ensure sustainable development of ground water resources.
Assessment of TECHNOLOGICAL NEEDS for adaptation Measures by the year 2020 in the programmes
Up-gradation of the Infrastructure and equipment will be done on the continuous basis as per the need.
Up-gradation & strengthening of NWA with infrastructure facilities, to cater to the training requirement
Advanced tools, instruments and research laboratories are to be set up for Research and Development. Tools like e-learning, distance learning etc. are required to be adopted to improve the outreach
Assessment of CAPACITY BUILDING NEEDS for adaptation Measures by the year 2020 in the programmes
Programme has a component for the Capacity Building on the continuous basis through Seminars, workshops etc.
Up-gradation & strengthening of NWA with additional manpower, to cater to the training requirement of
CGWB, in general and RGNGWTRI in particular require to be strengthened in terms of infrastructure and
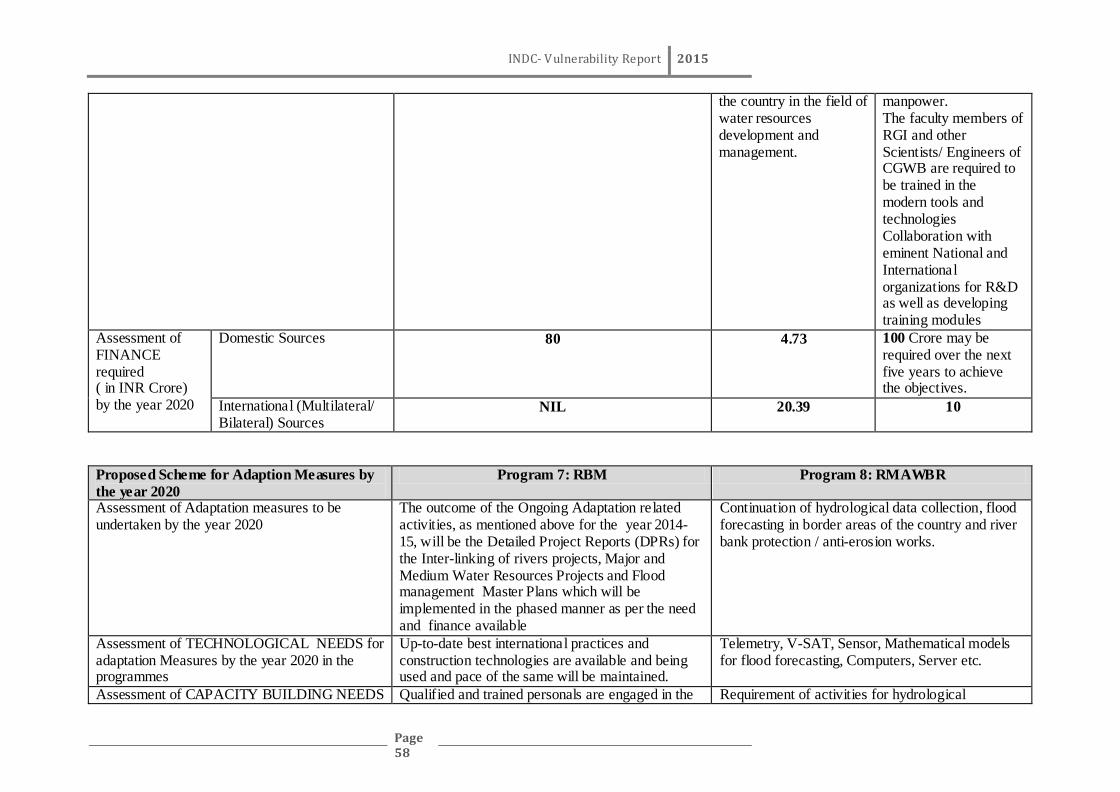
INDC- Vulnerability Report 2015
Page 58
the country in the field of water resources development and management.
manpower. The faculty members of RGI and other Scientists/ Engineers of CGWB are required to be trained in the modern tools and technologies Collaboration with eminent National and International organizations for R&D as well as developing training modules
Assessment of FINANCE required ( in INR Crore) by the year 2020
Domestic Sources 80 4.73 100 Crore may be required over the next five years to achieve the objectives.
International (Multilateral/ Bilateral) Sources
NIL 20.39 10
Proposed Scheme for Adaption Measures by
the year 2020
Program 7: RBM Program 8: RMAWBR
Assessment of Adaptation measures to be undertaken by the year 2020
The outcome of the Ongoing Adaptation related activities, as mentioned above for the year 2014-15, will be the Detailed Project Reports (DPRs) for the Inter-linking of rivers projects, Major and Medium Water Resources Projects and Flood management Master Plans which will be implemented in the phased manner as per the need and finance available
Continuation of hydrological data collection, flood forecasting in border areas of the country and river bank protection / anti-erosion works.
Assessment of TECHNOLOGICAL NEEDS for adaptation Measures by the year 2020 in the programmes
Up-to-date best international practices and construction technologies are available and being used and pace of the same will be maintained.
Telemetry, V-SAT, Sensor, Mathematical models for flood forecasting, Computers, Server etc.
Assessment of CAPACITY BUILDING NEEDS Qualified and trained personals are engaged in the Requirement of activities for hydrological

INDC- Vulnerability Report 2015
Page 59
for adaptation Measures by the year 2020 in the programmes
work and further Capacity Building will be done on the continuous basis for which Ministry have a separate progamme
observations flood forecasting and survey & investigations including equity to be provided to Pancheshwar Development Authority and grant-in- aid to States / UTs for flood management / anti-sea erosion works has been assessed
Assessment of FINANCE required ( in INR Crore) by the year 2020
Domestic Sources 2000 12200
International (Multilateral/ Bilateral) Sources
NIL 2.50 (for international capacity building courses)
Proposed Scheme for Adaption Measures by
the year 2020
Program 9: NWM Program 11: DRIP
Assessment of Adaptation measures to be undertaken by the year 2020
National water mission to work towards integration of various schemes of departments dealing with water sector for better management. State Specific Action Plan for water sector; water network of experts
Monitoring and evaluation reports on DRIP dams
Assessment of TECHNOLOGICAL NEEDS for adaptation Measures by the year 2020 in the programmes
Collaboration with specialized institutions dealing in Integrated Water Resource management, State of the art interventions for recycle and reuse of waste water
Collaboration with specialized institutions for rehabilitation, arresting silt, erosion, leakages, stability of structure.
Assessment of CAPACITY BUILDING NEEDS for adaptation Measures by the year 2020 in the programmes
Training of water resources engineers, scientists and govt. professionals in Integrated Water Resource Management, water conservation, best international practices for efficient use of water
Training programmes for officers to map the same and integration with the dam safety programmes, instrumentation, hydrological, re-assessment techniques.
Assessment of FINANCE required ( in INR Crore) by the year 2020
Domestic Sources 300 338
International (Multilateral/ Bilateral) Sources
10 1355

INDC- Vulnerability Report 2015
Page 60
Proposed Scheme for Adaption Measures by
the year 2020
Program 12: NMCG Program 14: AIBP
Assessment of Adaptation measures to be undertaken by the year 2020
Creating additional treatment capacity for 118 priority towns in 5 Basin States;
Mandatory recycle and reuse of treated wastewater;
ZLD to be introduced in 11 basin states of Ganga Basin;
Solar panels to be installed on ghats
Model dhobhi ghats – reduction in water consumption
Trash skimming from river and trash to cash for waste collected from the river
Remote monitoring of pollution from industries and municipalities; Web-based monitoring of industrial pollution and STP performance
Afforestation programme to plant medicinal plants and native species along Ganga basin
Major, Medium and National projects, Extension, Renovation and Modernisation (ERM) of major & medium projects would be covered under this component. The CAD&WM projects with AIBP projects which are to be implemented pari passu would be completed under PMKSY-WR.
Assessment of TECHNOLOGICAL NEEDS for adaptation Measures by the year 2020 in the programmes
Waste to energy conversion; Trash skimmer; Recycle and Reuse of wastewater; advanced probes and sensors to monitor water quality and transmit data in real-time; water quality monitoring using spatial technology
Collaboration with specialized institutions.
Assessment of CAPACITY BUILDING NEEDS for adaptation Measures by the year 2020 in the programmes
Training of Urban Local Bodies/local Executing Agency to operate and maintain advanced technologies for treatment; Workshop to recycle and reuse recycled wastewater
Improvement of infrastructural capacity and training of Governmental and Non –Governmental stakeholders requires Rs.100 Crores in next 5 years. Training of policy/ decision makers under program like IWMP may be incorporated.
Assessment of FINANCE required ( in INR Crore) by the year 2020
Domestic Sources 20,000 11060 (Creation of 13 lakh hectares of irrigation potential through on-going projects and pari-passu coverage of command areas of 13 lakh hectares)
International (Multilateral/ Bilateral) Sources
NIL NIL

INDC- Vulnerability Report 2015
Page 61
Proposed Scheme for Adaption Measures by
the year 2020
Program 15: PMKSY Program 16: FMP
Assessment of Adaptation measures to be undertaken by the year 2020
Surface minor irrigation (MI), Command Area Development and Water Management (CAD&WM) programme, Repair, Renovation and Restoration (RRR) of water bodies and other proposals of States including ground water irrigation etc. would be the major components. District and State irrigation plans would be made in the SMI, CAD&WM and RRR will continue.
River management, anti-erosion, flood management, anti-sea erosion measures
Assessment of TECHNOLOGICAL NEEDS for adaptation Measures by the year 2020 in the programmes
Best practice techniques regarding micro-irrigation, water use efficiency, volumetric water measurement, watershed management, conservation & application of water bodies and ground water, crop adaptation techniques.
Existing technologies of planning, investigation, design and construction to continue
Assessment of CAPACITY BUILDING NEEDS for adaptation Measures by the year 2020 in the programmes
Capacity building through Water User Associations and Panchayati Raj Institutions for best practice techniques regarding micro-irrigation, water use efficiency, volumetric water measurement, watershed management, conservation & application of water bodies and ground water, crop adaptation techniques. Improvement of infrastructural facilities and training of members of WUAs needs 150 Crores in next 5 years.
The needs have been assessed on the basis of projects envisaging construction of structural measures submitted by States for techno-economic appraisal.
Assessment of FINANCE required ( in INR Crore) by the year 2020
Domestic Sources 9050 (Coverage of command areas of 20 lakh hectares under CADWM programme. 3.0 lakh ha of irrigation potential is to be created through RRR of water bodies and 3.0 lakh ha of irrigation potential through ground water)
16000
International (Multilateral/ Bilateral) Sources
NIL 1 (for capacity building programmes in best design
methodologies and use of modern geo-textile materials)

INDC- Vulnerability Report 2015
Page 62
TEMPLATE FOR INDC – ADAPTATION MEASURES BETWEEN 2020-2030
Proposed Programmes for Adaption
Measures between 2020-2030 Program 1: DWRIS Program 2: FF
Assessment of Adaptation measures to be undertaken between 2020-2030
Development of Water Resources information system
Continuation of Flood Forecasting Services and Expansion of Flood Forecasting Network to cover Class-A, B and C Cities and other important places in the country, preparation of Digital Elevation Models for 30 mha of flood affected area.
Assessment of TECHNOLOGICAL NEEDS for adaptation Measures between 2020-2030 in the programmes
ARC-GIS, Oracle, ERDAS, Satellite imagery, Remote Sensing, water quality lab equipments, Sensors, Computer, Server, Telemetry, ADCP, real time water quality monitoring system etc.
Modernisation, expansion of Flood Forcasting Network of CWC and inundation forecasting needs have been assessed.
Assessment of CAPACITY BUILDING NEEDS for adaptation Measures between year 2020-2030 in the programmes
International/National training/ Workshop Need for capacity building programmes in the areas of global state-of-the-art technologies of flood forecasting, data transmission and inundation forecasting have been identified.
Assessment of FINANCE required ( in INR Crore) between 2020- 2030
Domestic Sources 3000 2000 ( includes flood forecasting services, modernization & expansion of network, DEMs for about 30 MHA
and inundation forecast models )
International (Multilateral/ Bilateral) Sources
NIL
NIL
Proposed Programmes for Adaption
Measures between 2020-2030 Program 3: HP III Program 4: GWMR
Assessment of Adaptation measures to be undertaken between 2020-2030
National Hydrology Project (contd.) Prioritizing areas for mapping aquifers below 300 and 500 metres below ground level.
Microlevel hydrogeological studies covering an area of about 5 lakh sq km area including Overcome, critical and poor water quality areas.
Implementation of Aquifer Management Plan

INDC- Vulnerability Report 2015
Page 63
(AMP) in phased manner envisaging activities related to ground water management such as artificial recharge, water conservation, enhancing water use efficiency, conjunctive use, etc.
Ground water management involving grass root level user through participatory ground water management (PGWM).
Impact assessment of Ground water management schemes through real time water level, quality and other relevant parameters.
Disaster management system may be developed.
Assessment of TECHNOLOGICAL NEEDS for adaptation Measures between 2020-2030 in the programmes
Integrated Water resources Management (IWRM) in most of the river basins in the country. This would involve extensive work related to strengthening of RTDAS, development of DSS for water resources assessment, conservation, planning and management, cloud computing for water resources modeling, minimum flow estimation (ecological flow), base flow computation, allocation of water resources to various sectors, identification of alternate sources of irrigation for e.g. assessment of ground water resources in deeper aquifers of Ganga and Brahmaputra Basins, etc.
Real time water level and quality monitoring
Telemetry system
Advance application software for web based platform.
Assessment of CAPACITY BUILDING NEEDS for adaptation Measures between year 2020-2030 in the programmes
Technical skills up-gradation of all stakeholders in the water resources management in the river basin.
National or international Trainings and workshops
Assessment of FINANCE required ( in INR Crore) between 2020- 2030
Domestic Sources 10000 10000 International (Multilateral/ Bilateral) Sources
10000
100

INDC- Vulnerability Report 2015
Page 64
Proposed Programmes for Adaption Measures
between 2020-2030 Program 5: R & D Program 6: HRD/ CAPACITY BUILDING
CWC CGWB Assessment of Adaptation measures to be undertaken between 2020-2030
Appropriate Adaptation Measures based on the outcome of the various studies and the research etc. will be taken up as per the need
Capacity Building of all Stakeholders will be continued with the focus on emerging areas and vital issues pertaining to Water Resources Development and Management.
RGNGWTRI will pursue its goal to develop and remain as a Centre of Excellence in training and research in ground water. It will continue its effort for R&D and capacity building to ensure clean and sustainable ground water resources
Assessment of TECHNOLOGICAL NEEDS for adaptation Measures between 2020-2030 in the programmes
Upgradation of the Infrastructure and equipment will be done on the continuous basis as per the need
Up-gradation & strengthening of NWA with infrastructure facilities, to cater to the training requirement
Upgrading the research facilities as per the global standards/ needs with particular focus on a) Ground water use efficiency, b) Aquifer Remediation and c) Climate change.
Assessment of CAPACITY BUILDING NEEDS for adaptation Measures between year 2020-2030 in the programmes
Programme has a component for the Capacity Building on the continuous basis through Seminars, workshops etc
Linkages will be developed with the National and International Organisation and also with other Ministries towards the Synergization efforts in Capacity Building in WRDM.
CGWB, in general and RGNGWTRI in particular require to be strengthened in terms of infrastructure and manpower to deal with the proposed. The faculty members of RGI and other Scientists/Engineers of CGWB are required to be trained in the modern tools and technologies.

INDC- Vulnerability Report 2015
Page 65
Assessment of FINANCE required ( in INR Crore) between 2020- 2030
Domestic Sources 1000 71.40 (Works: 1.10; Trg:
70.30)
Nearly 200 Crore.
International (Multilateral/ Bilateral) Sources
NIL NIL 20
Proposed Programmes for Adaption
Measures between 2020-2030 Program 7: RBM Program 8: RMAWBR
Assessment of Adaptation measures to be undertaken between 2020-2030
The outcome of the Ongoing Adaptation related activities, as mentioned above will be the Detailed Project Reports (DPRs) for the Ken-Betwa (Phase-I & Phase-II) link and Damanganga – Pinjal link under Inter-linking of rivers projects will be continued to be implemented.
Continuation of existing HO / FF activities in border areas and river bank protection / anti-erosion works on common border rivers , Joint construction of Panceshwar Multi[purpose Project and Sapta Kosi High Dam
Assessment of TECHNOLOGICAL NEEDS for adaptation Measures between 2020-2030 in the programmes
Up-to-date best international practices and construction technologies are available and being used and pace of the same will be maintained.
Requirement of activities for hydrological observations flood forecasting and survey & investigations including equity to be provided to Pancheshwar Development Authority and grant-in- aid to States / UTs for flood management / anti-sea erosion works has been assessed
Assessment of CAPACITY BUILDING NEEDS for adaptation Measures between year 2020-2030 in the programmes
Qualified and trained personals are engaged in the work and further Capacity Building will be done on the continuous basis for which Ministry have a separate progamme.
Needs of required capacity building programmes have been assessed.
Assessment of FINANCE required ( in INR Crore) between 2020- 2030
Domestic Sources 15000 54000 (includes requirement of equity for Pancheshwar
and Sapta Kosi High Dam Projects)
International (Multilateral/ Bilateral) Sources
5000 NIL

INDC- Vulnerability Report 2015
Page 66
Proposed Programmes for Adaption
Measures between 2020-2030 Program 9: NWM Program 11: DRIP
Assessment of Adaptation measures to be undertaken between 2020-2030
National water mission to work towards integration of various schemes of departments dealing with water sector for better management. State Specific Action Plan for water sector; water network of experts
The current ongoing DRIP is scheduled to complete by June 2018. Possibility of taking up the next Dam Rehabilitation Program with World Bank assistance will be explored in discussion with World Bank by June 2017.
Assessment of TECHNOLOGICAL NEEDS for adaptation Measures between 2020-2030 in the programmes
Collaboration with specialized institutions dealing in Integrated Water Resource management, State of the art interventions for recycle and reuse of waste water. Develop appropriate indicators to assess the success/failure of various water sector projects. State of the art technology to disseminate knowledge down to the farmer.
Collaboration with specialized institutions for rehabilitation, arresting silt, erosion, leakages, stability of structure. Possibility of increasing spillway capacities through State govt. Hydrological re-assessments and dam safety instrumentation.
Assessment of CAPACITY BUILDING NEEDS for adaptation Measures between year 2020-2030 in the programmes
Training of water resources engineers, scientists and govt. professionals in Integrated Water Resource Management, water conservation, best international practices for efficient use of water
Training programmes for officers to map the same and integration with the dam safety programmes, instrumentation, hydrological, re-assessment techniques.
Assessment of FINANCE required ( in INR Crore) between 2020- 2030
Domestic Sources 500 5200
International (Multilateral/ Bilateral) Sources
25 20800
Proposed Programmes for Adaption
Measures between 2020-2030 Program 12: NMCG Program 14: AIBP
Assessment of Adaptation measures to be undertaken between 2020-2030
Creating additional treatment capacity for Class I & II towns in all 11 basin States
Complete sanitation coverage for 1657 Gram Panchayats using biotoilets
Biogas plants to be installed for electricity generation –using bio gas generated in septic tanks, and treatment plants
Waste to energy conversion
Major, Medium and National projects, Extension, Renovation and Modernisation (ERM) of major & medium projects and Flood Management Programme (FMP) projects would be covered under this component. The CAD&WM projects with AIBP projects which are to be implemented pari passu would be completed under PMKSY-WR.

INDC- Vulnerability Report 2015
Page 67
Utilization of biogas from anaerobic treatment to be mandatory
Organic farming to be mandatory for all villages along Ganga river
Sludge to compost conversion to be mandatory
GIS based decision support system with all details of Ganga with possibility of analysis, project and evaluating scenarios
Assessment of TECHNOLOGICAL NEEDS for adaptation Measures between 2020-2030 in the programmes
Innovative treatment technologies, Biotiolets, waste to energy technology, organic fertilizers and pesticides, GIS, IT, and other technology that reduce consumption of water (and hence generation of wastewater) & promote recycling of treated wastewater
Collaboration with specialized institutions.
Assessment of CAPACITY BUILDING NEEDS for adaptation Measures between year 2020-2030 in the programmes
Production of organic fertilizers and pesticides, Workshop to operate decision support system, etc
Improvement of infrastructural capacity and training of Governmental and Non–Governmental stakeholders requires Rs.200 Crores in 10 years. Training of policy/ decision makers under program like IWMP may be incorporated.
Assessment of FINANCE required ( in INR Crore) between 2020- 2030
Domestic Sources 74,000 (as per estimate provided by IIT Consortium)
20 lakh [For achieving the target of 1120 BCM of storages (430 BCM ground water and 690 BCM surface water), storages of 414 BCM is already created/under execution/under planning. Storages for 400 BCM (including 124 BCM of storage projects already taken up by 2020 for planning/execution) is to be planned and executed]
International (Multilateral/ Bilateral) Sources
NIL NIL
Proposed Programmes for Adaption
Measures between 2020-2030 Program 15: PMKSY Program 16: FMP
Assessment of Adaptation measures to be undertaken between 2020-2030
Surface minor irrigation (MI), Command Area Development and Water Management (CAD&WM) programme, Repair, Renovation and
River management, anti-erosion, flood management, anti-sea erosion measures( Providing reasonable degree of protection in remaining 30

INDC- Vulnerability Report 2015
Page 68
Restoration (RRR) of water bodies and other proposals of States including ground water irrigation etc. would be the major components. District and State irrigation plans would be made in the SMI, CAD&WM and RRR will continue.
MHA of flood affected area)
Assessment of TECHNOLOGICAL NEEDS for adaptation Measures between 2020-2030 in the programmes
Best practice techniques regarding micro-irrigation, water use efficiency, volumetric water measurement, watershed management, conservation & application of water bodies and ground water, crop adaptation techniques.
Existing technologies to continue with introduction of new geo-textile materials
Assessment of CAPACITY BUILDING NEEDS for adaptation Measures between year 2020-2030 in the programmes
Capacity building through Water User Associations and Panchayati Raj Institutions for best practice techniques regarding micro-irrigation, water use efficiency, volumetric water measurement, watershed management, conservation & application of water bodies and ground water, crop adaptation techniques. Improvement of infrastructural facilities and training of members of WUAs needs 3000 Crores in 10 years.
Capacity building programmes to Central / State Officers
Assessment of FINANCE required ( in INR Crore) between 2020- 2030
Domestic Sources 0.85 lakh (Coverage of command areas of 266 lakh hectares under CADWM programme (gap of 220 lakh ha and 46 lakh of remaining works of MMI projects). 48 lakh ha of irrigation potential is to be created through RRR of water bodies)
3,00,000 (Required for providing reasonable protection in about 30 MHA of flood affected area by way construction of embankments, strengthening of embankments, anti-erosion works, river from development works etc. Assessment has been made on the analogy of requirement assessed by XII Plan Working Group for protection in 6.0 MHA of flood affected area). This is subject to decision of Government of India on extent of central assistance to be provided for flood management works.)
International (Multilateral/ Bilateral) Sources
NIL NIL

INDC- Vulnerability Report 2015
Page 69
ANNEXURE 1: Potential impacts on water sector - IPCC
Fresh Water Resources -
Fresh water related risks of climate change increase significantly with increasing GHG (green house effect)
emissions. Climate change is projected to reduce renewable surface water & groundwater resources
significantly in most dry subtropical regions. This will exacerbate competition for water among agriculture,
industry & energy production, affecting regional water, energy & food security. In global analysis of
simulated stream flows, about one third of the top 200 rivers including the Ganges also, showed significant
trends in discharge: 45 recorded decreasing & only 19 recorded increasing discharge.
Ground water Resources -
Detection of change in ground water systems& attribution of those changes to climate change is rare owing to
lack of appropriate observation wells & a small number of studies. Heavy rainfall is likely to become more
intense & frequent during the 21st century in many part of the world, which may lead to more intense soil
erosion even if the total rainfall does not increase. In a major headwater basin of the Ganges river, increased
precipitation & glacier runoff are projected to increase sediment yield by 26% by 2050. Due to greater
variability of precipitation the seasonal reductions of water supply due to reduced snow & ice storage.
Availability of clean water can also be reduced by negative impacts of climate change on water quality, for
instance, the quality of lakes used for water supply could be impaired by the presence of algae-producing
toxins.
Water uses in field of Agriculture -
Water demand & use for food & livestock feed production is governed not only by crop management & its
efficiency but also by the balance between atmospheric moisture deficit & soil water supply.
Thus, changes in climate (precipitation, temperature, radiation) will affect the water demand of crops grown in
both irrigated & rain fed systems. Major irrigated areas in India might experience a slight decrease in
irrigation – demand, due for example to higher precipitation but only under some climate scenarios.
Energy Production –
Hydroelectric and thermal power plants, and the irrigation of bio-energy crops, require large amounts of
water. Climate change affects hydropower generation through changes in the mean annual stream flow, shifts
of seasonal flows, and increases of stream flow variability (including floods and droughts), as well as by
increased evaporation from reservoirs and changes in sediment fluxes. Therefore, the impact of climate
change on a specific hydropower plant will depend on the local change of these hydrological characteristics,
as well as on the type of hydropower plant and on the (seasonal) energy demand, which will itself be affected
by climate change.
Municipal Services –
Climate change also impacts water quality indirectly. For instance, at present many cities rely on water from
forested catchments that requires very little treatment. Many drinking water treatment plants—especially
small ones—are not designed to handle the more extreme influent variations that are to be expected under
climate change. These demand additional or even different infrastructure capable of operating for up to
several months per year, which renders wastewater treatment very costly, notably in rural areas.