Embed Size (px)
Citation preview

1 | P a g e
Executive Summary
With the French elections out of the way and no wild kneejerk reaction in the Futures we can do our analyses as if
nothing happened. That makes our life a lot easier
The S&P500 has failed numerous times to break below SPX2378 without making any new highs first all week last
week, and rallied strongly on Friday above SPX2398. Hence, we continue to look up and expect SPX2407-2417.
There’s a more bullish setup/potential in the charts and over SPX2420 is the first sign of SPX2480-2490 next,
whereas over SPX2431 will confirm. All charts (from daily to weekly for several indices as well as breadth-
indicators ) we analyzed have a distinct bullish character to them and all charts and their respective TIs point to
higher prices in the coming days and weeks. All tell us to stay long. In fact, none of the charts is yet setup to
suggest a larger (>50p decline) soon. That doesn’t mean it can’t happen, but the charts simple don’t favor those
odds and that’s what we have to go buy.
2 | P a g e
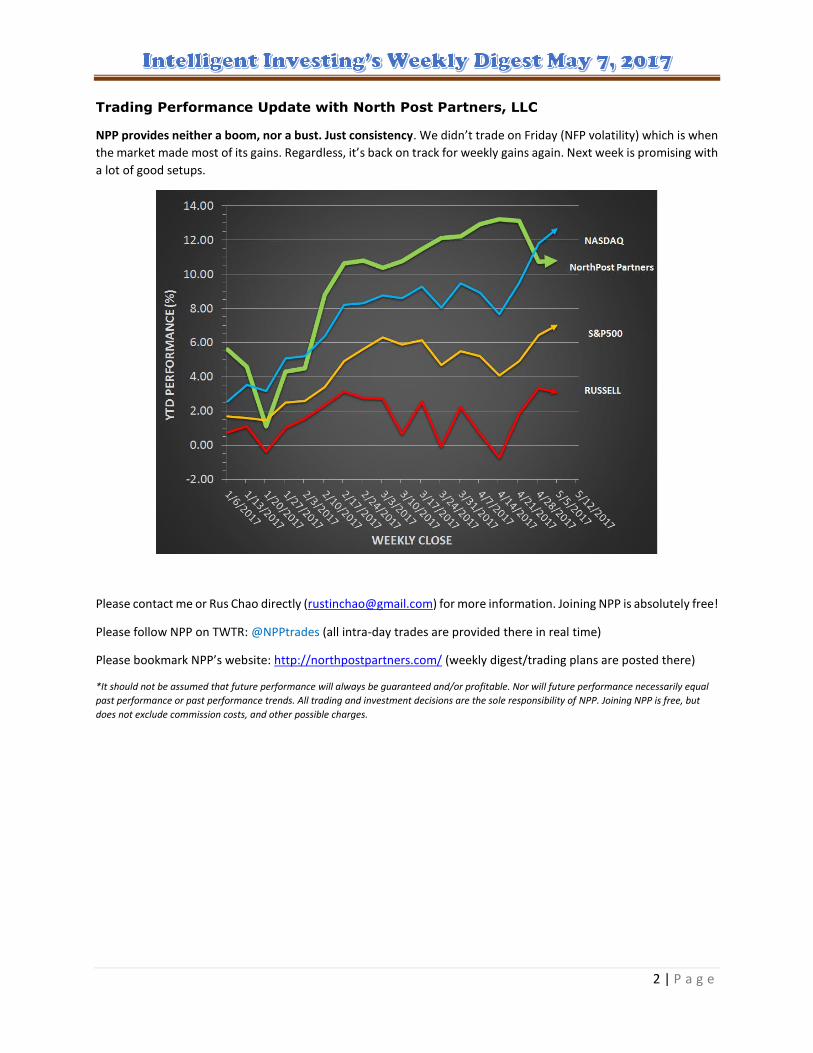
Trading Performance Update with North Post Partners, LLC
NPP provides neither a boom, nor a bust. Just consistency. We didn’t trade on Friday (NFP volatility) which is when
the market made most of its gains. Regardless, it’s back on track for weekly gains again. Next week is promising with
a lot of good setups.
Please contact me or Rus Chao directly ([email protected]) for more information. Joining NPP is absolutely free!
Please follow NPP on TWTR: @NPPtrades (all intra-day trades are provided there in real time)
Please bookmark NPP’s website: http://northpostpartners.com/ (weekly digest/trading plans are posted there)
*It should not be assumed that future performance will always be guaranteed and/or profitable. Nor will future performance necessarily equal
past performance or past performance trends. All trading and investment decisions are the sole responsibility of NPP. Joining NPP is free, but
does not exclude commission costs, and other possible charges.

3 | P a g e
Elliot wave updates
With the 2nd weekly higher closing high, our preferred count is shown below. Wave-v of 1 or b should be underway
to SPX2407-2417. A break above SPX2420 will be a first sign a much more bullish scenario is in play (see Figure 4 RUT
count) and a break above SPX2431 will entirely confirm that the S&P500 is on its way to SPX2480-2490 for major 3.
We show the DOW’s hourly as a reminder that the DOW made a lower low, whereas the SPX didn’t and as such we
may have failed flat intermediate-iv.
We need to see a break below SPX2380 as a first step of see a more bearish scenario developing, to be followed by
a break below SPX2370. Until then, and as we mentioned throughout the week, now that SPX2398 has been
exceeded the SPX2407-2417 target zone is next. We must say that the daily chart’s and TIs are not yet setup for a
large decline and all want to see higher prices first (see figure 2-4), some of which are setup to suggest SPX2431
will be broken.
Figure 1. SPX and DOW 60min charts.

4 | P a g e
Technical Market update
This Friday was the first green Friday for the S&P500 since March 10. Useless statistic? Maybe, but the close was on
the highs and back above the upper black trend line. Price remains above the 50d and 20d SMA, which are both
pointing up. The Money Flow Index is now confirming the higher prices, and all TIs including the A.I. now remain on
a buy/long signal. The Bollinger bands are expanding and the upper band is following price: higher. Hence, the daily
chart is now much more bullish then it was a week ago. It supports higher prices in the days ahead and we simple
see no setup that forebodes a rapid decline. Lastly, the larger negative divergences are eroding for each day that
passes and as such we’ll not focus on them. Instead we’ll focus on the (grey) bull flag that targets SPX2440-2450.
Figure 2. SPX daily chart. Changed from questionable to bullish.

5 | P a g e
The S&P500’s weekly chart’s A.I. “non-ideal buy signal” from last week continued with a higher close the past week,
despite the fact the entire rally came on Friday. The RSI5 and MACD continue to point up, but still no MACD buy
signal. Last week’s bearish weekly candle (wig equal to the body (14p vs 14p)) was negated this week: that’s the
thing with candles: they need follow through/conformation. Support is at the 20w SMA: SPX2330. The weekly SMAs
continue to bullishly align: all are pointing up and all are bullishly stacked (20>50>100>150>200).
Figure 3. SPX weekly TI chart. TIs remain pointing up, with a confirmed non-ideal A.I. buy: bullish chart.

6 | P a g e
We wanted to point out the NYA and RUT daily charts as the former had a very nice solid candle on Friday, with TIs
that –similarly- to the SPX are all looking bullish. The latter chart shows the possible 1,2,i,ii set up we showed last
week, and price held the 20d, 50d and 200d SMA nicely on Friday. The MACD on the NYA is starting to provide a nice
“hook set up”: looks ready to launch higher. With the expanding Bollinger band setup on this chart this may very
well happen. All in all, these charts confirm the bullish set up on the S&P500 daily and weekly charts.
Figure 4. NYA and RUT daily TI charts. TIs starting to point back up, non-ideal A.I. buy, but no MACD buy signal yet.

7 | P a g e
Market breadth
The McClellan Oscillator for S&P500 (SPX-MO) ended the week at +25, gaining 22p. As such the SPX-SI (summation
index of the SPX-MO) remains on a buy/long. That’s all we really need to know: the chart signals buy/long, then
buy/long it is.
Figure 5. SPX-MO remains positive and as such the SPX-SI remains on buy. That’s all there is to it.

8 | P a g e
In addition to the SPX-SI continued buy/long signal, the NYAD (advancing/declining issues) made another new closing
high last week, continuing to tell that higher prices should be expected in the coming weeks. Not until we see
negative divergence should we become more cautious.
Figure 6. NYAD: new weekly highs.

9 | P a g e
Miscellaneous
Our long-term Simple Moving Averages only chart (LT-SMA, for trend followers and long term investing) continues
to be 100% bullish. It’s telling long term investors to stay long and strong. As such this chart also continues to support
our overall view of the market and where it will head over the next several months: higher. Our short term chart
(ST-SMA, for traders to swing traders) improved last week and is now 85% bullish. Also this chart tells traders to now
remain long and strong. That’s all there is to it.
Figure 7. LT-SMA chart 100% bullish ST-SMA chart 85% Bullish.
Below is how a 100% bullish chart look likes, everything points up. Price > fastest SMAs > slowest SMAs.
The “Ebola scare” correction
in 2014 didn’t even register
on the LT chart!
Copyright Intelligent Investing. May not be distributed
without permission. www.investingintelligent.com
Copyright Intelligent Investing. May not be distributed
without permission. www.investingintelligent.com

10 | P a g e
Fib-based Trading Interval Turn dates & Bradley Turn Dates for 2017
Our next turn date is not until the end of May and last week’s (May 2nd +/- 3 trading days) likely signaled the past
week’s low. Hence late-May could signal a high. There’s a Bradley turn date June 9 as well.
January 18 (50/100 Long Terms Power)
January 30 (55/100 Middle Terms Power)
March 20 (100/100 Long Terms Power)
April 3 (31/100 Declinations Power)
April 17 (19/100 Bradley Siderograph Power)
April 19 (59/100 Middle Terms Power)
April 29 (19/100 Bradley Siderograph Power
May 5 (30/100 Declinations Power)
June 9 (61/100 Long Terms Power)
June 21 (100/100 Bradley Siderograph Power)
June 30 (100/100 Declinations Power)
July 4 (100/100 Middle Terms Power)
August 19 (17/100 Bradley Siderograph Power)
September 5 (17/100 Declinations Power)
September 7 (29/100 Bradley Siderograph Power)
October 7 (48/100 Middle Terms Power)
December 3 (23/100 Bradley Siderograph Power)
December 6 (100/100 Long Terms Power)

11 | P a g e
ALOHA
Soul, Ph.D.
©2017, Intelligent Investing. This copyrighted weekly periodical is published on non-stock market trading weekend
days by Intelligent Investing, and is intended solely for use by designated recipients. No reproduction, retransmission,
or other use of the information or images is authorized. Legitimate news media may quote representative passages,
in context and with full attribution, for the purpose of reporting on our opinions.
Analysis is derived from data believed to be accurate, but such accuracy or completeness cannot be guaranteed. It
should not be assumed that such analysis, past or future, will be profitable or will equal past performance or
guarantee future performance or trends. All trading and investment decisions are the sole responsibility of the reader.
Inclusion of information about managed accounts, program positions and other information is not intended as any
type of recommendation, nor solicitation.
For more information, contact intelligent investing at [email protected]. We reserve the right to refuse
service to anyone for any reason.