Embed Size (px)
Citation preview
Intelligent Approach to Determine the Type of Objects with Low
Effective Reflective Surface, Built with Stealth Technology
M.KOSTOVA
1, V. DJUROV
2
Department of Algebra and Geometry1 , Department of Theoretical Electrical Engineering 2
University of Rousse “Angel Kunchev”,
8 Studentska Str.,7017 – Rousse,
BULGARIA
[email protected] 1 [email protected] 2
Abstract: A system with a module for statistical processing and a module based on fuzzy logic is developed to
analyse the scattering field of complex objects with low effective reflectivity, built with Stealth technology.
One of the tasks of the system is to determine the type of surface of the observed object (plane В2) by
analyzing emulative data obtained under certain laboratory conditions and parameters of probed signal. Data is
manipulated for statistical processing, where every angle of azimuth, at a fixed angle position corresponds to a
certain level of signal within the field of dispersion.
Key Words: emulative data, amplitude, cubic spline, fuzzy logic, effective reflective surface, smooth and
double-reflective surfaces.
1. Introduction The main objective of radiolocation is to determine
the type of the observed object. This can be
achieved by analyzing the effective reflective
surface (ERS) and also by restoring the image of the
objective [3]. The great variety of objects according
to ERS poses challenges for professionals working
in this area. These challenges are greater in objects
with low effective reflectivity due to the use of
composite materials and technology, causing
emergence of new physical properties and
phenomena [4].
The application of “intelligent” modeling
increases the efficiency of modern radiolocation [7].
The current available data sources show, that the use
of an intelligent approach to modeling is primarily
for processing of radiolocation data from objects
with high radiolocation visibility. Using various
forms of artificial intelligence in separate modules
of radiolocation stations increases its efficiency and
defense from cyber attacks [2].
2. Problem Formulation To analyze the scattering field of complex objects a
mathematical model and software application
system is developed to determine the type of
concrete object of Stealth technology – plane В2, by
using emulative data from the characteristics of the
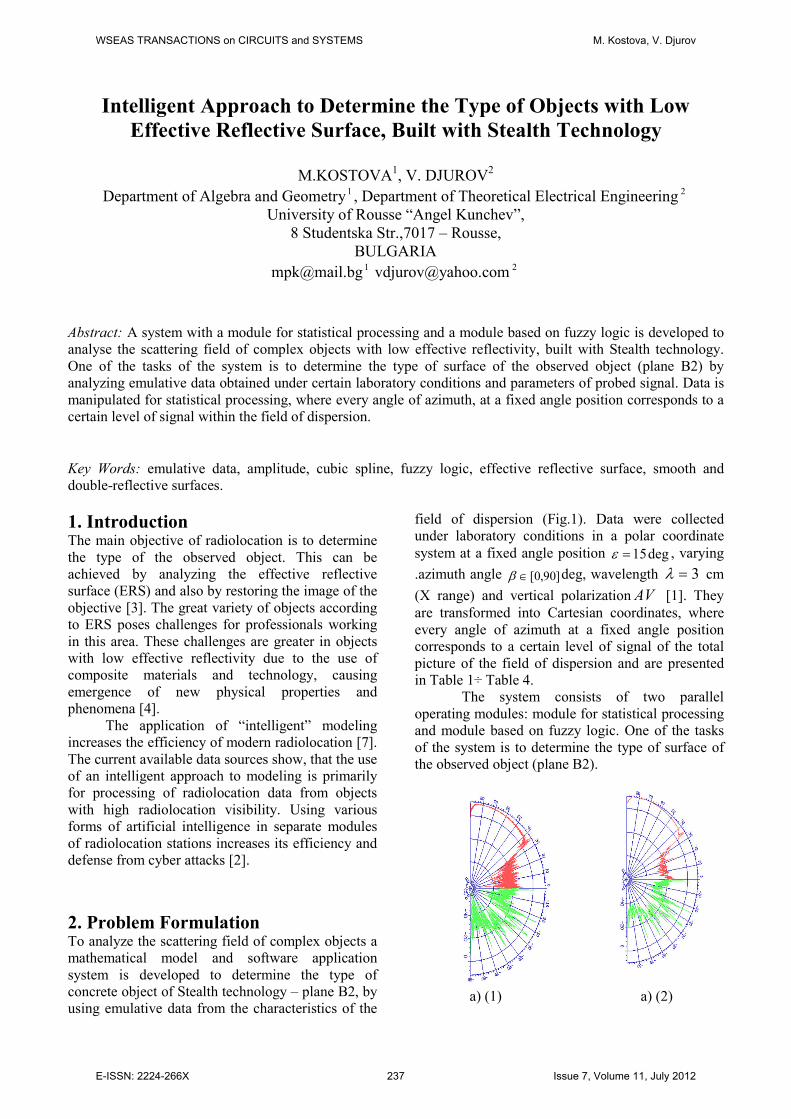
field of dispersion (Fig.1). Data were collected
under laboratory conditions in a polar coordinate
system at a fixed angle position deg15=ε , varying
.azimuth angle β ]90,0[∈ deg, wavelength 3=λ cm
(Х range) and vertical polarization AV [1]. They
are transformed into Cartesian coordinates, where
every angle of azimuth at a fixed angle position
corresponds to a certain level of signal of the total
picture of the field of dispersion and are presented
in Table 1÷ Table 4. The system consists of two parallel
operating modules: module for statistical processing
and module based on fuzzy logic. One of the tasks
of the system is to determine the type of surface of
the observed object (plane В2).
а) (1) а) (2)
WSEAS TRANSACTIONS on CIRCUITS and SYSTEMS M. Kostova, V. Djurov
E-ISSN: 2224-266X 237 Issue 7, Volume 11, July 2012
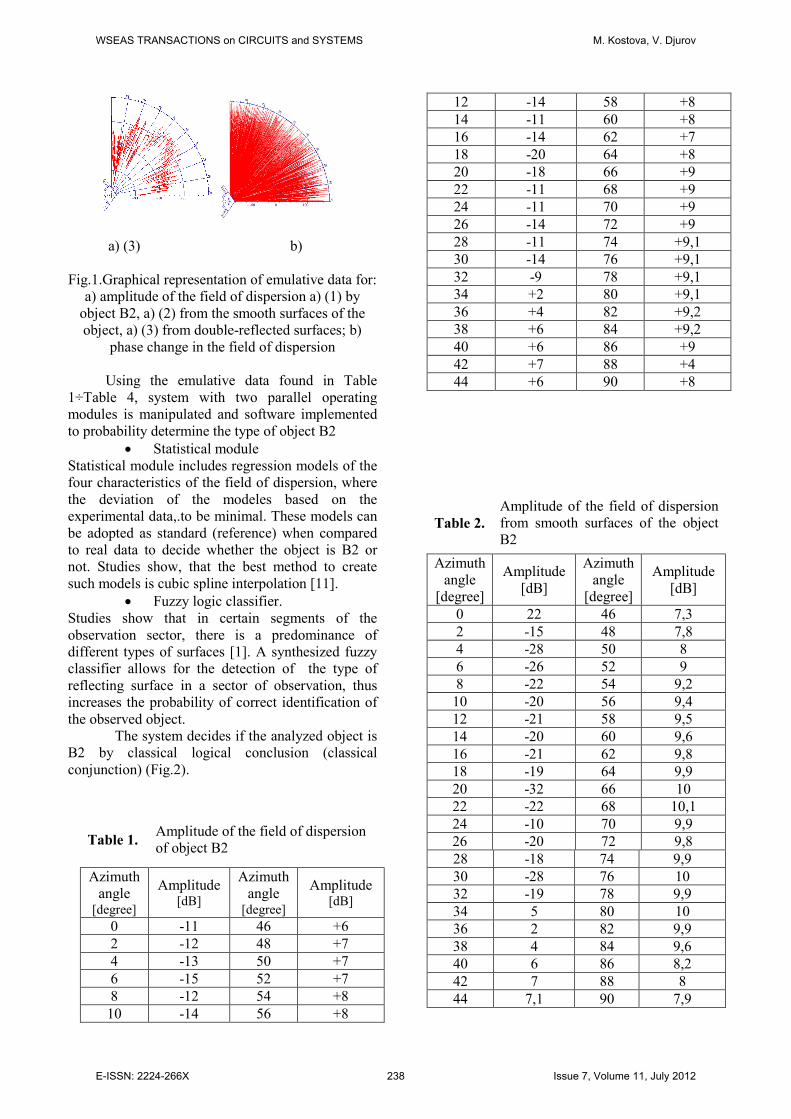
а) (3) b)
Fig.1.Graphical representation of emulative data for:
а) amplitude of the field of dispersion а) (1) by
object В2, а) (2) from the smooth surfaces of the
object, а) (3) from double-reflected surfaces; b)
phase change in the field of dispersion
Using the emulative data found in Table
1÷Table 4, system with two parallel operating
modules is manipulated and software implemented
to probability determine the type of object B2
• Statistical module
Statistical module includes regression models of the
four characteristics of the field of dispersion, where
the deviation of the modeles based on the
experimental data,.to be minimal. These models can
be adopted as standard (reference) when compared
to real data to decide whether the object is B2 or
not. Studies show, that the best method to create
such models is cubic spline interpolation [11].
• Fuzzy logic classifier.
Studies show that in certain segments of the
observation sector, there is a predominance of
different types of surfaces [1]. A synthesized fuzzy
classifier allows for the detection of the type of
reflecting surface in a sector of observation, thus
increases the probability of correct identification of
the observed object.
The system decides if the analyzed object is
B2 by classical logical conclusion (classical
conjunction) (Fig.2).
Table 1. Amplitude of the field of dispersion
of object B2
Azimuth
angle
[degree]
Amplitude
[dB]
Azimuth
angle
[degree]
Amplitude
[dB]
0 -11 46 +6
2 -12 48 +7
4 -13 50 +7
6 -15 52 +7
8 -12 54 +8
10 -14 56 +8
12 -14 58 +8
14 -11 60 +8
16 -14 62 +7
18 -20 64 +8
20 -18 66 +9
22 -11 68 +9
24 -11 70 +9
26 -14 72 +9
28 -11 74 +9,1
30 -14 76 +9,1
32 -9 78 +9,1
34 +2 80 +9,1
36 +4 82 +9,2
38 +6 84 +9,2
40 +6 86 +9
42 +7 88 +4
44 +6 90 +8
Table 2.
Amplitude of the field of dispersion
from smooth surfaces of the object
B2
Azimuth
angle
[degree]
Amplitude
[dB]
Azimuth
angle
[degree]
Amplitude
[dB]
0 22 46 7,3
2 -15 48 7,8
4 -28 50 8
6 -26 52 9
8 -22 54 9,2
10 -20 56 9,4
12 -21 58 9,5
14 -20 60 9,6
16 -21 62 9,8
18 -19 64 9,9
20 -32 66 10
22 -22 68 10,1
24 -10 70 9,9
26 -20 72 9,8
28 -18 74 9,9
30 -28 76 10
32 -19 78 9,9
34 5 80 10
36 2 82 9,9
38 4 84 9,6
40 6 86 8,2
42 7 88 8
44 7,1 90 7,9
WSEAS TRANSACTIONS on CIRCUITS and SYSTEMS M. Kostova, V. Djurov
E-ISSN: 2224-266X 238 Issue 7, Volume 11, July 2012
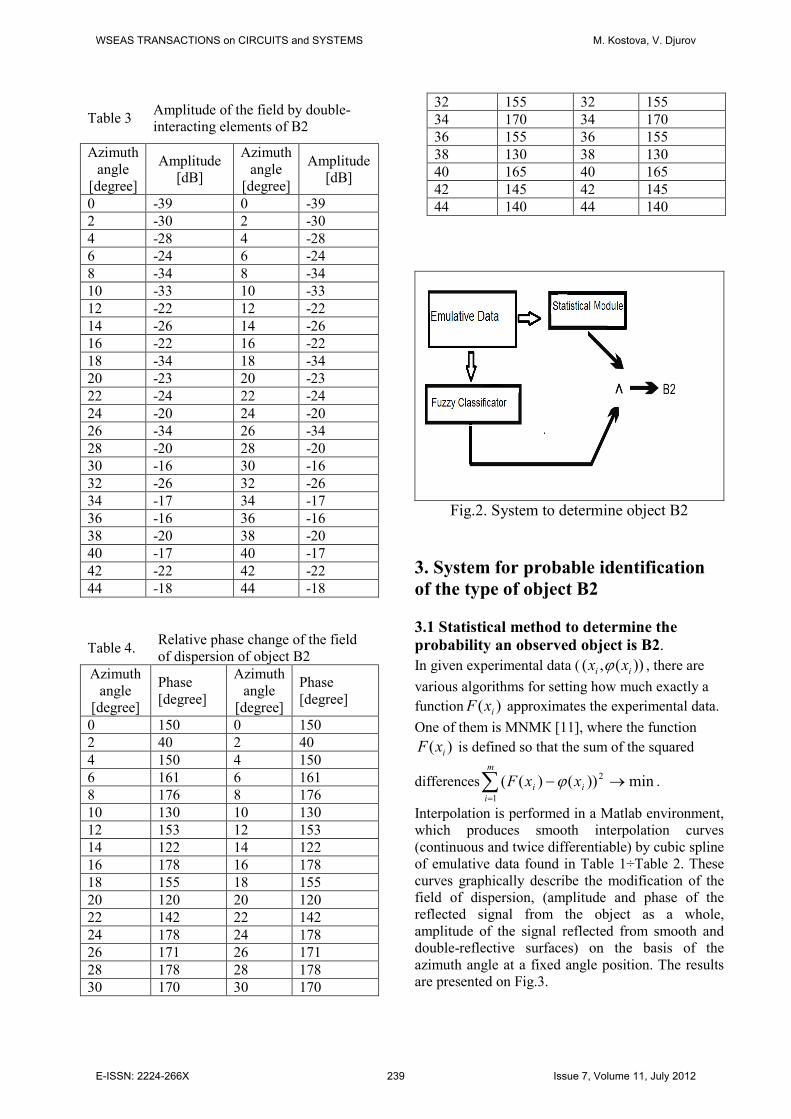
Table 3
Amplitude of the field by double-
interacting elements of B2
Azimuth
angle
[degree]
Amplitude
[dB]
Azimuth
angle
[degree]
Amplitude
[dB]
0 -39 0 -39
2 -30 2 -30
4 -28 4 -28
6 -24 6 -24
8 -34 8 -34
10 -33 10 -33
12 -22 12 -22
14 -26 14 -26
16 -22 16 -22
18 -34 18 -34
20 -23 20 -23
22 -24 22 -24
24 -20 24 -20
26 -34 26 -34
28 -20 28 -20
30 -16 30 -16
32 -26 32 -26
34 -17 34 -17
36 -16 36 -16
38 -20 38 -20
40 -17 40 -17
42 -22 42 -22
44 -18 44 -18
Table 4. Relative phase change of the field
of dispersion of object B2
Azimuth
angle
[degree]
Phase
[degree]
Azimuth
angle
[degree]
Phase
[degree]
0 150 0 150
2 40 2 40
4 150 4 150
6 161 6 161
8 176 8 176
10 130 10 130
12 153 12 153
14 122 14 122
16 178 16 178
18 155 18 155
20 120 20 120
22 142 22 142
24 178 24 178
26 171 26 171
28 178 28 178
30 170 30 170
32 155 32 155
34 170 34 170
36 155 36 155
38 130 38 130
40 165 40 165
42 145 42 145
44 140 44 140
Fig.2. System to determine object B2
3. System for probable identification
of the type of object B2
3.1 Statistical method to determine the
probability an observed object is B2.
In given experimental data ( ))(,( ii xx ϕ , there are
various algorithms for setting how much exactly a
function )( ixF approximates the experimental data.
One of them is МNМК [11], where the function
)( ixF is defined so that the sum of the squared
differences min))()(( 2
1
→−∑=
i
m
i
i xxF ϕ .
Interpolation is performed in a Matlab environment,
which produces smooth interpolation curves
(continuous and twice differentiable) by cubic spline
of emulative data found in Table 1÷Table 2. These
curves graphically describe the modification of the
field of dispersion, (amplitude and phase of the
reflected signal from the object as a whole,
amplitude of the signal reflected from smooth and
double-reflective surfaces) on the basis of the
azimuth angle at a fixed angle position. The results
are presented on Fig.3.
WSEAS TRANSACTIONS on CIRCUITS and SYSTEMS M. Kostova, V. Djurov
E-ISSN: 2224-266X 239 Issue 7, Volume 11, July 2012
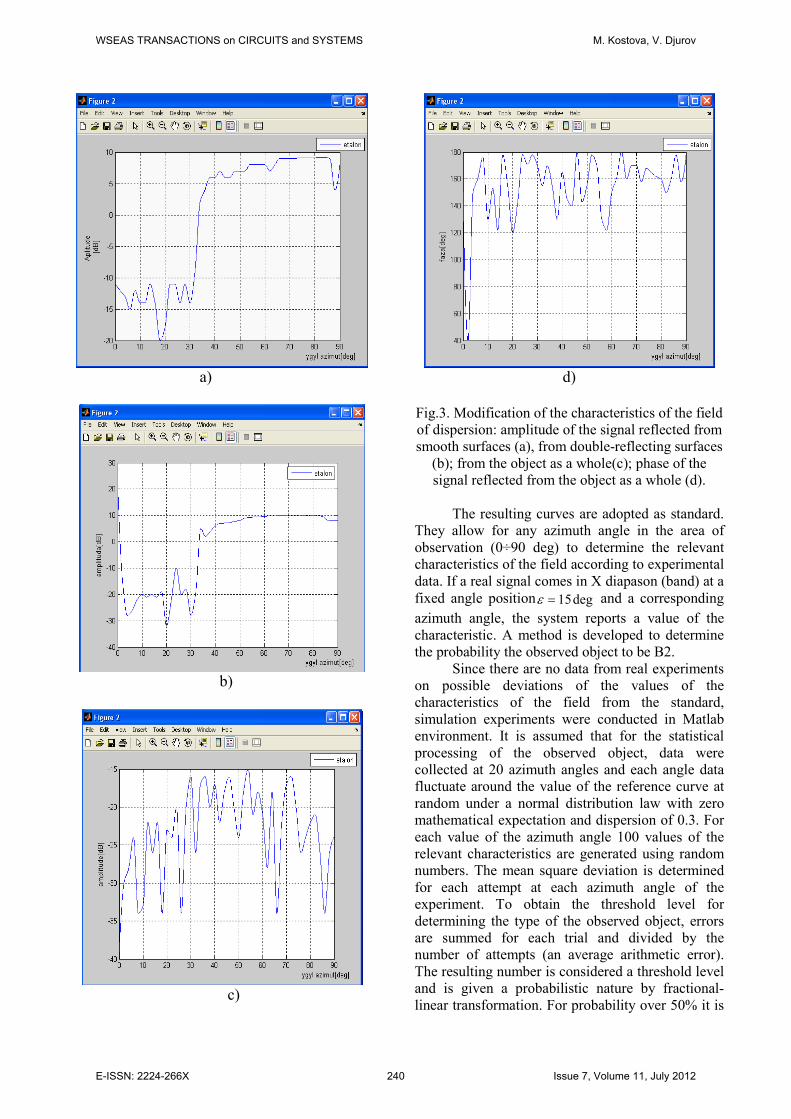
а)
b)
c)
d)
Fig.3. Modification of the characteristics of the field
of dispersion: amplitude of the signal reflected from
smooth surfaces (а), from double-reflecting surfaces
(b); from the object as a whole(c); phase of the
signal reflected from the object as a whole (d).
The resulting curves are adopted as standard.
They allow for any azimuth angle in the area of
observation (0÷90 deg) to determine the relevant
characteristics of the field according to experimental
data. If a real signal comes in X diapason (band) at a
fixed angle position deg15=ε and a corresponding
azimuth angle, the system reports a value of the
characteristic. A method is developed to determine
the probability the observed object to be B2.
Since there are no data from real experiments
on possible deviations of the values of the
characteristics of the field from the standard,
simulation experiments were conducted in Matlab
environment. It is assumed that for the statistical
processing of the observed object, data were
collected at 20 azimuth angles and each angle data
fluctuate around the value of the reference curve at
random under a normal distribution law with zero
mathematical expectation and dispersion of 0.3. For
each value of the azimuth angle 100 values of the
relevant characteristics are generated using random
numbers. The mean square deviation is determined
for each attempt at each azimuth angle of the
experiment. To obtain the threshold level for
determining the type of the observed object, errors
are summed for each trial and divided by the
number of attempts (an average arithmetic error).
The resulting number is considered a threshold level
and is given a probabilistic nature by fractional-
linear transformation. For probability over 50% it is
WSEAS TRANSACTIONS on CIRCUITS and SYSTEMS M. Kostova, V. Djurov
E-ISSN: 2224-266X 240 Issue 7, Volume 11, July 2012
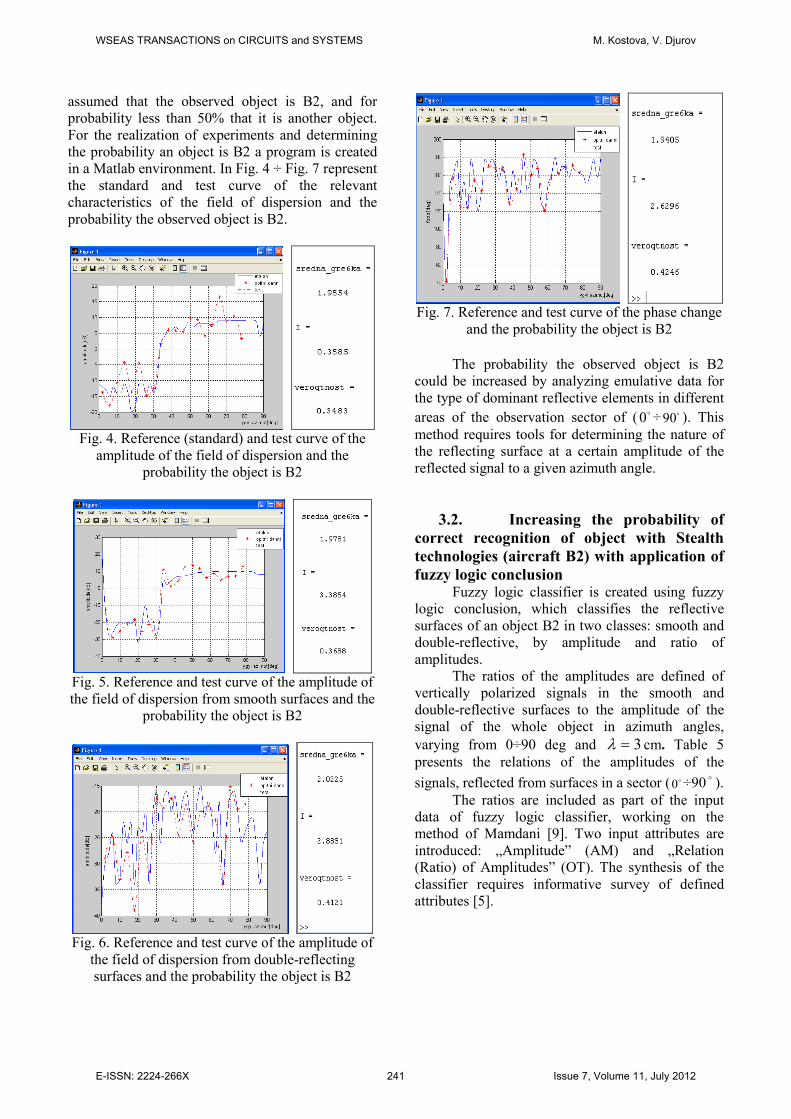
assumed that the observed object is B2, and for
probability less than 50% that it is another object.
For the realization of experiments and determining
the probability an object is B2 a program is created
in a Matlab environment. In Fig. 4 ÷ Fig. 7 represent
the standard and test curve of the relevant
characteristics of the field of dispersion and the
probability the observed object is B2.
Fig. 4. Reference (standard) and test curve of the
amplitude of the field of dispersion and the
probability the object is B2
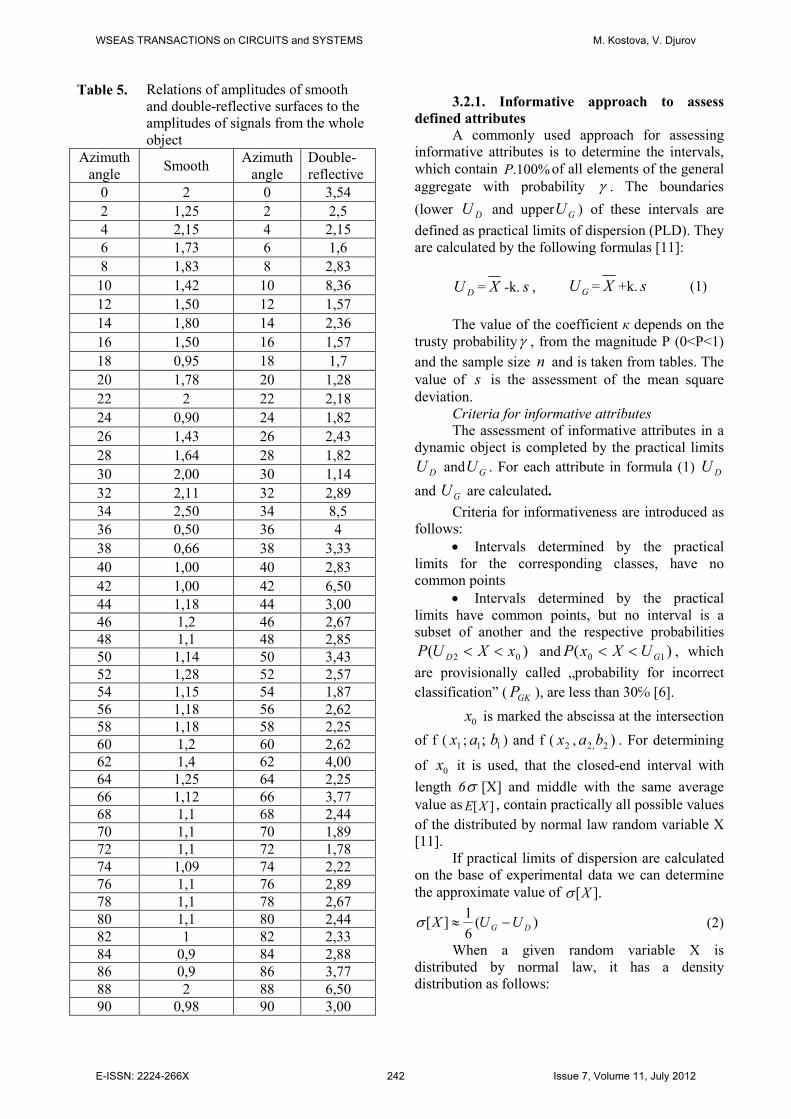
Fig. 5. Reference and test curve of the amplitude of
the field of dispersion from smooth surfaces and the
probability the object is B2
Fig. 6. Reference and test curve of the amplitude of
the field of dispersion from double-reflecting
surfaces and the probability the object is B2
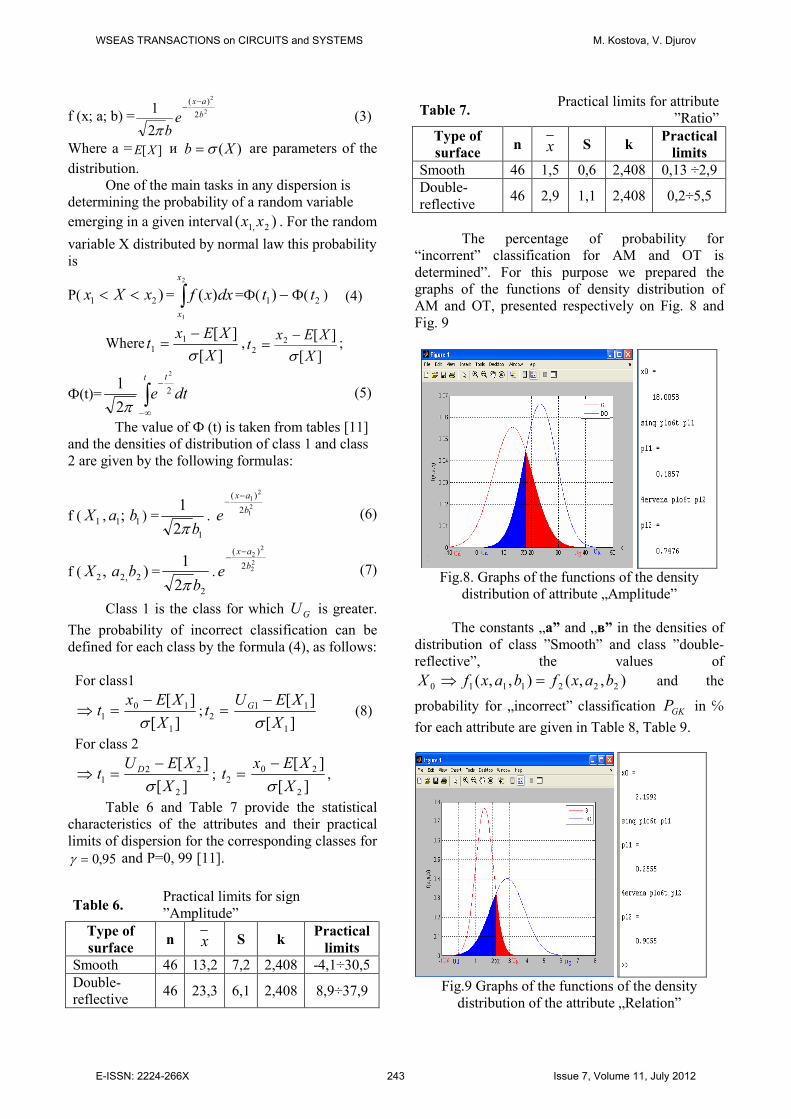
Fig. 7. Reference and test curve of the phase change
and the probability the object is B2
The probability the observed object is B2
could be increased by analyzing emulative data for
the type of dominant reflective elements in different
areas of the observation sector of ( �0 ÷ �90 ). This
method requires tools for determining the nature of
the reflecting surface at a certain amplitude of the
reflected signal to a given azimuth angle.
3.2. Increasing the probability of
correct recognition of object with Stealth
technologies (aircraft B2) with application of
fuzzy logic conclusion Fuzzy logic classifier is created using fuzzy
logic conclusion, which classifies the reflective
surfaces of an object B2 in two classes: smooth and
double-reflective, by amplitude and ratio of
amplitudes.
The ratios of the amplitudes are defined of
vertically polarized signals in the smooth and
double-reflective surfaces to the amplitude of the
signal of the whole object in azimuth angles,
varying from 0÷90 deg and 3=λ cm. Table 5
presents the relations of the amplitudes of the
signals, reflected from surfaces in a sector ( �0 ÷90�
).
The ratios are included as part of the input
data of fuzzy logic classifier, working on the
method of Mamdani [9]. Two input attributes are
introduced: „Amplitude” (АM) and „Relation
(Ratio) of Amplitudes” (OT). The synthesis of the
classifier requires informative survey of defined
attributes [5].
WSEAS TRANSACTIONS on CIRCUITS and SYSTEMS M. Kostova, V. Djurov
E-ISSN: 2224-266X 241 Issue 7, Volume 11, July 2012
3.2.1. Informative approach to assess
defined attributes
A commonly used approach for assessing
informative attributes is to determine the intervals,
which contain %100.P of all elements of the general
aggregate with probability γ . The boundaries
(lower DU and upper GU ) of these intervals are
defined as practical limits of dispersion (PLD). They
are calculated by the following formulas [11]:
DU = X -k. s , GU = X +k. s (1)
The value of the coefficient к depends on the
trusty probabilityγ , from the magnitude P (0<P<1)
and the sample size n and is taken from tables. The
value of s is the assessment of the mean square
deviation.
Criteria for informative attributes
The assessment of informative attributes in a
dynamic object is completed by the practical limits
DU and GU . For each attribute in formula (1) DU
and GU are calculated.
Criteria for informativeness are introduced as
follows:
• Intervals determined by the practical
limits for the corresponding classes, have no
common points
• Intervals determined by the practical
limits have common points, but no interval is a
subset of another and the respective probabilities
)( 02 xXUP D << and )( 10 GUXxP << , which
are provisionally called „probability for incorrect
classification” ( GKP ), are less than 30℅ [6].
0x is marked the abscissa at the intersection
of f ( 1x ; ;1a 1b ) and f ( 2x , )2,2 ba . For determining
of 0x it is used, that the closed-end interval with
length 6σ [X] and middle with the same average
value as ][XE , contain practically all possible values
of the distributed by normal law random variable Х
[11].
If practical limits of dispersion are calculated
on the base of experimental data we can determine
the approximate value of ].[Хσ
)(6
1][ DG UUХ −≈σ (2)
When a given random variable Х is
distributed by normal law, it has a density
distribution as follows:
Table 5. Relations of amplitudes of smooth
and double-reflective surfaces to the
amplitudes of signals from the whole
object
Azimuth
angle Smooth
Azimuth
angle
Double-
reflective
0 2 0 3,54
2 1,25 2 2,5
4 2,15 4 2,15
6 1,73 6 1,6
8 1,83 8 2,83
10 1,42 10 8,36
12 1,50 12 1,57
14 1,80 14 2,36
16 1,50 16 1,57
18 0,95 18 1,7
20 1,78 20 1,28
22 2 22 2,18
24 0,90 24 1,82
26 1,43 26 2,43
28 1,64 28 1,82
30 2,00 30 1,14
32 2,11 32 2,89
34 2,50 34 8,5
36 0,50 36 4
38 0,66 38 3,33
40 1,00 40 2,83
42 1,00 42 6,50
44 1,18 44 3,00
46 1,2 46 2,67
48 1,1 48 2,85
50 1,14 50 3,43
52 1,28 52 2,57
54 1,15 54 1,87
56 1,18 56 2,62
58 1,18 58 2,25
60 1,2 60 2,62
62 1,4 62 4,00
64 1,25 64 2,25
66 1,12 66 3,77
68 1,1 68 2,44
70 1,1 70 1,89
72 1,1 72 1,78
74 1,09 74 2,22
76 1,1 76 2,89
78 1,1 78 2,67
80 1,1 80 2,44
82 1 82 2,33
84 0,9 84 2,88
86 0,9 86 3,77
88 2 88 6,50
90 0,98 90 3,00
WSEAS TRANSACTIONS on CIRCUITS and SYSTEMS M. Kostova, V. Djurov
E-ISSN: 2224-266X 242 Issue 7, Volume 11, July 2012
f (x; a; b) =2
2
2
)(
2
1b
ax
еb
−−
π (3)
Where а = ][XE и )(Xb σ= are parameters of the
distribution.
One of the main tasks in any dispersion is
determining the probability of a random variable
emerging in a given interval )( 2,1 xx . For the random
variable Х distributed by normal law this probability
is
P( )21 xXx << = ∫2
1
)(
x
x
dxxf =Ф( −)1t Ф( 2t ) (4)
Where][
][11
Х
XExt
σ−
= ,][
][2
2Х
XExt
σ−
= ;
Ф(t)= ∫∞−
−t t
dte 2
2
2
1
π (5)
The value of Ф (t) is taken from tables [11]
and the densities of distribution of class 1 and class
2 are given by the following formulas:
f ( 1X , ;1a 1b ) =
12
1
bπ.
21
21
2
)(
b
ax
e
−−
(6)
f ( ,2X )2,2 ba =
22
1
bπ.
22
22
2
)(
b
ax
e
−−
(7)
Class 1 is the class for which GU is greater.
The probability of incorrect classification can be
defined for each class by the formula (4), as follows:
For class1
⇒ =1t][
][
1
10
X
XEx
σ−
; =2t][
][
1
11
X
XEU G
σ−
(8)
For class 2
⇒ =1t][
][
2
22
X
XEU D
σ−
; =2t][
][
2
20
X
XEx
σ−
,
Table 6 and Table 7 provide the statistical
characteristics of the attributes and their practical
limits of dispersion for the corresponding classes for 95,0=γ and Р=0, 99 [11].
Table 6. Practical limits for sign
”Amplitude”
Type of
surface n x S k
Practical
limits
Smooth 46 13,2 7,2 2,408 -4,1÷30,5
Double-
reflective 46 23,3 6,1 2,408 8,9÷37,9
Table 7. Practical limits for attribute
”Ratio”
Type of
surface n x S k
Practical
limits
Smooth 46 1,5 0,6 2,408 0,13 ÷2,9
Double-
reflective 46 2,9 1,1 2,408 0,2÷5,5
The percentage of probability for
“incorrent” classification for AM and OT is
determined”. For this purpose we prepared the
graphs of the functions of density distribution of
AM and OT, presented respectively on Fig. 8 and
Fig. 9
Fig.8. Graphs of the functions of the density
distribution of attribute „Amplitude”
The constants „а” and „в” in the densities of
distribution of class ”Smooth” and class ”double-
reflective”, the values of
),,(),,( 2221110 baxfbaxfX =⇒ and the
probability for „incorrect” classification GKP in ℅
for each attribute are given in Table 8, Table 9.
Fig.9 Graphs of the functions of the density
distribution of the attribute „Relation”
WSEAS TRANSACTIONS on CIRCUITS and SYSTEMS M. Kostova, V. Djurov
E-ISSN: 2224-266X 243 Issue 7, Volume 11, July 2012
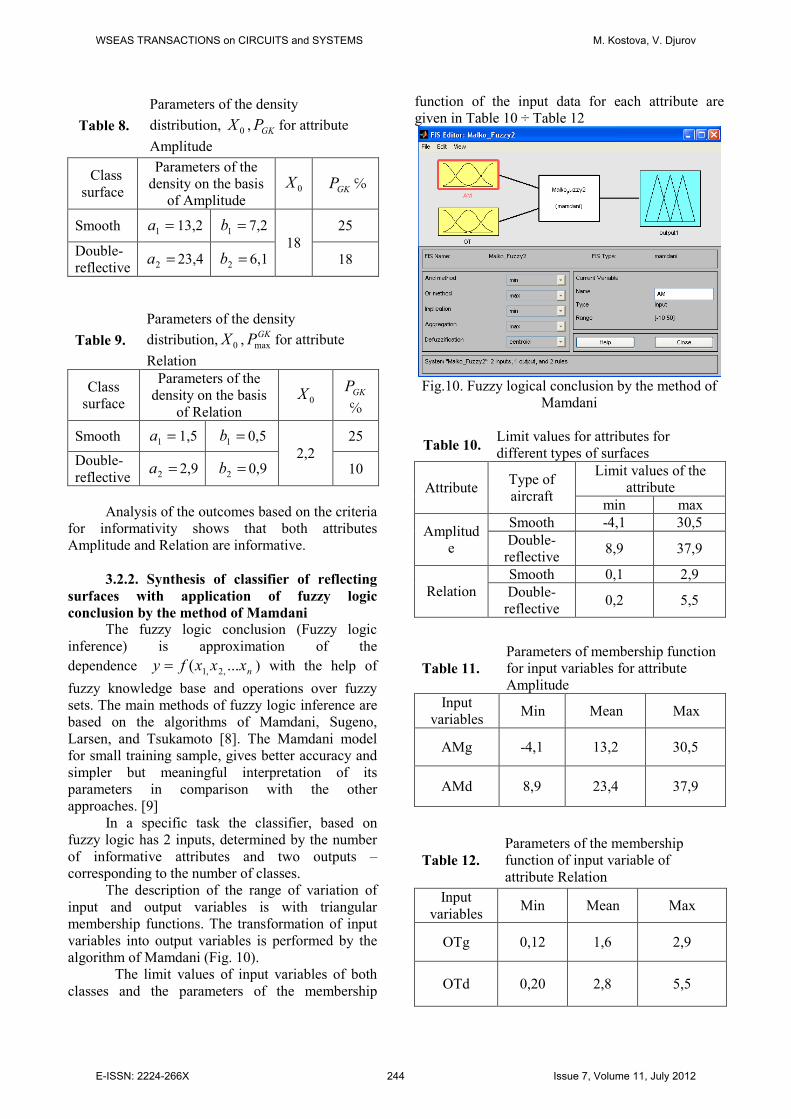
Table 8.
Parameters of the density
distribution, 0X , GKP for attribute
Amplitude
Table 9.
Parameters of the density
distribution, 0X ,GKPmax for attribute
Relation
Class
surface
Parameters of the
density on the basis
of Relation 0X GKP
℅
Smooth =1a 1,5 =1b 0,5
2,2
25
Double-
reflective =2a 2,9 =2b 0,9 10
Analysis of the outcomes based on the criteria
for informativity shows that both attributes
Amplitude and Relation are informative.
3.2.2. Synthesis of classifier of reflecting
surfaces with application of fuzzy logic
conclusion by the method of Mamdani
The fuzzy logic conclusion (Fuzzy logic
inference) is approximation of the
dependence nxxxfy ...( ,2,1= ) with the help of
fuzzy knowledge base and operations over fuzzy
sets. The main methods of fuzzy logic inference are
based on the algorithms of Mamdani, Sugeno,
Larsen, and Tsukamoto [8]. The Mamdani model
for small training sample, gives better accuracy and
simpler but meaningful interpretation of its
parameters in comparison with the other
approaches. [9]
In a specific task the classifier, based on
fuzzy logic has 2 inputs, determined by the number
of informative attributes and two outputs –
corresponding to the number of classes.
The description of the range of variation of
input and output variables is with triangular
membership functions. The transformation of input
variables into output variables is performed by the
algorithm of Mamdani (Fig. 10).
The limit values of input variables of both
classes and the parameters of the membership
function of the input data for each attribute are
given in Table 10 ÷ Table 12
Fig.10. Fuzzy logical conclusion by the method of
Mamdani
Table 10. Limit values for attributes for
different types of surfaces
Attribute Type of
aircraft
Limit values of the
attribute
min max
Amplitud
e
Smooth -4,1 30,5
Double-
reflective 8,9 37,9
Relation
Smooth 0,1 2,9
Double-
reflective 0,2 5,5
Table 11.
Parameters of membership function
for input variables for attribute
Amplitude
Input
variables Min Mean Max
AМg -4,1 13,2 30,5
AМd 8,9 23,4 37,9
Table 12.
Parameters of the membership
function of input variable of
attribute Relation
Input
variables Min Mean Max
OTg 0,12 1,6 2,9
OTd 0,20 2,8 5,5
Class
surface
Parameters of the
density on the basis
of Amplitude 0X
GKP ℅
Smooth =1a 13,2 =1b 7,2
18
25
Double-
reflective =2a 23,4 =2b 6,1 18
WSEAS TRANSACTIONS on CIRCUITS and SYSTEMS M. Kostova, V. Djurov
E-ISSN: 2224-266X 244 Issue 7, Volume 11, July 2012
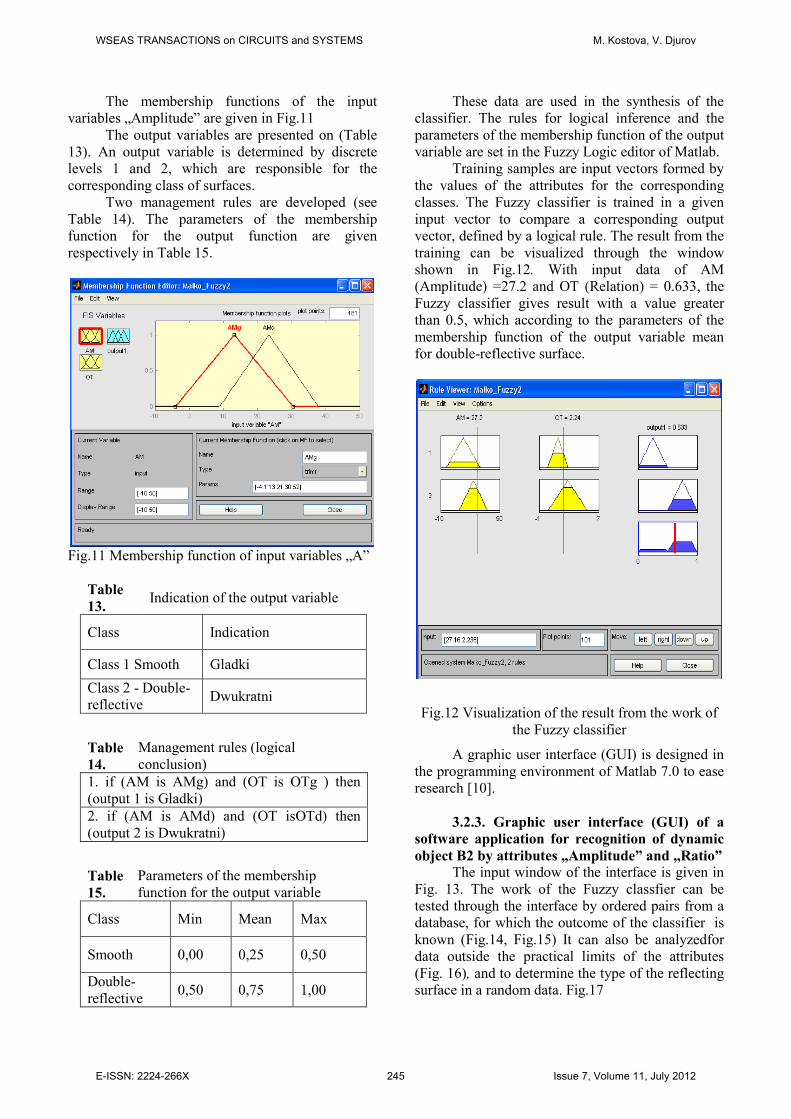
The membership functions of the input
variables „Amplitude” are given in Fig.11
The output variables are presented on (Table
13). An output variable is determined by discrete
levels 1 and 2, which are responsible for the
corresponding class of surfaces.
Two management rules are developed (see
Table 14). The parameters of the membership
function for the output function are given
respectively in Table 15.
Fig.11 Membership function of input variables „А”
Table
13. Indication of the output variable
Class Indication
Class 1 Smooth Gladki
Class 2 - Double-
reflective Dwukratni
Table
14.
Management rules (logical
conclusion)
1. if (AM is AMg) and (OT is OTg ) then
(output 1 is Gladki)
2. if (AM is AMd) and (OT isOTd) then
(output 2 is Dwukratni)
Table
15.
Parameters of the membership
function for the output variable
Class Min Mean Max
Smooth 0,00 0,25 0,50
Double-
reflective 0,50 0,75 1,00
These data are used in the synthesis of the
classifier. The rules for logical inference and the
parameters of the membership function of the output
variable are set in the Fuzzy Logic editor of Matlab.
Training samples are input vectors formed by
the values of the attributes for the corresponding
classes. The Fuzzy classifier is trained in a given
input vector to compare a corresponding output
vector, defined by a logical rule. The result from the
training can be visualized through the window
shown in Fig.12. With input data of АМ
(Amplitude) =27.2 and ОТ (Relation) = 0.633, the
Fuzzy classifier gives result with a value greater
than 0.5, which according to the parameters of the
membership function of the output variable mean
for double-reflective surface.
Fig.12 Visualization of the result from the work of
the Fuzzy classifier
A graphic user interface (GUI) is designed in
the programming environment of Matlab 7.0 to ease
research [10].
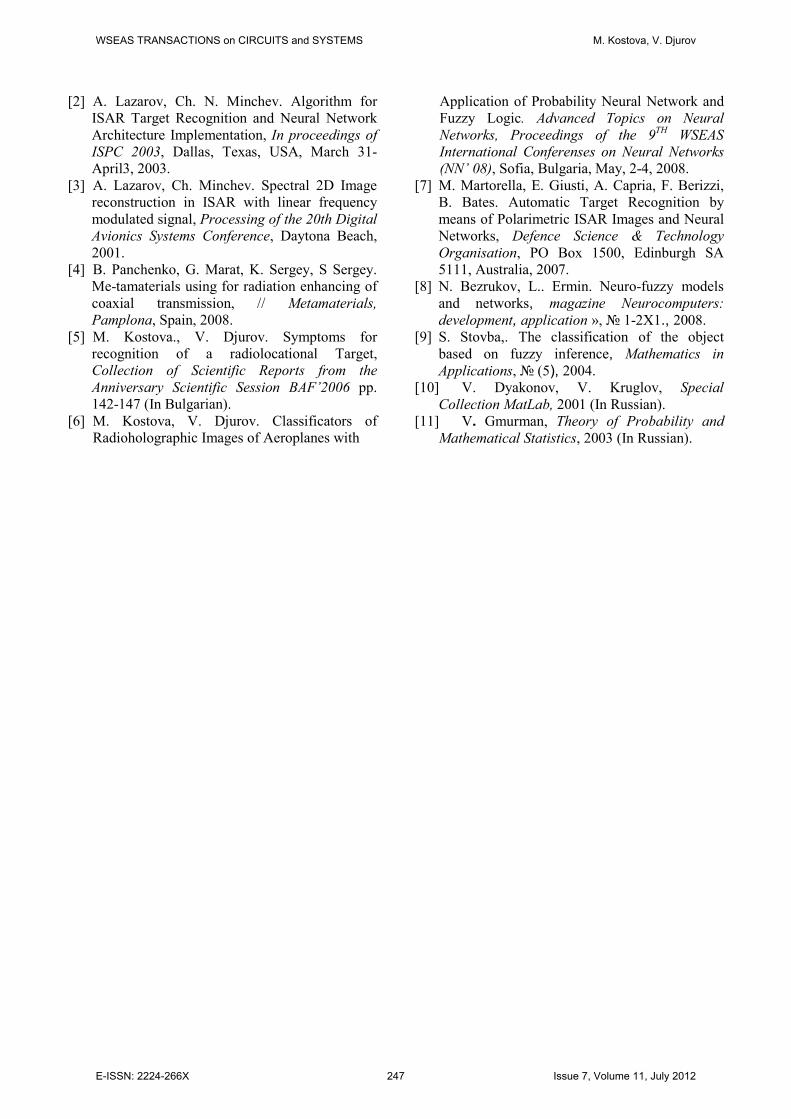
3.2.3. Graphic user interface (GUI) of a
software application for recognition of dynamic
object B2 by attributes „Amplitude” and „Ratio”
The input window of the interface is given in
Fig. 13. The work of the Fuzzy classfier can be
tested through the interface by ordered pairs from a
database, for which the outcome of the classifier is
known (Fig.14, Fig.15) It can also be analyzedfor
data outside the practical limits of the attributes
(Fig. 16), and to determine the type of the reflecting
surface in a random data. Fig.17
WSEAS TRANSACTIONS on CIRCUITS and SYSTEMS M. Kostova, V. Djurov
E-ISSN: 2224-266X 245 Issue 7, Volume 11, July 2012
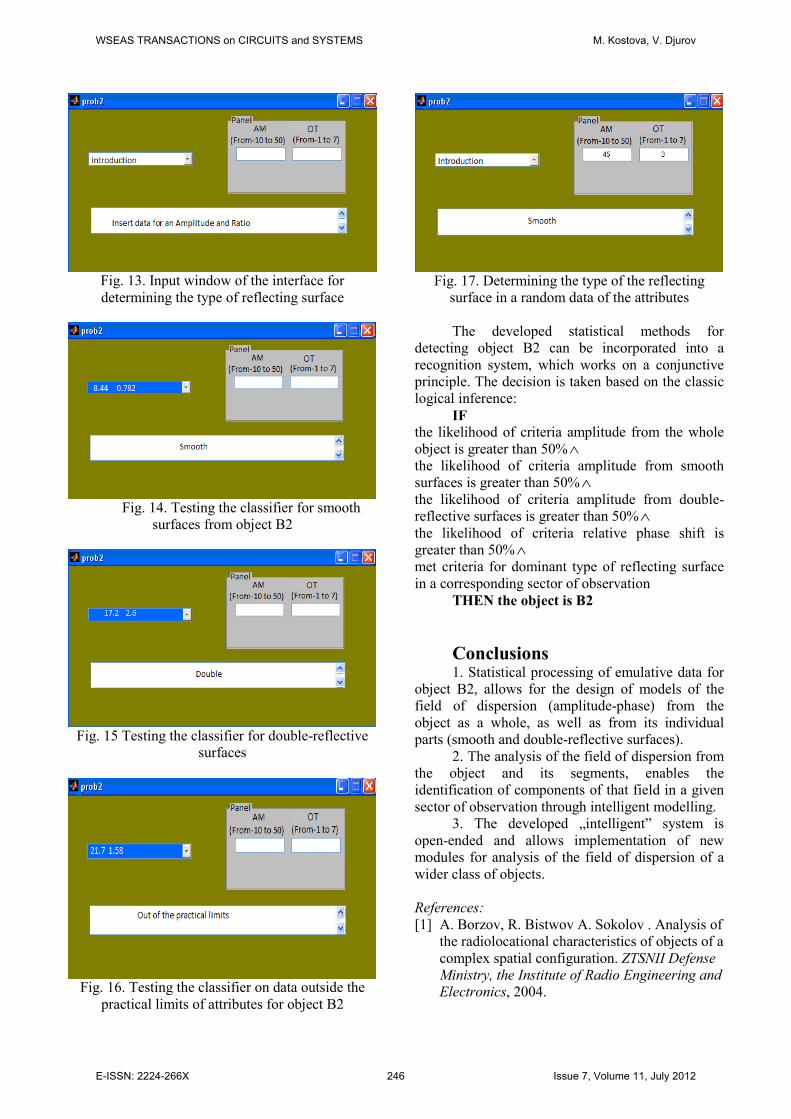
Fig. 13. Input window of the interface for
determining the type of reflecting surface
Fig. 14. Testing the classifier for smooth
surfaces from object B2
Fig. 15 Testing the classifier for double-reflective
surfaces
Fig. 16. Testing the classifier on data outside the
practical limits of attributes for object B2
Fig. 17. Determining the type of the reflecting
surface in a random data of the attributes
The developed statistical methods for
detecting object B2 can be incorporated into a
recognition system, which works on a conjunctive
principle. The decision is taken based on the classic
logical inference:
IF
the likelihood of criteria amplitude from the whole
object is greater than 50%∧
the likelihood of criteria amplitude from smooth
surfaces is greater than 50%∧
the likelihood of criteria amplitude from double-
reflective surfaces is greater than 50%∧
the likelihood of criteria relative phase shift is
greater than 50%∧
met criteria for dominant type of reflecting surface
in a corresponding sector of observation
THEN the object is В2
Conclusions 1. Statistical processing of emulative data for
object B2, allows for the design of models of the
field of dispersion (amplitude-phase) from the
object as a whole, as well as from its individual
parts (smooth and double-reflective surfaces).
2. The analysis of the field of dispersion from
the object and its segments, enables the
identification of components of that field in a given
sector of observation through intelligent modelling.
3. The developed „intelligent” system is
open-ended and allows implementation of new
modules for analysis of the field of dispersion of a
wider class of objects.
References:
[1] A. Borzov, R. Bistwov А. Sokolov . Analysis of
the radiolocational characteristics of objects of a
complex spatial configuration. ZTSNII Defense
Ministry, the Institute of Radio Engineering and
Electronics, 2004.
WSEAS TRANSACTIONS on CIRCUITS and SYSTEMS M. Kostova, V. Djurov
E-ISSN: 2224-266X 246 Issue 7, Volume 11, July 2012
[2] A. Lazarov, Ch. N. Minchev. Аlgorithm for
ISAR Target Recognition and Neural Network
Architecture Implementation, In proceedings of
ISPC 2003, Dallas, Texas, USA, March 31-
April3, 2003.
[3] A. Lazarov, Ch. Minchev. Spectral 2D Image
reconstruction in ISAR with linear frequency
modulated signal, Processing of the 20th Digital
Avionics Systems Conference, Daytona Beach,
2001.
[4] B. Panchenko, G. Marat, K. Sergey, S Sergey.
Me-tamaterials using for radiation enhancing of
coaxial transmission, // Metamaterials,
Pamplona, Spain, 2008.
[5] M. Kostova., V. Djurov. Symptoms for
recognition of a radiolocational Target,
Collection of Scientific Reports from the
Anniversary Scientific Session BAF’2006 pp.
142-147 (In Bulgarian).
[6] M. Kostova, V. Djurov. Classificators of
Radioholographic Images of Aeroplanes with
Application of Probability Neural Network and
Fuzzy Logic. Advanced Topics on Neural
Networks, Proceedings of the 9TH
WSEAS
International Conferenses on Neural Networks
(NN’ 08), Sofia, Bulgaria, May, 2-4, 2008.
[7] M. Martorella, E. Giusti, A. Capria, F. Berizzi,
B. Bates. Automatic Target Recognition by
means of Polarimetric ISAR Images and Neural
Networks, Defence Science & Technology
Organisation, PO Box 1500, Edinburgh SA
5111, Australia, 2007.
[8] N. Bezrukov, L.. Ermin. Neuro-fuzzy models and networks, magazine Neurocomputers:
development, application », № 1-2X1., 2008.
[9] S. Stovba,. The classification of the object based on fuzzy inference, Mathematics in
Applications, № (5), 2004.
[10] V. Dyakonov, V. Kruglov, Special
Collection MatLab, 2001 (In Russian).
[11] V. Gmurman, Theory of Probability and
Mathematical Statistics, 2003 (In Russian).
WSEAS TRANSACTIONS on CIRCUITS and SYSTEMS M. Kostova, V. Djurov
E-ISSN: 2224-266X 247 Issue 7, Volume 11, July 2012