Embed Size (px)
Citation preview
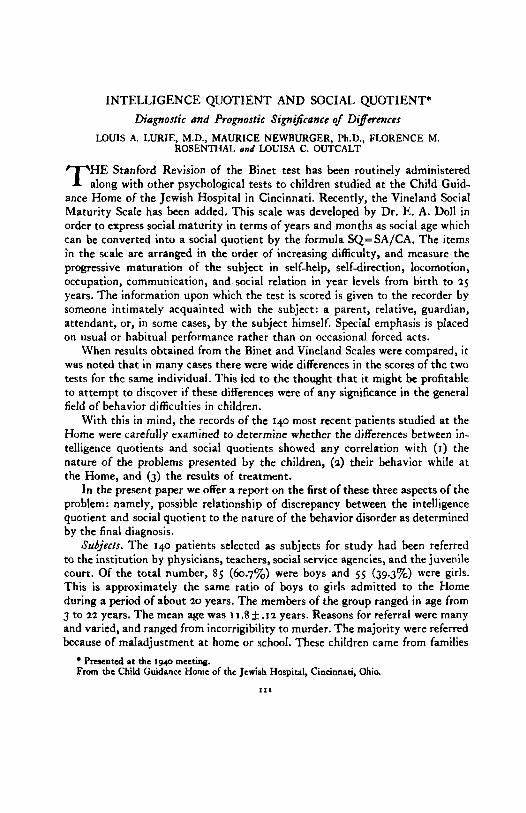
INTELLIGENCE QUOTIENT AND SOCIAL QUOTIENT* Diagnostic and Prognostic Signtjicance of Diyerences
LOUIS A. LURIE, M.D., MAURICE NEWBURGER, Ph.D., FLORENCE M. ROSENTHAI. and LOUISA C. OUTCALT
HE Stanford Revision of the Binet test has been routinely administered T along with other psychological tests to children studied a t the Child Guid- ance Home of the Jewish Hospital in Cincinnati. Recently, the Vineland Social Maturity Scale has been added. This scale was developed by Dr. E. A. Doll in order to express social maturity in terms of years and months as social age which can be converted into a social quotient by the formula SQ=SA/CA. The items i'n the scale are arranged in the order of increasing difficulty, and measure the progressive maturation of the subject in self-help, selfdirection, locomotion, occupation, communication, and. social relation in year levels from birth to 25 years. The information upon which the test is scored is given to the recorder by someone intimately acquainted with the subject: a parent, relative, guardian, attendant, or, in some cases, by the subject himself. Special emphasis is placed on usual or habitual performance rather than on occasional forced acts.
When results obtained from the Binet and Vineland Scales were compared, it was noted that in many cases there were wide differences in the scores of the two tests for the same individual. This led to the thought that it might be profitable to attempt to discover if these differences were of any significance in the general field of behavior difficulties in children.
With this in mind, the records of the 140 most recent patients studied at the Home were carefully examined to determine whether the differences between in- telligence quotients and social quotients showed any correlation with (I) the nature of the problems presented by the children, (2) their behavior while a t the Home, and (3) the results of treatment.
In the present paper we offer a report on the first of these three aspects of the problem: namely, possible relationship of discrepancy between the intelligence quotient and social quotient to the nature of the behavior disorder as determined by the final diagnosis.
Subjects. The 140 patients selected as subjects for study had been referred to the institution by physicians, teachers, social service agencies, and the juvenile court. Of the total number, 85 (60.77&) were boys and 55 (39.3%) were girls. This is approximately the same ratio of boys to girls admitted to the Home during a period of about 20 years. The members of the group ranged in age from 3 to 22 years. The mean age was 11 .8k .n years. Reasons for referral were many and varied, and ranged from incorrigibility to murder. The majority were referred because of maladjustment a t home or school. These children came from families
Presented at the 1940 meeting. From the Child Guidance Home of the Jewish Hospital, Cincinnati, Ohio.
1x1
1 1 2 INTELLIGENCE QUOTIENT AND SOCIAL QUOTIENT
of different economic and social levels ranging from the social elite to the sub- merged tenth, and thus represented a fairly typical cross section of the entire community .
Procedure. Records were examined for IQ and S.Q. and these were arranged in the order of their magnitude. The IQ's which ranged from 30 to 150 were divided into groups having a 20 point range. There were thus 6 groups. The mean IQ and S.Q. for each group was determined as well as the discrepancy between the means. These cases were then grouped according to final diagnoses, and the dis- crepancy between the two quotients was obtained a t each IQ level for each diag- nostic classification as well as for the entire group. In this way, discrepancies occurring in each diagnostic group could be compared with that of the entire group. Graphs were plotted to show these relationships.
Results. When individual 1Q's and S.Q.'s were distributed in accordance with their frequency, and when an analysis of the data was made, the mean IQ was found to be 92.5 k .64 and the mean S.Q., 86.3 k . I 5. This means that the group we chose for study had an average S.Q. which is appreciably lower than its average IQ. The significance of this difference is established by the fact that the probable error of the difference is only .66 while the actual difference is 6.2. This represents a critical ratio of 9.39.*
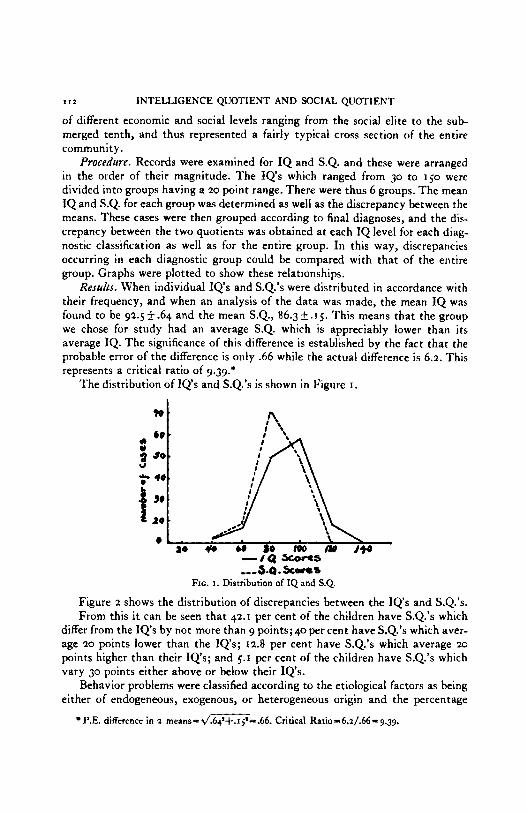
The distribution of IQ's and S.Q.'s is shown in Figure I.
0 ao
---&Q. &-5 FIG. I . Distribution of IQ and S.Q.
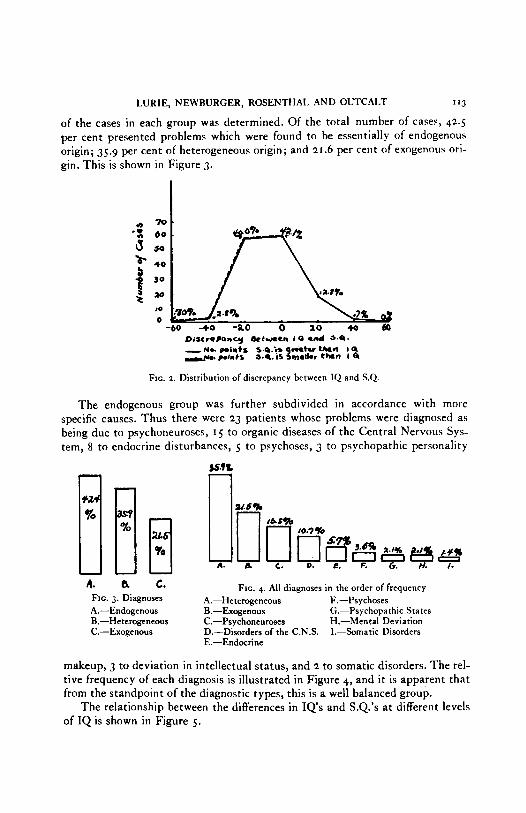
Figure 2 shows the distribution of discrepancies between the IQ's and S.Q.'s. From this it can be seen that 42.1 per cent of the children have S.Q.'s which
differ from the IQ's by not more than 9 points; 40 per cent have S.Q.'s which aver- age 20 points lower than the IQs; 12.8 per cent have S.Q.'s which average 20
points higher than their IQ's; and 5.1 per cent of the children have S.Q.'s which vary 30 points either above or below their IQ's.
Behavior problems were classified according to the etiological factors as being either of endogeneous, exogenous, or heterogeneous origin and the percentage
P.E. difference in 2 means=d.64'+.15'==.66. Critical Ratio=6.i/.66=g.3g.
LURIE, NEWRURGER, ROSENTHAI. AND 0UTCAI.T * '3
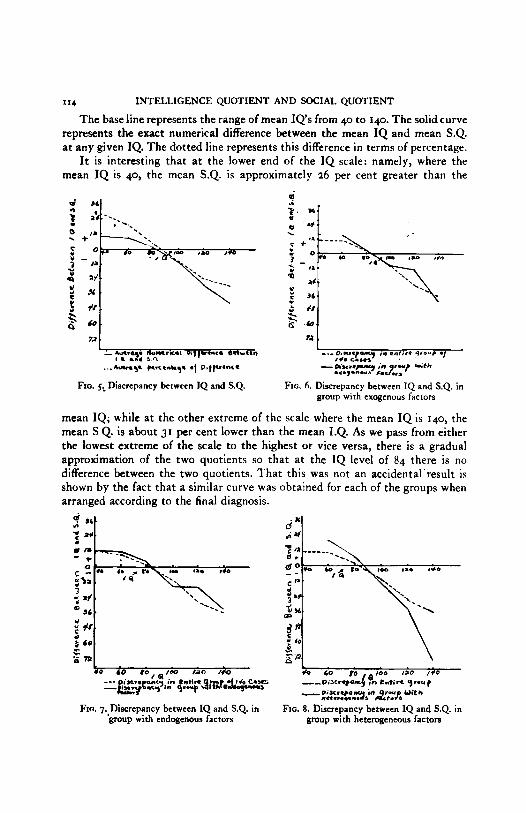
of the cases in each group was determined. Of the total number of cases, 42.5 per cent presented problems which were found to be essentially of endogenous origin; 35.9 per cent of heterogeneous origin; and 21.6 per cent of exogenous ori- gin. This is shown in Figure 3.
DixrePamcy k t e e m 1 0 and *.a. - M L points 5.4.i.~ mtw-n I Q d o . writs s.a. is 1mat1.r t h n I Q
FIG. Z. Distribution of discrepancy between IQ and S.Q.
The endogenous group was further subdivided in accordance with more specific causes. Thus there were 23 patients whose problems were diagnosed as being due to psychoneuroses, 1 5 to organic diseases of the Central Nervous Sys- tem, 8 to endocrine disturbances, 5 to psychoses, 3 to psychopathic personality [I[ [
A.
A. a c. FIG. 4. All diagnoses in the order of frequency FIG. 3. Diagnoses A.-Heterogeneous F.-Psychoses A.-Endogenous R.-Exogenous (;.-Psychopathic States B.-Heterogeneous C.-Psychoneuroses H.-Mental Deviation C.-Exogenous D.-Disorders of the C.N.S. I.--Somatic Disorders
E.-Endocrine
makeup, 3 to deviation in intellectual status, and 2 to somatic disorders. The rel- tive frequency of each diagnosis is illustrated in Figure 4, and it is apparent that from the standpoint of the diagnostic types, this is a well balanced group.
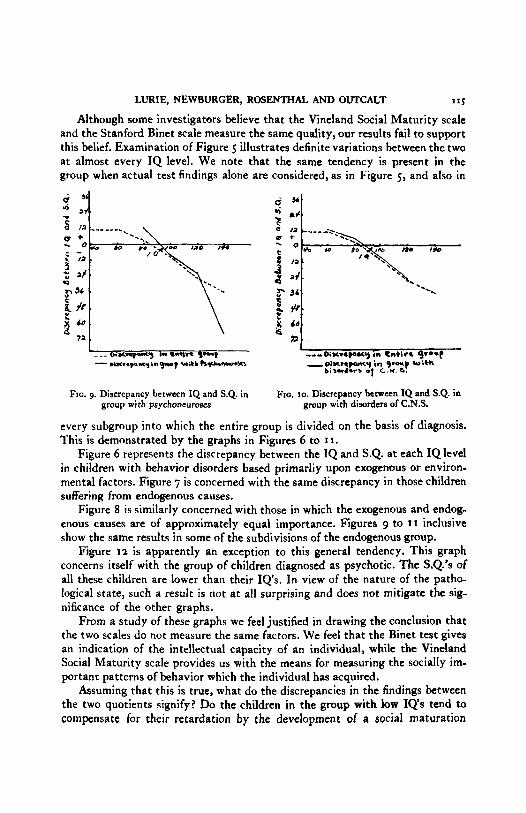
The relationship between the differences in IQ's and S.Q.'s a t different levels of IQ is shown in Figure 5.
114 INTELLIGENCE QUOTIENT AND SOCIAL QUOTIENT
The base line represents the range of mean IQ's from 40 to 140. The solidcurve represents the exact numerical difference between the mean IQ and mean S.Q. a t any given IQ. The dotted line represents this difference in terms of percentage.
It is interesting that a t the lower end of the IQ scale: namely, where the mean IQ is 40, the mean S.Q. is approximately 26 per cent greater than the
72 72
1. aua.ay N u m r r a oq)v-r* eebean
... A - y wuenhq. of o q p e n c a ---o*xn.r-y i n entrra y o ~ r -1
I L 111 sn, #+. C.,., . - w w . p y i n .-
FIG. 6. Discrepancy between IQ and S.Q. in group with exogenous factors
mean IQ; while a t the other extreme of the scale where the mean IQ is 140, the mean S Q. is about 31 per cent lower than the mean I.Q. As we pass from either the lowest extreme of the scale to the highest or vice versa, there is a gradual approximation of the two quotients so that a t the IQ level of 84 there is no difference between the two quotients. That this was not an accidental'result is shown by the fact that a similar curve was obtained for each of the groups when arranged according to the final diagnosis.
...,.n.r> *.3.., I FIG. 5: Discrepancy between 1Q and S.Q.
dX Sb.
7 a# . i* d
sr
f n .) 3 60
i . *o 0 taa /M $0 60 po , s ~ ~ o iao /+o ---6--;&$ *~:4y+qnr&f$c$2 - - O + c r q a u y on entire 9-u) - p,sc.pa "r ,n2reup Uith
llet.r.4e.1. s 't. s
FIG. 7.,Discrepancy between IQ and S.Q. in group with endogenous factors
FIG. 8. Discrepancy between IQ and S.Q. in group with heterogeneous factors
LURtE, NEWBURGER, ROSENTHAL AND OUTCALT 1x5
Although some investigators believe that the Vineland Social Maturity scale and the Stanford Binet scale mesure the same quality, our results fail to support this belief. Examination of Figure 5 illustrates definite variations between the two at almost every IQ level. We note that the same tendency is present in the group when actual test findings alone are considered, as in Figure 5 , and also in
d 4
I L- - e.snpu) in s*cLn 9-p- ,--D;xraprcr) k tntira 9r-t - eix..pqinq.lt Wi tb h+-s - oixwpancy in 9.0~ W i t h
b i S O d O r 5 ef C . W .
FIG. 9. Discrepancy between IQ and S.Q. in group with psychoneuroses
Fro. 10. Discrepancy between IQ and S.Q. in group with disorders of C.N.S.
every subgroup into which the entire group is divided on the basis of diagnosis. This is demonstrated by the graphs in Figures 6 to I I .
Figure 6 represents the discrepancy between the IQ and S.Q. a t each IQ level in children with behavior disorders based primarliy upon exogenous or environ- mental factors. Figure 7 is concerned with the same discrepancy in those children suffering from endogenous causes.
Figure 8 is similarly concerned with those in which the exogenous and endog- enous causes are of approximately equal importance. Figures 9 to 1 1 inclusive show the same results in some of the subdivisions of the endogenous group.
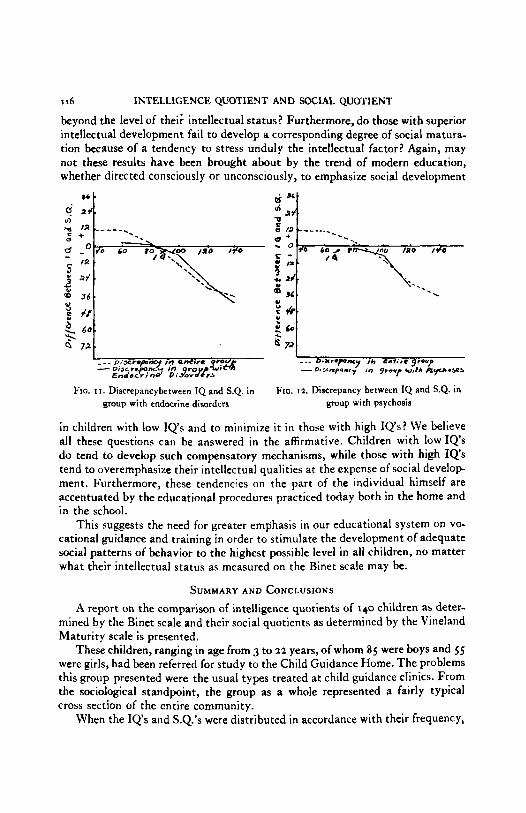
Figure I 2 is apparently an exception to this general tendency. This graph concerns itself with the group of children diagnosed as psychotic. The S.Q.'s of all these children are lower than their IQ's. In view of the nature of the patho- logical state, such a result is not a t all surprising and does not mitigate the sig- nificance of the other graphs.
From a study of these graphs we feel justified in drawing the conclusion that the two scales do not measure the same factors. We feel that the Binet test gives an indication of the intellectual capacity of an individual, while the Vineland Social Maturity scale provides us with the means for measuring the socially im- portanr patterns of behavior which the individual has acquired.
Assuming that this is true, what do the discrepancies in the findings between the two quotients signify? Do the children in the group with low IQ's tend to compensate for their retardation by the development of a social maturation
I 16 INTELLIGENCE QUOTIENT AND SOCIAL QUOTIENT
beyond the level of thei; intellectual status? Furthermore, do those with superior intellectual development fail to develop a corresponding degree of social matura- tion because of a tendency to stress unduly the intellectual factor? Again, may not these results have been brought about by the trend of modern education, whether directed consciously or unconsciously, to emphasize social development
Q 72 "i FIG. 1 1 . Discrepancybetween IQ and S.Q. in
group with endocrine disorders FIG. 12. Discrepancy between IQ and S.Q. in
group with psychosis
in children with low IQ's and to minimize it in those with high IQ's? We believe all these questions can be answered in the affirmative. Children with low IQ's do tend to develop such compensatory mechanisms, while those with high IQ's tend to overemphasize their intellectual qualities a t the expense of social develop ment. Furthermore, these tendencies on the part of the individual himself are accentuated by the educational procedures practiced today both in the home and in the school.
This suggests the need for greater emphasis in our educational system on VO-
cational guidance and training in order to stimulate the development of adequate social patterns of behavior to the highest possible level in all children, no matter what their intellectual status as measured on the Binet scale may be.
SUMMARY A N D CONCLUSIONS A report on the comparison of intelligence quotients of 140 children as deter-
mined by the Binet scale and their social quotients as determined by the Vineland Maturity scale is presented.
These children, ranging in age from 3 to 22 years, of whom 85 were boys and 5s were girls, had been referred for study to the Child Guidance Home. The problems this group presented were the usual types treated at child guidance clinics. From the sociological standpoint, the group as a whole represented a fairly typical cross section of the entire community.
When the IQ's and S.Q.'s were distributed in accordance with their frequency,
LURIE. NEWBURGER, 'ROSENTHAL AND OUTCALT
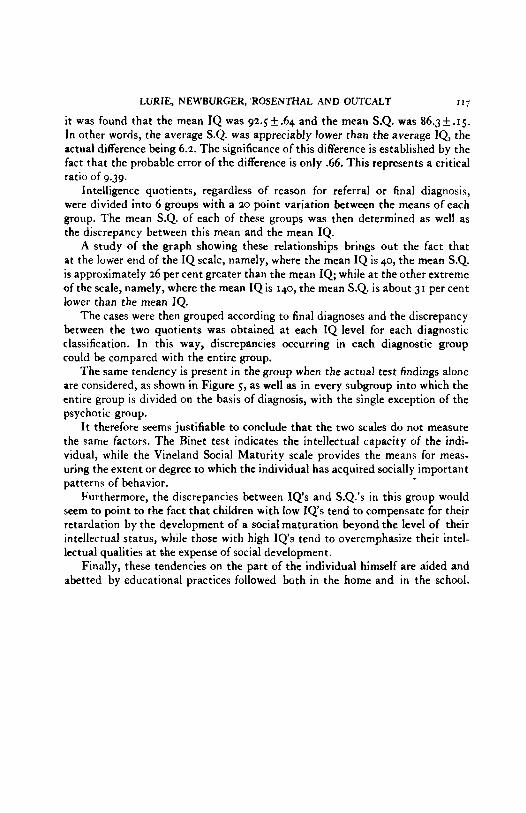
it was found that the mean IQ was 92.5 + .64 and the mean S.Q. was 86.3 f .15.
In other words, the average S.Q. was appreciably lower than the average IQ, the actual difference being 6.2. The significance of this difference is established by the fact that the probable error of the difference is only .66. This represents a critical ratio of 9.39.
Intelligence quotients, regardless of reason for referral or final diagnosis, were divided into 6 groups with a 20 point variation between the means of each group. The mean S.Q. of each of these groups was then determined as well as the discrepancy between this mean and the mean IQ.
A study of the graph showing these relationships brings out the fact that at the lower end of the IQ scale, namely, where the mean IQ is 40, the mean S.Q. is approximately 26 per cent greater than the mean IQ; while a t the other extreme of the scale, namely, where the mean IQ is 140, the mean S.Q. is about 31 per cent lower than the mean IQ.
The cases were then grouped according to final diagnoses and the discrepancy between the two quotients was obtained a t each IQ level for each diagnostic classification. I n this way, discrepancies occurring in each diagnostic group could be compared with the entire group.
The same tendency is present in the group when the actual test findings alone are considered, as shown in Figure 5, as well as in every subgroup into which the entire group is divided on the basis of diagnosis, with the single exception of the psychotic group.
I t therefore seems justifiable to conclude that the two scales do not measure the same factors. The Rinet test indicates the intellectual capacity of the indi- vidual, while the Vineland Social Maturity scale provides the means for meas- uring the extent or degree to which the individual has acquired socially important patterns of behavior.
Furthermore, the discrepancies between I Q s and S.Q.'s in this group would seem to point to the fact that children with low IQ's tend to compensate for their retardation by the development of a social maturation beyond the level of their intellectual status, while those with high IQ's tend to overemphasize their intel- lectual qualities a t &he expense of social development.
Finally, these tendencies on the part of the individual himself are aided and abetted by educational practices followed both in the home and in the school.
"7