Embed Size (px)
Citation preview
Value Based Payment Advisory Group –Services for the Intellectually/Developmentally Disabled
I/DD VBP Advisory Group Meeting 1Meeting Date: January 21, 2016 - 1 – 4pm
January 2016

2January 2016
Introductions
3January 2016
Part I
A. Intellectually/Developmentally Disabled (I/DD) VBP Advisory Group Overview
4January 2016
I/DD VBP Advisory Group in Context
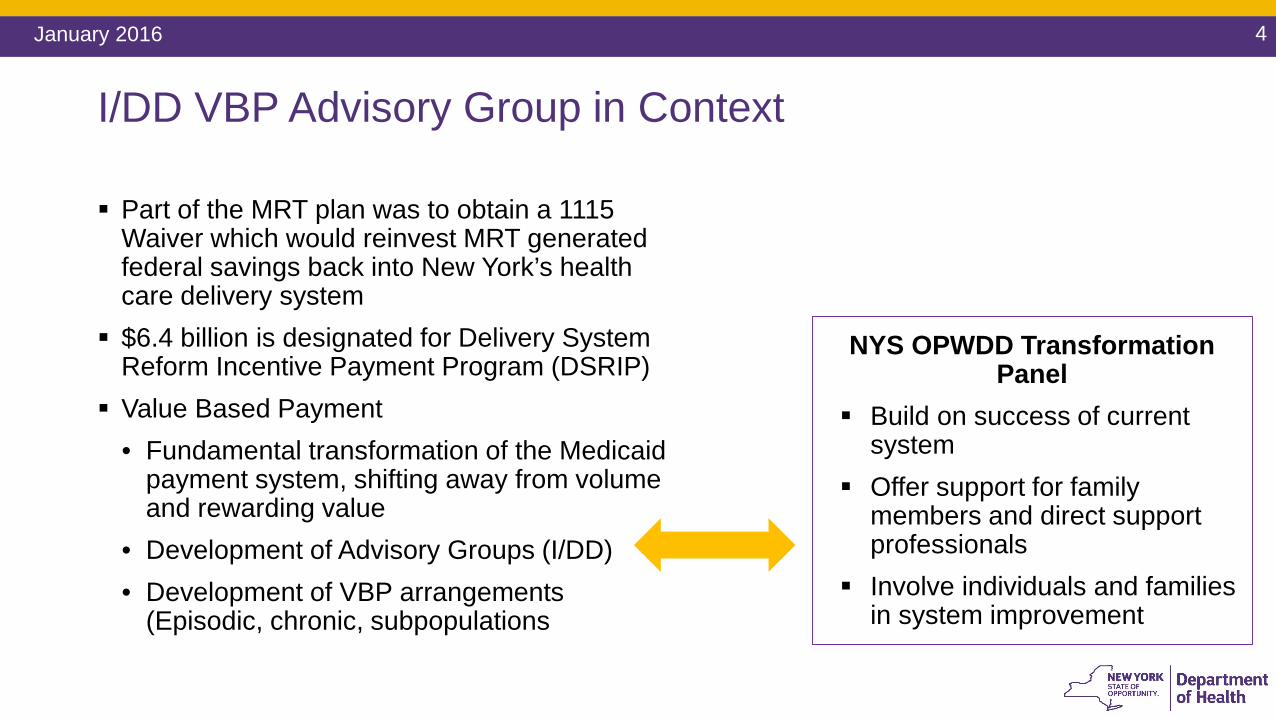
Part of the MRT plan was to obtain a 1115 Waiver which would reinvest MRT generated federal savings back into New York’s health care delivery system
$6.4 billion is designated for Delivery System Reform Incentive Payment Program (DSRIP)
Value Based Payment • Fundamental transformation of the Medicaid
payment system, shifting away from volume and rewarding value
• Development of Advisory Groups (I/DD)• Development of VBP arrangements
(Episodic, chronic, subpopulations
NYS OPWDD Transformation Panel
Build on success of current system
Offer support for family members and direct support professionals
Involve individuals and families in system improvement
5January 2016
I/DD VBP Advisory Group Composition
Comprehensive Stakeholder Engagement Comprehensive stakeholder engagement
has been a key component to the development of the Value Based Payment Roadmap.
We will continue engaging stakeholders as we develop and define opportunities for value based payment arrangements.
Composition of the I/DD VBP AG includes: Experience and knowledge focused on the
specific care or condition being discussed
Industry knowledge and experience
Geographic diversity
Total care spectrum as it relates to the specific care or condition being discussed
6January 2016
I/DD VBP Advisory Group (I/DD VBP AG): Objectives
Understand the State’s visions for the Roadmap to Value Based Payment
Review VBP arrangement for people with I/DD receiving services
Make recommendations to the State on:• Quality measures • Data and other support required for
providers to be successful• Other implementation details related to
VBP
Definitions are standard, but financial arrangements between plans and providers around the bundles are not set by the State
7January 2016
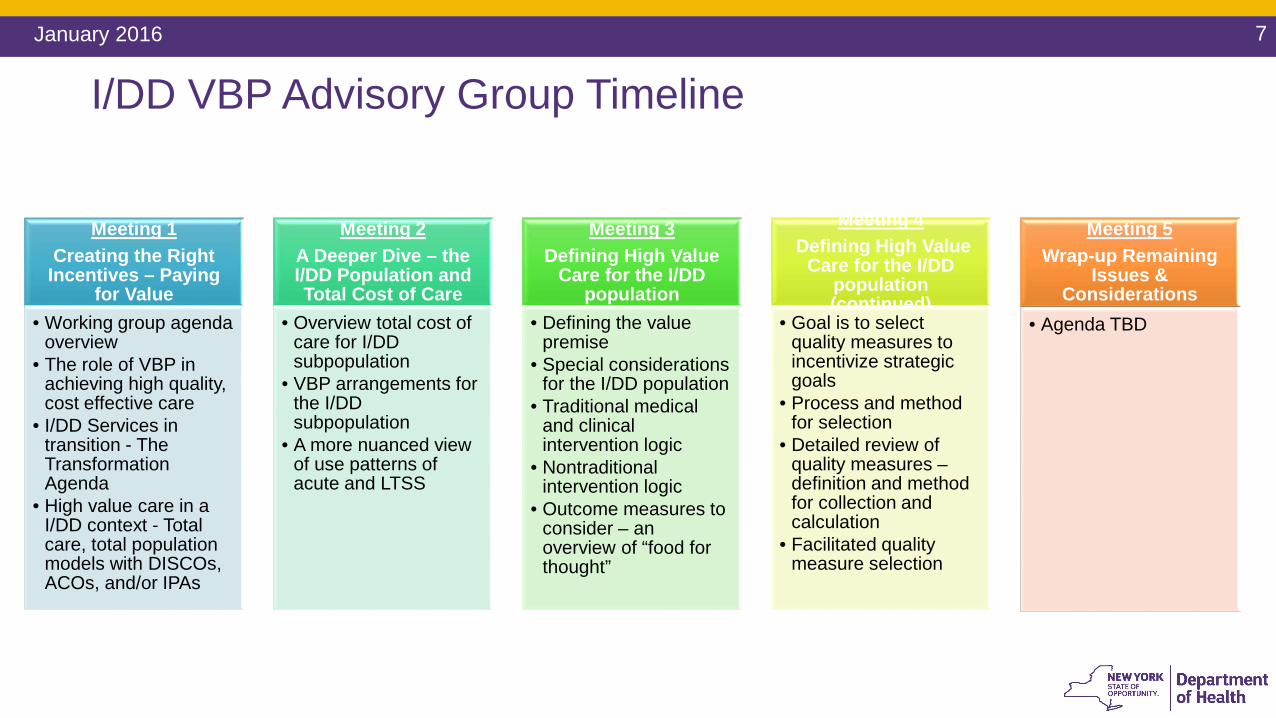
Meeting 1Creating the Right
Incentives – Paying for Value
• Working group agenda overview
• The role of VBP in achieving high quality, cost effective care
• I/DD Services in transition - The Transformation Agenda
• High value care in a I/DD context - Total care, total population models with DISCOs, ACOs, and/or IPAs
Meeting 2A Deeper Dive – the I/DD Population and Total Cost of Care
• Overview total cost of care for I/DD subpopulation
• VBP arrangements for the I/DD subpopulation
• A more nuanced view of use patterns of acute and LTSS
Meeting 3Defining High Value
Care for the I/DD population
• Defining the value premise
• Special considerations for the I/DD population
• Traditional medical and clinical intervention logic
• Nontraditional intervention logic
• Outcome measures to consider – an overview of “food for thought”
Meeting 4Defining High Value
Care for the I/DD population (continued)
• Goal is to select quality measures to incentivize strategic goals
• Process and method for selection
• Detailed review of quality measures –definition and method for collection and calculation
• Facilitated quality measure selection
Meeting 5Wrap-up Remaining
Issues & Considerations
• Agenda TBD
I/DD VBP Advisory Group Timeline
8January 2016
Part II
A. The Role of VBP in Achieving Quality, Cost Effective Care
9January 2016
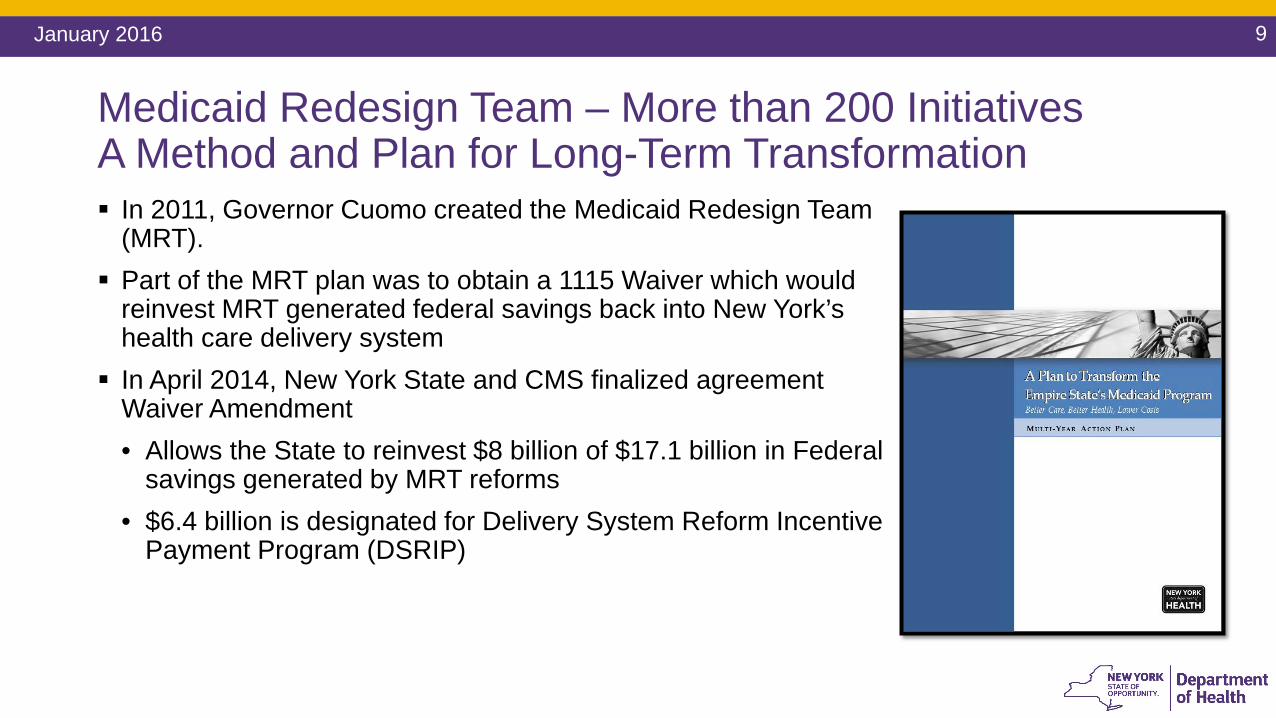
Medicaid Redesign Team – More than 200 InitiativesA Method and Plan for Long-Term Transformation In 2011, Governor Cuomo created the Medicaid Redesign Team
(MRT). Part of the MRT plan was to obtain a 1115 Waiver which would
reinvest MRT generated federal savings back into New York’s health care delivery system
In April 2014, New York State and CMS finalized agreement Waiver Amendment• Allows the State to reinvest $8 billion of $17.1 billion in Federal
savings generated by MRT reforms• $6.4 billion is designated for Delivery System Reform Incentive
Payment Program (DSRIP)
10January 2016
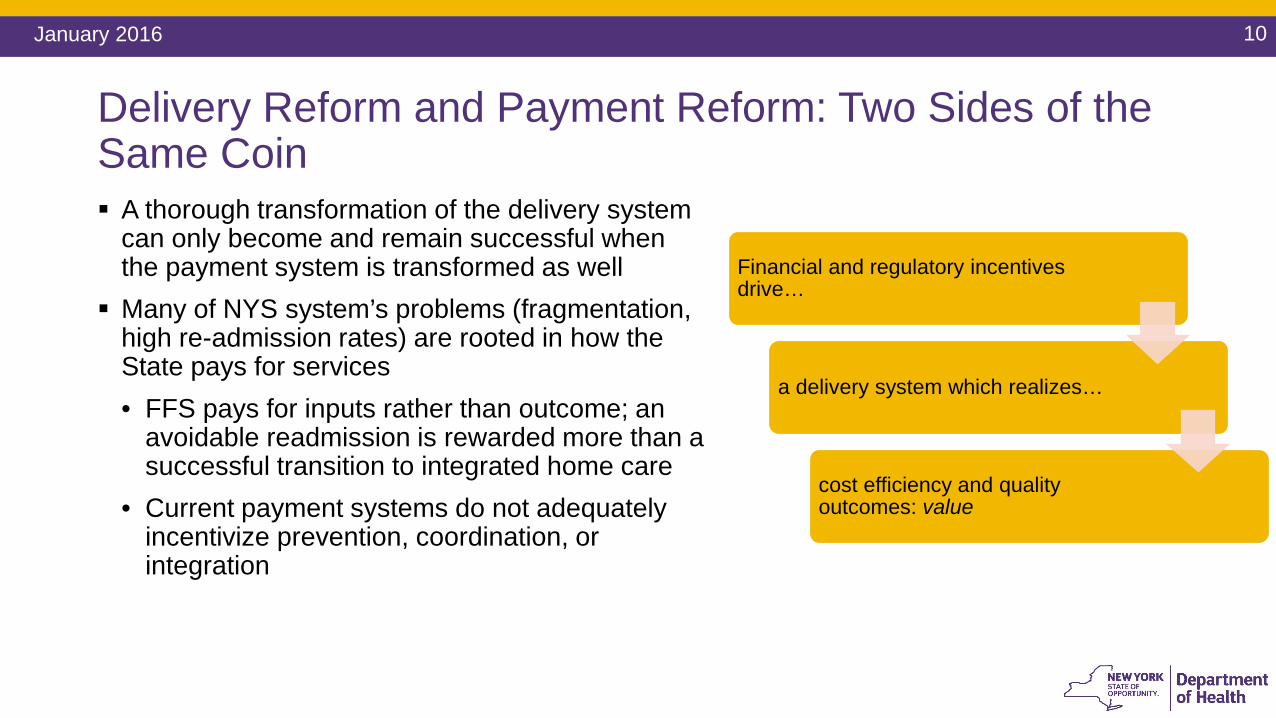
Delivery Reform and Payment Reform: Two Sides of the Same Coin A thorough transformation of the delivery system
can only become and remain successful when the payment system is transformed as well
Many of NYS system’s problems (fragmentation, high re-admission rates) are rooted in how the State pays for services• FFS pays for inputs rather than outcome; an
avoidable readmission is rewarded more than a successful transition to integrated home care
• Current payment systems do not adequately incentivize prevention, coordination, or integration
Financial and regulatory incentives drive…
a delivery system which realizes…
cost efficiency and quality outcomes: value
11January 2016
Payment Reform: Moving Towards Value Based Payments A Five-Year Roadmap outlining NYS’ plan for Medicaid Payment
Reform was required by the MRT Waiver By DSRIP Year 5 (2019), all Managed Care Organizations must
employ non fee-for-service payment systems that reward value over volume for at least 80-90% of their provider payments (outlined in the Special Terms and Conditions of the waiver)
The State and CMS have committed to the Roadmap Core Stakeholders (providers, MCOs, unions, patient
organizations) have actively collaborated in the creation of the Roadmap
If Roadmap goals are not met, overall DSRIP dollars from CMS to NYS will be significantly reduced
12January 2016
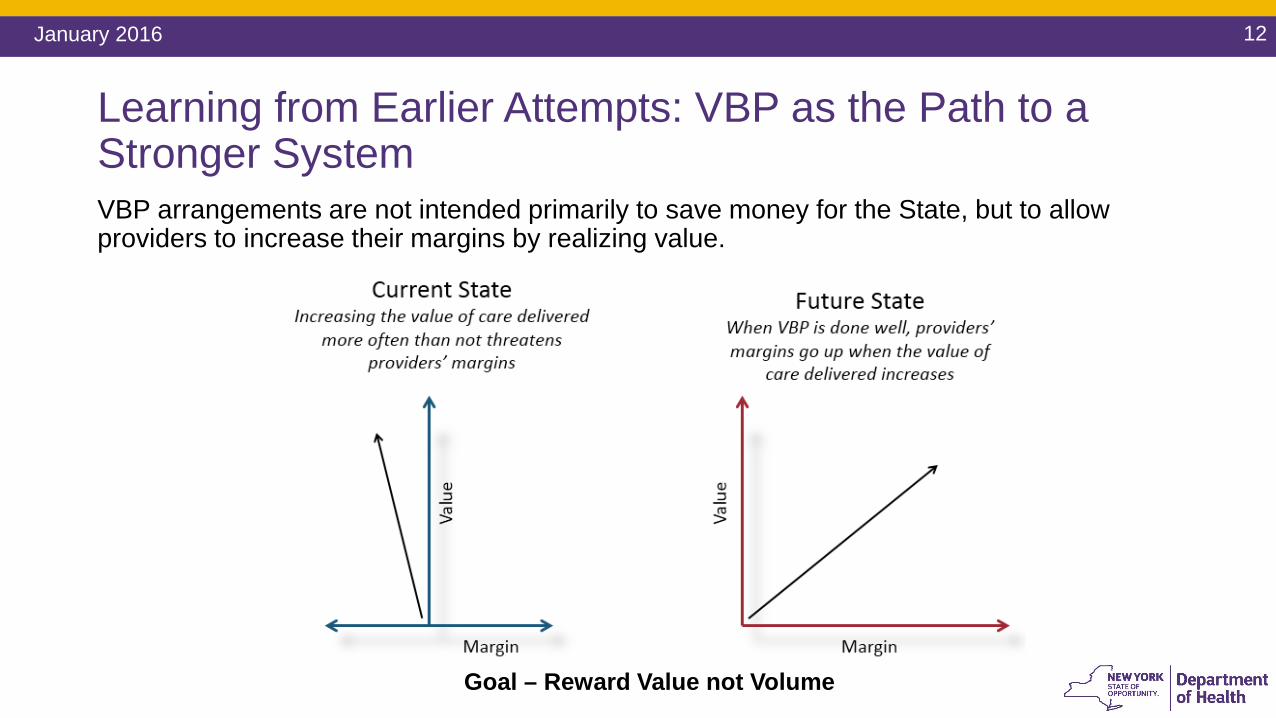
Learning from Earlier Attempts: VBP as the Path to a Stronger SystemVBP arrangements are not intended primarily to save money for the State, but to allow providers to increase their margins by realizing value.
Goal – Reward Value not Volume
13January 2016
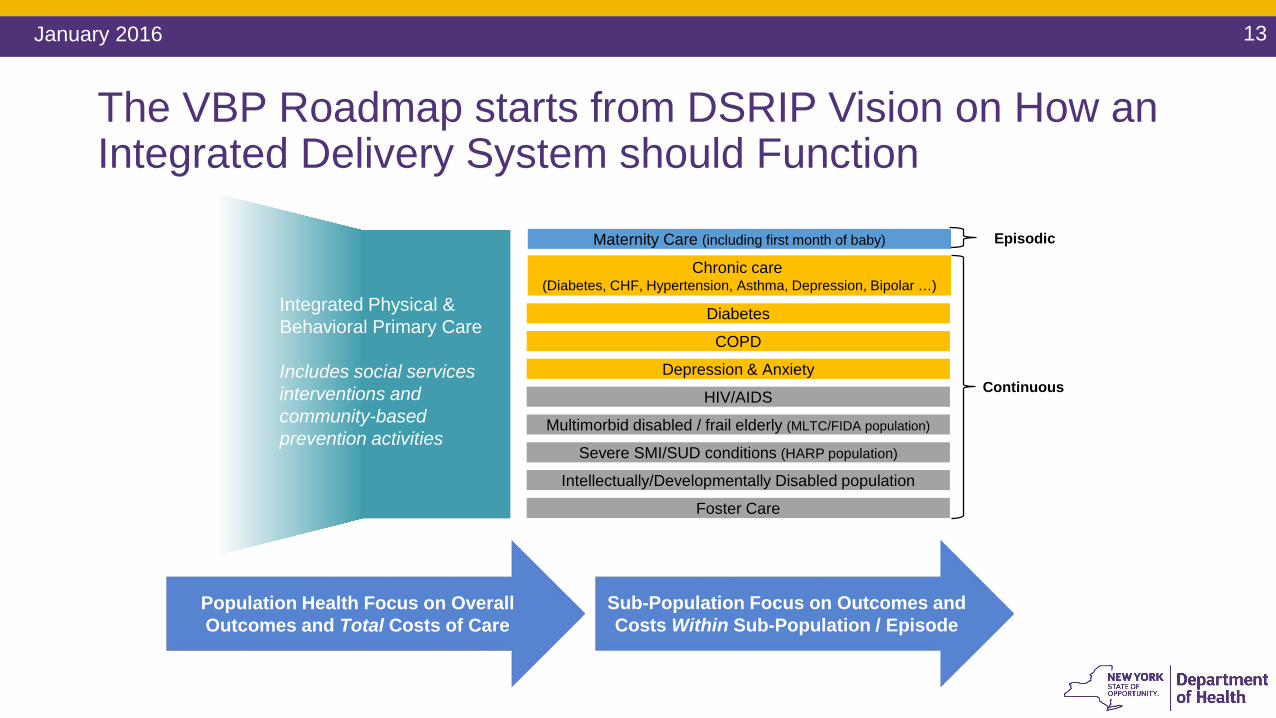
The VBP Roadmap starts from DSRIP Vision on How an Integrated Delivery System should Function
Episodic
Continuous
Sub-Population Focus on Outcomes and Costs Within Sub-Population / Episode
Depression & Anxiety
Foster Care
Integrated Physical & Behavioral Primary Care
Includes social services interventions and community-based prevention activities
Chronic care (Diabetes, CHF, Hypertension, Asthma, Depression, Bipolar …)
Multimorbid disabled / frail elderly (MLTC/FIDA population)
Severe SMI/SUD conditions (HARP population)
Intellectually/Developmentally Disabled population
Maternity Care (including first month of baby)
Diabetes
COPD
HIV/AIDS
Population Health Focus on Overall Outcomes and Total Costs of Care
14January 2016
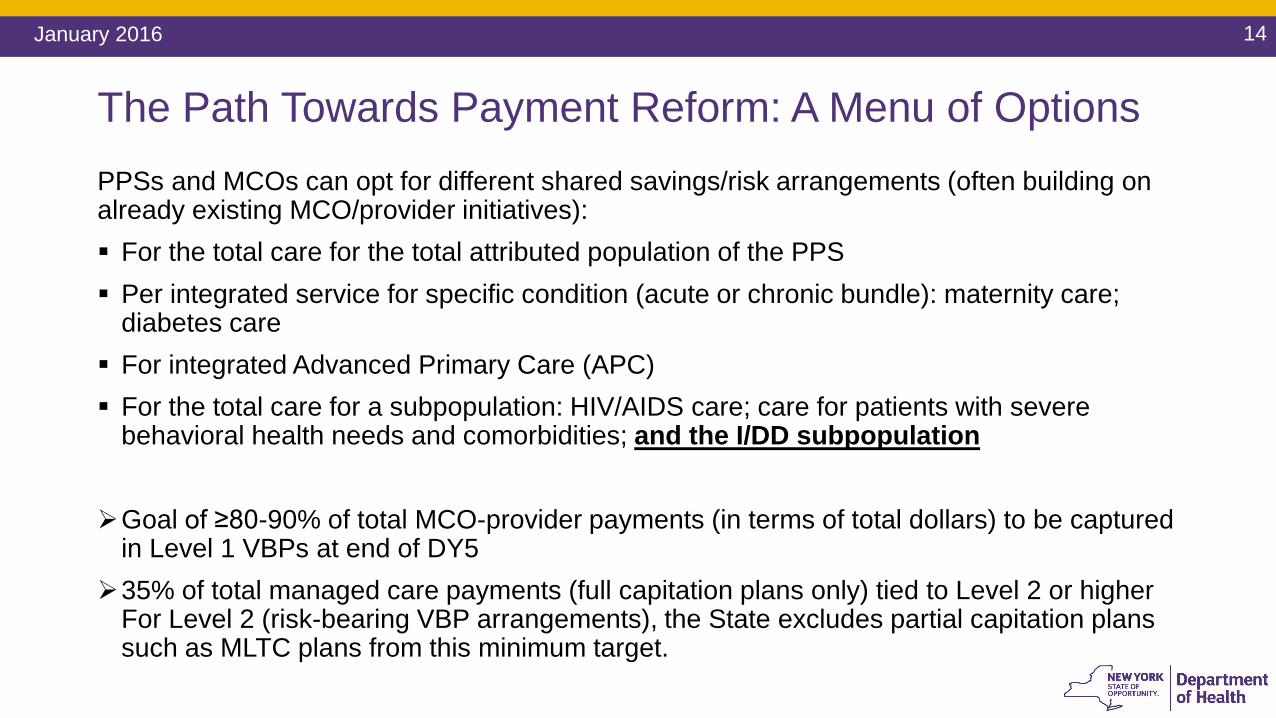
The Path Towards Payment Reform: A Menu of OptionsPPSs and MCOs can opt for different shared savings/risk arrangements (often building on already existing MCO/provider initiatives): For the total care for the total attributed population of the PPS Per integrated service for specific condition (acute or chronic bundle): maternity care;
diabetes care For integrated Advanced Primary Care (APC) For the total care for a subpopulation: HIV/AIDS care; care for patients with severe
behavioral health needs and comorbidities; and the I/DD subpopulation
Goal of ≥80-90% of total MCO-provider payments (in terms of total dollars) to be captured in Level 1 VBPs at end of DY5
35% of total managed care payments (full capitation plans only) tied to Level 2 or higher For Level 2 (risk-bearing VBP arrangements), the State excludes partial capitation plans such as MLTC plans from this minimum target.
15January 2016
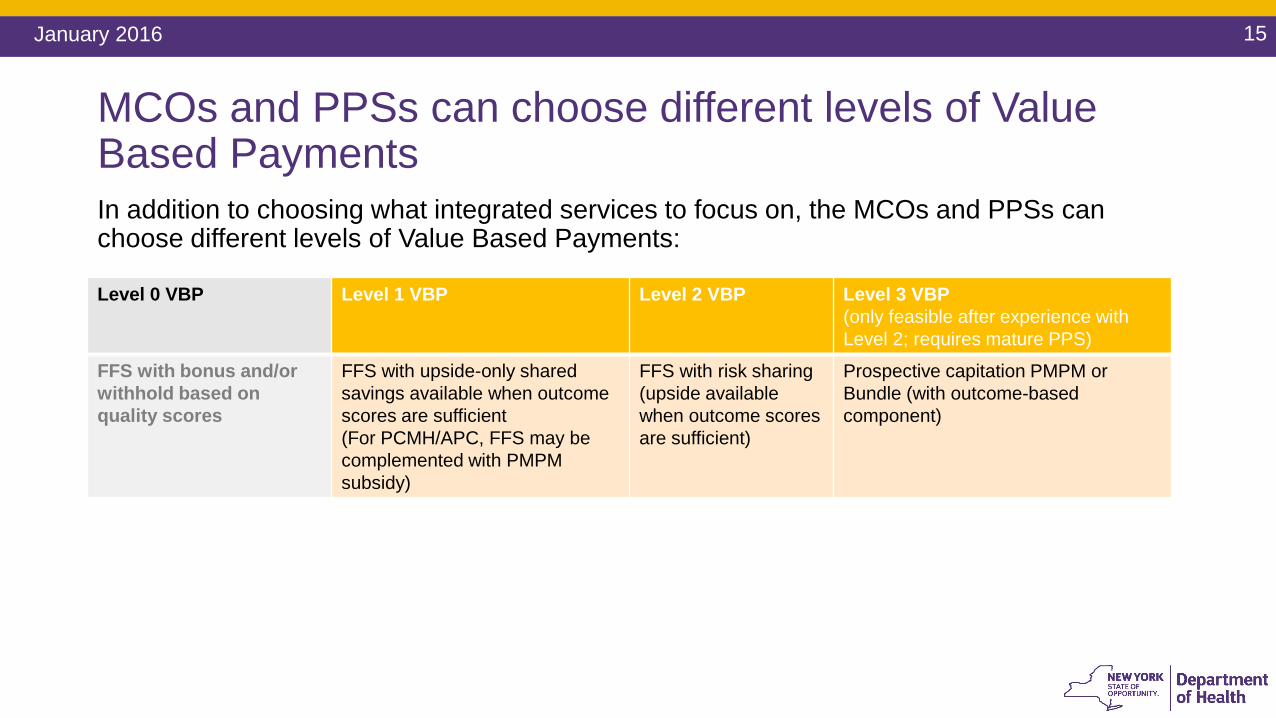
MCOs and PPSs can choose different levels of Value Based PaymentsIn addition to choosing what integrated services to focus on, the MCOs and PPSs can choose different levels of Value Based Payments:
Level 0 VBP Level 1 VBP Level 2 VBP Level 3 VBP (only feasible after experience with Level 2; requires mature PPS)
FFS with bonus and/or withhold based on quality scores
FFS with upside-only shared savings available when outcome scores are sufficient(For PCMH/APC, FFS may be complemented with PMPM subsidy)
FFS with risk sharing(upside availablewhen outcome scores are sufficient)
Prospective capitation PMPM or Bundle (with outcome-based component)
16January 2016
Key Defining Factors of the New York VBP Approach
1. Addressing all of the Medicaid program in a holistic, all-encompassing approach rather than a pilot or piecemeal plan
2. Leveraging the Managed Care Organizations (MCO) to deliver the payment reforms jointly with the providers
3. Addressing the need to change provider business models through positive financial incentives
4. Allowing for maximum flexibility in the implementation for stakeholders while maintaining a robust, standardized framework
5. Maximum focus on transparency of costs and outcomes of care
17January 2016
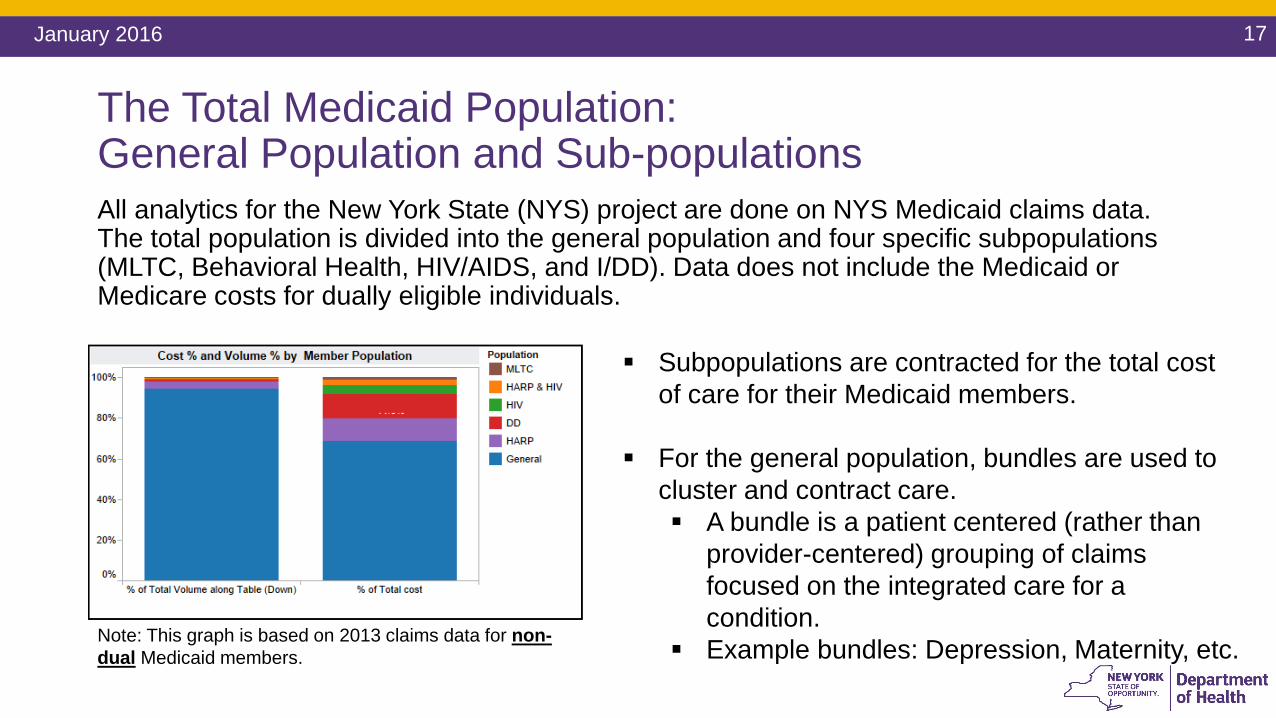
The Total Medicaid Population: General Population and Sub-populationsAll analytics for the New York State (NYS) project are done on NYS Medicaid claims data. The total population is divided into the general population and four specific subpopulations (MLTC, Behavioral Health, HIV/AIDS, and I/DD). Data does not include the Medicaid or Medicare costs for dually eligible individuals.
Subpopulations are contracted for the total cost of care for their Medicaid members.
For the general population, bundles are used to cluster and contract care. A bundle is a patient centered (rather than
provider-centered) grouping of claims focused on the integrated care for a condition.
Example bundles: Depression, Maternity, etc.Note: This graph is based on 2013 claims data for non-dual Medicaid members.
18January 2016
Developing a Subpopulation VBP Arrangement –The Need to Identify Quality MeasuresQuality measures will be used to determine the level of quality of care, and ultimately, will inform opportunity for savings when the quality metrics have been achieved.1. Identify existing quality measures: QARR, HEDIS, DSRIP, NQF, etc.2. Analyze additional sources of quality measure sources, specific to the subpopulation.3. Gather appropriate quality measures for inclusion in the subpopulation VBP
arrangement, based on clinical relevance, reliability & validity, and feasibility.4. Prioritize quality measures for incorporation into the VBP Pilot phase and subsequent
VBP implementation phase.
19January 2016
Part III
A. I/DD Services in Transition - The Transformation Agenda
• “Changing complex systems is never easy or fast, but in Managed Care and Value Based Payments we have models based on the simple idea that rewarding good outcomes and containing costs in a measurably effective system works for all: it makes sense for each individual and for everyone who depends on the system of care, now and for years to come.” (Draft Recommendations, p. 5)
20January 2016
Transformation Panel Draft Recommendations: The Imperative to TransformThe transformed system must: Build on the successes of the current system in helping the individuals OPWDD supports
participate as citizens in the community whenever possible; Offer support for the family members and the direct support professionals who are the
foundation of our systems of care; Involve individuals and families as much as possible.
Note: The data and analysis in the next section are from the State of the States in Developmental Disabilities, which is a comparative, longitudinal study of states’ performance in financing intellectual and developmental disabilities (I/DD) services and supports. The study is primarily funded by the U.S. Administration on Intellectual and Developmental Disabilities, U.S. Department of Health and Human Services. The Project is located in Boulder, Colorado at the Coleman Institute for Cognitive Disabilities and administered by the University of Colorado Department of Psychiatry in the CU School of Medicine. The Project maintains a 35‐year I/DD data set on all 50 states, DC, and preliminary data on the U.S. Territories, and can be accessed at http://www.stateofthestates.org/index.php/publications1/technical-reports
21January 2016
Transformation Panel Draft Recommendations: The Shared VisionAll future program models and system corrections should be grounded in the following principles: Does it help promote the integration of people and services into the community? Does it encourage the active involvement of people with disabilities and their families? Does it broaden the range of choices and options for individuals? Does it foster independence? Does it take those at the higher end of need into account? Does it use data to measure and evaluate quality and satisfaction? Is it clear and realistic in its language?
(Draft Recommendations, p. 19)
22January 2016
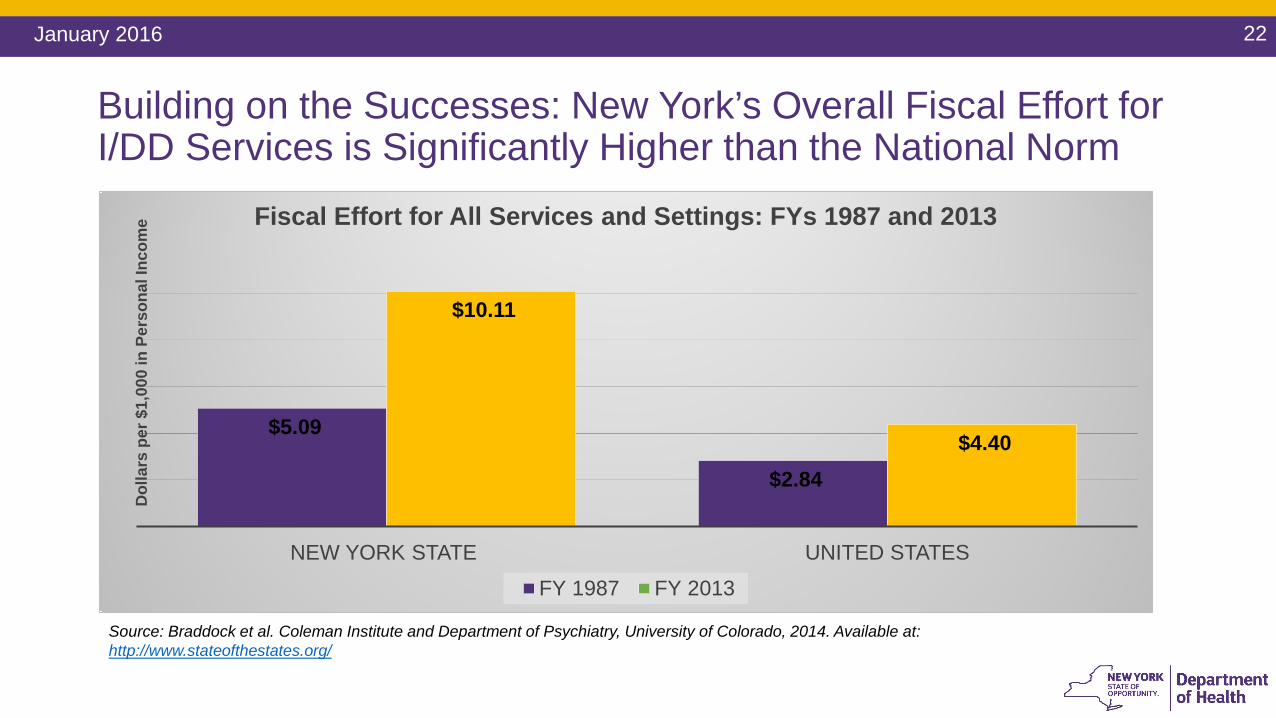
Building on the Successes: New York’s Overall Fiscal Effort for I/DD Services is Significantly Higher than the National Norm
$5.09
$2.84
$10.11
$4.40
NEW YORK STATE UNITED STATES
Dol
lars
per
$1,
000
in P
erso
nal I
ncom
e Fiscal Effort for All Services and Settings: FYs 1987 and 2013
FY 1987 FY 2013
Source: Braddock et al. Coleman Institute and Department of Psychiatry, University of Colorado, 2014. Available at: http://www.stateofthestates.org/
23January 2016
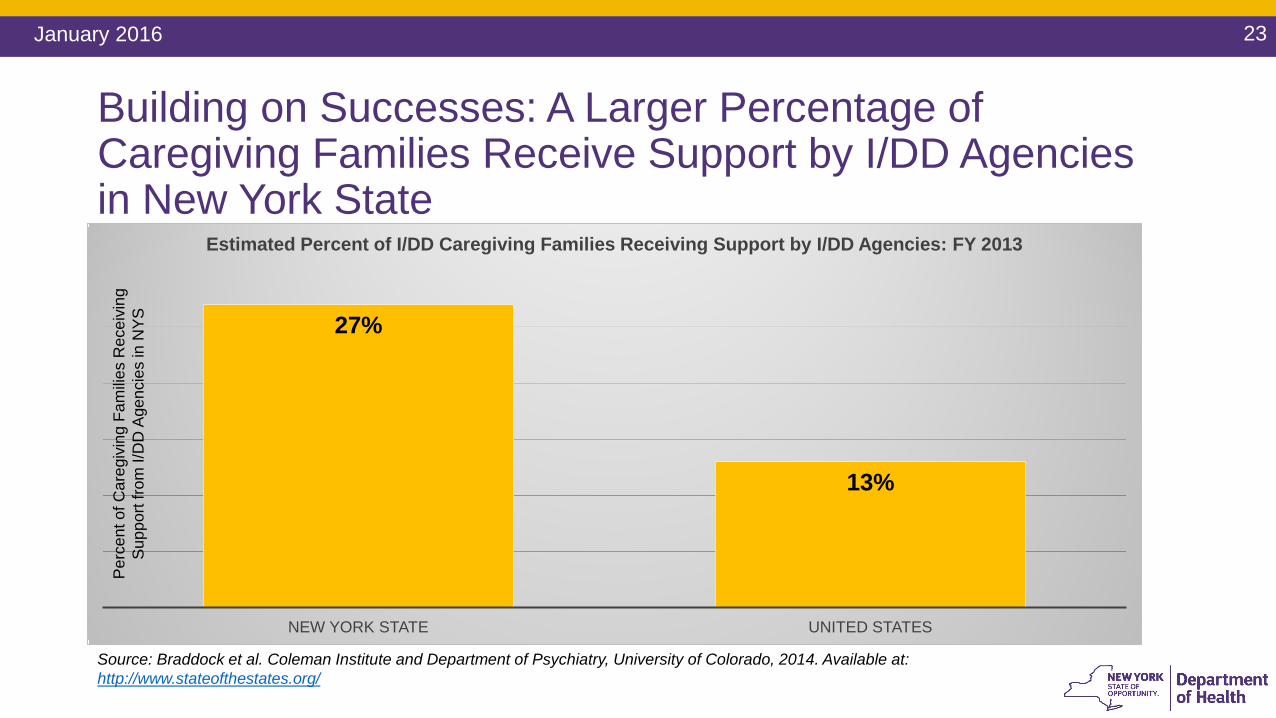
27%
13%
NEW YORK STATE UNITED STATES
Estimated Percent of I/DD Caregiving Families Receiving Support by I/DD Agencies: FY 2013
Source: Braddock et al. Coleman Institute and Department of Psychiatry, University of Colorado, 2014. Available at: http://www.stateofthestates.org/
Building on Successes: A Larger Percentage of Caregiving Families Receive Support by I/DD Agencies in New York State
Per
cent
of C
areg
ivin
g Fa
milie
s R
ecei
ving
S
uppo
rt fro
m I/
DD
Age
ncie
s in
NYS
24January 2016
Transformation Panel Draft Recommendations: Residential Support“…the era of one-size-fits-all models has passed—people want and need choices in how and where they live. Institutions were once the only option, but today the inclusion of people with developmental disabilities in the community is a real and achievable goal for many.” (Draft Recommendations, p. 13)
Residential support should: Establish a system of flexible housing supports; Ensure that individuals living at home and those living in institutional settings have access
to residential services based on need; Pursue an affordable housing strategy to increase investments/focus on statewide
investments in affordable housing for the I/DD population; Engage in outreach and community education; Work with Intermediate Care Facilities residents and providers ensure meaningful
opportunities for home and community-based services.
25January 2016
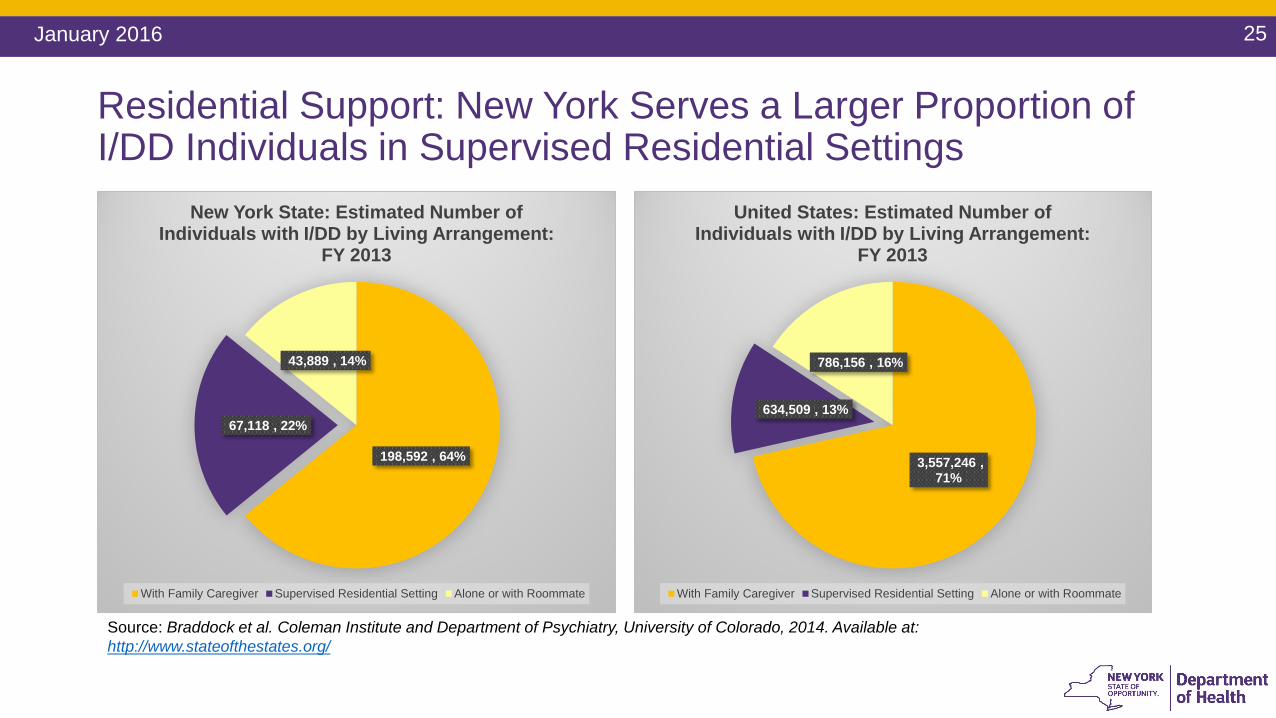
Residential Support: New York Serves a Larger Proportion of I/DD Individuals in Supervised Residential Settings
198,592 , 64%
67,118 , 22%
43,889 , 14%
New York State: Estimated Number of Individuals with I/DD by Living Arrangement:
FY 2013
With Family Caregiver Supervised Residential Setting Alone or with Roommate
3,557,246 , 71%
634,509 , 13%
786,156 , 16%
United States: Estimated Number of Individuals with I/DD by Living Arrangement:
FY 2013
With Family Caregiver Supervised Residential Setting Alone or with Roommate
Source: Braddock et al. Coleman Institute and Department of Psychiatry, University of Colorado, 2014. Available at: http://www.stateofthestates.org/
26January 2016
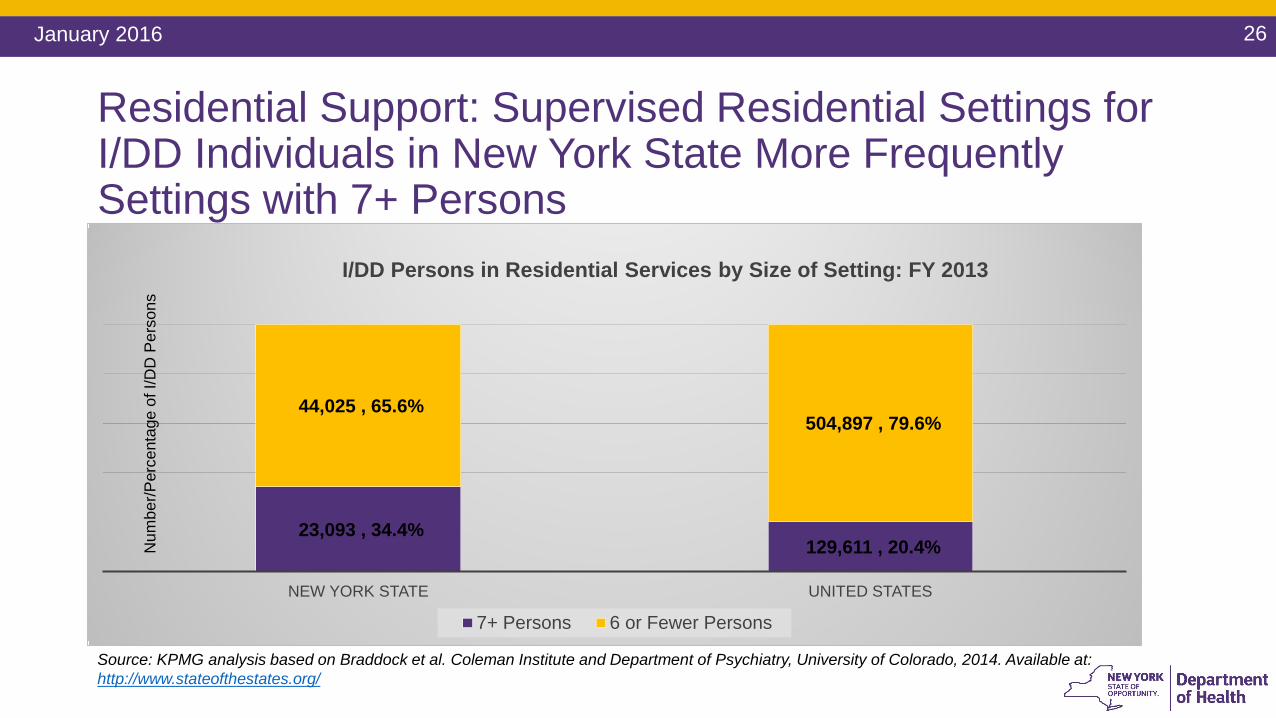
23,093 , 34.4%129,611 , 20.4%
44,025 , 65.6%504,897 , 79.6%
NEW YORK STATE UNITED STATES
I/DD Persons in Residential Services by Size of Setting: FY 2013
7+ Persons 6 or Fewer Persons
Source: KPMG analysis based on Braddock et al. Coleman Institute and Department of Psychiatry, University of Colorado, 2014. Available at: http://www.stateofthestates.org/
Residential Support: Supervised Residential Settings for I/DD Individuals in New York State More Frequently Settings with 7+ Persons
Num
ber/P
erce
ntag
e of
I/D
D P
erso
ns
27January 2016
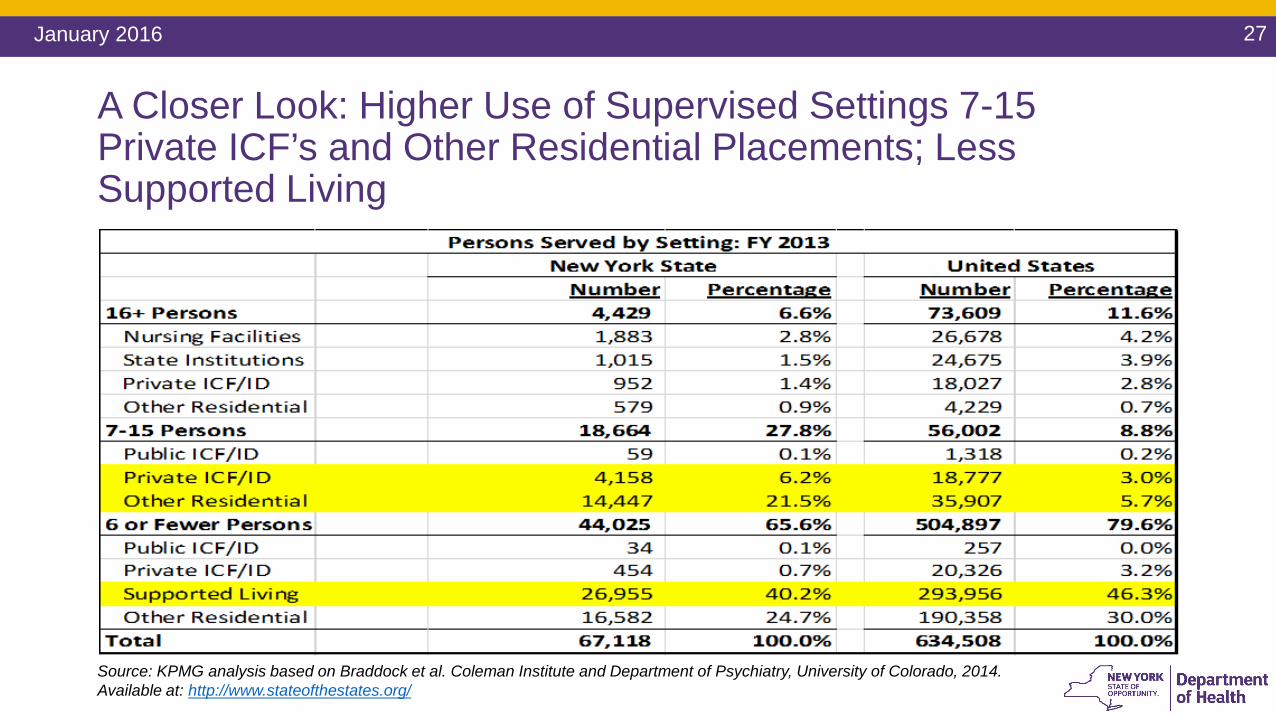
A Closer Look: Higher Use of Supervised Settings 7-15 Private ICF’s and Other Residential Placements; Less Supported Living
Source: KPMG analysis based on Braddock et al. Coleman Institute and Department of Psychiatry, University of Colorado, 2014. Available at: http://www.stateofthestates.org/
28January 2016
Transformation Panel Draft Recommendations: Employment and Life in the Community“There are many challenges and no quick fixes, but as we move away from a focus on group settings there is plenty of room for new approaches that promote real and meaningful involvement in community life.” (Draft Recommendations, p. 13)
Future programs and rules should: Develop a flexible day service model; Conduct a media campaign to encourage businesses to employ people with I/DD; Develop more volunteer opportunities to forge relationships in the community and pathways to
employment; Assist students in transition from high school to employment; Develop retirement strategies for those who may not want to pursue employment; Explore supplement transportation strategies such as on-demand services; Ensure continuity of employment for those involved in sheltered workshop transition; Set a percentage goal for the number of people with developmental disabilities employed by
OPWDD.
29January 2016
Transformation Panel Draft Recommendations: Self-Determination“Self-determination may not be the right service delivery option for everyone, but all of us like to have some control over our lives. That’s why our systems of support need to move away from a regimented approach to make choice a reality.” (Draft Recommendations, p. 13)In the future the system should: Simplify rules and requirements for self-direction; Establish a peer mentoring program to help individuals and families understand self-
direction; Ensure that funding is sufficient for individuals with higher needs to self-direct; Develop strategies to infuse self-determination in all aspects of OPWDD service delivery; Develop strategies to better utilize community resources available to the general public,
and foster relationships between people with developmental disabilities and their non-disabled peers.
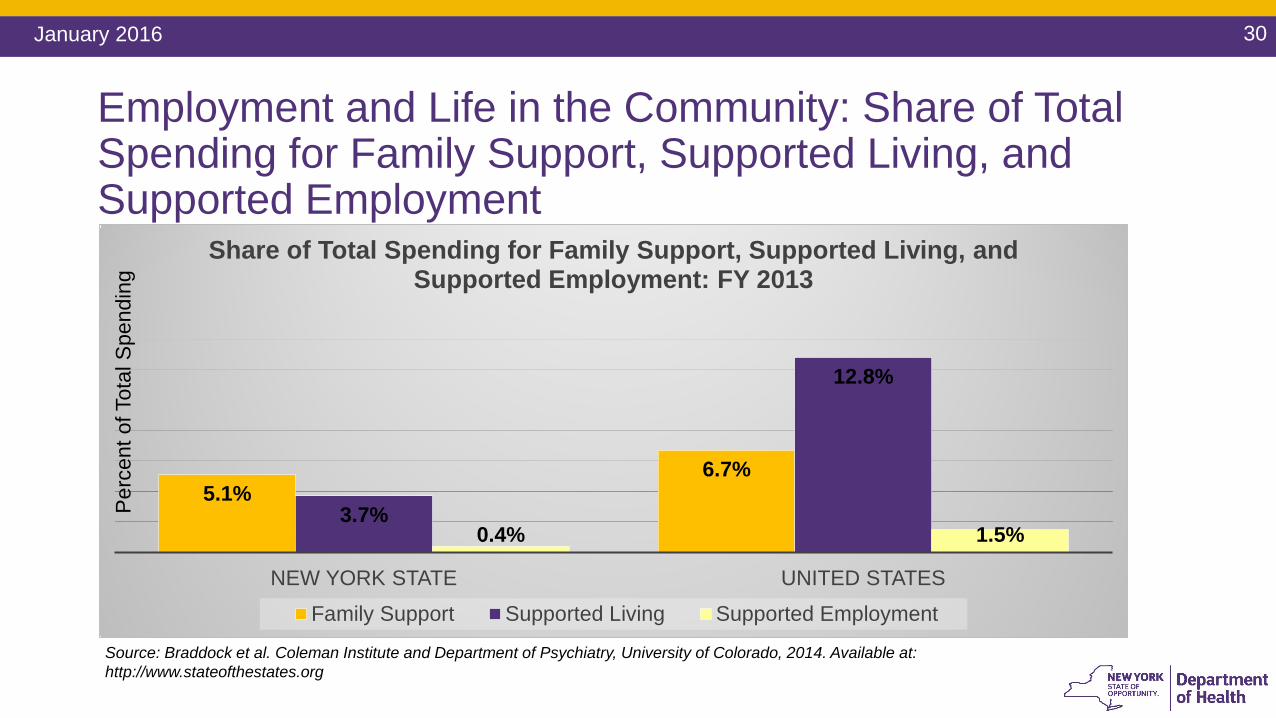
30January 2016
Employment and Life in the Community: Share of Total Spending for Family Support, Supported Living, and Supported Employment
5.1%6.7%
3.7%
12.8%
0.4% 1.5%
NEW YORK STATE UNITED STATES
Share of Total Spending for Family Support, Supported Living, and Supported Employment: FY 2013
Family Support Supported Living Supported Employment
Source: Braddock et al. Coleman Institute and Department of Psychiatry, University of Colorado, 2014. Available at: http://www.stateofthestates.org
Per
cent
of T
otal
Spe
ndin
g
31January 2016
Transformation Panel Draft Recommendations: Supporting Staff and Family Caregivers“People with disabilities are supported by family and friends as well as paid caregivers, and all these people deserve and need to be supported in turn. … Careful consideration needs to be given to ensure resources are available to families who are caring for their loved ones at home, and steps taken to address immediate needs as well as plan for long-term residential support.” (Draft Recommendations, p. 14)
Staff and Family Caregivers should be supported by the following: Implement a second phase of comprehensive training for Front Door staff to better equip them as
they develop effective service plans with individuals and families; Advocate for appropriate compensation for Direct Support Professionals; Implement the START crisis response model statewide; Implement care coordination in a way that incorporates the expertise of existing Medicaid Service
Coordinators; Explore creative models for supporting caregivers, including sharing resources among families Review respite needs; Engage in yearly outreach for those on the Residential Request List.
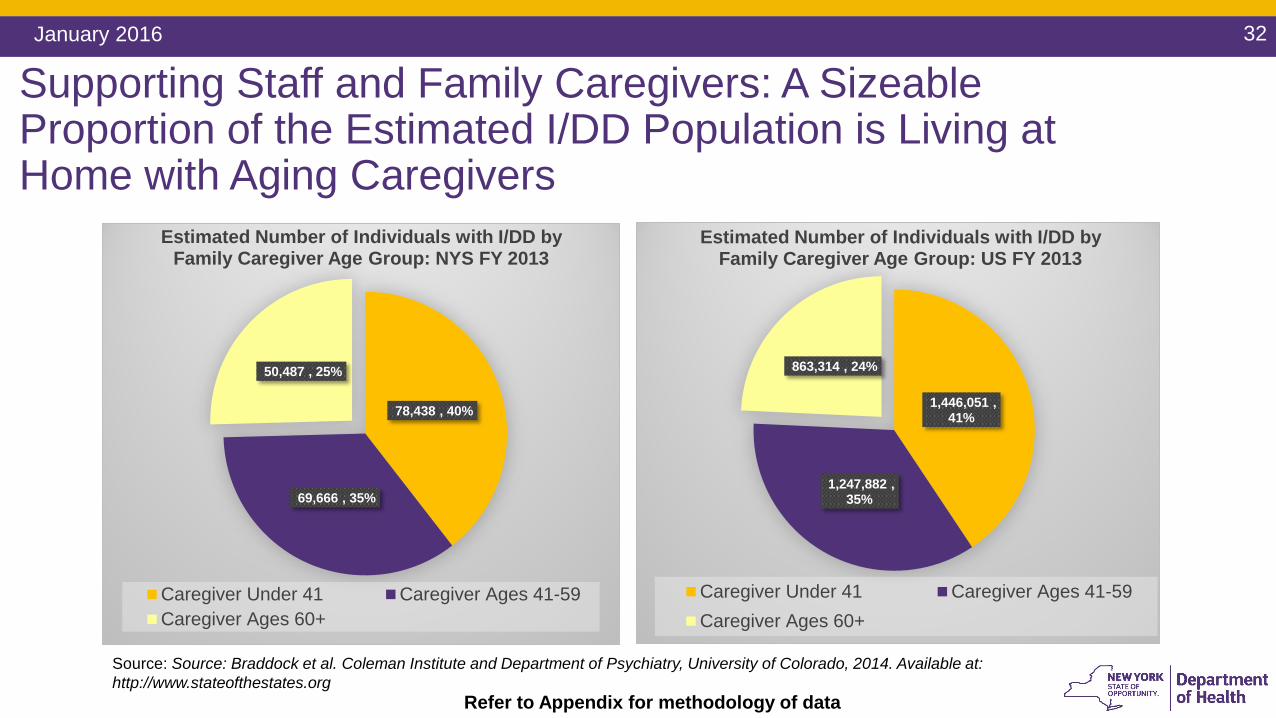
32January 2016
78,438 , 40%
69,666 , 35%
50,487 , 25%
Estimated Number of Individuals with I/DD by Family Caregiver Age Group: NYS FY 2013
Caregiver Under 41 Caregiver Ages 41-59Caregiver Ages 60+
Source: Source: Braddock et al. Coleman Institute and Department of Psychiatry, University of Colorado, 2014. Available at: http://www.stateofthestates.org
1,446,051 , 41%
1,247,882 , 35%
863,314 , 24%
Estimated Number of Individuals with I/DD by Family Caregiver Age Group: US FY 2013
Caregiver Under 41 Caregiver Ages 41-59Caregiver Ages 60+
Refer to Appendix for methodology of data
Supporting Staff and Family Caregivers: A Sizeable Proportion of the Estimated I/DD Population is Living at Home with Aging Caregivers
33January 2016
New York State’s Performance on the National Core Indicators New York State’s performance relative to other states is
reflected in the National Core Indicators (NCI) NCI is a voluntary effort by state developmental disability
agencies to gauge their own performance using a common and nationally validated set of measures.
NCI uses 100 standard performance measures (or “indicators”) to assess the outcomes of services provided to individuals and their families.
New York State NCI Standings New York State underperforms the NCI average in the
domains of individual choice and work. Access to transportation is also 10 points below the NCI
average. In the health domain, NYS does relatively well relative to
the NCI average.
34January 2016
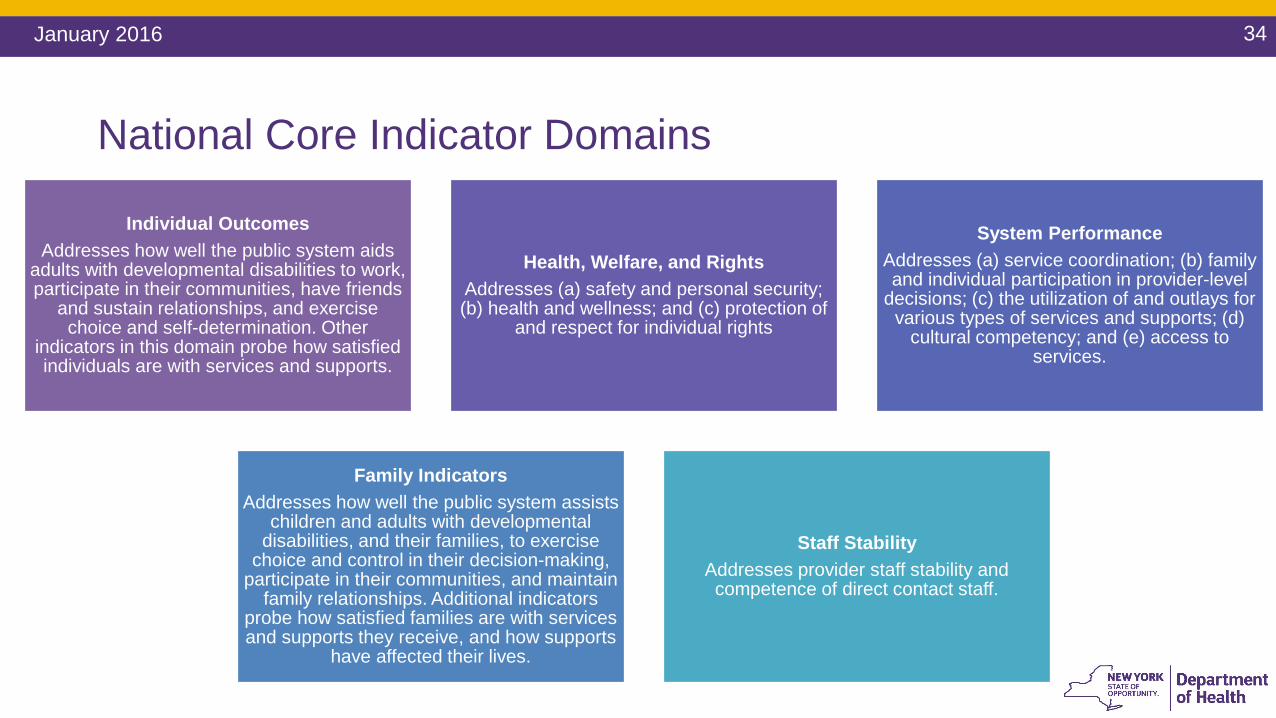
National Core Indicator Domains
Individual Outcomes Addresses how well the public system aids
adults with developmental disabilities to work, participate in their communities, have friends
and sustain relationships, and exercise choice and self-determination. Other
indicators in this domain probe how satisfied individuals are with services and supports.
Health, Welfare, and Rights Addresses (a) safety and personal security; (b) health and wellness; and (c) protection of
and respect for individual rights
System Performance Addresses (a) service coordination; (b) family and individual participation in provider-level
decisions; (c) the utilization of and outlays for various types of services and supports; (d)
cultural competency; and (e) access to services.
Family Indicators Addresses how well the public system assists
children and adults with developmental disabilities, and their families, to exercise
choice and control in their decision-making, participate in their communities, and maintain
family relationships. Additional indicators probe how satisfied families are with services and supports they receive, and how supports
have affected their lives.
Staff Stability Addresses provider staff stability and competence of direct contact staff.
35January 2016
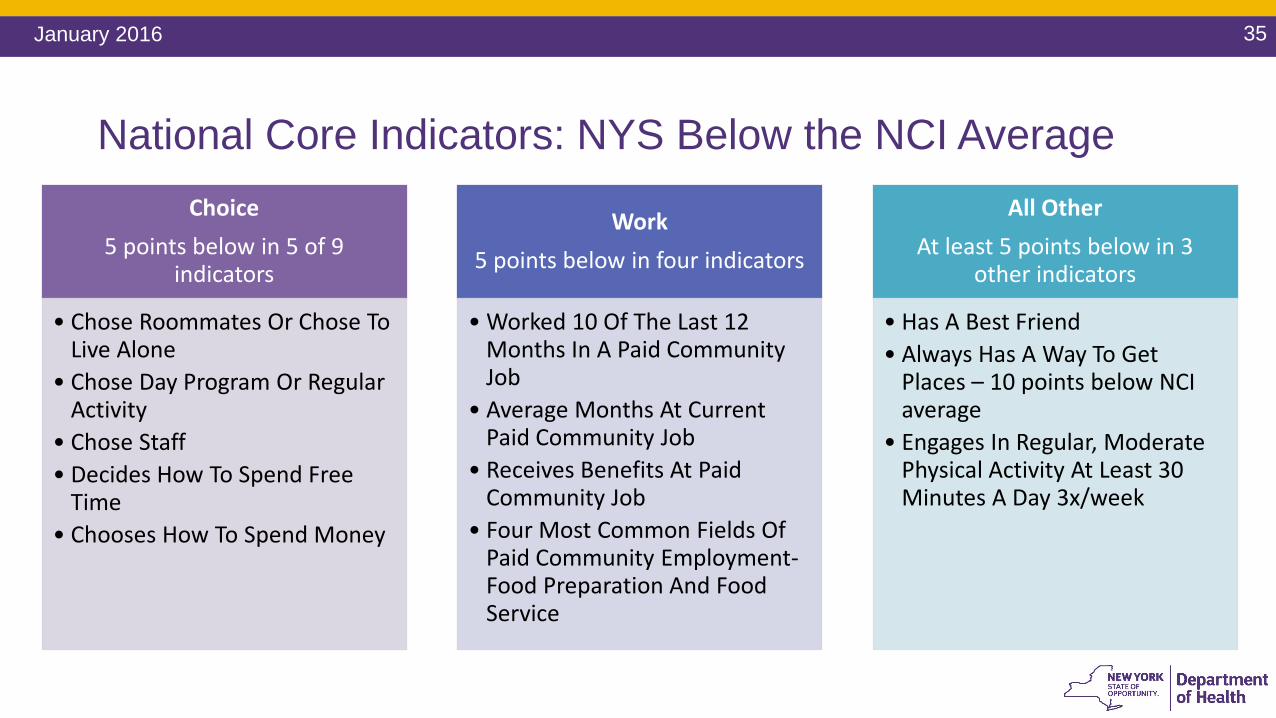
National Core Indicators: NYS Below the NCI AverageChoice
5 points below in 5 of 9 indicators
• Chose Roommates Or Chose To Live Alone
• Chose Day Program Or Regular Activity
• Chose Staff • Decides How To Spend Free
Time • Chooses How To Spend Money
Work 5 points below in four indicators
• Worked 10 Of The Last 12 Months In A Paid Community Job
• Average Months At Current Paid Community Job
• Receives Benefits At Paid Community Job
• Four Most Common Fields Of Paid Community Employment-Food Preparation And Food Service
All Other At least 5 points below in 3
other indicators
• Has A Best Friend • Always Has A Way To Get
Places – 10 points below NCI average
• Engages In Regular, Moderate Physical Activity At Least 30 Minutes A Day 3x/week
36January 2016
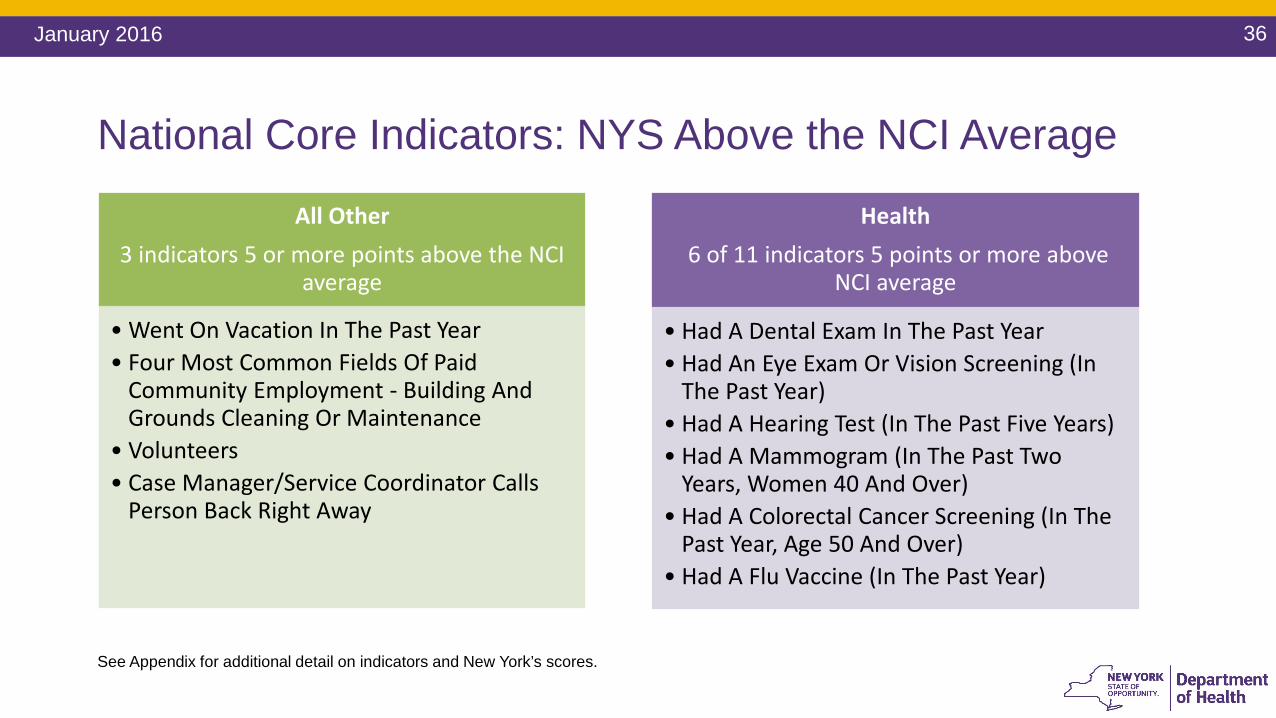
National Core Indicators: NYS Above the NCI Average
See Appendix for additional detail on indicators and New York’s scores.
All Other 3 indicators 5 or more points above the NCI
average
• Went On Vacation In The Past Year• Four Most Common Fields Of Paid
Community Employment - Building And Grounds Cleaning Or Maintenance
• Volunteers• Case Manager/Service Coordinator Calls
Person Back Right Away
Health 6 of 11 indicators 5 points or more above
NCI average
• Had A Dental Exam In The Past Year• Had An Eye Exam Or Vision Screening (In
The Past Year) • Had A Hearing Test (In The Past Five Years) • Had A Mammogram (In The Past Two
Years, Women 40 And Over) • Had A Colorectal Cancer Screening (In The
Past Year, Age 50 And Over) • Had A Flu Vaccine (In The Past Year)
37January 2016
Part IV- System Platforms
High value care in a DD context – Total care, total population models
• “We need modern, responsive and effective platforms to meet the varied demands of individuals and families. Our current system was built for a different time and now we need more streamlined and cost-effective alternatives. … By focusing on what works—by measuring outcomes and rewarding providers who achieve results for people—platforms like value based payments work for everyone.” (Draft Recommendations, p. 17)
38January 2016
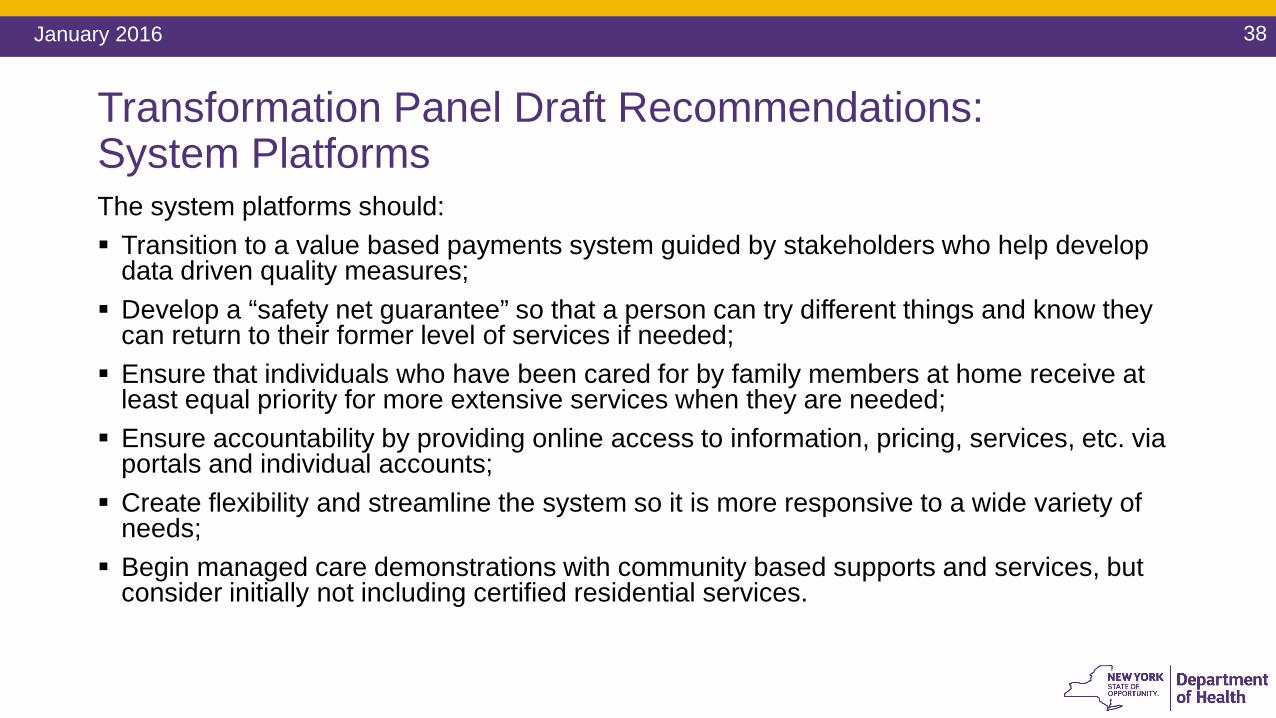
Transformation Panel Draft Recommendations: System PlatformsThe system platforms should: Transition to a value based payments system guided by stakeholders who help develop
data driven quality measures; Develop a “safety net guarantee” so that a person can try different things and know they
can return to their former level of services if needed; Ensure that individuals who have been cared for by family members at home receive at
least equal priority for more extensive services when they are needed; Ensure accountability by providing online access to information, pricing, services, etc. via
portals and individual accounts; Create flexibility and streamline the system so it is more responsive to a wide variety of
needs; Begin managed care demonstrations with community based supports and services, but
consider initially not including certified residential services.
39January 2016
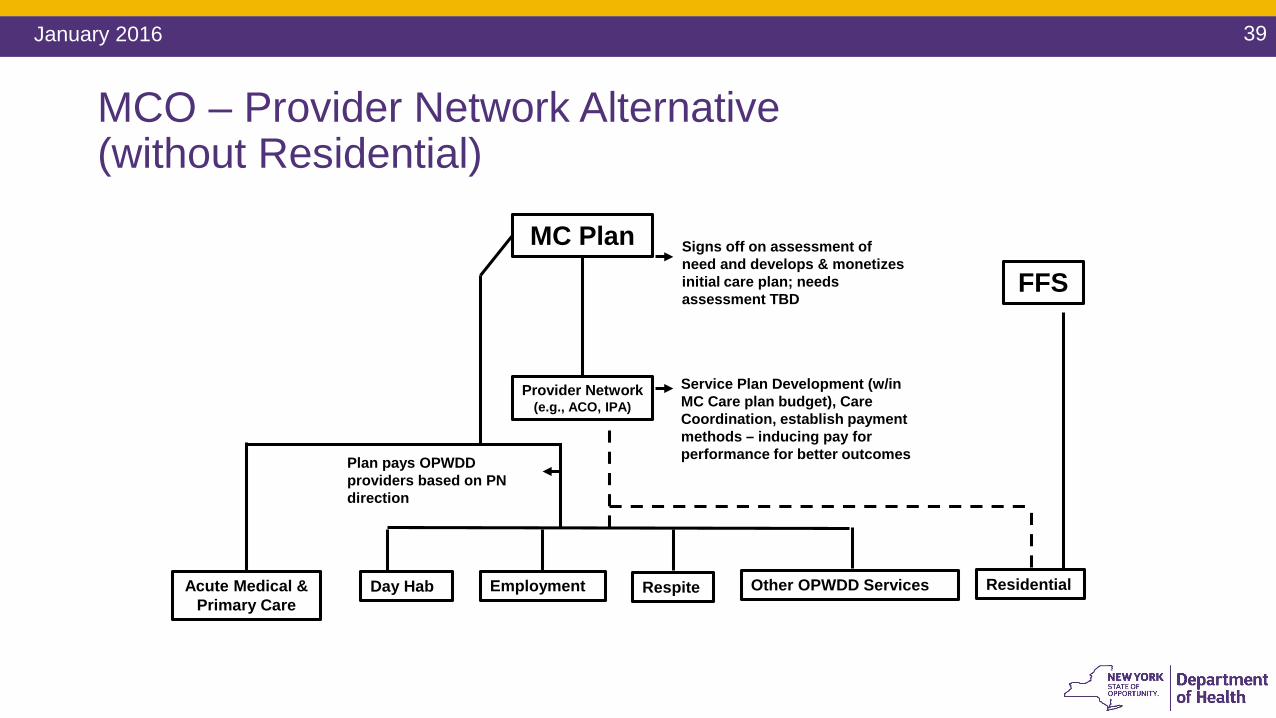
MCO – Provider Network Alternative(without Residential)
Residential
FFS
MC Plan
Provider Network(e.g., ACO, IPA)
Day Hab Employment Respite Other OPWDD Services
Plan pays OPWDD providers based on PN direction
Signs off on assessment of need and develops & monetizes initial care plan; needs assessment TBD
Service Plan Development (w/in MC Care plan budget), Care Coordination, establish payment methods – inducing pay for performance for better outcomes
Acute Medical & Primary Care
40January 2016
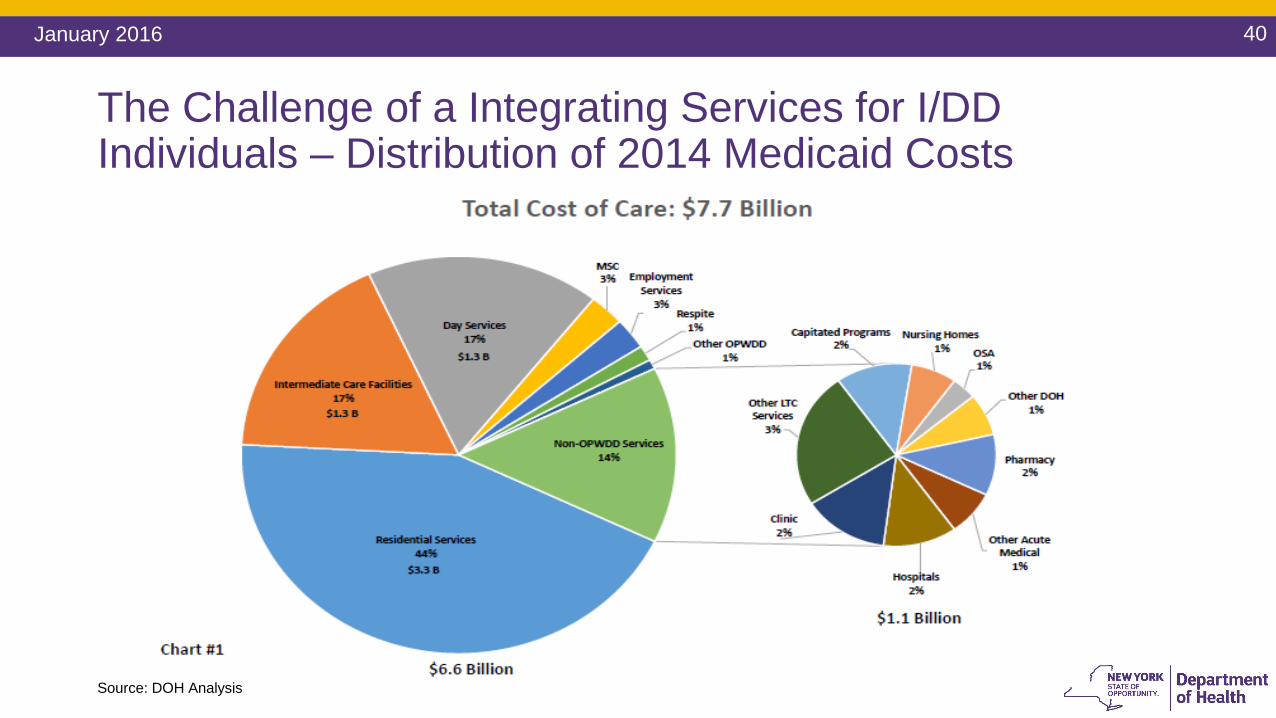
The Challenge of a Integrating Services for I/DD Individuals – Distribution of 2014 Medicaid Costs
Source: DOH Analysis
41January 2016
Questions / Open Discussion
I/DD VBP Advisory Group Meeting # 2
Meeting 2: Deeper Dive - the I/DD Population and Total Cost of
Care• Overview total cost of care for I/DD subpopulation• VBP arrangements for subpopulations• A more nuanced view of use patterns of acute and Long-Term
Support Services

Appendix
44January 2016
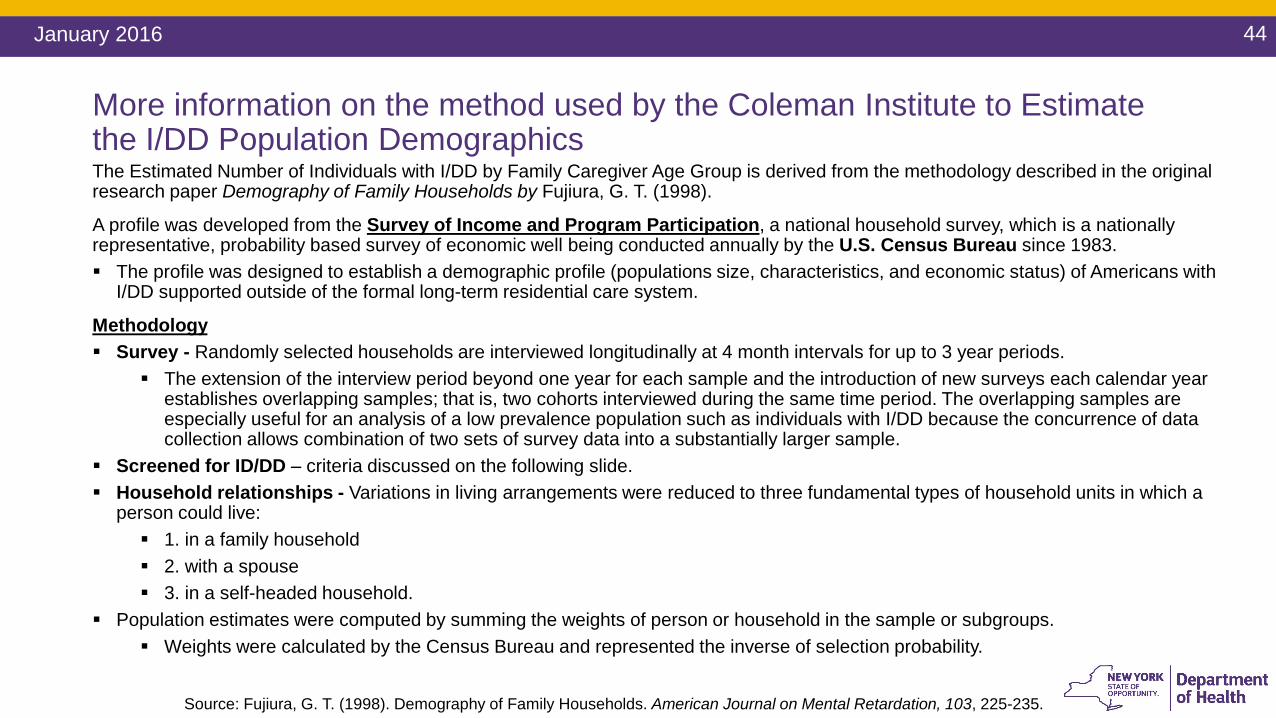
More information on the method used by the Coleman Institute to Estimate the I/DD Population Demographics The Estimated Number of Individuals with I/DD by Family Caregiver Age Group is derived from the methodology described in the original research paper Demography of Family Households by Fujiura, G. T. (1998).
A profile was developed from the Survey of Income and Program Participation, a national household survey, which is a nationally representative, probability based survey of economic well being conducted annually by the U.S. Census Bureau since 1983. The profile was designed to establish a demographic profile (populations size, characteristics, and economic status) of Americans with
I/DD supported outside of the formal long-term residential care system.
Methodology Survey - Randomly selected households are interviewed longitudinally at 4 month intervals for up to 3 year periods.
The extension of the interview period beyond one year for each sample and the introduction of new surveys each calendar year establishes overlapping samples; that is, two cohorts interviewed during the same time period. The overlapping samples are especially useful for an analysis of a low prevalence population such as individuals with I/DD because the concurrence of data collection allows combination of two sets of survey data into a substantially larger sample.
Screened for ID/DD – criteria discussed on the following slide. Household relationships - Variations in living arrangements were reduced to three fundamental types of household units in which a
person could live: 1. in a family household 2. with a spouse 3. in a self-headed household.
Population estimates were computed by summing the weights of person or household in the sample or subgroups. Weights were calculated by the Census Bureau and represented the inverse of selection probability.
Source: Fujiura, G. T. (1998). Demography of Family Households. American Journal on Mental Retardation, 103, 225-235.
45January 2016
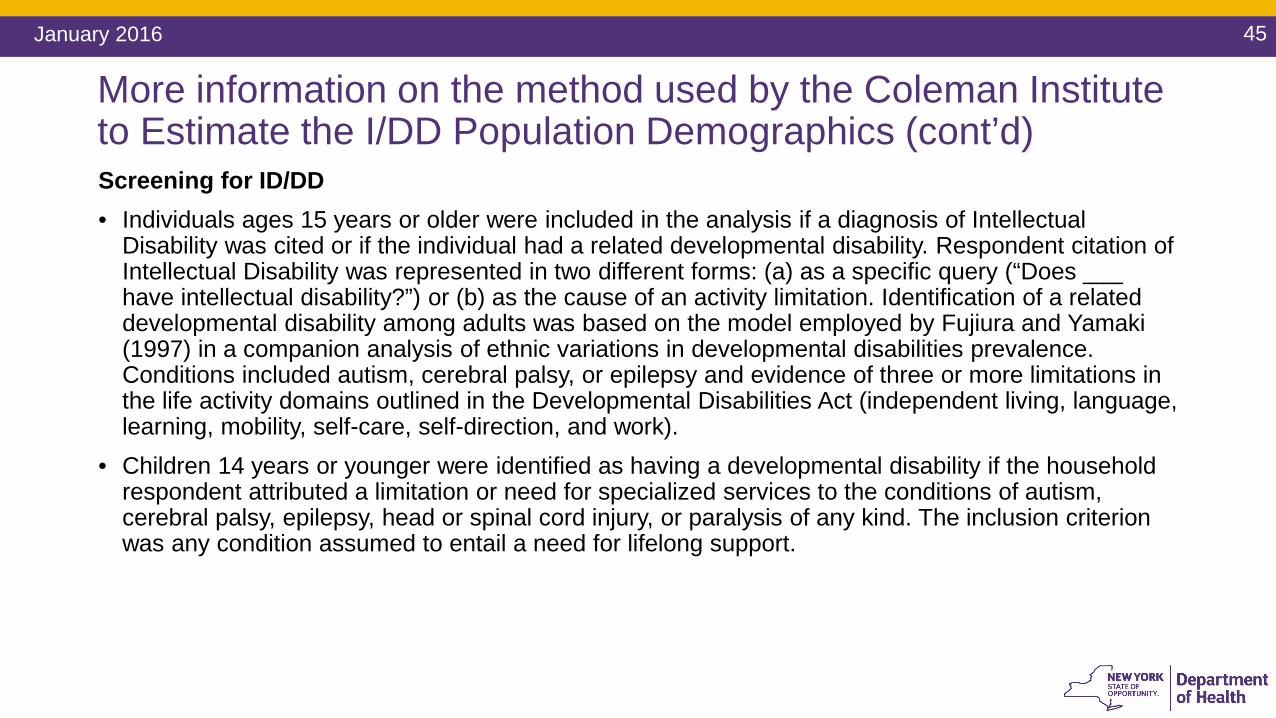
Screening for ID/DD • Individuals ages 15 years or older were included in the analysis if a diagnosis of Intellectual
Disability was cited or if the individual had a related developmental disability. Respondent citation of Intellectual Disability was represented in two different forms: (a) as a specific query (“Does ___ have intellectual disability?”) or (b) as the cause of an activity limitation. Identification of a related developmental disability among adults was based on the model employed by Fujiura and Yamaki(1997) in a companion analysis of ethnic variations in developmental disabilities prevalence. Conditions included autism, cerebral palsy, or epilepsy and evidence of three or more limitations in the life activity domains outlined in the Developmental Disabilities Act (independent living, language, learning, mobility, self-care, self-direction, and work).
• Children 14 years or younger were identified as having a developmental disability if the household respondent attributed a limitation or need for specialized services to the conditions of autism, cerebral palsy, epilepsy, head or spinal cord injury, or paralysis of any kind. The inclusion criterion was any condition assumed to entail a need for lifelong support.
More information on the method used by the Coleman Institute to Estimate the I/DD Population Demographics (cont’d)
46January 2016
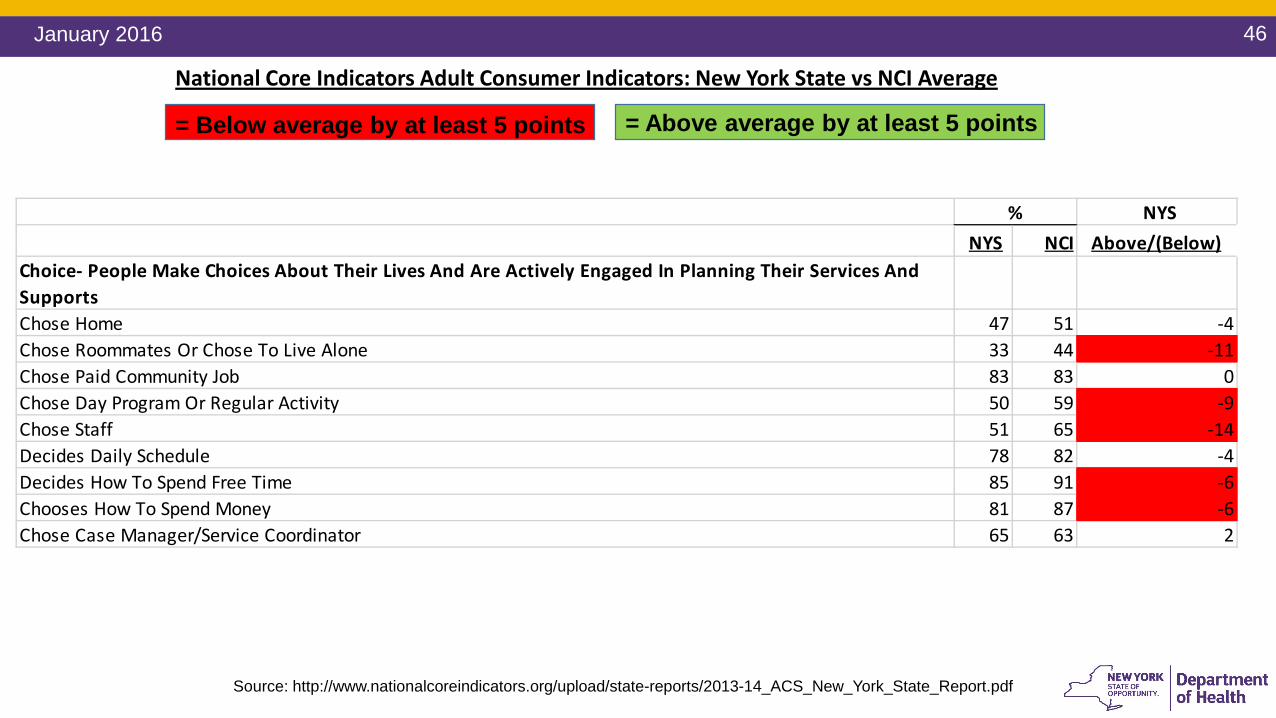
NYSNYS NCI Above/(Below)
Choice- People Make Choices About Their Lives And Are Actively Engaged In Planning Their Services And SupportsChose Home 47 51 -4Chose Roommates Or Chose To Live Alone 33 44 -11Chose Paid Community Job 83 83 0Chose Day Program Or Regular Activity 50 59 -9Chose Staff 51 65 -14Decides Daily Schedule 78 82 -4Decides How To Spend Free Time 85 91 -6Chooses How To Spend Money 81 87 -6Chose Case Manager/Service Coordinator 65 63 2
%
National Core Indicators Adult Consumer Indicators: New York State vs NCI Average
= Above average by at least 5 points= Below average by at least 5 points
Source: http://www.nationalcoreindicators.org/upload/state-reports/2013-14_ACS_New_York_State_Report.pdf
47January 2016
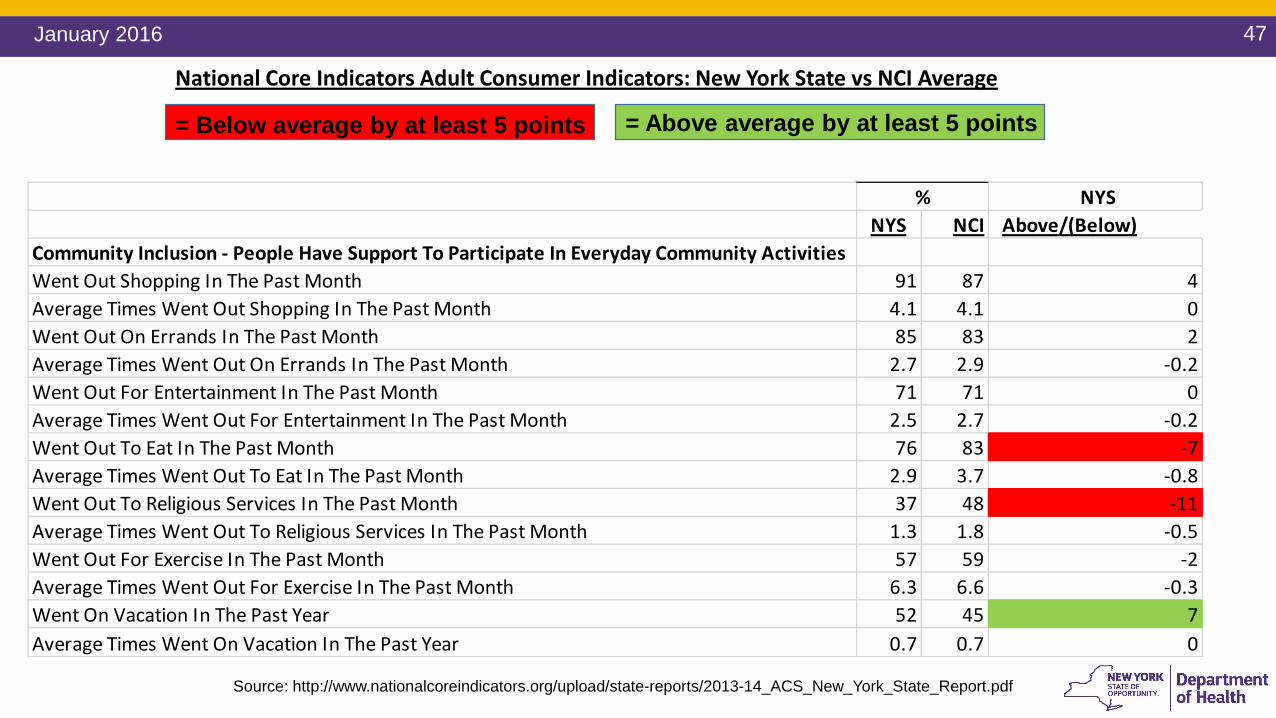
NYSNYS NCI Above/(Below)
Community Inclusion - People Have Support To Participate In Everyday Community ActivitiesWent Out Shopping In The Past Month 91 87 4Average Times Went Out Shopping In The Past Month 4.1 4.1 0Went Out On Errands In The Past Month 85 83 2Average Times Went Out On Errands In The Past Month 2.7 2.9 -0.2Went Out For Entertainment In The Past Month 71 71 0Average Times Went Out For Entertainment In The Past Month 2.5 2.7 -0.2Went Out To Eat In The Past Month 76 83 -7Average Times Went Out To Eat In The Past Month 2.9 3.7 -0.8Went Out To Religious Services In The Past Month 37 48 -11Average Times Went Out To Religious Services In The Past Month 1.3 1.8 -0.5Went Out For Exercise In The Past Month 57 59 -2Average Times Went Out For Exercise In The Past Month 6.3 6.6 -0.3Went On Vacation In The Past Year 52 45 7Average Times Went On Vacation In The Past Year 0.7 0.7 0
%
Source: http://www.nationalcoreindicators.org/upload/state-reports/2013-14_ACS_New_York_State_Report.pdf
National Core Indicators Adult Consumer Indicators: New York State vs NCI Average
= Above average by at least 5 points= Below average by at least 5 points
48January 2016
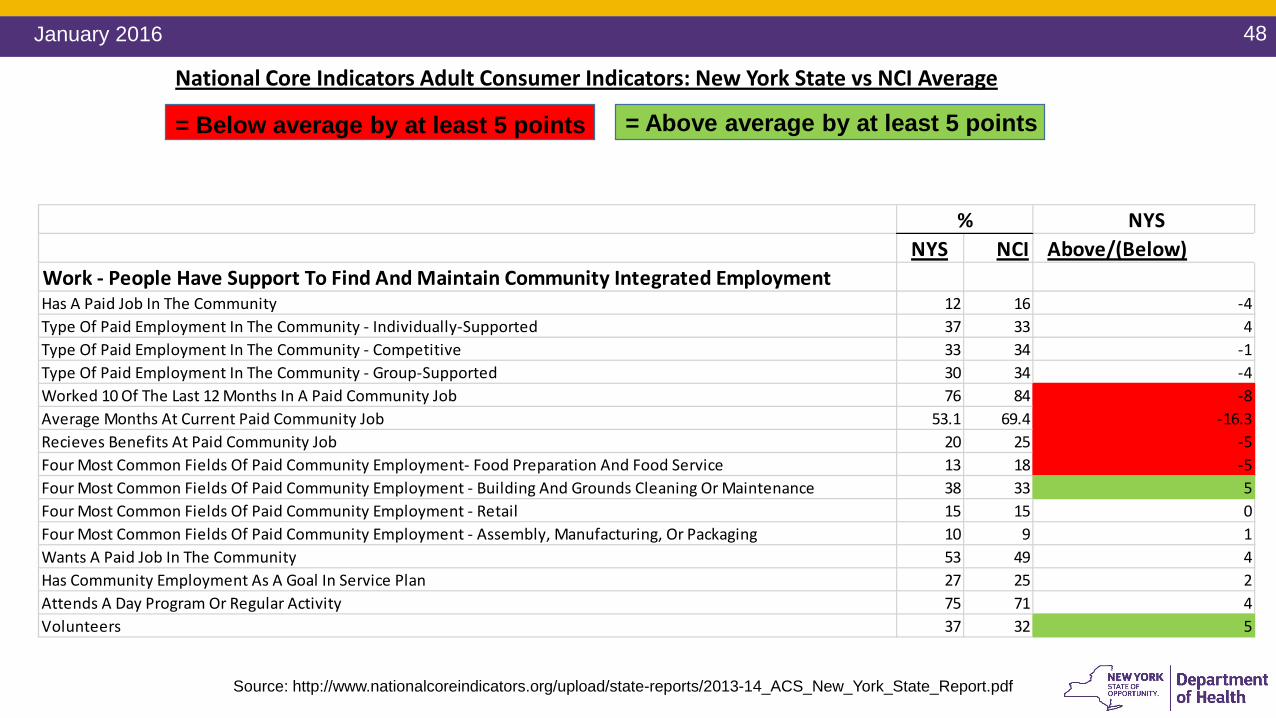
NYSNYS NCI Above/(Below)
Work - People Have Support To Find And Maintain Community Integrated EmploymentHas A Paid Job In The Community 12 16 -4Type Of Paid Employment In The Community - Individually-Supported 37 33 4Type Of Paid Employment In The Community - Competitive 33 34 -1Type Of Paid Employment In The Community - Group-Supported 30 34 -4Worked 10 Of The Last 12 Months In A Paid Community Job 76 84 -8Average Months At Current Paid Community Job 53.1 69.4 -16.3Recieves Benefits At Paid Community Job 20 25 -5Four Most Common Fields Of Paid Community Employment- Food Preparation And Food Service 13 18 -5Four Most Common Fields Of Paid Community Employment - Building And Grounds Cleaning Or Maintenance 38 33 5Four Most Common Fields Of Paid Community Employment - Retail 15 15 0Four Most Common Fields Of Paid Community Employment - Assembly, Manufacturing, Or Packaging 10 9 1Wants A Paid Job In The Community 53 49 4Has Community Employment As A Goal In Service Plan 27 25 2Attends A Day Program Or Regular Activity 75 71 4Volunteers 37 32 5
%
Source: http://www.nationalcoreindicators.org/upload/state-reports/2013-14_ACS_New_York_State_Report.pdf
National Core Indicators Adult Consumer Indicators: New York State vs NCI Average
= Above average by at least 5 points= Below average by at least 5 points
49January 2016
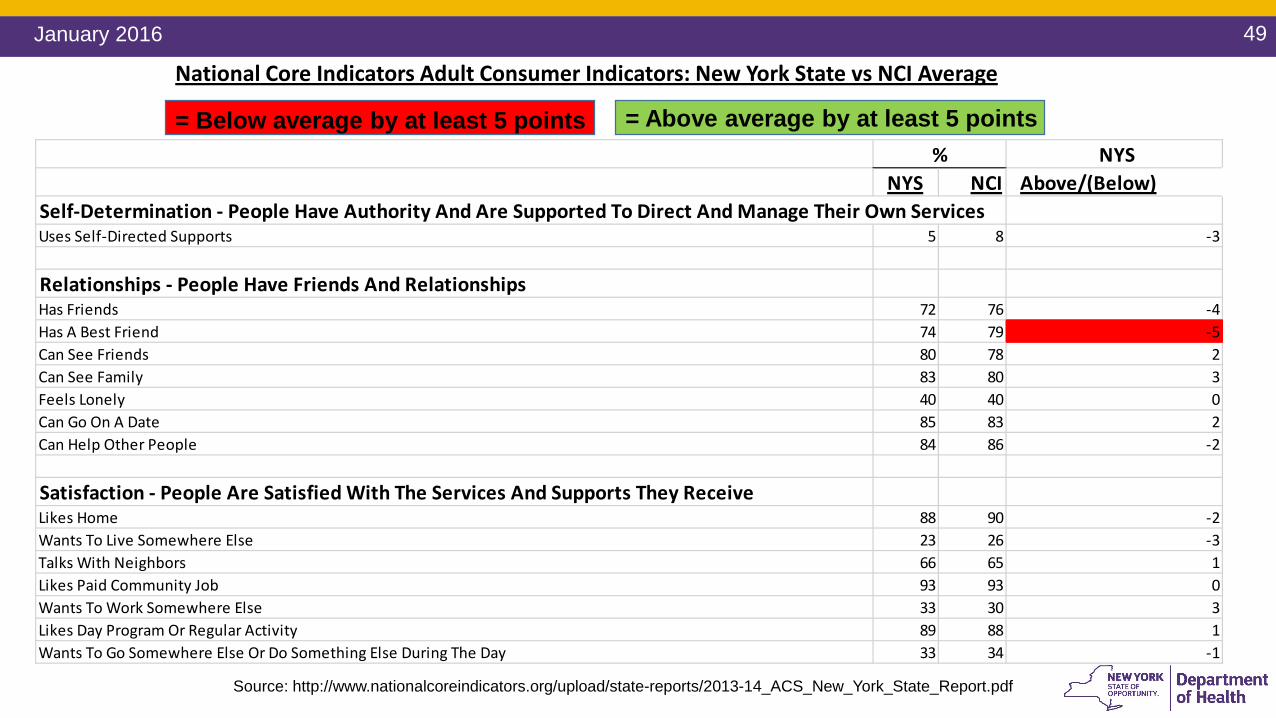
NYSNYS NCI Above/(Below)
Self-Determination - People Have Authority And Are Supported To Direct And Manage Their Own ServicesUses Self-Directed Supports 5 8 -3
Relationships - People Have Friends And RelationshipsHas Friends 72 76 -4Has A Best Friend 74 79 -5Can See Friends 80 78 2Can See Family 83 80 3Feels Lonely 40 40 0Can Go On A Date 85 83 2Can Help Other People 84 86 -2
Satisfaction - People Are Satisfied With The Services And Supports They ReceiveLikes Home 88 90 -2Wants To Live Somewhere Else 23 26 -3Talks With Neighbors 66 65 1Likes Paid Community Job 93 93 0Wants To Work Somewhere Else 33 30 3Likes Day Program Or Regular Activity 89 88 1Wants To Go Somewhere Else Or Do Something Else During The Day 33 34 -1
%
Source: http://www.nationalcoreindicators.org/upload/state-reports/2013-14_ACS_New_York_State_Report.pdf
National Core Indicators Adult Consumer Indicators: New York State vs NCI Average
= Above average by at least 5 points= Below average by at least 5 points
50January 2016
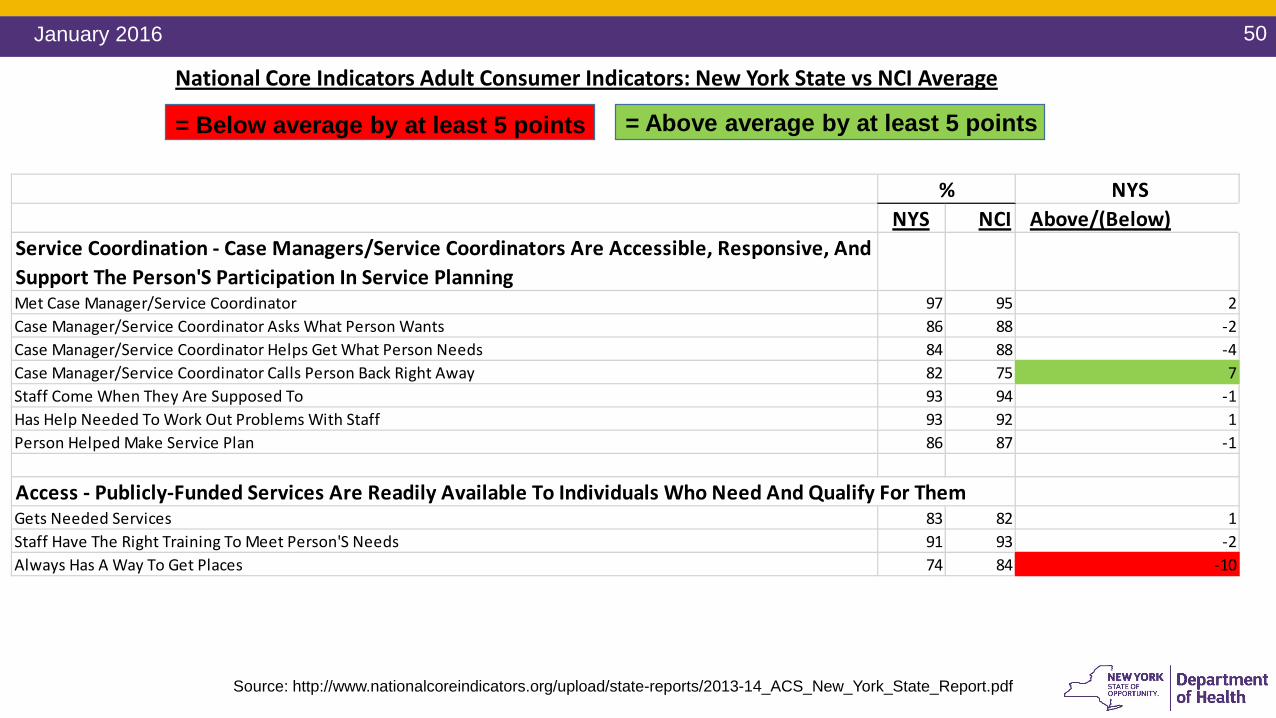
NYSNYS NCI Above/(Below)
Service Coordination - Case Managers/Service Coordinators Are Accessible, Responsive, And Support The Person'S Participation In Service PlanningMet Case Manager/Service Coordinator 97 95 2Case Manager/Service Coordinator Asks What Person Wants 86 88 -2Case Manager/Service Coordinator Helps Get What Person Needs 84 88 -4Case Manager/Service Coordinator Calls Person Back Right Away 82 75 7Staff Come When They Are Supposed To 93 94 -1Has Help Needed To Work Out Problems With Staff 93 92 1Person Helped Make Service Plan 86 87 -1
Access - Publicly-Funded Services Are Readily Available To Individuals Who Need And Qualify For ThemGets Needed Services 83 82 1Staff Have The Right Training To Meet Person'S Needs 91 93 -2Always Has A Way To Get Places 74 84 -10
%
Source: http://www.nationalcoreindicators.org/upload/state-reports/2013-14_ACS_New_York_State_Report.pdf
National Core Indicators Adult Consumer Indicators: New York State vs NCI Average
= Above average by at least 5 points= Below average by at least 5 points
51January 2016
NYSNYS NCI Above/(Below)
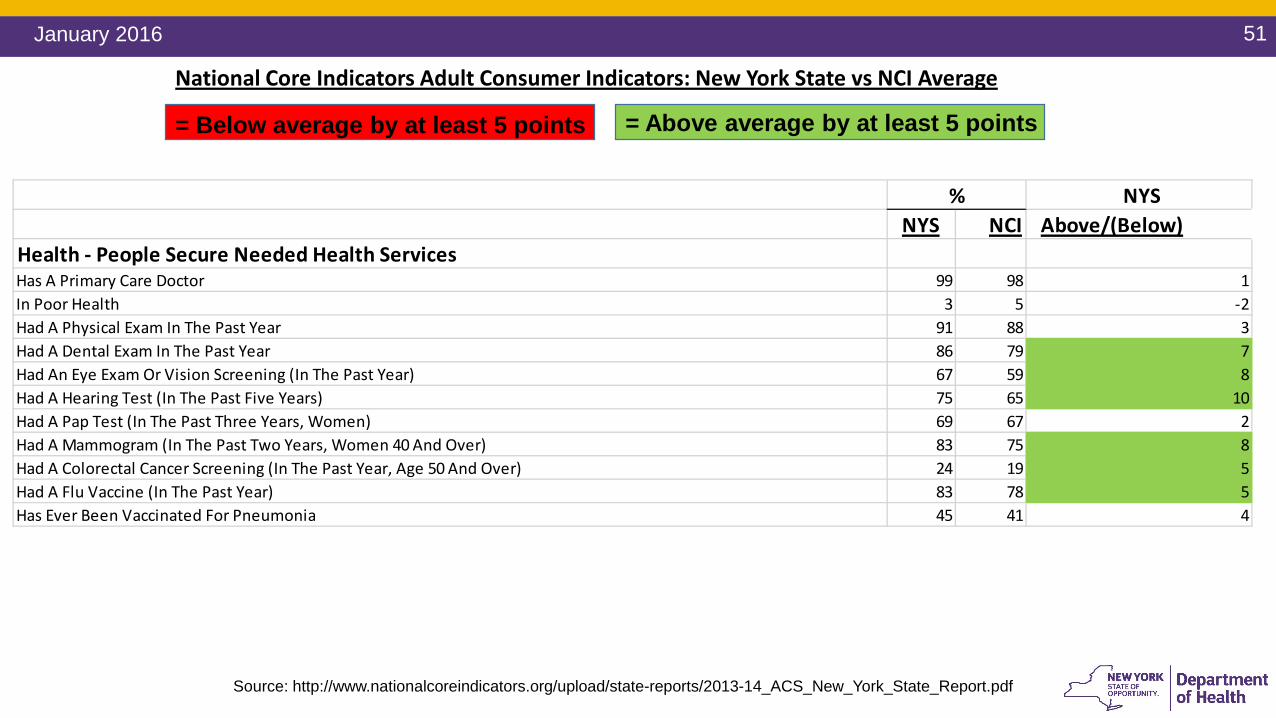
Health - People Secure Needed Health ServicesHas A Primary Care Doctor 99 98 1In Poor Health 3 5 -2Had A Physical Exam In The Past Year 91 88 3Had A Dental Exam In The Past Year 86 79 7Had An Eye Exam Or Vision Screening (In The Past Year) 67 59 8Had A Hearing Test (In The Past Five Years) 75 65 10Had A Pap Test (In The Past Three Years, Women) 69 67 2Had A Mammogram (In The Past Two Years, Women 40 And Over) 83 75 8Had A Colorectal Cancer Screening (In The Past Year, Age 50 And Over) 24 19 5Had A Flu Vaccine (In The Past Year) 83 78 5Has Ever Been Vaccinated For Pneumonia 45 41 4
%
Source: http://www.nationalcoreindicators.org/upload/state-reports/2013-14_ACS_New_York_State_Report.pdf
National Core Indicators Adult Consumer Indicators: New York State vs NCI Average
= Above average by at least 5 points= Below average by at least 5 points
52January 2016
NYSNYS NCI Above/(Below)
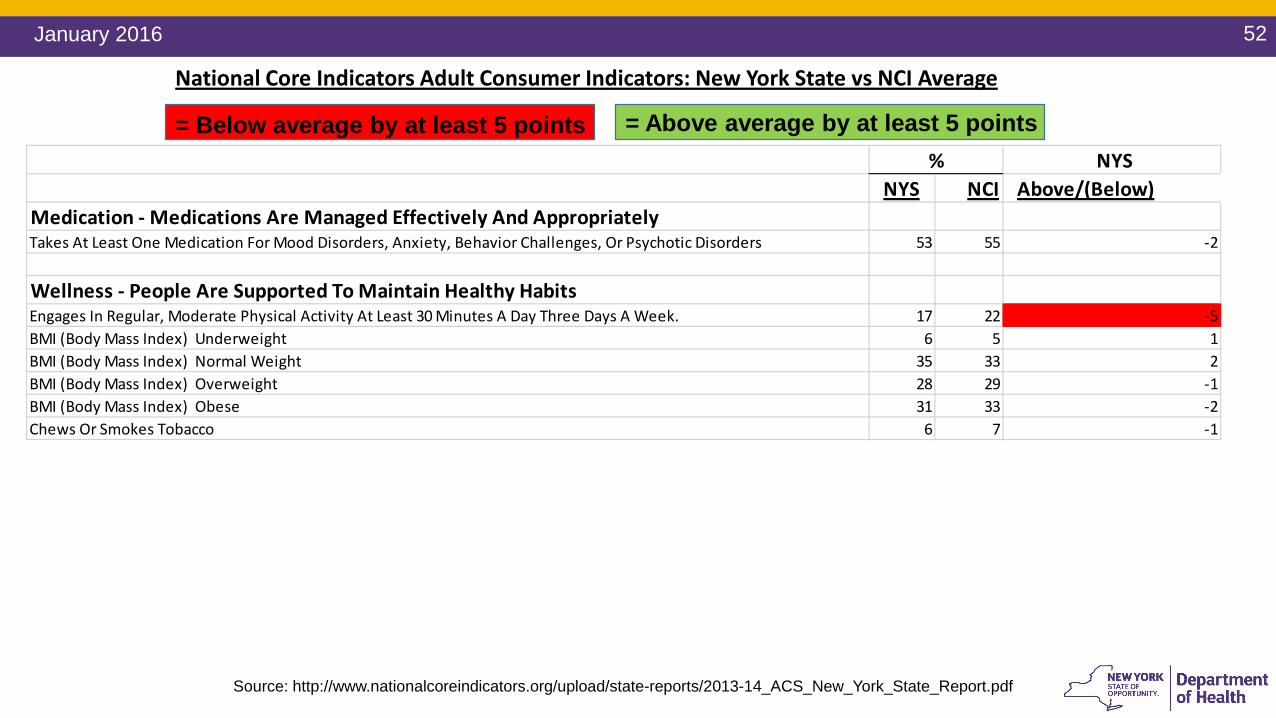
Medication - Medications Are Managed Effectively And AppropriatelyTakes At Least One Medication For Mood Disorders, Anxiety, Behavior Challenges, Or Psychotic Disorders 53 55 -2
Wellness - People Are Supported To Maintain Healthy HabitsEngages In Regular, Moderate Physical Activity At Least 30 Minutes A Day Three Days A Week. 17 22 -5BMI (Body Mass Index) Underweight 6 5 1BMI (Body Mass Index) Normal Weight 35 33 2BMI (Body Mass Index) Overweight 28 29 -1BMI (Body Mass Index) Obese 31 33 -2Chews Or Smokes Tobacco 6 7 -1
%
Source: http://www.nationalcoreindicators.org/upload/state-reports/2013-14_ACS_New_York_State_Report.pdf
National Core Indicators Adult Consumer Indicators: New York State vs NCI Average
= Above average by at least 5 points= Below average by at least 5 points
53January 2016
NYSNYS NCI Above/(Below)
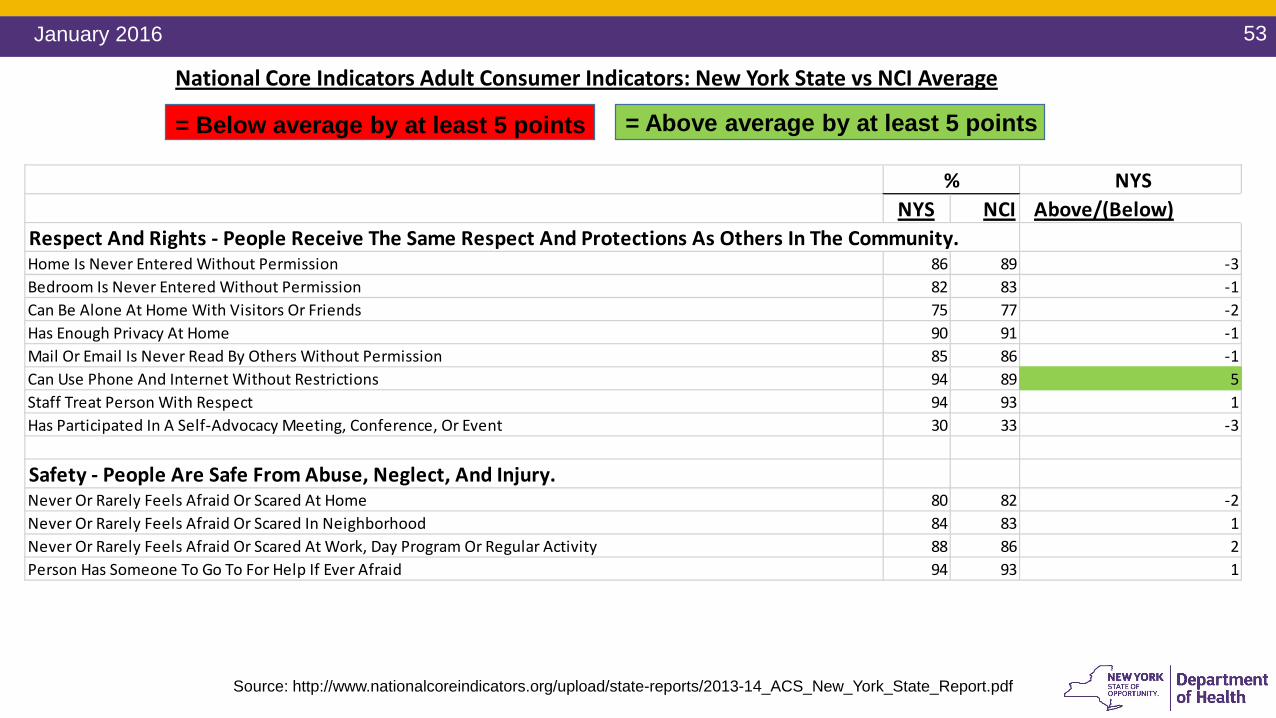
Respect And Rights - People Receive The Same Respect And Protections As Others In The Community.Home Is Never Entered Without Permission 86 89 -3Bedroom Is Never Entered Without Permission 82 83 -1Can Be Alone At Home With Visitors Or Friends 75 77 -2Has Enough Privacy At Home 90 91 -1Mail Or Email Is Never Read By Others Without Permission 85 86 -1Can Use Phone And Internet Without Restrictions 94 89 5Staff Treat Person With Respect 94 93 1Has Participated In A Self-Advocacy Meeting, Conference, Or Event 30 33 -3
Safety - People Are Safe From Abuse, Neglect, And Injury.Never Or Rarely Feels Afraid Or Scared At Home 80 82 -2Never Or Rarely Feels Afraid Or Scared In Neighborhood 84 83 1Never Or Rarely Feels Afraid Or Scared At Work, Day Program Or Regular Activity 88 86 2Person Has Someone To Go To For Help If Ever Afraid 94 93 1
%
Source: http://www.nationalcoreindicators.org/upload/state-reports/2013-14_ACS_New_York_State_Report.pdf
National Core Indicators Adult Consumer Indicators: New York State vs NCI Average
= Above average by at least 5 points= Below average by at least 5 points