Embed Size (px)
Citation preview
INSIGHTS | PERSPECTIVES
236 16 JANUARY 2015 • VOL 347 ISSUE 6219 sciencemag.org SCIENCE
The patent system is built on a grand
bargain: To gain exclusive rights to
practice their inventions, inventors
must disclose their proprietary knowl-
edge publicly. Economists have stud-
ied incentive benefits of exclusivity
while implicitly assuming that disclosure of
know-how in patent applications is costly
for inventors. Yet, apart from fa-
cilitating diffusion of knowledge,
disclosing know-how in a patent
may privately benefit inventors by deterring
rivals’ duplicative research and development
(R&D), preempting competitors’ ef-
forts to patent similar technology,
and reducing informational asym-
metries between patentees and po-
tential investors [supplementary
materials (SM)]. Understanding to
what extent disclosure is viewed as a
cost or a benefit by patenting inven-
tors provides insights into our com-
plex patent system and allows better
policy-making to advance the diffu-
sion of technical knowledge.
Whereas, historically, applications
for U.S. patents were kept secret un-
til grant, Congress in 1999 sought to
harmonize the United States with
virtually all other nations by requir-
ing publication 18 months after first
filing ( 1). This sparked disagreement,
including from 26 Nobel laureates
who warned that the legislation,
which included the pregrant pub-
lication provision, “will prove very
damaging to American small inven-
tors and thereby discourage the flow
of new inventions that have contributed so
much to America’s superior performance”
( 2). Congress adopted the change in the
American Inventors Protection Act (“AIPA”
or “Act”), but allowed applicants seeking no
foreign patents on the same invention to opt
out of publication, preserving secrecy until
patent grant ( 3, 4) (SM).
This bifurcated choice—to disclose or
not—presents a quasi-natural experiment.
Inventors make choices to maximize private
value. We investigate these “revealed prefer-
ences” using data on all 1.81 million applica-
tions filed with the U.S. Patent & Trademark
Office (USPTO) in 1996–2005 and granted by
mid-2012. Our focus on preferences, condi-
tioned on the decision to patent, cannot mea-
sure benefits or costs of secrecy in general.
Our findings are relevant to recent legislative
proposals seeking to restrict pregrant publi-
cation ( 5) and to recommendations to elimi-
nate the secrecy loophole altogether ( 6, 7).
Disclosure provisions are a sticking point in
international patent-system harmonization;
thus, our findings inform ongoing negotia-
tions [e.g., Trans-Pacific Partnership ( 8)].
SMALL AND IMPORTANT. Before AIPA,
the United States published only at pat-
ent grant, yet applications with a parallel
foreign filing were published elsewhere.
Beginning after 28 November 2000, AIPA
requires the USPTO to publish all U.S. ap-
plications, with or without parallel foreign
applications, 18 months from the first filing
date. Applicants without a parallel foreign
filing may opt out of 18-month publication
at the time of application. Filing-to-grant
lags averaged about 38 months in 2001,
thus AIPA accelerated disclosure by about
20 months on average.
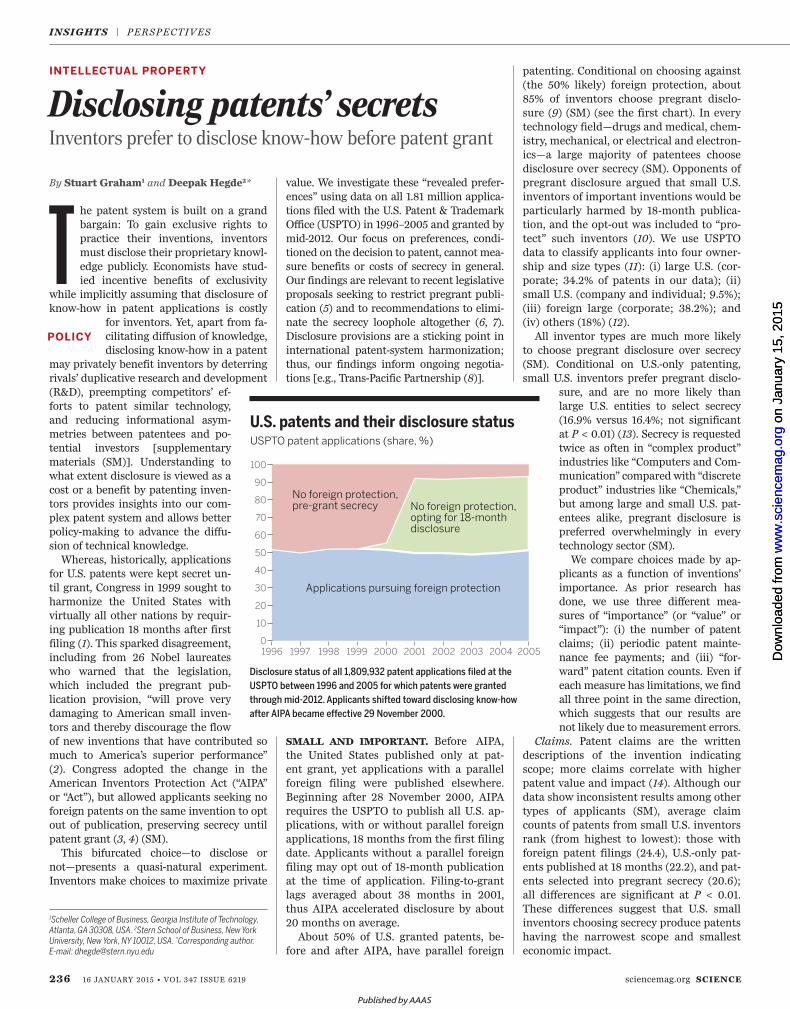
About 50% of U.S. granted patents, be-
fore and after AIPA, have parallel foreign
patenting. Conditional on choosing against
(the 50% likely) foreign protection, about
85% of inventors choose pregrant disclo-
sure ( 9) (SM) (see the first chart). In every
technology field—drugs and medical, chem-
istry, mechanical, or electrical and electron-
ics—a large majority of patentees choose
disclosure over secrecy (SM). Opponents of
pregrant disclosure argued that small U.S.
inventors of important inventions would be
particularly harmed by 18-month publica-
tion, and the opt-out was included to “pro-
tect” such inventors ( 10). We use USPTO
data to classify applicants into four owner-
ship and size types ( 11): (i) large U.S. (cor-
porate; 34.2% of patents in our data); (ii)
small U.S. (company and individual; 9.5%);
(iii) foreign large (corporate; 38.2%); and
(iv) others (18%) ( 12).
All inventor types are much more likely
to choose pregrant disclosure over secrecy
(SM). Conditional on U.S.-only patenting,
small U.S. inventors prefer pregrant disclo-
sure, and are no more likely than
large U.S. entities to select secrecy
(16.9% versus 16.4%; not significant
at P < 0.01) ( 13). Secrecy is requested
twice as often in “complex product”
industries like “Computers and Com-
munication” compared with “discrete
product” industries like “Chemicals,”
but among large and small U.S. pat-
entees alike, pregrant disclosure is
preferred overwhelmingly in every
technology sector (SM).
We compare choices made by ap-
plicants as a function of inventions’
importance. As prior research has
done, we use three different mea-
sures of “importance” (or “value” or
“impact”): (i) the number of patent
claims; (ii) periodic patent mainte-
nance fee payments; and (iii) “for-
ward” patent citation counts. Even if
each measure has limitations, we find
all three point in the same direction,
which suggests that our results are
not likely due to measurement errors.
Claims. Patent claims are the written
descriptions of the invention indicating
scope; more claims correlate with higher
patent value and impact ( 14). Although our
data show inconsistent results among other
types of applicants (SM), average claim
counts of patents from small U.S. inventors
rank (from highest to lowest): those with
foreign patent filings (24.4), U.S.-only pat-
ents published at 18 months (22.2), and pat-
ents selected into pregrant secrecy (20.6);
all differences are significant at P < 0.01.
These differences suggest that U.S. small
inventors choosing secrecy produce patents
having the narrowest scope and smallest
economic impact.
Disclosing patents’ secrets
Disclosure status of all 1,809,932 patent applications filed at the
USPTO between 1996 and 2005 for which patents were granted
through mid-2012. Applicants shifted toward disclosing know-how
after AIPA became effective 29 November 2000.
By Stuart Graham 1 and Deepak Hegde 2 *
Inventors prefer to disclose know-how before patent grant
INTELLECTUAL PROPERTY
1Scheller College of Business, Georgia Institute of Technology, Atlanta, GA 30308, USA. 2Stern School of Business, New York University, New York, NY 10012, USA. *Corresponding author. E-mail: [email protected]
No foreign protection, pre-grant secrecy No foreign protection,
opting for 18-month disclosure
Applications pursuing foreign protection
U.S. patents and their disclosure statusUSPTO patent applications (share, %)
0
1996 1997 1998 1999 2000 2001 2002 2003 2004 2005
10
20
30
40
50
60
70
80
90
100
POLICY
Published by AAAS
on
Janu
ary
15, 2
015
ww
w.s
cien
cem
ag.o
rgD
ownl
oade
d fr
om
on
Janu
ary
15, 2
015
ww
w.s
cien
cem
ag.o
rgD
ownl
oade
d fr
om
16 JANUARY 2015 • VOL 347 ISSUE 6219 237SCIENCE sciencemag.org
Maintenance fees. U.S. patentees must
pay postgrant maintenance fees at 3.5, 7.5,
and 11.5 years. These payments escalate over
time, providing a proxy for the economic
value of patents to their owners ( 15, 16). We
can observe 3.5- and 7.5-year renewal rates,
finding them highest for U.S. patents with
parallel foreign filings. Among large U.S. in-
ventors, renewal rates are higher for patents
issuing from pregrant secrecy. But among
small U.S. inventors, both 3.5- and 7.5-year
renewal rates are lowest for patents issuing
from pregrant secrecy (significant at P <
0.01), which suggests that these patents are
the least valuable and have the least impact
particularly for U.S. small inventors (SM).
Citations. Increasing numbers of cita-
tions of a patent by other patents indicate
more follow-on invention and private value
( 17). As 90% of citations arrive within 10
years ( 18), we minimize truncation bias by
analyzing citations to post-AIPA patents
filed in 2001, and accumulated over the 10
years from application date. Patents issuing
from pregrant secrecy collect, on average,
the least citations (7.8), with U.S.-only pub-
lished patents (11.0) and foreign-filed pat-
ents (8.7) collecting more (significant at P
< 0.01) (SM). Patents issuing from pregrant
secrecy collected the least average number
of citations for all inventor types (SM).
For robustness, we also measure citations
from the disclosure date (18-month publi-
cation date versus grant date for “opt-out”
patents). To avoid bias introduced by pos-
sible “strategic” citation behavior by indus-
try applicants, we also restrict analysis to
the ~35% of patent citations
in our sample inserted only
by patent examiners. With
the exception of those held
by non-U.S. large entities, we
find that U.S. patents issuing
from pregrant secrecy receive
significantly fewer citations
than those published at 18
months (SM).
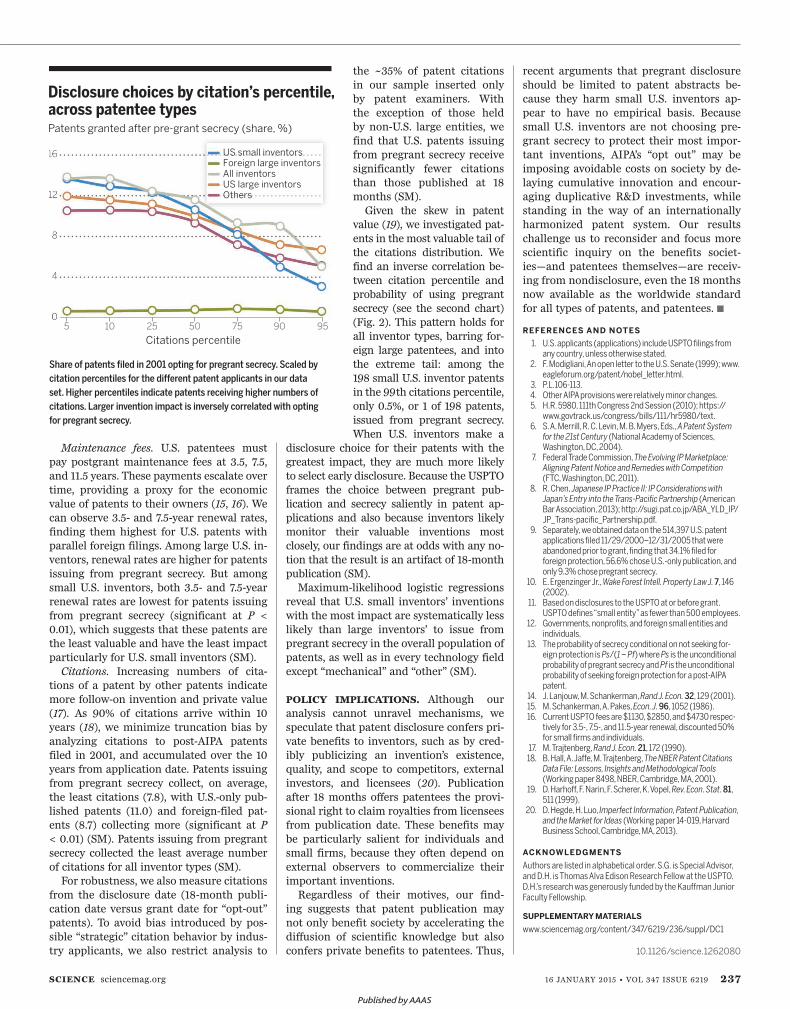
Given the skew in patent
value ( 19), we investigated pat-
ents in the most valuable tail of
the citations distribution. We
find an inverse correlation be-
tween citation percentile and
probability of using pregrant
secrecy (see the second chart)
( Fig. 2). This pattern holds for
all inventor types, barring for-
eign large patentees, and into
the extreme tail: among the
198 small U.S. inventor patents
in the 99th citations percentile,
only 0.5%, or 1 of 198 patents,
issued from pregrant secrecy.
When U.S. inventors make a
disclosure choice for their patents with the
greatest impact, they are much more likely
to select early disclosure. Because the USPTO
frames the choice between pregrant pub-
lication and secrecy saliently in patent ap-
plications and also because inventors likely
monitor their valuable inventions most
closely, our findings are at odds with any no-
tion that the result is an artifact of 18-month
publication (SM).
Maximum-likelihood logistic regressions
reveal that U.S. small inventors’ inventions
with the most impact are systematically less
likely than large inventors’ to issue from
pregrant secrecy in the overall population of
patents, as well as in every technology field
except “mechanical” and “other” (SM).
POLICY IMPLICATIONS. Although our
analysis cannot unravel mechanisms, we
speculate that patent disclosure confers pri-
vate benefits to inventors, such as by cred-
ibly publicizing an invention’s existence,
quality, and scope to competitors, external
investors, and licensees ( 20). Publication
after 18 months offers patentees the provi-
sional right to claim royalties from licensees
from publication date. These benefits may
be particularly salient for individuals and
small firms, because they often depend on
external observers to commercialize their
important inventions.
Regardless of their motives, our find-
ing suggests that patent publication may
not only benefit society by accelerating the
diffusion of scientific knowledge but also
confers private benefits to patentees. Thus,
recent arguments that pregrant disclosure
should be limited to patent abstracts be-
cause they harm small U.S. inventors ap-
pear to have no empirical basis. Because
small U.S. inventors are not choosing pre-
grant secrecy to protect their most impor-
tant inventions, AIPA’s “opt out” may be
imposing avoidable costs on society by de-
laying cumulative innovation and encour-
aging duplicative R&D investments, while
standing in the way of an internationally
harmonized patent system. Our results
challenge us to reconsider and focus more
scientific inquiry on the benefits societ-
ies—and patentees themselves—are receiv-
ing from nondisclosure, even the 18 months
now available as the worldwide standard
for all types of patents, and patentees. ■
REFERENCES AND NOTES
1. U.S. applicants (applications) include USPTO filings from any country, unless otherwise stated.
2. F. Modigliani, An open letter to the U.S. Senate (1999); www.eagleforum.org/patent/nobel_letter.html.
3. P.L.106-113. 4. Other AIPA provisions were relatively minor changes. 5. H.R. 5980, 111th Congress 2nd Session (2010); https://
www.govtrack.us/congress/bills/111/hr5980/text. 6. S. A. Merrill, R. C. Levin, M. B. Myers, Eds., A Patent System
for the 21st Century (National Academy of Sciences, Washington, DC, 2004).
7. Federal Trade Commission, The Evolving IP Marketplace: Aligning Patent Notice and Remedies with Competition (FTC, Washington, DC, 2011).
8. R. Chen, Japanese IP Practice II: IP Considerations with Japan’s Entry into the Trans-Pacific Partnership (American Bar Association, 2013); http://sugi.pat.co.jp/ABA_YLD_IP/JP_Trans-pacific_Partnership.pdf.
9. Separately, we obtained data on the 514,397 U.S. patent applications filed 11/29/2000–12/31/2005 that were abandoned prior to grant, finding that 34.1% filed for foreign protection, 56.6% chose U.S.-only publication, and only 9.3% chose pregrant secrecy.
10. E. Ergenzinger Jr., Wake Forest Intell. Property Law J. 7, 146 (2002).
11. Based on disclosures to the USPTO at or before grant. USPTO defines “small entity” as fewer than 500 employees.
12. Governments, nonprofits, and foreign small entities and individuals.
13. The probability of secrecy conditional on not seeking for-eign protection is Ps/(1 – Pf) where Ps is the unconditional probability of pregrant secrecy and Pf is the unconditional probability of seeking foreign protection for a post-AIPA patent.
14. J. Lanjouw, M. Schankerman, Rand J. Econ. 32, 129 (2001). 15. M. Schankerman, A. Pakes, Econ. J. 96, 1052 (1986). 16. Current USPTO fees are $1130, $2850, and $4730 respec-
tively for 3.5-, 7.5-, and 11.5-year renewal, discounted 50% for small firms and individuals.
17. M. Trajtenberg, Rand J. Econ. 21, 172 (1990). 18. B. Hall, A. Jaffe, M. Trajtenberg, The NBER Patent Citations
Data File: Lessons, Insights and Methodological Tools (Working paper 8498, NBER, Cambridge, MA, 2001).
19. D. Harhoff, F. Narin, F. Scherer, K. Vopel, Rev. Econ. Stat. 81, 511 (1999).
20. D. Hegde, H. Luo, Imperfect Information, Patent Publication, and the Market for Ideas (Working paper 14-019, Harvard Business School, Cambridge, MA, 2013).
ACKNOWLEDGMENTS
Authors are listed in alphabetical order. S.G. is Special Advisor, and D.H. is Thomas Alva Edison Research Fellow at the USPTO. D.H.’s research was generously funded by the Kauffman Junior Faculty Fellowship.
SUPPLEMENTARY MATERIALS
www.sciencemag.org/content/347/6219/236/suppl/DC1
Share of patents filed in 2001 opting for pregrant secrecy. Scaled by
citation percentiles for the different patent applicants in our data
set. Higher percentiles indicate patents receiving higher numbers of
citations. Larger invention impact is inversely correlated with opting
for pregrant secrecy.
US small inventorsForeign large inventorsAll inventorsUS large inventorsOthers
Citations percentile
Disclosure choices by citation’s percentile,across patentee typesPatents granted after pre-grant secrecy (share, %)
5 10 25 50 75 90 95
10.1126/science.1262080
Published by AAAS
www.sciencemag.org/content/347/6219/236/suppl/DC1
Supplementary Materials for
Disclosing patents’ secrets
Stuart Graham and Deepak Hegde
*Corresponding author. E-mail: [email protected]
Published 16 January 2015, Science 347, 236 (2014) DOI: 10.1126/science.1262080
This PDF file includes
Materials and Methods Supplementary Text Figs. S1 to S9 Tables S1 to S6 References
Other Supplementary Material for this manuscript includes the following: (available at www.sciencemag.org/content/347/6219/236/suppl/DC1)
Patent Disclosure Data and Code as a zipped archive
1
Supplementary Materials Materials and Methods
Data required to reproduce all results in this paper are available for download in Stata format as “patentdisclosure_datafile_gh_submit.dta.” The Stata code used to produce each table and figure, in the main manuscript and these supplementary materials (SM), is available in the file titled “descriptives.” The code used to estimate the regressions reported here is available in the file titled “regressions.” All files are packaged into the zip folder named “Patent Disclosure Data and Code” and can be downloaded from this site. Note no. 9 of the manuscript provides aggregate statistics on the percentage of U.S. patent applications that chose pregrant secrecy and were abandoned before grant. Data on unpublished applications are generally not made available by the U.S. Patent and Trademark Office (USPTO) in order to protect the trade secrets of applicants who may abandon their applications before the 18-month publication date. The USPTO approved the authors to use suitably anonymized and aggregated statistics on unpublished applications as reported in Footnote no. 9 for the purpose of this project. Users can obtain this data from the USPTO by submitting a Freedom of Information Act request.
2
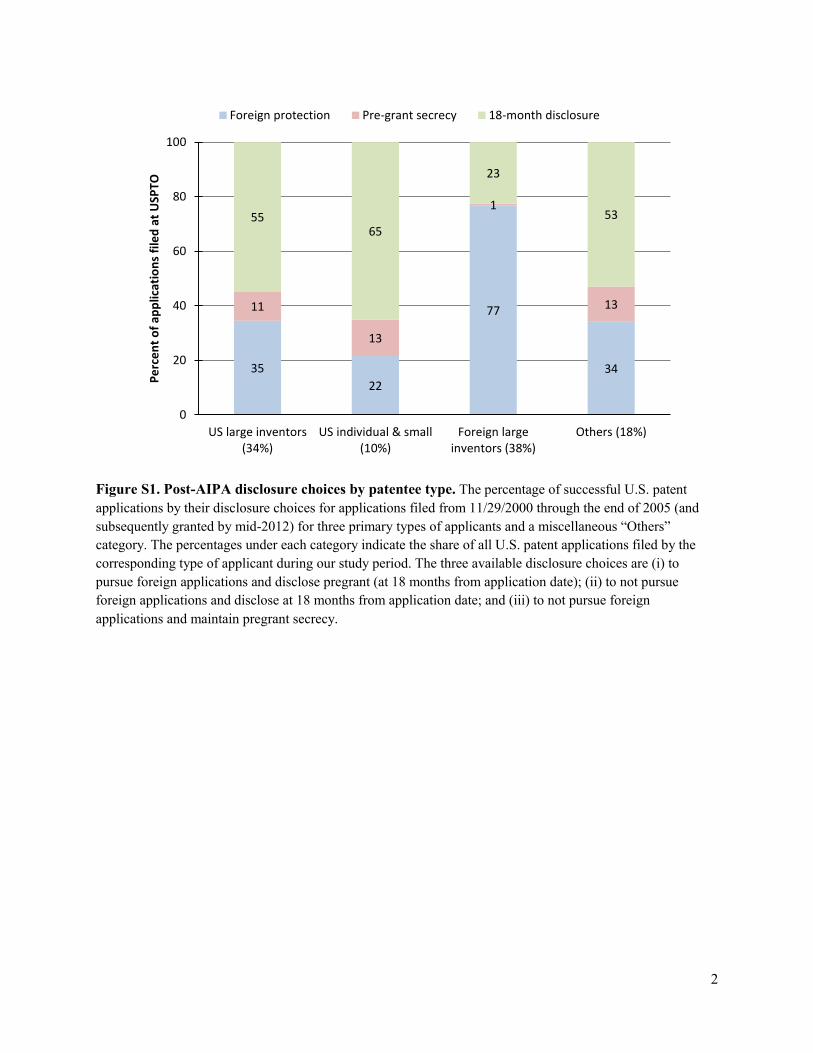
Figure S1. Post-AIPA disclosure choices by patentee type. The percentage of successful U.S. patent applications by their disclosure choices for applications filed from 11/29/2000 through the end of 2005 (and subsequently granted by mid-2012) for three primary types of applicants and a miscellaneous “Others” category. The percentages under each category indicate the share of all U.S. patent applications filed by the corresponding type of applicant during our study period. The three available disclosure choices are (i) to pursue foreign applications and disclose pregrant (at 18 months from application date); (ii) to not pursue foreign applications and disclose at 18 months from application date; and (iii) to not pursue foreign applications and maintain pregrant secrecy.
35 22
77
34
11
13
1
13
55 65
23
53
0
20
40
60
80
100
US large inventors(34%)
US individual & small(10%)
Foreign largeinventors (38%)
Others (18%)
Perc
ent o
f app
licat
ions
file
d at
USP
TO
Foreign protection Pre-grant secrecy 18-month disclosure
3
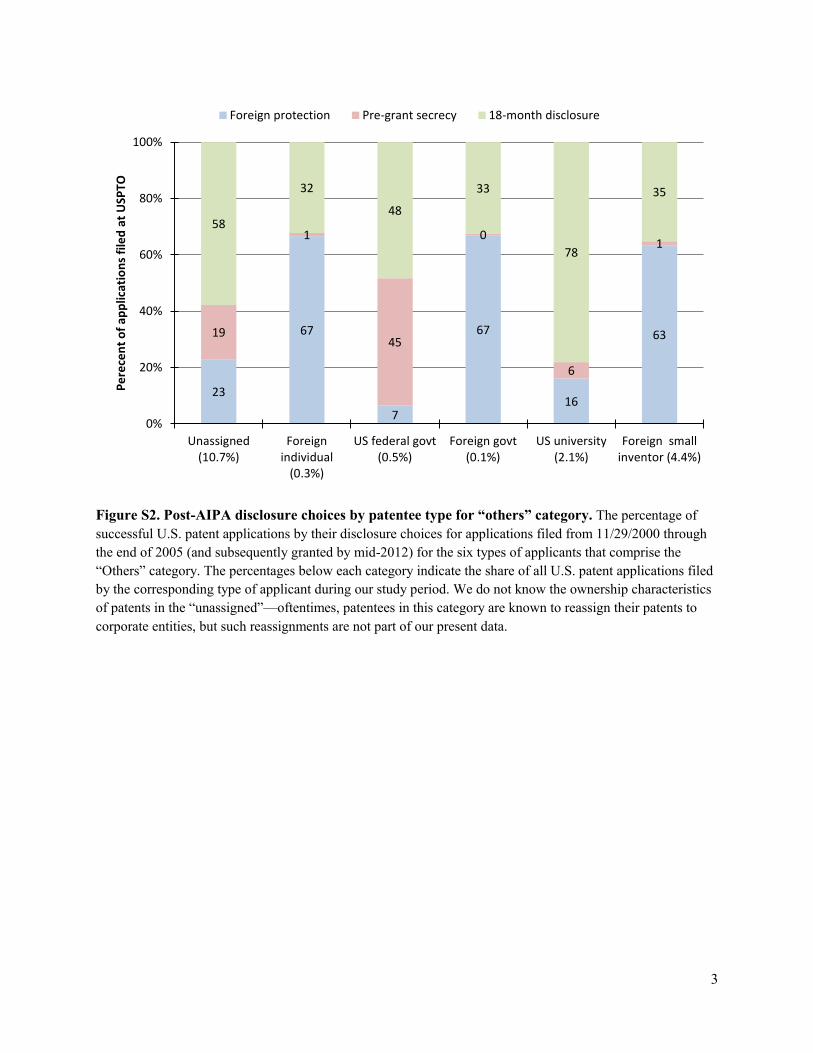
Figure S2. Post-AIPA disclosure choices by patentee type for “others” category. The percentage of successful U.S. patent applications by their disclosure choices for applications filed from 11/29/2000 through the end of 2005 (and subsequently granted by mid-2012) for the six types of applicants that comprise the “Others” category. The percentages below each category indicate the share of all U.S. patent applications filed by the corresponding type of applicant during our study period. We do not know the ownership characteristics of patents in the “unassigned”—oftentimes, patentees in this category are known to reassign their patents to corporate entities, but such reassignments are not part of our present data.
23
67
7
67
16
63 19
1
45
0
6
1 58
32
48
33
78
35
0%
20%
40%
60%
80%
100%
Unassigned(10.7%)
Foreignindividual
(0.3%)
US federal govt(0.5%)
Foreign govt(0.1%)
US university(2.1%)
Foreign smallinventor (4.4%)
Pere
cent
of a
pplic
atio
ns fi
led
at U
SPTO
Foreign protection Pre-grant secrecy 18-month disclosure
4
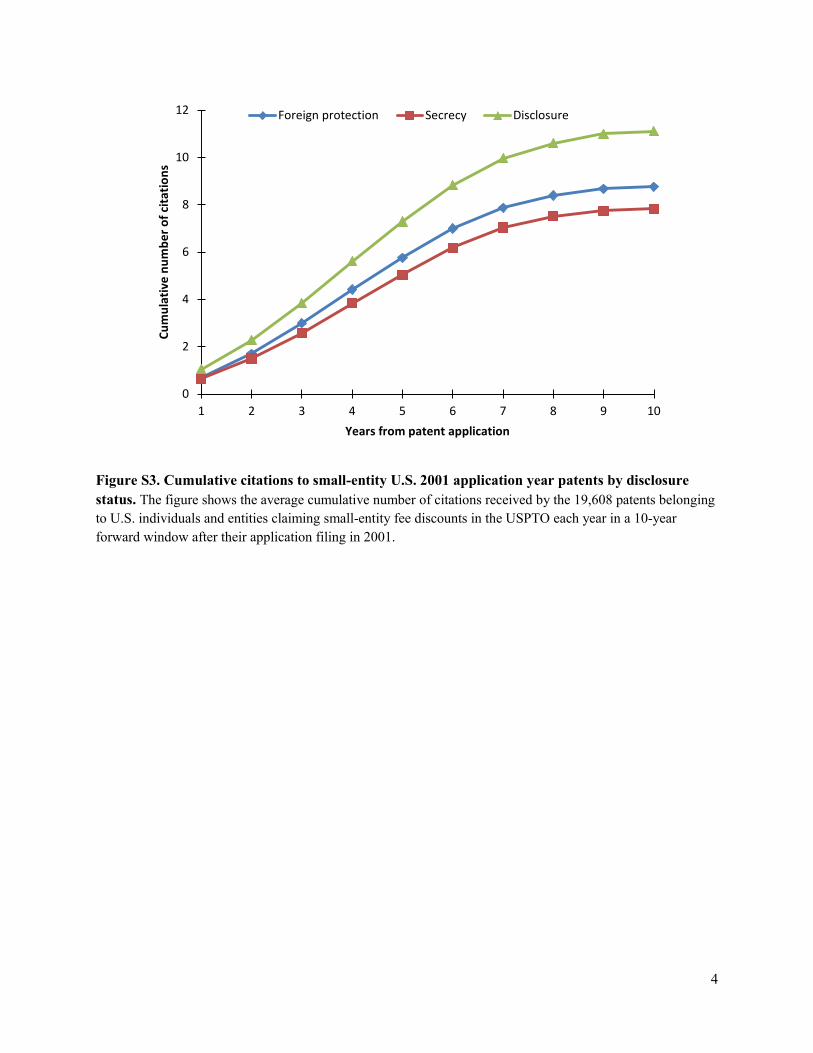
Figure S3. Cumulative citations to small-entity U.S. 2001 application year patents by disclosure status. The figure shows the average cumulative number of citations received by the 19,608 patents belonging to U.S. individuals and entities claiming small-entity fee discounts in the USPTO each year in a 10-year forward window after their application filing in 2001.
0
2
4
6
8
10
12
1 2 3 4 5 6 7 8 9 10
Cum
ulat
ive
num
ber o
f cita
tions
Years from patent application
Foreign protection Secrecy Disclosure
5
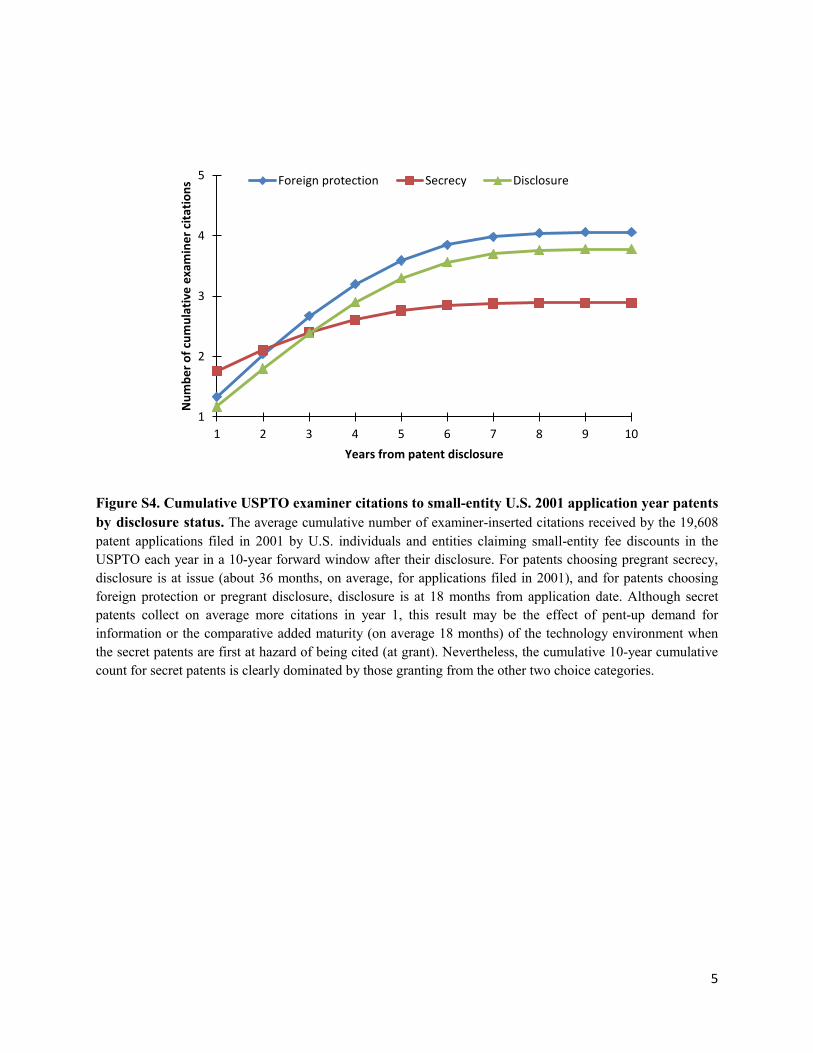
Figure S4. Cumulative USPTO examiner citations to small-entity U.S. 2001 application year patents by disclosure status. The average cumulative number of examiner-inserted citations received by the 19,608 patent applications filed in 2001 by U.S. individuals and entities claiming small-entity fee discounts in the USPTO each year in a 10-year forward window after their disclosure. For patents choosing pregrant secrecy, disclosure is at issue (about 36 months, on average, for applications filed in 2001), and for patents choosing foreign protection or pregrant disclosure, disclosure is at 18 months from application date. Although secret patents collect on average more citations in year 1, this result may be the effect of pent-up demand for information or the comparative added maturity (on average 18 months) of the technology environment when the secret patents are first at hazard of being cited (at grant). Nevertheless, the cumulative 10-year cumulative count for secret patents is clearly dominated by those granting from the other two choice categories.
1
2
3
4
5
1 2 3 4 5 6 7 8 9 10
Num
ber o
f cum
ulat
ive
exam
iner
cita
tions
Years from patent disclosure
Foreign protection Secrecy Disclosure
6
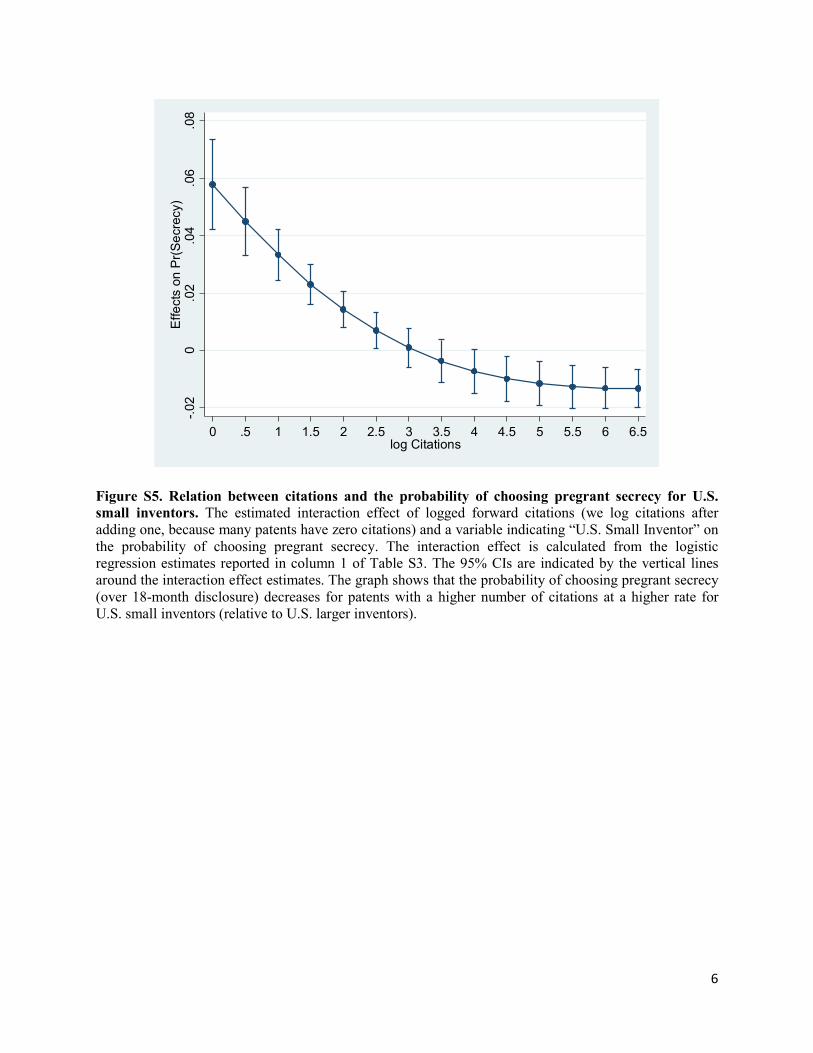
Figure S5. Relation between citations and the probability of choosing pregrant secrecy for U.S. small inventors. The estimated interaction effect of logged forward citations (we log citations after adding one, because many patents have zero citations) and a variable indicating “U.S. Small Inventor” on the probability of choosing pregrant secrecy. The interaction effect is calculated from the logistic regression estimates reported in column 1 of Table S3. The 95% CIs are indicated by the vertical lines around the interaction effect estimates. The graph shows that the probability of choosing pregrant secrecy (over 18-month disclosure) decreases for patents with a higher number of citations at a higher rate for U.S. small inventors (relative to U.S. larger inventors).
-.02
0.0
2.0
4.0
6.0
8E
ffect
s on
Pr(
Sec
recy
)
0 .5 1 1.5 2 2.5 3 3.5 4 4.5 5 5.5 6 6.5log Citations
7
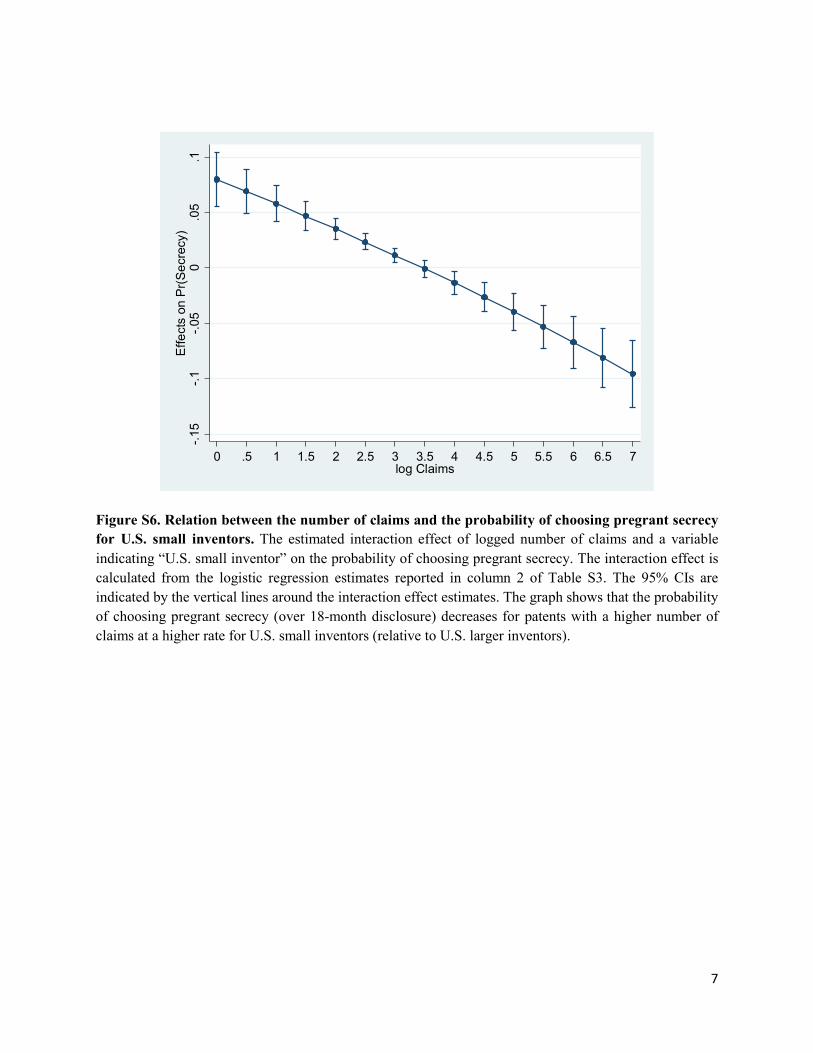
Figure S6. Relation between the number of claims and the probability of choosing pregrant secrecy for U.S. small inventors. The estimated interaction effect of logged number of claims and a variable indicating “U.S. small inventor” on the probability of choosing pregrant secrecy. The interaction effect is calculated from the logistic regression estimates reported in column 2 of Table S3. The 95% CIs are indicated by the vertical lines around the interaction effect estimates. The graph shows that the probability of choosing pregrant secrecy (over 18-month disclosure) decreases for patents with a higher number of claims at a higher rate for U.S. small inventors (relative to U.S. larger inventors).
-.15
-.1-.0
50
.05
.1E
ffect
s on
Pr(
Sec
recy
)
0 .5 1 1.5 2 2.5 3 3.5 4 4.5 5 5.5 6 6.5 7log Claims
8
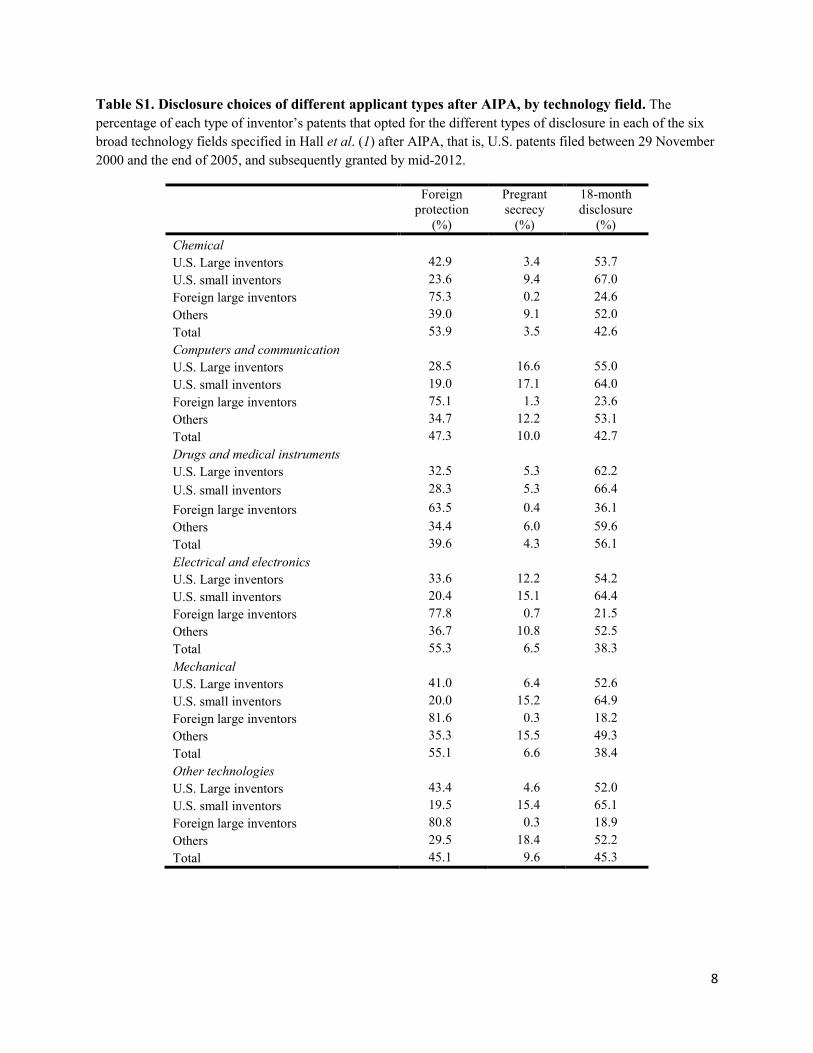
Table S1. Disclosure choices of different applicant types after AIPA, by technology field. The percentage of each type of inventor’s patents that opted for the different types of disclosure in each of the six broad technology fields specified in Hall et al. (1) after AIPA, that is, U.S. patents filed between 29 November 2000 and the end of 2005, and subsequently granted by mid-2012.
Foreign protection
(%)
Pregrant secrecy
(%)
18-month disclosure
(%) Chemical U.S. Large inventors 42.9 3.4 53.7 U.S. small inventors 23.6 9.4 67.0 Foreign large inventors 75.3 0.2 24.6 Others 39.0 9.1 52.0 Total 53.9 3.5 42.6 Computers and communication U.S. Large inventors 28.5 16.6 55.0 U.S. small inventors 19.0 17.1 64.0 Foreign large inventors 75.1 1.3 23.6 Others 34.7 12.2 53.1 Total 47.3 10.0 42.7 Drugs and medical instruments U.S. Large inventors 32.5 5.3 62.2 U.S. small inventors 28.3 5.3 66.4 Foreign large inventors 63.5 0.4 36.1 Others 34.4 6.0 59.6 Total 39.6 4.3 56.1 Electrical and electronics U.S. Large inventors 33.6 12.2 54.2 U.S. small inventors 20.4 15.1 64.4 Foreign large inventors 77.8 0.7 21.5 Others 36.7 10.8 52.5 Total 55.3 6.5 38.3 Mechanical U.S. Large inventors 41.0 6.4 52.6 U.S. small inventors 20.0 15.2 64.9 Foreign large inventors 81.6 0.3 18.2 Others 35.3 15.5 49.3 Total 55.1 6.6 38.4 Other technologies U.S. Large inventors 43.4 4.6 52.0 U.S. small inventors 19.5 15.4 65.1 Foreign large inventors 80.8 0.3 18.9 Others 29.5 18.4 52.2 Total 45.1 9.6 45.3
9
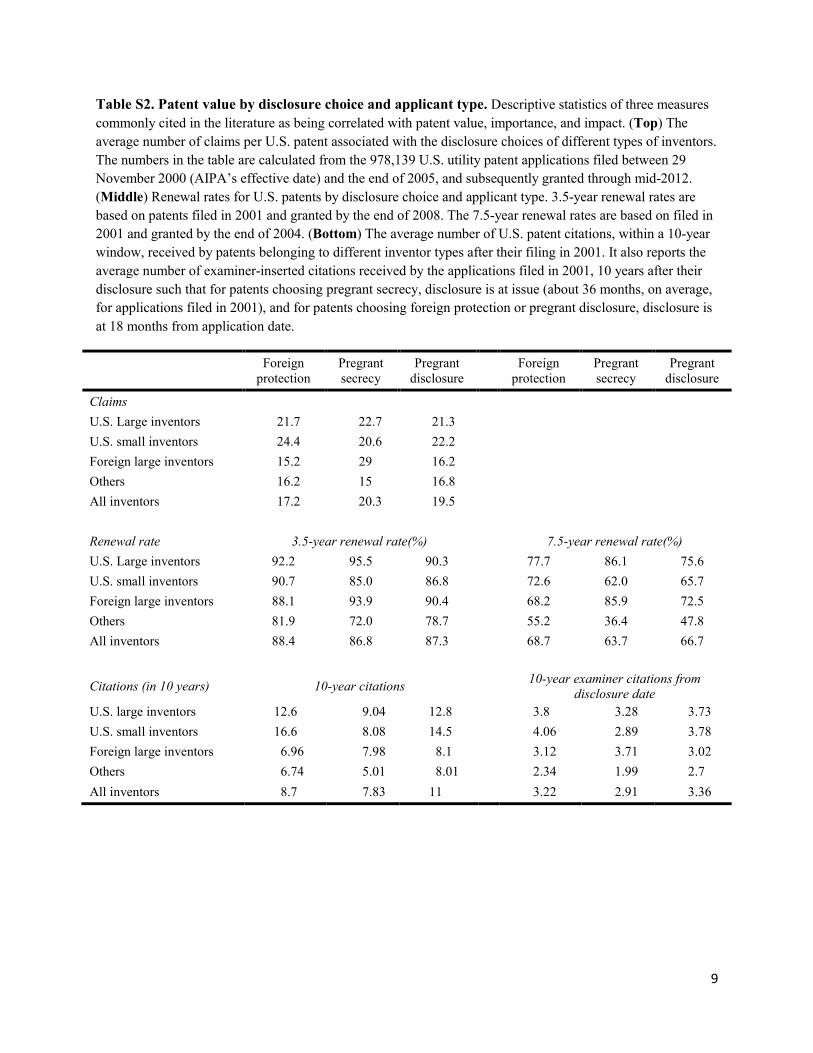
Table S2. Patent value by disclosure choice and applicant type. Descriptive statistics of three measures commonly cited in the literature as being correlated with patent value, importance, and impact. (Top) The average number of claims per U.S. patent associated with the disclosure choices of different types of inventors. The numbers in the table are calculated from the 978,139 U.S. utility patent applications filed between 29 November 2000 (AIPA’s effective date) and the end of 2005, and subsequently granted through mid-2012. (Middle) Renewal rates for U.S. patents by disclosure choice and applicant type. 3.5-year renewal rates are based on patents filed in 2001 and granted by the end of 2008. The 7.5-year renewal rates are based on filed in 2001 and granted by the end of 2004. (Bottom) The average number of U.S. patent citations, within a 10-year window, received by patents belonging to different inventor types after their filing in 2001. It also reports the average number of examiner-inserted citations received by the applications filed in 2001, 10 years after their disclosure such that for patents choosing pregrant secrecy, disclosure is at issue (about 36 months, on average, for applications filed in 2001), and for patents choosing foreign protection or pregrant disclosure, disclosure is at 18 months from application date.
Foreign
protection Pregrant secrecy
Pregrant disclosure Foreign
protection Pregrant secrecy
Pregrant disclosure
Claims U.S. Large inventors 21.7 22.7 21.3 U.S. small inventors 24.4 20.6 22.2 Foreign large inventors 15.2 29 16.2 Others 16.2 15 16.8 All inventors 17.2 20.3 19.5 Renewal rate 3.5-year renewal rate(%) 7.5-year renewal rate(%) U.S. Large inventors 92.2 95.5 90.3 77.7 86.1 75.6 U.S. small inventors 90.7 85.0 86.8 72.6 62.0 65.7 Foreign large inventors 88.1 93.9 90.4 68.2 85.9 72.5 Others 81.9 72.0 78.7 55.2 36.4 47.8 All inventors 88.4 86.8 87.3 68.7 63.7 66.7
Citations (in 10 years) 10-year citations
10-year examiner citations from disclosure date
U.S. large inventors 12.6 9.04 12.8 3.8 3.28 3.73 U.S. small inventors 16.6 8.08 14.5 4.06 2.89 3.78 Foreign large inventors 6.96 7.98 8.1 3.12 3.71 3.02 Others 6.74 5.01 8.01 2.34 1.99 2.7 All inventors 8.7 7.83 11 3.22 2.91 3.36
10
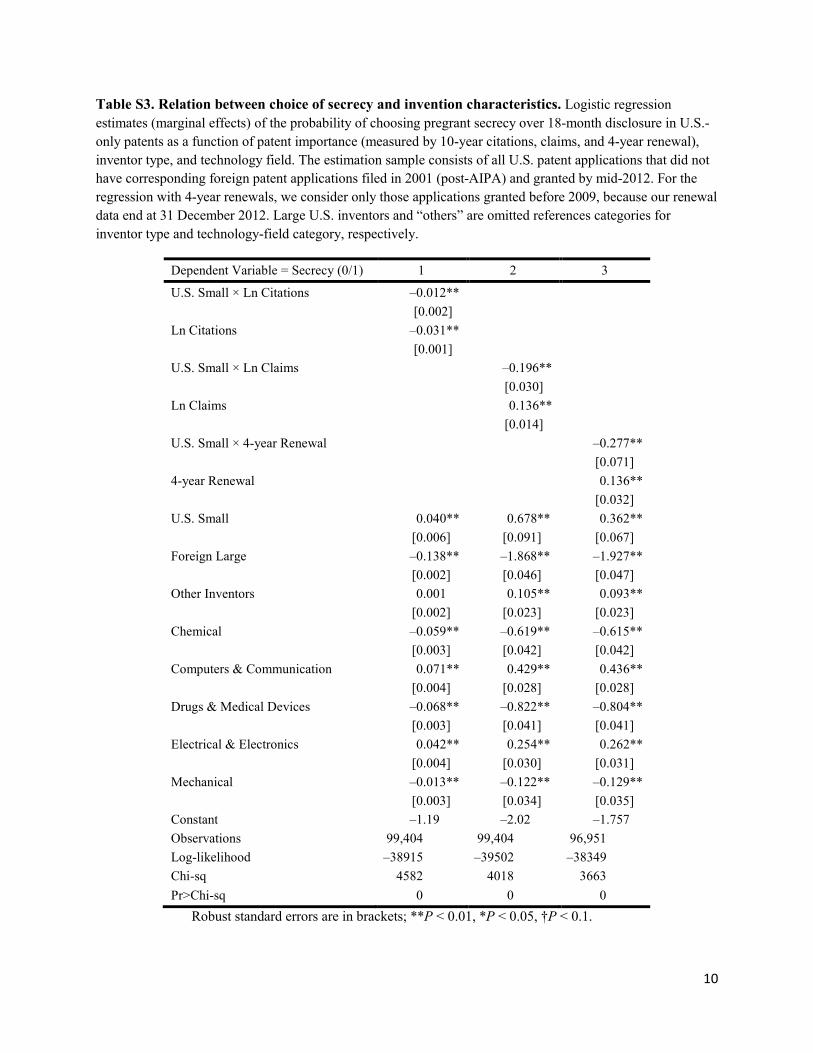
Table S3. Relation between choice of secrecy and invention characteristics. Logistic regression estimates (marginal effects) of the probability of choosing pregrant secrecy over 18-month disclosure in U.S.-only patents as a function of patent importance (measured by 10-year citations, claims, and 4-year renewal), inventor type, and technology field. The estimation sample consists of all U.S. patent applications that did not have corresponding foreign patent applications filed in 2001 (post-AIPA) and granted by mid-2012. For the regression with 4-year renewals, we consider only those applications granted before 2009, because our renewal data end at 31 December 2012. Large U.S. inventors and “others” are omitted references categories for inventor type and technology-field category, respectively.
Dependent Variable = Secrecy (0/1) 1 2 3
U.S. Small × Ln Citations –0.012** [0.002] Ln Citations –0.031** [0.001] U.S. Small × Ln Claims –0.196** [0.030] Ln Claims 0.136** [0.014] U.S. Small × 4-year Renewal –0.277**
[0.071] 4-year Renewal 0.136**
[0.032] U.S. Small 0.040** 0.678** 0.362**
[0.006] [0.091] [0.067] Foreign Large –0.138** –1.868** –1.927**
[0.002] [0.046] [0.047] Other Inventors 0.001 0.105** 0.093**
[0.002] [0.023] [0.023] Chemical –0.059** –0.619** –0.615**
[0.003] [0.042] [0.042] Computers & Communication 0.071** 0.429** 0.436**
[0.004] [0.028] [0.028] Drugs & Medical Devices –0.068** –0.822** –0.804**
[0.003] [0.041] [0.041] Electrical & Electronics 0.042** 0.254** 0.262**
[0.004] [0.030] [0.031] Mechanical –0.013** –0.122** –0.129**
[0.003] [0.034] [0.035] Constant –1.19 –2.02 –1.757 Observations 99,404 99,404 96,951 Log-likelihood –38915 –39502 –38349 Chi-sq 4582 4018 3663 Pr>Chi-sq 0 0 0
Robust standard errors are in brackets; **P < 0.01, *P < 0.05, †P < 0.1.
11
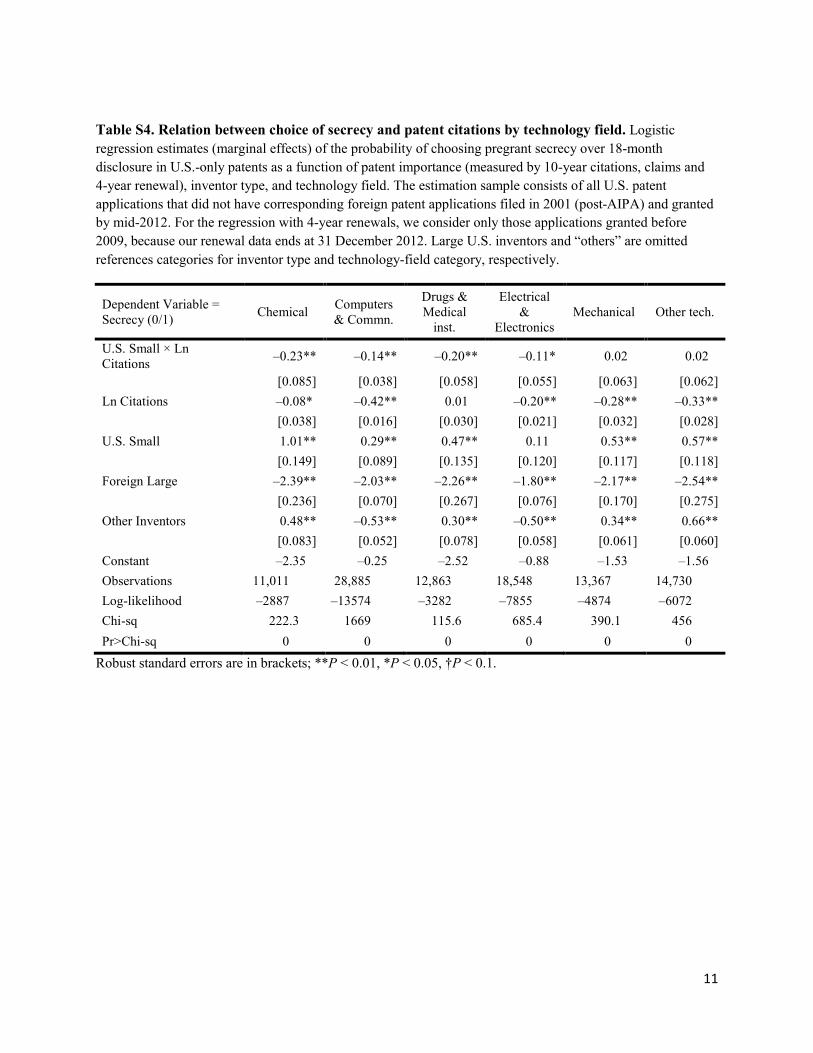
Table S4. Relation between choice of secrecy and patent citations by technology field. Logistic regression estimates (marginal effects) of the probability of choosing pregrant secrecy over 18-month disclosure in U.S.-only patents as a function of patent importance (measured by 10-year citations, claims and 4-year renewal), inventor type, and technology field. The estimation sample consists of all U.S. patent applications that did not have corresponding foreign patent applications filed in 2001 (post-AIPA) and granted by mid-2012. For the regression with 4-year renewals, we consider only those applications granted before 2009, because our renewal data ends at 31 December 2012. Large U.S. inventors and “others” are omitted references categories for inventor type and technology-field category, respectively.
Dependent Variable = Secrecy (0/1) Chemical Computers
& Commn.
Drugs & Medical
inst.
Electrical &
Electronics Mechanical Other tech.
U.S. Small × Ln Citations –0.23** –0.14** –0.20** –0.11* 0.02 0.02
[0.085] [0.038] [0.058] [0.055] [0.063] [0.062] Ln Citations –0.08* –0.42** 0.01 –0.20** –0.28** –0.33**
[0.038] [0.016] [0.030] [0.021] [0.032] [0.028] U.S. Small 1.01** 0.29** 0.47** 0.11 0.53** 0.57**
[0.149] [0.089] [0.135] [0.120] [0.117] [0.118] Foreign Large –2.39** –2.03** –2.26** –1.80** –2.17** –2.54**
[0.236] [0.070] [0.267] [0.076] [0.170] [0.275] Other Inventors 0.48** –0.53** 0.30** –0.50** 0.34** 0.66**
[0.083] [0.052] [0.078] [0.058] [0.061] [0.060] Constant –2.35 –0.25 –2.52 –0.88 –1.53 –1.56 Observations 11,011 28,885 12,863 18,548 13,367 14,730 Log-likelihood –2887 –13574 –3282 –7855 –4874 –6072 Chi-sq 222.3 1669 115.6 685.4 390.1 456 Pr>Chi-sq 0 0 0 0 0 0
Robust standard errors are in brackets; **P < 0.01, *P < 0.05, †P < 0.1.

12
Table S5. Relation between choice of secrecy and number of claims by technology field. Logistic regression estimates (marginal effects) of the probability of choosing pregrant secrecy over 18-month disclosure in U.S.-only patents as a function of patent importance (measured by number of claims) and inventor type for each of the six patent technology fields specified in Hall et al. (1). The estimation sample consists of all U.S. patent applications that did not have corresponding foreign patent applications filed in 2001 (post-AIPA) and granted by mid-2012. “Large U.S. inventors” is the omitted reference category for inventor type.
Dependent Variable = Secrecy (0/1) Chemical Computers
& Comm’n.
Drugs & Medical instrum.
Electrical & Electronics Mechanical Other tech.
U.S. Small × Ln Claims –0.19* –0.28** –0.21* –0.31** 0.03 –0.02
[0.096] [0.054] [0.096] [0.076] [0.080] [0.073] Ln Claims 0.12* 0.25** 0.11* 0.21** 0.06 –0.03
[0.048] [0.025] [0.048] [0.030] [0.038] [0.033] U.S. Small 1.21** 0.74** 0.69* 0.80** 0.47* 0.71**
[0.285] [0.171] [0.284] [0.231] [0.237] [0.214] Foreign Large –2.32** –1.82** –2.25** –1.70** –2.09** –2.43**
[0.237] [0.070] [0.266] [0.077] [0.171] [0.274] Other Inventors 0.51** –0.43** 0.32** –0.40** 0.42** 0.77**
[0.083] [0.051] [0.078] [0.058] [0.062] [0.061] Constant –2.82 –1.85 –2.85 –1.87 –2.13 –2.04 Observations 11,011 28,885 12,863 18,548 13,367 14,730 Log-likelihood –2895 –14037 –3285 –7895 –4922 –6154 Chi-sq 206.8 982.9 116.3 717.2 299 302.5 Pr>Chi-sq 0 0 0 0 0 0
Robust standard errors are in brackets; **P < 0.01, *P < 0.05, †P < 0.1.
13
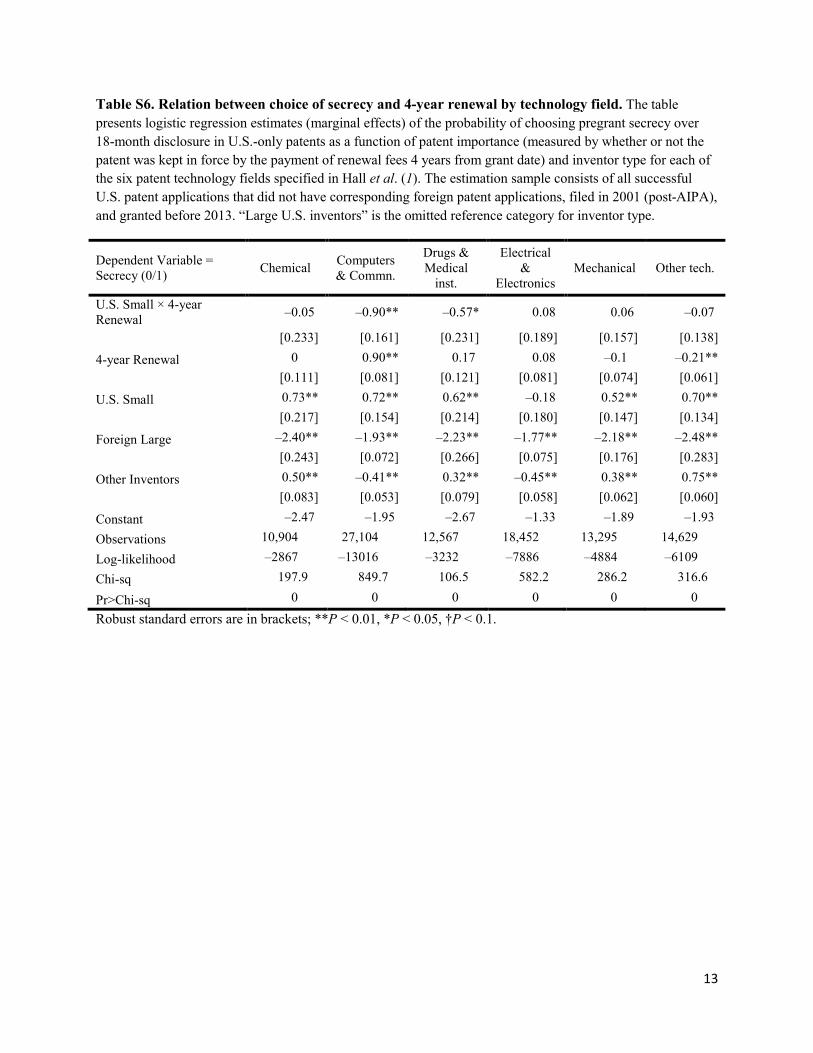
Table S6. Relation between choice of secrecy and 4-year renewal by technology field. The table presents logistic regression estimates (marginal effects) of the probability of choosing pregrant secrecy over 18-month disclosure in U.S.-only patents as a function of patent importance (measured by whether or not the patent was kept in force by the payment of renewal fees 4 years from grant date) and inventor type for each of the six patent technology fields specified in Hall et al. (1). The estimation sample consists of all successful U.S. patent applications that did not have corresponding foreign patent applications, filed in 2001 (post-AIPA), and granted before 2013. “Large U.S. inventors” is the omitted reference category for inventor type.
Dependent Variable = Secrecy (0/1) Chemical Computers
& Commn.
Drugs & Medical
inst.
Electrical &
Electronics Mechanical Other tech.
U.S. Small × 4-year Renewal –0.05 –0.90** –0.57* 0.08 0.06 –0.07
[0.233] [0.161] [0.231] [0.189] [0.157] [0.138]
4-year Renewal 0 0.90** 0.17 0.08 –0.1 –0.21**
[0.111] [0.081] [0.121] [0.081] [0.074] [0.061]
U.S. Small 0.73** 0.72** 0.62** –0.18 0.52** 0.70**
[0.217] [0.154] [0.214] [0.180] [0.147] [0.134]
Foreign Large –2.40** –1.93** –2.23** –1.77** –2.18** –2.48**
[0.243] [0.072] [0.266] [0.075] [0.176] [0.283]
Other Inventors 0.50** –0.41** 0.32** –0.45** 0.38** 0.75**
[0.083] [0.053] [0.079] [0.058] [0.062] [0.060]
Constant –2.47 –1.95 –2.67 –1.33 –1.89 –1.93
Observations 10,904 27,104 12,567 18,452 13,295 14,629
Log-likelihood –2867 –13016 –3232 –7886 –4884 –6109
Chi-sq 197.9 849.7 106.5 582.2 286.2 316.6
Pr>Chi-sq 0 0 0 0 0 0
Robust standard errors are in brackets; **P < 0.01, *P < 0.05, †P < 0.1.
14
Supplementary Text
Section S1
This section provides information on the literature relating to inventors’ choices over patenting and secrecy. Mirroring the contract embodied in the patent system—the choice inventors must make between patent exclusivity and disclosure—the economics literature has often focused on the costs associated with publication, such as informing rivals about the invention, reducing competitors' costs of "inventing around," and providing rivals with nonroyalty use of the invention after the patent expires. A large body of theoretical work in economics has assumed that inventors value secrecy (nondisclosure) for their inventions, and that they choose among different appropriability mechanisms, such as patents and trade secrecy, on the basis of the costs of disclosure associated with patenting [e.g., (2–6)].
Although the prior economics literature has generally considered disclosure a cost, a few theoretical and empirical findings demonstrate benefits flowing to inventors from disclosure. For example, Long (7) argues that patent publication plays a significant role in mitigating the asymmetric information between patentees and external observers and may particularly benefit small firms. Scotchmer (8) shows that publication can notify rivals and licensees about exclusive property rights and thereby provide the inventor with competitive advantage and royalties. Evidence for the latter concept is provided by Gans, Hsu, and Stern (9) in the university licensing context and, more recently, by Hegde and Luo (10) in a larger sample of corporate licensors and licensees. Because we found theory and evidence on both sides of this question, we take an agnostic approach as to whether disclosure is net beneficial or costly and, instead, allow the revealed preferences of inventors—their disclosure choices exposed in the data—to speak for themselves on the question in our publication. Using data on U.S. patents granted before AIPA’s enactment, Johnson and Popp (11) provide evidence that early disclosure of patents may benefit society by accelerating the diffusion of technical knowledge.
15
Section S2
This section provides information on the patent law changes introduced with 18-month pregrant publication in the American Inventors’ Protection Act (AIPA) of 1999, to address possible concerns that our findings are the result of substantial shifts in patent applicant behavior associated with other policy changes. We investigated the legislative history and are satisfied that, although there were changes introduced in the AIPA that would tend to change the selection into patenting by inventors, none of these changes appears to us to have enough impact to produce substantial changes in the propensity to patent. For completeness, we reprint those here:
Subtitle B. The Patent and Trademark Fee Fairness Act of 1999: Reduced certain patent fees by relatively small increments: the original filing fee; the reissue fee (a postgrant fee, so not relevant until on average 3 years after initial filing, and then only in rare circumstances); and the international application fee were each reduced from $760 to $690. The initial maintenance fee (due at 3.5 years after grant, so on average 6.5 years after initial filing) was reduced from $940 to $830.
Subtitle C. First Inventor Defense Act of 1999: Provided a limited prior-users defense in the realm of “business method” patents, first made patentable in the State Street Bank court decision (12). The defense was limited in that it was only available to a person who actually used the method more than 1 year before the patent filing, and anyone asserting the defense in court was given the burden of proving it, and failing to prove prior use, was responsible for paying the other party’s attorney fees (fee shifting) upon losing at trial.
Subtitle D. The Patent Term Guarantee Act of 1999: Extended the term of patents to compensate for certain PTO processing delays and for PTO delays in the prosecution of applications; diligent applicants were to be afforded not less than a 17-year term.
Subtitle F. The Optional Inter Partes Reexamination Procedure Act of 1999: Established a reexamination alternative expanding the participation of third-party requesters.
16
Section S3
This section addresses whether our statistical finding—that patent applicants at the USPTO systematically prefer 18-month publication of their patent applications over pregrant secrecy (nonpublication)—can be explained by how the USPTO frames or presents the default rule.
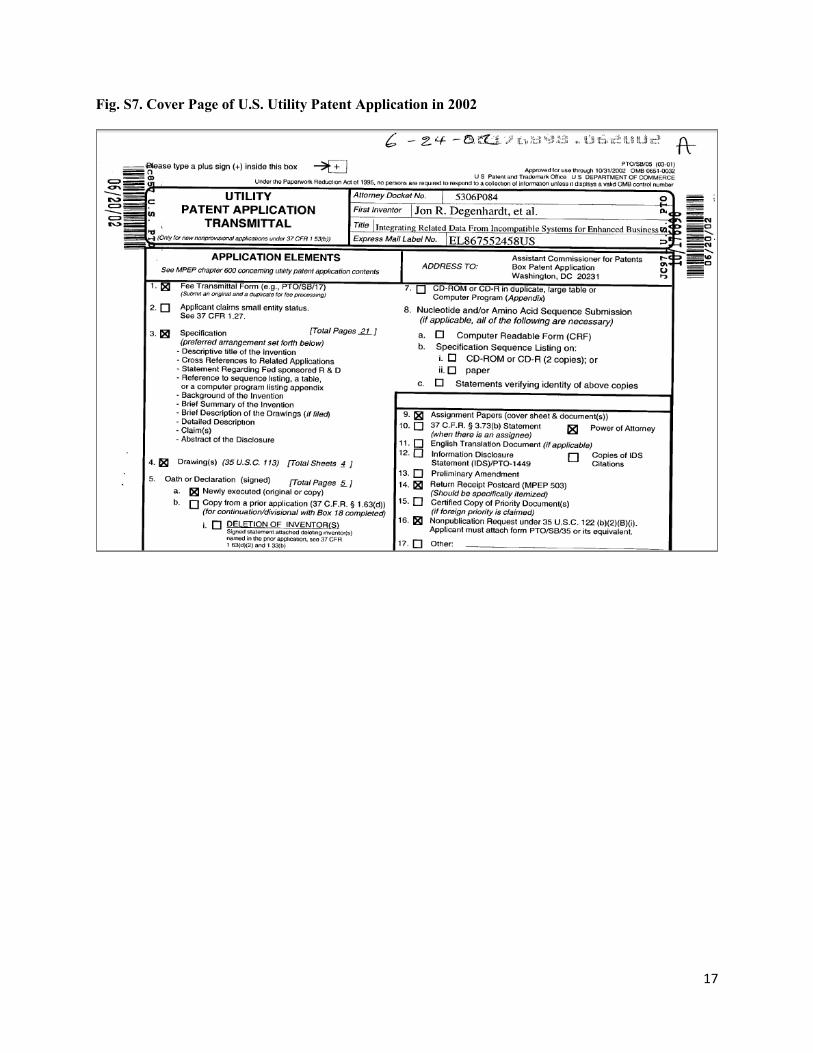
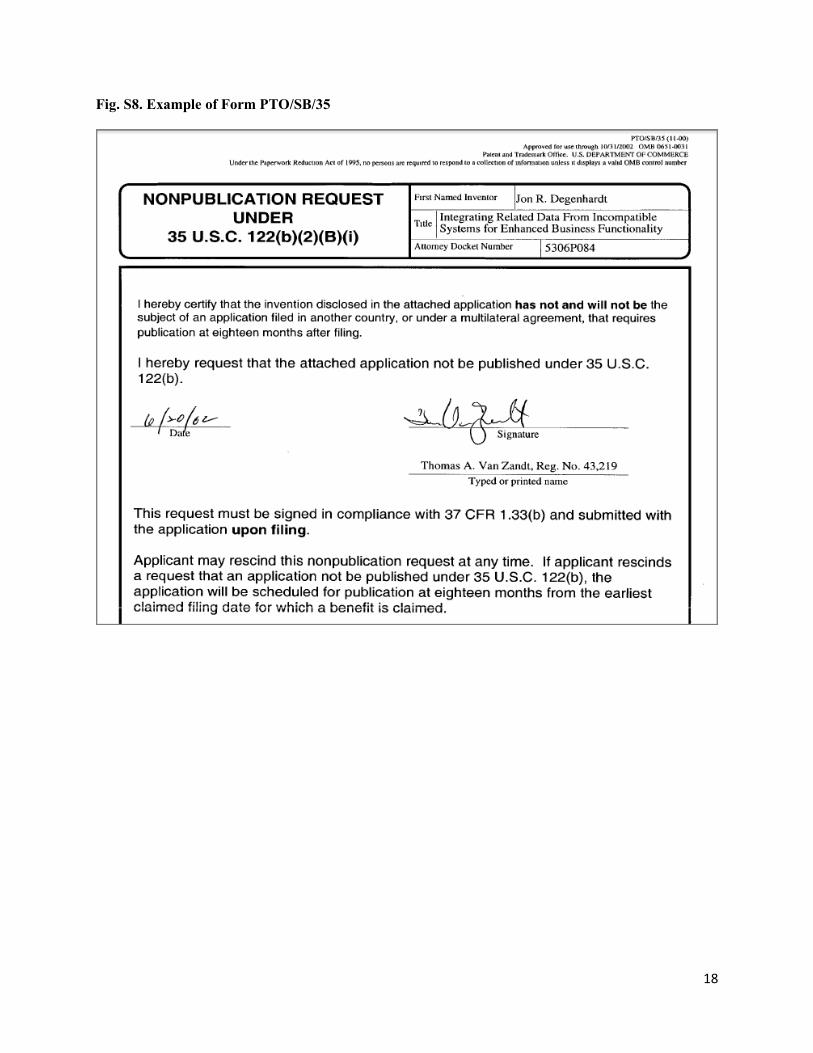
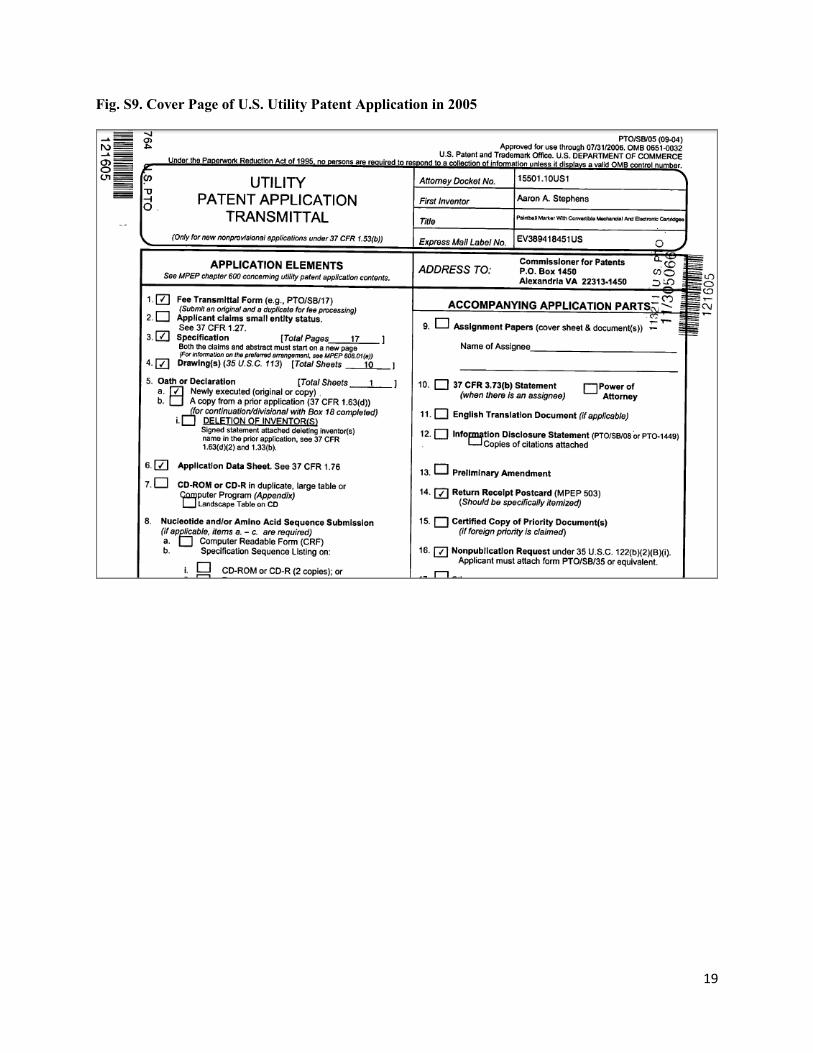
First, the American Inventors Protection Act (AIPA) makes clear that to benefit from secrecy until grant, the patent applicant must make a conspicuous indication at the time of filing. Reflecting this requirement, the USPTO changed its official patent application form (see 16 in Fig. S7 below which presents a screen shot from a U.S. utility patent application filed in 2002) to make that choice conspicuous and obvious. The requirement of filing another form (PTO/SB/35 referred to under 16 of Fig. S7) is not onerous, because the form requires only a signature and a few text entries, and may be completed by the attorney (see Fig. S8 for an example). Although the choice is made obvious in this 2002-dated form, the form that replaced it by 2005 (the last year in our sample data) made the choice arguably even more obvious, with bolded text (screen shot in Fig. S9), demonstrating that the official USPTO forms have made an obvious choice even more obvious over time. As such, if the effect we find is due to “framing,” then this trend would be at odds with the pattern we observe in the data—that fewer nondisclosure requests have been made year-on-year since AIPA was enacted (starting with about 8% in 2001, down to 6.5% in 2005). Second, the vast majority of patent applications are processed by “experts”—the learned intermediary patent agent or attorney. These agents are specially trained in the patent law and its intricacies, and it is unlikely that they are unaware of the rules or are making poor choices for their (untrained) inventor clients. Third, the USPTO has a formal process for rescinding nonpublication requests, which primarily consists of filling out a form (Form PTO/SB/36) requesting rescission and transmitting the same to the USPTO. In contrast, the option to withdraw an initial election to publish at 18 months remains available (in case the applicant chooses not to file abroad), but the associated transaction costs are not trivial (ordinarily, it requires abandoning the initial application and filing a type of “reapplication”—a continuation—which requires the payment of an additional filing fee: in 2005, $795, $395 for small entities, plus attorneys’ costs for reprocessing). Finally, the choice of greatest interest to us (and to society) is the choice by inventors concerning their most valuable inventions. Our results show that this choice against secrecy becomes stronger as inventions become more valuable. It seems unlikely that if the disclosure choice was being driven by framing that this effect would be exacerbated as private value rises. We would expect the opposite if framing was driving our result, because mistakes driven by inattention would be correlated with low value, not the other way around. For the above reasons, we believe that “framing” or “default rule” biases cannot explain our results.
17
Fig. S7. Cover Page of U.S. Utility Patent Application in 2002
18
Fig. S8. Example of Form PTO/SB/35
19
Fig. S9. Cover Page of U.S. Utility Patent Application in 2005
20
Supplementary References
1. B. Hall, A. Jaffe, M. Trajtenberg, The NBER Patent Citations Data File: Lessons, Insights and Methodological Tools (Working paper 8498, NBER, Cambridge, MA, 2001).
2. I. Horstmann, G. MacDonald, A. Slivinski, Patents as information transfer mechanism: To patent or (maybe) not to patent. J. Polit. Econ. 93, 837–856 (1985). doi:10.1086/261338
3. D. Friedman, W. Landes, R. Posner, Some economics of trade secret law. J. Econ. Perspect. 5, 61–72 (1991). doi:10.1257/jep.5.1.61
4. N. Gallini, Patent policy and costly imitation. Rand J. Econ. 23, 52–63 (1992). doi:10.2307/2555432
5. J. Anton, D. Yao, Little patents and big secrets: Managing intellectual property. Rand J. Econ. 35, 1–22 (2004). doi:10.2307/1593727
6. R. Aoki, Y. Spiegel, Pregrant patent publication and cumulative innovation. Int. J. Ind. Organ. 27, 333–345 (2009). doi:10.1016/j.ijindorg.2008.10.002
7. C. Long, Patent signals. Univ. Chic. Law Rev. 69, 625–679 (2002). doi:10.2307/1600501
8. S. Scotchmer, Innovation and Incentives (MIT Press, Cambridge, MA, 2004).
9. J. Gans, D. Hsu, S. Stern, The impact of uncertain intellectual property rights on the market for ideas: Evidence from patent grant delays. Manage. Sci. 54, 982–997 (2008). doi:10.1287/mnsc.1070.0814
10. D. Hegde, H. Luo, Imperfect Information, Patent Publication, and the Market for Ideas (Working paper 14-019, Harvard Business School, Cambridge, MA, 2013).
11. D. K. N. Johnson, D. Popp, Forced out of the closet: The impact of the American Inventors Protection Act on the timing of patent disclosure. Rand J. Econ. 34, 96–112 (2003). doi:10.2307/3087445
12. Bank State Street Bank and Trust Company 1998 C6 v. Almonesson Associates LP Kenneth Goldenberg, 149 F.3d 1368 (Fed. Cir. 1998).