Embed Size (px)
Citation preview
lable at ScienceDirect
Environmental Pollution 184 (2014) 154e160
Contents lists avai
Environmental Pollution
journal homepage: www.elsevier .com/locate/envpol
Integrative demographic modeling reveals population level impacts ofPCB toxicity to juvenile snapping turtles
Christopher J. Salice a, *, Christopher L. Rowe b, Karen M. Eisenreich b
a Department of Environmental Toxicology, Texas Tech University, Lubbock, TX 79410, USAb University of Maryland Center for Environmental Science, Chesapeake Biological Laboratory, Solomons, MD 20688, USA
a r t i c l e i n f o
Article history:Received 26 February 2013Received in revised form6 August 2013Accepted 9 August 2013
Keywords:TurtlePopulation modelPCBsEcological riskReptile ecotoxicology
* Corresponding author.E-mail addresses: [email protected] (C.J. Salice),
0269-7491/$ e see front matter � 2013 Elsevier Ltd.http://dx.doi.org/10.1016/j.envpol.2013.08.031
a b s t r a c t
A significant challenge in ecotoxicology and risk assessment lies in placing observed contaminant effectsin a meaningful ecological context. Polychlorinated biphenyls (PCBs) have been shown to affect juvenilesnapping turtle survival and growth but the ecological significance of these effects is difficult to discernwithout a formal, population-level assessment. We used a demographic matrix model to explore thepotential population-level effects of PCBs on turtles. Our model showed that effects of PCBs on juvenilesurvival, growth and size at hatching could translate to negative effects at the population level despitethe fact that these life cycle components do not typically contribute strongly to population level pro-cesses. This research points to the utility of using integrative demographic modeling approaches to betterunderstand contaminant effects in wildlife. The results indicate that population-level effects are onlyevident after several years, suggesting that for long-lived species, detecting adverse contaminant effectscould prove challenging.
� 2013 Elsevier Ltd. All rights reserved.
1. Introduction
Despite the ban on PCBs imposed in the U.S. in 1979, PCBscontinue to impact species in contaminated habitats due to theirpersistence and historically wide use. The upper Hudson River, forexample, is characterized by high levels of PCB contaminationthat resulted primarily from historical discharges from twoelectric capacitor plants operated by the General Electric Corpo-ration (see Baker et al., 2006; NOAA, 2013). The PCB contaminatedregion of the Hudson River is occupied by many species ofwildlife and thus there has been a long-standing concern thatPCBs may deleteriously impact resident organisms. PCBs can exerta number of toxic effects on exposed animal species includingdisruption of endocrine function, immunotoxicity, developmentaleffects and alterations in metabolism (Hoffman, 2003), any ofwhich may impact fitness by reducing survival, growth orreproductive success.
Previous research on common snapping turtles, Chelydra ser-pentina, from the upper Hudson River, NY, USA showed that tur-tles from PCB-contaminated habitats experienced reducedjuvenile survival and growth that manifested long after hatching,
[email protected] (C.L. Rowe).
All rights reserved.
representing significant latent effects (Eisenreich et al., 2009).Specifically, by 14 months post hatch, only 40% of laboratory-reared juveniles obtained from mothers from the most PCBcontaminated portion of the Hudson River survived, compared to90% of juveniles obtained from mothers from uncontaminatedareas (Eisenreich et al., 2009). Growth was also affected bymaternally transferred PCBs: the post-overwintering size ofhatchlings from PCB-exposed mothers was significantly smallerthan hatchlings from reference sites (Eisenreich et al., 2009).Although effects of PCBs have been observed in other species(Aulerich and Ringer, 1977; Örn et al., 1998; Harris and Elliott,2011), the study by Eisenreich et al. (2009) is among the fewstudies on PCB exposure and effects in wild turtles. Another lab-oratory study has also shown that PCBs can decrease growth ratesin juvenile turtles (Malaclemys terrapin; Holliday et al., 2009) andthe observed effect may, in part, be mediated by affects on bonedensity (Holliday and Holliday, 2012). Despite the strong andobvious indicators of PCB toxicity to turtles, uncertainties remainregarding how these effects observed in juvenile turtles maymanifest at the population level.
A primary objective in ecotoxicology and ecological riskassessment is to determine at what level of contaminant exposurenatural populations might show adverse effects. Ideally, inferencesobtained from laboratory or field studies can be clearly linked toexpected effects in wild populations although, in practice, this linkcan be difficult to establish (Forbes et al., 2008). Population-level
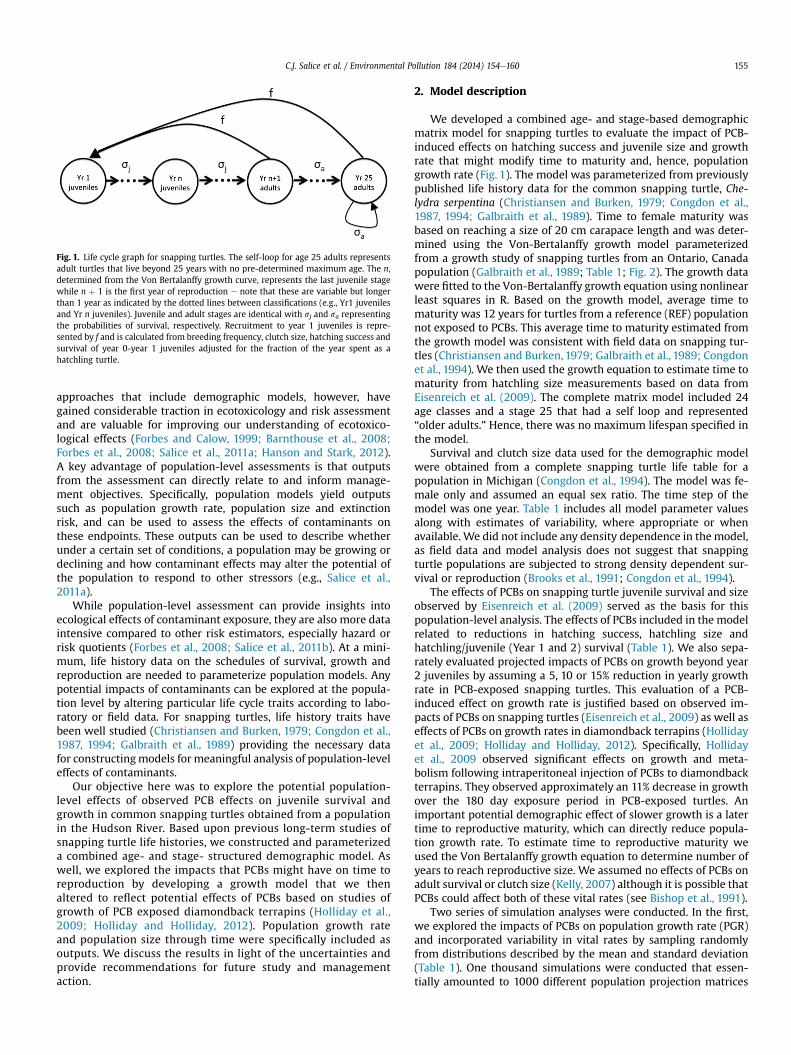
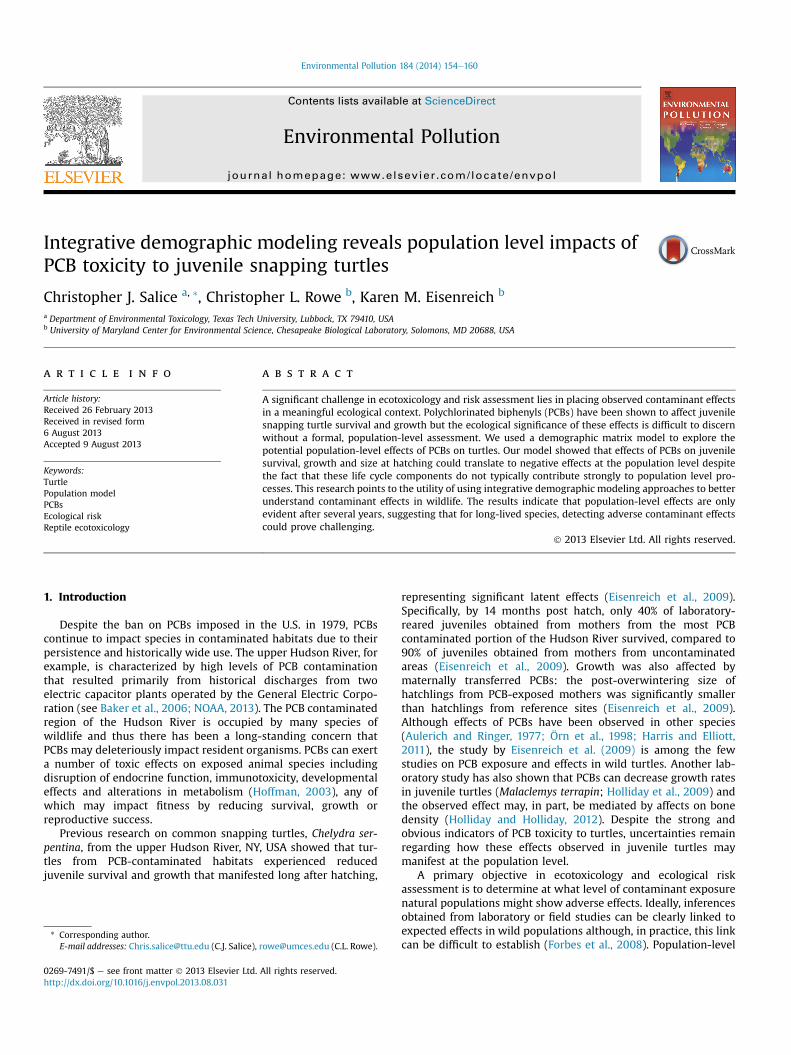
Fig. 1. Life cycle graph for snapping turtles. The self-loop for age 25 adults representsadult turtles that live beyond 25 years with no pre-determined maximum age. The n,determined from the Von Bertalanffy growth curve, represents the last juvenile stagewhile n þ 1 is the first year of reproduction e note that these are variable but longerthan 1 year as indicated by the dotted lines between classifications (e.g., Yr1 juvenilesand Yr n juveniles). Juvenile and adult stages are identical with sj and sa representingthe probabilities of survival, respectively. Recruitment to year 1 juveniles is repre-sented by f and is calculated from breeding frequency, clutch size, hatching success andsurvival of year 0-year 1 juveniles adjusted for the fraction of the year spent as ahatchling turtle.
C.J. Salice et al. / Environmental Pollution 184 (2014) 154e160 155
approaches that include demographic models, however, havegained considerable traction in ecotoxicology and risk assessmentand are valuable for improving our understanding of ecotoxico-logical effects (Forbes and Calow, 1999; Barnthouse et al., 2008;Forbes et al., 2008; Salice et al., 2011a; Hanson and Stark, 2012).A key advantage of population-level assessments is that outputsfrom the assessment can directly relate to and inform manage-ment objectives. Specifically, population models yield outputssuch as population growth rate, population size and extinctionrisk, and can be used to assess the effects of contaminants onthese endpoints. These outputs can be used to describe whetherunder a certain set of conditions, a population may be growing ordeclining and how contaminant effects may alter the potential ofthe population to respond to other stressors (e.g., Salice et al.,2011a).
While population-level assessment can provide insights intoecological effects of contaminant exposure, they are also more dataintensive compared to other risk estimators, especially hazard orrisk quotients (Forbes et al., 2008; Salice et al., 2011b). At a mini-mum, life history data on the schedules of survival, growth andreproduction are needed to parameterize population models. Anypotential impacts of contaminants can be explored at the popula-tion level by altering particular life cycle traits according to labo-ratory or field data. For snapping turtles, life history traits havebeen well studied (Christiansen and Burken, 1979; Congdon et al.,1987, 1994; Galbraith et al., 1989) providing the necessary datafor constructingmodels for meaningful analysis of population-leveleffects of contaminants.
Our objective here was to explore the potential population-level effects of observed PCB effects on juvenile survival andgrowth in common snapping turtles obtained from a populationin the Hudson River. Based upon previous long-term studies ofsnapping turtle life histories, we constructed and parameterizeda combined age- and stage- structured demographic model. Aswell, we explored the impacts that PCBs might have on time toreproduction by developing a growth model that we thenaltered to reflect potential effects of PCBs based on studies ofgrowth of PCB exposed diamondback terrapins (Holliday et al.,2009; Holliday and Holliday, 2012). Population growth rateand population size through time were specifically included asoutputs. We discuss the results in light of the uncertainties andprovide recommendations for future study and managementaction.
2. Model description
We developed a combined age- and stage-based demographicmatrix model for snapping turtles to evaluate the impact of PCB-induced effects on hatching success and juvenile size and growthrate that might modify time to maturity and, hence, populationgrowth rate (Fig. 1). The model was parameterized from previouslypublished life history data for the common snapping turtle, Che-lydra serpentina (Christiansen and Burken, 1979; Congdon et al.,1987, 1994; Galbraith et al., 1989). Time to female maturity wasbased on reaching a size of 20 cm carapace length and was deter-mined using the Von-Bertalanffy growth model parameterizedfrom a growth study of snapping turtles from an Ontario, Canadapopulation (Galbraith et al., 1989; Table 1; Fig. 2). The growth datawere fitted to the Von-Bertalanffy growth equation using nonlinearleast squares in R. Based on the growth model, average time tomaturity was 12 years for turtles from a reference (REF) populationnot exposed to PCBs. This average time to maturity estimated fromthe growth model was consistent with field data on snapping tur-tles (Christiansen and Burken, 1979; Galbraith et al., 1989; Congdonet al., 1994). We then used the growth equation to estimate time tomaturity from hatchling size measurements based on data fromEisenreich et al. (2009). The complete matrix model included 24age classes and a stage 25 that had a self loop and represented“older adults.” Hence, there was no maximum lifespan specified inthe model.
Survival and clutch size data used for the demographic modelwere obtained from a complete snapping turtle life table for apopulation in Michigan (Congdon et al., 1994). The model was fe-male only and assumed an equal sex ratio. The time step of themodel was one year. Table 1 includes all model parameter valuesalong with estimates of variability, where appropriate or whenavailable. We did not include any density dependence in themodel,as field data and model analysis does not suggest that snappingturtle populations are subjected to strong density dependent sur-vival or reproduction (Brooks et al., 1991; Congdon et al., 1994).
The effects of PCBs on snapping turtle juvenile survival and sizeobserved by Eisenreich et al. (2009) served as the basis for thispopulation-level analysis. The effects of PCBs included in the modelrelated to reductions in hatching success, hatchling size andhatchling/juvenile (Year 1 and 2) survival (Table 1). We also sepa-rately evaluated projected impacts of PCBs on growth beyond year2 juveniles by assuming a 5, 10 or 15% reduction in yearly growthrate in PCB-exposed snapping turtles. This evaluation of a PCB-induced effect on growth rate is justified based on observed im-pacts of PCBs on snapping turtles (Eisenreich et al., 2009) as well aseffects of PCBs on growth rates in diamondback terrapins (Hollidayet al., 2009; Holliday and Holliday, 2012). Specifically, Hollidayet al., 2009 observed significant effects on growth and meta-bolism following intraperitoneal injection of PCBs to diamondbackterrapins. They observed approximately an 11% decrease in growthover the 180 day exposure period in PCB-exposed turtles. Animportant potential demographic effect of slower growth is a latertime to reproductive maturity, which can directly reduce popula-tion growth rate. To estimate time to reproductive maturity weused the Von Bertalanffy growth equation to determine number ofyears to reach reproductive size. We assumed no effects of PCBs onadult survival or clutch size (Kelly, 2007) although it is possible thatPCBs could affect both of these vital rates (see Bishop et al., 1991).
Two series of simulation analyses were conducted. In the first,we explored the impacts of PCBs on population growth rate (PGR)and incorporated variability in vital rates by sampling randomlyfrom distributions described by the mean and standard deviation(Table 1). One thousand simulations were conducted that essen-tially amounted to 1000 different population projection matrices
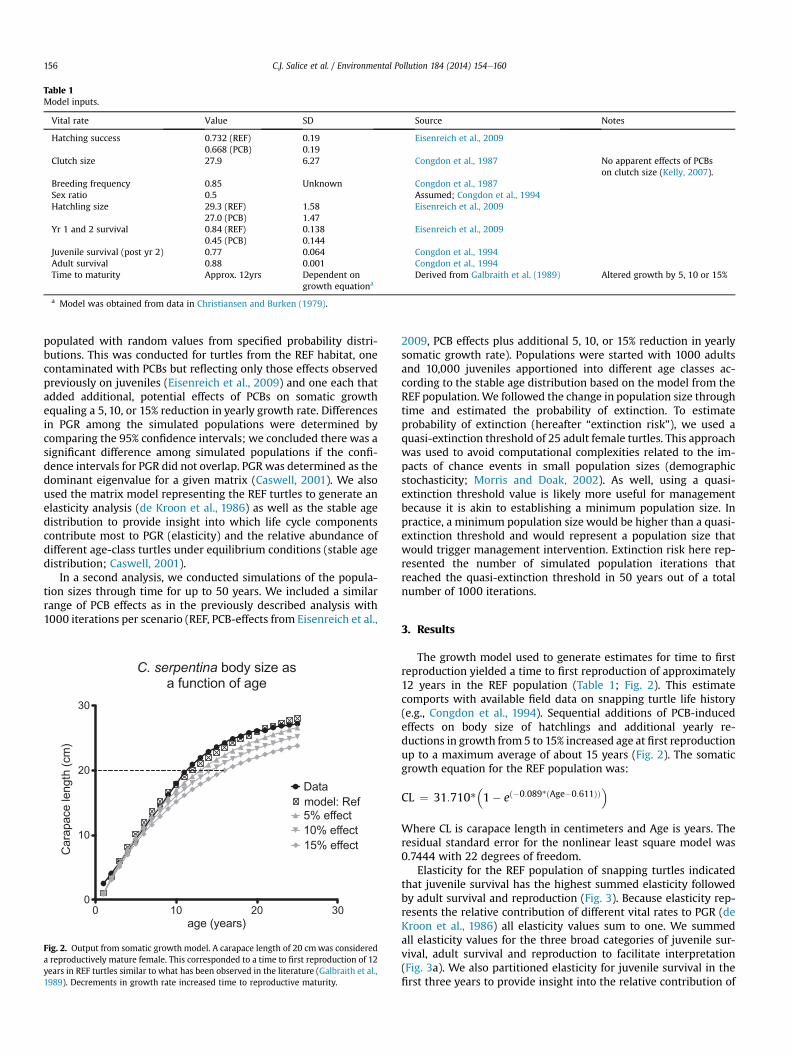
Table 1Model inputs.
Vital rate Value SD Source Notes
Hatching success 0.732 (REF)0.668 (PCB)
0.190.19
Eisenreich et al., 2009
Clutch size 27.9 6.27 Congdon et al., 1987 No apparent effects of PCBson clutch size (Kelly, 2007).
Breeding frequency 0.85 Unknown Congdon et al., 1987Sex ratio 0.5 Assumed; Congdon et al., 1994Hatchling size 29.3 (REF)
27.0 (PCB)1.581.47
Eisenreich et al., 2009
Yr 1 and 2 survival 0.84 (REF)0.45 (PCB)
0.1380.144
Eisenreich et al., 2009
Juvenile survival (post yr 2) 0.77 0.064 Congdon et al., 1994Adult survival 0.88 0.001 Congdon et al., 1994Time to maturity Approx. 12yrs Dependent on
growth equationaDerived from Galbraith et al. (1989) Altered growth by 5, 10 or 15%
a Model was obtained from data in Christiansen and Burken (1979).
C.J. Salice et al. / Environmental Pollution 184 (2014) 154e160156
populated with random values from specified probability distri-butions. This was conducted for turtles from the REF habitat, onecontaminated with PCBs but reflecting only those effects observedpreviously on juveniles (Eisenreich et al., 2009) and one each thatadded additional, potential effects of PCBs on somatic growthequaling a 5, 10, or 15% reduction in yearly growth rate. Differencesin PGR among the simulated populations were determined bycomparing the 95% confidence intervals; we concluded there was asignificant difference among simulated populations if the confi-dence intervals for PGR did not overlap. PGR was determined as thedominant eigenvalue for a given matrix (Caswell, 2001). We alsoused the matrix model representing the REF turtles to generate anelasticity analysis (de Kroon et al., 1986) as well as the stable agedistribution to provide insight into which life cycle componentscontribute most to PGR (elasticity) and the relative abundance ofdifferent age-class turtles under equilibrium conditions (stable agedistribution; Caswell, 2001).
In a second analysis, we conducted simulations of the popula-tion sizes through time for up to 50 years. We included a similarrange of PCB effects as in the previously described analysis with1000 iterations per scenario (REF, PCB-effects from Eisenreich et al.,
C. serpentina body size asa function of age
0 10 20 300
10
20
30
Datamodel: Ref5% effect10% effect15% effect
age (years)
Carapacelengt(cm)
h
Fig. 2. Output from somatic growth model. A carapace length of 20 cmwas considereda reproductively mature female. This corresponded to a time to first reproduction of 12years in REF turtles similar to what has been observed in the literature (Galbraith et al.,1989). Decrements in growth rate increased time to reproductive maturity.
2009, PCB effects plus additional 5, 10, or 15% reduction in yearlysomatic growth rate). Populations were started with 1000 adultsand 10,000 juveniles apportioned into different age classes ac-cording to the stable age distribution based on the model from theREF population. We followed the change in population size throughtime and estimated the probability of extinction. To estimateprobability of extinction (hereafter “extinction risk”), we used aquasi-extinction threshold of 25 adult female turtles. This approachwas used to avoid computational complexities related to the im-pacts of chance events in small population sizes (demographicstochasticity; Morris and Doak, 2002). As well, using a quasi-extinction threshold value is likely more useful for managementbecause it is akin to establishing a minimum population size. Inpractice, a minimum population size would be higher than a quasi-extinction threshold and would represent a population size thatwould trigger management intervention. Extinction risk here rep-resented the number of simulated population iterations thatreached the quasi-extinction threshold in 50 years out of a totalnumber of 1000 iterations.
3. Results
The growth model used to generate estimates for time to firstreproduction yielded a time to first reproduction of approximately12 years in the REF population (Table 1; Fig. 2). This estimatecomports with available field data on snapping turtle life history(e.g., Congdon et al., 1994). Sequential additions of PCB-inducedeffects on body size of hatchlings and additional yearly re-ductions in growth from 5 to 15% increased age at first reproductionup to a maximum average of about 15 years (Fig. 2). The somaticgrowth equation for the REF population was:
CL ¼ 31:710*�1� eð�0:089*ðAge�0:611ÞÞ
�
Where CL is carapace length in centimeters and Age is years. Theresidual standard error for the nonlinear least square model was0.7444 with 22 degrees of freedom.
Elasticity for the REF population of snapping turtles indicatedthat juvenile survival has the highest summed elasticity followedby adult survival and reproduction (Fig. 3). Because elasticity rep-resents the relative contribution of different vital rates to PGR (deKroon et al., 1986) all elasticity values sum to one. We summedall elasticity values for the three broad categories of juvenile sur-vival, adult survival and reproduction to facilitate interpretation(Fig. 3a). We also partitioned elasticity for juvenile survival in thefirst three years to provide insight into the relative contribution of
Juvenile Survival
AdultSurvival
Reproduction
0.0
0.2
0.4
0.6
Summed Vital Rates
Elasticity
a
Juv yr 1
Juv yr 2
Juv yr 3
Juv yr 4-8
AdultSurvival
Reproduction
0.0
0.1
0.2
0.3
0.4
0.5
Yearly and Summed Vital Rates
Elasticity
b
Fig. 3. (a) Elasticity of juvenile and adult survival and reproduction. Elasticity valueswere summed for each life stage category and vital rate. Juvenile survival has thehighest elasticity but also represents multiple years (9e12). Reproduction includesboth clutch size and hatching success. (b) Elasticity values for important age classesand vital rates for the C. serpentina matrix model. For any given year, the elasticity ofjuvenile survival is relatively low. Effects of PCBs evaluated here were limited to sur-vival and size of year 1 and 2 juveniles and subsequent growth rate of all turtles.
C.J. Salice et al. / Environmental Pollution 184 (2014) 154e160 157
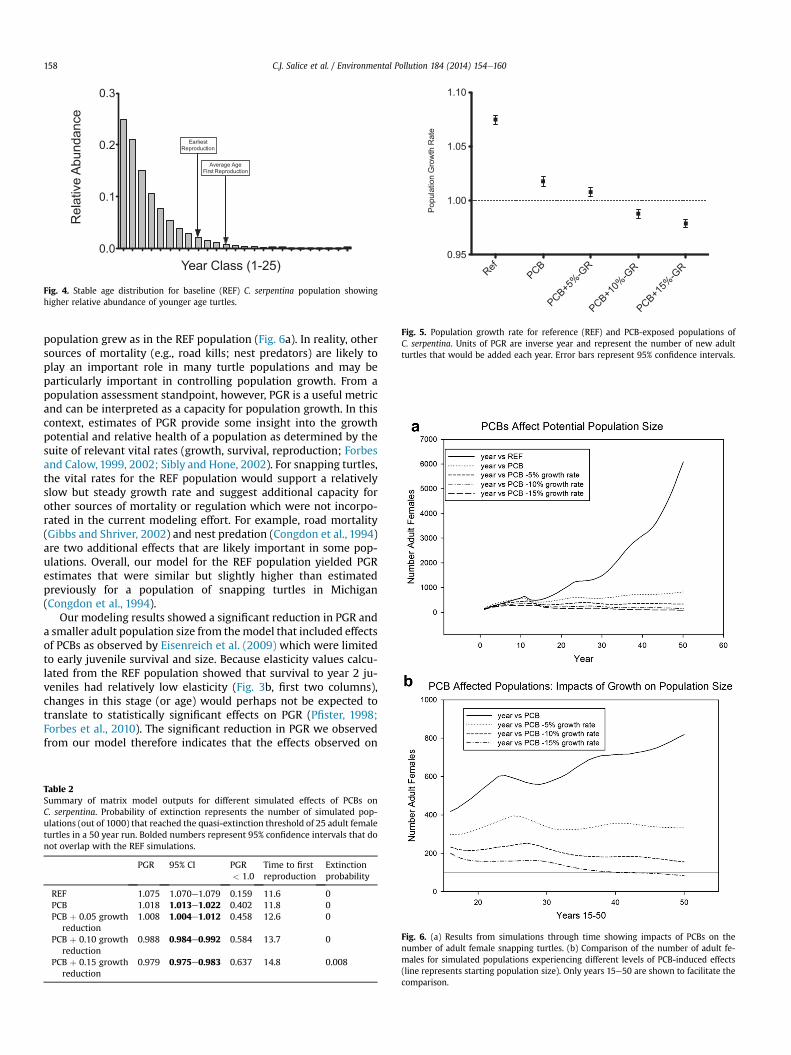
the first several years to PGR, as effects reported by Eisenreich et al.(2009) were observed in young juveniles (Fig. 3b). The stable agedistribution shows that younger turtles dominated the populationwith fewer older turtles (Fig. 4).
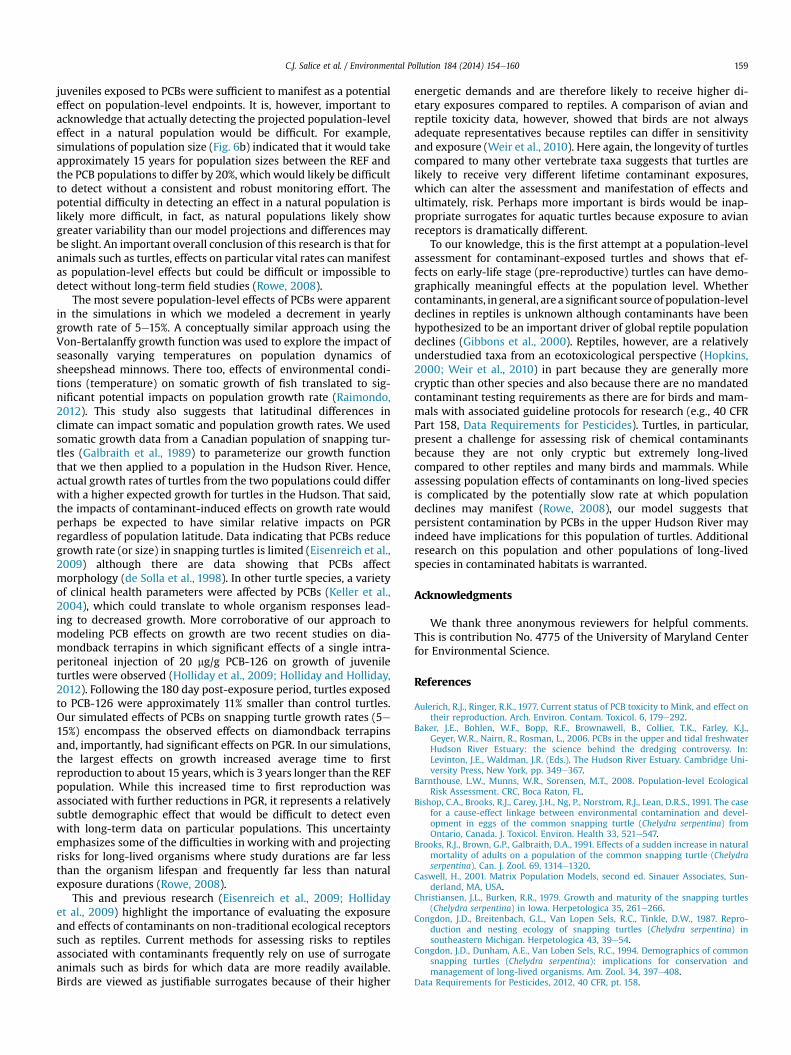
The PGR of turtles from the reference populationwas 1.075 (95%CI: 1.070e1.079) and the proportion of PGR estimates for the REFpopulation below 1.0 was 0.159 (Table 2; Fig. 5). The estimate ofpopulation growth rate for the REF population was slightly higherthan that estimated by Congdon using Euler’s model for populationgrowth rate (Congdon et al., 1994). The effects of PCBs on juvenilesurvival and hatchling size as observed by Eisenreich et al. (2009)resulted in a statistically significant reduction in PGR to 1.018(1.013e1.022) and an increase in the proportion of PGR estimatesbelow 1.0 to 0.402 (Table 2; Fig. 5). The 5% incremental reductionsin yearly somatic growth rate, there was an associated decrease inaverage PGR as well as an increase in the proportion of PGR esti-mates that were less than 1.0. For 5, 10 and 15% reductions in yearlygrowth, the corresponding PGR estimates were 1.008 (1.004e1.012), 0.988 (0.984e0.992), and 0.979 (0.975e0.983) while cor-responding proportion of PGR estimates less than 1.0 were 0.458,0.584 and 0.637, respectively. The effects of PCB on somatic growth
rate further reduced PGR by increasing the average time to firstreproduction (Table 2; Fig. 5).
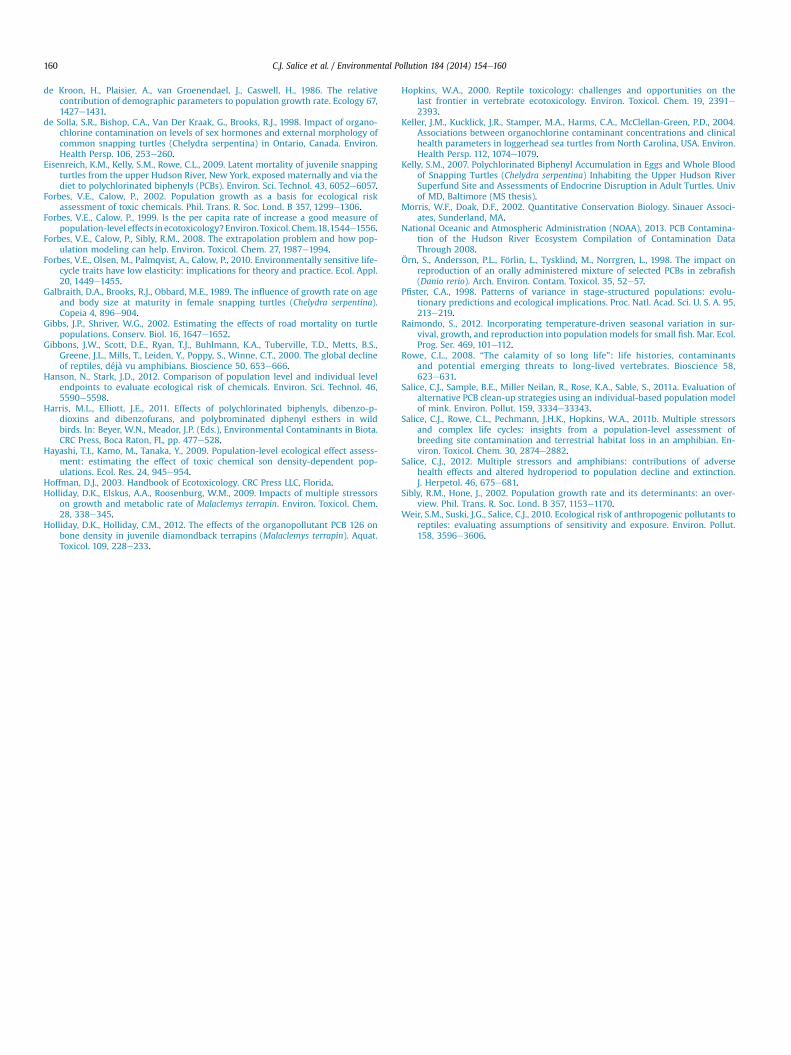
We also conducted a series of model simulations through timeto evaluate how PCBs might affect the abundance of female snap-ping turtles. While PGR provides important insight and is a well-accepted metric (Forbes and Calow, 2002; Sibly and Hone, 2002),population size is extremely useful from a management perspec-tive and can also provide insight intowhen toxicant-induced effectsmay be detected in natural populations. For the REF population, thetotal number of females increased steadily but sharply increasedbeyond about year 10 (Fig. 6a). The estimated number of femalesnapping turtles by year 50 exceeded 6000. In contrast, the numberof adult female snapping turtles in the PCB-exposed population didnot exceed 1000 turtles by year 50. Each 5% incremental reductionin yearly growth reduced the number of adult female turtles tobelow 400. For example, a 5% reduction in yearly growth reducedthe total number of females to 333 and showed a steady decline(Fig. 6b). For a 15% decrease in yearly growth (worst case scenario),the total number of adult female turtles in year 50 was 83 and forthis simulation scenario there was a probability of quasi-extinctionin 50 years of 0.008, the only simulation that yielded an extinctionrisk greater than zero in 50 years (Table 2). On the whole, the smallapparent changes in PGR associated with PCB exposure and effectsobserved by Eisenreich et al. (2009) manifested as significantchanges in population size through time and effects of PCBs onsomatic growth and time to first reproduction only exacerbatednegative effects with populations all declining through time (Fig. 6).
4. Discussion
The results of this population-level assessment indicated thatpreviously observed effects of PCBs on juvenile snapping turtlesfrom the Hudson River (Eisenreich et al., 2009) have the potential tomanifest as negative effects at the population level. Specifically, theobserved effects of maternal PCB exposure on hatching success,hatchling size and juvenile survival translated to a decrease in PGRcompared to turtles from a non-exposed reference population.Moreover, any additional effect of PCBs on endpoints such asgrowth rate would only exacerbate negative impacts to PGR.Temporal projections that simulated turtle population size throughtime, however, suggest that the projected population-level effectsmight not be detectable until long after the onset of exposure. Sucha delayed response points to the potential difficulty in detectingcontaminant-induced effects in natural populations of long-livedspecies which may experience population declines at an excep-tionally slow rate, perhaps eluding intervention until substantialimpacts have already occurred (Rowe, 2008). Importantly, thisscenario assumes more or less constant and consistent effects ofPCBs on snapping turtles through time. Because PCBs are persistent,it is likely that continued exposure of snapping turtles to PCBs couldoccur, however, this would not apply unilaterally to all chemicalcontaminants and should be considered any time demographicmodels are applied in an ecotoxicological context.
The model for the REF population of snapping turtles yielded anestimated population growth of 1.07, just over 1.0. Conceptually, aPGR >1.0 indicates that a population is growing and if <1.0,declining. In reality, few populations are consistently growing asthere are a number of regulating factors that can limit populationsize such as catastrophic events (Salice, 2012), non-accountedsources of mortality and demographic processes such as densitydependence (Hayashi et al., 2009). We did not include densitydependent survival or reproduction in the current model due to alack of evidence that it is operating in most snapping turtle pop-ulations. Nonetheless, populations cannot grow forever and densitydependent factors would begin to act if a snapping turtle
0.0
0.1
0.2
0.3
EarliestReproduction
Average AgeFirst Reproduction
Year Class (1-25)
RelativeAbundance
Fig. 4. Stable age distribution for baseline (REF) C. serpentina population showinghigher relative abundance of younger age turtles.
Ref
PCB
PCB+5%-GR
PCB+10%-GR
PCB+15%-GR
0.95
1.00
1.05
1.10
PopulationGrowthRate
Fig. 5. Population growth rate for reference (REF) and PCB-exposed populations ofC. serpentina. Units of PGR are inverse year and represent the number of new adultturtles that would be added each year. Error bars represent 95% confidence intervals.
C.J. Salice et al. / Environmental Pollution 184 (2014) 154e160158
population grew as in the REF population (Fig. 6a). In reality, othersources of mortality (e.g., road kills; nest predators) are likely toplay an important role in many turtle populations and may beparticularly important in controlling population growth. From apopulation assessment standpoint, however, PGR is a useful metricand can be interpreted as a capacity for population growth. In thiscontext, estimates of PGR provide some insight into the growthpotential and relative health of a population as determined by thesuite of relevant vital rates (growth, survival, reproduction; Forbesand Calow, 1999, 2002; Sibly and Hone, 2002). For snapping turtles,the vital rates for the REF population would support a relativelyslow but steady growth rate and suggest additional capacity forother sources of mortality or regulation which were not incorpo-rated in the current modeling effort. For example, road mortality(Gibbs and Shriver, 2002) and nest predation (Congdon et al., 1994)are two additional effects that are likely important in some pop-ulations. Overall, our model for the REF population yielded PGRestimates that were similar but slightly higher than estimatedpreviously for a population of snapping turtles in Michigan(Congdon et al., 1994).
Our modeling results showed a significant reduction in PGR anda smaller adult population size from themodel that included effectsof PCBs as observed by Eisenreich et al. (2009) which were limitedto early juvenile survival and size. Because elasticity values calcu-lated from the REF population showed that survival to year 2 ju-veniles had relatively low elasticity (Fig. 3b, first two columns),changes in this stage (or age) would perhaps not be expected totranslate to statistically significant effects on PGR (Pfister, 1998;Forbes et al., 2010). The significant reduction in PGR we observedfrom our model therefore indicates that the effects observed on
Table 2Summary of matrix model outputs for different simulated effects of PCBs onC. serpentina. Probability of extinction represents the number of simulated pop-ulations (out of 1000) that reached the quasi-extinction threshold of 25 adult femaleturtles in a 50 year run. Bolded numbers represent 95% confidence intervals that donot overlap with the REF simulations.
PGR 95% CI PGR< 1.0
Time to firstreproduction
Extinctionprobability
REF 1.075 1.070e1.079 0.159 11.6 0PCB 1.018 1.013e1.022 0.402 11.8 0PCB þ 0.05 growth
reduction1.008 1.004e1.012 0.458 12.6 0
PCB þ 0.10 growthreduction
0.988 0.984e0.992 0.584 13.7 0
PCB þ 0.15 growthreduction
0.979 0.975e0.983 0.637 14.8 0.008
Fig. 6. (a) Results from simulations through time showing impacts of PCBs on thenumber of adult female snapping turtles. (b) Comparison of the number of adult fe-males for simulated populations experiencing different levels of PCB-induced effects(line represents starting population size). Only years 15e50 are shown to facilitate thecomparison.
C.J. Salice et al. / Environmental Pollution 184 (2014) 154e160 159
juveniles exposed to PCBs were sufficient to manifest as a potentialeffect on population-level endpoints. It is, however, important toacknowledge that actually detecting the projected population-leveleffect in a natural population would be difficult. For example,simulations of population size (Fig. 6b) indicated that it would takeapproximately 15 years for population sizes between the REF andthe PCB populations to differ by 20%, which would likely be difficultto detect without a consistent and robust monitoring effort. Thepotential difficulty in detecting an effect in a natural population islikely more difficult, in fact, as natural populations likely showgreater variability than our model projections and differences maybe slight. An important overall conclusion of this research is that foranimals such as turtles, effects on particular vital rates canmanifestas population-level effects but could be difficult or impossible todetect without long-term field studies (Rowe, 2008).
The most severe population-level effects of PCBs were apparentin the simulations in which we modeled a decrement in yearlygrowth rate of 5e15%. A conceptually similar approach using theVon-Bertalanffy growth function was used to explore the impact ofseasonally varying temperatures on population dynamics ofsheepshead minnows. There too, effects of environmental condi-tions (temperature) on somatic growth of fish translated to sig-nificant potential impacts on population growth rate (Raimondo,2012). This study also suggests that latitudinal differences inclimate can impact somatic and population growth rates. We usedsomatic growth data from a Canadian population of snapping tur-tles (Galbraith et al., 1989) to parameterize our growth functionthat we then applied to a population in the Hudson River. Hence,actual growth rates of turtles from the two populations could differwith a higher expected growth for turtles in the Hudson. That said,the impacts of contaminant-induced effects on growth rate wouldperhaps be expected to have similar relative impacts on PGRregardless of population latitude. Data indicating that PCBs reducegrowth rate (or size) in snapping turtles is limited (Eisenreich et al.,2009) although there are data showing that PCBs affectmorphology (de Solla et al., 1998). In other turtle species, a varietyof clinical health parameters were affected by PCBs (Keller et al.,2004), which could translate to whole organism responses lead-ing to decreased growth. More corroborative of our approach tomodeling PCB effects on growth are two recent studies on dia-mondback terrapins in which significant effects of a single intra-peritoneal injection of 20 mg/g PCB-126 on growth of juvenileturtles were observed (Holliday et al., 2009; Holliday and Holliday,2012). Following the 180 day post-exposure period, turtles exposedto PCB-126 were approximately 11% smaller than control turtles.Our simulated effects of PCBs on snapping turtle growth rates (5e15%) encompass the observed effects on diamondback terrapinsand, importantly, had significant effects on PGR. In our simulations,the largest effects on growth increased average time to firstreproduction to about 15 years, which is 3 years longer than the REFpopulation. While this increased time to first reproduction wasassociated with further reductions in PGR, it represents a relativelysubtle demographic effect that would be difficult to detect evenwith long-term data on particular populations. This uncertaintyemphasizes some of the difficulties in working with and projectingrisks for long-lived organisms where study durations are far lessthan the organism lifespan and frequently far less than naturalexposure durations (Rowe, 2008).
This and previous research (Eisenreich et al., 2009; Hollidayet al., 2009) highlight the importance of evaluating the exposureand effects of contaminants on non-traditional ecological receptorssuch as reptiles. Current methods for assessing risks to reptilesassociated with contaminants frequently rely on use of surrogateanimals such as birds for which data are more readily available.Birds are viewed as justifiable surrogates because of their higher
energetic demands and are therefore likely to receive higher di-etary exposures compared to reptiles. A comparison of avian andreptile toxicity data, however, showed that birds are not alwaysadequate representatives because reptiles can differ in sensitivityand exposure (Weir et al., 2010). Here again, the longevity of turtlescompared to many other vertebrate taxa suggests that turtles arelikely to receive very different lifetime contaminant exposures,which can alter the assessment and manifestation of effects andultimately, risk. Perhaps more important is birds would be inap-propriate surrogates for aquatic turtles because exposure to avianreceptors is dramatically different.
To our knowledge, this is the first attempt at a population-levelassessment for contaminant-exposed turtles and shows that ef-fects on early-life stage (pre-reproductive) turtles can have demo-graphically meaningful effects at the population level. Whethercontaminants, in general, are a significant source of population-leveldeclines in reptiles is unknown although contaminants have beenhypothesized to be an important driver of global reptile populationdeclines (Gibbons et al., 2000). Reptiles, however, are a relativelyunderstudied taxa from an ecotoxicological perspective (Hopkins,2000; Weir et al., 2010) in part because they are generally morecryptic than other species and also because there are no mandatedcontaminant testing requirements as there are for birds and mam-mals with associated guideline protocols for research (e.g., 40 CFRPart 158, Data Requirements for Pesticides). Turtles, in particular,present a challenge for assessing risk of chemical contaminantsbecause they are not only cryptic but extremely long-livedcompared to other reptiles and many birds and mammals. Whileassessing population effects of contaminants on long-lived speciesis complicated by the potentially slow rate at which populationdeclines may manifest (Rowe, 2008), our model suggests thatpersistent contamination by PCBs in the upper Hudson River mayindeed have implications for this population of turtles. Additionalresearch on this population and other populations of long-livedspecies in contaminated habitats is warranted.
Acknowledgments
We thank three anonymous reviewers for helpful comments.This is contribution No. 4775 of the University of Maryland Centerfor Environmental Science.
References
Aulerich, R.J., Ringer, R.K., 1977. Current status of PCB toxicity to Mink, and effect ontheir reproduction. Arch. Environ. Contam. Toxicol. 6, 179e292.
Baker, J.E., Bohlen, W.F., Bopp, R.F., Brownawell, B., Collier, T.K., Farley, K.J.,Geyer, W.R., Nairn, R., Rosman, L., 2006. PCBs in the upper and tidal freshwaterHudson River Estuary: the science behind the dredging controversy. In:Levinton, J.E., Waldman, J.R. (Eds.), The Hudson River Estuary. Cambridge Uni-versity Press, New York, pp. 349e367.
Barnthouse, L.W., Munns, W.R., Sorensen, M.T., 2008. Population-level EcologicalRisk Assessment. CRC, Boca Raton, FL.
Bishop, C.A., Brooks, R.J., Carey, J.H., Ng, P., Norstrom, R.J., Lean, D.R.S., 1991. The casefor a cause-effect linkage between environmental contamination and devel-opment in eggs of the common snapping turtle (Chelydra serpentina) fromOntario, Canada. J. Toxicol. Environ. Health 33, 521e547.
Brooks, R.J., Brown, G.P., Galbraith, D.A., 1991. Effects of a sudden increase in naturalmortality of adults on a population of the common snapping turtle (Chelydraserpentina). Can. J. Zool. 69, 1314e1320.
Caswell, H., 2001. Matrix Population Models, second ed. Sinauer Associates, Sun-derland, MA, USA.
Christiansen, J.L., Burken, R.R., 1979. Growth and maturity of the snapping turtles(Chelydra serpentina) in Iowa. Herpetologica 35, 261e266.
Congdon, J.D., Breitenbach, G.L., Van Lopen Sels, R.C., Tinkle, D.W., 1987. Repro-duction and nesting ecology of snapping turtles (Chelydra serpentina) insoutheastern Michigan. Herpetologica 43, 39e54.
Congdon, J.D., Dunham, A.E., Van Loben Sels, R.C., 1994. Demographics of commonsnapping turtles (Chelydra serpentina): implications for conservation andmanagement of long-lived organisms. Am. Zool. 34, 397e408.
Data Requirements for Pesticides, 2012, 40 CFR, pt. 158.
C.J. Salice et al. / Environmental Pollution 184 (2014) 154e160160
de Kroon, H., Plaisier, A., van Groenendael, J., Caswell, H., 1986. The relativecontribution of demographic parameters to population growth rate. Ecology 67,1427e1431.
de Solla, S.R., Bishop, C.A., Van Der Kraak, G., Brooks, R.J., 1998. Impact of organo-chlorine contamination on levels of sex hormones and external morphology ofcommon snapping turtles (Chelydra serpentina) in Ontario, Canada. Environ.Health Persp. 106, 253e260.
Eisenreich, K.M., Kelly, S.M., Rowe, C.L., 2009. Latent mortality of juvenile snappingturtles from the upper Hudson River, New York, exposed maternally and via thediet to polychlorinated biphenyls (PCBs). Environ. Sci. Technol. 43, 6052e6057.
Forbes, V.E., Calow, P., 2002. Population growth as a basis for ecological riskassessment of toxic chemicals. Phil. Trans. R. Soc. Lond. B 357, 1299e1306.
Forbes, V.E., Calow, P., 1999. Is the per capita rate of increase a good measure ofpopulation-level effects in ecotoxicology?Environ. Toxicol. Chem.18,1544e1556.
Forbes, V.E., Calow, P., Sibly, R.M., 2008. The extrapolation problem and how pop-ulation modeling can help. Environ. Toxicol. Chem. 27, 1987e1994.
Forbes, V.E., Olsen, M., Palmqvist, A., Calow, P., 2010. Environmentally sensitive life-cycle traits have low elasticity: implications for theory and practice. Ecol. Appl.20, 1449e1455.
Galbraith, D.A., Brooks, R.J., Obbard, M.E., 1989. The influence of growth rate on ageand body size at maturity in female snapping turtles (Chelydra serpentina).Copeia 4, 896e904.
Gibbs, J.P., Shriver, W.G., 2002. Estimating the effects of road mortality on turtlepopulations. Conserv. Biol. 16, 1647e1652.
Gibbons, J.W., Scott, D.E., Ryan, T.J., Buhlmann, K.A., Tuberville, T.D., Metts, B.S.,Greene, J.L., Mills, T., Leiden, Y., Poppy, S., Winne, C.T., 2000. The global declineof reptiles, déjà vu amphibians. Bioscience 50, 653e666.
Hanson, N., Stark, J.D., 2012. Comparison of population level and individual levelendpoints to evaluate ecological risk of chemicals. Environ. Sci. Technol. 46,5590e5598.
Harris, M.L., Elliott, J.E., 2011. Effects of polychlorinated biphenyls, dibenzo-p-dioxins and dibenzofurans, and polybrominated diphenyl esthers in wildbirds. In: Beyer, W.N., Meador, J.P. (Eds.), Environmental Contaminants in Biota.CRC Press, Boca Raton, FL, pp. 477e528.
Hayashi, T.I., Kamo, M., Tanaka, Y., 2009. Population-level ecological effect assess-ment: estimating the effect of toxic chemical son density-dependent pop-ulations. Ecol. Res. 24, 945e954.
Hoffman, D.J., 2003. Handbook of Ecotoxicology. CRC Press LLC, Florida.Holliday, D.K., Elskus, A.A., Roosenburg, W.M., 2009. Impacts of multiple stressors
on growth and metabolic rate of Malaclemys terrapin. Environ. Toxicol. Chem.28, 338e345.
Holliday, D.K., Holliday, C.M., 2012. The effects of the organopollutant PCB 126 onbone density in juvenile diamondback terrapins (Malaclemys terrapin). Aquat.Toxicol. 109, 228e233.
Hopkins, W.A., 2000. Reptile toxicology: challenges and opportunities on thelast frontier in vertebrate ecotoxicology. Environ. Toxicol. Chem. 19, 2391e2393.
Keller, J.M., Kucklick, J.R., Stamper, M.A., Harms, C.A., McClellan-Green, P.D., 2004.Associations between organochlorine contaminant concentrations and clinicalhealth parameters in loggerhead sea turtles from North Carolina, USA. Environ.Health Persp. 112, 1074e1079.
Kelly, S.M., 2007. Polychlorinated Biphenyl Accumulation in Eggs and Whole Bloodof Snapping Turtles (Chelydra serpentina) Inhabiting the Upper Hudson RiverSuperfund Site and Assessments of Endocrine Disruption in Adult Turtles. Univof MD, Baltimore (MS thesis).
Morris, W.F., Doak, D.F., 2002. Quantitative Conservation Biology. Sinauer Associ-ates, Sunderland, MA.
National Oceanic and Atmospheric Administration (NOAA), 2013. PCB Contamina-tion of the Hudson River Ecosystem Compilation of Contamination DataThrough 2008.
Örn, S., Andersson, P.L., Förlin, L., Tysklind, M., Norrgren, L., 1998. The impact onreproduction of an orally administered mixture of selected PCBs in zebrafish(Danio rerio). Arch. Environ. Contam. Toxicol. 35, 52e57.
Pfister, C.A., 1998. Patterns of variance in stage-structured populations: evolu-tionary predictions and ecological implications. Proc. Natl. Acad. Sci. U. S. A. 95,213e219.
Raimondo, S., 2012. Incorporating temperature-driven seasonal variation in sur-vival, growth, and reproduction into population models for small fish. Mar. Ecol.Prog. Ser. 469, 101e112.
Rowe, C.L., 2008. “The calamity of so long life”: life histories, contaminantsand potential emerging threats to long-lived vertebrates. Bioscience 58,623e631.
Salice, C.J., Sample, B.E., Miller Neilan, R., Rose, K.A., Sable, S., 2011a. Evaluation ofalternative PCB clean-up strategies using an individual-based population modelof mink. Environ. Pollut. 159, 3334e33343.
Salice, C.J., Rowe, C.L., Pechmann, J.H.K., Hopkins, W.A., 2011b. Multiple stressorsand complex life cycles: insights from a population-level assessment ofbreeding site contamination and terrestrial habitat loss in an amphibian. En-viron. Toxicol. Chem. 30, 2874e2882.
Salice, C.J., 2012. Multiple stressors and amphibians: contributions of adversehealth effects and altered hydroperiod to population decline and extinction.J. Herpetol. 46, 675e681.
Sibly, R.M., Hone, J., 2002. Population growth rate and its determinants: an over-view. Phil. Trans. R. Soc. Lond. B 357, 1153e1170.
Weir, S.M., Suski, J.G., Salice, C.J., 2010. Ecological risk of anthropogenic pollutants toreptiles: evaluating assumptions of sensitivity and exposure. Environ. Pollut.158, 3596e3606.