Embed Size (px)
Citation preview

© Copy Right Reserved
Institute of Certified Management Accountants of Sri Lanka
May 2016 Examination
Integrative Case Study (ICS- 501)
Instructions to candidates:
The Integrative Case Study (ICS - 501) of May 2016 Examination comprises of two scenarios;Scenario I, Scenario II and the Question paper. Scenario I
Scenario I is provided in this web site and has information about the company and industry, on which the question paper will be based. This is not allowed in the examination hall. Scenario II
Scenario II is a continuation of Scenario I. Scenario I together with Scenario II will be provided with the Question paper, at the Examination. Question paper
The question paper will be of 3 hours duration and will have one question based on Scenarios Iand II.
1

Petroleum Industry in Sri Lanka
Scenario I
Petroleum industry in Sri Lanka is highly dependent on international sources as it was not possible to come out with significant breakthroughs of oil exploration, despite the fact that continuous efforts are taking place at different levels. As a result, the need for petroleum products are still largely met with imported petroleum products and local products of the only refinery that Ceylon Petroleum Corporation (CPC) has.
Exploration works on petroleum resources in Sri Lanka date back to 1960s and the efforts are continuing with the hopes that there would be a significant breakthrough in future. In 1974, Russia (Then it was Soviet Union) engaged in drilling in Northern parts of Sri Lanka and encountered a water-bearing Cretaceous sandstone with a small amount of dissolved gas with heavy ends to pentane. With this discovery of gas, explorations were expanded but it failed to find significant reservoir rocks and finally the Soviet efforts were given up.
Pexamin Pacific, as a consultant engaged in exploring in the Sri Lankan portion of the Cauvery Basin in 1975. Some seismic data over a large range were collected and Pexamin Pacific signed a contract with CPC for an offshore exploration block in 1976. Subsequently, two exploratory wells were drilled in Palk Bay and Delft in the Cauvery Basin. However, both wells failed to discover any hydrocarbons. In 1981, another attempt was made in the Cauvery and the Mannar basins but that too was not successful except collecting seismic data from a large area.
One positive outcome of the efforts was the existence of well penetrated thick Late Cretaceous basal sandstone in the Mannar Basin. Later in 1984, a tripartite agreement between Phoenix Canada Oil Company, Petro-Canada and CPC, Petro-Canada was signed to acquire data in the Mannar Basin. However petroleum exploration work offshore Sri Lanka came to a halt and remained dormant till 2001.With the assistance of Asian Development Bank, draft petroleum legislation and a Petroleum Resources Agreement to evaluate the potential of petroleum were made in 2001. At the same time Indian Production sharing Contract (PSC) was also signed.
A Norwegian seismic contractor, TGS NOPEC signed an agreement with CPC to collect 2D seismic data in the Mannar Basin and the data acquired supported the petroleum potential. In 2007, the government bought the Mannar Basin 2D data from TGS NOPEC by canceling the exclusive rights that TGS NOPEC had to collect seismic data. Government looked for potential exploration companies to commence the works based on such date collected. Mannar Basin licensing was given to Cairn India Limited, through a competitive bidding process in 2007. Cairn India Limited ended its engagement in 2016. Cairn has spend approximately US dollars 235 million and produced invaluable petroleum data.
Cairn’s two wells (Dorado and Barracuda) drilled in 2011 had resulted in natural gas discoveries and the third (Dorado North) was dry. The forth well (Wallago) drilled in February 2013 was abandoned due to a technical failure.
Government of Sri Lanka signed a Joint Study Agreement in February 2016 with French major Total, a world’s largest international "super major” oil and gas companies, with operations in more than 130 countries to explore two ultra-deep water blocks off the east coast of Sri Lanka for oil and gas for a period of two years. In addition, Sri Lankan Government will receive a ground rental of approximately LKR 7 million per annum from this agreement. Figure 1 depicts the off show areas targeted for explorations.
2

Figure 1: Targeted petroleum explorations in Sri Lanka
Role of the Ministry of Petroleum Development Resources
Ministry of Petroleum Development Resources is responsible for all the operations on petroleum resources with the vision to make both upstream and downstream petroleum industry the foremost contributor to the National Economic Development of Sri Lanka. With the mandate given to the Ministry, key functional area comprise of the following. 1. Formulation of policies, plans and programs in respect of upstream and downstream petroleum
activities. 2. Enact the Petroleum Resources Act and the Ceylon Petroleum Corporation Act. 3. Make necessary institutional arrangements to facilitate the operational activities of oil and
natural gas exploration and exploitation of the country. 4. Develop and upgrade the infrastructure facilities for exploration and exploitation, supply,
storage and distribution of petroleum. 5. Facilitate import, export, refine, store, distribute and sell petroleum based products. 6. Facilitate the conversion of waste plastic into petroleum fuel. Four institutions are directly coming under the purview of the Ministry of Petroleum Development Resources. They are; 1. Ceylon Petroleum Corporation (CPC) 2. Ceylon Petroleum Storage Terminals Ltd (CPSTL) 3. Petroleum Resources Development Secretariat (PRDS) 4. Polipto Lanka (Pvt.) Ltd
CPC was established in 1961 by a special act of Parliament and has been carrying out its operations successfully. It was able meet the total petroleum product demand in Sri Lanka by the 1970s with its only refinery located in Sapugaskanda.
3

At the beginning, it had a capacity of refining 38,000 barrels per day and subsequent modification increased the capacity up to 50,000 barrels per day. However, the demand for main petroleum products (petrol, diesel and Furnace Oil) has been increasing over time mainly due to expansion in transportation industry. Out of the total consumption of fuel, the quantity used for transportation sector as in other countries is relatively high. As a result, the gap between the demand for and local supply of petroleum products was happened to be filled by imported refined products instead of taking serious efforts to increase the capacity of CPC. At present, the refinery meets only 40% of total petroleum products requirement of the country. Major finished products of CPC are Petrol, Auto Diesel, Low Sulphur Furnace Oil, Kerosene, LPG, Jet A-1 (Avtur), Bitumen, Chemical Naphtha and Solvent. Table 1 gives data on imported petroleum products by CPC during the period from 2013-2015. Table 1: Import of Petroleum Products by CPC (Metric Tons ‘000)
Bunkering business of CPC was changed by handing it over to private sector in 1990. However, bunker fuel business was entrusted to the Sri Lanka Ports Authority later on (SLPA) by a Court order. Now, bunker fuels are supplied by Bunker License Holders with licenses issued by SLPA. Table 2 provides details of bunker fuel sales by Bunker License Holders during last five years.
4

Table 2: Sales of bunker Fuel (Metric Tons)
Financial performance shows that CPC generated gross sales of over 525,000 million rupees in 2014 but the performance of the year 2015 dropped significantly. The forecast sales for the year 2016 are around 400,000 million rupees. Total assets of CPC as at 30.09.2015 amounted were just above 200,000 million of rupees. Income statement for the nine months ended 30.09.2015 and the balance sheet as at that date are given in tables 3 and 4.
5

Table 3: Income statement of CPC for nine months ended 30/09/2015 (Rs. million)
6
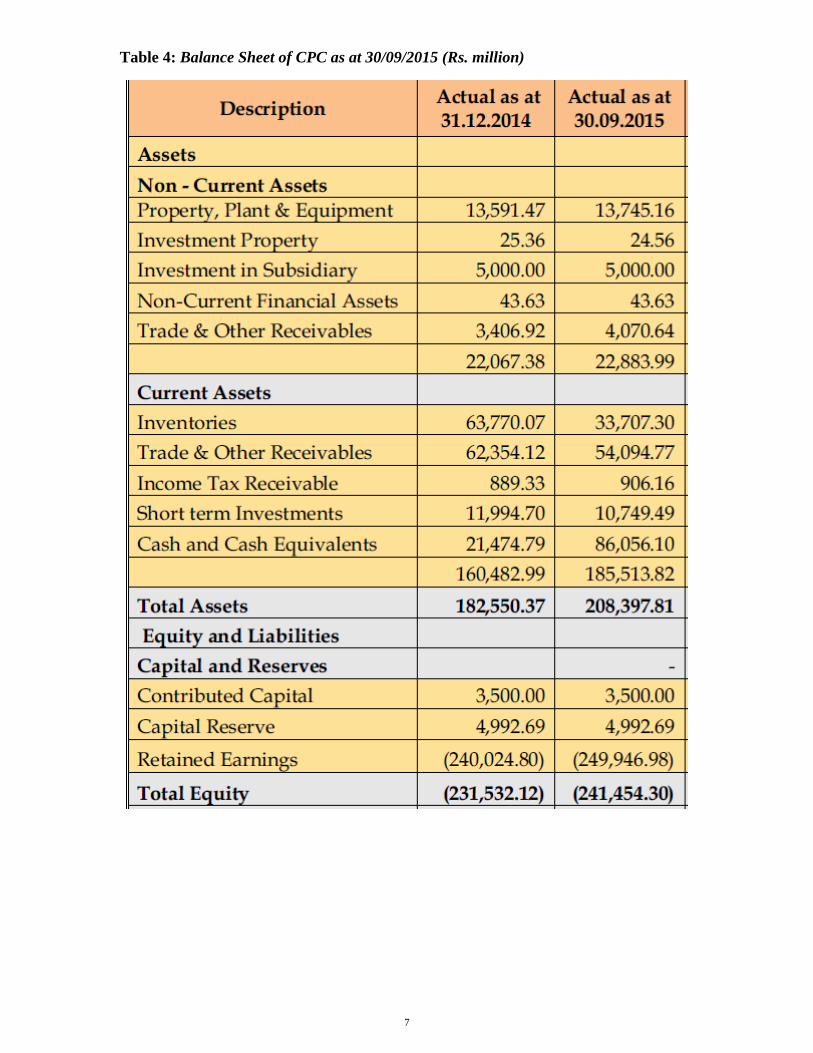
Table 4: Balance Sheet of CPC as at 30/09/2015 (Rs. million)
7

Ceylon Petroleum Storage Terminals Ltd (CPSTL) involves mainly in planning and scheduling fuel requirement of the country. Accordingly, other logistic arrangements such as managing stock receipts, loading & unloading of products, maintaining adequate stocks, quality assurance and issuance of products. Petroleum Resources Development Secretariat (PRDS) was established in 2003 with the objective of administering petroleum exploration and production operations in Sri Lanka. Polipto Lanka (Pvt) was incorporated in 2009 to carry out the project of converting unclean, unsorted Waste Plastic into Petroleum Fuel. There is an increasing trend of importing plastics to the country and it has exceeded 350 metric tons at present. Table 5 below gives a summarized version of the petroleum market structure in Sri Lanka. Table 5: Petroleum Market Structure in Sri Lanka
Period Products Market structure Market players
Prior to 1961 All products Oligopoly Caltex, Mobil, Shell
1961-2003 All products Monopoly CPC
2003 to date Petrol, diesel, kerosene, bitumen
Duopoly CPC, LIOC
Global Demand, Supply and Consumption of Petroleum Products
The trend of global liquid fuel consumption is increasing parallel to increase in the production. Global demand and consumption of liquid fuel is around 90 million barrels per day (mbd) throughout the period from 2010 to 2015. Global oil production has been increasing and it has reached to an average level of 90 million barrels per day at present. Table 6 gives average global liquid fuel production and consumption with the forecasts for the years 2016 and 2017.
8

Table 6: Global Liquid Fuel Production and Consumption (mbd) Year Average Production Average Consumption
2010 86 86
2011 89 89
2012 90 90
2013 91 91
2014 93 92
2015 96 94
2016 96 95
2017 97 96
OPEC countries supply about 40% of the global demand at present. Estimates of recoverable petroleum resources over the world have been increasing despite the limits of exploitation have become big concerns mainly to due to technological advancements and breakthroughs in science.
On the other hand, the world is exploring energy saving technologies and diversification of energy sources. Developments in shale gas industry would also lead to reduce demand for energy in the long run. Fossil fuel which accounts for about 85% of the world’s primary energy demand is the major source of energy and it is likely that this proportion will not change in the near future. However, the structure of the primary energy demands will result changes with increasing use of natural gas at present. Statistics show how the excess production capacity of OPEC over last five years was decreasing despite the fact that there is an excess capacity. Table 7 gives excess capacity of OPEC in terms of millions barrels per day Table 7: Excess production capacity of OPEC
Year mbd
2010 3.98
2011 3.05
2012 2.12
2013 2.16
2014 2.07
2015 1.61
2016 1.95
2017 1.72
History reveals that, in the 1950s, more than 80% of global oil reserves were in the hands of big oil companies namely British Petroleum, Esso, Gulf Oil, Mobil, Royal Dutch Shell, SoCal and Texaco. However, over 90 percent of global oil reserves are currently controlled by national oil companies in the USA.
On the other hand, the demand for petroleum products from big counties like India and China has been increasing. With respect to the use of oil in the world, it is seen that about 60% of demand for oil products in the world is consumed by the transport sector. Further, it has been revealed that the demand for fuel oil in the developing countries will also increase faster in the future mainly due to developments in transport, agro chemicals, and Residential, commercial, industrial sectors. Fuel Oil is also used for electricity generation and it has been estimated that the demand for fuel oil for electricity generation will decline in the future as there would be several non-oil sources available.
9

Despite the fact the Sri Lanka consumption of fuel is relatively low, it accounts for about 25% of the import value of goods and services at present. Accordingly, the import cost of petroleum products such as crude oil, refined petroleum products and other petroleum-based products exceeds US dollars 6 billion a year. Policy Decision and Liberalization of the Industry
CPC had an undisturbed liberty in the petroleum market in Sri Lanka with monopolistic powers until 2003 when Lanka Indian Oil Company (LIOC) entered in to the market as a petroleum product distributor. The main activities of LIOC are importing, blending, distributing and selling of petroleum products including lubricants and bitumen, and bunkering in Sri Lanka. Government controlled storage units were made to be a common usage facility by establishing a separate company called the Ceylon Petroleum Storage Terminals Limited (CPSTL) with the joint participation of CPC and LIOC. Before LIOC entered into operations, all import, export, storage, transportation, wholesale and retail trade activities were carried out by CPC.
Companies such as Caltex and Mobil are operating in some subsectors in the petroleum industry since the 1990s. However, the import of petroleum products is under the control of government through licensing mechanism. The first refinery of processing imported crude oil was established in 1969. Subsequently, operations of CPC were gradually expanded with importation of crude oil and refined oil, storage and distribution of and retail trade petroleum products with a product portfolio including agro, chemicals, chemical fertilizer, Liquid Petroleum Gas, Naphtha, synthetic fiber, lubricating oil and bunkering oil for sea vessels.
Petroleum products are mainly used in sectors including transport, electricity generation, industrial purposes, agriculture, fisheries and manufacturing. Investment in the petroleum infrastructure at the Colombo sea port, storage facilities around Colombo, regional storage facilities, retail marketing infrastructure were accordingly developed by the key petroleum companies engaged in the Sri Lanka’s market. Railway transportation was mainly used at the beginning as it was cost effective and convenient as all the facilities of storage and distribution systems of petroleum products had been developed around the railway lines. The proportion of oil consumption for electricity generation has been increasing since 1990s mainly due to increase in demand pushed by the situation where, the production volume of the large scale hydro based electricity generation is said to have reached its full capacity. Pricing of Petroleum Products
Government has the control over pricing of fuel oil to a greater extent. Government pricing policy on petroleum products has been consistent since 2005 as frequent price adjustments in line with international price movements was abandoned. However, by considering the need for giving subsidies on certain products some upward and downward price adjustments were done from time to time. Nevertheless, LIOC has been vested with powers to determine its pricing policies despite the fact that LIOC can deviate very little from the government policies as CPC is the market leader. Some key financial ratios for the years from 2010 to 2015 and the balance sheet of LIOC are given in tables 8 and 9.
10

Table 8: Key Financial Ratios-LIOC
2010 2011 2012 2013 2014 2015
Sales (Rs. million) 50,214 51,742 60,436 7,511 81,793 79,901
Gross profit (Rs. million) (371) 1,526 2,954 5,389 8,312 4,733
Net Profit/(Loss) After Tax (Rs. million) (423) 877 906 2,911 4,811 1,886
Return On Capital Employed ‐5% 10% 9% 22% 28% 10%
Equity (Rs. million) 8,335 9,211 10,117 13,028 17,043 18,125
Earnings per share (Rs.) (0.8) 1.7 1.7 5.5 9.0 3.5
Price Earnings Ratio (Times) (23) 11 11 4 4 10
Net Assets per share (Rs.) 16 17 19 24 32 32
Table 9: Balance Sheet of LIOC as at 31/03/2015 2015 (Rs. Mn.) 2014 (Rs.Mn.)
Non‐Current Assets
Property Plant and Equipment 3,673 3,341
Investment 4,394 4,394
Intangible Assets 675 677
Other Receivables 86 8,828 74 8,486
Current Assets
Inventories 5,635 7,929
Trade and Other Receivables 1,085 1,812
Income Tax Receivable 242 ‐
Cash and Cash Equivalent 7,752 14,714 8,758 18,499
23,542 26,985
Equity and Liabilities
Capital and Reserves
Stated Capital 7,577 7,577
Retained Earnings 10,548 9,466
Total Equity 18,125 17,043
Non‐Current Liabilities
Differed Benefit Obligation 61 47
Deferred Tax Liabilities 55 116 30 77
Current Liabilities
Trade and other Payables 1,303 3,213
Income Tax Payable ‐ 529
Interest Bearing Borrowing 3,998 6,123
Total Liabilities 5,417 9,942
Total Equity and Liabilities 23,542 26,985 Though there were price fluctuations throughout the history, the general trend of crude oil price was increasing most of the time. However, the crude oil price has been continuously decreasing in the recent past and it went down to as low as US dollar 26 per barrel. The highest oil price recorded was US dollar 147 per barrel in 2008. Under normal circumstances, it was seen that prices of petroleum products were increasing mainly due to rising global consumption. Figure 2 depicts how crude oil price has been changing over time from 2011.
11
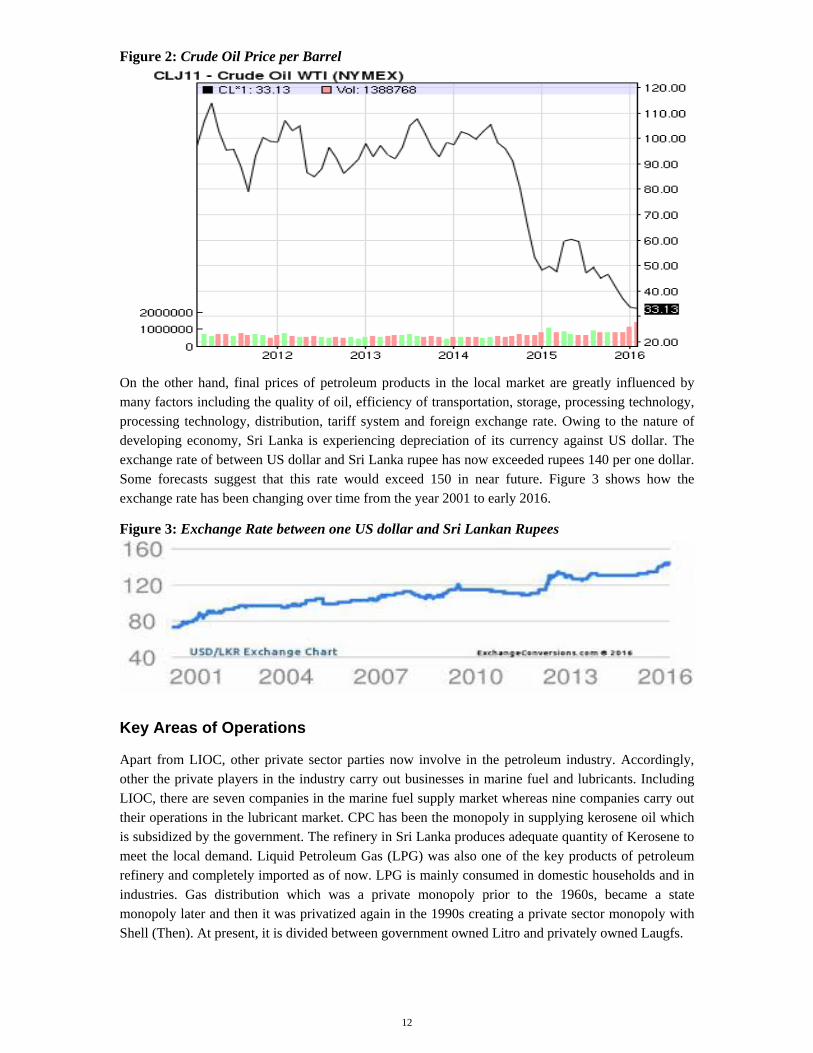
Figure 2: Crude Oil Price per Barrel
On the other hand, final prices of petroleum products in the local market are greatly influenced by many factors including the quality of oil, efficiency of transportation, storage, processing technology, processing technology, distribution, tariff system and foreign exchange rate. Owing to the nature of developing economy, Sri Lanka is experiencing depreciation of its currency against US dollar. The exchange rate of between US dollar and Sri Lanka rupee has now exceeded rupees 140 per one dollar. Some forecasts suggest that this rate would exceed 150 in near future. Figure 3 shows how the exchange rate has been changing over time from the year 2001 to early 2016.
Figure 3: Exchange Rate between one US dollar and Sri Lankan Rupees
Key Areas of Operations
Apart from LIOC, other private sector parties now involve in the petroleum industry. Accordingly, other the private players in the industry carry out businesses in marine fuel and lubricants. Including LIOC, there are seven companies in the marine fuel supply market whereas nine companies carry out their operations in the lubricant market. CPC has been the monopoly in supplying kerosene oil which is subsidized by the government. The refinery in Sri Lanka produces adequate quantity of Kerosene to meet the local demand. Liquid Petroleum Gas (LPG) was also one of the key products of petroleum refinery and completely imported as of now. LPG is mainly consumed in domestic households and in industries. Gas distribution which was a private monopoly prior to the 1960s, became a state monopoly later and then it was privatized again in the 1990s creating a private sector monopoly with Shell (Then). At present, it is divided between government owned Litro and privately owned Laugfs.
12

Local Demand, Production and Importation of Petroleum Products
Consumption of petroleum products in Sri Lanka compared to the global demand and consumption is very insignificant. Until the recent past, Sri Lanka was producing a large proportion of fuel oil with the local refinery. Accordingly, the total need for kerosene, about 40 % of diesel and 65% of petrol for the local market were produced at the local refinery. However, due to increasing demand for petroleum products, the import volume is increasing thus spending large amount of funds. Total expenditure on petroleum import accounts for about 25% of total import expenditure of the country. Import volumes of each type of petroleum products are given in table 10. Table 10: Imports of Petroleum Products from 2010 to 2014 Petroleum Product Imports (thousand tones)
2010 2011 2012 2013 2014
Crude Oil 1752.72 2003.61 1626.07 1743.49 1824.00
Refined Products
LPG 137.14 181.34 192.62 197.00 198.00
Petrol 451.79 508.48 574.60 538.89 584.80
Avtur 222.81 244.10 288.22 295.65 234.87
Kerosene 0 0 55.04 56.37 0
Diesel 1199.17 1401.98 1652.16 1198.92 1394.36
Fuel Oil 423.00 367.87 563.68 176.50 348.40
Other Products
Avgas 0.25 0.211 0.22 0.14 0.21
Bitumen 44.73 120.29 105.34 142.68 56.00
Solvents 0 0 0 0 0
It is further seen that the proportion of expenditure on importation of petroleum products compared to importation of crude oil has been significantly increasing. Hence, more than 70% of the current import expenditure on petroleum goes to imported products. 40 years ago, this proportion was less than 10%. Increasing demand for petroleum products and inability of CPC to increase in refinery capacity must have led this situation to some extent. CPC’s refinery mainly used crude oil from Iran and Saudi Arabia from the very beginning when it was established in 1960s. Developments in science and technology have now expanded the boundaries of refinery technology significantly. The ability of CPC to process with other types of crude oil other than Iranian type light crude oil is limited even though it compelled to do so with other alternative crude oils mainly due to changes in international politics which restricted supply of Iranian crude oil. These international economic sanctions imposed by USA on against Iran indirectly posed threat to CPC in terms of operational volume. It was big task for the government to negotiate with other countries to import similar type of light crude oil in order to keep the refinery of CPC function at a satisfactory capacity. However, the operating efficiency of CPC with other types of similar crude oil went down significantly. Table 11 gives statistics of different types of crude oil refined by CPC during the period from 2010 to 2014.
13

Table 11: Types of Crude oil Processed by the CPC Refinery
Crude Oil Processed by Crude Type in the Refinery (thousand tones)
2010 2011 2012 2013 2014
Crude Type
Arabian light 134.61 113.48 547.7
Iranian light 1,618.1 1,890.12 697.41
Mirilight 69.41
Oman Crude 225.25 1,743.49 469.546
Dubai Crude 86.29 1,354.442
Total 1,752.71 2,003.6 1,626.06 1,743.49 1,823.99
Crude Input 1,752,710 2,003,600 1,626,060 1,743,490 1,823,990
Local production output of the refinery can be identified with respect to major product categories. Accordingly, furnace oil output is the largest all the time followed by diesel. Relatively a significant amount of Jet fuel, Avtur is also produced at the local refinery. The production output of the refinery over five years from 2010 to 2014 is given in table 12.
Table 12: Production Output by Category from 2010 to 2014 (Thousands of Tons)
2010 2011 2012 2013 2014
LPG 22.93 24.11 17.44 22.14 28.12
Petrol Total 157.97 206.48 151.57 143.96 152.26
Avtur 126.41 155.35 93.16 124.54 168.48
Kerosene 92.78 92.92 74.84 57.30 65.20
Naphtha Total 84.29 79.96 70.88 86.50 117.04
Diesel Total 441.54 501.08 394.16 389.72 496.24
Furnace Oil Total 685.88 614.63 648.41 723.77 641.21
Solvents Total 2.73 3.80 3.70 3.00 2.51
Bitumen 34.94 46.06 26.55 5.02 0
Total Refinery Production 1,649.47 1,724.39 1,480.71 1,555.95 1,671.06
Own Use and Losses (%) 5.90 13.90 8.90 10.80 8.40
Statistics on sales of petroleum products reveal that sales volumes of most of products are increasing. Among them LPG, Petrol (Gasoline) and Diesel are significant. Table 13 provides details of domestic sales volumes of all major petroleum products.
14

Table 13: Domestic Sales Volume of Petroleum Products from 2010 to 2014
Domestic Sales Volume (thousand tones)
2010 2011 2012 2013 2014
LPG 185 198 223 231 232
petrol (Gasoline) 617 709 751 787 836
Kerosene 165 169 143 126 122
Auto Diesel 1,508 1,639 1,575 1,660 1,681
Super Diesel 12 16 22 25 36
Furnace Oil 168 163 159 148 160
Other Local Sales (thousand tones)
Power Generation 1,070 1,273 1,482 656 962
Domestic Bunkers 28 32 30 36 47
Domestic Aviation 170 7 32 2 3
Packaged Products 84 151 95 52 33
Total 4,006 4,358 4,511 3,723 4,113
Despite the facts that some petroleum products are exported, the volume is not significant. Statistics on export of petroleum products are given in table 14.
Table 14: Export of Petroleum Products and Bunkering from 2010 to 2014
2010 2011 2012 2013 2014
Naphtha 26.69 36.737 0 34.19521 20.7115
Gasoline 0 0 0 0 0
Kerosene 0 0 0 0 0
Diesel 55.33 65.28 53.61 54.07 88.37
Furnace Oil 199 248.31 242.11 370.19 337.85
Avtur 111.01 307.9807 386.1212 347.2307 458.25
Avgas 0 0.00176 0 0.879765 0.0018
Lubricants 0 0 0 0 0
Total Export & Foreign Bunker Sales 392.03 658.31 681.84 806.57 905.18
15

CMA INTEGRATIVE CASE STUDY – (ICS - 501) May 2016Examination- Marking Grid
Marks A B C D E
High level of Management Accounting awareness relating to world examples
17-20
Good Management Accounting awareness relating to case study examples
11-16
Some level of Management Accounting awareness relating to few case study examples
10-14
Low level Management Accounting awareness
5-9
Lack of Management Accounting awareness
0-4
1. Management Accounting 20 Sound technical knowledge
in Management Accounting
20
High level of application of theory in an analytical manner in solving problems in the case study
17-20
Good level of application of theory in an analytical manner solving problems in the case study.
11-16
Some level of application of theory in an analytical manner solving problems in the case study.
10-14
Low level of application of theory in solving problems in the case study
5-9
Lack of application of theory in solving problems
0-4
2. Application of theories Diverse knowledge clearly applied in an analytical and practical manner in solving the problems in the case study.
High level of recognition of key issues and these being prioritized logically with a clear rational.
8-10
Good level of recognition of issues and these being prioritized logically
5-7
Some level of recognition of issues and these being prioritized
3-4
Low level of recognition of issues
1-2
Lack of recognition of issues
0
3. Identifying key issues Issues to be identified and prioritized in a logical manner with a clear rationale.
10
4. Decision making skills Ability to recognize and present appropriate alternate solutions and make effective judgment in a logical & rational manner.
20
High level of ability to recognize and present appropriate alternate solutions and make effective judgment in a logical and rational manner
17-20
Good level of ability to recognize and present alternate solutions and make effective judgment in a logical and rational manner.
11-16
Some level of ability to recognize and present alternate solutions in a logical and rational manner
10-14
Low level of ability to recognize alternate solutions
5-9
Lack of ability to recognize alternate solutions
0-4
High level of ability to communicate effectively with realistic recommendations in a concise and logical manner
5. Logical arguments Ability to communicate effectively with realistic recommendations in a concise and logical manner.
20
17-20
Good level of ability to communicate effectively with realistic recommendations in a concise manner
11-16
Some level of ability to communicate effectively with realistic recommendations in a concise manner
10-14
Low level of ability to communicate effectively
5-9
Lack of ability to communicate effectively
0-4
6. Communication skills Style and synthesis in evaluation of a good report to higher management.
10 High level of combining ideas and experiences in a professional manner using relevant appendixes
8-10
Good style in writing a Management Report encompassing ideas and recommendations with some appendixes
5-7
Some style in writing a Management Report encompassing ideas and recommendations
3-4
Poor style in writing a Management Report
1-2
Lack of knowledge in writing a Management Report
0
100 TOTAL
16


![INDEX []...INDEX Page 501-E01 CYLINDER, HEAD AND COVER 3 501-E02 PISTON/CRANKSHAFT 5 501-E03 INTAKE/ESHAUST 7 501-E04 WATER PUMP 11 501-E05 OIL PUMP 13 501-E06 OIL SYSTEM 15 501-E07](https://img.pdfslide.us/doc/110x75/5e9579482775034fef0cc642/index-index-page-501-e01-cylinder-head-and-cover-3-501-e02-pistoncrankshaft.jpg)