Embed Size (px)
Citation preview
INTEGRATION OR SEGMENTATION OF MALAYSIAN EQUITY MARKET:
AN ANALYSIS OF PRE- AND POST-CAPITAL CONTROLS
Mansor H. Ibrahim* Department of Economics, IIUM
November 2004
* Address: Department of Economics, International Islamic University Malaysia, KM 16 Jalan Gombak 53100 Kuala Lumpur MALAYSIA. Email- [email protected]
2
INTEGRATION OR SEGMENTATION OF MALAYSIAN EQUITY MARKET:
AN ANALYSIS OF PRE- AND POST-CAPITAL CONTROLS
ABSTRACT
The paper implements time series techniques of cointegration and vector autoregression (VAR) to assess the integration or segmentation of Malaysian equity market prior to the Asian crisis and after the imposition of capital controls. We consider both regional and international financial forces represented by respectively the ASEAN markets and the advanced markets of US and Japan. We form three systems of share prices – (i) ASEAN markets; (ii) US, Japan and Malaysia; and (iii) US, Japan and ASEAN. Our findings suggest no long run relation among share prices in all systems before the Asian crisis and after the imposition of capital controls. However, there are substantial short run dynamic interactions among regional markets of ASEAN. We note significant responses of the Malaysian market to ASEAN shocks regardless of the sample periods. By contrast, its responses to innovations in US and Japan, while significant before the Asian crisis, turn insignificant after the imposition of capital controls. Comparatively, the US market is more influential in accounting for fluctuations in the ASEAN markets. From the results, while not attributing solely to capital control measures, we contend that capital controls play some role in insulating the Malaysian market from international disturbances. Keywords: Integration and Segmentation, Cointegration, Vector Autoregression, Generalized Impulse Responses.
3
INTEGRATION OR SEGMENTATION OF MALAYSIAN EQUITY MARKET:
AN ANALYSIS OF PRE- AND POST-CAPITAL CONTROLS
1. INTRODUCTION
The recent 1997/1998 financial crisis that sent various East Asian and Southeast
Asian markets into financial turbulences has captured much attention. Triggered by
successful speculative attack on Thai baht, the stock markets of severely-hit crisis
countries (namely, Indonesia, Malaysia, the Philippines, South Korea, and Thailand)
witnessed shattered market sentiments and tremendous drop in their share prices. As an
example, the Kuala Lumpur Composite Index ended the month of June, 1997 with 1077
points. However, it dropped to as low as 262 points on September 1, 1998. Indeed, to
date, the index has yet recovered to the level achieved prior to the crisis. The crisis
culminated in a sudden halt of impressive growth experienced by these countries for over
a decade. In 1997, the growth rates of Indonesia, South Korea, Malaysia, the Philippines
and Thailand were respectively 4.7%, 5.0%, 7.3%, 5.2% and -1.7%. Then, in 1998, these
growth figures dropped substantially to -13.1%, (Indonesia), -6.7% (South Korea), -7.4%
(Malaysia), -0.6% (the Philippines) and -10.2% (Thailand).
As correctly noted by Athukorala (2001), domestic stabilization policies implemented
in these countries are not sufficient to restore market confidence. In responses to the
crisis, the normal route to instill confidence in the market for a crisis country is to turn to
the IMF for assistance, which has been adopted by Indonesia, the Philippines, South
Korea and Thailand. Malaysia, however, has taken an unorthodox route by adopting an
official peg to the US dollar buttressed by selective capital controls on mainly short-term

4
capital flows. The main argument provided for this policy adoption is to stabilize the
exchange rate and to insulate domestic financial markets from volatile short-term
financial flows so that policy makers can pay undivided attention to standard monetary
and fiscal stabilization policies. This policy response has received substantial attention
and revived interest on various aspects of capital controls. The main aspects include
effectiveness of (Athukorala, 2000, 2001, Dornbusch, 2001, Kaplan and Rodrik, 2001)
and benefits and costs of capital controls (Nambiar, 2003). While these studies have
added to our understanding, the implication of capital controls on financial integration
and linkages of the Malaysian market with regional markets and advanced markets seems
to receive little attention1.
Accordingly, the purpose of this paper is to address this issue by examining long-run
and short-run dynamic linkages of the Malaysian stock market with regional and global
equity markets for the periods before and after capital controls. The analysis can aid
policy makers in assessing interdependencies of international equity markets and the
extent to which independent policies can be implemented. If the markets are segmented
by the adoption of capital controls, then policy makers have room for independent
domestic policies. By contrast, significant linkages between national equity markets mean
that developments in domestic and international financial markets can not be ignored.
Apart from this policy aspect, the analysis also bears important implications on
international portfolio diversification. Namely, to the extent that the Malaysian market is
segmented, it can be a potential market for international investors to diversify their
1 Notable studies that have examined stock market linkages of ASEAN countries are Palac-McMiken (1997), Roca et al. (1998), and Daly (2003). While the first two studies utilize data up until 1995, Daly (2003) focuses specifically on the role of Asian crisis. Our analysis complements these studies by looking at the role of capital controls.

5
portfolios provided accounts are made on risks or benefits involved with capital controls.
All else equals, the reduced correlation between, for example, the US and Malaysian
markets means an increase in the weight of the Malaysian (US) market in the US
(Malaysian) investors’ portfolios. Lastly, capital controls also bear important implications
for the developments of Malaysian capital markets.
Malaysia provides an interesting case study as arguments can be made for both
market segmentation and market integration. The imposition of capital controls with
restrictions on short term capital flows tends to deactivate the finance link among equity
markets. Accordingly, as it is intended, the domestic equity market may be insulated
from international financial disturbances. Indeed, Cornelius (1992) provides evidence for
the effectiveness of capital controls as an insulation device for the case of three emerging
markets. However, the trade link that connects Malaysia to other regional economies
and to advanced economies of the US and Japan remains strong even during the crisis
and after the imposition of capital controls. The three largest trading partners of
Malaysia are the United States, Singapore and Japan, accounting for more than 50% of
Malaysia’s exports. Similarly, prior to the Asian crisis, more than 50% of Malaysia’s
imports were from these three countries. The import ratio from these three countries
reduced slightly after the crisis period due to Ringgit depreciation but remains above
45%. The high level of trade between Malaysia and these three countries, thus, can serve
as a channel that links their stock prices. As noted by Hatemi-J and Roca (2004), equity
markets of countries that have significant economic links tend to be integrated or
interdependent. Some examples are the US and Canada (Jorion and Schwartz, 1986) and
Malaysia and Singapore (Cheung and Ho, 1991). Accordingly, if the trade channel is
6
operative, the Malaysian equity market may still be integrated with other markets even
after the imposition of capital controls.
In the analysis, we rely on standard time series methods in assessing long run
relations and short run dynamic linkages between the Malaysian equity market and other
regional and international markets. More specifically, we use cointegration tests to
evaluate the long run co-movements among the stock markets. Then, we construct
vector autoregressive (VAR) models and simulate impulse response functions to discern
short run dynamic interactions among them. As we have emphasized, our focus is on
the role capital controls have played in the linkages of Malaysian equity market with
international and regional markets. Accordingly, we assess the linkages for the period
prior to the Asian crisis and for the period after the imposition of capital controls. The
organization of the paper is as follows. In the next section, we provide a brief
background of the Malaysian stock market, the Kuala Lumpur Stock Exchange, and
highlight some important aspects of capital controls implemented in September 1998.
Then, section 3 details data preliminaries. Section 4 implements time series analysis.
Lastly, section 5 concludes with the main findings.
2. BACKGROUND
The history of stock trading in Malaysia can be traced as far back as early 1930s.
Prior to 1973, Malaysia shared one exchange market for common stocks with Singapore,
having trading rooms in both Kuala Lumpur and Singapore. In 1964, following the
formation of Federation of Malaysia in September 1963, the Stock Exchange of Malaysia
was established. Then, it was renamed as the Stock Exchange of Malaysia and Singapore

7
after the secession of Singapore from Malaysia in 1965. Formal separation of the Stock
Exchange of Malaysia and Singapore into the Kuala Lumpur Stock Exchange (KLSE) for
Malaysia and Stock Exchange of Singapore (SES) for Singapore took place in May 1973.
The move was in conjunction with the termination of exchange rate interchangeability
between Malaysia and Singapore and was motivated by a policy objective to strengthen
Malaysia’s financial institutions.
Prior to the imposition of capital controls, investors can move fund in and out from
the country freely, making the Kuala Lumpur Stock Exchange one of highly integrated
equity markets (World Bank, 1997). Until recent difficulties, the KLSE had emerged to
become one of the fastest growing financial markets in the world. Facilitated by the
country’s privatization policy and high growth performance, market capitalization and
turnovers had increased markedly, especially since 1987. During 1980-1986, the average
market capitalization was RM62 billion. It then increased to RM74 billion in 1987 and to
RM807 billion in 1996, the year before the eruption of the Asian crisis. Similarly, the
value of total turnover increased almost three-fold from RM3.4 billion in 1986 to
RM10.1 billion in 1987 and over 136 times to RM463.3 billion in 1996. The market had
also witnessed rapid rise in the KLSE composite index prior to the Asian crisis.
Propelled by large portfolio investment inflows of early 1990s, the index jumped from
644 points at the end of 1992 to 1275 points at the end of 1993 and remained above
1000 points on average until mid-1997. Indeed, assessing stock market development for
44 countries, Demirgüç-Kunt and Levine (1996) ranked Malaysia third in terms of
growth rates of market capitalization and the ratio of total value traded to GDP.

8
The Asian crisis, which was triggered by speculative attack on Thai baht and later on
other currencies in the region, has put a sudden halt to this rapid growth of the Malaysian
equity market. The market index nosedived during the crisis to as low as 262 points on
September 1, 1998. The market capitalization was cut more than half from year 1996 to
RM375.8 billion in 1997 and to RM374.5 in 1998. Value of turnovers reduced
substantially to only RM115.2 billion in 1998. As Athukorala (2001, Chapter 5) notes,
the currency and stock market collapses spread to the banking sector and, later, vibrated
to the real sector. All the severely crisis-hit countries including Malaysia experienced
sharp reduction in their real activities. Subsequently, on September 2, 1998, the
Malaysian government implemented selective capital controls and fixed the exchange rate
to RM3.80 per US dollar as part of a package to deal with the crisis. The main aim of
capital controls is to insulate domestic financial markets from volatile portfolio capital
flows and from speculative activities for the much needed breathing room for the
implementation of domestic stabilization policies.
The 1998 capital controls contain essentially measures that eliminate offshore
speculative activities and curb external portfolio capital outflows. Malaysia is perhaps the
only emerging market that had an offshore market for its currency which, during the
crisis, contributed to exchange rate turbulences. Knowing that it was a major source of
ringgit for speculative purposes, the government eliminated this offshore market by
prohibiting repatriation of externally held ringgit deposits to Malaysia after September
1998. This means that any ringgit outside Malaysia after that date is no longer legal
tender. Domestic ringgit credit facilities to non-residents were also prohibited. As part
of a package to curtail speculative activities on Malaysian shares, the Central Limit Order
9
Book (CLOB), which had operated in Singapore since the delisting of Malaysian shares
from the Stock Exchange of Singapore in 1990, was shut down. The measures also
impose restrictions on external portfolio capital outflows by requiring a 12-month
waiting period. Then, in September 15, 1999, the government introduced exited levies
that differ according to whether capital was already in the country or entering the country
after that date and according to length of stay. This levy system, however, was later
modified to make Malaysian equity market attractive to international investors2.
The Malaysian capital controls have attracted substantial interest with discussions
concentrating mainly on their effectiveness and costs and benefits. Although some
praise the measures as effective crisis management tools (Athukorala, 2000, 2001), others
argued that it would be unconvincing to attribute Malaysian recovery to capital control
measures (see, for instance, Jomo, 2003). Malaysia recorded a V-shaped recovery,
experiencing a positive growth of 6.1% in 1999 after the drastic contraction in output of
7.4% in 1998. While it is tempted to attribute this remarkable turnaround to capital
controls, other crisis-hit countries have also registered positive growth in 1999. Indeed,
they recovered more rapidly than Malaysia. More importantly in our context, capital
controls are generally viewed as discouraging foreign investments and portfolio inflows.
It may be argued that, as they are intended, capital controls have insulated domestic stock
market from volatile financial flows. In other words, to the extent that financial links
among nations play a dominant role in stock market integration, there is a possibility of
market segmentation for the Malaysian case. As the issue bears important implications
on the effectiveness of capital controls as an insulation device, international portfolio
2 The brief description of the 1998 capital controls in this section benefits greatly from Jomo (2003). Readers should refer to Jomo (2003) for more details.
10
diversification, and on capital market developments, the current analysis focus on the
role capital controls have played on dynamic linkages between the Malaysian market and
other international and regional markets.
3. DATA PRELIMINARIES
We employ the widely-cited market index for the Malaysian market, the Kuala
Lumpur composite index (KLCI), to assess its long run relations and short run dynamic
linkages with global and regional markets. By global markets, we mean two dominant
equity markets of the US and Japan. The Standard & Poor 500 index (SP) is used to
represent the US market while the Nikkei 225 index (NK) represents the Japanese
market. We use other ASEAN market indexes to represent regional markets. Namely,
they are the Jakarta composite index for Indonesia (JSE); the PSE composite for the
Philippines (PSE); the Strait Times index for Singapore (STI); and SET index for
Thailand (SET). The main source of data is EconStats3. The data are monthly for the
time period covering January 1988 to December 2003. The behavior of the Malaysian
market is assessed for two sample periods – pre-crisis period (January 1988 – December
1996) and post-capital control period (January 1999 – December 2003). These indices
are expressed in natural logarithm. Table 1 presents descriptive statistics of these index
returns over the whole period, pre-crisis period, and post-capital control period. Figure 1
plots the Malaysian index against the indexes from advanced markets, i.e. the US, Japan
and Singapore. Meanwhile, Figure 2 plots the Malaysian index against the remaining
3 Website address: www.econstats.com.

11
three indexes. Note that, in the figures, they are normalized such that the first
observations take the value of 100.
Several points are notable from the table. First, the Japanese market is distinct from
the rest in that it recorded a negative return over the period under consideration,
reflecting continuing decline in the market after the stock market bubble burst in late
1980s. The S&P 500 index exhibited an upward trend until the turn of century but then
reverted downward owing to looming recession and various global political uncertainties.
From 1999 to 2003, the S & P 500 index recorded an average monthly return of -0.17%.
Except the PSE index during the second period, the ASEAN stock markets documented
positive returns. Although these markets nosedived in magnitudes unanticipated by
many during the Asian crisis, they still posed positive returns over the whole sample
period. These positive returns were accounted mostly by the markets’ impressive growth
prior to the Asian crisis. Indeed, before the crisis, most ASEAN stock markets
witnessed higher returns than that of the US.
The emerging markets of ASEAN (Indonesia, Malaysia, the Philippines and
Thailand) are relatively more volatile as compared to the advanced markets of US, Japan
and Singapore, a stylized fact for the emerging markets. As may be noted from the table,
the unconditional standard deviations of market returns are higher for the former for all
sample periods. Additionally, the index returns tend to be negatively skewed. However,
the returns do not seem to exhibit excess kurtosis, except only for few cases. This seems
reasonable as the leptokurtic property of market returns tends to characterize only high
frequency data but disappears under temporal aggregation. Lastly, as normally
documented for time series data, we note that the market indices under consideration
12
contain a unit root. The augmented Dickey-Fuller (ADF) unit root test fails to reject the
unit root null for all indices except for the case of Indonesia (Whole Sample) and
Malaysia (Pre-crisis). However, the unit root null is rejected once they are first-
differenced. In short, these indices can generally be characterized as integrated of order
1, or an I(1) process.
The plots of these indexes in Figure 1 and Figure 2 clearly reflect the noted
descriptions of stock price movements with generally upward trend in the markets prior
to the Asian crisis except for the case of Japan and with higher volatility of emerging
markets. Generally, the figures seem to suggest some correlations among these price
series not only during the period prior to the crisis but also during the post-capital
control period. Indeed, in the case of Japan, the co-movements of its share prices with
other markets seem to increase during the post-capital control period. More noticeably,
the price movements tend to move in tandem during the crisis periods. During the
global market crash of October 1997, we may observe concurrent fall in these indexes.
Likewise, all markets except the US also witnessed precipitous fall in their share prices
during the recent Asian financial crisis. Note that, comparatively, the reduction in the
emerging market indexes was more pronounced, illustrating the fact that they are more
vulnerable to financial disturbances.
Casual observations of the graphical plots, however, may be illusionary. Accordingly,
we compute the price and return correlation coefficients between Malaysian market and
other equity markets for the whole sample, pre-crisis sample, and post-capital control
sample. These correlation coefficients are reported in Table 2. While not conclusive,
they serve as a preliminary assessment of short run correlations between pairs of equity

13
prices. As may be observed from the table, the price correlations between KLCI and
other indexes before the crisis are very high exceeding 0.9 in most cases. Note that, for
the case of Japan, its correlation with the Malaysian market is negative. However, these
correlations, except for the case of Indonesia, drop substantially during the post-control
period. For the case of Japan, the correlation turns positive. Likewise, we may also note
lower return correlations in the post-capital control period. The exception is only in the
case of Indonesia where the return correlation between the Kuala Lumpur Stock
Exchange and Jakarta Stock Exchange increases from 0.28 to roughly 0.51. These
statistics, thus, provide a preliminary indication of increased segmentation of the
Malaysian market after the imposition of capital controls. To be more conclusive, we
implement a formal analysis using time series techniques in the ensuing section.
4. TIME SERIES ANALYSIS
To further evaluate market integration or segmentation of the Malaysian stock
market, we proceed to time series framework of cointegration and vector autoregression.
We use cointegration tests to assess the long run co-movements among the stock
markets and vector autoregressive (VAR) models to evaluate their short run dynamic
interactions. While the correlation analysis focuses on bivariate relations between equity
prices, our main aim in this section is to look at regional and global integration or
segmentation of the Malaysian market. Three systems of markets are analyzed - (i)
ASEAN, (ii) Malaysia, US and Japan, and (iii) ASEAN, US and Japan. The analysis is
done for pre-crisis period (January 1988 – December 1996) and post capital control
period (January 1999 – December 2003).

14
4.1 Cointegration
To test for long-run co-movements or cointegration among stock markets, we apply
multivariate cointegration test of Johansen (1988) and Johansen and Juselius (1990).
They develop trace and maximal eigenvalue statistics to determine the presence as well as
the number of cointegration vectors in the system. As it is well known, the Johansen-
Juselius cointegration test is not only sensitive to the order of VAR but also tends to be
biased toward finding evidence for cointegration especially in finite samples. While there
are various information criteria that can be employed to determine the lag length,
Cheung and Lai (1993) show that lag length selection using information criteria may not
be adequate in the presence of moving average error terms. Hall (1989) and Johansen
(1992), however, suggest specifying the lag length such that the VAR residuals are serially
uncorrelated or Gaussian. Accordingly, in the present analysis, we specify the lag length
according to their suggestion. To account for finite sample bias, we adjust the test
statistics by a factor of (T – nk)/T as suggested by Reinsel and Ahn (1992), where T is
the number of effective observations, n is the number of variables, and k is the order of
VAR.
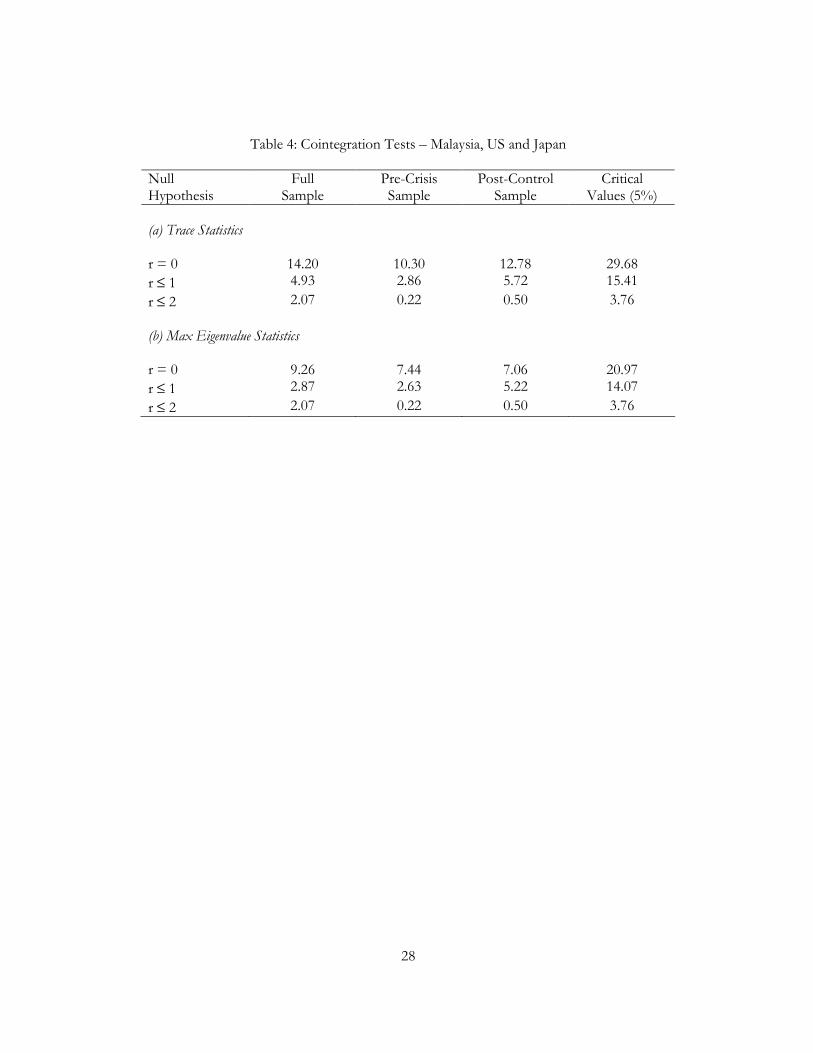
Table 3 reports cointegration test results for the ASEAN markets. Meanwhile, Table
4 reports the results for the markets of Malaysia, US and Japan. As may be noted from
the tables, the null hypothesis of no cointegration can not be rejected for both systems
and for all sample periods. Accordingly, the Malaysian equity prices are neither tied to
regional markets nor to advanced markets of the US and Japan. In other words, they can
drift arbitrarily away from other market trends in the long run. These results conform
well to those documented by Roca et al. (1998) and Daly (2003). In particular, Roca et al.
15
(1998) find no evidence indicating long-run co-movements among ASEAN markets
using weekly data from 1988 to 1995. Similarly, based on daily data from April 1990 to
October 2001, Daly (2003) finds limited evidence of cointegration among ASEAN
markets and among ASEAN and three advanced markets of Australia, Germany and the
United States. It needs mentioning that evidence of cointegration among ASEAN
markets is documented in Palac-McMiken (1997). However, unlike ours, his results are
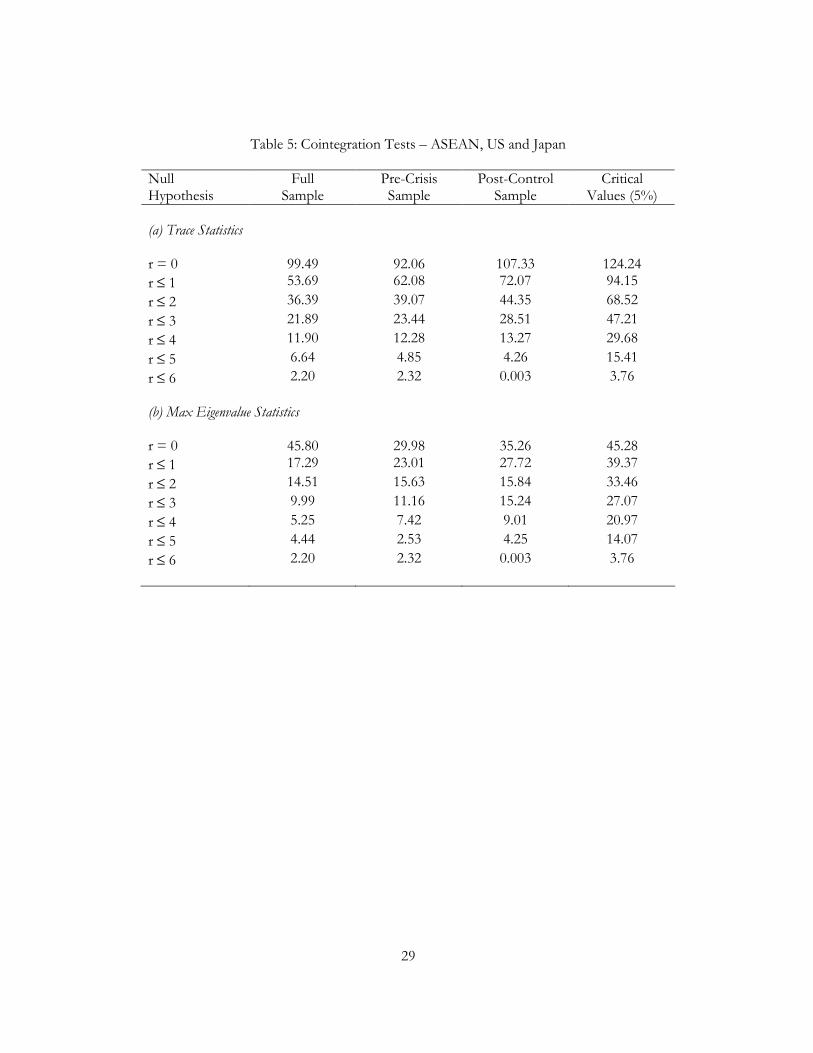
based on the bivariate Engle and Granger’s (1987) two-step cointegration test. Note that
our results are further substantiated in our 7-market systems consisting of ASEAN
markets, US and Japanese markets (Table 5).
Thus, based on the foregoing results, we are unable to infer the role capital controls
play in the long run financial integration of the Malaysian market. Prior to the crisis, the
ASEAN markets serve as potential markets for international portfolio diversification to
investors that have long-term investment horizons. This potential remains even after the
Asian crisis. For the case of Malaysia, however, the risks or benefits associated with
capital controls need to be incorporated as an additional input before committing to long
term investments.
4.2 VAR Analysis
We next estimate VAR models to assess short-run dynamic interactions among the
share prices. Given no evidence of cointegration, we estimate the VAR models using the
variables in first differences. Then, from the VAR models, we generate impulse-response
functions as a basis for inferences. We are interested in the dynamic interactions
between the Malaysian market and other ASEAN markets as well as between these
markets and the advanced markets of US and Japan. The latter allows us to assess the
16
Malaysian market short run behavior in comparison with the dynamics of other ASEAN
markets that have not adopted capital controls. In implementing the VAR models, we
note that the error terms are significantly contemporaneously correlated especially among
the ASEAN markets. This means that the use of traditional Cholesky factorization as
suggested by Sims (1980) in generating the impulse response functions would not be
appropriate since the results will be markedly different depending on the ordering of
variables in the VAR models. Accordingly, we adopt the generalized impulse response
functions developed by Pesaran and Shin (1998), which are shown to be invariant to the
variables’ ordering.
Recall that we have three systems of equations – (i) ASEAN markets; (ii) Malaysia,
US, and Japan; and (iii) ASEAN, US and Japan. The results we obtained for the first two
systems are similar to and fully captured by system (iii). Thus, to avoid repetition in the
discussion of results, we only present the results for the third system. We first look at
dynamic responses of KLCI to shocks in other ASEAN markets and responses of
ASEAN markets to innovations in KLCI, which are summarized in Figure 3. Then, we
assess the responses of ASEAN markets to innovations in the two developed markets
(Figure 4). Panel (a) of the figures presents the results for pre-crisis period. Meanwhile,
panel (b) captures the results for post-capital control period.
From Figure 3, we observe substantial dynamic interactions among the ASEAN
markets prior to the crisis. Indeed, the responses of these markets to innovations in
other ASEAN markets are immediate and significant but subside toward zero quickly.
Note that the Malaysian market reacts positively to shocks and, at the same time, its
shocks lead to positive responses from other markets. These two-way effects between

17
the Malaysian market and other ASEAN markets prevail during the post-capital control
period. However, while significant, the responses seem to be less in magnitude in the
second sample, post-capital control sample. Regionally, thus, the imposition of capital
control measures by Malaysia beginning September 1998 has not led to complete
segmentation of its equity market. Regional market developments are still an important
force in driving the dynamics of Malaysian market. Likewise, news from the Malaysian
market remains relevant. These perhaps reflect close proximity and economic ties
between the countries of ASEAN.
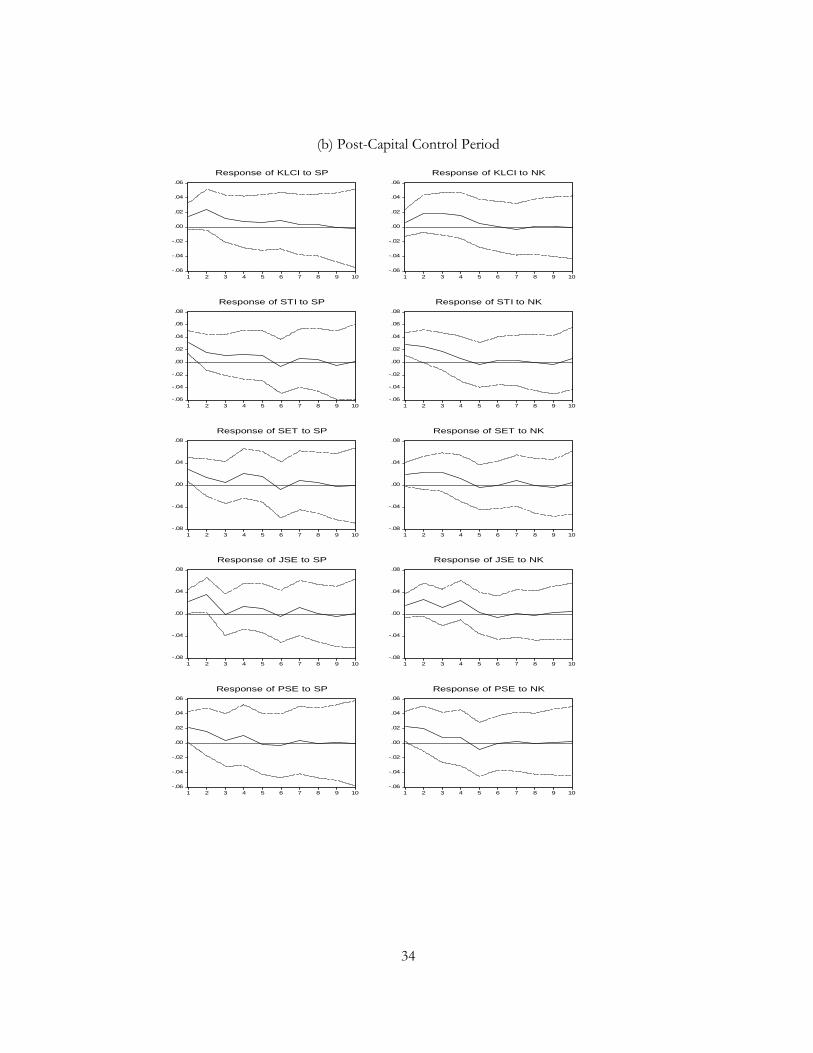
The responses of ASEAN markets to the developed markets, plotted in Figure 4,
reveal several interesting insights. Generally, the US market seems to be more influential
than the Japanese market in accounting for short run dynamics of the ASEAN markets.
Prior to the crisis, innovations in the advanced markets of US and Japan solicit positive
and significant reactions from the markets of Malaysia, Singapore and Thailand. The
Philippine market reacts significantly to only the US innovations. Meanwhile, the Jakarta
Stock Exchange tends to be isolated or segmented from the two advanced markets.
While positive, its responses to the US and Japanese shocks are not significant. During
the second period, we observe the reduced role of Japanese market in accounting for the
variations in the ASEAN markets. To be more specific, none of the ASEAN markets
except Singapore react significantly to positive Japanese shocks. Meanwhile, the US
shocks remain significant in explaining the variations in the equity prices of Singapore
and Thailand. Additionally, the reaction of Indonesian market turns significant while
that of the Philippine market is not significant. In short, there seem to be some changes

18
in the influences of international markets on the ASEAN markets. Our results suggest a
reduced role of the global financial forces.
Turning to the case of Malaysia, we document evidence that the Malaysian market
turns from being vulnerable into being insignificant in reacting to international shocks.
While regional forces remain significant, the reaction of Malaysian market to innovations
in both the US and Japan are insignificantly different from zero. The questions are: Has
the Malaysian market been more insulated from international disturbances after capital
controls? Are capital controls an effective insulation device? The answer to the first
question is affirmative. While the evidence clearly indicates insignificant responses of the
Malaysian market to global shocks in the second sample, the answer to the second
question is not unequivocally yes. Our contention is that capital controls do play some
role in accounting for the reduced integration or increased segmentation of Malaysian
market. However, the insignificant responses in the second sample can not be attributed
fully to capital control measures. The markets of Thailand and the Philippine also
become less vulnerable to global shocks, although they opt for the IMF-style measures.
Perhaps, the Asian crisis has heightened market risks in these markets. Accordingly,
equity returns in these markets may not move in tandem with those of the advanced
markets. Moreover, the influences of advanced markets may still be felt indirectly by the
Malaysian market, propagated through the regional markets of ASEAN.
5. CONCLUSION
Understanding long run relations and dynamic interactions among national equity
markets bears important implications on the implementation of independent
19
macroeconomic policies, international portfolio diversification, and on capital market
developments. In this paper, we assess this issue for the case of Malaysia, which has
adopted capital controls as a crisis management tool. In specific, we focus on the
question of market segmentation or integration as experienced by Malaysia after the
imposition of capital controls, examining the influences of regional forces (i.e. ASEAN
markets) and international forces (i.e. US and Japanese markets) before the Asian crisis
and after the imposition of capital controls. The analysis relies on time series techniques
of cointegration and vector autoregression to respectively examine the long run relations
and short run dynamic interactions among equity prices. In the latter, we adopt
generalized impulse response functions as a basis for making inferences. Three systems
of share prices are considered – (i) ASEAN, (ii) US, Japan and Malaysia, and (iii) US,
Japan and ASEAN.
From the analysis, we document various interesting results. To summarize, they are
stated as follows:
• There is no long run relation among share prices in all systems of share prices
before the Asian crisis and after the imposition of capital controls.
• There are substantial short run dynamic interactions among regional markets of
ASEAN. The significant responses of Malaysian market to ASEAN shocks
documented prior to the crisis period prevail after the imposition of capital
controls.
• Comparatively, the US market is more influential in accounting for fluctuations
in the ASEAN markets.

20
• The responses of Malaysian market to innovations in US and Japan, while
significant prior to the Asian crisis, turns insignificant after the imposition of
capital controls.
Apart from the above results, we also note some asymmetry in the responses of ASEAN
markets to international shocks. Some ASEAN markets respond to both the US and
Japanese markets while others respond only to the US markets. Among the ASEAN
markets, the Indonesian market seems to be most isolated from international
disturbances pre-crisis while the Malaysian market is least affected after the crisis.
Needless to say, with the exception of Singapore, there seems to be a reduction in the
responses of ASEAN markets to international disturbances after the crisis.
Generally, our results suggest reduced integration or increased segmentation of the
Malaysian equity market. We contend that, while not completely attributing this finding
to capital control measures implemented by Malaysia, capital controls play some role in
insulating the Malaysian market from the international disturbances in the short run.
Note that, despite this, the regional forces remain a significant driving factor in
explaining the dynamics of Malaysian market. This may reflect the close proximity and
economic ties among the ASEAN markets. The implication of our finding is that the
ASEAN markets remain potential markets for international diversification in the long
run. However, the benefits for international portfolio diversification in these markets in
the short run may be limited. While the Malaysian and the Philippine markets can be
potential for short run diversification, since we observe their insignificant responses to
international shocks in the second period, proper accounts of specific risks inherent in
these markets need to be made. Lastly, to the extent that capital controls discourage

21
portfolio flows and accordingly untie the financial links between national markets, the
needed liquidity for the progress of the capital market may be restricted.

22
REFERENCES
Athukorala, Prema-Chandra, (2000), “Capital Account Regimes, Crisis, and Adjustment
in Malaysia,” Asian Development Review, 18(1), 17-48.
Athukorala, Prema-Chandra, (2001), Crisis and Recovery in Malaysia: the Role of Capital
Controls, Cheltenham: Edward Elgar.
Cheung, Y.L., and Ho, Y.K., (1991), “The Intertemporal Stability of the Relationships
Between the Emerging Asian Equity Markets and the Developed Equity Markets,”
Journal of Business, Finance and Accounting, 18(2), 235-254.
Cheung, Y. W. and Lai, K.S., (1993), “Long-run Purchasing Power Parity during the
Recent Float,” Journal of International Economics, 34, 181-192.
Cornelius, Peter K., (1992), “Capital Controls and Market Segmentation of Emerging
Stock Markets,” Seoul Journal of Economics, 5(3), 289-299.
Daly, K. J., (2003), “Southeast Asian Stock Market Linkages: Evidence from Pre- and
Post-October 1997,” ASEAN Economic Bulletin, 20(1), 73-85.
Engle, R.F. and Granger, C.W.J., (1987), “Co-Integration and Error Correction:
Representation, Estimation and Testing,” Econometrica, 55(2), 251-276.
Dornbusch, Rudi, (2001), “Malaysia: Was it Different?” National Bureau of Economic
Research Working Paper, 8325, June.
Hall, S.G., (1989), “Maximum Likelihood Estimation of Cointegration Vectors: An
Example of the Johansen Procedure,” Oxford Bulletin of Economics and Statistics,
51, 213-218.
Hatemi-J, A., and Roca, E. D., (2004), Do Birds of the Same Feather Flock Together?
The Case of the Chinese States Equity Markets,” Journal of International Financial

23
Markets, Institutions and Money, 14, 281-294.
Johansen, S., (1992), “Testing Weak Exogeneity and the Order of Cointegration in UK
Money Demand Data,” Journal of Policy Modeling, 14, 313-334.
Johansen, S., (1988), “Statistical Analysis of Cointegration Vectors,” Journal of Economic
Dynamics and Control, 12, 231-254.
Johansen, S. and K. Juselius, (1990), “Maximum Likelihood Estimation and Inference on
Cointegration: with Applications to the Demand for Money,” Oxford Bulletin of
Economics and Statistics, 52(2), 169-210.
Jomo, K. S., (2003), M Way: Mahathir’s Economic Legacy, Kuala Lumpur: Forum.
Jorion, P., and Schwartz, E., (1986), “Integration vs. Segmentation in the Canadian Stock
Markets,” Journal of Finance, 41, 603-614.
Kaplan, Ethan and Rodrik, Dani, 2001, “Dis the Malaysian Capital Controls Work?”
CEPR Discussion Paper: 2754, April.
Nambiar, Shankaran, (2003), “Malaysia's Response to the Financial Crisis: Reconsidering
The Viability of Unorthodox Policy,” Asia Pacific Development Journal, 10(1): 1-23.
Palac-McMiken, E.D., (1997), “An Examination of ASEAN Stock Markets: A
Cointegration Approach,” ASEAN Economic Bulletin, 13, 299-311.
Pesaran, M.H. and Y. Shin, (1998), “Generalized Impulse Response Analysis in Linear
Multivariate Models,” Economics Letters, 58, 17-29.
Reinsel, G.C., and Ahn, S.K., (1992), “Vector Autoregressive Models with Unit Roots
and Reduced Rank Structure: Estimation, Likelihood Ratio Test and Forecasting,”
Journal of Time Series Analysis, 13, 353-375.
Roca, E.D. et al. (1998), “Are the ASEAN Equity Markets Interdependent?” ASEAN

24
Economic Bulletin, 15, 109-120.
Sims, C., (1980), “Comparison of Interwar and Postwar Business Cycles: Monetarism
Reconsidered,” American Economic Review: Papers and Proceedings, 70, 250-257.

25
Table 1: Descriptive Statistics
Equity Index Returns ADF Tests Markets Mean Std. Dev. Skewness Kurtosis X ∆X (a) Whole Sample (Jan 1988 – Dec 2003)
SP NK KLCI JSE PSE STI SET
0.0077 -0.0042
0.0054 0.0111 0.0030 0.0035 0.0046
0.0423 0.0650
0.0833 0.1053 0.0940 0.0726 0.1031
-0.5944 -0.2688
-0.0520 1.0199 -0.0536 -0.2187 -0.1310
3.8364 3.3182
4.7119 12.687 4.6531 5.1472 3.6730
-1.037 -2.991
-2.555 -3.899**
-1.867 -2.514 -2.034
-14.43* -13.97*
-4.836* -9.443* -12.06* -12.99* -12.49*
(b) Pre-Crisis (Jan 1988 – Dec 1996) SP NK KLCI JSE PSE STI SET
0.0099 -0.0019
0.0138 0.0190 0.0127 0.0083 0.0090
0.0331 0.0697
0.0651 0.1022 0.0932 0.0530 0.0901
-0.1842 -0.3032
-0.1841 2.6718 -0.1659 -0.5970 -0.3130
3.8745 3.6819
4.4736 19.891 4.5126 5.0072 4.3061
-2.314 -2.465
-3.508** -2.876 -2.390 -3.117 -2.293
-11.61* -10.68*
-6.207* -8.197* -9.585* -9.490* -8.735*
(c) Post-Capital Controls (Jan 1999 – Dec 2003)
SP NK KLCI JSE PSE STI SET
-0.0017 -0.0043
0.0051 0.0092 -0.0052 0.0039 0.0129
0.0497 0.0585
0.0744 0.0849 0.0745 0.0731 0.0958
-0.1838 -0.2415
0.8154 0.2998 0.2233 -0.2292 -0.1587
2.3476 1.9326
5.1770 2.4409 3.0281 4.3134 3.5420
-1.877 -2.063
-3.087 -2.832 -2.847 -2.715 -0.356
-7.804* -7.107*
-7.158* -5.987* -6.750* -7.398* -8.332*
Note: *, ** denote significance at 1% and 5% respectively.

26
Table 2: Correlations of Malaysian Equity Market with Other Markets
Price Correlations Return Correlations Equity Markets
Whole Sample
Pre-Crisis
Post-Control
Whole Sample
Pre-Crisis
Post-Control
SP NK JSE PSE STI SET
0.3652 -0.2499
0.7553 0.8254 0.9327 0.5280
0.9233 -0.6176
0.7837 0.9351 0.9814 0.9356
0.4083 0.4477
0.7011 0.2625 0.6676 0.3661
0.3966 0.2595
0.4094 0.5697 0.6757 0.5883
0.3970 0.3145
0.2823 0.5768 0.7855 0.6410
0.3023 0.1653
0.5057 0.3216 0.4627 0.4918

27
Table 3: Cointegration Tests – ASEAN
Null Hypothesis
Full Sample
Pre-Crisis Sample
Post-Control Sample
Critical Values (5%)
(a) Trace Statistics
r = 0
45.81
54.57
62.53
68.52
r ≤ 1 27.21 32.85 37.45 47.21 r ≤ 2 16.11 16.85 21.04 29.68 r ≤ 3 8.88 6.01 10.00 15.41 r ≤ 4 3.03 0.24 1.27 3.76 (b) Max Eigenvalue Statistics
r = 0
18.60
21.72
25.08
33.46
r ≤ 1 11.10 16.00 16.41 27.07 r ≤ 2 7.23 10.84 11.03 20.97 r ≤ 3 5.85 5.77 8.74 14.07 r ≤ 4
3.03 0.24 1.27 3.76
28
Table 4: Cointegration Tests – Malaysia, US and Japan
Null Hypothesis
Full Sample
Pre-Crisis Sample
Post-Control Sample
Critical Values (5%)
(a) Trace Statistics
r = 0
14.20
10.30
12.78
29.68
r ≤ 1 4.93 2.86 5.72 15.41 r ≤ 2 2.07 0.22 0.50 3.76 (b) Max Eigenvalue Statistics
r = 0
9.26
7.44
7.06
20.97
r ≤ 1 2.87 2.63 5.22 14.07 r ≤ 2 2.07 0.22 0.50 3.76
29
Table 5: Cointegration Tests – ASEAN, US and Japan
Null Hypothesis
Full Sample
Pre-Crisis Sample
Post-Control Sample
Critical Values (5%)
(a) Trace Statistics
r = 0
99.49
92.06
107.33
124.24
r ≤ 1 53.69 62.08 72.07 94.15 r ≤ 2 36.39 39.07 44.35 68.52 r ≤ 3 21.89 23.44 28.51 47.21 r ≤ 4 11.90 12.28 13.27 29.68 r ≤ 5 6.64 4.85 4.26 15.41 r ≤ 6 2.20 2.32 0.003 3.76 (b) Max Eigenvalue Statistics
r = 0
45.80
29.98
35.26
45.28
r ≤ 1 17.29 23.01 27.72 39.37 r ≤ 2 14.51 15.63 15.84 33.46 r ≤ 3 9.99 11.16 15.24 27.07 r ≤ 4 5.25 7.42 9.01 20.97 r ≤ 5 4.44 2.53 4.25 14.07 r ≤ 6
2.20 2.32 0.003 3.76

30
Figure 1: Stock Prices of Malaysia, Singapore, Japan and the US
80
90
100
110
120
130
140
88 90 92 94 96 98 00 02
KLCI STI NK SP
Onset of the Crisis
Introduction ofCapital Controls

31
Figure 2: Stock Prices of Malaysia, Indonesia, the Philippines and Thailand
90
100
110
120
130
140
150
88 90 92 94 96 98 00 02
KLCI JSE PSE SET
Onset of the Crisis
Introduction ofCapital Controls

32
Figure 3: Generalized Impulse Response Functions
(a) Pre-Crisis Period
-.04
-.02
.00
.02
.04
.06
.08
1 2 3 4 5 6 7 8 9 10
Response of KLCI to STI
-.04
-.02
.00
.02
.04
.06
.08
1 2 3 4 5 6 7 8 9 10
Response of KLCI to SET
-.04
-.02
.00
.02
.04
.06
.08
1 2 3 4 5 6 7 8 9 10
Response of KLCI to JSE
-.04
-.02
.00
.02
.04
.06
.08
1 2 3 4 5 6 7 8 9 10
Response of KLCI to PSE
-.04
-.02
.00
.02
.04
.06
.08
1 2 3 4 5 6 7 8 9 10
Response of STI to KLCI
-.04
.00
.04
.08
.12
1 2 3 4 5 6 7 8 9 10
Response of SET to KLCI
-.08
-.04
.00
.04
.08
.12
1 2 3 4 5 6 7 8 9 10
Response of JSE to KLCI
-.04
.00
.04
.08
.12
1 2 3 4 5 6 7 8 9 10
Response of PSE to KLCI
(b) Post-Capital Control Period
-.08
-.04
.00
.04
.08
1 2 3 4 5 6 7 8 9 10
Response of KLCI to STI
-.08
-.04
.00
.04
.08
1 2 3 4 5 6 7 8 9 10
Response of KLCI to SET
-.08
-.04
.00
.04
.08
1 2 3 4 5 6 7 8 9 10
Response of KLCI to JSE
-.08
-.04
.00
.04
.08
1 2 3 4 5 6 7 8 9 10
Response of KLCI to PSE
-.08
-.04
.00
.04
.08
1 2 3 4 5 6 7 8 9 10
Response of STI to KLCI
-.10
-.05
.00
.05
.10
1 2 3 4 5 6 7 8 9 10
Response of SET to KLCI
-.08
-.04
.00
.04
.08
.12
1 2 3 4 5 6 7 8 9 10
Response of JSE to KLCI
-.08
-.04
.00
.04
.08
.12
1 2 3 4 5 6 7 8 9 10
Response of PSE to KLCI

33
Figure 4: Generalized Impulse Response Functions
(a) Pre-Crisis Period
-.03
-.02
-.01
.00
.01
.02
.03
.04
.05
1 2 3 4 5 6 7 8 9 10
Response of KLCI to SP
-.03
-.02
-.01
.00
.01
.02
.03
.04
.05
1 2 3 4 5 6 7 8 9 10
Response of KLCI to NK
-.02
-.01
.00
.01
.02
.03
.04
.05
1 2 3 4 5 6 7 8 9 10
Response of STI to SP
-.02
-.01
.00
.01
.02
.03
.04
.05
1 2 3 4 5 6 7 8 9 10
Response of STI to NK
-.04
-.02
.00
.02
.04
.06
.08
1 2 3 4 5 6 7 8 9 10
Response of SET to SP
-.04
-.02
.00
.02
.04
.06
.08
1 2 3 4 5 6 7 8 9 10
Response of SET to NK
-.03
-.02
-.01
.00
.01
.02
.03
.04
.05
1 2 3 4 5 6 7 8 9 10
Response of JSE to SP
-.03
-.02
-.01
.00
.01
.02
.03
.04
.05
1 2 3 4 5 6 7 8 9 10
Response of JSE to NK
-.04
-.02
.00
.02
.04
.06
1 2 3 4 5 6 7 8 9 10
Response of PSE to SP
-.04
-.02
.00
.02
.04
.06
1 2 3 4 5 6 7 8 9 10
Response of PSE to NK
34
(b) Post-Capital Control Period
-.06
-.04
-.02
.00
.02
.04
.06
1 2 3 4 5 6 7 8 9 10
Response of KLCI to SP
-.06
-.04
-.02
.00
.02
.04
.06
1 2 3 4 5 6 7 8 9 10
Response of KLCI to NK
-.06
-.04
-.02
.00
.02
.04
.06
.08
1 2 3 4 5 6 7 8 9 10
Response of STI to SP
-.06
-.04
-.02
.00
.02
.04
.06
.08
1 2 3 4 5 6 7 8 9 10
Response of STI to NK
-.08
-.04
.00
.04
.08
1 2 3 4 5 6 7 8 9 10
Response of SET to SP
-.08
-.04
.00
.04
.08
1 2 3 4 5 6 7 8 9 10
Response of SET to NK
-.08
-.04
.00
.04
.08
1 2 3 4 5 6 7 8 9 10
Response of JSE to SP
-.08
-.04
.00
.04
.08
1 2 3 4 5 6 7 8 9 10
Response of JSE to NK
-.06
-.04
-.02
.00
.02
.04
.06
1 2 3 4 5 6 7 8 9 10
Response of PSE to SP
-.06
-.04
-.02
.00
.02
.04
.06
1 2 3 4 5 6 7 8 9 10
Response of PSE to NK


![[Assignment 8.1] Market research - Segmentation vs brand equity](https://img.pdfslide.us/doc/110x75/55a849141a28ab9e108b47eb/assignment-81-market-research-segmentation-vs-brand-equity.jpg)