Embed Size (px)
Citation preview

Integration of Variable Renewable Energy
Volume II: Case studies
January 2015
IEA-RETD


326641 TRD EFR 5 e
Vol II: Case studies
28 November 2014
Integration of Variable Renewable Energy
Volume II: Case studies
Integration of Variable Renewable Energy
Volume II: Case studies
January 2015
IEA-RETD
Mott MacDonald, Victory House, Trafalgar Place, Brighton BN1 4FY, United Kingdom
T +44 (0)1273 365 000 F +44(0) 1273 365 100 W www.mottmac.com


326641/TRD/EFR/5/e January 2015 Vol II: Case studies
Integration of Variable Renewable Energy Volume II: Case studies
Revision Date Originator Checker Approver Description
1 May 2014 Andrew Conway Guy Doyle David Holding Working draft
2 July 2014 Andrew Conway Guy Doyle David Holding Second draft
3 September 2014 Andrew Conway Guy Doyle David Holding Final draft addressing comments
4 October 2014 Andrew Conway Guy Doyle David Holding Draft for external review
5 November 2014 Andrew Conway Guy Doyle David Holding Final draft for publication
Issue and revision record
Information Class: Standard
This document is issued for the party which commissioned it and for specific purposes connected with the above-captioned project only. It should not be relied upon by any other party or used for any other purpose.
We accept no responsibility for the consequences of this document being relied upon by any other party, or being used for any other purpose, or containing any error or omission which is due to an error or omission in data supplied to us by other parties.
This document contains confidential information and proprietary intellectual property. It should not be shown to other parties without consent from us and from the party which commissioned it.
This publication should be cited as: IEA-RETD (2015), Integration of Variable Renewables (RE-INTEGRATION), [A.Conway; Mott MacDonald] IEA Implementing Agreement for Renewable Energy Technology Deployment (IEA-RETD), Utrecht, 2015.


326641/TRD/EFR/5/e January 2015 Vol II: Case studies
Integration of Variable Renewable Energy Volume II: Case studies
Chapter Title Page
Acknowledgements and Disclaimer i
List of Acronyms ii
1 Introduction 1
1.1 Scope of the report __________________________________________________________________ 1 1.2 Jurisdictions _______________________________________________________________________ 1 1.3 Structure of the report________________________________________________________________ 2 1.4 Approach _________________________________________________________________________ 2 1.5 Data Quality _______________________________________________________________________ 3
2 Case Study Regions 4
1.6 North American regions ______________________________________________________________ 4 1.7 European regions ___________________________________________________________________ 4 1.8 Hokkaido _________________________________________________________________________ 5 1.9 Characteristics of Jurisdictions _________________________________________________________ 5
2 Alberta 7
2.1 Introduction ________________________________________________________________________ 7 2.2 Context ___________________________________________________________________________ 7 2.3 Challenges ________________________________________________________________________ 9 2.4 Integration timeline _________________________________________________________________ 10 2.5 Frame conditions __________________________________________________________________ 12 2.6 Potential developments _____________________________________________________________ 14 2.7 Lessons for other jurisdictions ________________________________________________________ 14
3 ERCOT 15
3.1 Introduction _______________________________________________________________________ 15 3.2 Context __________________________________________________________________________ 15 3.3 Challenges _______________________________________________________________________ 19 3.4 Integration timeline _________________________________________________________________ 19 3.5 Frame-conditions __________________________________________________________________ 22 3.6 Integration studies _________________________________________________________________ 25 3.7 Potential developments _____________________________________________________________ 25 3.8 Lessons for other jurisdictions ________________________________________________________ 27
4 Ontario 28
4.1 Introduction _______________________________________________________________________ 28 4.2 Context __________________________________________________________________________ 28 4.3 Challenges _______________________________________________________________________ 30 4.4 Integration timeline _________________________________________________________________ 30 4.5 Frame conditions __________________________________________________________________ 32 4.6 Potential developments _____________________________________________________________ 34 4.7 Lessons for other jurisdictions ________________________________________________________ 35
Contents

326641/TRD/EFR/5/e January 2015 Vol II: Case studies
Integration of Variable Renewable Energy Volume II: Case studies
5 Denmark 36
5.1 Introduction _______________________________________________________________________ 36 5.2 Context __________________________________________________________________________ 36 5.3 Challenges _______________________________________________________________________ 38 5.4 Integration timeline _________________________________________________________________ 38 5.5 Frame conditions __________________________________________________________________ 41 5.6 Demonstration projects ______________________________________________________________ 43 5.7 Lessons for other jurisdictions ________________________________________________________ 44
6 Germany 46
6.1 Introduction _______________________________________________________________________ 46 6.2 Context __________________________________________________________________________ 46 6.3 Challenges _______________________________________________________________________ 47 6.4 Integration timeline _________________________________________________________________ 49 6.5 Frame conditions __________________________________________________________________ 53 6.6 Potential developments _____________________________________________________________ 55 6.7 Lessons for other jurisdictions ________________________________________________________ 56
7 Great Britain 57
7.1 Introduction _______________________________________________________________________ 57 7.2 Context __________________________________________________________________________ 57 7.3 Challenges _______________________________________________________________________ 58 7.4 Integration timeline _________________________________________________________________ 59 7.5 Frame conditions __________________________________________________________________ 62 7.6 Potential developments _____________________________________________________________ 64 7.7 Lessons for other jurisdictions ________________________________________________________ 65
8 Ireland 67
8.1 Introduction _______________________________________________________________________ 67 8.2 Context __________________________________________________________________________ 67 8.3 Challenges _______________________________________________________________________ 69 8.4 Integration timeline _________________________________________________________________ 70 8.5 Frame conditions __________________________________________________________________ 72 8.6 Integration studies _________________________________________________________________ 74 8.7 Potential developments _____________________________________________________________ 74 8.8 Lessons for other jurisdictions ________________________________________________________ 75
9 Spain 76
9.1 Introduction _______________________________________________________________________ 76 9.2 Context __________________________________________________________________________ 76 9.3 Challenges _______________________________________________________________________ 77 9.4 Integration timeline _________________________________________________________________ 78 9.5 Frame conditions __________________________________________________________________ 80 9.6 Lessons for other jurisdictions ________________________________________________________ 82
10 Hokkaido 83
10.1 Introduction _______________________________________________________________________ 83 10.2 Context __________________________________________________________________________ 83

326641/TRD/EFR/5/e January 2015 Vol II: Case studies
Integration of Variable Renewable Energy Volume II: Case studies
10.3 Challenges _______________________________________________________________________ 85 10.4 Integration timeline _________________________________________________________________ 86 10.5 Frame conditions __________________________________________________________________ 87
Figures
Figure 1.1: World map of jurisdictions in the study ___________________________________________________ 2 Figure 2.1: Installed capacity in Alberta ___________________________________________________________ 7 Figure 2.2: Alberta wind speed distribution (left) + Geographical deployment (right) _________________________ 8 Figure 2.3: Average pool price captured by northern and southern wind farm ______________________________ 9 Figure 2.4: AESO perception of the challenges _____________________________________________________ 9 Figure 2.5: Alberta integration timeline ___________________________________________________________ 11 Figure 2.6: Alberta frame conditions _____________________________________________________________ 13 Figure 3.1: ERCOT Installed capacity as a percentage of peak demand _________________________________ 16 Figure 3.2: ERCOT wind capacity development ____________________________________________________ 17 Figure 3.3: Geographical distribution of wind farms in ERCOT ________________________________________ 18 Figure 3.4: ERCOT perception of challenge _______________________________________________________ 19 Figure 3.5: ERCOT – Integration timeline _________________________________________________________ 20 Figure 3.6: Annual operating cost savings ($million) due to implementation of state of the art forecasting _______ 21 Figure 3.7: Impact of ERCOTs dispatch reforms on regulation requirement ______________________________ 22 Figure 3.8: ERCOT Frame conditions. ___________________________________________________________ 24 Figure 3.9: ERCOT current ancillary services _____________________________________________________ 26 Figure 3.10: ERCOT proposed ancillary services ____________________________________________________ 26 Figure 4.1: Installed capacity as percentage of peak demand _________________________________________ 28 Figure 4.2: Wind distribution ___________________________________________________________________ 29 Figure 4.3: Over supply before VRE dispatch introduced _____________________________________________ 30 Figure 4.4: Ontario timeline of integration measures ________________________________________________ 31 Figure 4.5: Oversupply after VRE dispatch introduced _______________________________________________ 32 Figure 4.6: Ontario frame conditions. ____________________________________________________________ 34 Figure 5.1: Denmark installed capacity as a percentage of peak demand ________________________________ 36 Figure 5.2: Denmark interconnection ____________________________________________________________ 37 Figure 5.3: Energinet.DK perception of the challenges ______________________________________________ 38 Figure 5.4: Denmark integration timeline _________________________________________________________ 39 Figure 5.5: Denmark wind generation and imports in January 2014_____________________________________ 40 Figure 5.6: Denmark frame conditions ___________________________________________________________ 43 Figure 5.7: High Wind Ride Through control provide more stability to grid ________________________________ 44 Figure 6.1: Germany TSOs ___________________________________________________________________ 46 Figure 6.2: Germany installed capacity __________________________________________________________ 47 Figure 6.3: 50Hertz perception of the challenges ___________________________________________________ 48 Figure 6.4: Germany summer generation profile in 2013 _____________________________________________ 49 Figure 6.5: Integration timeline _________________________________________________________________ 50 Figure 6.6: Use of secondary and tertiary reserves before and after TSO collaboration _____________________ 51 Figure 6.7: Priority grid development in the Grid Expansion Law _______________________________________ 52 Figure 6.8: Germany frame conditions ___________________________________________________________ 55 Figure 7.1: Installed capacity in GB as a percentage of peak demand (57 GW) ___________________________ 57 Figure 7.2: UK Wind farm distribution as of December 2012 __________________________________________ 58 Figure 7.3: National Grid’s perception of the challenges _____________________________________________ 59 Figure 7.4: GB Integration timeline ______________________________________________________________ 60 Figure 7.5: GB frame conditions ________________________________________________________________ 63 Figure 8.1: Installed capacity of the All Island system _______________________________________________ 67 Figure 8.2: All Island installed wind capacity (MW) __________________________________________________ 68 Figure 8.3: Ireland wind farms above 10MW (approximately 80 percent of capacity) as of 2013 (Republic of Ireland
only) ____________________________________________________________________________ 69
326641/TRD/EFR/5/e January 2015 Vol II: Case studies
Integration of Variable Renewable Energy Volume II: Case studies
Figure 8.4: EirGrid perception of the challenges____________________________________________________ 70 Figure 8.5: Ireland integration timeline ___________________________________________________________ 71 Figure 8.6: Ireland frame conditions. ____________________________________________________________ 73 Figure 9.1: Spain installed capacity as a percentage of peak demand ___________________________________ 76 Figure 9.2: Spain – distribution of wind and solar capacity ____________________________________________ 77 Figure 9.3: REE perception of the challenges _____________________________________________________ 78 Figure 9.4: Spain integration timeline ____________________________________________________________ 79 Figure 9.5: Spain frame conditions. _____________________________________________________________ 82 Figure 10.1: Japan Electricity Service Areas _______________________________________________________ 83 Figure 10.2: Hokkaido installed capacity as a percentage of peak demand (5.7GW)_________________________ 84 Figure 10.3: Wind and solar distribution as of March 2013 _____________________________________________ 85 Figure 10.4: HEPCO’s perception of the challenges _________________________________________________ 86 Figure 10.5: Integration timeline _________________________________________________________________ 87
Tables
Table 2.1: Key characteristics of the case study jurisdictions __________________________________________ 5 Table 2.1: Alberta ancillary services ____________________________________________________________ 13 Table 3.1: ERCOT ancillary services ____________________________________________________________ 23 Table 4.1: Ontario ancillary services ____________________________________________________________ 33 Table 5.1: Denmark ancillary services ___________________________________________________________ 42 Table 6.1: Germany ancillary services __________________________________________________________ 54 Table 7.1: National Grid wind forecast error targets ________________________________________________ 61 Table 7.2: Main GB balancing services __________________________________________________________ 62 Table 8.1: Ireland ancillary services ____________________________________________________________ 72 Table 9.1: Spanish ancillary services ___________________________________________________________ 81

i 326641/TRD/EFR/5/e January 2015 Vol II: Case studies
Integration of Variable Renewable Energy Volume II: Case studies
The authors would like to extend their gratitude to the members of the RE-Integration
Project Steering Group: Michael Paunescu (Natural Resources Canada), Darcy Blais
(Natural resources Canada), Yoko Ito (Institute of Energy Economics Japan), Akihiro
Iwata (New Energy and Industrial Technology Development Organization), Yasuyuki
Kowata (New Energy and Industrial Technology Development Organization), Simon
Mueller (International Energy Agency) and Sascha van Rooijen (Operating Agent IEA-
RETD).
The completion of this report would not have been possible without the support and
efforts of the survey respondents, interviewees and external reviewers. Those that have
provided information have been very cooperative and have given valuable insight into a
number of technical / policy matters.
This report relies upon information received through a survey and interviews, and whilst
we have made efforts to verify the information with the source we cannot guarantee the
accuracy of the information presented.
Acknowledgements and Disclaimer

ii 326641/TRD/EFR/5/e January 2015 Vol II: Case studies
Integration of Variable Renewable Energy Volume II: Case studies
List of Acronyms
AC Alternating Current
AER Alternative Energy Requirement
AESO Alberta Electricity System Operator
AIES Alberta Interconnected Electricity System
ATC Available Transfer Capacity
BALIT Balancing Inter TSO
BSIS Balancing Services Incentive Schemes
CAISO California Independent System Operator
CCGT Combined Cycle Gas Turbine
CCGT Combined Cycle Gas Turbine
CECRE Centralised Control Centre of Renewable Energy
CfD Contracts for Difference
CHP Combined Heat and Power
CREZ Competitive Renewable Energy Zones
CSP Concentrating Solar Power
CWE Central West Europe
DA Day Ahead
DC Direct Current
DECC Department of Energy and Climate Change
DER Distributed Energy Resources
DLR Dynamic Line Rating
DNO Distribution Network Operators
DSBR Demand Side Balancing Reserve
DSO Distribution System Operators
DSR Demand Side Response
EEX European Energy Exchange
EMCC European Market Coupling Company
EMR Electricity Market Reform
ENTSO-E European Network of Transmission System Operators for Electricity
ERCOT Electricity Reliability Council of Texas
FACTS Flexible Alternating Current Transmission System
FFR Fast Frequency Response
FFRS Fast Frequency Reserve Service
FiP Feed in Premium
FiT Feed in Tariff
FRT Fault Ride Through
GB Great Britain
GCC Grid Control Cooperation
GW Giga Watt
HEPCO Hokkaido Electric Power Company
HRUC Hourly Reliability Unit Commitment
HVAC High Voltage Alternating Current
HVDC High Voltage Direct Current
HWRT High Wind Ride Through
HWSD High Wind Shut Down
IGCC International Grid Control Cooperation
IR Inertial Response
ISO Independent System Operator
ITVC Interim Tight Volume Coupling

iii 326641/TRD/EFR/5/e January 2015 Vol II: Case studies
Integration of Variable Renewable Energy Volume II: Case studies
LFC Load Frequency Reserve
LMP Locational Marginal Pricing
LRAS Large Ramp Alert System
LTEP Long Term Energy Plan
MAE Mean Absolute Error
MW Mega Watt
MWh Mega Watt hour
NERC North American Electric Reliability Corporation
NG National Grid
NPCC Northeast Power Coordinating Council
NWE North West Europe
OIESO Ontario Independent Electricity System Operator
PFR Primary Frequency Response
PTC Production Tax Credit
PUCT Public Utility Commission of Texas
PV Photo Voltaic
REE Red Electrica de Espana
REFIT Renewable Energy Feed In Tariff
RfP Request for Proposal
RO Renewables Obligation
RoCoF Rate of Change of Frequency
RPS Renewable Portfolio Standard
RRS Responsive Reserve Service
RRSG Responsive Reserve Service from Generation
RRSL Responsive Reserve Service from Load
RS Regulation Service
SBR Supplemental Balancing Reserve
SCED Security Constrained Economic Dispatch
SEM Single Electricity Market
SEMO Single Electricity Market Operator
SIR System Inertial Response
SIR Synchronous Inertial Response
SNSP System Non Synchronous Penetration
SO System Operator
SONI System Operator of Northern Ireland
SRMC Short Run Marginal Cost
SWPL System Wind Power Limit
TNUoS Transmission Network Use of System
ToU Time of Use
TSO Transmission System Operator
UMIS Uplift Management Scheme
VRE Variable Renewable Energy
WECC Western Electricity Coordinating Council
WEPROG Weather and Energy Prognoses
WPRM Wind Power Ramp Management
WSAT Wind Security Assessment Tool
WTR Wind Technical Rule

Integration of Variable Renewable Energy Volume II: Case studies
326641/TRD/EFR/5/e January 2015 Volume II: Case studies
1
In 2013, Mott MacDonald was commissioned to undertake a research project for the IEA Renewable
Energy Technology Development into the integration of Variable Renewable Energy (VRE).
The overall objective of the research was to understand how the context of each jurisdiction influences the
measures implemented to integrate VRE and the effectiveness of these measures. The study investigates
the context, challenges and integration measures in a number of different jurisdictions throughout North
America, Western Europe and Japan. The lessons learnt from this study are built around a case study
approach based on desktop research, questionnaires and interviews with system operators and policy
makers. This report (Volume II – Case Studies) sets out some of the detailed information collected, our
analysis and conclusions. The background, approach and key findings are outlined in Volume I – Main
Report.
1.1 Scope of the report
Our three main research questions are:
1. What are typical country specific factors that determine the choice of integration measures?
2. Different countries may have different preferences in terms of integration. Based on case studies, what
can be concluded about which options are applicable and effective in which context?
3. What general lessons might be drawn by countries with similar underlying characteristics?
We have aimed to address these questions through the analysis of the case studies outlined in detail in
this report, with background approach and findings summarised in Volume I – Main Report.
1.2 Jurisdictions
The jurisdictions for this study have been agreed jointly between the IEA-RETD and Mott MacDonald. They
have been selected to give a broad cross-section of jurisdictions which have different contextual
characteristics, levels of VRE penetration and as a result have implemented a range of policies to address
VRE integration.
1 Introduction
Integration of Variable Renewable Energy Volume II: Case studies
326641/TRD/EFR/5/e January 2015 Volume II: Case studies
2
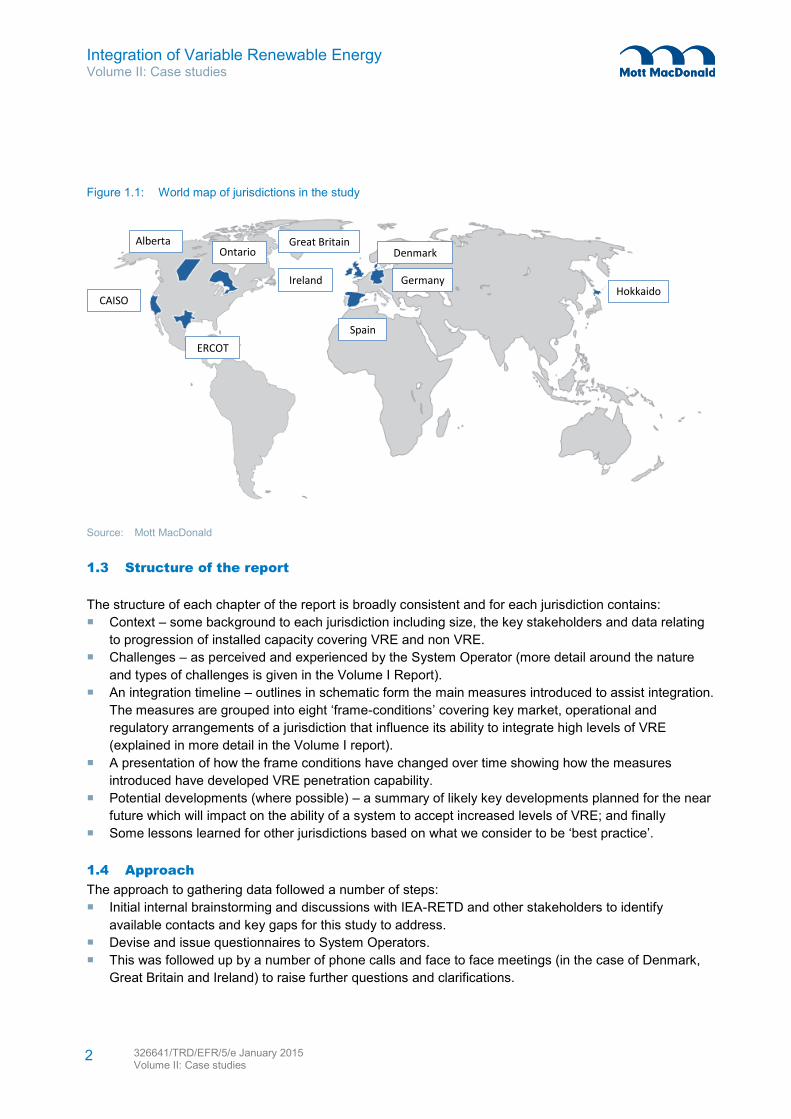
Figure 1.1: World map of jurisdictions in the study
Source: Mott MacDonald
1.3 Structure of the report
The structure of each chapter of the report is broadly consistent and for each jurisdiction contains:
Context – some background to each jurisdiction including size, the key stakeholders and data relating
to progression of installed capacity covering VRE and non VRE.
Challenges – as perceived and experienced by the System Operator (more detail around the nature
and types of challenges is given in the Volume I Report).
An integration timeline – outlines in schematic form the main measures introduced to assist integration.
The measures are grouped into eight ‘frame-conditions’ covering key market, operational and
regulatory arrangements of a jurisdiction that influence its ability to integrate high levels of VRE
(explained in more detail in the Volume I report).
A presentation of how the frame conditions have changed over time showing how the measures
introduced have developed VRE penetration capability.
Potential developments (where possible) – a summary of likely key developments planned for the near
future which will impact on the ability of a system to accept increased levels of VRE; and finally
Some lessons learned for other jurisdictions based on what we consider to be ‘best practice’.
1.4 Approach
The approach to gathering data followed a number of steps:
Initial internal brainstorming and discussions with IEA-RETD and other stakeholders to identify
available contacts and key gaps for this study to address.
Devise and issue questionnaires to System Operators.
This was followed up by a number of phone calls and face to face meetings (in the case of Denmark,
Great Britain and Ireland) to raise further questions and clarifications.
Ontario
CAISO
Alberta
ERCOT
Ireland
Great Britain
Spain
Denmark
GermanyHokkaido
AlbertaOntario

Integration of Variable Renewable Energy Volume II: Case studies
326641/TRD/EFR/5/e January 2015 Volume II: Case studies
3
1.5 Data Quality
The availability and quality of data varied significantly from jurisdiction. In some cases despite some good
contacts provided by IEA-RETD and others:-
The designated people were unable / unwilling to commit time to this study
The data received was incomplete as in some cases not one person in an organisation had all the
required information.
The data has been difficult to extract and has taken a number of iterations and extended time and cost
to source.
It was evident from the start of the study that data quality would be key to determining the reliability and
robustness of conclusions drawn. In many cases, the data has been good and comprehensive but for other
jurisdictions it has not been the case. Where the data quality has been less good we have noted this in our
report. Areas where data was less good centred on a difficulty in being able to disaggregate the impact of
an individual policy due to the complexity of the external environment – this has been the case across all of
the case studies. One particular example was in relation to trying to quantify the benefits of a particular
measure or group of measures, which System Operators generally felt was not possible given the available
information to them.

Integration of Variable Renewable Energy Volume II: Case studies
326641/TRD/EFR/5/e January 2015 Volume II: Case studies
4
2.1 North American regions
Alberta: AESO operates the power system for the Canadian province of Alberta. While the geographical
size of the system is comparable to the others, such as ERCOT and CAISO, its peak demand is much
smaller, at about 11 GW1. Alberta has no targets for renewables, but wind capacity has reached about 10
percent of peak demand (1.1 GW). Alberta is part of the Western Electricity Coordinating Council (WECC)
synchronous area, one of the two major synchronous areas in North America, with a peak demand in 2012
of 151 GW (WECC 2013).
CAISO: is the Independent System Operator for the majority of California. The state’s Renewable Portfolio
Standard (RPS) sets the target 33 percent share renewables in electricity by 2020 through both wind and
solar. CAISO is a mid-sized jurisdiction (relative to other systems in the study), with a peak demand of 50
GW. There is currently about 5 GW of wind and 2 GW of solar installed. CAISO is part of the WECC
synchronous area.
ERCOT: operates the power system which covers about 80 percent of demand in Texas. The state has
already surpassed its RPS target of achieving 10 GW of wind (with about 11 GW to date) and has a target
to achieve 500 MW from non-wind renewables. It is a mid-sized system, with peak demand of 68 GW, and
relatively isolated power system, its five DC ties represent about 2 percent of peak demand, and
synchronously independent.
Ontario: OIESO is the operator for Ontario power system, which is the largest geographically of the
jurisdictions in the study, but a relatively low peak demand of 27 GW. Ontario is well connected to the
power system in the North East of the USA – interconnection capacity is at 19 percent of peak demand.
There is currently 1.8 GW of installed wind capacity (about 7 percent of peak demand), with a target of
10.7 GW (40 percent of current peak) by 2020. Ontario is part of the Quebec interconnection.
2.2 European regions
Denmark: has the highest penetration of wind of any jurisdiction in the world – installed wind capacity is 73
percent of peak demand (4.4 GW of wind, 6.1 GW peak demand). The power system in Denmark is
operated by Energinet.DK and is highly interconnected with Scandinavia and continental Europe. Denmark
is unique in the case studies in that West Denmark is part of the main European synchronous power
system, and East Denmark is part of the Nordic synchronous system.
Germany: has four different balancing areas, each with its own transmission system operator, but these
collaborate on a number of operational aspects: 50Hertz Transmission, TenneT TSO, Ampiron and
Transnet BW. Germany is considered a world leader in VRE with 34 GW of wind and 37 GW of solar PV in
2014, compared to peak demand of 81.7 GW. Germany is part of the main European synchronous system.
1 Sources for capacity figures provided in relevant case study chapters
2 Case Study Regions

Integration of Variable Renewable Energy Volume II: Case studies
326641/TRD/EFR/5/e January 2015 Volume II: Case studies
5
Great Britain: the power system for England, Scotland and Wales is operated by National Grid. It has a
target to achieve about 30 percent annual electricity consumption of renewables by 2020, much of this is
expected to come from wind. Currently, there is approximately 10 GW of wind and almost 2 GW of solar
installed in GB (by March 2013), compared to peak demand of 57 GW. Great Britain is synchronously
independent.
Island of Ireland: the power grid for both the Republic of Ireland and Northern Ireland is operated by
EirGrid and the System Operator of Northern Ireland (SONI) respectively (SONI is owned by EirGrid) and
can be considered as one jurisdiction for our purposes. Being a small island with already a large proportion
of wind power on the system (installed capacity is 2.5 GW compared to a peak demand of 6.9 GW),
EirGrid is dealing with challenges that are not currently felt in other jurisdictions. The island of Ireland is a
synchronously independent system.
Spain: has a significant amount of generation from VRE sources, both wind and solar, with installed
capacities on the Spanish peninsular in 2014 of 23 GW of wind and 6.7 GW of solar (4.4 GW of PV, 2.3
GW of CSP). This represents about 73 percent of peak demand (which was 40GW in 2013). Spain is part
of the main European synchronous system.
2.3 Hokkaido
Hokkaido is a small island in the North-East of Japan that has relatively limited amount of interconnection.
The system operator for the island is the vertically integrated utility HEPCO. There is 316 MW of wind and
354 MW of solar PV installed with a further 700 MW of solar PV and 400 MW of wind allocated to the grid,
compared to a peak demand of 5.7 GW. Hokkaido is a synchronously independent system.
2.4 Characteristics of Jurisdictions
In Volume I: Main report we explain how we have categorised the various jurisdictions by looking at four
different dimensions (see Table 2.1). The summary table from Volume I is replicated here for ease of
reference.
Table 2.1: Key characteristics of the case study jurisdictions
country VRE portfolio
Geographical distribution of VRE
Interconnection
Generation and storage
flexibility
Alberta
California
ERCOT
(2 percent of peak demand)
Ontario
Denmark*

Integration of Variable Renewable Energy Volume II: Case studies
326641/TRD/EFR/5/e January 2015 Volume II: Case studies
6
country VRE portfolio
Geographical distribution of VRE
Interconnection
Generation and storage
flexibility
Germany
Great Britain
(8 percent of peak demand)
Ireland
(11 percent of peak demand)
Spain
Hokkaido
(10 percent of peak demand)
Source: Respective sources detailed in the case studies and Mott MacDonald
High wind and solar
High wind
Mid VRE penetration
Low VRE penetration
Strongly interconnected
Weakly interconnected
Synchronously Independent
High flexibility
Low flexibility
Well distributed
Mostly distributed
High concentration in few areas
Mostly in one area
Mid flexibility

Integration of Variable Renewable Energy Volume II: Case studies
326641/TRD/EFR/5/e January 2015 Volume II: Case studies
7
3.1 Introduction
This chapter of the Volume II Case Studies report presents the case study for Alberta. The information
gathered was based on:
questionnaire information received.
telephone interview and subsequent email exchange with Alberta Energy (energy ministry of the
government of Alberta).
3.2 Context
The Alberta Interconnected Electricity System (AIES) is operated by the Alberta Electricity System
Operator (AESO), a non-profit body that also administers the wholesale electricity market.
Power system
The power generation capacity in Alberta is dominated by gas (55 percent of peak demand) and coal (54
percent of peak demand) – see Figure 3.1. Peak demand in Alberta is 11 GW. Interconnection is relatively
low at 8 percent of peak demand.
Figure 3.1: Installed capacity in Alberta
Source: AESO2 and Mott MacDonald
2 Figures from - http://www.energy.alberta.ca/Electricity/682.asp - accessed August 2014, quoted as November 2013
0% 20% 40% 60% 80% 100% 120% 140% 160%
Dispatchable
Variable
Capacity as percent of peak demand (11 GW)
Wind Gas Hydro Coal Interconnection Other
3 Alberta

Integration of Variable Renewable Energy Volume II: Case studies
326641/TRD/EFR/5/e January 2015 Volume II: Case studies
8
Variable Renewable Energy
The federal government wind incentive, worth 1ct/kWh, ended in 2011. Alberta currently has no direct
subsidy (such as FiT or RPS) for renewable energy (the only indirect benefit to wind is a small carbon price
paid by emitters), and so renewables deployment is on the basis of the revenues that can be received
through the wholesale market, though projects commissioned before 2011 will still receive the federal
government incentive. Considering this, Alberta has a significant amount of wind capacity installed already,
at about 1,100 MW (10 percent of peak demand). There is also an estimated 4.03 MW of solar PV on the
system, installed on the basis of net billing.
Wind resource in Alberta is strongest in the far south of the province (see Figure 3.2), which has led to the
majority of wind deployment in this area. However, the wind profile north of the high wind region is more
positively correlated with demand3 and so can achieve higher average electricity price (see Figure 3.3).
This has led to more recent deployment of wind farms and planned developments in more northerly
regions (see Figure 3.2), since the wind generators are fully exposed to the pool price. This increasingly
disperse portfolio should be less costly to integrate than if the capacity was located in a confined area.
Figure 3.2: Alberta wind speed distribution (left) + Geographical deployment (right)
Source: Environment Canada, Alberta Environment and the US Climate Data Centre (left hand map); Albert Energy and Mott
MacDonald (right hand map)
3 Most of demand (about 80 percent) in Alberta is industrial, so demand peaks in the day and drops in the evening – which is opposite to the wind generation profile in the south of the province
OPERATING
APPROVED
PLANNED

Integration of Variable Renewable Energy Volume II: Case studies
326641/TRD/EFR/5/e January 2015 Volume II: Case studies
9
Key message: while the strongest resource in in the far south, deployment is beginning to spread north,
partly due to the fact that northern farms can capture better average pool prices. Great geographical
diversity should help to minimise integration challenges and cost.
Figure 3.3: Average pool price captured by northern and southern wind farm
Source: EDC Associates
Key message: northern wind farms (defined by EDC Associates as Ghost Pine, Wintering Hills and Halkirk)
capture a higher average pool price than southern wind farms because the generation portfolio is more
positively correlated with demand. It is likely that this effect will encourage a more geographically diverse
wind portfolio.
3.3 Challenges
We asked Alberta Energy and AESO to rate the severity six discrete integration challenges (on a scale of 1
to 5, with 5 being most severe), and the ratings given are based on the response from AESO and agreed
upon through consultation with Alberta Energy. The challenges we define are detailed in Volume I: Main
Report. Figure 3.4 presents Alberta Energy’s perception of the severity of the challenges.
Figure 3.4: AESO perception of the challenges
Source: Mott MacDonald
0
1
2
3
4
5Inertia
Reactive power
Transientstability
Congestion
Ramping
Supplyadequacy

Integration of Variable Renewable Energy Volume II: Case studies
326641/TRD/EFR/5/e January 2015 Volume II: Case studies
10
Ramping is one of the key challenges perceived in Alberta (see Figure 3.4). AESO performed analysis of
wind ramp events in 2011, finding that extreme ramp events4 occur with a frequency of about once per
week. In further analysis of a period between December 2011 and April 2013, this increased to three times
per week. In order to deal with the increasing ramp rate requirements, AESO is dispatching the electricity
market to make sure the generation can deal with the ramping need, which can increase short term price
volatility – and introduced a wind ramp limit (see below). For these reasons, AESO is considering the
implementation of a new ancillary service product to provide ramp capabilities, discussed further in section
3.6. Congestion is also an issue, as the VRE generation has mostly been deployed in on specific area.
3.4 Integration timeline
Alberta has implemented a number of key policies in the electricity market that have had an effect on the
integration of VRE (see Figure 3.5).
4 Defined by AESO as ramps at least 100 MW (about 10 percent of wind capacity or 1 percent of peak demand) over a ten minute period

Integration of Variable Renewable Energy Volume II: Case studies
326641/TRD/EFR/5/e January 2015 Volume II: Case studies
11
Figure 3.5: Alberta integration timeline
Source: Mott MacDonald
AESO established – 2003: Alberta established the AESO to facilitate the market and operate the transmission system.
Wind grid code – 2004: grid codes developed in 2004 include Fault Ride Through and requirements for
reactive power support.
Centralised forecasting – 2010: Centralised forecasting was implemented in January 2010, and is
delivered by Weather and Energy PROGnoses (WEPROG), an independent forecaster. Initially, long term
forecasts (day ahead to 7 days) were provided and short term forecasts (0 to 12 hours) were added later.
AESO established – Alberta
Electricity System Operator established along with spot market
Wind grid code – grid code for wind established
including Low-Voltage-Ride-Through and voltage regulation and reactive power requirements.
Centralised forecasting – AESO contracted WEPROG
to provide centralized forecasting of wind power.
2003
2004
2010
Wind phase II – Recommendations to
increase wind capacity beyond 1500 MW. 2014
Wind cap removed – AESO removes previous
900MW cap due to stakeholder consultation and integration studies.
2007
Wind grid code – Additional requirements added to the
2004 code including voltage, frequency, reactive power and obligations for ramp rates and meteorological data.
2011
WPRM – Wind Power Ramp Up Management allows
AESO to temporarily limit production when the system cannot accommodate.
$Dispatch sophistication
System services market
Regulator incentives on SO
Grid representation
Use of forecasting
Interconnector management and market integration
Grid code
VRE incentives and dispatch
Wind dispatch – Pilot project for wind
dispatch.

Integration of Variable Renewable Energy Volume II: Case studies
326641/TRD/EFR/5/e January 2015 Volume II: Case studies
12
Wind grid code – 2011: further developments of grid code (specified as the Wind Technical Rule or WTR)
including frequency response and ramp rate limits. The WTR also requires wind farms to provide real-time
meteorological information at 10 minute intervals.
WPRM – 2011: Wind Power Ramp Management (WPRM) is currently employed by AESO to deal with
large fast wind ramps. When wind ramps are expected to reach a level at which the power system cannot
accommodate securely, AESO gives instructions to wind farms to limit their ramp rate. AESO calculates a
System Wind Power Limit (SWPL) every 20 minutes based on the power systems ability to deal with
potential ramps on the system. If wind generation gets to within 90 percent or 65 MW of the SWPL, AESO
issues instruction to wind generators to limit production. Currently six wind farms (totalling 309 MW) are
exempt because they do not have the ability to control output. AESO considers this tool to be a last resort
and is looking for market based solutions in wind phase II.
Wind phase II – 2012: AESO considers that it has now entered a new phase of wind development in
Alberta. In the Wind Integration Phase II recommendations paper, AESO recommends that wind farms
should be required to dispatch in the electricity market (see below), and a new ancillary service for ramping
should be investigated.
Wind dispatch pilot project – 2012: in 2012, AESO piloted wind dispatch in the electricity pool. Currently,
wind generators do not offer energy in to the market. The pilot sought to test wind dispatch in the market.
The pilot involved an aggregate of two wind facilities with a combined capacity of 134 MW for six months.
AESO found that having wind offer energy into market improved the visibility of wind to the system
controller and created an incentive for wind operators to improve the accuracy of their forecasting. AESO is
now considering ways to expand the pilot.
3.5 Frame conditions
The frame conditions, as defined in Volume I: Main Report, are key market, operational and regulatory
conditions of a power system that influence the ability of the power system to integrate high levels of VRE
now and in the future.
Dispatch sophistication: The AESO runs an energy only intraday market with gate closure of two hours
before operation, and the SO dispatches on a five minute basis. Prices are capped at $1000/MWh and
negative price bids are not allowed. There is a significant amount of demand side participation in the
market (approximately 350 MW), owing to the fact that the majority (~80 percent) of demand is industrial.
Incentives on VRE: There is now no direct subsidy for VRE development in Alberta and so new capacity is
deployed purely on the basis of the revenue that can be achieved through the energy market. VRE is not
exposed to imbalance risk (it is currently a price taker and does not offer energy into the market) and
receives no compensation in the event of curtailment. Wind dispatch is currently being piloted.
Use of forecasting: AESO uses centralised a forecasting system that integrates 75 individual forecasts.
AESO uses day ahead wind forecasts to project the need for operating reserves and procurement, and for
real time dispatch of the electricity market. AESO also uses short term forecasting to inform WPRM to
assess whether wind farm generation needs to be limited to reduce the impact of large ramps.
System services market: Operating reserve is procured over a day ahead trading platform by AESO.

Integration of Variable Renewable Energy Volume II: Case studies
326641/TRD/EFR/5/e January 2015 Volume II: Case studies
13
Table 3.1: Alberta ancillary services
Service Description Price determined
Regulating reserve Used to instantaneously provide the power difference between supply and demand (balancing)
Remuneration
Spinning reserve Reserve that is synchronised to the grid but not necessarily providing power, allowing the generator to provide very fast response and frequency
response. Used in case of an unexpected event
Marginal
Supplemental reserve Reserve that is brought online from cold to replace spinning reserve after an event
Marginal
Source: AESO and Mott MacDonald
Grid representation: One single market zone is used for the wholesale energy market (as opposed to zonal
or nodal representation of grid constraints). The grid operator may need to re-dispatch in the case that
initial schedule of dispatch does not satisfy grid constraints.
Interconnector management: Alberta has a very limited level of interconnection, though the interconnectors
can be used for balancing.
Regulator incentives on the SO: AESO faces no explicit performance incentive. Its allowable income is
negotiated on an annual basis.
VRE grid code: Fault Ride Through reactive power and frequency response – established in 2004,
developed in 2011.
Figure 3.6 shows as a simple schematic our view of how the key frame conditions have developed over
time as a result of the measures introduced, shown through our timeline. The ratings are a subjective view
and are meant to show the development of the measures.
Figure 3.6: Alberta frame conditions
Source: Mott MacDonald
0
1
2
3
4
5
Dispatchsophisticationand maturity
VRE incentivesand dispatch
Use offorecasting
System servicesmarket
Gridrepresentation
Interconnectormanagement
Regulatorincentives on
SO
Grid code
Chart Title
Start year Now

Integration of Variable Renewable Energy Volume II: Case studies
326641/TRD/EFR/5/e January 2015 Volume II: Case studies
14
Key message: Alberta has developed in a number of key areas of the assessment period including grid
code (with the implementation of the Wind Technical Rule), VRE incentives (with the cancellation of the
production tax credit and piloting wind dispatch) and forecasting (with the implementation of centralised
forecasting).
3.6 Potential developments
New ramping service
AESO is investigating the potential for a new ancillary service which would provide ramping capabilities. In
the wind integration recommendations paper, AESO outlines a possible ramping product. The service
would be designed to be used for short periods when the required ramp rate is higher than the capability
that the market would provide. Participants would need to provide a ramp rate threshold and would be paid
a premium for the ramp rate dispatches as well as the energy price at time of generation. The service
would be split in two: an up-ramping service and a down-ramping service.
Energy storage integration
There is a negligible amount of storage currently connected to the Alberta power system, but there is
interest: as of March 2014, four storage facilities submitted system access service requests to AESO (two
batteries, one compressed air energy storage and one pumped hydro). AESO is currently consulting on
plans for energy storage integration and is due to make recommendations in Q4 of 2014. The
recommendations will be on the three priority issues of: technical and operational requirements for
connection; appropriate tariff rates; and technical requirements for operating reserves.
3.7 Lessons for other jurisdictions
Alberta provides an interesting example of a jurisdiction that currently has very little direct support for new
developments (the Canadian government incentive scheme ended in 2011), but where the capacity of VRE
is already significant (at 10 percent of peak demand) and growing. The exposure of wind generation to
time of generation pricing is likely to be influencing developers’ decisions, and there is evidence to suggest
that this is promoting greater geographical diversity. This diversity will not only improve the wind generation
portfolio’s correlation to demand, but also reduce forecast errors as forecasting is aggregated over wider
areas. Ramp effects may also lessen as weather fronts will hit the generation capacity at different times.
Using market exposure as a tool to promote geographical diversity is mostly applicable to large
jurisdictions, but has some applicability to all regions.

Integration of Variable Renewable Energy Volume II: Case studies
326641/TRD/EFR/5/e January 2015 Volume II: Case studies
15
4.1 Introduction
This chapter of the Volume II Case Studies report presents the case study for Texas. The information
gathered was based on:
questionnaire information received
subsequent email and telephone exchange with ERCOT
Our thanks in particular are extended to [name to be provided after confirmation] for their assistance in
compiling this information.
4.2 Context
The majority of Texas (about 80 percent of electric load) is in the Electricity Reliability Council of Texas
(ERCOT), an Independent System Operator (ISO)5. ERCOT owns and operates the transmission system
and operates the day ahead, intraday and real time electricity markets.
Power system
ERCOT is a mid-sized electricity jurisdiction (Texas has a land area of 268,581 km2), with a peak summer
demand of 68 GW and annual consumption of 335 TWh. The non-VRE generation capacity available to in
ERCOT is 71 GW, about 60 percent of which is gas plant6. Interconnection capacity, of 1.3 GW, between
ERCOT and the other electric grids is by DC line; therefore it is a synchronously isolated power system.
ERCOT has no pumped storage, but has 35 MW battery storage.
Figure 4.1 shows the capacity of the power plants and interconnection available to ERCOT, as a
percentage of peak demand (68 GW), separated into ‘Dispatchable’ and ‘Variable’. ‘Non-ERCOT’ refers to
power plants that are outside of the ERCOT system, but can be dispatched by ERCOT – most of these are
gas fired plants.
5 The remaining 15 percent is covered by the Southwest Power Pool (SPP), South-eastern Electric Reliability Council (SERC) and the Western Electric Coordinating Council (WECC).
6 All ERCOT capacity figures from ERCOT’s “2014 Report on the Cpacity, Demand, and Reserves in the ERCOT Region”, Summer, summary
4 ERCOT
Integration of Variable Renewable Energy Volume II: Case studies
326641/TRD/EFR/5/e January 2015 Volume II: Case studies
16
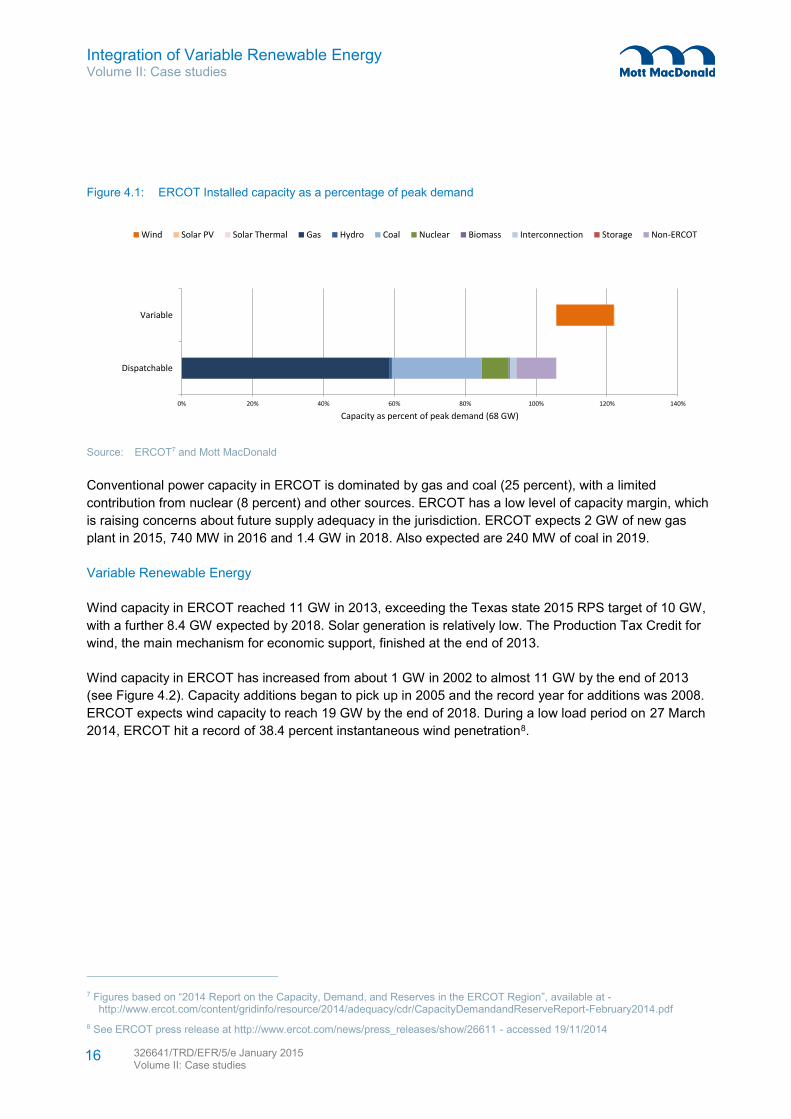
Figure 4.1: ERCOT Installed capacity as a percentage of peak demand
Source: ERCOT7 and Mott MacDonald
Conventional power capacity in ERCOT is dominated by gas and coal (25 percent), with a limited
contribution from nuclear (8 percent) and other sources. ERCOT has a low level of capacity margin, which
is raising concerns about future supply adequacy in the jurisdiction. ERCOT expects 2 GW of new gas
plant in 2015, 740 MW in 2016 and 1.4 GW in 2018. Also expected are 240 MW of coal in 2019.
Variable Renewable Energy
Wind capacity in ERCOT reached 11 GW in 2013, exceeding the Texas state 2015 RPS target of 10 GW,
with a further 8.4 GW expected by 2018. Solar generation is relatively low. The Production Tax Credit for
wind, the main mechanism for economic support, finished at the end of 2013.
Wind capacity in ERCOT has increased from about 1 GW in 2002 to almost 11 GW by the end of 2013
(see Figure 4.2). Capacity additions began to pick up in 2005 and the record year for additions was 2008.
ERCOT expects wind capacity to reach 19 GW by the end of 2018. During a low load period on 27 March
2014, ERCOT hit a record of 38.4 percent instantaneous wind penetration8.
7 Figures based on “2014 Report on the Capacity, Demand, and Reserves in the ERCOT Region”, available at - http://www.ercot.com/content/gridinfo/resource/2014/adequacy/cdr/CapacityDemandandReserveReport-February2014.pdf
8 See ERCOT press release at http://www.ercot.com/news/press_releases/show/26611 - accessed 19/11/2014
0% 20% 40% 60% 80% 100% 120% 140%
Dispatchable
Variable
Capacity as percent of peak demand (68 GW)
Wind Solar PV Solar Thermal Gas Hydro Coal Nuclear Biomass Interconnection Storage Non-ERCOT

Integration of Variable Renewable Energy Volume II: Case studies
326641/TRD/EFR/5/e January 2015 Volume II: Case studies
17
Figure 4.2: ERCOT wind capacity development
Source: ERCOT and Mott MacDonald
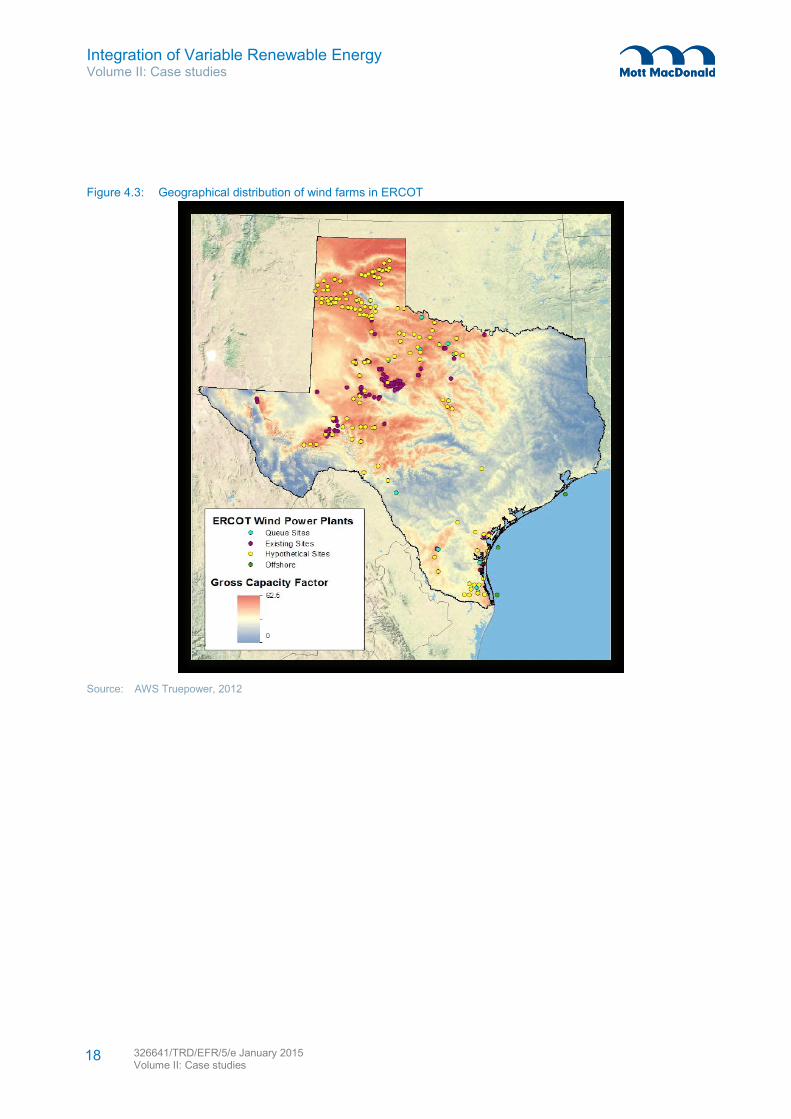
The wind resource is highest in the North and West (see Figure 4.3) and the majority of installed capacity
is clustered in a relatively small area. However, the geographical distribution of wind generation in ERCOT
is increasing – most of the planned development is in the Panhandle region (far north), but also in the west
and south.
0
5
10
15
20
20
02
200
3
20
04
20
05
20
06
20
07
200
8
20
09
20
10
20
11
20
12
201
3
20
14
20
15
20
16
20
17
201
8
Cap
acit
y (G
W)
Additions Cumulative Planned additions Planned cumulative
Integration of Variable Renewable Energy Volume II: Case studies
326641/TRD/EFR/5/e January 2015 Volume II: Case studies
18
Figure 4.3: Geographical distribution of wind farms in ERCOT
Source: AWS Truepower, 2012

Integration of Variable Renewable Energy Volume II: Case studies
326641/TRD/EFR/5/e January 2015 Vol II: Case studies
19
Key message: Wind capacity is located mainly in the North West region of Texas as a result of strong wind
resource in that area.
4.3 Challenges
We asked ERCOT to rate the severity of six discrete integration challenges (on a scale of 1 to 5, with 5
being most severe). The challenges we define are detailed in Volume I: Main Report.:
Figure 4.4: ERCOT perception of challenge
Source: Mott MacDonald
ERCOT considers supply adequacy and ramping as the most severe challenges (see Figure 4.4). This is
likely to be because ERCOT has a low, non-VRE reserve margin.
ERCOT qualified their response to inertia (which it gave a ‘3’) by saying that it is likely to become more of
an issue, as there is a further 8 GW of wind expected in three years. As a synchronously independent
system, ERCOT has to be able to provide its own inertia. Congestion (reported as a ‘4’) has been
alleviated to a certain extent by the introduction of Competitive Renewable Energy Zones (CREZ) –
described later in section 4.4.
4.4 Integration timeline
ERCOT has implemented a number of key policies in the electricity market that have had an effect on the
integration of VRE (see Figure 4.5).
0
1
2
3
4
5Inertia
Reactive power
Transientstability
Congestion
Ramping
Supplyadequacy

Integration of Variable Renewable Energy Volume II: Case studies
326641/TRD/EFR/5/e January 2015 Vol II: Case studies
20
Figure 4.5: ERCOT – Integration timeline
Source: Mott MacDonald
Load RRS – 2002: ERCOT introduced the use of Load Resources into the Responsive Reserve Service
(RRS), the primary responsive reserve ancillary service in ERCOT. Load resources with under-frequency
relays can bid into the RRS services. The total amount of load allowed is limited to 1400 MW (50 percent
of total RRS procured) due to frequency concerns during deployment.
Load RRS – Load introduced
into Ancillary Services (Responsive Reserve Service) for the first time
Forecasting – AWS True wind forecasting introduced,
updated every hour on 48 hour rolling window
Emergency Reserve Service – Introduction of
loads with 10 minute ramp capability to provide ERS, updated in 2013 and 2014
CREZ– Competitive Renewable Energy Zones,
legislation in 2005, established in 2008.
LRAS – Large Ramp Alert System introduced to
alert operator of high risk of ramp in next 6 hours
Market reform – move from 5 market zones to
over 4,000 nodes & introduction of RT (5-minute) market through SCED
System offer cap – cap increased from
$3/kWh to $4.50/kWh in 2012 and $5/MWh in 2013 – plans for further increases
Governor wind response – Requires wind
to provide primary frequency response
2002
2005
2006
2007
2010
2012
FRRS Pilot – Fast Regulation Reserve Services
pilot for ~ 30 MW up & down – battery storage is participating
2013
$Dispatch sophistication
System services market
Regulator incentives on SO
Grid representation
Use of forecasting
Interconnector management and market integration
Grid code
VRE incentives and dispatch

Integration of Variable Renewable Energy Volume II: Case studies
326641/TRD/EFR/5/e January 2015 Vol II: Case studies
21
CREZ – 2005: Competitive Renewable Energy Zones (CREZ) legislation was passed in 2005, and was
implemented in 2008. The scheme designates renewable energy development zones in which wind and
transmission was to be developed. About 12.5 GW of transmission capacity has since been built, reducing
congestion and curtailment at a cost of $6.85 billion.
Forecasting – 2006: ERCOT’s wind forecasting is done by AWS True Wind, producing a 48 hour rolling
forecast which is updated every hour.
Emergency Reserve Service – 2007: Loads with a ramp capability of mobilising within 10 minutes’ notice
were introduced into the Emergency Reserve Service (ERS), mainly to Energy Emergency Alert situations.
This gives ERCOT additional flexibility, and can be used before (and is cheaper than) implementing firm-
load shedding. In 2013, small distributed generators were introduced into the services, and in 2014, loads
with 30 minute ramp capability were introduced.
LRAS – 2010: The Large Ramp Alert System (LRAS) was developed by ERCOT and AWS true wind to
forecast wind ramp events. A display in the ERCOT control room indicates when there is a high risk of a
large wind power ramp occurring in the next six hours. The intention is to allow ERCOT to prepare for wind
ramps ahead of time. The system has not yet been integrated with a load ramp forecast but work is
currently ongoing in this area.
Annual operating cost savings, from holding lower reserves and reduced balancing needs, due to the
implementation of state of the art wind forecasting at different capacities of wind in ERCOT were estimated
by Piwko (see Figure 4.6). These estimates translate to a cost saving of almost $200 million at current
capacity.
Figure 4.6: Annual operating cost savings ($million) due to implementation of state of the art forecasting
Source: Piwko, 2009
Market Reform – 2010: ERCOT underwent significant reforms of the energy market, introducing Locational
Marginal Pricing (LMP), moving from a zonal market (of five regions) to a nodal market (of over 4000
nodes). Also included in the reform was the introduction of Day Ahead co-optimisation of the energy
market and ancillary service markets and reducing dispatch times from 15 minutes to 5 minutes with the
introduction of the Security Constrained Economic Dispatch (SCED) optimiser. ERCOT reports that the
reforms have improved dispatch efficiency and unit commitment.
As a result of these reforms, the average regulating requirement has been significantly reduced (see
Figure 4.7), which should result in system wide cost savings.
0
100
200
300
400
500
600
5 10 15
Esti
mat
ed
co
st s
avin
gs (
$m
)
Wind capacity (GW)

Integration of Variable Renewable Energy Volume II: Case studies
326641/TRD/EFR/5/e January 2015 Vol II: Case studies
22
Figure 4.7: Impact of ERCOTs dispatch reforms on regulation requirement
Source: ERCOT
Key message: introduction of market reforms has reduced the requirement for regulating reserve.
System offer cap – 2012: Caps on energy market price were increased from $3000/MWh to $4500/MWh
(in 2012) and again to $5000/MWh in 2013. Plans are in place to further increase to $7000/MWh in the
summer of 2014 and again to $9000/MWh in 2015. Low prices seen in recent years, due to low Short Run
Marginal Cost (SRMC) wind plants and cheap gas, and caps on scarcity pricing have not been enough to
bring on new flexible resource. The intention of the increases is to address resource adequacy concerns
by providing greater incentives for the deployment of new flexible resource.
Governor wind response – 2012: All wind generators are required to provide frequency response, similar to
the Primary Frequency Response used by conventional steam generators.
FRRS Pilot – 2013: ERCOT is trialling a new ancillary service called the Fast Regulation Reserve Service
(FRRS), which involves 33 MW of up regulation and 30 MW of down regulation – including some battery
storage. The pilot is testing various deployment methodologies to determine whether FRRS can improve
ERCOT’s ability to arrest frequency deviations during unit trips and reduce the need for Regulation Service
(RS) and reserve costs.
4.5 Frame-conditions
The frame conditions, as defined in Volume I: Main Report, are key market, operational and regulatory
conditions of a power system that influence the ability of the power system to integrate high levels of VRE
now and in the future.
1,000
900
800
700
600
500
400
300
08-07 02-08 08-08 02-09 08-09 02-10 08-10 02-11 08-11 02-12
Cap
acit
y (M
W)
Time (date-month)
Avg. Reg. Up requirement Avg. Reg. Down requirement

Integration of Variable Renewable Energy Volume II: Case studies
326641/TRD/EFR/5/e January 2015 Vol II: Case studies
23
Dispatch sophistication: ERCOT has a day ahead, intraday market (closing one hour before operation) and
real time (5 minute) dispatch. Day ahead is a financial voluntary pool and the intraday is a physical market
in which participants can refine their positions. The real time dispatch – or Security Constrained Economic
Dispatch (SCED) – takes consideration of technical constraints (ramp rates, min and max generation and
ancillary service commitments) to dispatch the generation fleet every five minutes.
ERCOT’s dispatch process is an example of a sophisticated central dispatch method.
Incentives on VRE: The Production Tax Credit (PTC) was the main form of support for wind deployment,
which provided a premium on wholesale energy prices; however, this was abandoned in December 2013
(there is grace period for projects that have started construction by December 2013). Wind generation
plants are dispatched every 5 minutes in the SCED, based on persistence (i.e. requested to generate the
same as the previous 5 minutes, unless curtailment due to transmission constraint is required). Wind
generators face reduced imbalance risk (penalty for 20 percent deviation from dispatch instruction, in
contrast with 10 percent for conventional generators) and receive no compensation for curtailment.
VRE generators have a high level of market exposure, which encourages developers to consider system
impacts when developing new wind farms.
Use of forecasting: Centralised forecasting is used by ERCOT to inform day ahead and hour ahead
commitment schedules, and the Hourly Reliability Unit Commitment (HRUC). ERCOT also uses historic
wind forecast errors to inform the level of Non-Spinning reserve (part of the ancillary services) required.
ERCOT has also introduced and is developing a Large Ramp Alert System in order to better manage ramp
events.
System services market: the ancillary services for reserve defined by ERCOT are responsive reserve,
regulation reserve, and non-spin (replacement) reserve). These are described in Table 4.1:
Table 4.1: ERCOT ancillary services
Service Description Price determined
Responsive Resource held in reserve to deal with the unexpected loss of generation. Responsive Reserve
requirement currently covers two largest unit trips. Generation and load resources provide Responsive
Reserve (load resources restricted to 50 percent)
Energy and ancillary services are co-optimized in the day ahead, as a result
there is an energy clearing price and clearing price associated with each
ancillary service per MW of capacity. This AS clearing price will be used to pay
participants who are awarded the service.
Regulation Used to maintain ERCOT's target frequency. Amount of regulation requirement is based on
historic 5 minute net load (load minus wind) variability and historic Regulation deployments,
whichever is larger. Regulation is defined for each hour in a day.
As above
Non-spin (replacement) Non-spinning reserve used to compensate (within 30 minutes) for load forecast errors and generation.
Non-spin requirement is determined based on historic hourly net load forecast error. Non-spin is
defined for each 4 hour block of a day.
As above
Source: ERCOT
ERCOT is currently piloting a Fast Response Reserve Service (described further in section 4.4) in addition
to considering further developments to ancillary services (discussed in section 4.7 section).

Integration of Variable Renewable Energy Volume II: Case studies
326641/TRD/EFR/5/e January 2015 Vol II: Case studies
24
Grid representation: ERCOT uses Locational Marginal Pricing (LMP) of over 4000 different nodes. This is
an advanced method of grid constraint representation and considered as best practice.
Interconnector management: The five DC ties ERCOT has with other power systems are treated as a
resource in SCED and are dispatched based on need and economics; however, they aren’t used for
balancing services. The interconnector schedules are generally based on long term contracts.
Regulator incentives on the SO: The Public Utility Commission of Texas is the independent market
regulator that monitors ERCOT, but there are no explicit regulator incentives for ERCOT to reduce costs.
Allowable costs are negotiated between these two parties based on previous performance and projected
outlook. Any significant reforms and rule changes that are likely to impact costs go through the stakeholder
process with representatives from all sectors.
VRE grid code: ERCOT’s grid code specifies requirements for reactive power, fault ride-through and
frequency response.
Figure 4.8 shows as a simple schematic our view of how the key frame conditions have developed over
time as a result of the measures introduced, shown through our timeline. The ratings are a subjective view
and are meant to show the development of the measures.
Figure 4.8: ERCOT Frame conditions.
Source: Mott MacDonald
Key message: ERCOT has developed integration measures in all areas except regulator incentives on SO
and interconnector management. It has particularly developed best practice areas of grid representation
and dispatch sophistication and maturity.
0
1
2
3
4
5
Dispatchsophisticationand maturity
VRE incentivesand dispatch
Use offorecasting
System servicesmarket
Gridrepresentation
Interconnectormanagement
Regulatorincentives on
SO
Grid code
Start year Now

Integration of Variable Renewable Energy Volume II: Case studies
326641/TRD/EFR/5/e January 2015 Vol II: Case studies
25
4.6 Integration studies
In 2008, GE conducted the study to evaluate amounts of additional regulation requirements with up to 15
GW of wind generation in ERCOT system. GE determined additional amounts of reserves per month
needed for each additional 1000 MW of wind generation from the installed capacity in 2008 up to 15 GW.
The study was updated in 2013 based on measured (rather that modelled) wind power production
variability. The results are used in the methodology for regulation reserve requirement determination every
month. The study also determined a wind capacity credit of 8.7 percent (this is currently under review) –
meaning ERCOT can count this percentage of wind capacity as firm.
4.7 Potential developments
There are two key developments being considered in ERCOT: Optimal Reserve Demand curve and
ancillary services re-think.
The Optimal Reserve Demand curve is proposed to address concerns about resource adequacy. The idea
is to have a price adder, or availability payment, paid to generators based on reserve availability, loss of
load probability and value of lost load (ERCOT 2013). The value of the price adder will be based on
reserve availability, loss of load probability and the value of lost load.
The adder should provide incentives for the development of new flexible and reliable generation and
smooth out price spikes due to energy scarcity.
ERCOT is also reviewing their ancillary services market. The re-think includes introducing markets of some
services that are currently provided through mandatory requirements, and the splitting or replacing of
existing ancillary service markets.
The current ancillary service markets in place are; Responsive Reserve Service from Load (RRSL),
Responsive Reserve Service from Generation (RRSG) and is Regulating Reserve (Reg) and Non-Spinning
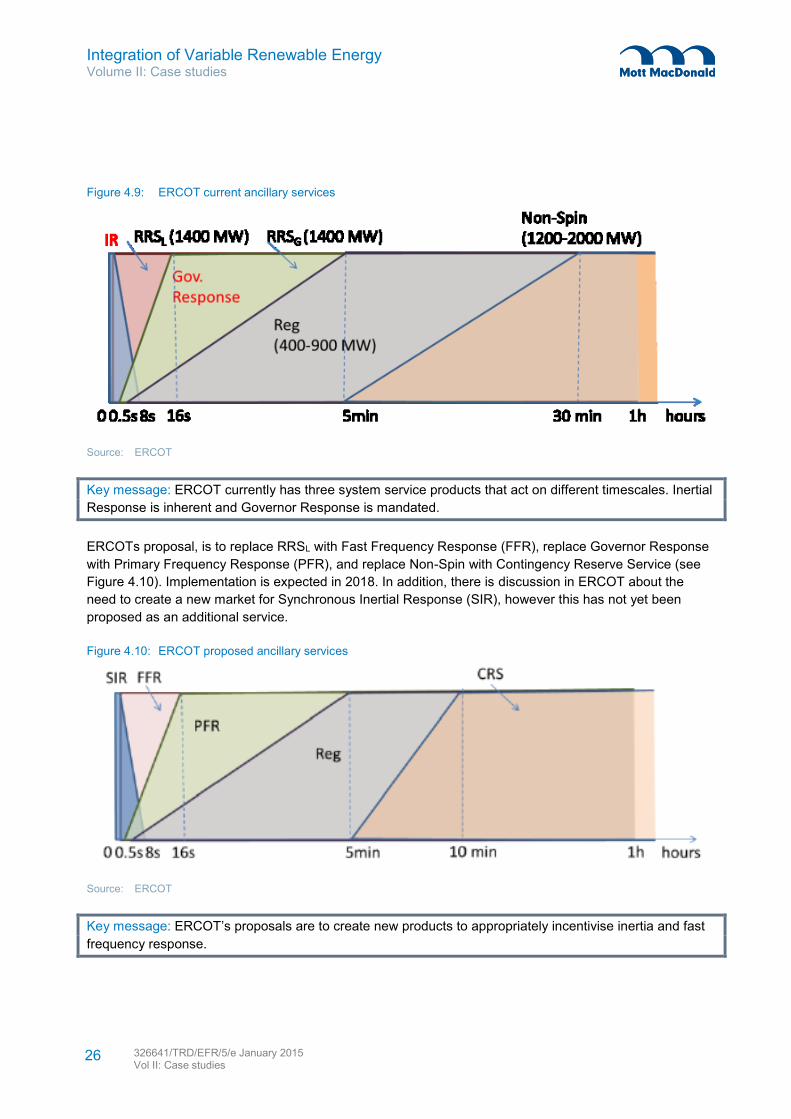
Reserve (Non-Spin) – see Figure 4.9. Inertial Response (IR) is provided by the kinetic energy stored in the
rotating mass of synchronous power generators which helps stabilise frequency. Governor Response is
provided through mandated requirements in the grid codes (including wind turbines). Note that Inertial
Response helps stabilise the power system and is provided implicitly by synchronous generators, and
Governor Response is provided through mandatory requirements of generators.
Integration of Variable Renewable Energy Volume II: Case studies
326641/TRD/EFR/5/e January 2015 Vol II: Case studies
26
Figure 4.9: ERCOT current ancillary services
Source: ERCOT
Key message: ERCOT currently has three system service products that act on different timescales. Inertial
Response is inherent and Governor Response is mandated.
ERCOTs proposal, is to replace RRSL with Fast Frequency Response (FFR), replace Governor Response
with Primary Frequency Response (PFR), and replace Non-Spin with Contingency Reserve Service (see
Figure 4.10). Implementation is expected in 2018. In addition, there is discussion in ERCOT about the
need to create a new market for Synchronous Inertial Response (SIR), however this has not yet been
proposed as an additional service.
Figure 4.10: ERCOT proposed ancillary services
Source: ERCOT
Key message: ERCOT’s proposals are to create new products to appropriately incentivise inertia and fast
frequency response.

Integration of Variable Renewable Energy Volume II: Case studies
326641/TRD/EFR/5/e January 2015 Vol II: Case studies
27
The aim of the ancillary service market re-think is two-fold. First, by changing the products and creating
additional markets ERCOT expects to provide system security more efficiently. Second, market incentives
for ancillary services products may spur investment in new flexible resources that ERCOT needs. These
outcomes should help to integrate VRE by limiting stability cost increases arising from variability and lack
of inertial response from these resources. Work in this area is ongoing – detailed discussion can be found
in ERCOT’s concept paper ‘The Future of Ancillary Services’.
4.8 Lessons for other jurisdictions
ERCOT has a sophisticated approach to market dispatch (through 5-min SCED) and grid representation
(through LMP), which is especially applicable to large demand, congested power systems that are weakly
connected with other systems. The market reforms are leading to greater efficiency of the market, which
should reduce total system cost and allow for greater VRE integration.
Increasing the market exposure that VRE developers face may lead to improved system friendly
deployment, through geographical dispersion, though this remains to be evidenced. What is clear though is
that the Competitive Renewable Energy Zones (CREZ) have helped alleviate congestion and curtailment
through transmission development planning and is beginning to encourage more geographic dispersion of
deployment. These methods are particularly relevant to jurisdictions with a large land area or have
particular concern with congestion constraints.
ERCOT is developing novel ancillary service products which will potentially reduce the costs of providing
system stability. Included in the concept is a product to remunerate the provision of inertia – which should
be of particular interest to synchronously independent jurisdictions.
Integration of Variable Renewable Energy Volume II: Case studies
326641/TRD/EFR/5/e January 2015 Vol II: Case studies
28
5.1 Introduction
This chapter of the Volume II Case Studies report presents the case study for Ontario. The information
gathered was based on:
questionnaire information received
subsequent email and telephone exchange with Ontario Independent Electricity System Operator
(OIESO)
Our thanks in particular are extended to OIESO for their assistance in compiling this information.
5.2 Context
Ontario is the largest region, geographically, in the study. The power system is operated by OIESO.
Power system
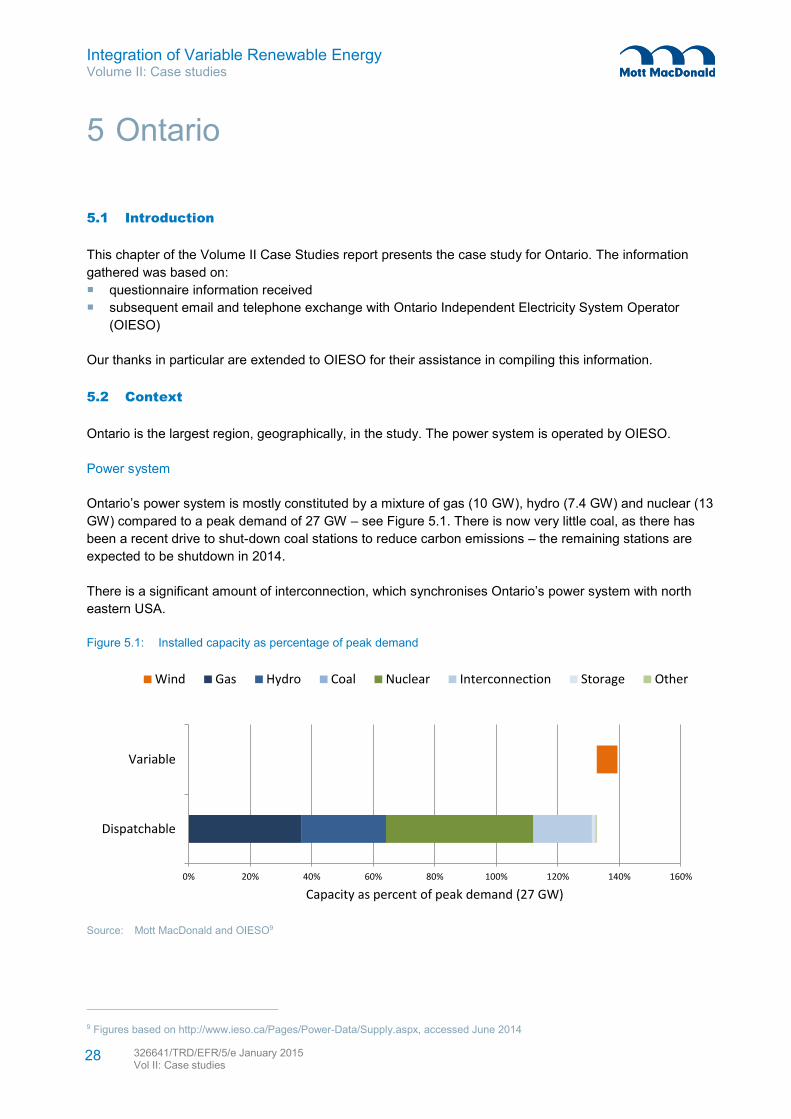
Ontario’s power system is mostly constituted by a mixture of gas (10 GW), hydro (7.4 GW) and nuclear (13
GW) compared to a peak demand of 27 GW – see Figure 5.1. There is now very little coal, as there has
been a recent drive to shut-down coal stations to reduce carbon emissions – the remaining stations are
expected to be shutdown in 2014.
There is a significant amount of interconnection, which synchronises Ontario’s power system with north
eastern USA.
Figure 5.1: Installed capacity as percentage of peak demand
Source: Mott MacDonald and OIESO9
9 Figures based on http://www.ieso.ca/Pages/Power-Data/Supply.aspx, accessed June 2014
0% 20% 40% 60% 80% 100% 120% 140% 160%
Dispatchable
Variable
Capacity as percent of peak demand (27 GW)
Wind Gas Hydro Coal Nuclear Interconnection Storage Other
5 Ontario

Integration of Variable Renewable Energy Volume II: Case studies
326641/TRD/EFR/5/e January 2015 Vol II: Case studies
29
Variable Renewable Energy
Ontario currently has a relatively low level of installed wind capacity (~1.7 GW) compared to its peak
demand, and a negligible amount of solar PV. However, a further 1000 MW of wind and solar is expected
to come on line during 2014. In the Long Term Energy Plan (LTEP) of Ontario’s government aims for 10.7
GW (8 GW of which to be wind) by 2020 – which would be almost 40 percent of peak demand. This
represents not only a significant deployment challenge, but also integration challenge.
Figure 5.2 shows the distribution of wind generation currently deployed in Ontario.
Figure 5.2: Wind distribution
Source: OIESO
Key message: Most deployment is located the South West of Ontario (close to demand). Encouraging
geographically distributed deployment of VRE could bring smoothing benefits from aggregating generation
over large distances.
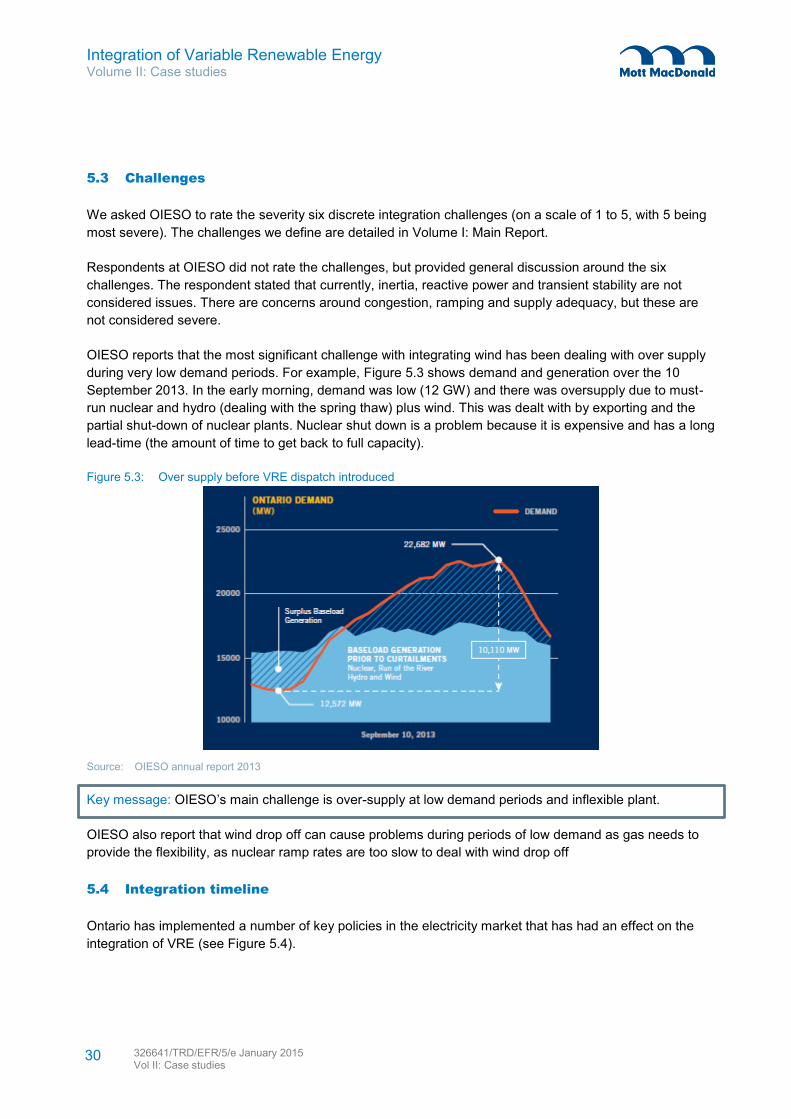
Integration of Variable Renewable Energy Volume II: Case studies
326641/TRD/EFR/5/e January 2015 Vol II: Case studies
30
5.3 Challenges
We asked OIESO to rate the severity six discrete integration challenges (on a scale of 1 to 5, with 5 being
most severe). The challenges we define are detailed in Volume I: Main Report.
Respondents at OIESO did not rate the challenges, but provided general discussion around the six
challenges. The respondent stated that currently, inertia, reactive power and transient stability are not
considered issues. There are concerns around congestion, ramping and supply adequacy, but these are
not considered severe.
OIESO reports that the most significant challenge with integrating wind has been dealing with over supply
during very low demand periods. For example, Figure 5.3 shows demand and generation over the 10
September 2013. In the early morning, demand was low (12 GW) and there was oversupply due to must-
run nuclear and hydro (dealing with the spring thaw) plus wind. This was dealt with by exporting and the
partial shut-down of nuclear plants. Nuclear shut down is a problem because it is expensive and has a long
lead-time (the amount of time to get back to full capacity).
Figure 5.3: Over supply before VRE dispatch introduced
Source: OIESO annual report 2013
Key message: OIESO’s main challenge is over-supply at low demand periods and inflexible plant.
OIESO also report that wind drop off can cause problems during periods of low demand as gas needs to
provide the flexibility, as nuclear ramp rates are too slow to deal with wind drop off
5.4 Integration timeline
Ontario has implemented a number of key policies in the electricity market that has had an effect on the
integration of VRE (see Figure 5.4).
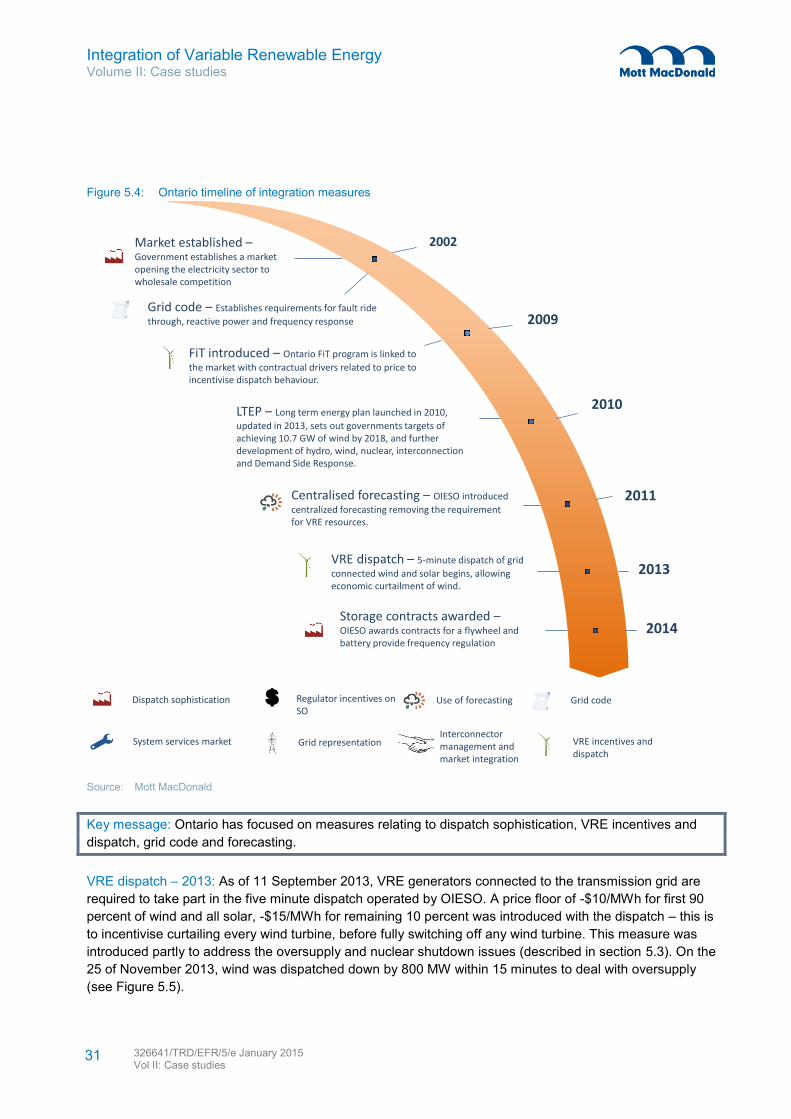
Integration of Variable Renewable Energy Volume II: Case studies
326641/TRD/EFR/5/e January 2015 Vol II: Case studies
31
Figure 5.4: Ontario timeline of integration measures
Source: Mott MacDonald
Key message: Ontario has focused on measures relating to dispatch sophistication, VRE incentives and
dispatch, grid code and forecasting.
VRE dispatch – 2013: As of 11 September 2013, VRE generators connected to the transmission grid are
required to take part in the five minute dispatch operated by OIESO. A price floor of -$10/MWh for first 90
percent of wind and all solar, -$15/MWh for remaining 10 percent was introduced with the dispatch – this is
to incentivise curtailing every wind turbine, before fully switching off any wind turbine. This measure was
introduced partly to address the oversupply and nuclear shutdown issues (described in section 5.3). On the
25 of November 2013, wind was dispatched down by 800 MW within 15 minutes to deal with oversupply
(see Figure 5.5).
Market established –Government establishes a market opening the electricity sector to wholesale competition
FiT introduced – Ontario FiT program is linked to
the market with contractual drivers related to price to incentivise dispatch behaviour.
Centralised forecasting – OIESO introduced
centralized forecasting removing the requirement for VRE resources.
2002
2009
2011
VRE dispatch – 5-minute dispatch of grid
connected wind and solar begins, allowing economic curtailment of wind.
2013
LTEP – Long term energy plan launched in 2010,
updated in 2013, sets out governments targets of achieving 10.7 GW of wind by 2018, and further development of hydro, wind, nuclear, interconnection and Demand Side Response.
2010
Grid code – Establishes requirements for fault ride
through, reactive power and frequency response
$Dispatch sophistication
System services market
Regulator incentives on SO
Grid representation
Use of forecasting
Interconnector management and market integration
Grid code
VRE incentives and dispatch
Storage contracts awarded –OIESO awards contracts for a flywheel and battery provide frequency regulation
2014

Integration of Variable Renewable Energy Volume II: Case studies
326641/TRD/EFR/5/e January 2015 Vol II: Case studies
32
Figure 5.5: Oversupply after VRE dispatch introduced
Source: OIESO annual report 2013
Key message: Requiring VRE to dispatch allows for more economic operation of the power system by
allowing wind curtailment rather than forcing nuclear shut-down
Storage contracts – 2014: In July, a 2MW flywheel had begun operations to provide OIESO with frequency
regulation service. In August, a contract was awarded to a 4MW capacity battery that will, when
operational, provide additional frequency regulation service for OIESO.
5.5 Frame conditions
The frame conditions, as defined in Volume I: Main Report, are key market, operational and regulatory
conditions of a power system that influence the ability of the power system to integrate high levels of VRE
now and in the future.
Dispatch sophistication: Offer and Bid window id 6:30-9:50 day ahead for imports, exports and larger fossil
units. Intra-day gate closure is 2 hours before the dispatch. OIESO operates five minute dispatch of
generation. Large consumers can participate as ‘dispatchable load’ in the market. The Ontario market has
a price cap of $2,000/MWh and floor of -$2,000/MWh.
Incentives on VRE: Ontario FiT program is linked to the market with contractual drivers related to price that
incentivises dispatch behaviour based on marginal cost of the resource. Dispatch of VRE was introduced
in 2013. VRE generators are not exposed to imbalance risk. The FiT design shares curtailment risk where
the VRE is exposed to a certain number of unpaid hours per year and it is capped over the life of the
contract.
Use of forecasting: OIESO uses centralised forecasting for wind farms greater than 5MW for day ahead
scheduling and system monitoring (GE Energy 2011). OIESO uses 2-7day forecasts for outage planning,
0-48 hour forecasting for day ahead and hourly scheduling, 5-minute forecasting for real-time dispatch and
ramp forecasting for situational awareness.
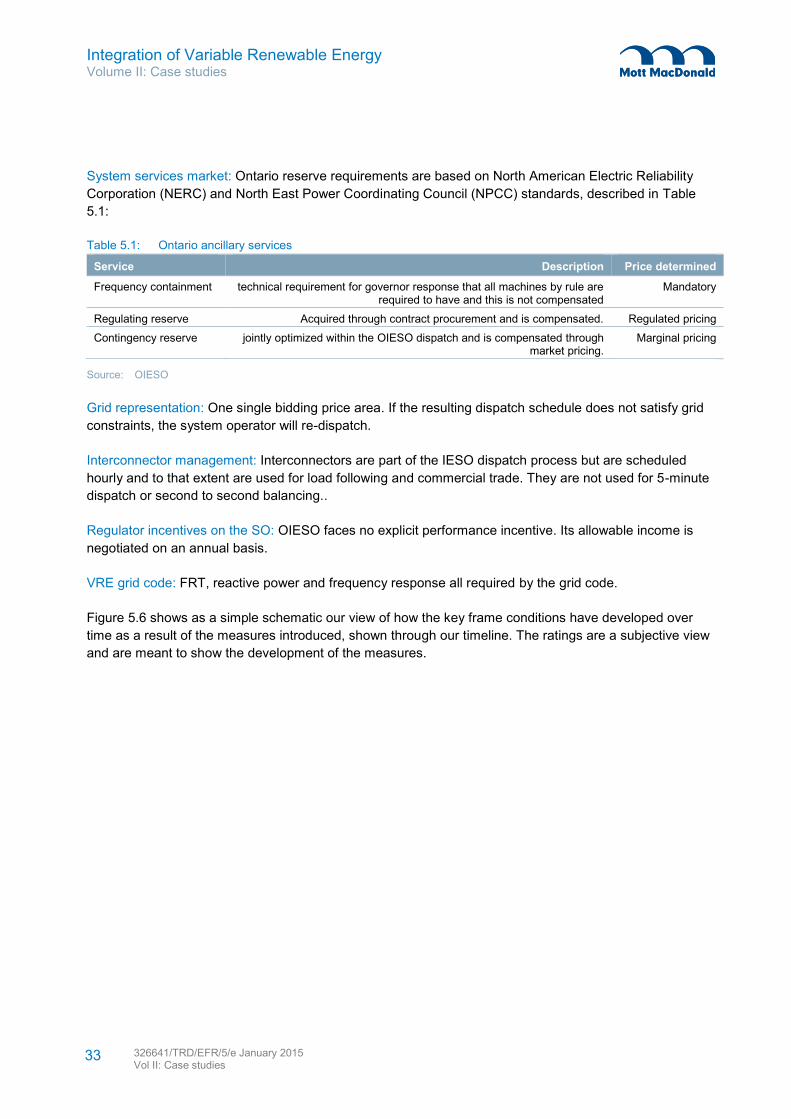
Integration of Variable Renewable Energy Volume II: Case studies
326641/TRD/EFR/5/e January 2015 Vol II: Case studies
33
System services market: Ontario reserve requirements are based on North American Electric Reliability
Corporation (NERC) and North East Power Coordinating Council (NPCC) standards, described in Table
5.1:
Table 5.1: Ontario ancillary services
Service Description Price determined
Frequency containment technical requirement for governor response that all machines by rule are required to have and this is not compensated
Mandatory
Regulating reserve Acquired through contract procurement and is compensated. Regulated pricing
Contingency reserve jointly optimized within the OIESO dispatch and is compensated through market pricing.
Marginal pricing
Source: OIESO
Grid representation: One single bidding price area. If the resulting dispatch schedule does not satisfy grid
constraints, the system operator will re-dispatch.
Interconnector management: Interconnectors are part of the IESO dispatch process but are scheduled
hourly and to that extent are used for load following and commercial trade. They are not used for 5-minute
dispatch or second to second balancing..
Regulator incentives on the SO: OIESO faces no explicit performance incentive. Its allowable income is
negotiated on an annual basis.
VRE grid code: FRT, reactive power and frequency response all required by the grid code.
Figure 5.6 shows as a simple schematic our view of how the key frame conditions have developed over
time as a result of the measures introduced, shown through our timeline. The ratings are a subjective view
and are meant to show the development of the measures.

Integration of Variable Renewable Energy Volume II: Case studies
326641/TRD/EFR/5/e January 2015 Vol II: Case studies
34
Figure 5.6: Ontario frame conditions.
Source: Mott MacDonald
Key message: Ontario has focused on developing VRE incentives and dispatch, by introducing a FiT
payment linked to wholesale electricity price and through the introduction of wind dispatch. OIESO has
also developed the use of forecasting, by implementing centralised forecasts.
5.6 Potential developments
OIESO is currently evaluating submissions for an RfP on 35 MW of electricity storage (including the
projects mentioned above). The project is to assess how storage can be integrated into the power system.
A range of technologies have been invited to participate and they will be required to provide either
regulating service or reactive support and voltage control.
In addition, OIESO reports that some nuclear power plants are going to go through refurbishment.
Capacity markets are also being considered at the moment in order to alleviate concerns about resource
adequacy and OIESO is looking at developing a large ramp forecast to help deal with wind ramps.
0
1
2
3
4
5
Dispatchsophisticationand maturity
VRE incentivesand dispatch
Use offorecasting
System servicesmarket
Gridrepresentation
Interconnectormanagement
Regulatorincentives on
SO
Grid code
Start year Now

Integration of Variable Renewable Energy Volume II: Case studies
326641/TRD/EFR/5/e January 2015 Vol II: Case studies
35
5.7 Lessons for other jurisdictions
Ontario is characterised by having a large amount of inflexible nuclear generation (at almost half peak
demand), though with a significant level of interconnection (~20 percent of peak demand). Even at a
modest level of VRE penetration (installed wind capacity is 6 percent of demand) this has caused problems
during periods of very low demand (see above). By making wind dispatchable, Ontario is better able to
economically manage these operational issues. Therefore wind dispatch seems to be particularly relevant
for countries with a large amount of inflexible generation (such as nuclear). However, this solution is not
ideal, as it requires relying on wind curtailment as a means of integration. Interconnection programme unit
schedules are hourly – Ontario may be able to gain more flexibility out of their interconnection by reducing
the programme unit schedules.
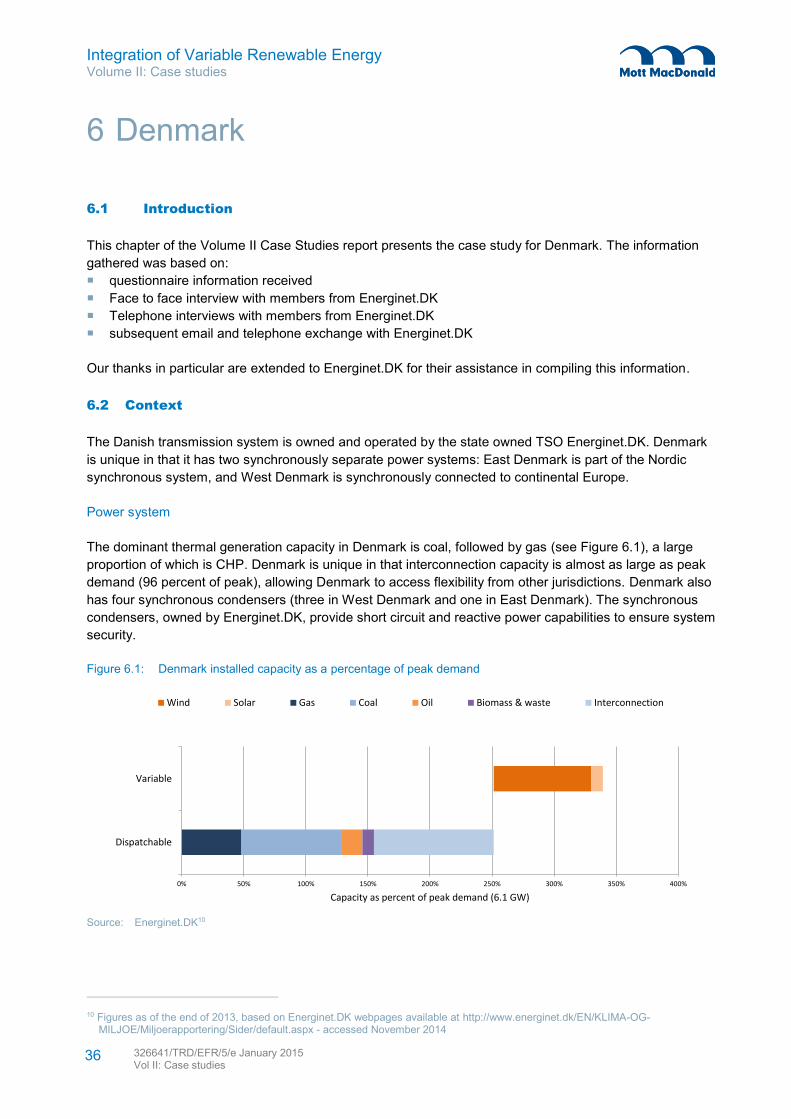
Integration of Variable Renewable Energy Volume II: Case studies
326641/TRD/EFR/5/e January 2015 Vol II: Case studies
36
6.1 Introduction
This chapter of the Volume II Case Studies report presents the case study for Denmark. The information
gathered was based on:
questionnaire information received
Face to face interview with members from Energinet.DK
Telephone interviews with members from Energinet.DK
subsequent email and telephone exchange with Energinet.DK
Our thanks in particular are extended to Energinet.DK for their assistance in compiling this information.
6.2 Context
The Danish transmission system is owned and operated by the state owned TSO Energinet.DK. Denmark
is unique in that it has two synchronously separate power systems: East Denmark is part of the Nordic
synchronous system, and West Denmark is synchronously connected to continental Europe.
Power system
The dominant thermal generation capacity in Denmark is coal, followed by gas (see Figure 6.1), a large
proportion of which is CHP. Denmark is unique in that interconnection capacity is almost as large as peak
demand (96 percent of peak), allowing Denmark to access flexibility from other jurisdictions. Denmark also
has four synchronous condensers (three in West Denmark and one in East Denmark). The synchronous
condensers, owned by Energinet.DK, provide short circuit and reactive power capabilities to ensure system
security.
Figure 6.1: Denmark installed capacity as a percentage of peak demand
Source: Energinet.DK10
10 Figures as of the end of 2013, based on Energinet.DK webpages available at http://www.energinet.dk/EN/KLIMA-OG-MILJOE/Miljoerapportering/Sider/default.aspx - accessed November 2014
0% 50% 100% 150% 200% 250% 300% 350% 400%
Dispatchable
Variable
Capacity as percent of peak demand (6.1 GW)
Wind Solar Gas Coal Oil Biomass & waste Interconnection
6 Denmark

Integration of Variable Renewable Energy Volume II: Case studies
326641/TRD/EFR/5/e January 2015 Vol II: Case studies
37
Interconnection to other jurisdictions is a significant part of Denmark’s context. Denmark has a large
capacity of interconnection with Norway, Sweden and Germany and has further plans to increase
interconnection with Norway and Germany (see Figure 6.2). Plans for an interconnector with the
Netherlands have been approved.
Figure 6.2: Denmark interconnection
Source: Energinet.DK
Key message: Denmark is a highly interconnected system, with interconnection to Norway, Germany and
Sweden and an approved interconnection to the Netherlands.
Variable Renewable Energy
Denmark is considered a world leader in wind power, with an installed capacity equal to 79 percent of peak
demand. There is also a small (9 percent of peak demand) but growing capacity of solar PV in the country.
The wind resource is strongest in the west and north of the country, but deployment of capacity has been
fairly evenly distributed11.
11 See Energinet.DK.DK, "Wind Power to combat climate change - How to integrate wind energy into the power system" available at <http://Energinet.DK.dk/SiteCollectionDocuments/Engelske%20dokumenter/Klimaogmiljo/Wind%20power%20magazine.pdf> accessed on 14.8.2014

Integration of Variable Renewable Energy Volume II: Case studies
326641/TRD/EFR/5/e January 2015 Vol II: Case studies
38
6.3 Challenges
We asked Energinet.DK to rate the severity of six discrete integration challenges (on a scale of 1 to 5, with
5 being most severe). The challenges we define are detailed in Volume I: Main Report.
Figure 6.3 presents Energinet.DK’s perception of the severity of the challenges.
Figure 6.3: Energinet.DK perception of the challenges
Source: Mott MacDonald and Energinet.DK
The major concern reported is for reactive power. Reactive power is a local issue in that the supply and
demand of reactive power has to be managed in a small network area, as opposed to frequency, which is
system wide.
Inertia is reported to be a relatively low level concern, as the Danish power systems are a small part of
much larger synchronous grids (West Denmark is part of the continental European synchronous grid, and
East Denmark is part of the Nordic synchronous grid).
Ramping is reported to be a key issue. Energinet.DK imposes a rule on the market driven change of HVDC
interconnectors that changes in export / import conditions presently need to take 30 minutes. This is to
ensure continuously stable voltage control on the transmission grid. This limits the ability of interconnectors
to provide short term flexibility for large changes in generation, for example if a weather front hits and
significantly increases production from wind.
6.4 Integration timeline
Denmark has implemented a number of key policies in the electricity market that has had an effect on the
integration of VRE (see Figure 6.4).
0
1
2
3
4
5Inertia
Reactive power
Transientstability
Congestion
Ramping
Supplyadequacy

Integration of Variable Renewable Energy Volume II: Case studies
326641/TRD/EFR/5/e January 2015 Vol II: Case studies
39
Figure 6.4: Denmark integration timeline
Source: Mott MacDonald
Nordel coupling – 1999: East Denmark, and the West Denmark (in 2000), joined the Nordic market,
comprised of Norway, Sweden and Finland. At this time, Denmark also introduced the day ahead hourly
spot market.
Nordel Grid code – 1999: Due to concerns about protecting wind farm equipment, the Nordel grid code
was developed which required all wind generators on the high voltage transmission system to disconnect
in the event of abnormal voltage or frequency.
CHP in the market – 2004: in 2004, CHP was required to participate in the wholesale market. This
measure has allowed the CHP plants with hot water storage to be operated more flexibly. CHP operators
generate electricity at times of high prices (low wind or high demand) and store heat, then shut down
generation at times of low prices (high wind or low demand) and use the stored heat. Also, at times of VRE
oversupply, the VRE generation can be used for the electric boilers. This helps the integration of wind in
Denmark by providing additional flexibility in the power system to match the variations in wind generation.
Nordel grid code – Wind generators on
the high voltage network required to disconnect during abnormal voltage or frequency
CHP in the market – CHP operators required to
compete in the spot market.
Nordel grid code – Wind required to provide fault-ride
through, and introduction of compensation for curtailment.
1999
2004
2008
VRE in regulating market – Wind introduced into
the regulating market (ancillary services).
2014
Energinet formed – out of merger between
ELTRA and ELKRAFT.
2007
Market Coupling – Danish and German electricity
markets coupled.
2009Negative pricing – Negative pricing first allowed
in the market, occurring for between 20 and 100 hours a year.
NOIS – Nordel Operational Information System,
based at Energinet, monitors interconnection and usable operating reserve over the Nordic system.
Internal grid strengthening – Great belt DC link
between East and West Denmark, providing additional management options for wind power in the west.
Market Coupling – Danish market coupled with
Central Western Europe markets.
2012
2010
$Dispatch sophistication
System services market
Regulator incentives on SO
Grid representation
Use of forecasting
Interconnector management and market integration
Grid code
VRE incentives and dispatch
Nordel coupling – Denmark joins Nordpool
and price quotation implemented

Integration of Variable Renewable Energy Volume II: Case studies
326641/TRD/EFR/5/e January 2015 Vol II: Case studies
40
Nordel grid code – 2007: due to the increasing penetration of wind turbines on the system, Nordel grid
code is developed to require Fault Ride Through in the event of voltage disturbance. Compensation for
curtailment is also introduced.
Market coupling – 2008: the Danish and German day ahead markets coupling was initially mired in IT
problems. Coupling re-launched successfully in 2010.
The use of interconnection, and market coupling with Nordpool and Germany, is crucial to the success that
Denmark has had in integrating wind. When the wind is strong, market prices in Denmark are depressed,
creating the incentive for export from Denmark to neighbouring jurisdictions. When wind is weak, prices in
Denmark rise, creating the incentive to import (see Figure 6.5). This allows Denmark to ‘export’ much of
the variability issue to the wider region and access a wider range of flexible resource, such as hydro in
Norway and conventional power plants in Germany.
Figure 6.5: Denmark wind generation and imports in January 2014
Source: Energinet.DK
Key message: we can see from the figure that there is a strong negative correlation between wind
generation and imports. Denmark is making use of significant interconnection to manage wind variability.
Negative pricing – 2009: Negative pricing first allowed. Negative pricing provides a strong incentive for
storage and demand shifting (by allowing larger differentials between prices).
Internal grid strengthening – 2010: The Great Belt power link, a 600 MW HVDC connecting east and West
Denmark, began commercial operations in August 2010. Due to generally higher prices in East Denmark,
the flow of power is usually West to East.
VRE in the regulating market – 2012: There is a Nordic regulating power market that Energinet.DK can call
on to cover shortfalls or overproduction of energy for each 15 minute period during the day of operation.
-2,000
-1,500
-1,000
-500
0
500
1,000
1,500
2,000
2,500
3,000
Po
wer
(M
W)
Wind generation imports
1st 31stJanuary

Integration of Variable Renewable Energy Volume II: Case studies
326641/TRD/EFR/5/e January 2015 Vol II: Case studies
41
Participants offer bids for upward and downward regulation stating the volume (in MW) and price
(DKK/MWh). Wind power is allowed to participate in the regulating market, and recent changes mean wind
generators do not have to offer a volume, just state their installed capacity, and so Energinet.DK calculates
the forecasted offer. This change allows for easier access to the VRE market for wind generators.
Market coupling – 2014: the most recent developments in European Market Coupling has been the market
coupling of Great Britain, Spain and Portugal to the central and northern European markets, and the move
from Interim Tight Volume Coupling (ITVC)12 to full market coupling between Nordic and CWE regions.
While these countries do not have direct links with Denmark, the continuing development towards a single
European market allows Danish market participants to effectively trade electricity with parties (through
national changes via the mechanism of implicit auctioning of day ahead capacity) in these regions.
6.5 Frame conditions
The frame conditions, as defined in Volume I: Main Report, are key market, operational and regulatory
conditions of a power system that influence the ability of the power system to integrate high levels of VRE
now and in the future.
Dispatch sophistication: Denmark is part of the Nord Pool Spot power exchange which organises the
Elspot (Day Ahead Market) and Elbas (intraday market). The intraday market closes an hour ahead of
operation. Negative pricing is allowed and the electricity price cap is set at €3,000/MWh
Incentives on VRE: VRE generators receive a fixed rate FiT for energy generated, but are fully exposed to
imbalance risk (though they receive an additional subsidy to cover losses due to added risk – this means
there is still the incentive to manage the balancing risk). They receive full compensation for curtailment.
Use of forecasting: Energinet.DK makes two sets of forecast for onshore wind: long-term (up to 48 hours
ahead) and short term (within day, updated every 15 minutes), but uses the offshore wind owners
forecasts. The long term forecasting is used for system planning by the TSO. Additionally, some of the
wind generation (on early FIT rules) must be sold by the TSO into the market. Energinet.DK publishes its
forecast, making it available for all market participants, who can use it to inform their portions in the day
ahead and intraday markets. Energinet.DK also uses short term forecasts to inform the amount of
regulating service required ahead of time. Energinet.DK does not make a separate ramping forecast.
System services market: Denmark has three types of operating reserve, each of which receives the
marginal price for the provision of energy:
12 ITVC was a provisional solution, launched in 2010, in which energy volume traded between regions is determined before the exchanges determine their prices (see http://www.tennet.eu/nl/about-tennet/about-the-electricity-sector/market-coupling/cwe-nordic-itvc.html)

Integration of Variable Renewable Energy Volume II: Case studies
326641/TRD/EFR/5/e January 2015 Vol II: Case studies
42
Table 6.1: Denmark ancillary services
Service Description Price determined
Frequency control reserves
Reserves used to contain the frequency of the synchronous system. West Denmark is part of a large synchronous system with continental Europe and
is required to carry 30 MW of frequency control reserves
Marginal
Load Frequency Reserves (LFC)
LFC is only used in West Denmark (not East). LFC reserves must be able to activate automatically within 30 seconds.
Marginal
Manual reserves Manual reserves are activated to deal with wind or load forecast errors and to relieve primary and secondary reserves after faults or generator trips –In
West Denmark, Energinet.DK buys approximately 250 MW at daily auctions and in East Denmark Dong Energy has a five year contract (extended to
2020) for fast manual reserves (15 minutes) of 300 MW and slow (2 hours) of 300 MW
Marginal
Source: Energinet.DK
Grid representation: Denmark is part of the Nordpool market that has 12 different market zones. Denmark
itself is split into two zones; East Denmark and West Denmark.
Interconnector management: Denmark has fully integrated into the Nordpool market, which itself is coupled
with the markets in continental Europe. Therefore, interconnector capacity is managed by use of day
ahead implicit auctioning and can also be used for balancing (Denmark is part of the International Grid
Control Cooperation agreement, which means imbalances are netted before reserves are activated, and is
part of a common Nordic regulating market).
Regulator incentives on the SO: Price (or revenue) control – SO is allowed to recover revenue up to an
overall revenue target based on forecast of its controllable costs.
VRE grid code: Grid codes in Denmark require FRT, reactive power support and active power controls.
Figure 6.6 shows as a simple schematic our view of how the key frame conditions have developed over
time as a result of the measures introduced, shown through our timeline. The ratings are a subjective view
and are meant to show the development of the measures.
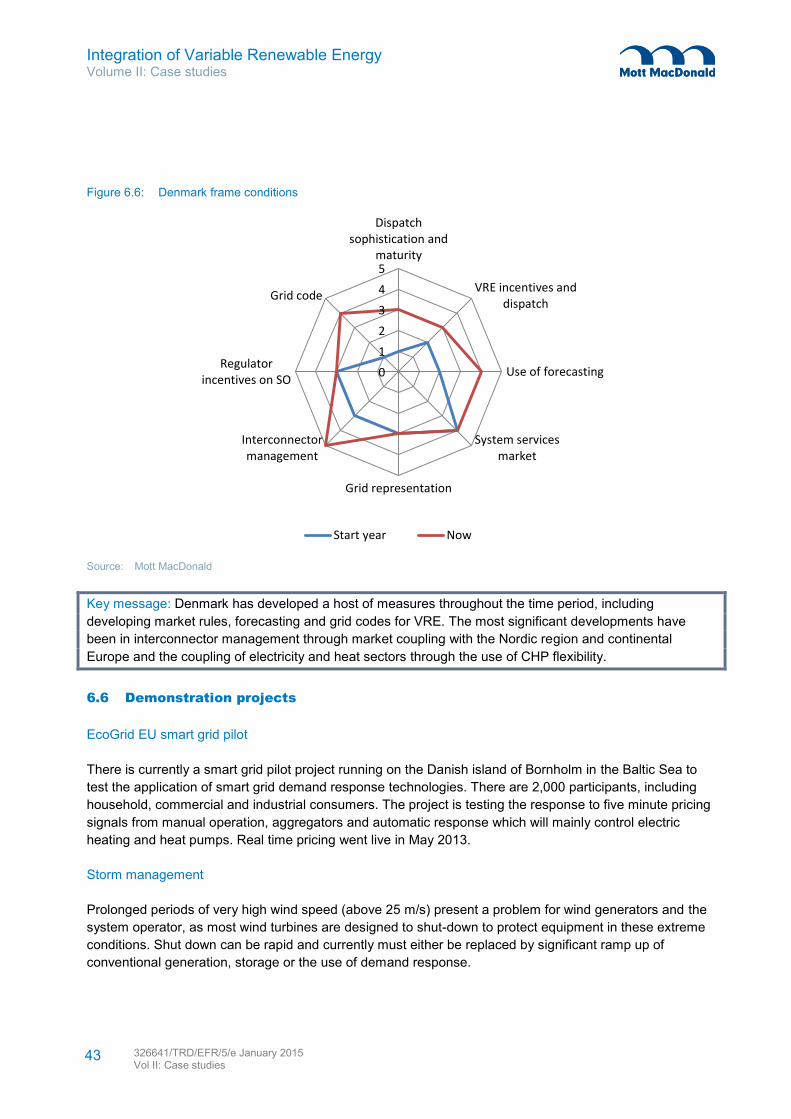
Integration of Variable Renewable Energy Volume II: Case studies
326641/TRD/EFR/5/e January 2015 Vol II: Case studies
43
Figure 6.6: Denmark frame conditions
Source: Mott MacDonald
Key message: Denmark has developed a host of measures throughout the time period, including
developing market rules, forecasting and grid codes for VRE. The most significant developments have
been in interconnector management through market coupling with the Nordic region and continental
Europe and the coupling of electricity and heat sectors through the use of CHP flexibility.
6.6 Demonstration projects
EcoGrid EU smart grid pilot
There is currently a smart grid pilot project running on the Danish island of Bornholm in the Baltic Sea to
test the application of smart grid demand response technologies. There are 2,000 participants, including
household, commercial and industrial consumers. The project is testing the response to five minute pricing
signals from manual operation, aggregators and automatic response which will mainly control electric
heating and heat pumps. Real time pricing went live in May 2013.
Storm management
Prolonged periods of very high wind speed (above 25 m/s) present a problem for wind generators and the
system operator, as most wind turbines are designed to shut-down to protect equipment in these extreme
conditions. Shut down can be rapid and currently must either be replaced by significant ramp up of
conventional generation, storage or the use of demand response.
0
1
2
3
4
5
Dispatchsophistication and
maturity
VRE incentives anddispatch
Use of forecasting
System servicesmarket
Grid representation
Interconnectormanagement
Regulatorincentives on SO
Grid code
Start year Now

Integration of Variable Renewable Energy Volume II: Case studies
326641/TRD/EFR/5/e January 2015 Vol II: Case studies
44
In this pilot project, High Wind Ride Through (HWRT), as opposed to High Wind Shut Down (HWSD),
control capabilities were tested at a DONG Energy owned offshore wind farm of 91 Siemens turbines with
a combined capacity of 209 MW. Rather than complete shutdown at high wind speeds, HWRT control
gradually reduces power to reduce the system impact of a sudden loss of generation. In the demonstration
project, a storm event was observed on the 30 January 2013 (see Figure 6.7). During the period of
prolonged high wind speeds, the measured output from the wind farm reduced, but did not shut-down as it
would have done if using HWSD control.
Figure 6.7: High Wind Ride Through control provide more stability to grid
Source: Energinet.DK
Key message: High Wind Ride Through allows the wind farm to continue to generate at very high wind
speeds. This operational practice reduces the need for flexibility.
Power Hub – Virtual Power Plants demonstrations
Aggregators can combine Distributed Energy Resources (DER) and demand response resource into
Virtual Power Plants (VPPs) and optimise the operations of the VPP, given adequate control systems. This
allows the DERs (such as small scale hydro, wind turbines and CHP) and demand resources to access
ancillary services markets that would otherwise be too complex for them to operate in. The Power Hub
project involved 47 DER owners.
6.7 Lessons for other jurisdictions
The approach taken by Denmark to integrate its large amounts of wind (79 percent of peak demand) has
undoubtedly been to focus on maximising the potential of its interconnection (96 percent of peak demand)
through market coupling with Germany and the Nordic Region. Denmark has been able to do this due to a
combination of its geographical position, small size relative to its neighbours and the large amount of
flexible resource available in the neighbouring countries.

Integration of Variable Renewable Energy Volume II: Case studies
326641/TRD/EFR/5/e January 2015 Vol II: Case studies
45
In addition, Denmark has also implemented a number of market changes that have influenced VRE
integration. Requiring CHP to participate in the spot market, and introduced them into the balance markets,
opens up the potential to use hot water stores to provide some flexibility, though this is only relevant to
jurisdictions with significant CHP. However, this shows there are potential gains from coupling energy
sectors (for example heat and electricity). Negative pricing should provide additional incentives for storage
and demand response. Relaxing rules to make it easier for wind to participate in the regulating market
should also help VRE to self-integrate, particularly when wind capacity reaches high levels of penetration.

Integration of Variable Renewable Energy Volume II: Case studies
326641/TRD/EFR/5/e January 2015 Vol II: Case studies
46
7.1 Introduction
This chapter of the Volume II Case Studies report presents the case study for Germany. The information
gathered was based on:
questionnaire information received
telephone interviews with representatives from 50Hertz Transmission (50 Hertz Transmission is one of
the system operators in Germany).
Our thanks in particular are extended to 50Hertz Transmission for their assistance in compiling this
information.
7.2 Context
In Germany, there are four TSOs who own and operate the transmission system. These are Amprion,
Tennet TSO, 50Hertz Transmission and Transnet BW (see Figure 7.1).
Figure 7.1: Germany TSOs
Source: Renewables International
7 Germany

Integration of Variable Renewable Energy Volume II: Case studies
326641/TRD/EFR/5/e January 2015 Vol II: Case studies
47
Power system
Germany has a wide range of technology and fuel supplying the power system, none of which is overly
dominant (see Figure 7.2). The diversity of capacity in Germany gives the power system a certain amount
of flexibility.
Figure 7.2: Germany installed capacity
Source: Bundesnetzagentur13
Variable Renewable Energy
Germany is rightfully considered as a world leader in the development of both wind and solar PV. As of
October 2014, installed capacity of wind reached 35 GW (44 percent of peak demand) and installed
capacity of PV reached 38 GW (47 percent of peak demand). Combined installed capacity of VRE, as a
percentage of peak demand, is 90 percent – higher than any other jurisdiction in the study.
Germany has achieved this level of deployment through implementation of the renewable energy law
(EEG), in its various forms, with the main economic incentive being the Feed in Tariff (FiT) for both wind
and solar PV.
The geographical spread of the deployment of wind capacity has been mostly concentrated in the north of
the country, due to higher wind resource there. Conversely, and due to greater solar resource, PV capacity
is higher in the south of the country.
7.3 Challenges
We asked 50Hertz Transmission to rate the severity six discrete integration challenges (on a scale of 1 to
5, with 5 being most severe). The challenges we define are detailed in Volume I: Main Report.
Figure 7.3 presents 50Hertz’ perception of the severity of the challenges for Germany.
13 Figures are based on Fraunhofer compilations of Bundesnetzagentur Kraftwerkliste, available at http://www.ise.fraunhofer.de/en/renewable-energy-data, accessed November 2014
0% 50% 100% 150% 200% 250% 300%
Dispatchable
Variable
Capacity as percent of peak demand (81 GW)
Wind Solar Gas Hydro Coal Nuclear Oil Biomass Interconnection Storage

Integration of Variable Renewable Energy Volume II: Case studies
326641/TRD/EFR/5/e January 2015 Vol II: Case studies
48
Figure 7.3: 50Hertz perception of the challenges
Source: Mott MacDonald
It was reported to us that the high penetration of VRE on the distribution system (10-20 kV) means there is
usually a net demand in the distribution for reactive power in the distribution system. During periods of high
distributed generation (for example on a sunny summer’s day) the distribution system takes reactive power
from the transmission system, leading to power flow and or voltage control issues.
Congestion is reported to be a major issue, due to the concentration of wind generation in the north of the
country. Congestion is not so much of a concern for integrating solar on the transmission level, but it can
cause problems on the distribution level. However, if the installed capacity increases the vertical load flow
will decrease, resulting in a higher stressed transmission system.
Ramping in Germany poses a significant challenge (rated as a ‘5’ by 50Hertz). The large capacity of solar
PV in Germany means there is a large daily swing in VRE generations as PV production peaks midday and
generates nothing overnight (see Figure 7.4) – this has to be matched with flexibility in the conventional
plant and use of interconnectors. There is also an issue of unforeseen ramping due to weather conditions
such as the change in cloud cover – this can have implications on much shorter timescales. If large PV
plants stress the distribution grid under high ramping conditions, DSO are likely to limit ramping of PV
plants. Currently, ramping is mainly a challenge for the DNOs, as most of the solar generation is on the
distribution network. Another, more unique challenge will arise from the solar eclipse on 20th March 2015.
0
1
2
3
4
5Inertia
Reactive power
Transientstability
Congestion
Ramping
Supplyadequacy

Integration of Variable Renewable Energy Volume II: Case studies
326641/TRD/EFR/5/e January 2015 Vol II: Case studies
49
Figure 7.4: Germany summer generation profile in 2013
Source: Agora Energiewende
Key message: The generation of PV in Germany causes a significant ramping impact.
Supply adequacy was rated as a ‘5’, but qualified that it is not an immediate concern. However, there may
be cause for concern in the future. Germany is closing down its nuclear capacity (currently at 16 percent of
peak demand) in a phased process ending in 2022. The business case for gas power is suffering because
of high gas prices, CO2 prices and low electricity prices (caused in part by VRE). For example, Statkraft
announced the idling of two gas power stations (Knapsack and Herdecke) in 2013.
Transient stability and inertia were reported to be of low concern because of the high mesh grade of the
system.
7.4 Integration timeline
Germany has implemented a number of key policies in the electricity market that has had an effect on the
integration of VRE (see Figure 7.5).
Po
wer
gen
erat
ed

Integration of Variable Renewable Energy Volume II: Case studies
326641/TRD/EFR/5/e January 2015 Vol II: Case studies
50
Figure 7.5: Integration timeline
Source: Mott MacDonald
TSO collaboration – 2007, 2009: The German TSOs used to dispatch secondary reserves (used to
account for forecast errors in supply and demand and to restore frequency during contingencies)
independently of each other – leading to a situation in which TSOs would be calling reserve in opposite
directions. In 2008 three of the four TSOs implemented the Grid Control Cooperation (GCC) agreement,
which optimises the use of automatic reserves. The agreement was extended to include all TSOs. The
GCC was implemented in four stages14:
1. Netting of power imbalances to prevent counteracting reserve activation.
2. Common dimensioning of control reserve allowing TSOs access to commonly held reserve.
3. Common procurement of secondary reserve, allowing for competition between providers across the
whole of Germany.
4. Cost optimised activation of reserve on the basis of a German wide merit order for reserves.
14 https://www.regelleistung.net/ip/action/static/gcc
FiT reform – wind generation given the option of FiT or
premium
TSO collaboration – The four German TSOs agreed
the Grid Control Cooperation (GCC) to optimise use of automatic reserve.
Market coupling – Market coupling with France and
Benlux - allows faster trading cross-borders.
2007
2009VRE market dispatch– Equalisation Scheme Ordinance
- All EEG electricity to be sold by TSOs on spot market.
2010
2011
Grid code– New wind required to provide fault ride
through and control own frequency.
Grid code – Additional requirements for wind and PV
Grid expansion Law – Grid Expansion Law) -
aims to reduce permission process from 10 years to 4
Gate closure shortening – Shortened from 75 minutes to 45
minute in March. Programme unit times shortened to 15 minutes in December.
IGCC – Energinet joined IGCC in 2011. Dutch Tennet joined in 2012
Czech TSO CEPS joined in 2012. Belgian TSO Elia joined in 2012.
Grid code– Solar on 10kV to 110kV required to provide fault
ride-through
Storage incentives – €50 million funding scheme for private
household battery storage.
$Dispatch sophistication
System services market
Regulator incentives on SO
Grid representation
Use of forecasting
Interconnector management and market integration
Grid code
VRE incentives and dispatch
2014
IGCC – Austria joins IGCC.
2013
FiT reform – move to market premium over straight FiT

Integration of Variable Renewable Energy Volume II: Case studies
326641/TRD/EFR/5/e January 2015 Vol II: Case studies
51
The effect of these cooperation agreements has been to reduce the required amount of reserves used by
the TSOs (see Figure 7.6).
Figure 7.6: Use of secondary and tertiary reserves before and after TSO collaboration
Source: GE Energy
Key message: German TSOs reduced the required use of reserves by implementing a Grid Control
Cooperation agreement.
Market coupling – 2008, 2010, 2014: market coupling refers to the joining of two or more electricity
markets, and has been an ongoing process for Germany since the first attempt at market coupling with
Nordpool, via Denmark, in 2008. German and Danish markets were successfully coupled in October 2010
after the initial attempt was mired by IT problems (Utility Week, 2008). In November 2010, Germany
coupled with France and Benelux to create the Central Western Europe (CWE) coupling region, which also
coupled with the Nordic region in the same month. The North West Europe (NWE) coupling region was
created in February 2014 with the addition of Great Britain.
Before coupling, Available Transfer Capacity (ATC) (interconnection) was auctioned to market participants
(known as an explicit auction). Since market coupling, participants bid into their domestic exchanges, and
the exchanges then schedule ATC based on price differentials. This is called implicit auctioning (there is no
actual auctioning, but the auctions are implied in the bids and exchanges) and effectively means that any
of the participants within the whole coupled region can trade with each other, as long as the required
capacity is available. Implicit auctioning is more efficient at allocating ATC and prevents perverse situations
in which ATC flow is scheduled in opposition to the price differential.
Dispatch and reform of the EEG – 2009, 2011: The German FiT gave VRE generators a fixed price for
energy produced. The energy was not sold in the electricity market until in 2009 the Equalisation
Ordinance Scheme was implemented, which obliged the TSOs to resell all the VRE energy in the market.
In 2011, the FiT scheme was changed to give new and existing wind generators the choice of a FiT or
premium payment on top of the energy price. New rules in 2014 mean all new wind generators receive a
premium on the energy price, rather than the FiT.
0
100
200
300
400
500
600
700
800
Before After
Cap
acit
y (M
W)
Secondary - up
Secondary - down
Tertiary - up
Tertiary - down

Integration of Variable Renewable Energy Volume II: Case studies
326641/TRD/EFR/5/e January 2015 Vol II: Case studies
52
Grid expansion law – 2010: the grid expansion law, EnLAG, (which was complemented in 2013 by the
Bundesbedarfsplangesetz) aimed to give priority to north-south high voltage transmission line development
that is needed to relieve the congestion issues being faced, by reforming the approval process. The stated
goal is to reduce the approval time from 10-20 years to just 4 years. However, public opposition to the
expansion of the grid is the main barrier. Included in the grid expansion law are 24 priority projects in
varying stages of the approval process (see Figure 7.7).
Figure 7.7: Priority grid development in the Grid Expansion Law
Source: Federal Ministry for Economic Affairs and Energy
Key message: Grid expansion law is specifying a number of priority transmission lines to bring wind from
the north to the south

Integration of Variable Renewable Energy Volume II: Case studies
326641/TRD/EFR/5/e January 2015 Vol II: Case studies
53
Gate closure times shortening – 2011: Gate closure times (i.e. the last time a participant can update their
positions for operation before the TSO takes over dispatch) on the Germany intraday market were
shortened from 75 minutes to 45 minutes. Market participants should be able to make use of more
accurate forecasts at the reduced gate closure time, and so react better to changes in the supply/demand
balance.
International Grid Control Cooperation – 2011 to 2014: the German TSOs extended their Grid Control
Cooperation agreement to accept foreign TSOs, creating the International Grid Control Cooperation
(IGCC) agreement. The IGCC works in a similar way to the original GCC, in that the TSOs cooperate on
the use of secondary reserves, however, only step 1 – netting of imbalances – of the GCC (see above) has
been implemented in the IGCC. There are six IGCC members (in addition to the four German TSOs):
Energinet.DK, Denmark – joined in October 2011
Swissgrid, Switzerland – joined in 2012
Dutch Tennet, the Netherlands – joined in February 2012
CEPS, Czech Republic – joined in June 2012
Elia, Belgian – joined in October 2012
Austria – joined in 2014
For each international participant, the savings due to participation in the IGCC are estimated at €10 million
per year.
Storage incentives – 2013 and 2014: in May 2013, the Federal Ministry of the Environment and the Credit
Institution for Reconstruction launched a funding scheme of €50 million (for 2013 and 2014) to incentivise
battery storage in private households. The scheme provides a grant of up to €660/kW of PV output (up to
30 kW systems) for new solar PV systems with storage15. The scheme is now paid for by the Ministry for
Economic Affairs and Energy.
7.5 Frame conditions
The frame conditions, as defined in Volume I: Main Report, are key market, operational and regulatory
conditions of a power system that influence the ability of the power system to integrate high levels of VRE
now and in the future.
Dispatch sophistication: In Germany, the intraday market closes 45 minutes before operation (down from
75 minutes in 2011), and trades power in in 15 minute intervals. There are two price caps: Day Ahead
capped at €3,000/MWh, and intraday price capped at €9999/MWh. Negative pricing is allowed.
Incentives on VRE: Germany has moved to an optional Premium FiT, and about two thirds of existing
onshore capacity has opted for premium incentive scheme. Generators on the Premium FiT are exposed
to imbalance risk. There is full compensation for curtailment. Generators under the FiT receive the
management premium.
Use of forecasting: TSOs procure their own independent day ahead and intraday forecasts. FIT rules
require TSOs to purchase VRE energy from (some) generators and sell this into the market, so forecasts
are used to inform these positions as well as making security assessments.
15 http://www.energy-storage-online.com/cipp/md_energy/lib/all/lob/return_download,ticket,g_u_e_s_t/bid,682/no_mime_type,0/~/E_PM_BVES_F%C3%B6rderung_E_Speicher.pdf
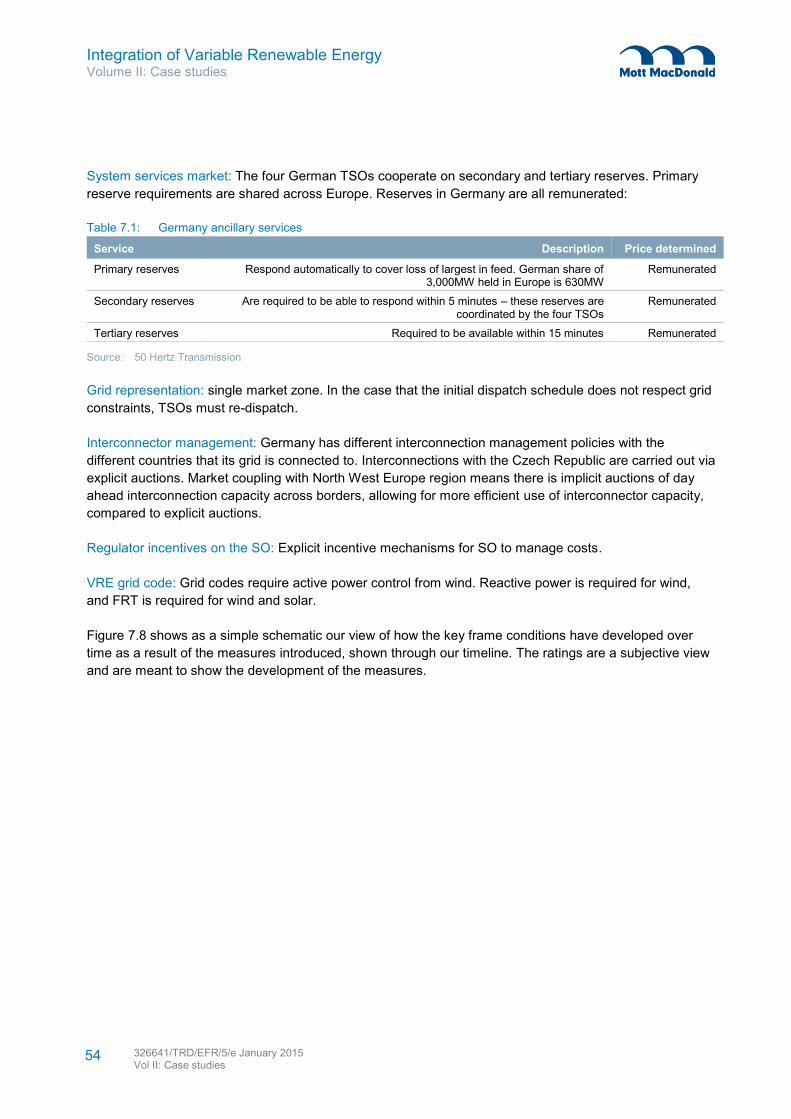
Integration of Variable Renewable Energy Volume II: Case studies
326641/TRD/EFR/5/e January 2015 Vol II: Case studies
54
System services market: The four German TSOs cooperate on secondary and tertiary reserves. Primary
reserve requirements are shared across Europe. Reserves in Germany are all remunerated:
Table 7.1: Germany ancillary services
Service Description Price determined
Primary reserves Respond automatically to cover loss of largest in feed. German share of 3,000MW held in Europe is 630MW
Remunerated
Secondary reserves Are required to be able to respond within 5 minutes – these reserves are coordinated by the four TSOs
Remunerated
Tertiary reserves Required to be available within 15 minutes Remunerated
Source: 50 Hertz Transmission
Grid representation: single market zone. In the case that the initial dispatch schedule does not respect grid
constraints, TSOs must re-dispatch.
Interconnector management: Germany has different interconnection management policies with the
different countries that its grid is connected to. Interconnections with the Czech Republic are carried out via
explicit auctions. Market coupling with North West Europe region means there is implicit auctions of day
ahead interconnection capacity across borders, allowing for more efficient use of interconnector capacity,
compared to explicit auctions.
Regulator incentives on the SO: Explicit incentive mechanisms for SO to manage costs.
VRE grid code: Grid codes require active power control from wind. Reactive power is required for wind,
and FRT is required for wind and solar.
Figure 7.8 shows as a simple schematic our view of how the key frame conditions have developed over
time as a result of the measures introduced, shown through our timeline. The ratings are a subjective view
and are meant to show the development of the measures.

Integration of Variable Renewable Energy Volume II: Case studies
326641/TRD/EFR/5/e January 2015 Vol II: Case studies
55
Figure 7.8: Germany frame conditions
Source: Mott MacDonald
Key message: Germany has focused on developing interconnector management (through European
Market Coupling), dispatch sophistication and grid codes.
7.6 Potential developments
While there is no firm policy decision yet made on the matter, there is consideration in the German
government, regulatory authority and the power industry about the implementation of a capacity
mechanism in order to ensure medium term supply adequacy. In 2013, The Power Plant Forum16
published a discussion paper called “Ensuring sufficient generation capacity over the medium to long
term”17 which presents three options:
1. Do nothing and allow scarcity pricing to provide the investment signal for future capacity.
2. Introduce ‘Strategic Reserve’, capacity which would be procured by the TSOs outside the energy
market to provide additional energy in the event of a power shortage (and in the event of being used
for re-dispatch). The aim would be to use this as a transitional stage, procuring limited new and existing
capacity (~4GW).
16 The power plant forum was set up in 2011 by the Federal Ministry of Economics and Technology as a platform for the government, regulatory authority, power industry and environmental organisation to discuss future energy security issues
17 http://www.bmwi.de/English/Redaktion/Pdf/report-of-the-power-plant-forum,property=pdf,bereich=bmwi2012,sprache=en,rwb=true.pdf
0
1
2
3
4
5
Dispatchsophisticationand maturity
VRE incentivesand dispatch
Use offorecasting
System servicesmarket
Gridrepresentation
Interconnectormanagement
Regulatorincentives on SO
Grid code
Start year Now

Integration of Variable Renewable Energy Volume II: Case studies
326641/TRD/EFR/5/e January 2015 Vol II: Case studies
56
3. Full capacity mechanism for a long term market framework, in which power generator owners would be
remunerated based on capacity. This could take either a centralised procurement form, or
decentralised tradable ‘capacity certificate’ form.
Recommendations of the paper are to monitor supply security, simulate the market and model the impacts
of different solutions, investigate legal and regional (European) compatibility and to develop grid reserve
(short term contracts for reserve power) as a temporary solution.
7.7 Lessons for other jurisdictions
Germany’s most successful developments appear to be the cultivation of an environment for cooperation,
both in terms of the energy market (through market coupling) and in the balancing and reserve markets, for
which Germany led the way through its International Grid Control Cooperation. Through cooperation,
Germany has made efficiency gains which could reduce the costs of VRE integration. This approach is
most relevant for jurisdictions with a significant amount of (or potential for) interconnection with other
jurisdictions (or one large one).
In addition to cooperation, Germany is gradually exposing VRE generators to the market, first by requiring
TSOs to sell VRE energy into the market and second by moving to replacing the FiT scheme with a
premium on top of the wholesale price. We would expect that this increasing market exposure will
influence developer behaviour to build out a more geographically diverse and system friendly VRE portfolio
in response to price signals (as appear to be happening in Alberta). However, we have not seen evidence
to suggest this is happening yet.

Integration of Variable Renewable Energy Volume II: Case studies
326641/TRD/EFR/5/e January 2015 Vol II: Case studies
57
8.1 Introduction
This chapter of the Volume II Case Studies report presents the case study for Great Britain (GB). The
information gathered was based on a literature search and information provided by various stakeholders,
most notably National Grid (National Grid is the system operator for Great Britain) via questionnaire
responses, interviews and email exchanges.
8.2 Context
Power system
GB has a diverse fuel supply to meet its 57 GW peak demand (see Figure 8.1). Gas has the highest
installed capacity (at 56 percent of peak demand), followed by coal (39 percent). Nuclear currently makes
up around 16 percent of peak demand, and hydro about 8 percent. Interconnection (at 8 percent of peak
demand) is with Ireland, the Netherlands and France. All interconnectors are HVDC, and so GB is a
synchronously independent power system. Storage capacity of 5 percent of peak demand is all pumped
storage hydro.
Figure 8.1: Installed capacity in GB as a percentage of peak demand (57 GW)
Source: National Grid 10 year statement for peak demand and VRE capacity, November 2013 and DECC for installed dispatchable
capacity March 2013
Variable Renewable Energy
Installed capacity wind generation in GB was about 10.2 GW in 2013 (Offshore accounts for about 3.6
GW). This represents approximately 19 percent of peak demand. Installed solar PV is at almsot 2 GW in
2013 (~4 percent of peak demand)18.
18 Installed capacity according to National Grid’s 2013 Ten Year Statement, available at http://www2.nationalgrid.com/UK/Industry-information/Future-of-Energy/Electricity-ten-year-statement/Current-statement/ accessed 19.11.2014
0% 20% 40% 60% 80% 100% 120% 140% 160% 180%
Dispatchable
Variable
Capacity as percent of peak demand (57 GW)
Wind Solar Gas Hydro Coal Nuclear Oil Biomass Interconnection Storage
8 Great Britain
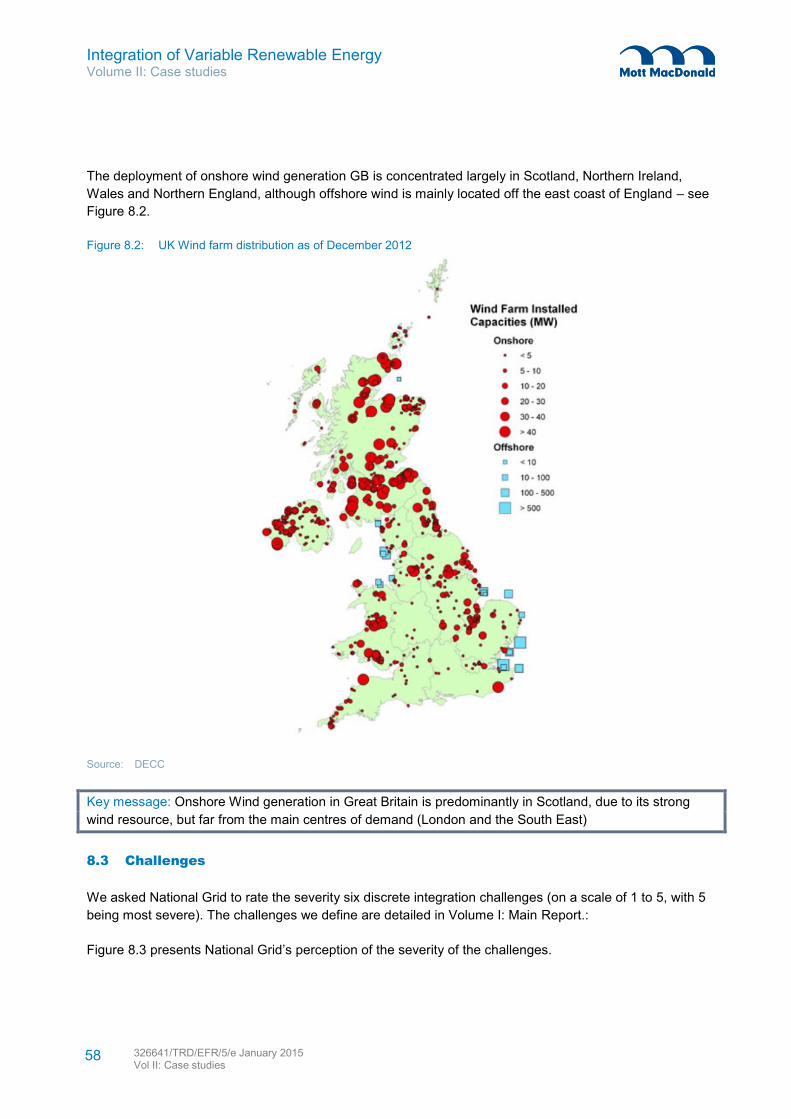
Integration of Variable Renewable Energy Volume II: Case studies
326641/TRD/EFR/5/e January 2015 Vol II: Case studies
58
The deployment of onshore wind generation GB is concentrated largely in Scotland, Northern Ireland,
Wales and Northern England, although offshore wind is mainly located off the east coast of England – see
Figure 8.2.
Figure 8.2: UK Wind farm distribution as of December 2012
Source: DECC
Key message: Onshore Wind generation in Great Britain is predominantly in Scotland, due to its strong
wind resource, but far from the main centres of demand (London and the South East)
8.3 Challenges
We asked National Grid to rate the severity six discrete integration challenges (on a scale of 1 to 5, with 5
being most severe). The challenges we define are detailed in Volume I: Main Report.:
Figure 8.3 presents National Grid’s perception of the severity of the challenges.

Integration of Variable Renewable Energy Volume II: Case studies
326641/TRD/EFR/5/e January 2015 Vol II: Case studies
59
Figure 8.3: National Grid’s perception of the challenges19
Source: Mott MacDonald
It is reported that inertia, ramping, congestion and supply adequacy as the main issues. Inertia is seen as
being a key issue because GB is a synchronously independent system; the interconnections with Europe
and Ireland are DC, so inertia cannot be shared. Congestion is also an issue, due to the majority of the
wind (in Scotland) being located far from the load centres (London and the South East), although the
commissioning of the western “bootstrap” is expected to alleviate this in 2015-16. Supply adequacy is a
key concern due to the expected decommissioning of a number of coal power plants, and steps to
introduce a capacity market (discussed in Section 8.6), as part of the Electricity Market Reform (EMR), are
being taken.
8.4 Integration timeline
Great Britain has implemented a number of key policies in the electricity market that has had an effect on
the integration of VRE (see Figure 8.4).
19 Answers are forward looking
0
1
2
3
4
5Inertia
Reactive power
Transientstability
Congestion
Ramping
Supplyadequacy

Integration of Variable Renewable Energy Volume II: Case studies
326641/TRD/EFR/5/e January 2015 Vol II: Case studies
60
Figure 8.4: GB Integration timeline
Source: Mott MacDonald
NETA introduced – 2001: New Electricity Trading Arrangements introduced to replace the electricity pool
with bilateral trading through contracting parties or power exchanges.
Renewable Obligation – 2002: Renewables Obligation (RO), a quota and tradable green certificate
scheme, introduced to replace the Non Fossil Fuel Obligation (a central tendering scheme). The RO
requires electricity suppliers to source a target percentage of their sales from renewable generators (which
increases each year). This is done by purchasing Renewable Obligation Certificates (ROCs) or paying a
penalty. Generators receive an income from both ROCs and the sale of electricity; whether directly in the
wholesale market or through Power Purchase Agreements (PPAs). This provides an incentive to
encourage renewables deployment, but also exposes the generators and developers to the wholesale
electricity market.
NETA introduced – NETA replaces pool in
market reforms that include the introduction of negative pricing.
RO – Renewables Obligation established as a green
certificate trading scheme to support renewables deployment.
BALIT mechanism – Introduced to allow
interconnection with France to be used for balancing.
2001
2006
Grid codes amendments – specific conditions
in the grid code relating to variable renewable energy generators.
2010
2014
Connect and manage – Allows wind farms to
connect before system reinforcements are complete, subject to adequate constraint management.
NWE coupling – Coupling of the Day Ahead
markets in the North West European region to use interconnection more efficiently.
2009
$Dispatch sophistication
System services market
Regulator incentives on SO
Grid representation
Use of forecasting
Interconnector management and market integration
Grid code
VRE incentives and dispatch
New balancing mechanisms – National Grid made
an application to regulator for new balancing services –currently in consultation.
SO forecast incentive mechanism – Incentive
scheme introduced to encourage National Grid to reduce forecast error.
$
2013
2002

Integration of Variable Renewable Energy Volume II: Case studies
326641/TRD/EFR/5/e January 2015 Vol II: Case studies
61
Grid code amendments – 2006: In practice Grid Codes have been amended on an almost yearly basis
since 1990. In terms of obligations for VRE generators these have included FRT, reactive power and
frequency response, with most significant tightening in standards being implemented in mid 2000s.
Connect and manage – 2009: Connect and Manage arrangements were introduced in 2009 to allow wind
farms to be connected to the transmission system ahead of transmission system reinforcements required
under the National Electricity Transmission System Security and Quality Supply Standards (NETS SQQS).
This allows for fast connection of renewable electricity generators. Total renewables capacity connected
under the scheme since October 2010 has been 1.19 GW – wind accounts for almost 1072 MW (solar PV
is not included). The total attributable costs to the Connect and Manage scheme since it started is
£48.6million, mostly due to additional network constraints20.
BALIT mechanism – 2010: In 2009/10, Great Britain introduced the BALIT mechanism which allows
interconnection capacity to be used for balancing. Transmission system operators exchange prices to
change the transfer across the interconnection between jurisdictions. The firm price is exchanged day
ahead and exchanges can happen during the operating hour. The prices for exchanged have to be costs
reflective (TSO cannot profit from the exchange) and the service can be withdrawn if system security is at
risk. Cost saving in 2009/10 was estimated by National Grid to be £34 million.
SO forecast incentive mechanism – 2013: National Grid publishes its own Day Ahead wind generation
forecast which is used to inform operating reserve requirements and system security and stability
assessments. In 2013, the wind forecast incentive mechanism was introduced to encourage National Grid
to achieve a reduction in forecast error21.
The incentive has set four targets, winter and summer for both 2013/14 and 2014/15, based on the Mean
Absolute Error (MAE)22 – see Table 8.1. National Grid can gain £250k per month by achieving 0 percent
error, or lose £250k if the MAE is double the target.
Table 8.1: National Grid wind forecast error targets
Year Summer MAE target (%) Winter MAE target (%)
2013/14 6.25 4.75
2014/15 6.00 4.50
Source: National Grid
NWE coupling – 2014: In February 2014, Day Ahead price coupling of the North West European (NWE)23
market was launched by the TSOs and exchanges to increase the efficiency of use of interconnector
capacity. The price coupling works by using a single algorithm (called ‘Euphemia’) to simultaneously match
energy supply and demand and net position of the bidding areas, taking into account network constraints.
20 See “Connect and Manage Outturn Interim Reports”, available at < http://www2.nationalgrid.com/UK/Services/Electricity-connections/Industry-products/connect-and-manage> accessed 20.8.2014
21 See <http://www2.nationalgrid.com/UK/Industry-information/Electricity-system-operator-incentives/Wind-Generation-Forecasting/>
22 The Mean Absolute Error is an average of all the absolute errors
23 The NWE area covers the Nordic region (Denmark, Finland, Norway, Sweden), Great Britain and the Continental West Europe region (Belgium, France, Germany, Luxemburg and the Netherlands)

Integration of Variable Renewable Energy Volume II: Case studies
326641/TRD/EFR/5/e January 2015 Vol II: Case studies
62
Price coupling represents a change from explicit day ahead auctioning of interconnection capacity between
GB and France to implicit Day Ahead auctions24.
New balancing mechanisms – 2014: National Grid made a request to Ofgem (the electricity and gas
market’s regulator in the UK) to launch two new balancing services in order to ensure sufficient generation
adequacy in the interim period before the capacity market is implemented.
8.5 Frame conditions
The frame conditions, as defined in Volume I: Main Report, are key market, operational and regulatory
conditions of a power system that influence the ability of the power system to integrate high levels of VRE
now and in the future.
Dispatch sophistication: The intraday market closes one hour ahead of operation, after which the balancing
market takes over. Dispatch instructions are not limited by settlement boundaries and so can be
generators instructed at any time. There are no caps on market prices, and negative pricing is allowed.
Incentives on VRE: The main incentive mechanism in place in the UK for wind and large solar (>5MW) is
the Renewables Obligation (RO) which is similar to a premium FiT, so generators are partially exposed to
wholesale electricity price. In the event of curtailment VRE generators receive the price at which they bid
(not necessarily the corresponding energy price), but lose the value of the ROC. VRE generators that
receive the ROC are fully exposed to imbalance risk.
Use of forecasting: National Grid, the System Operator, publishes Day Ahead forecasts which are used to
in the calculation for special wind reserve requirements and to assess security and stability conditions.
Operators in the control also get wind generation forecast four hours ahead which is used to inform reserve
requirements.
System services market: National Grid, deploys over a dozen different system services many of which are
procured through tendering and other market mechanisms. The key services are summarised in Table 8.2.
In addition, NG also participates in the energy market as a way of mitigating overall system balancing
costs. Typically, NG will contract for energy from flexible generators that can be cheaply de-loaded in the
balancing mechanism.
Table 8.2: Main GB balancing services
Service Description Price determined
Frequency Response
Two services: 1/ Dynamic (automatic governor) response
2/ Non-dynamic, response triggered by frequency collapse
Dynamic response paid on regulated basis. Non-dynamic response paid on tender basis
Fast Reserve Active power response (to manual instruction) within 2 mins and sustained for 2-15 mins
Marginal prices - called on a tender basis
Short term operating reserve (STOR)
Active power response (to manual instruction) within 20mins to 2 hours and sustained for 2 hours
Marginal prices - called on a tender basis
Reactive Power National Grid manages voltage levels on a local level by calling upon injections or withdrawals of reactive power.
Minimum levels of RP response are mandatory, enhanced offers called on tender basis
Source: National Grid
24 See “Charging Methodology Statement for the Anglo-French Interconnector” available at < https://www.ofgem.gov.uk/ofgem-publications/83545/england-franceinterconnectorifachargingmethodology.pdf> accessed 20.8.2014

Integration of Variable Renewable Energy Volume II: Case studies
326641/TRD/EFR/5/e January 2015 Vol II: Case studies
63
Grid representation: There is no market representation of grid constraints. However, transmission network
use of system charges are differentiated by region (based on 23 and 18 zones for generation and load,
respectively).
Interconnector management: Since the introduction of NEW coupling in early 2014, interconnector capacity
between Great Britain and France is through Day Ahead implicit auctions. Interconnector capacity with
Ireland is scheduled through long term and ad hoc agreements between the Systems Operators and there
are no auctions. Interconnectors can be used for balancing.
Regulator incentives on the SO: National Grid is subject to explicit incentive mechanisms set by the
regulatory authority (Ofgem). These take the form of sliding scale cost targets whereby the NG is rewarded
if it achieves better than the target and bares a loss if the outturn is worse. Similar arrangements have
been applied for over 15 years. Ofgem is currently consulting on how to sharpen these incentives and
introduce wider performance based regulation.
VRE grid code: Grid codes specify FRT, reactive power conditions and frequency response for wind and
solar. Synthetic inertia provision by wind generators is currently being considered.
Figure 8.5 shows as a simple schematic our view of how the key frame conditions have developed over
time as a result of the measures introduced, shown through our timeline. The ratings are a subjective view
and are meant to show the development of the measures.
Figure 8.5: GB frame conditions
Source: Mott MacDonald
Key message: Great Britain has developed measures for interconnector management (market coupling
and the BALIT mechanism), grid codes and in the use of forecasting (using forecasting to inform reserve
requirements).
0
1
2
3
4
5
Dispatchsophisticationand maturity
VRE incentivesand dispatch
Use offorecasting
System servicesmarket
Gridrepresentation
Interconnectormanagement
Regulatorincentives on
SO
Grid code
Start year Now

Integration of Variable Renewable Energy Volume II: Case studies
326641/TRD/EFR/5/e January 2015 Vol II: Case studies
64
8.6 Potential developments
The UK electricity sector is currently subject to considerable changes in the form of a package of measures
called Electricity Market Reform (EMR) and several other changes most notably relating to the balancing
prices and transmission use of system pricing. All this may significantly influence the investment and
operational decisions of market participants so therefore will indirectly impact on VRE integration
challenges.
Two key developments that are part of EMR are the replacement of the RO with a ‘Contracts for
Difference’ (CfD) scheme, and the implementation of a Capacity Market.
Contracts for Difference
Contracts for difference are being introduced from 2015, and will provide long term fixed price off-take
cover for new low carbon generation. Generators with still need to trade their energy and bear imbalance
risks however they will get a difference payment (normally a top-up) that will mean their total earnings will
be close to the agreed strike price. This translates into a lower cost of capital for CfD supported projects
versus ROC supported which should lead to a higher level of VRE deployment. VRE generators will
continue to be exposed to balancing risks, so will remain incentivised to dispatch close to their contracted
position, which will in fact see an enhanced incentive to balance, under the regulators’ proposed cash out
price reform – see below.
Capacity Markets
The UK will plans to introduce a capacity market that ensure sufficient capacity by winter 2018/19. The
market will be run as an undifferentiated auction four years ahead (T-4), with a year ahead (T-1) auction for
fine tuning. The T-4 will be able to award 15-year contracts to new capacity, while legacy plant will have
annual contracts. Even though there will be no explicit reward for flexibility services, this capacity market is
expected to incentivise an increased contribution from distributed generation and demand side response in
energy and reserve markets, as capacity costs will be largely underwritten.
New balancing mechanisms and transitional arrangements
Ofgem is close to ruling on new arrangements for cash out pricing in the balancing mechanism. The main
measures will be a move towards more marginal pricing for imbalances based on a single imbalance price
(versus the current dual price arrangement) and rule change that parties with imbalances which are
counter to the system position will not be penalised. This is likely to sharpen the incentive on all generators
to minimise their imbalance positions.
The regulator has also granted powers to the GB system operator to introduce two new transitional
balancing services which are meant to provide incentive for reserve capacity before the implementation of
the capacity market takes effect in 2018/19.
The first is the Demand Side Balancing Reserve (DSBR) which is to incentivise large energy users to
reduce demand for grid electricity during winter peak hours, either by reducing demand or by increasing
output from their own generators. The second is Supplemental Balancing Reserve (SBR), which is
proposed to support National Grid in balancing as the capacity margin is expected to tighten during this
decade (as coal plants come off-line and reduce hours due to the Industrial Emissions Directive). SBR will
provide an incentive to bring power stations back into the market from being closed or mothballed.

Integration of Variable Renewable Energy Volume II: Case studies
326641/TRD/EFR/5/e January 2015 Vol II: Case studies
65
Power station owners will contract with National Grid to provide SBR but will not be able to participate in
the electricity market or other balancing markets. National Grid will have direct control of the power station,
and will dispatch as a last resort in the event that generation is insufficient to meet demand.
National Grid is expected to run tenders for both DSBR and SBR in autumn 2014 and early 2015 for 1,800
MW for the winter of 2015/16. Additionally, there will be a further tender for 1,300 MW for the winter of
2016/17 and 800 MW for the winter of 2017/18, after which the capacity market is expected to provide the
required incentive25.
Another reform that is coming is an expected change in the transmission network use of system (TNUoS)
pricing, which is expected to introduce greater cost reflectivity in these grid tariffs, while at the same time
shifting a greater burden to the load versus generation. This lower weighting on the generation side may
result in a weaker incentive for transmission connected capacity to locate in regions will easier grid access,
however it should simultaneously provide a much reinforced incentive for DSR and embedded generation
located in areas with transmission bottlenecks.
Power Networks Joint Vision: The Institution of Engineering and Technology, is co-ordinating a cross
industry and academic study into developing a “whole system” approach to adapting GB’s power grid for
decarbonisation, with a “systems architect” at the helm. The study is to review experience overseas and
across sectors with comparable complex system management issues. A final report is scheduled for
Q4:2014.
8.7 Lessons for other jurisdictions
Great Britain provides a number of lessons for other jurisdictions, mainly through innovative approaches to
the application of integration measures.
Regulatory incentives on system operator: GB has a long standing policy of setting explicit targets for NG
in its system operation activities. These mechanisms, which provide a financial incentive for NG to beat its
cost targets are thought to have led NG to seek ways of reducing balancing (including constraints) costs.
For these arrangements to work effectively, the regulator needs to be well informed and astute in its
negotiations.
Bootstraps to ease congestion: NG has taken a significant precedent by developing a major off-shore west
coast HVDC transmission line to by-pass the main North-South grid bottleneck in GB. This eased
consenting risks and reduced the project schedule time compared with the alternative of overhead lines
and underground cables. This so-called “bootstrap” is the first of a planned pair, the second of which will
be on the east coast. While these two schemes will effective remove NG’s internal grid constraints, the
integration of these new HVDC line (both ends of which will be connected to the synchronous system) may
present some challenges for NG in operating its transmission system. Resolution of these issues should
provide further lesson to other systems considering similar internal grid reinforcement.
SO participation in energy markets: National Grid is one of the few system operators, which trades in the
day ahead and intraday energy market as a way of managing balancing risks. It has been doing this for
more than a decade and reports that this brings significant gains over the cost of its trading operation.
Market players and the regulator have long been confident that NG has not abused its market position.
25 For both Demand Side Balancing Reserve and Supplemental Balancing Reserve, see <http://www2.nationalgrid.com/UK/Industry-information/Electricity-system-operator-incentives/Wind-Generation-Forecasting/> accessed 20.8.2014

Integration of Variable Renewable Energy Volume II: Case studies
326641/TRD/EFR/5/e January 2015 Vol II: Case studies
66
Capacity market: While GB is not the first jurisdiction to implement capacity markets, it will be the first
capacity auction to include long term contracts for new generating capacity. It is also setting aside a
significant tranche of capacity for demand side response and embedded generation that will be auctioned
closer to the delivery year. It will also have among the most punitive penalty clauses for contracted
capacity that fails to deliver after a 4 hour notice period.
BALIT mechanism: This SO-to-SO trading arrangement between NG and RTE (the French SO) does not
represent the state-of-the-art in terms of trading balancing energy between systems, however it provides a
demonstration of the first step in balancing trading between two jurisdictions.

Integration of Variable Renewable Energy Volume II: Case studies
326641/TRD/EFR/5/e January 2015 Vol II: Case studies
67
9.1 Introduction
This chapter of the Volume II Case Studies report presents the case study for Ireland. The information
gathered was based on:
questionnaire information received
subsequent email and telephone exchange with EirGrid
face to face meeting with representatives of EirGrid
communications with the Sustainable Energy Authority of Ireland (SEAI)
9.2 Context
The Irish power system is operated by EirGrid (Republic of Ireland) and the System Operator of Northern
Ireland (SONI). While there are two system operators, there is a single market, operated by the Single
Electricity Market Operator (SEMO).
Power system
The island of Ireland’s portfolio of dispatchable plant can be considered as flexible as there is a high
proportion of gas, hydro and oil and no nuclear. However, most gas plants have a high minimum stable
generation (around 50 percent), which could impact wind integration. Interconnection is limited to two DC
ties with Great Britain, the Moyle interconnector26 and the East-West interconnector, with a combined
capacity of 750MW, and so Ireland is relatively isolated and synchronously independent.
Figure 9.1: Installed capacity of the All Island system
Source: EirGrid and SEAI27
26 Mutual Energy, owner and operator of the Moyle interconnector, reports that the connector is currently operating at 250 MW (half of its design capacity) due to technical faults that are not expected to be resolved until 2016/17
27 Figures based on Eirgrid ‘All-Island Renewable Connection Report Q3 2014” (available at http://www.eirgrid.com/media/All_Island_Renewable_Connection_Report_36_Month_Forecast__(Q4_2013).pdf) and SEAI “Energy in Ireland 2012” (available at http://www.seai.ie/Publications/Statistics_Publications/)
0% 20% 40% 60% 80% 100% 120% 140% 160% 180% 200%
Dispatchable
Variable
Capacity as percent of peak demand (6.9 GW)
Wind Solar Gas Hydro Coal Oil Peat, waste and biomass Interconnection Storage
9 Ireland
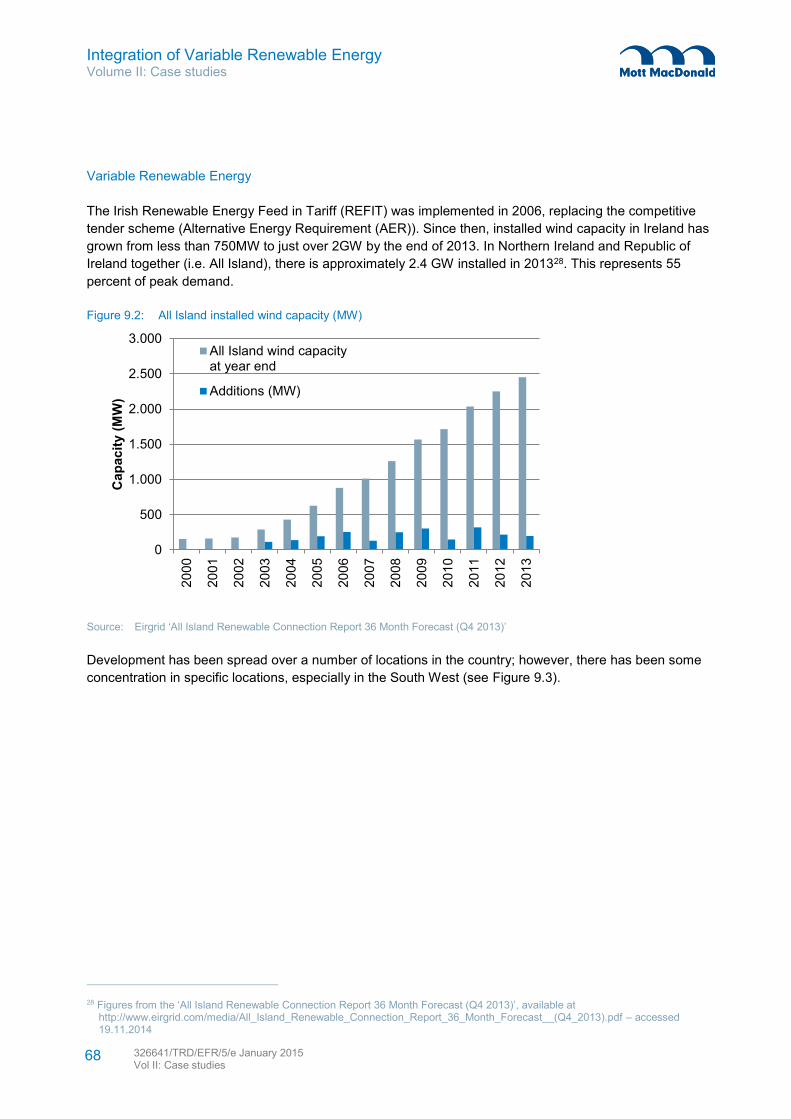
Integration of Variable Renewable Energy Volume II: Case studies
326641/TRD/EFR/5/e January 2015 Vol II: Case studies
68
Variable Renewable Energy
The Irish Renewable Energy Feed in Tariff (REFIT) was implemented in 2006, replacing the competitive
tender scheme (Alternative Energy Requirement (AER)). Since then, installed wind capacity in Ireland has
grown from less than 750MW to just over 2GW by the end of 2013. In Northern Ireland and Republic of
Ireland together (i.e. All Island), there is approximately 2.4 GW installed in 201328. This represents 55
percent of peak demand.
Figure 9.2: All Island installed wind capacity (MW)
Source: Eirgrid ‘All Island Renewable Connection Report 36 Month Forecast (Q4 2013)’
Development has been spread over a number of locations in the country; however, there has been some
concentration in specific locations, especially in the South West (see Figure 9.3).
28 Figures from the ‘All Island Renewable Connection Report 36 Month Forecast (Q4 2013)’, available at http://www.eirgrid.com/media/All_Island_Renewable_Connection_Report_36_Month_Forecast__(Q4_2013).pdf – accessed 19.11.2014
0
500
1.000
1.500
2.000
2.500
3.000
20
00
20
01
20
02
20
03
20
04
20
05
20
06
20
07
20
08
20
09
20
10
20
11
20
12
20
13
Cap
acit
y (
MW
)
All Island wind capacityat year end
Additions (MW)

Integration of Variable Renewable Energy Volume II: Case studies
326641/TRD/EFR/5/e January 2015 Vol II: Case studies
69
Figure 9.3: Ireland wind farms above 10MW (approximately 80 percent of capacity) as of 2013 (Republic of Ireland
only)
Source: Mott MacDonald
Key message: wind capacity in Ireland Is fairly evenly distributed, though there is some concentration in
the south west of the country.
9.3 Challenges
We asked EirGrid to rate the severity of six discrete integration challenges (on a scale of 1 to 5, with 5
being most severe). The challenges we define are detailed in Volume I: Main Report.
Figure 9.4 presents EirGrid’s perception of the severity of the challenges.
>30 MW
>10 MW

Integration of Variable Renewable Energy Volume II: Case studies
326641/TRD/EFR/5/e January 2015 Vol II: Case studies
70
Figure 9.4: EirGrid perception of the challenges
Source: Mott MacDonald
EirGrid responded with their perception of how the challenges are likely to progress in the coming years.
The main concern is inertia, this is because they are synchronously independent and wind power cannot
provide inertial response in the same way as conventional generation, leading to stability issues. EirGrid
use an operational limit call the System Non-Synchronous Penetration (SNSP), which is effectively the
penetration of wind and DC imports on the system. The SNSP limit is currently 50 percent, which has been
set due to inertia concerns. EirGrid report that reactive power, ramping and transient stability not currently
a concern, though are expected to be in coming years as they increase the installed capacity of wind.
Congestion issues are expected to fall away as an issue over time as grid upgrades are implemented.
9.4 Integration timeline
Ireland has implemented a number of key policies in the electricity market that has had an effect on the
integration of VRE (see Figure 9.5).
0
1
2
3
4
5Inertia
Reactive power
Transient stability
Congestion
Ramping
Supply adequacy
2014 2018 2022

Integration of Variable Renewable Energy Volume II: Case studies
326641/TRD/EFR/5/e January 2015 Vol II: Case studies
71
Figure 9.5: Ireland integration timeline
Source: Mott MacDonald
Grid code – 2003 & 2005: Grid code requirements for wind turbines were first developed in 2003, and were
a world first in specifying requirements for reactive power and active control requirements. In 2005, these
requirements were tightened in anticipation of increasing levels of wind penetration on the system.
REFIT – 2006: The Renewable Energy Feed in Tariff (REFIT) replaced the Alternative Energy
Requirement (AER); a competitive tender scheme. The REFIT was introduced to better enable larger scale
deployment. The REFIT provides a regulated, guaranteed price for VRE developers, reducing market
exposure.
SEM – 2007: The Single Electricity Market (SEM) was implemented in 2007, joining the Northern Ireland
and Republic of Ireland electricity markets. The market is operated by the Single Electricity Market
Operator (SEMO). The unified market should operate more efficiently and reduce the costs (as compared
to business as usual) of wind integration.
Grid code – Introduction in 2003 of special grid
code for wind generators – specifying FRT, reactive power and active power control requirements
SEM – Single Electricity market established – joining
the markets of the Republic of Ireland and Northern Ireland
Grid 25 – project to coordinate the development of
transmission and distribution system to 2025.
2003
2005
2011
Grid code – Major revamp of grid code increases
requirements in all areas
2007
System services review – ongoing review of system
services – Eirgrid has proposed five new services in recognition of changing environment due o high levels of wind generation.
2010
Grid development plans – National
development plan for 2007-2013
$Dispatch sophistication
System services market
Regulator incentives on SO
Grid representation
Use of forecasting
Interconnector management and market integration
Grid code
VRE incentives and dispatch
DS3 programme – performance, operational policy and
system tools plan to introduce the capability to operate the power system at high levels of wind.
WSAT – Wind Security Assessment Tool assesses real-
time stability of grid based on a number of variables
2012
Forecasting – Upgrade of forecasting tools and
transfer from Eirgrid to independent service provider
REFIT – new FiT scheme replaces competitive tender (AER)
2006
Integration of Variable Renewable Energy Volume II: Case studies
326641/TRD/EFR/5/e January 2015 Vol II: Case studies
72
WSAT – 2010: The Wind Security Assessment Tool (WSAT) was developed jointly by EirGrid and Power
tech labs. The WSAT takes real-time data from monitored wind turbines on the system to assess voltage
and transient stability. This helps grid operators maximise wind generation while maintaining system
security.
Grid 25 – 2010: Grid 25 is an infrastructure initiative to coordinate grid investment, with a view to 2025.
There is an estimated €4 billion, in the Republic of Ireland, required investment in the grid infrastructure to
accommodate the planned VRE development by 2025.
System services review – 2012: EirGrid proposed additional ancillary service products, including System
Inertial Response (SIR) and Fast Frequency Response (FFR) – detailed further in section 9.7. Part of the
DS3 programme which aims to deliver a secure, sustainable power system29
9.5 Frame conditions
The frame conditions, as defined in Volume I: Main Report, are key market, operational and regulatory
conditions of a power system that influence the ability of the power system to integrate high levels of VRE
now and in the future.
Dispatch sophistication: EirGrid (and SONI in Northern Ireland) operate a centralised dispatch of power
plants, controlled in the National Control Centre. The intraday market gate closure is 6 hours ahead of
operation. Market price is capped at €1,000/MWh and negative prices, down to – €100/MWh, are allowed.
Incentives on VRE: VRE generators receive a fixed payment under the REFIT scheme, which replaced the
competitive tender in 2006. There is partial compensation for curtailment - generators receive 100 percent
of market price but no support price. The newest generators are curtailed first, encouraging developers to
consider curtailment risk of new projects. VRE generators are not exposed to imbalance risk.
Use of forecasting: Wind forecasting is used in scheduling.
System services market: Table 9.1 shows the ancillary services in Ireland:
Table 9.1: Ireland ancillary services
Service Description Price determined
Frequency containment Reserve held in case of generation trip Regulated payments
Operating reserve Includes primary, secondary and tertiary reserves that are able to respond to frequency variations in varying time periods
Regulated payments
Replacement reserve Reserve to replaced lost generation from 20 minutes after an event, or to deal with ramps
Regulated payments
Steady-state reactive power Controls voltages for efficient transmission of power around the system - not a type of reserve, and in most jurisdictions is specified
in grid code as opposed to being defined as separate ancillary service
Regulated payments
Source: EirGrid
29 see http://www.eirgrid.com/operations/ds3/ accessed 13.11.2014

Integration of Variable Renewable Energy Volume II: Case studies
326641/TRD/EFR/5/e January 2015 Vol II: Case studies
73
Ireland has a sophisticated differentiation of ancillary services, including remuneration for reactive power,
but payments for all the products are regulated prices determined through consultation, not
market/marginal pricing.
Grid representation: The SEM has a single market price and there is no market price representation of grid
constraints (e.g. zonal or LMP). Generators who are constrained do receive payments if the actual
dispatch differs from what market dispatch has indicated.
Interconnector management: The Single Electricity Market Operator (SEMO) has operated the unified
electricity market between the Republic of Ireland and Northern Ireland since 2007. Interconnection with
Great Britain is done on longer term agreements and ad hoc basis. The interconnectors can be used for
balancing.
Regulator incentives on the SO: Price control negotiations set targets for EirGrid costs, but there are also
some explicit incentive mechanisms for SOs to manage costs.
VRE grid code: Irish wind grid code sets requirements for FRT, reactive power, frequency response, ramp
rates and high wind ride through.
Figure 9.6 shows as a simple schematic our view of how the key frame conditions have developed over
time as a result of the measures introduced, shown through our timeline. The ratings are a subjective view
and are meant to show the development of the measures.
Figure 9.6: Ireland frame conditions.
Source: Mott MacDonald
Key message: Ireland has focused developments on grid codes, through the 2005 grid code overhaul,
interconnector management through market integration between the Republic of Ireland and Northern
Ireland.
0
1
2
3
4
5
Dispatchsophisticationand maturity
VRE incentivesand dispatch
Use offorecasting
System servicesmarket
Gridrepresentation
Interconnectormanagement
Regulatorincentives on
SO
Grid code
Start year Now

Integration of Variable Renewable Energy Volume II: Case studies
326641/TRD/EFR/5/e January 2015 Vol II: Case studies
74
9.6 Integration studies
Ireland has taken a proactive approach to investigating the impacts of wind on the system, and how to
integrate increasing amounts in the future. Five major integration studies since 2008 are:
All Island Grid study (2008)
Facilitation of Renewables study (2010)
Ensuring a secure, reliable and efficient power system in a changing environment (2011)
Summary of studies on RoCoF events on the All-Island system (2012)
Northern Ireland System Separation Studies (2012)
The key outcomes of these studies has been to recognise that there are operational limits to integration
wind energy in a synchronously independent system – EirGrid now has a limit of 50 percent System Non
Synchronous Penetration (SNSP). The studies investigate required developments to increase this stability
limit and inform the recommendations for reforms to ancillary services, as described in section 9.8.
9.7 Potential developments
In 2012, EirGrid submitted a proposal to the regulator to introduce changes to ancillary services, including
proposing five new ancillary service products and changes to existing products. The changes are in
recognition of the changing environment due to high wind penetration causing the need to provide
additional and appropriate incentives for certain capabilities not traditionally incentivised in the energy or
ancillary service markets.
The first new service proposed is Synchronous Inertial Response (SIR). Synchronous inertia stabilises the
power system – wind generators do not provide synchronous inertia and so this reduces the stability of the
system. EirGrid proposes an incentive system for SIR that would encourage synchronous power plant
design that reduces the minimum stable output, which would help to accommodate higher levels of VRE.
The second is Fast Frequency Response (FFR) that would provide a frequency response faster than the
existing Primary Operating Reserve. In addition to conventional generators, demand response, storage,
DC interconnectors and full convertor type wind generators could provide this service.
Fast Post-fault Active Power Recovery is the third proposed new service. This would incentivise power
generators (conventional and full convertor wind turbines) to restore normal operation more quickly after a
fault, and would be used to address transient stability concerns.
The fourth new product would be the Ramping Margin, which would provide incentive for ramping
capability. The final new proposed product is Dynamic Reactive Power capability to incentivise advanced
voltage control to address reactive power concerns.
The new proposals could potentially be approved by the end of 2014, with full implementation by 2016.
EirGrid states that these reforms would increase the SNSP limit to 55 percent. Further reforms, including
revising the RoCoF standard, enhanced control centre tools and revised operational policies may increase
the SNSP limit to 75 percent by 201930.
30 DS3 Operational Capability Outlook

Integration of Variable Renewable Energy Volume II: Case studies
326641/TRD/EFR/5/e January 2015 Vol II: Case studies
75
9.8 Lessons for other jurisdictions
Ireland has the highest VRE penetration in the world for synchronously independent system. It also has
some of the most developed grid code specifications for wind. EirGrid has performed detailed studies
about operational stability focusing on wind penetration limits which would be relevant too for other
jurisdictions. New products for ancillary services being developed could help to resolve issues such as
provision of adequate inertia (particularly relevant for synchronously independent jurisdictions), fault
recovery (transient stability concerns), ramping and reactive power.
Additionally, the development of the Single Electricity Market (SEM) was a significant landmark and should
allow the more efficient use of flexibility, and aggregation of VRE over a larger geographical area. This is
mostly relevant for countries with a significant amount of interconnection with other jurisdictions.

Integration of Variable Renewable Energy Volume II: Case studies
326641/TRD/EFR/5/e January 2015 Vol II: Case studies
76
10.1 Introduction
This chapter of the Volume II Case Studies report presents the case study for Spain. The information
gathered was based on:
questionnaire information received
subsequent email exchange with Red Electrica de Espana (REE)
10.2 Context
The Spanish Transmission Network is owned and operated by the Transmission System Operator (TSO);
Red Electrica de Espana (REE). The Spanish system is composed of two main subsystems. The major
part is the Iberian Peninsula (the focus of this study), with the Canary Islands and the cities of Ceuta and
Melilla making up the remainder.
Power system
Spain is one of the largest regions in this study (land area is 5050,992 km2). The Iberian Peninsula has a
peak demand of 40 GW (in 2013), total installed capacity of 102 GW (2014). Spain has an overcapacity
issue; total installed dispatchable capacity is 174 percent of peak demand (see Figure 10.1). Installed
capacity of gas and hydro (generally considered to be flexible) together make up 107 percent of peak
demand. Interconnection capacity is low (11 percent of peak demand) relative to its peak demand31.
Figure 10.1: Spain installed capacity as a percentage of peak demand
Source: Mott MacDonald and REE Statistical series October 2014
Variable Renewable Energy
Spain has a significant amount of installed VRE capacity – 23 GW of wind and 6.7 GW of Solar (57 percent
and 17 percent of peak demand, respectively). VRE capacity is well distributed throughout the country (see
Figure 10.2), though wind tends to be more in the north and solar tends to be more in the South.
31 Figures for installed capacity and peak demand are from Red Electrica de Espana Statistical series (October 2014) available at http://www.ree.es/en/publications/indicators-and-statistical-data/statistical-series
0% 50% 100% 150% 200% 250% 300%
Dispatchable
Variable
Capacity as percent of peak demand (40 GW)
Wind Solar PV Solar Thermal Gas Hydro Coal Nuclear Biomass Interconnection Storage CHP
10 Spain

Integration of Variable Renewable Energy Volume II: Case studies
326641/TRD/EFR/5/e January 2015 Vol II: Case studies
77
A well distributed VRE capacity should help to alleviate congestion issues and allow aggregation of VRE
generation over a large area, smoothing out some of the variability.
Figure 10.2: Spain – distribution of wind and solar capacity
Source: REE
Key message: Solar and wind capacity is well distributed throughout the country.
10.3 Challenges
We asked REE to rate the severity of six discrete integration challenges (on a scale of 1 to 5, with 5 being
most severe). The challenges we define are detailed in Volume I: Main Report.

Integration of Variable Renewable Energy Volume II: Case studies
326641/TRD/EFR/5/e January 2015 Vol II: Case studies
78
Figure 10.3: REE perception of the challenges
Source: Mott MacDonald and REE
REE rated supply adequacy and ramping as the most severe challenges (see Figure 10.3). Spain has a
large reserve margin and reserves are usually provided by CCGT, hydro with reservoirs and hydro pumps.
In addition Gas CCGT and coal power plants operating hours are being significantly reduced due to the
increase in VRE generation, economic crisis and demand crunch, and overcapacity due to over
investment. Average operating hours for CCGT dropped from 2,492 in 2012 to 1,736 in 2013 and for coal
dropped from 5,766 to 4,350 in the same period32.
This is leading to conventional generation, especially CCGT, becoming uneconomic to keep operating. The
government’s reforms in 2013 proposed to cut capacity payments and allow the mothballing of 6 GW of
CCGT plant. The loss of too much conventional generation could lead to concerns for supply adequacy
and ramping capability.
10.4 Integration timeline
Spain has implemented a number of key policies in the electricity market that has had an effect on the
integration of VRE (see Figure 10.4).
32 Operating hours available in the REE report “The Spanish Electricity System, 2013”, available at http://www.ree.es/sites/default/files/downloadable/the_spanish_electricity_system_2013.pdf - accessed November 2014
0
1
2
3
4
5Inertia
Reactive power
Transientstability
Congestion
Ramping
Supplyadequacy

Integration of Variable Renewable Energy Volume II: Case studies
326641/TRD/EFR/5/e January 2015 Vol II: Case studies
79
Figure 10.4: Spain integration timeline
Source: Mott MacDonald
Forecasting – 2002: SIPREÓLICO and SIPRESOLAR are short term statistical wind and solar power
prediction tools for the Spanish peninsular electric system, generating hourly forecasts for 48 hours ahead.
REE uses the tools to schedule reserve, identify potential congestion issues monitor system security.
Grid Code – 2006: Introduced to deal with the potential for losing VRE due to voltage dips. New rules
specify fault ride through procedures to improve the security of the system.
CECRE – 2007: The Centralised Control Centre of Renewable Energy in Spain (CECRE) was introduced
to help REE manage increasing amounts of wind and solar on the system. CECRE is considered a world
first in being able to manage all RES facilities over 10 MW (connected to either transmission network or
distribution network) and real time production of all RES facilities over 1 MW or aggregation of facilities
over 1 MW are monitored in CECRE.
Energy Forecasting – SIPREOLICO and
SIPRSOLAR tools developed and used to inform level of ancillary services required.
CECRE – Centralised control centre monitors real-
time generation helps to automatically manage congestion and system balance.
Grid code – Further development of grid code requires
VRE to provide voltage control, as instructed by the system operator.
2002
2006
2013
Grid code – Sets procedure for responding to
voltage dips.
2007
Gate closure shortening – gate closure times in the
intra-day market shortened as a step towards integration with the European electricity market.
2010
MIBEL – Spanish and Portuguese market integration
allows day ahead bilateral trading across interconnector increasing competitiveness of generation and optimising use of interconnector.
$Dispatch sophistication
System services market
Regulator incentives on SO
Grid representation
Use of forecasting
Interconnector management and market integration
Grid code
VRE incentives and dispatch
FiP suspended – Government ends the feed in premium
subsidy for renewables due to fiscal pressure, effective in 2013.

Integration of Variable Renewable Energy Volume II: Case studies
326641/TRD/EFR/5/e January 2015 Vol II: Case studies
80
CECRE provides the communication interface between VRE generators and REE, monitors real-time
productions and uses forecasts to anticipate sudden changes in VRE generation. CECRE monitors real-
time operations to assess whether the generation scenario satisfies security constraints and automatically
instructs connected VRE generators to reduce generation if security is compromised.
MIBEL – 2007: The interconnection between Spain and Portugal is managed through the Iberian Electricity
Market (MIBEL) whose market operator is OMIE since 2007. In MIBEL, generators and consumers in
Spain and Portugal present their bids in each market session for the purchase and sale of energy and after
the matching process, by which prices are determined in both countries, an energy schedule is established
through the Spain-Portugal interconnection for each hour.
The interconnection use under MIBEL has been historically very high prompting continuous expansion of
interconnection capacity between the two countries. The wholesale price spread prior to the market
coupling was in excess of 10 euro/MWh, but it has since disappeared for most periods when the capacity
is sufficiently large to prevent congestion. However, if the flow exceeds the maximum capacity, the markets
are decoupled. When market splitting occurs, prices generally rise in Portugal and fall in Spain.
The price difference between the two interconnected areas generates congestion rents. These rents are
shared equally between the two countries and are intended for the future development of interconnections
or to reduce access tariffs.
Grid code – 2010: All facilities or group of facilities with the same point of common coupling with an
installed capacity larger than 1 MW must send real-time telemetry to the CECRE.
FiP suspended – 2013: The Spanish government implemented retroactive cuts applied to all VRE
installations and closed the scheme to all new installations. This exposes future VRE development to
market prices.
Gate closure shortening – 2013: Gate closure time in the intraday market was shortened to allow for
market coupling of the SWE region with the CWE region.
10.5 Frame conditions
The frame conditions, as defined in Volume I: Main Report, are key market, operational and regulatory
conditions of a power system that influence the ability of the power system to integrate high levels of VRE
now and in the future.
Dispatch sophistication: Day Ahead market in Spain closes at 14.00. Gate closure in the intraday market is
40 minutes ahead of the first dispatch hour. Prices are capped at €180/MWh and negative pricing is not
currently allowed in the market33.
Incentives on VRE: As of 2013, VRE developers receive no premium on the market prices. They are fully
exposed to imbalance risk and receive only partial compensation in the event of curtailment – 15 percent of
projected energy payment.
Use of forecasting: forecasting from SIPREOLICO and SIPRESOLAR is used in the calculation of reserve
requirements and used in CECRE.
33 http://www.omel.es/en/home/markets-and-products

Integration of Variable Renewable Energy Volume II: Case studies
326641/TRD/EFR/5/e January 2015 Vol II: Case studies
81
System services market: Table 10.1outlines the operating reserve REE requires on the system. Reserve
requirements are calculated based on stochastic approaches, taking into account demand deviations, wind
production deviations and generation losses. Spain also has a fourth service which most jurisdictions do
not have called Deviation, which is use to deal with large ramps.
Table 10.1: Spanish ancillary services
Service Description Price determined
Primary Primary control reserve is a mandatory requirement (grid code) – generators providing primary reserve operate with reserve margin of 1.5 percent
Not remunerated
Secondary Used by REE to automatically balance the system in real-time (as much as 1.5 GW) – includes many fast response hydro plants
Marginal price
Tertiary 15 minute dispatchable responsive reserve to manually address differences between generation and load
Marginal price
Deviation Deviation reserves are used to balance large differences between scheduled generation and forecasted demand
Marginal price
Source: REE
Grid representation: In the Iberian market, there is market splitting between Spain and Portugal, but there
is just a single price for the Spanish market i.e. there is no representation of grid constraints in the market.
Interconnector management: The interconnection with Portugal is fully integrated into the spot electricity
market. Use of interconnection with France is by long term auctions and day a head auctions of capacity.
The French and Portuguese interconnectors have been used for balancing since June 2014.
Regulator incentives on the SO: Price (or revenue) control – SO is allowed to recover revenue up to an
overall revenue target based on forecast of its controllable costs.
VRE grid code: Grid code for both wind and solar specifies fault-ride through and reactive power
requirements. There are no requirements for frequency response, high-wind ride through or emulated
inertia.
Figure 10.5 shows as a simple schematic our view of how the key frame conditions have developed over
time as a result of the measures introduced, shown through our timeline. The ratings are a subjective view
and are meant to show the development of the measures.

Integration of Variable Renewable Energy Volume II: Case studies
326641/TRD/EFR/5/e January 2015 Vol II: Case studies
82
Figure 10.5: Spain frame conditions.
Source: Mott MacDonald
Key message: The significant developments in Spain have been in interconnector management (mainly
through market coupling with Portugal), forecasting (with the use of the SIPREÓLICO and SIPRESOLAR)
and grid code developments.
10.6 Lessons for other jurisdictions
Spain has a very high penetration of VRE (73 percent of peak capacity) which is one of the highest in the
world. In order to integrate such a high level of capacity, Spain has implemented a number of key
measures – the CECRE renewable control centre, market integration with Portugal and sophisticated
forecasting. Spain’s use of forecasting measures (i.e. using forecasts to influence scheduling and spinning
reserve requirements) are relevant for all jurisdictions. Market integration, through MIBEL, is applicable to
jurisdictions that have potential connection to another sizeable power system with which they can pool
flexible resource and increase the VRE aggregating area.
0
1
2
3
4
5
Dispatchsophisticationand maturity
VRE incentivesand dispatch
Use offorecasting
System servicesmarket
Gridrepresentation
Interconnectormanagement
Regulatorincentives on
SO
Grid code
Start year 2014

Integration of Variable Renewable Energy Volume II: Case studies
326641/TRD/EFR/5/e January 2015 Vol II: Case studies
83
11.1 Introduction
This chapter of the Volume II Case Studies report presents the case study for Hokkaido. The information
gathered was based on:
questionnaire information received
Our thanks in particular are extended to Hepco for their assistance in compiling this information.
11.2 Context
Hokkaido is one of ten power service areas in Japan (see Figure 11.1). The Hokkaido Electric Power
Company (HEPCO), a vertically integrated utility, owns and operates the powers system on the island.
Japan is currently implementing reforms to liberalise the power sector34, including the formation of a
national system operator with a coordinating role, however power generation is still in the domain of
HEPCO.
Figure 11.1: Japan Electricity Service Areas
Source: U.S. Energy Information Administration
34 See “Reforming Japan’s Electricity Sector” and interview with Koichiro Ito by Jennifer Steffensen in October 2013, available at http://www.nbr.org/research/activity.aspx?id=368 accessed on 19.8.2014
11 Hokkaido
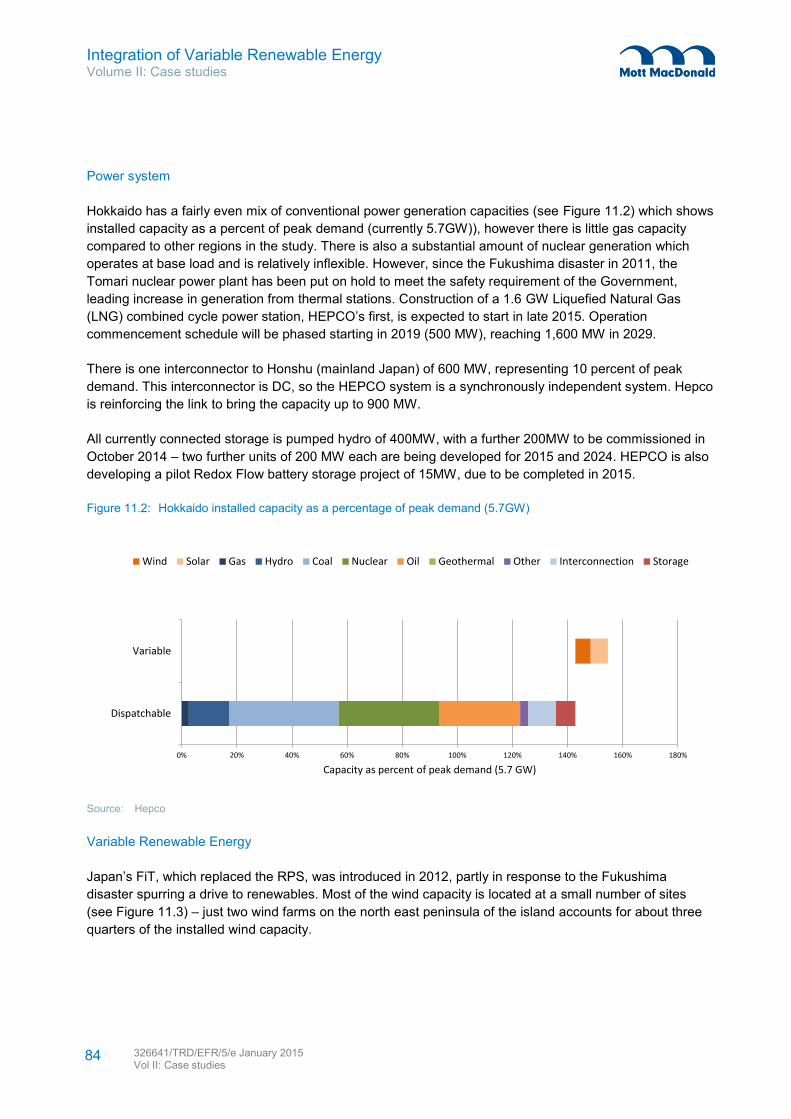
Integration of Variable Renewable Energy Volume II: Case studies
326641/TRD/EFR/5/e January 2015 Vol II: Case studies
84
Power system
Hokkaido has a fairly even mix of conventional power generation capacities (see Figure 11.2) which shows
installed capacity as a percent of peak demand (currently 5.7GW)), however there is little gas capacity
compared to other regions in the study. There is also a substantial amount of nuclear generation which
operates at base load and is relatively inflexible. However, since the Fukushima disaster in 2011, the
Tomari nuclear power plant has been put on hold to meet the safety requirement of the Government,
leading increase in generation from thermal stations. Construction of a 1.6 GW Liquefied Natural Gas
(LNG) combined cycle power station, HEPCO’s first, is expected to start in late 2015. Operation
commencement schedule will be phased starting in 2019 (500 MW), reaching 1,600 MW in 2029.
There is one interconnector to Honshu (mainland Japan) of 600 MW, representing 10 percent of peak
demand. This interconnector is DC, so the HEPCO system is a synchronously independent system. Hepco
is reinforcing the link to bring the capacity up to 900 MW.
All currently connected storage is pumped hydro of 400MW, with a further 200MW to be commissioned in
October 2014 – two further units of 200 MW each are being developed for 2015 and 2024. HEPCO is also
developing a pilot Redox Flow battery storage project of 15MW, due to be completed in 2015.
Figure 11.2: Hokkaido installed capacity as a percentage of peak demand (5.7GW)
Source: Hepco
Variable Renewable Energy
Japan’s FiT, which replaced the RPS, was introduced in 2012, partly in response to the Fukushima
disaster spurring a drive to renewables. Most of the wind capacity is located at a small number of sites
(see Figure 11.3) – just two wind farms on the north east peninsula of the island accounts for about three
quarters of the installed wind capacity.
0% 20% 40% 60% 80% 100% 120% 140% 160% 180%
Dispatchable
Variable
Capacity as percent of peak demand (5.7 GW)
Wind Solar Gas Hydro Coal Nuclear Oil Geothermal Other Interconnection Storage

Integration of Variable Renewable Energy Volume II: Case studies
326641/TRD/EFR/5/e January 2015 Vol II: Case studies
85
Hokkaido has approximately half of the wind potential for the whole of Japan, and so this region will be a
major focus of renewables development for the country, as it seeks to develop its renewables sector. A
further 700MW of PV and 560MW of wind capacity have been allocated grid connection and are expected
to be installed. These additions will bring installed capacity, as percentage of peak demand, to 14 percent
for wind and 16 percent for PV – a step change for renewables in the region.
Figure 11.3: Wind and solar distribution as of March 2013
Source: Hepco, capacity as of March 31 2014
Key message: VRE generation facilities in Hepco are fairly evenly distributed, though most of the wind
development is on the west of the island. (note that VRE generation in Hokkaido is expanding rapidly and
so the geography distribution of installations will also change quickly)
11.3 Challenges
We asked HEPCO to rate the severity of six discrete integration challenges (on a scale of 1 to 5, with 5
being most severe). The challenges we define are detailed in Volume I: Main Report.
Figure 11.4 presents HEPCO’s perception of the severity of the challenges.

Integration of Variable Renewable Energy Volume II: Case studies
326641/TRD/EFR/5/e January 2015 Vol II: Case studies
86
Figure 11.4: HEPCO’s perception of the challenges
Source: Mott MacDonald
It has been reported that there are concerns about most of the key technical challenges in Hokkaido, but
most concern is for supply adequacy, ramping, congestion and reactive power.
11.4 Integration timeline
Hokkaido has implemented a number of key policies in the electricity market that has had an effect on the
integration of VRE (see Figure 11.5).
0
1
2
3
4
5Inertia
Reactive power
Transientstability
Congestion
Ramping
Supplyadequacy

Integration of Variable Renewable Energy Volume II: Case studies
326641/TRD/EFR/5/e January 2015 Vol II: Case studies
87
Figure 11.5: Integration timeline
Source: Mott MacDOnald
11.5 Frame conditions
The frame conditions, as defined in Volume I: Main Report, are key market, operational and regulatory
conditions of a power system that influence the ability of the power system to integrate high levels of VRE
now and in the future.
As mentioned above, HEPCO is a vertically integrated utility, as opposed to the other case studies which
all have markets. There are fundamental differences between the two types of regulatory system,
particularly when it comes to investment in new generation. For a market system, investment is made on
the basis of the potential revenues a generator may accrue from sales of energy, ancillary services and
additional payments that may be received.
JEPX – Japanese Electricity Power Exchanges
first established, creating a platform for spot and forward trading.
Electric Power System Council of Japan –Created as an independent body to support transmission and distribution operations.
VRE incentives – Feed in Tariff introduced.
2003
2004
2009
2012
Intraday trading – Intraday trading introduced.
Grid code – Fault ride through required for grid
connected solar and wind generation sources.
$Dispatch sophistication
System services market
Regulator incentives on SO
Grid representation
Use of forecasting
Interconnector management and market integration
Grid code
VRE incentives and dispatch

Integration of Variable Renewable Energy Volume II: Case studies
326641/TRD/EFR/5/e January 2015 Vol II: Case studies
88
Policy makers can influence and reform market design (such as changing price caps, negative pricing etc.)
in order to encourage investment that will meet needs of the power system (resource adequacy, system
flexibility, renewables targets etc.). The development of the power system depends on the actions of the
market participant responding to the design of the market.
In a vertically integrated utility, the utility responds to the goals (such as RE targets, generation expansion)
defined by policy makers and makes investment decisions by attempting to minimise costs while operating
with specific constraints (such as environmental and price constraints). The development of the power
system depends on the processes the utility takes in determining investment decisions. In theory, a
vertically integrated utility in which decision makers are incentivised to act in the public good should lead to
the same result as an efficient functioning market.
Dispatch sophistication: In japan, there is a day ahead and intraday market. However, these markets
represent less than 1 percent of the energy volumes. Japanese power utilities are vertically integrated,
meaning they own the generation and transmission network. Hepco operates a central dispatch, instructing
generation at least every 30 minutes.
Incentives on VRE: The Japanese FiT was introduced in 2012 by the Act on Feed-in-Tariff for Electricity
from Renewable Energy Sources. The FiT provides a fixed rate payment for energy sold to the grid.
However, the utilities are not obliged to give priority access to VRE and can refuse connection if it will
unreasonably harm the stability of the grid. For curtailment, rules stipulate that fossil fuel and hydro must
be curtailed before VRE, but VRE is curtailed before nuclear. Curtailment is only compensated if the
generator is curtailed for more than 30 days in the year.
Use of forecasting: HEPCO does not use wind or solar forecasting. Wind generation is monitored in real-
time in order to adjust generation from other plant. HEPCO plans to introduce forecasting in the near
future.
System services market: there is no market for the procurement of ancillary services, as the power sector
is not unbundled, HEPCO can directly instruct generation facilities that it owns, but the information on how
HEPCO manages the process is unavailable. The grid code stipulates that utilities should procure at least
3 to 5 percent of expected daily peak demand for the provision of spinning reserve to meet any mismatch
in supply and demand. Renewables generation is not taken into account when calculating the required
reserves.
Grid representation: Hokkaido is a single dispatch area.
Interconnector management: Transfer capacity is generally allocated years in advance, though there is
also some day ahead trading between the Electricity Power Companies (EPCO). The role of the
interconnectors is mainly to manage contingencies and is generally used as a last resort to maintain 3
percent reserve capacity. The interconnectors can be used for balancing.
Regulator incentives on the SO: There are no regulatory incentives on the system operator (HEPCO) –
rate of return regulation.
VRE grid code: Fault Ride Through and reactive power requirements are specified in the grid code for both
wind and solar PV.

Integration of Variable Renewable Energy Volume II: Case studies
326641/TRD/EFR/5/e January 2015 Vol II: Case studies
89
Hokkaido has a vertically integrated monopoly utility and so the analytical method we have used to
represent the changes in the frame-conditions does not apply. It should be noted that Hepco has been able
to make direct investments in flexible resource (such as storage facilities) without the need for
interventions or changes to the frame-conditions.