Embed Size (px)
Citation preview

Integration of Nutrition Assessment, Counseling, and Support into Uganda’s Routine Health Service Delivery A Monitoring Report
August 2015

About SPRING The Strengthening Partnerships, Results, and Innovations in Nutrition Globally (SPRING) project is a five-year USAID-funded Cooperative Agreement to strengthen global and country efforts to scale up high-impact nutrition practices and policies and improve maternal and child nutrition outcomes. The project is managed by JSI Research & Training Institute, Inc., with partners Helen Keller International, The Manoff Group, Save the Children, and the International Food Policy Research Institute.
Disclaimer This report is made possible by the generous support of the American people through the United States Agency for International Development (USAID) under the terms of the Cooperative Agreement AID-OAA-A-11-00031 (SPRING), managed by JSI Research & Training Institute, Inc. (JSI). The contents are the responsibility of JSI, and do not necessarily reflect the views of USAID or the United States Government.
Recommended Citation SPRING. 2015. Integration of Nutrition Assessment, Counseling, and Support into Uganda’s Routine Health Service Delivery: A Monitoring Report. Arlington, VA: Strengthening Partnerships, Results, and Innovations in Nutrition Globally (SPRING) project.
SPRING JSI Research & Training Institute, Inc. 1616 Fort Myer Drive 16th Floor Arlington, VA 22209 USA Phone: 703-528-7474 Fax: 703-528-7480 Email: [email protected] Internet: www.spring-nutrition.org
Photo credits: Top, Majid Okot, SPRING/Uganda; bottom, Katherine Otim, SPRING/Uganda

Contents Acronyms ........................................................................................................................................................................ vii Executive Summary ....................................................................................................................................................... ix Chapter 1. Introduction ................................................................................................................................................. 1
1.1. Nutrition Situation in Uganda ............................................................................................................................ 1 1.2. HIV and AIDS in Uganda .................................................................................................................................... 1 1.3. Responses to Nutrition and AIDS Crises in Uganda ....................................................................................... 1 1.4. SPRING in Uganda ............................................................................................................................................... 2 1.5. Rationale for the Assessment ............................................................................................................................ 3 1.6. Overall Objectives of this Assessment ............................................................................................................. 3 1.7. Specific Objectives of the Assessment ............................................................................................................ 3
Chapter 2. Methodology .............................................................................................................................................. 5 2.1. Design .................................................................................................................................................................... 5 2.2. Study Areas ........................................................................................................................................................... 5 2.3. Data Collection Methods .................................................................................................................................. 5 2.4. Sampling of Study Sites and Participants ........................................................................................................ 5 2.5. Data Analysis ........................................................................................................................................................ 6 2.6. Quality Assurance and Control Plan ............................................................................................................... 7 2.7. Ethical Considerations ........................................................................................................................................ 7 2.8. Implementation of the Assessment and the Management Plan .............................................................. 7 2.9. Study Limitations .................................................................................................................................................. 8
Chapter 3. Key Findings ................................................................................................................................................. 9 3.1. Capacity of health facilities to implement nutrition interventions ............................................................. 9 3.2. Knowledge and Skills/Competencies of Health Workers for NACS Services ......................................... 10 3.3. Gaps in Information and Feedback Mechanisms to Improve Quality of Services .............................. 24 3.4. Sources of motivation for improved performance among health workers ........................................... 26 3.5. Roles of community health workers in delivering preventive and treatment nutrition services ........ 28
Chapter 4. Summary of Key Findings and Discussion ............................................................................................ 31 4.1. Health Work Force ............................................................................................................................................. 31 4.2. Nutrition Capacity ............................................................................................................................................. 31 4.3. NACS Services .................................................................................................................................................... 31 4.3. Documentation of Nutrition Data/Information ............................................................................................ 34 4.4. Quality Improvement ........................................................................................................................................ 35 4.5. Supportive Supervision for Health Care Providers ....................................................................................... 36 4.6. Community-Based Health Services ................................................................................................................ 36
Chapter 5. Conclusion and Recommendations .................................................................................................... 39 References ..................................................................................................................................................................... 41 Annex 1. .......................................................................................................................................................................... 43

Tables 2.1. Summary of sample composition for facility health providers ........................................................................ 6
2.2. Summary of sample size for client exit interviews .............................................................................................. 6
3.1. Number of health workers surveyed, by service delivery point ...................................................................... 9
3.2. Preservice training of health workers in nutrition-related topics within previous 12 months ...................10
3.3. Percentage of health workers by cadre providing nutrition assessment, by facility type ......................11
3.4. Availability of nutrition assessment services, by facility type .........................................................................11
3.5. Percentage of facilities that include nutrition assessment in routine services, by facility type ..............12
3.6. Percentage of health facilities providing nutrition-specific services, by facility type ..............................12
3.7. Classification of malnutrition, by facility type ..................................................................................................13
3.8. Percentage of facilities documenting nutrition assessment indicators, by facility type .........................15
3.9. Availability of equipment for assessment of nutrition status, by service point and facility type ............16
3.10. Proportions of facilities providing nutrition counseling at different service points ..................................17
3.11. frequency of nutrition counseling, by facility type .......................................................................................17
3.12. Percentage of health facilities with BFHI guidelines, by service point and facility type .......................19
3.13. Percentage of health facilities with IYCF guidelines, by service point and facility type .......................20
3.14. Percentage of facilities with IMAM guidelines, by service point and facility type .................................21
3.15. Percentage of health facilities implementing BFHI guidelines, by service point and facility type .....22
3.16. Percentage of facilities implementing IYCF, by service point and facility type .....................................22
3.17. Percentage of facilities implementing IMAM, by service point and facility type ..................................22
3.18. Percentage of Health Facilities with Designated Staff for Collection and Use of HMIS Data ..............24
3.19. Percentage of facilities collecting nutrition-related data through HMIS or other systems ...................25
3.20. Availability and functionality of quality improvement teams by facility type .........................................26
3.21. Incentives provided to health workers, by facility type ...............................................................................27
3.22. Technical support supervision provided to health workers, by facility type ............................................27
3.23. Facility-community linkages, by facility type .................................................................................................28
3.24. Functionality of facility-community linkages, by facility type .....................................................................29
3.25. Facilities linked to community-based services, by facility type ..................................................................29
3.26. Most recent training for community health workers, by facility type ........................................................30
List of Health Facilities Surveyed by District ..............................................................................................................43

Figures 3.1. Percentage of facilities reporting nutrition documentation in pediatric OPD, by facility level .............14
3.2. Percentage of facilities reporting nutrition documentation in ANC, by facility type ..............................14
3.3. Percentage of facilities reporting nutrition documentation in YCC, by facility type ...............................15
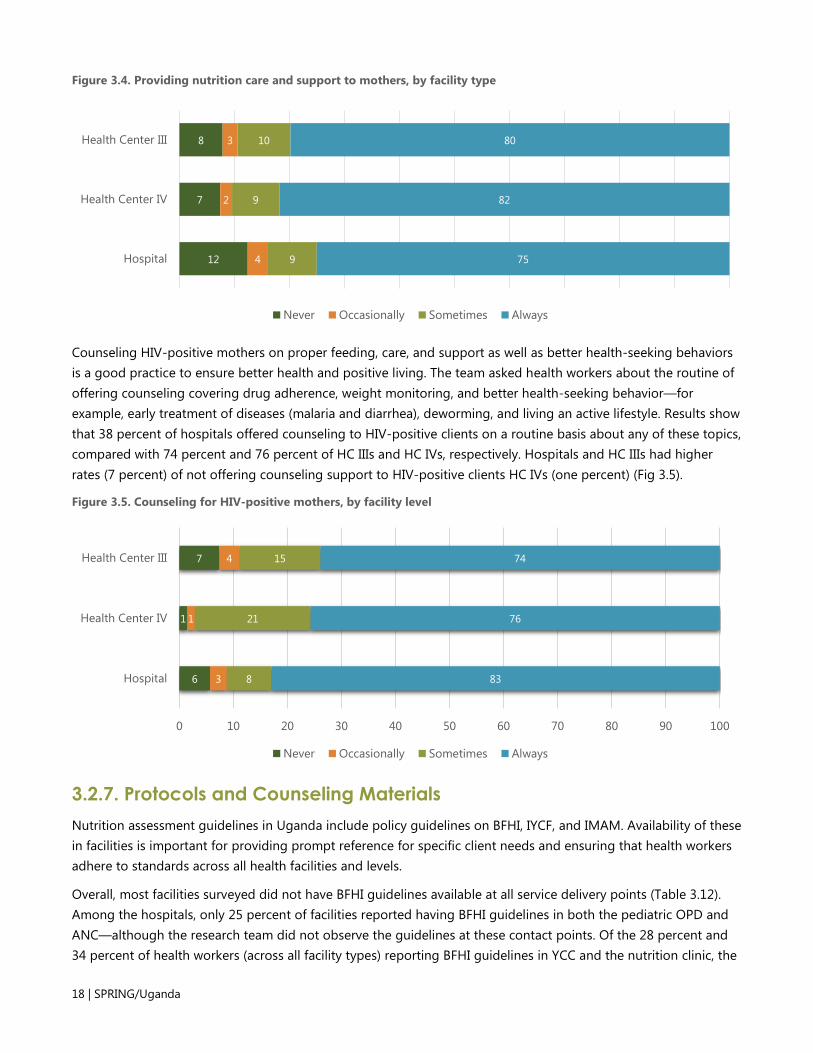
3.4. Providing nutrition care and support to mothers, by facility type ...............................................................18
3.5. Counseling for HIV-positive mothers, by facility level .....................................................................................18
3.6. Number of facilities reporting availability of essential nutrition supplies .....................................................23
4.1. Improvement in the percentage of facilities providing nutrition assessment, 2012–2014 .......................32
4.2. Methods of nutrition assessment improved across all health facilities, 2012–2014 ...................................32
4.3. Improvement in nutrition counseling all facility types, 2012–2014 ................................................................33
4.4. Documentation of MUAC and weight assessment, 2012–2014....................................................................35


Integration of Nutrition Assessment, Counseling, and Support into Uganda’s Routine Health Service Delivery | vii
Acronyms AIDS Acquired Immunodeficiency Syndrome
ANC antenatal care
ART antiretroviral therapy
BFHI Baby Friendly Hospital Initiative
BMI body mass index
CHW Community-based Health Worker
DQIT District Quality Improvement Team
EC East Central [region]
EID early infant diagnosis
eMTCT elimination of Mother-to-Child Transmission
FP family planning
HC health center
HIV Human Immunodeficiency Virus
HMIS health management information system
IFA Iron and Folic Acid
IMAI Integrated Management of Adolescent Illness
IMAM Integrated Management of Acute Malnutrition
IMCI Integrated Management of Childhood Illness
IPT intermittent preventive treatment
IYCF infant and young child feeding
JSI JSI Research & Training Institute, Inc.
MCH maternal and child health
MoH Ministry of Health
MTCT mother-to-child transmission
MUAC mid-upper arm circumference
NACS Nutrition Assessment, Counseling, and Support
OPD outpatient department
PEPFAR U.S. President’s Emergency Plan for AIDS Relief
PHFS Partnership for HIV-Free Survival
PLHIV people living with HIV
QI quality improvement
RA research assistant
RDA recommended dietary allowance
RUTF ready-to-use therapeutic food
SPRING Strengthening Partnerships, Results and Innovations in Nutrition Globally

viii | SPRING/Uganda
SW South West [region]
UNAP Uganda Nutrition Action Plan
USAID U.S. Agency for International Development
UBOS Uganda Bureau of Statistics
VHT village health team
WAZ score weight-for-age Z score
WHO World Health Organization
WHZ score weight-for-height Z score
YCC young child clinic

Integration of Nutrition Assessment, Counseling, and Support into Uganda’s Routine Health Service Delivery | ix
Executive Summary The 2014 monitoring of the integration of Nutrition Assessment Counselling and Support (NACS) into routine health care in South West (SW) Uganda and Namutumba district in East Central (EC) Uganda was designed as a follow-up to the 2012 and 2013 NACS assessments. The main objective of this study was to better understand the context for NACS programming in the SW and EC regions and to determine the availability of the required essential elements of nutrition services (assessment tools, counseling skills, and anthropometric tools). In addition, the study sought to determine the availability of supplies, such as micronutrient supplements, drugs, and therapeutic and supplementary foods, for adults and children in supported health facilities and at the community level.
The findings of the 2014 monitoring assessment are critical to measuring the achievements of NACS integration into routine health care in SPRING/Uganda health facilities since 2011. The findings of the supported assessment will support the refocusing of interventions that are relevant and essential for enhancing the capacity of health facilities to implement NACS to achieve better health outcomes.
Study Methodology The study used a descriptive cross-sectional design with both qualitative and quantitative data collection methods. The study covered all the 46 health facilities, 42 from Ntungamo and Kisoro, and four of the seven facilities in Namutumba as well as the five former NuLife supported hospitals from Kanugu, Rukungiri, Sheema, and Bushenyi; one regional referral hospital in Kabale district. A randomly selected 457 health workers across all health facilities were interviewed. Of these, 344 were in Kisoro and Ntungamo districts, 105 in former NuLife districts, and eight in Namutumba district.
Data Analysis Before the analysis, quantitative data analysts captured data in Epidata software and analyzed them using SPSS 19 and Microsoft Excel to obtain descriptive statistics, frequencies, and percentages. Analysts performed data verifications, cleaning, and consistency checks before the analysis. Bivariate analysis was the main mode of analysis used. To tease out the differences in performance, the analysis was disaggregated by type of facility and service delivery points.
Limitations Even though the 2014 monitoring assessment planned to reach all 51 supported health facilities, one hospital refused to participate in the assessment. Data from two hospitals (Ibanda and Mbarara) were not included in the analysis as they failed to respond to the survey. In Namutumba district, the team did not reach three health facilities. Despite these difficulties, the findings presented in this report cover 90 percent of the SPRING/Uganda-supported facilities and provide a good description of the context for programming. The 2014 monitoring of NACS covered all 10 SPRING/Uganda-supported districts in SW and EC Uganda, and results were compared to the 2012 survey (which covered only SW Uganda).

x | SPRING/Uganda
Key Findings Health Work Force Study findings showed that lower-level staff, including nurses, midwives, and nursing assistants, continue to predominate the health work force. These health workers have attained midlevel training, and most of them provide maternal and child health services. For effective integration of NACS in routine health care, NACS trainings, coaching, and mentorship should continue targeting nurses, midwives, and nursing assistants since they account for the greatest part of the health work force.
Nutrition Capacity More health workers in health center (HC) IIIs have received training on nutrition focus areas than those in hospitals and HC IVs. Health workers in HC IVs missed out on Integrated Management of Acute Malnutrition (IMAM), infant and young child feeding (IYCF), and Baby-Friendly Hospital Initiative (BFHI) trainings. In general, capacity gaps are present in the offering of BFHI and Integrated Management of Adolescent Illnesses (IMAI) training for health workers. Capacity building is still needed for IMAM contact points in the offering of IYCF, Integrated Management of Childhood Illness, and elimination of Mother to Child Transmission (eMTCT) services.
Nutrition Assessment The 2014 assessment found that all 46 health facilities visited have integrated nutrition assessment into routine health care, compared with findings of the 2012 assessment, when this was true for only 80 percent of hospitals, 60 percent of HC IVs, and 40 percent of the HC IIIs. Health workers at 46 facilities were conducting one or more nutrition assessment of patients, including anthropometric, biochemical, clinical, and dietary assessments. Documentation of nutrition data was not standard across all facilities, and anthropometric equipment was not receiving the routine calibration needed to ensure accuracy of nutrition assessments. Taking mid–upper arm circumference (MUAC)/weight, or both, checking for edema/pallor or both, and noting dietary history were the common assessments performed. The least performed, though greatly improved compared to the 2012 assessment, were taking length/height and estimating hemoglobin. Though the use of MUAC cutoffs increased among HC IIIs and HC IVs from 18 percent and 25 percent, respectively, in 2012 to 100 percent in 2014, the use of weigh-for-height Z (WHZ) scores, body mass index (BMI) for age Z scores, and BMI cutoff across all types of facilities increased only very slightly. These findings show that a significant gap persists in the use of nutrition assessment for classification of nutrition status.
Nutrition Counseling Health workers practice nutrition counseling in all health facilities, though it varies by type of facility and contact point. The provision of counseling services increased to 100 percent among all health facilities from 66 percent among hospitals and HC IIIs, and 33 percent among HC IVs in 2012. Individual counseling at the antiretroviral therapy (ART) service delivery point increased from an average of 50 percent in the 2012 survey to 100 percent among hospitals, 80 percent among HC IVs, and 90 percent among HC IIIs in the 2014 survey.
Nutrition Support Nutrition assessment equipment were widely available at all health facilities, but only a few counseling tools, infant scales, and height boards were available. All health facilities reported having MUAC tapes for both adults and children. Adult weighing scales were also available in all health facilities, while infant weighing scales were

Integration of Nutrition Assessment, Counseling, and Support into Uganda’s Routine Health Service Delivery | xi
lacking at some service delivery points where they are most appropriate. None of the HC IVs had a length board, and its availability was limited to only 38 percent of the hospitals and 22 percent of the HC IIIs. In addition, counseling tools, job aids, guidelines, and protocols were not widely available. Most of the health facilities managed nutrition-related supplies and drugs but continued to experience stock outs of supplies in the three months before the survey. None of the health facilities managed combined minerals or combined minerals and vitamins.
Documentation of Nutrition Data/Information The proportion of health facilities documenting MUAC assessment increased from 80 percent among hospitals, 19 percent among HC IVs, and seven percent among HC IIIs in the 2012 NACS assessment to 100 percent across all facility types. Similarly, documentation of weight assessment increased to 100 percent in all health facilities from 10 percent among hospitals, 69 percent among HC IVs, and 44 percent among HC IIIs in the 2012 survey. Irrespective of the nutrition assessment service, health workers documented nutrition services mainly in patient registers and on clinic cards in all health facilities and service delivery points. The exception was pediatric outpatient departments, where health worker routinely documented on client cards.
Quality Improvement (QI) and Supportive Supervision Survey results showed that QI teams existed in 88 percent of the hospitals, 77 percent of HC IIIs, and in all HC IVs, though the number of regular meetings and functionality of the teams were still low. On the other hand, all HC IIIs, HC IVs, and 88 percent of the hospitals reported health workers receiving technical supportive supervision. Health workers received feedback on supportive supervision mostly through verbal and written means for HC IIIs and HC IVs. In hospitals, 88 percent and 83 percent of health workers reported verbal and written feedback, respectively.
Community-based Health Services The provision of community-based nutrition services, including nutrition counseling on proper feeding practices for the entire population, is a key strategy in the prevention of malnutrition. Seventy-five percent of the hospitals, 50 percent of HC IVs, and 57 percent of the HC IIIs reported that Community-based Health Workers (CHWs) attached to their health facilities provided community-based nutrition screening. All hospitals and HC IVs, and 93 percent of HC IIIs identified CBHWs as key actors in the prevention of undernutrition at the community level through community-based nutrition counseling. CHWs are also key players in facilitating community-facility and facility-community referral mechanisms. Among the facilities with a referral mechanism, 87 percent of the HC IIIs and all hospitals and HC IVs received referrals from the communities. Health facilities linked clients to community-based services, including client treatment and support, home care, HIV counseling and testing, food security support, social support for people living with HIV (PLHIV), economic and livelihood development, community-based nutrition screening, and social support for mothers.
Conclusion This survey focused on assessing the status of the integration of nutrition services into routine health care and identifying ways to improve nutrition interventions. The ultimate goal of the survey is to improve nutritional services in all supported health facilities. Findings indicated that the delivery of nutrition services continued to improve and facilities have built capacity to manage acute malnutrition. For sustainable integration of NACS services into routine health care, program interventions should ensure continued capacity building of health workers through refresher trainings, coaching and continuous nutrition education. Nutrition program

xii | SPRING/Uganda
interventions should build the capacity of district quality improvement teams to continue conducting technical support supervision for health workers that includes their role in providing nutrition-related services.

Integration of Nutrition Assessment, Counseling, and Support into Uganda’s Routine Health Service Delivery | 1
Chapter 1. Introduction
1.1. Nutrition Situation in Uganda Despite Uganda’s great agricultural potential, the country continues to suffer from undernutrition. The 2012 survey by the Uganda Bureau of Statistics (UBOS) indicates that over three in 10 children (33 percent) are stunted, 14 percent are underweight, and five percent are wasted. In addition, over one in 10 (12 percent) of women of reproductive age are chronically energy-deficient (UBOS and ICF International 2012).
The largest proportion of undernutrition is attributed to micronutrient deficiency, with prevalence rates of vitamin A deficiency among children and women at 38 percent and 36 percent, respectively (UBOS and ICF International 2012). Furthermore, household survey data indicate that five percent of children under five are severely anemic, and the problem is more pronounced (at 13 percent) in children 6–8 months (UBOS and ICF International 2012).
Rates of undernutrition differ according to geography, with rural areas faring far worse than urban areas: 3 percent of children in urban areas are severely stunted, compared with 12 percent of children in rural areas. Furthermore, different regions suffer differently from undernutrition; for example, Karamoja sub region has the highest rate of severe stunting, at 20 percent, followed by the Southwest region, at 17 percent (UBOS and ICF International, 2012).
Malnutrition imposes great economic costs at the individual, household, community, and national levels. These costs stems from the need to address the increased susceptibility to illnesses and reduced economic productivity caused by hunger and morbidity. Malnourished children suffer from frequent illness due to low immunity, as well as mental retardation, leading to poor educational attainment. For adults, continuous hunger impedes productivity potential and pushes up health spending; in addition, stunted women give birth to low-birthweight babies, leading to a vicious cycle of malnutrition (Government of Uganda 2011).
1.2. HIV and AIDS in Uganda Uganda has a generalized HIV epidemic, with a prevalence of 6.7 percent in adults aged 15–49 and 0.7 percent in children (MoH et al. 2012). Approximately 1.1 million of 30 million Ugandans are living with HIV, and over 100,000 new infections occur annually (Uganda AIDS Commission 2009). Sexual transmission accounts for 76 percent of new HIV infections, while mother-to-child transmission (MTCT) of HIV accounts for 22 percent. Approximately 250,000 people in Uganda are receiving ART, an estimated 47 percent of those who need it (WHO, UNAIDS, and UNICEF 2011).
1.3. Responses to Nutrition and AIDS Crises in Uganda Uganda enjoys a supportive environment for fighting undernutrition: the Government of Uganda has shown its commitment to fighting undernutrition through the Uganda Nutrition Action Plan (UNAP) 2011–2016 (Government of Uganda 2011). The UNAP provides a road map for implementation of undernutrition prevention and treatment activities using a multi-sectoral approach. With the clear commitment exhibited through the UNAP, development partners such as the U.S. Agency for International Development (USAID) have provided financial and technical support to the government to combat undernutrition in children under five years and women of reproductive age in particular.
USAID supports the Government of Uganda in implementing nutrition services through programs focused on maternal and child health (MCH), HIV and AIDS, and investments in increased agricultural productivity. Within the
2 | SPRING/Uganda
portfolio of maternal and child nutrition programs, USAID has provided support for the implementing micronutrient supplementation and fortification programs; nutrition services for PLHIV, orphans, and other vulnerable children; and improvement in infant and young child nutrition services. In response to the HIV and AIDS crisis, the Government of Uganda, USAID, and partners have been fighting the spread of HIV and other infectious diseases that undermine nutrition.
Through the U.S. President’s Emergency Plan for AIDS Relief (PEPFAR), Uganda has received financial assistance to support comprehensive HIV and AIDS prevention, treatment, and control programs. HIV and AIDS activities include basic care and support, assistance to integrate TB and HIV programs, and the provision of high-quality clinical care for PLHIV (specifically in the management of opportunistic infections). The availability of ART for prevention of mother-to-child transmission of HIV has been scaled up at the community level, linking care and support activities to HIV prevention for positive living. In addition, there have been efforts to integrate nutrition into HIV and AIDS care and support services at facilities and at the community level.
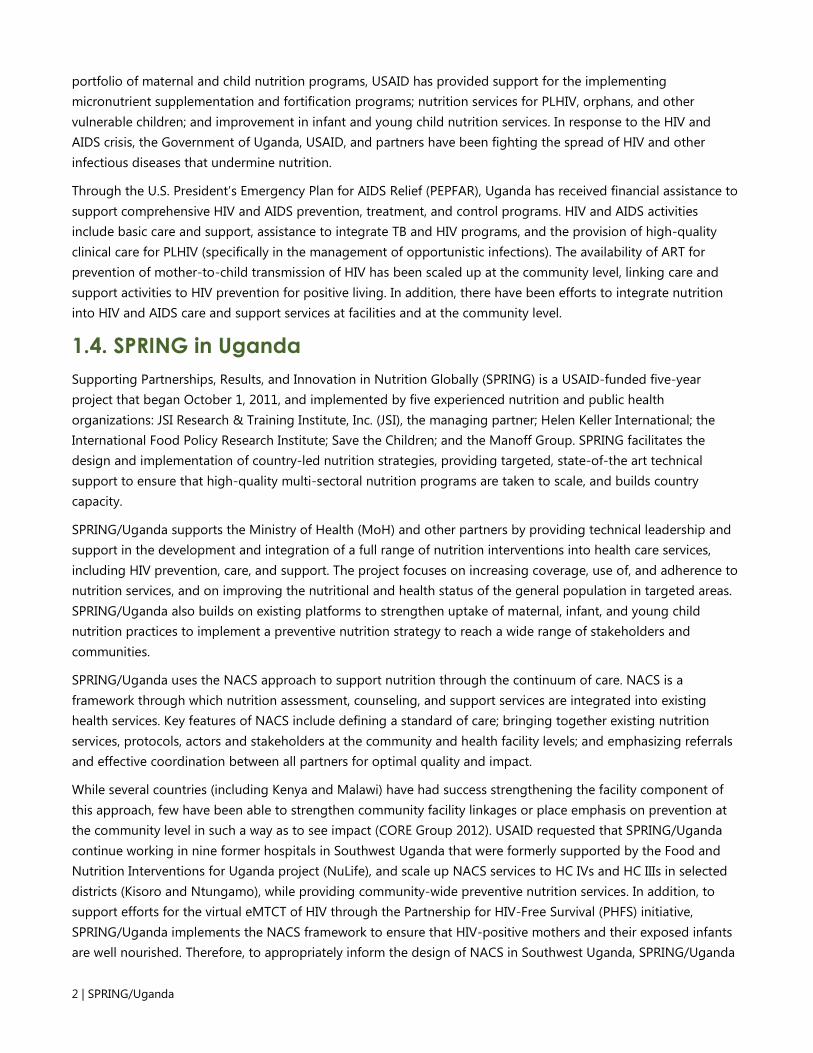
1.4. SPRING in Uganda Supporting Partnerships, Results, and Innovation in Nutrition Globally (SPRING) is a USAID-funded five-year project that began October 1, 2011, and implemented by five experienced nutrition and public health organizations: JSI Research & Training Institute, Inc. (JSI), the managing partner; Helen Keller International; the International Food Policy Research Institute; Save the Children; and the Manoff Group. SPRING facilitates the design and implementation of country-led nutrition strategies, providing targeted, state-of-the art technical support to ensure that high-quality multi-sectoral nutrition programs are taken to scale, and builds country capacity.
SPRING/Uganda supports the Ministry of Health (MoH) and other partners by providing technical leadership and support in the development and integration of a full range of nutrition interventions into health care services, including HIV prevention, care, and support. The project focuses on increasing coverage, use of, and adherence to nutrition services, and on improving the nutritional and health status of the general population in targeted areas. SPRING/Uganda also builds on existing platforms to strengthen uptake of maternal, infant, and young child nutrition practices to implement a preventive nutrition strategy to reach a wide range of stakeholders and communities.
SPRING/Uganda uses the NACS approach to support nutrition through the continuum of care. NACS is a framework through which nutrition assessment, counseling, and support services are integrated into existing health services. Key features of NACS include defining a standard of care; bringing together existing nutrition services, protocols, actors and stakeholders at the community and health facility levels; and emphasizing referrals and effective coordination between all partners for optimal quality and impact.
While several countries (including Kenya and Malawi) have had success strengthening the facility component of this approach, few have been able to strengthen community facility linkages or place emphasis on prevention at the community level in such a way as to see impact (CORE Group 2012). USAID requested that SPRING/Uganda continue working in nine former hospitals in Southwest Uganda that were formerly supported by the Food and Nutrition Interventions for Uganda project (NuLife), and scale up NACS services to HC IVs and HC IIIs in selected districts (Kisoro and Ntungamo), while providing community-wide preventive nutrition services. In addition, to support efforts for the virtual eMTCT of HIV through the Partnership for HIV-Free Survival (PHFS) initiative, SPRING/Uganda implements the NACS framework to ensure that HIV-positive mothers and their exposed infants are well nourished. Therefore, to appropriately inform the design of NACS in Southwest Uganda, SPRING/Uganda

Integration of Nutrition Assessment, Counseling, and Support into Uganda’s Routine Health Service Delivery | 3
carries out health facility assessments to continuously refine and focus its preventive and treatment strategies for undernutrition in the target population groups.
1.5. Rationale for the Assessment In 2012, SPRING/Uganda carried out an assessment of nutrition assessment counseling and support in SW project-supported facilities to provide a baseline and make recommendations for integrating NACS services into routine health service delivery. The purpose of SPRING/Uganda’s 2014 monitoring assessment was to evaluate the extent of achieving integration, identifying which components have worked well and which have not worked. The findings of the 2014 assessment will support SPRING/Uganda, the Ministry of Health (MoH), and the districts in revising and/or developing new strategies for enhancing the capacity of health facilities to implement NACS.
1.6. Overall Objectives of this Assessment The main objectives of the assessment was to better understand the current context related to the NACS framework programming in supported health facilities in the SW and EC regions. In addition, determine the availability of the required essential elements of nutrition services (assessment tools, counseling skills and tools, and availability of supplies such as micronutrient supplements, drugs, and therapeutic and supplementary foods) for adults and children in supported health facilities and at the community level.
1.7. Specific Objectives of the Assessment The 2014 monitoring study pursued the following specific objectives:
1. To assess the existing capacity of health facilities (e.g., supplies and equipment) to implement nutrition interventions for populations in their catchment areas
2. To determine the knowledge and skills of health workers in relation to nutrition-related care and support services for clients
3. To identify gaps in information and feedback mechanisms that can be addressed to improve quality of services in selected health facilities
4. To assess the sources of motivation for improved performance among health workers
5. To assess the role of community health workers in delivering preventive and treatment nutrition services for vulnerable groups, including people living with HIV.

4 | SPRING/Uganda

Integration of Nutrition Assessment, Counseling, and Support into Uganda’s Routine Health Service Delivery | 5
Chapter 2. Methodology 2.1. Design The assessment employed a cross-sectional survey design to collect primary data and review secondary data sources using both quantitative and qualitative methods. These methods included face-to-face interviews with administrators, health workers, and clients. A multidisciplinary team led by SPRING/Uganda’s monitoring and evaluation analysts executed the assessment. The assessment triangulates the findings to reinforce each another and deepen understanding of the current context related to the NACS framework programming.
2.2. Study Areas The assessment design focused on all 51 project-supported health facilities in the 10 SPRING/Uganda intervention districts (Bushenyi, Ibanda, Kabale, Kanungu, Kisoro, Mbarara, Namutumba, Ntungamo, Rukingiri, and Sheema). However, the assessment reached only 46 health facilities due to study limitations highlighted in Section 2.9. Among the 46 health facilities reached, HC IIIs accounted for 65.2 percent, hospitals for 17.4 percent and HC IVs for 17.4 percent of facilities surveyed. In SW Uganda, 42 health facilities were included in the survey: 20 in Kisoro, 17 in Ntungamo, and one hospital from each of the other districts in SW Uganda. In EC Uganda, four health facilities were included in the survey. Overall, 44 percent of facilities surveyed were in Kisoro district, 37 percent in Ntungamo, nine percent in Namutumba, and two percent each were in from Bushenyi, Kabale, Kanungu, Rukungiri, Sheema, and districts (Annex I).
2.3. Data Collection Methods The assessment used four tools to collect quantitative data for assessing nutrition services and the capacity of health facilities and systems to carry out these services. The health facility tool collected data to measure issues related to the facility; management and administration; environment (including supplies, materials [e.g., manuals], equipment [e.g., weighing scales, MUAC tapes], and space (e.g., for holding assessment or counseling); and feedback mechanisms. The health worker survey tool assessed knowledge, skills, practices, roles, responsibilities, and training related to preventive and treatment nutrition services. These methods helped in identifying existing gaps that affect the implementation of nutrition assessment, counseling, management skills, or knowledge of key nutrition and hygiene actions for improved nutrition status among infants and young children 0–24 months, pregnant and lactating women, and PLHIV.
The assessment used qualitative methods to explore client satisfaction with nutrition services offered in different health facility service points. The assessment team conducted exit interviews with clients after they received services. Using both quantitative and qualitative methods combined the strengths of each method to provide a more holistic perspective of the situation. This in turn supported the development of recommended interventions that are relevant and essential for enhancing the capacity of health facilities to implement NACS going forward.
2.4. Sampling of Study Sites and Participants The assessment targeted all SPRING/Uganda-supported health facilities in the 10 districts, conducting interviews with health facility in-charges for all facilities for both facility-based and community outreach services. They provided general information about their facilities, management and administration, environment, feedback mechanisms, and performance of community outreach services. Heads of departments in pediatrics, nutrition, antenatal care (ANC), delivery and post-partum, the pediatric outpatient department (OPD), well child clinics, sick

6 | SPRING/Uganda
child clinics, family planning (FP), community services, infectious diseases and HIV and AIDS, and pharmacy were interviewed for information on NACS services provided to children and adults in their facilities. Health workers from HIV/ART, ANC, FP, postnatal, delivery and immediate postpartum, the young child clinic (YCC), community outreach, and IMAM/nutrition service delivery points were also interviewed.
In hospitals, selection of health workers to interview by service point depended on the number of each cadre present on the day of the survey. One member of each cadre present per department was selected for participation. If, for example, a department was staffed by three comprehensive nurses (i.e., more than one person of the same training), then one nurse was randomly selected to participate in the study from the list of nurses assigned to that department. The team interviewed one randomly selected person from each training group. The team selected a maximum of three health workers if a department comprised of one physician, one nurse, and one midwife (i.e., two or more persons of varied training). For HC IVs, the team interviewed a maximum of two health workers present. In HC IIIs, one health worker present at each contact point was chosen. The number of health workers in a facility varied by type of facility and therefore the targeted number respondents was adjusted accordingly, as summarized in Table 2.1.
Table 2.1. Summary of sample composition for facility health providers
Facility Level No.
Facilities No. Contact
Points No. Health Providers
per Contact Point Total No. Health
Providers
Regional referral hospitals and district general hospitals
10 9 3 250
HC IVs 8 5 2 88
HC IIIs 33 4 1 165
Total 51 503
Selection of clients from ANC, ART/early infant diagnosis (EID), and pediatric OPD nutrition service delivery points for client exit interviews was purposive and depended on the client load per day per selected service contact point. The number of clients selected was based on the average client load experienced by facility type over the period of the previous year (March 2013–February 2014). The number of clients selected for participation varied by type of health facility (Table 2.2). The number of clients participating in client exit interviews also varied by type of facility; at regional referral hospitals, a maximum of 45; at hospitals, a maximum of 24; and at HC IVs, a maximum of six. The research team also conducted at least one client exit interview at each HC III (Table 2.2).
Table 2.2. Summary of sample size for client exit interviews
Facility Level No. Facilities No. Client Exit Interviews Total
Regional referral hospital 2 45 90
District or general hospital 8 24 192
HC IVs 8 6 48
HC IIIs 33 1 33
2.5. Data Analysis Quantitative data were analyzed using SPSS 19 and Microsoft Excel 2013 to obtain descriptive statistics, frequencies, and percentages. Bivariate analysis was the main mode of analysis used. The percentage of health

Integration of Nutrition Assessment, Counseling, and Support into Uganda’s Routine Health Service Delivery | 7
facilities by level with availability of specific supplies, infrastructure, anthropometric equipment, and QI practices was determined. Staffing levels by cadre and number was determined and expressed as percentage. To specifically tease out the differences in performance, analysts disaggregated the analysis by health service provision contact points, sex, and technical qualification, types of nutrition-related trainings obtained, and provision of NACS services.
The percentage of health service providers providing NACS services to PLHIV, pregnant women, and lactating mothers according to the standards was established. In addition, analysts disaggregated the provision of NACS by health facility type, technical qualification level of the health worker, and type of the clients seen (pregnant women, lactating mothers, and PLHIV in ART clinic).
2.6. Quality Assurance and Control Plan Quality assurance was an integral part of the survey process, and entailed the following broad strategies:
• Adoption and scrutiny of appropriate sampling methodologies for consistency and representativeness where necessary
• Recruiting of competent and experienced field data collection research assistants
• Training and orientation of field research assistants to ensure familiarity with the objectives of the assessment, tools, and process
• Development of a report outline and dummy tables for final reporting
• Ensuring that each survey team had a team lead to ensure compliance with survey protocol and procedures during the data collection process
• Adoption of systematic procedures for data capture and management
2.7. Ethical Considerations The study protocol (along with tools and consent form) was shared with the Institutional Review Board of Makerere University School of Public Health for renewal, since the protocol had gotten ethical approval prior to the 2012 assessment. The district leadership (Chief Administrative Officer) for each district provided approval for the study, and health workers and clients provided informed consent before participating in the survey. Only those who consented took part in the study, with the freedom to discontinue participation at any time. Data collected from the field were stored securely to protect personal information, and access to the confidential data was limited to core research team members. This report preserves the confidentiality of all personal identities.
2.8. Implementation of the Assessment and the Management Plan The assessment was implemented under the leadership of a principal investigator from SPRING/Uganda, assisted by co-investigators from SPRING and Makerere University. The investigators led in recruitment and training of research assistants, mobilizing respondents in the targeted districts in SW and EC Uganda, developing and pre-testing study tools, supervising fieldwork, cleaning and analyzing data, drafting and writing the final report, validating data, and disseminating key findings. SPRING/Uganda led the management of this health facility assessment and all the logistical, financial, and human resource arrangements, as well as execution in the field. SPRING/Uganda recruited 20 research assistants (RAs), graduates with experience in implementing health facility

8 | SPRING/Uganda
and community research. Among these, SPRING/Uganda identified three RAs with experience in data entry and management to carry out data entry upon completion of the data collection phase. Research assistants were required to understand and speak Runyakitara/Rukiga, Kifumbira, and Lusoga, local languages for the study areas.
In Mbarara, the training team trained all research assistants for three days in research ethics, methodology, and the study tools. SPRING/Uganda staff carried out the training using the classroom mode of training and hands-on sessions and conducting pre-testing of the research tools in Mbarara district. The tools were refined based on comments received during the pre-testing exercise.
The RAs were organized into three teams of four members each for data collection. The first team covered the formerly NuLife-supported hospitals in Bushenyi, Ibanda, Kabale, Kanunguthe, Mbarara, Rukungiri, and Sheema. The second team covered Kisoro and Ntungamo districts, reaching 3 hospitals, seven HC IVs and 27 HC IIIs. The third team covered Namutumba district, reaching one HC IV and 3 HC IIIs. Each research team covered at least one –2 facilities per day for the facility survey, health worker interviews, and client exit interviews. In addition to participating in data collection, each team leader played a supervisory role and the served as coordinator between data collection team members and the principal investigator.
To promote partnership and ownership at the district level, the team involved one representative of each district health office to help in mobilizing and coordinating with health facility staff in Kisoro, Ntungamo, and Namutumba districts.
2.9. Study Limitations As with all self-reported data, biases may affect the accuracy of information on knowledge, competency and skills from health workers when compared with verified information. In addition, the cross-sectional nature of the survey enables use of results to show associations but not causality.
Conducting the semi-structured interviews in the local languages of Runyankole/Rukiga, Kifumbira, and Rusoga and translated into English, which could have resulted in some loss of detail and subtleties in translation.
The study registered nonresponses from Ibanda Hospital, which affected the study sample. Due to logistical challenges, data collection in Mbarara Regional Referral Hospital was incomplete, which further reduced the study sample. As a result, analysis excludes data from Mbarara regional referral. In addition, some Bukonte, Bulange, and Nabisoige HCs could not be included because SPRING/Uganda had not begun implementation of activities in these facilities. In the four health facilities reached in Namutumba, the research assistants did not administer the health worker survey tool, which reduces the sample size for health workers interviewed. Hence, the assessment covered 46 health facilities out of the 51 supported facilities.

Integration of Nutrition Assessment, Counseling, and Support into Uganda’s Routine Health Service Delivery | 9
Chapter 3. Key Findings This section of the report presents the key findings from the assessment in line with the survey objectives by type of facility and at times by service delivery point/contact point. Contrary to the 2012 assessment, the 2014 report puts emphasis on progress made in the integration of nutrition services into routine health service delivery rather than comparing findings from SPRING/Uganda districts (Kisoro and Ntungamo) to formerly NuLife-supported hospitals. This approach enables easy comparability of facilities, making possible identification of areas of best practices and gaps for improvement, by type of facility.
3.1. Capacity of health facilities to implement nutrition interventions The assessment aimed to identify the capacity gaps of supported health facilities in offering quality nutrition services for informing adjustments in the design of interventions, as well as designing new interventions relevant and essential for enhancing the capacity of health facilities to implement NACS.
Assessment of the health workforce took place at seven key service delivery points (ANC, maternity/FP/postnatal care, the pediatric OPD, HIV/EID, nutrition/IMAM, community outreach, and medical social workers department). There were few (2) specialized medical doctors (i.e., pediatricians, OB/GYNs, or surgeons).1
All the hospitals had at least one general physician working at different service delivery points. On average, six medical officers and medical clinical officers worked across the different service delivery points, though majority of them were working in the pediatric OPD.
Nurses, midwives, and nursing assistants make up the bulk of the health work force and most are working in ANC, maternity/family planning/postnatal, or the pediatric OPD (Table 3.1). There were only five nutritionists across all the facilities surveyed only Chahafi HC IV and Kabale,2 Kambuga, Kisoro, and Kitagata Hospitals reported the availability of a nutritionist.
Table 3.1. Number of health workers surveyed, by service delivery point
Technical Qualifications of Providers*
Number of Health Providers Working in Different Health Departments
AN
C
Mat
erni
ty/
Post
nata
l Ca
re/F
P
Pedi
atri
c O
PD
HIV
/EID
Com
mun
ity
Out
reac
h
Med
ical
So
cial
W
orke
rs’
Dep
t.
Nut
riti
on/
IMA
M
Pediatrician 0 0 0 0 0 0 0
OB/GYN 0 2 0 0 0 0 0
General physician/medical officer
5 7 20 9 2 2 1
Medical clinical officer 9 4 32 8 2 0 1
Nurse 40 51 97 27 26 5 12
1 Only St. Francis Hospital in Mutolere and Kabale Regional Referral Hospital reported the availability of an OB/GYN in the maternity department. 2 Kabale Regional Referral Hospital reported having two nutritionists attached to its pediatric clinic.

10 | SPRING/Uganda
Technical Qualifications of Providers*
Number of Health Providers Working in Different Health Departments
AN
C
Mat
erni
ty/
Post
nata
l Ca
re/F
P
Pedi
atri
c O
PD
HIV
/EID
Com
mun
ity
Out
reac
h
Med
ical
So
cial
W
orke
rs’
Dep
t.
Nut
riti
on/
IMA
M
Midwife 50 48 11 12 9 3 3
Nursing assistant 27 24 65 15 20 4 5
Nutritionist 0 0 2 0 0 0 3
Health educator 9 7 8 12 14 7 1
Pharmacist 3 1 1 2 0 0 1
*Grouped categories: Nurse includes registered nurse, registered comprehensive nurse, enrolled nurse, and enrolled comprehensive nurse; Midwife includes enrolled midwife and registered midwife; Nursing Assistant includes nursing aide and auxiliary nurse; Health Educator includes social worker and counselor; Nutritionist, Pharmacist, and Medical Clinical Officer stand alone.
3.2. Knowledge and Skills/Competencies of Health Workers for NACS Services Knowledge and skills of health providers influence the quality of services provided during health service delivery. This section provides details on the skills of health workers in relation to the provision of nutrition services.
3.2.1. Training for Health Workers The survey assessed health facilities’ capacity to implement nutrition services by looking at whether the health facilities’ workers received training on a nutrition-specific topics/skills. Reported training provides a basis for identifying which levels of health facilities need to be targeted for capacity building in specific nutrition knowledge and skills. On average, over 25 percent of health workers had received training in NACS and eMTCT, and slightly over 10 percent had received training in IMAM in all facility types. On the other hand, only a handful (< eight percent) of health workers had received IYCF training in hospitals and HC IVs as opposed to 19 percent in HC IIIs. Training in BFHI was found to be lacking across all facility types (Table 3.2).
Table 3.2. Preservice training of health workers in nutrition-related topics within previous 12 months
Nutrition Training Topics Hospital (%) HC IV (%) HC III (%)
IYCF 7.2 2.9 18.9
IMAM 13.3 11.8 13.7
IMCI* 8.7 17.6 6.8
NACS 25.1 29.4 24.7
BFHI 5.1 2.9 5.9
eMTCT 29.2 35.3 25.1
IMAI** 11.3 0.0 4.8
*Integrated Management of Childhood Illness; **Integrated Management of Adolescent Illnesses

Integration of Nutrition Assessment, Counseling, and Support into Uganda’s Routine Health Service Delivery | 11
3.2.2. Nutrition Assessment The assessment collected data on commonly used nutrition assessments (taking MUAC, weight, or height; clinical assessment of dietary/feeding history; checking for pallor as signs of undernutrition/nutrient deficiencies) in routine health care. All health facilities assessed had integrated one or more nutrition assessment methods in routine health care delivery.
Nurses and midwives jointly provide 80 percent and 75 percent, respectively, of the basic minimum nutrition assessment in hospitals and HC IVs, and 69 percent in HC IIIs (Table 3.3). In addition, clinical officers conduct 20 percent of nutrition assessments across all facility types. Village health teams (VHTs) and peer educators play a substantial role in conducting nutrition assessments in HC IIIs.
Table 3.3. Percentage of health workers by cadre providing nutrition assessment, by facility type
Health Worker Providing Nutrition Assessment Hospital (n = 8)
(%) HC IV (n = 8)
(%) HC III (n = 30)
(%)
Nurse/midwife 80.0 75.0 69.8
Clinical officer 20.0 25.0 16.3
Peer educator 0.0 0.0 4.7
VHT 0.0 0.0 9.3
At the hospital level, the most common assessments routinely offered are taking MUAC, height/length, checking for edema, and checking for pallor. The least practiced was estimating hemoglobin, which was done at 88 percent of the hospitals, at 43 percent of HC IVs, and at 32 percent of HC IIIs. While all hospitals took height/length, only 88 percent and 52 percent of HC IVs and IIIs did, respectively (Table 3.4).
Table 3.4. Availability of nutrition assessment services, by facility type
Nutrition Assessment Hospital (n = 8)
(%) HC IV (n = 8)
(%) HC III (n = 30)
(%)
Taking MUAC 100 100 100
Taking height/length3 100 88 52
Taking weight 100 100 100
Checking for edema 100 100 100
Checking for pallor (i.e., pale palms and inner eyelids) 100 100 100
Estimating hemoglobin 88 43 32
The assessment found that health workers take MUAC and weight across all health facilities and service delivery points. All hospitals and HC IVs check for edema and take clients’ dietary history, while 96 percent and 89 percent of the HC IIIs check for pallor and take clients’ dietary histories, respectively (Table 3.5).
3 14 facilities reported not taking height/length of patients (Buhozi, Bukimbiri, Gasovu, Iremera, Kagano, Kagezi, Kinanira, Muramba, Nyakyera, Nyarubuye, Nyarusiza, Rubuguri, Rutaka, and Rwekiniro)

12 | SPRING/Uganda
Table 3.5. Percentage of facilities that include nutrition assessment in routine services, by facility type
Nutrition Status Assessment Methods Hospital (n = 8)
(%) HC IV (n = 7)
(%) HC III (n = 27)
(%)
Taking MUAC 100 100 100
Taking height 78 100 70
Taking weight 100 100 100
Checking for edema 89 100 96
Checking for pallor (i.e., pale palms and inner eyelids)
100 100 96
Hemoglobin estimation 100 71 33
Taking dietary history 100 100 89
Health facilities have integrated nutrition-specific services including asking about breastfeeding, dietary practices, frequency of meals, and consumption of iron-rich and Vitamin A–rich foods in health service delivery. These are important in the design and implementation of health education and counseling talks for clients seeking health care services. Nutrition-specific practices that health workers asked about, across all facility types were breastfeeding practices in 88 percent, 100 percent, and 90 percent at hospitals, HC IVs and HC IIIs, respectively; and dietary practices in 88 percent of hospitals and HC IVs, and 87 percent of HC IIIs (Table 3.6). Asking about dietary practices involves assessing food and fluid intake. It provides information on dietary quantity and quality, change in appetite, food allergies and intolerance, and reasons for inadequate food intake during or after illness. The results are compared with recommended intake such as recommended dietary allowance (RDA)4 to counsel clients on how to improve their diets to prevent undernutrition or treat conditions affected by food intake and nutritional status (e.g., cardiovascular disease, cancer, obesity, diabetes, and hyperlipidemia). Some common ways to assess dietary intake described are here, although some may be time-consuming for health care providers. The least-asked-about practice in hospitals was the number of meals eaten during the previous day (25 percent); in HC IVs, the practice least asked about was consumption of Vitamin A–rich foods during the previous week (38 percent). Asking about two these practices in HC IIIs, however, averages over 50 percent (Table 3.6).
Table 3.6. Percentage of health facilities providing nutrition-specific services, by facility type
Nutrition-Specific Practice Recorded Hospital (n = 8)
(%) HC IV (n = 8)
(%) HC III (n = 30)
(%)
Asking about breastfeeding practices 88 100 90
Asking about dietary practices 88 88 87
Asking number of meals eaten during the previous day 25 50 57
Asking about iron-rich foods eaten during the previous week
63 50 60
Asking about vitamin A–rich foods eaten during the previous week
50 38 62
4 RDA is the amount of each micronutrient (vitamin and mineral) the average person needs each day.

Integration of Nutrition Assessment, Counseling, and Support into Uganda’s Routine Health Service Delivery | 13
3.2.3. Nutrition Status Classification Health care providers classify clients’ nutritional status to determine appropriate counseling messages, eligibility for treatment of undernutrition, and nutrition care plans and to monitor clients’ recovery from undernutrition. The most indices most commonly used for classifying undernutrition include MUAC cutoffs, WHZ scores, and weight-for-age Z (WAZ) scores, based on the Uganda MoH Integrated Management of Acute Malnutrition Guidelines (2010).
On average, all service delivery points in all health facilities reported using MUAC cutoffs in the classification of malnutrition. The use of other indices for classification of nutrition status (including WHZ scores, WAZ scores, BMI-for-age scores, and BMI cutoffs), was low across all health facilities. In hospitals, the widely used indicators for classifying undernutrition are WHZ scores and WAZ scores (56 percent). The least-used indicators for classification of undernutrition across all health facilities and service delivery points are BMI-for-age Z scores and BMI cutoffs (Table 3.7).
Table 3.7. Classification of malnutrition, by facility type
Indicators for Classifying Malnutrition Hospital (n = 8)
(%) HC IV (n = 7)
(%) HC III (n = 26)
(%)
MUAC cutoffs 100 100 100
Weight-for-height Z scores) 56 14 23
Weight-for-age Z scores) 56 29 35
BMI-for-age Z scores 22 14 15
BMI cutoffs 22 14 27
3.2.4. Documentation of Nutrition Information Documentation of nutrition services varied across the different service delivery points. The common nutrition services documented by the health facilities were taking weight, taking MUAC, taking height/length, taking BMI, checking for edema, and hemoglobin estimation.
For all services in the pediatric OPD, health workers documented nutrition information mainly on client cards in hospitals and HC IVs, and in patient registers and client cards in HC IIIs. Patient registers were also widely used in hospitals and HC IVs, and clinic reports in hospitals (Fig. 3.1).

14 | SPRING/Uganda
Figure 3.1. Percentage of facilities reporting nutrition documentation in pediatric OPD, by facility level
Across all facility types, health workers documented nutrition information at the ANC service delivery point mostly in patient registers, and in client cards like mother’s passport. Clinic reports were also widely used in HC IIIs to document nutrition information in ANC (Fig. 3.2).
Figure 3.2. Percentage of facilities reporting nutrition documentation in ANC, by facility type
In the YCC, health workers documented nutrition information mostly in patient registers in hospitals and HC IIIs; health workers used mostly child health cards for this purpose in HC IVs. Child health cards and patient registers were also widely used in hospitals and HC IIIs (Fig. 3.3).
0%
10%
20%
30%
40%
50%
60%
70%
80%
90%
100%
Hospital (n=8) Health Center IV (n=7) Health Center III (n=25)
Patient registers Clients card Clinic reports Child Health Card
0%
10%
20%
30%
40%
50%
60%
70%
80%
90%
100%
Hospital (n=8) Health Center IV (n=7) Health Center III (n=26)
Patient registers Clients card Clinic reports Child Health Card

Integration of Nutrition Assessment, Counseling, and Support into Uganda’s Routine Health Service Delivery | 15
Figure 3.3. Percentage of facilities reporting nutrition documentation in YCC, by facility type
The assessment found that documentation (recording of nutrition parameters on the tools) of nutrition information varied by health facility type. All hospitals reported documenting classification of nutrition status and distribution of iron–folic acid; over 75 percent documented height, weight, MUAC, and ready-to-use therapeutic food (RUTF) distribution; relatively few (< 70 percent) recorded nutrition counseling and topic counseled on. All HC IVs reported documenting all services except for height, RUTF distribution, nutrition counseling, and topics counseled on. Of all the health facility types, HC IIIs had the least- documentation practice. Only 30 percent of HC IIIs documented providing undernourished clients with RUTF and nutrition counseling—likely, because many do not manage RUTF (Table 3.8).
Table 3.8. Percentage of facilities documenting nutrition assessment indicators, by facility type
Nutrition Assessment Information Recorded Hospital (n = 8)
(%) HC IV (n = 8)
(%) HC III (n = 30)
(%)
Height 75 88 70
Weight 88 100 93
MUAC 88 100 93
Classification of nutritional status 100 100 87
Iron–folic acid distributed to pregnant women 100 100 100
Undernourished clients who received RUTF 88 75 30
Nutrition counseling provision 63 75 60
Topic of nutrition counseling provided 38 25 53
3.2.5. Equipment and Tools for Nutrition Assessment The survey assessed the availability of equipment and tools for nutrition assessment at different health facility contact points in order to establish health workers’ capacity to routinely conduct appropriate nutrition assessment.
In the pediatric OPD, ANC, and YCC, nutrition assessment tools were available in most facilities across all service delivery points. Nutrition assessment tools were available in most facilities across all service delivery points. On
0%
10%
20%
30%
40%
50%
60%
70%
80%
90%
100%
Hospital (n=8) Health Center IV (n=7) Health Center III (n=25)
Patient registers Clients card Clinic reports Child Health Card

16 | SPRING/Uganda
average, all health facilities had MUAC tapes for both children and adults (but not all hospitals and HC IIIs had them for YCC clinic), and adult and infant weighing scales. Length boards remained the least-available equipment in all health facilities. In the pediatric OPD, none of the HC IVs had a length board. In the young child clinic, 63 percent of hospitals had length boards, 20 percent of HC IVs, and 13 percent of HC IIIs (Table 3.9).
Table 3.9. Availability of equipment for assessment of nutrition status, by service point and facility type
Service Delivery Point/Facility Types
Infa
nt/P
edia
tric
Sc
ale
(%)
Adu
lt W
eigh
ing
Scal
e (%
)
Leng
th B
oard
(%)
Stad
iom
eter
(for
A
dult
s) (%
)
MU
AC
Tape
s (A
dult
s) (%
)
MU
AC
Tape
s (C
hild
ren)
(%)
Pediatric OPD
Hospital 63 100 38 25 88 100
HC IV 14 86 0 50 86 100
HC III 81 96 22 33 88 100
ANC
Hospital 38 100 50 100
HC IV 57 100 57 100
HC III 57 100 64 96
YCC
Hospital 100 63 88
HC IV 80 20 100
HC III 83 13 96
3.2.6. Nutrition Counseling Nutrition counseling is a key component in the implementation of the NACS framework. Health workers offer nutritional counseling to clients to improve clients’ knowledge, attitudes, and skills on appropriate feeding practices using the available local foods. For undernourished clients, this may entail developing a tailored nutrition plan designed to lead to healthy lifestyle choices. Nutrition counseling, therefore, focuses on key messages for the promotion of optimum IYCF, maternal nutrition, and proper nutrition for the HIV-positive and the sick. Health facilities should offer nutrition counseling continuously, at all visits and service contact points. All hospitals, all HC IVs, and 97 percent of HC IIIs have at least one staff trained in nutrition counseling. Furthermore, all health facilities that participated in the study have integrated nutrition counseling into their routine service at one or more contact points.
To ascertain the service delivery points where health workers conduct nutrition counseling, unit in-charges were asked about provision of nutrition counseling at their service delivery points. All hospitals provided individual nutrition counseling at the pediatric OPD, ART, and nutrition service delivery points. HC IVs and IIIs that had nutrition service delivery points also provided individual nutrition counseling to their clients. Among HC IVs, 68 percent of facilities provided individual nutrition counseling in the pediatric OPD, 80 percent in ART, and 71

Integration of Nutrition Assessment, Counseling, and Support into Uganda’s Routine Health Service Delivery | 17
percent in ANC. Findings showed that 85 percent of HC IIIs provided individual nutrition counseling in the pediatric OPD, 90 percent in ART, 72 percent in ANC, and 50 percent in YCC (Table 3.10).
Table 3.10. Proportions of facilities providing nutrition counseling at different service points
Service Delivery Point Hospital
(%) n
HC IV (%)
n HC III (%)
n
Pediatric OPD 100 7 86 7 85 27
ART 100 8 80 5 90 20
ANC 63 8 71 7 72 25
YCC 89 8 100 1 50 2
Nutrition 100 7 100 1 100 1
Health workers should offer nutrition counseling at every contact with all clients at all health facility service contact points. Survey results revealed that 38 percent of hospitals, 62 percent of HC IVs, and 47 percent of HC IIIs provided nutrition counseling to clients on every visit. Twelve percent and six percent of HC IV and III, respectively, reported that the provision of nutrition counseling was inconsistent. A greater percentage of hospitals (62 percent) provided nutrition counseling as needed (dependent on client’s needs), compared with 47 percent of HC IIIs and 25 percent of HC IVs (Table 3.11).
Table 3.11. frequency of nutrition counseling, by facility type
Frequency Hospital (n = 8)
(%) HC IV (n = 8)
(%) HC III (n = 30)
(%)
At every visit 38 63 47
As needed (dependent on client’s needs) 62 25 47
Varies 0 12 6
The survey assessed the provision of nutrition care and support services to maternal and child health MCH clients, including referring/treating clients with undernutrition, counseling sustained exclusive breastfeeding for six months, managing common breastfeeding problems, deworming, providing vitamin A and iron folic acid (IFA) supplements to mothers and children, and assuring early infant diagnosis, among others. HC IVs (82 percent) and HC IIIs (80 percent) are doing slightly better than hospitals (75 percent) at giving nutrition support and care services to MCH clients. Twelve percent of hospital health workers reported not giving support to these clients at all, compared with eight percent and seven percent of health workers in HC IIIs and IVs, respectively (Fig. 3.4).
18 | SPRING/Uganda
Figure 3.4. Providing nutrition care and support to mothers, by facility type
Counseling HIV-positive mothers on proper feeding, care, and support as well as better health-seeking behaviors is a good practice to ensure better health and positive living. The team asked health workers about the routine of offering counseling covering drug adherence, weight monitoring, and better health-seeking behavior—for example, early treatment of diseases (malaria and diarrhea), deworming, and living an active lifestyle. Results show that 38 percent of hospitals offered counseling to HIV-positive clients on a routine basis about any of these topics, compared with 74 percent and 76 percent of HC IIIs and HC IVs, respectively. Hospitals and HC IIIs had higher rates (7 percent) of not offering counseling support to HIV-positive clients HC IVs (one percent) (Fig 3.5).
Figure 3.5. Counseling for HIV-positive mothers, by facility level
3.2.7. Protocols and Counseling Materials Nutrition assessment guidelines in Uganda include policy guidelines on BFHI, IYCF, and IMAM. Availability of these in facilities is important for providing prompt reference for specific client needs and ensuring that health workers adhere to standards across all health facilities and levels.
Overall, most facilities surveyed did not have BFHI guidelines available at all service delivery points (Table 3.12). Among the hospitals, only 25 percent of facilities reported having BFHI guidelines in both the pediatric OPD and ANC—although the research team did not observe the guidelines at these contact points. Of the 28 percent and 34 percent of health workers (across all facility types) reporting BFHI guidelines in YCC and the nutrition clinic, the
12
7
8
4
2
3
9
9
10
75
82
80
Hospital
Health Center IV
Health Center III
Never Occasionally Sometimes Always
6
1
7
3
1
4
8
21
15
83
76
74
0 10 20 30 40 50 60 70 80 90 100
Hospital
Health Center IV
Health Center III
Never Occasionally Sometimes Always

Integration of Nutrition Assessment, Counseling, and Support into Uganda’s Routine Health Service Delivery | 19
survey team observed the presence of these guidelines at only 14 percent and 17 percent of these clinics, respectively.
Among HC IVs, 43 percent of facilities reported having BFHI guidelines in the pediatric OPD, 20 percent in ART (observed/seen), and 33 percent in YCC (not seen). No HC IVs reported having these guidelines in ANC and nutrition service delivery points. Among HC IIIs, only four percent of facilities reported having BFHI guidelines in the pediatric OPD, six percent in ART, nine percent in ANC, and 33 percent in nutrition, but the interviewers did not see these guidelines. In YCC, 17 percent of HC IIIs reported having BFHI guidelines, four percent of the facilities made the guidelines available to the interviewers.
Table 3.12. Percentage of health facilities with BFHI guidelines, by service point and facility type
Service Point Hospital
(%) HC IV (%)
HC III (%)
Pediatric OPD
Yes, observed 0 14 0
Yes, not seen 25 29 4
No 75 57 96
Total n = 4 n = 7 n = 23
ART
Yes, observed 0 20 0
Yes, not seen 14 0 6
No 86 80 94
Total n = 7 n = 5 n = 18
ANC
Yes, not seen 25 0 9
No 75 100 91
Total n = 8 n = 6 n = 22
YCC
Yes, observed 14 0 4
Yes, not seen 14 33 13
No 71 67 83
Total n = 7 n = 3 n = 23
Nutrition
Yes, observed 17 0 0
Yes, not seen 17 0 33
No 67 100 67
Total n = 6 n = 1 n = 3
Examining the availability (Observed or not) of IYCF guidelines the results indicates that among hospitals, 57 percent had IYCF guidelines in the pediatric OPD, 86 percent in ART, 66 percent in ANC, 86 percent in YCC, and 63 percent in nutrition (Table 3.13). Among HC IVs, 33 percent had IYCF guidelines in the pediatric OPD, 25 percent had them in ART, and 50 percent had them in ANC and YCC, respectively; none were observed, however, to have IYCF guidelines in YCC (Table 3.13). Similarly, few HC IIIs had IYCF guidelines; only 25 percent had the guidelines in the pediatric OPD, 36 percent in ART, 30 percent in ANC, and 24 percent in YCC; none of the HC IIIs had IYCF guidelines at the nutrition service delivery point.

20 | SPRING/Uganda
Table 3.13. Percentage of health facilities with IYCF guidelines, by service point and facility type
Service Point Hospital
(%) HC IV (%)
HC III (%)
Pediatric OPD
Yes, observed 14 0 4
Yes, not seen 43 33 21
No 43 67 75
Total n = 7 n = 6 n = 24
ART
Yes, observed 71 25 12
Yes, not seen 14 0 24
No 14 75 65
Total n = 7 n = 4 n = 17
ANC
Yes, observed 44 33 4
Yes, not seen 22 17 26
No 34 50 70
Total n = 9 n = 6 n = 23
YCC
Yes, observed 43 25 10
Yes, not seen 43 25 14
No 14 50 76
Total n = 7 n = 4 n = 21
Nutrition
Yes, observed 50 0 0
Yes, not seen 13 0 0
No 38 100 100
Total n = 8 n = 1 n = 3
Among hospitals, only 14 percent had IMAM guidelines in the pediatric OPD, 26 percent in ART, 33 percent in ANC, 50 percent in YCC, and 71 percent at the nutrition service delivery point (Table 3.14). Among HC IVs, only 17 percent had IMAM guidelines in the pediatric OPD. A small number of HC IIIs reported having IMAM guidelines in the pediatric OPD, ART, ANC, YCC, and nutrition, but the survey teams did not see these guidelines.

Integration of Nutrition Assessment, Counseling, and Support into Uganda’s Routine Health Service Delivery | 21
Table 3.14. Percentage of facilities with IMAM guidelines, by service point and facility type
Service Point Hospital
(%) HC IV (%)
HC III (%)
Pediatric OD
Yes, not seen 14 17 17
No 86 83 83
Total n = 7 n = 6 n = 23
ART
Yes, observed 13 0 0
Yes, not seen 13 0 13
No 75 100 88
Total n = 8 n = 4 n = 16
ANC
Yes, observed 11 0 0
Yes, not seen 22 0 5
No 67 100 95
Total n = 9 n = 5 n = 22
YCC
Yes, observed 25 0 0
Yes, not seen 25 0 10
No 50 100 90
Total n = 8 n = 3 n = 21
Nutrition
Yes, observed 43 0 0
Yes, not seen 29 0 33
No 29 100 67
Total n = 7 n = 1 n = 3
Although more facilities reported having BFHI guidelines, only a fraction of them were implementing the guidelines. Among hospitals, 50 percent were implementing BFHI in ANC, YCC, and nutrition; 67 percent were implementing them in ART and 100 percent in the pediatric OPD (Table 3.15). Among HC IVs, all facilities that had BFHI guidelines were implementing them at the ART and YCC service delivery points, with 50 percent and 33 percent implementing them in ANC and the pediatric OPD, respectively. In HC IIIs, implementation of BFHI guidelines was below 50 across all service delivery points.

22 | SPRING/Uganda
Table 3.15. Percentage of health facilities implementing BFHI guidelines, by service point and facility type
Service Point Hospital
(%) n
HC IV (%)
n HC III (%)
n
Pediatric outpatient department 100 1 33 3 40 5
Antiretroviral therapy 67 3 100 1 25 4
ANC 50 2 50 4 50 6
YCC 50 2 100 1 33 6
Nutrition 50 2 0 1 33 3
Generally, hospital health workers were implementing IYCF guidelines at all service delivery points. All HC IVs that had IYCF guidelines were implementing them in YCC, 67 percent in ANC, and 50 percent in the pediatric OPD and ART, respectively (Table 3.16). No HC IVs were implementing IYCF guidelines in the nutrition service contact point. All HC IIIs were implementing IYCF guidelines at the ART service delivery point, 80 percent at both ANC and nutrition service points, 60 percent in YCC, and 50 percent in the pediatric OPD.
Table 3.16. Percentage of facilities implementing IYCF, by service point and facility type
Service Point Hospital
(%) n
HC IV (%)
n HC III (%)
n
Pediatric OPD 100 3 50 2 50 6
ART 100 6 50 2 100 5
ANC 80 5 67 3 80 5
YCC 100 6 100 2 60 5
Nutrition 100 5 0 1 83 6
Hospital health workers were implementing IMAM at all contact points. All HC IVs were also implementing IMAM at ART and YCC service delivery points, and 33 percent were implementing these guidelines in the pediatric OPD. HC IVs were implementing IMAM in the ANC and nutrition service contact points. All HC IIIs were implementing IMAM at ART, ANC and nutrition service points, while 50 percent and 40 percent were implementing IMAM at the pediatric OPD and YCC service delivery points (Table 3.17).
Table 3.17. Percentage of facilities implementing IMAM, by service point and facility type
Service Point Hospital
(%) n
HC IV (%)
n HC III (%)
n
Pediatric OPD 100 1 33 3 50 4
ART 100 2 100 2 100 4
ANC 100 2 0 1 100 1
YCC 100 3 100 1 40 5
Nutrition 100 6 0 1 100 1

Integration of Nutrition Assessment, Counseling, and Support into Uganda’s Routine Health Service Delivery | 23
3.2.8 Nutrition Support: Essential Nutrition Supplies and Drugs Delivery of quality nutrition support services requires continuous availability of nutrition supplies and drugs. The 2014 monitoring assessment checked for the availability of essential nutrition supplies in the supported health facilities to find out which supplies facilities manage and their availability and stock-outs in the three months preceding the survey. Findings (Fig. 3.6) indicate that none of the health facilities visited managed combined minerals or combined minerals and vitamins. However, most of the facilities that managed the available drugs did not have problems with stock-outs in the three months prior to the survey. On the other hand, only one facility reported having a stock-out for F-100 and one for F-75. Five (5) facilities had stock-outs of RUTF, three mabendazole, or iron, respectively; six had stock-outs of folic acid tablets.
Figure 3.6. Number of facilities reporting availability of essential nutrition supplies
30
10
34
36
40
38
40
37
13
5
5
20
29
2
6
3
6
6
3
7
3
8
5
1
0
5
6
1
2
2
4
1
1
2
1
1
1
1
1
1
46
Folic Acid
Iron
Iron-folate tablets
Vitamin A
Cotrimoxazole (Septrin) (480 mg)
Albendazole
Mebendazole
Fansidar
RUTF/RUTAFA
F-75
F-100
Multivitamins
Zinc Gluconate/sulphate
CMV
Combined mineral
ResoMal
Manages, drug is in stock Manages, drug is NOT in stock Does not manage drug

24 | SPRING/Uganda
3.3. Gaps in Information and Feedback Mechanisms to Improve Quality of Services This objective seeks to determine the current practice of documentation of nutrition related-information in the health management information system (HMIS) at the different types of facilities, as well as the existence of quality improvement teams.
3.3.1. Use of Health Management Information System The survey assessed the availability and use of national HMIS tools for collection and reporting of health care data. This in turn helped the team assess the quality of the data collection and reporting system across all health facilities. Data collection and documentation constitute a key source of information for programming and decision making. Therefore, determining gaps in this area enables the design of appropriate technical assistance to improve data collection and use practices to support improved service delivery. Improving the quality of data requires designated staff to collect the data of interest. Survey results revealed that all hospitals and HC IVs have designated staff for data collection, compared with 87 percent of HC IIIs (Table 3.18). All health facilities were, nevertheless, collecting and documenting data using the HMIS.
Table 3.18. Percentage of Health Facilities with Designated Staff for Collection and Use of HMIS Data
Availability of a Designate Staff for HMIS Data Collection
Hospitals (n = 8) (%)
HC IVs (n = 8) (%)
HC IIIs (n = 30) (%)
Availability of designated staff for data collection 100 100 87
Collection of data using the HMIS 100 100 100
Surveyed health facilities reported that they routinely collected data on nutrition-related indicators, using various different reporting systems, including the HMIS (Table 3.19). All hospitals, HC IVs, and 90 percent of HC IIIs document data on pregnant women receiving IFA in the HMIS. In facilities that collect data on pregnant women receiving intermittent preventive treatment (IPT) for malaria, health workers document the data mainly in the HMIS, although 13 percent of HC IVs noted that they report this data using other data collection and reporting systems.
Fifty percent of the HC IVs and IIIs and only 13 percent of the hospitals report collecting data on nutrition counseling in the HMIS. The routine collection and documentation of height/length assessment for children below five in the HMIS is very low in HC IVs and HC IIIs, at 13 percent and 20 percent, respectively, and 50 percent in hospitals. Fifty percent of HC IVs however reported height/length measurement for children under five in other data collection systems.
Routine collection and documentation of MUAC assessment for children under five in the HMIS was 50 percent in HC IVs as well as HC IIIs, and 63 percent in hospitals. On the other hand, 25 percent of hospitals and HC IVs, and 33 percent of HC IIIs documented data on counseling of caregivers for children under five on nutrition. The routine collection and documentation of data on the number of children found to be undernourished was 63 percent in hospitals, 50 percent in HC IVs, and 47 percent in HC IIIs (Table 3.19).

Integration of Nutrition Assessment, Counseling, and Support into Uganda’s Routine Health Service Delivery | 25
Table 3.19. Percentage of facilities collecting nutrition-related data through HMIS or other systems
Type of Data Documentation
System Used
Hospital (%) (n = 8)
HC IV (%) (n = 8)
HC III (%) (n = 30)
Number of pregnant women receiving iron–folic acid supplements
HMIS 100 100 90
Other data collection system 0 0 10
Number of pregnant women receiving IPT for malaria
HMIS 100 88 93
Other data collection system 0 13 7
Number of pregnant women counseled on nutrition
HMIS 13 50 53
Other data collection system 25 38 10
Number of deliveries with immediate breastfeeding
HMIS 50 63 50
Other data collection system 13 13 7
Number of children under five measured (height/length)
HMIS 50 13 20
Other data collection system 13 50 10
Number of children under five assessed with MUAC
HMIS 63 50 50
Other data collection system 38 38 33
Number of caregivers of children under five counseled on nutrition
HMIS 25 25 33
Other data collection system 25 63 17
Number of children under five who are undernourished
HMIS 63 50 47
Other data collection system 25 38 33
Number of undernourished children under five who received food
HMIS 13 14 15
Other data collection system 0 29 4
Number of children under five who received RUTF
HMIS 50 13 11
Other data collection system 50 38 4
Number of PLHIV assessed with MUAC
HMIS 50 63 48
Other data collection system 38 25 41
Number of PLHIV counseled on nutrition
HMIS 25 25 38
Other data collection system 38 50 28
Number of PLHIV who are undernourished
HMIS 50 75 41
Other data collection system 38 25 45
Number of undernourished PLHIV who received RUTF
HMIS 50 13 8
Other data collection system 50 38 8

26 | SPRING/Uganda
3.3.2. Quality Assurance System and Quality Improvement Activities Implementation of NACS services into routine health care uses QI methods to achieve successful and sustainable health care. The survey assessed the availability and functionality of QI teams at health facilities to lead QI projects at the facility level. Results show that all hospitals and HC IVs, as well as 77 percent of HC IIIs have QI teams5 (Table 3.20). The functionality of QI teams was determined by the last time each team met. All hospitals, all HC IVs, and 39 percent of HC IIIs reported that the QI team had met within the month immediately prior to the survey. The low functionality of QI teams in HC IIIs was attributed to the delay in scale-up of the PHFS intervention in most health facilities in SW for the survey period.
Table 3.20. Availability and functionality of quality improvement teams by facility type
Availability QI team Hospital (n = 8) Health Center IV (n = 8) Health Center III (n = 30)
Availability of QI team 100 100 77
Last time the QI team met
Within past 30 days 8 (50%) 8 (50%) 23 (39.1%)
Within past 2–6 months 8 (13%) 8 (25%) 23 (30.4%)
More than 12 months ago 8 (0%) 8 (12.5%) 23 (0.0%)
Don’t know 8 (25%) 8 (12.5%) 23 (30.4%)
3.4. Sources of motivation for improved performance among health workers Motivation to improve performance is linked to feelings of self-fulfillment, achievement, and recognition (Franco, Bennett, and Kanfer 2002, WHO 1993). Effective performance management can influence these feelings by managers making sure that staff members are competent and motivated in their jobs (Martinez 2001).This involves supervision, training, performance appraisal, and career development. These satisfiers (or “motivators”) are based on intrinsic motivation. This section details the ways that health workers are motivated in the different types of surveyed health facilities.
3.4.1. Types of Incentives Provided to Health Workers The survey explored different forms of motivation offered to health workers, including incentives for improving their performance. Providing motivation to health workers is important to ensure that they actively participate and gain interest in providing nutrition services.
All health facilities, irrespective of facility level, provided duty/outreach allowance for their health workers to effectively carry out outreach activities. Sixty-seven percent of hospitals reported providing monthly or quarterly salary supplements and bonuses to health workers, besides per diem for attending trainings, as well as providing payment for performing tasks outside a worker’s job description (Table 3.21). HC IVs also reported that health workers receive per diem payment for attending meetings (50 percent). All hospitals stated that they provide subsidized housing for health workers; 86 percent reported providing discounted medical services and training
5 Buhozi HC III, Gasovu HC III, Kagano HC III, Kagezi HC III, Kinanira HC III, Nyakibaale HC III, Nyarubuye HC III, and Rugarama HC III, did not report availability of functional QI teams.

Integration of Nutrition Assessment, Counseling, and Support into Uganda’s Routine Health Service Delivery | 27
opportunities. Likewise, all HC IVs reported providing subsidized housing for health workers, 80 percent reported providing discounted medical services as well as uniforms. HC IIIs provided similar incentives (Table 3.21).
Table 3.21. Incentives provided to health workers, by facility type
Monetary Incentives Hospital (n = 3) HC IV (n = 4) HC III (n = 18)
Monthly or quarterly salary supplement 67% 0% 29%
Per diem for attending training 33% 50% 61%
Duty/outreach allowance 100% 100% 94%
Payment for tasks outside of job description 33% 0% 0%
Overtime 0% 0% 11%
Bonus 67% 0% 0%
Nonmonetary Incentives Hospital (n = 8) HC IV (n = 8) HC III (n = 29)
Provision of nonmonetary incentives to health workers
88% 63% 66%
Types of nonmonetary Incentives Hospital (n = 7) HC IV (n = 5) HC III (n = 199)
Uniforms, caps, shoes, backpacks 43% 80% 74%
Discount for medicines/medical services 86% 80% 74%
Subsidized housing 100% 100% 79%
Training opportunities/continuing professional development
86% 60% 63%
Defined career path 29% 50% 12%
3.4.2. Provision of Technical Supportive Supervision to Health Workers Technical supportive supervision is important in promoting the quality of health care at all levels by strengthening relationships within the system, focusing on the identification and resolution of problems, helping optimize the allocation of resources, promoting high standards and teamwork, and making feedback more effective. All HC IVs and IIIs, and 88 percent of hospitals provided support supervision to health workers (Table 3.22). In addition, all HC IVs and IIIs stated that they provided feedback as part of support supervision, using verbal feedback, written feedback, commendations, discussion, and or updates on technical issues related to work. Hospitals use similar means, although only 88 percent and 83 percent of the hospitals respectively provided verbal or written feedback.
Table 3.22. Technical support supervision provided to health workers, by facility type
Technical Support Supervision Hospitals HC IV HC III
Supervision visits 8 (88%) 8 (100%) 30 (100%)
Verbal feedback 8 (88%) 5 (100%) 23 (100%)
Written feedback 6 (83%) 3* (100%) 22 (100%)
Commendations 2* (100%) 2* (100%) 13* (100%)
Updates on administrative or technical issues on work 2* (100%) 3* (100%) 15 (100%)
Discussion 5 (100%) 4 (100%) 15 (100%)
*Significantly fewer than the total number of facilities answered (less than 50 percent of expected)

28 | SPRING/Uganda
3.5. Roles of community health workers in delivering preventive and treatment nutrition services Community health workers play a big role in delivering preventive and treatment services at the community level. They serve as the key public health promoters at the community level and form the HC I level of Uganda’s health system. This section presents key findings about the roles of CBHWs and facility-community linkages.
3.5.1. Availability of Community Health Workers Community health workers provide a resource for close understanding of communities, forming a liaison/link/intermediary between health/social services and the community, which facilitates access to services and improves the quality and cultural competence of service delivery. Working with CHWs helps to efficiently build a community’s capacity in health knowledge and self-sufficiency through a range of activities such as outreach, community education, informal counseling, and social support. All health facilities surveyed have links to community health workers or volunteers (Table 3.23). These workers included nutrition peer educators and village health teams, vaccinators, and family support groups. The survey found that all hospitals and HC IVs had peer educators, compared with 96 percent of HC IIIs. Vaccinators were reported in 43 percent of hospitals, 29 percent of HC IVs, and 38 percent of HC IIIs. All facilities reported that CHWs and volunteers are involved in provision of community-based nutrition services, including community-based nutrition screening and nutrition counseling. Survey results show that community health workers provide community-based nutrition screening in 75 percent of hospitals, 50 percent of HC IVs, and 57 percent of HC IIIs. All hospitals and HC IVs stated that CHWs provided nutrition counseling, while 93 percent of HC IIIs reported that CHWs provided nutrition counseling.
Table 3.23. Facility-community linkages, by facility type
Links with Community Health Workers Hospital
(%) n
HC IV (%)
n HC III (%)
n
Health facilities with community health workers 100 8 100 8 100 30
Community Health Workers Linked to Health Facilities
Vaccinators 43 7 29 7 38 26
Peer educators/village health teams 100 7 100 7 96 26
Family support group leaders 71 7 57 7 27 26
Nutrition Services Provided by Community Health Workers
Community-based nutrition screening 75 8 50 8 57 30
Nutrition counseling 100 8 100 8 93 30
3.5.2. Facilities-Communities Referral Linkages Besides CHWs being a great resource in empowering communities to have improved health standards, they play a profound role in connecting the health facility with the community. They provide an efficient mode of providing health care to communities by visiting households within their communities to offer primary health care (preventive and treatment) and information. The survey found that 75 percent each of hospitals and HC IVs and 70 percent of HC IIIs have a system for referring clients (Table 3.24). All hospitals and HC IVs, and 87 percent of HC IIIs receive referrals from the community level. Over three-quarters of all facilities included nutrition information in

Integration of Nutrition Assessment, Counseling, and Support into Uganda’s Routine Health Service Delivery | 29
their reporting tools. In addition, 75 percent of hospitals had a system for supervision of CHWs; 88 percent of HC IVs and 80 percent HC IIIs have such a system.
Table 3.24. Functionality of facility-community linkages, by facility type
Type of Facility
Facilities with a System for
Referring Clients
(%)
Facilities with Referrals from the Community Level
(%)
Facilities with Reporting Format for
CHW Reporting, Reports, and Periodic Supervision for CHWs
(%)
Facilities with CHW Reporting Tools
Having Information on
Nutrition Services (%)
Facilities with a System for
Supervision of CHWs
(%)
Hospital (n=8) 75 100 100 75 75
HC IV (n = 8) 75 100 100 75 88
HC III (n =3 0) 70 87 90 85 80
Most of health facilities of all types surveyed had links to some client treatment and support services in the community, with 80 percent of hospitals, 100 percent of HC IVs, and 80 percent of HC IIIs having such linkages (Table 3.25). Specifically, 60 percent of hospitals, 86 percent of HC IVs, and 68 percent of HC IIIs had linkages to community-based HIV counseling and testing services; 100 percent of hospitals, 71 percent of HC IVs, and 52 percent of HC IIIs had linkages to community-based social support for PLHIV. Other community-based services to which health facilities had links included nutrition screening, and social support for mothers.
Table 3.25. Facilities linked to community-based services, by facility type
Community Service Hospital (n = 5) (%) HC IV (n = 7) (%) HC III (n = 25) (%)
Economic and livelihoods development 20 0 0
Food security support 20 0 8
HIV counseling and testing 60 86 68
Home care 80 43 32
Client treatment support 80 100 80
Social support for PLHIV 100 71 52
Community-based nutrition screening 20 43 36
Social support for mothers 60 71 20
3.5.3. Training Received by Community Health Volunteers To appropriately deliver quality health care services, CHWs/VHTs must be equipped with the required skills and tools. Capacity building of village health teas entails training, mentorship, and support supervision on a routine basis. Table 3.26 presents findings on whether the various training that VHTs had undertaken in the 12 months just prior to the survey involved nutrition topics.
In terms of training of community health workers and volunteers linked to health facilities, timing of training, and inclusion of nutrition in training, all hospitals reported that CHWs in their catchment areas received training within the past 12 months (April 2013–March 2014). In terms of nutrition topics, 83 percent of hospitals stated that

30 | SPRING/Uganda
trainings such content; 17 percent did not know whether nutrition was included in CHW training. All HC IVs reported that community health workers in their catchment areas received training, and that 75 percent of the trainings included nutrition; 25 percent of HC IVs did not know if the training included nutrition within the past 12 months. Similarly, 100 percent of HC IIIs reported that community health workers received training within the past 12 months, and 84 percent of these facilities stated that the training included nutrition. Additionally, eight percent of HC IIIs reported that the trainings did not include nutrition, while eight percent of HC IIIs did not know if nutrition topics were included. All trainings conducted within the previous 13–24 months (April 2012–March 2013) for CHWs linked to HC IIIs included nutrition. Overall, 92 percent of the trainings conducted for community health workers linked to HC IIIs in the past 24 months (April 2012–March 2014) included nutrition.
Table 3.26. Most recent training for community health workers, by facility type
Type of Facility Timing of Training Inclusion of Nutrition in Training (%)
No Yes Don’t Know
Hospital (n = 6) Within past 12 months 0 100 0
Total 0 83 17
HC IV (n = 8) Within past 12 months 0 75 25
Total 0 75 25
HC III (n = 29)
Within past 12 months 8 84 8
Within past 13–24 months 0 100 0
Total 4 92 8

Integration of Nutrition Assessment, Counseling, and Support into Uganda’s Routine Health Service Delivery | 31
Capacity gaps persist in BFHI, IMAI, and IYCF services.
All facilities have integrated nutrition assessment into routine health service delivery.
NACS trainings, coaching and mentorship should continue targeting nurses, midwives and nursing assistants since they dominate the health workforce
Chapter 4. Summary of Key Findings and Discussion 4.1. Health Work Force Lower-level staff such as nurses, midwives and nursing assistants makes up the largest component of the health work force. Survey findings revealed that across all service delivery points in all health facilities, there are more nurses, midwives, and nursing assistants than any other cadre of health worker, although the numbers varied across service delivery points. The majority of nurses and midwives had attained medium-/intermediate-level training, and mostly provided MCH services. Medical and clinical officers mainly provided pediatric OPD services. The 2012 NACS assessment also found that over 70 percent of the health work force was comprised of the nurses/midwifes and that they had attained medium/intermediate-level training (Nekatebeb, H., A. Mokori, K. Kappos, et al, 2013). Thus, the essential composition the health work force has not changed since 2012. NACS trainings, coaching, and mentorship should therefore continue to target nurses, midwives, and nursing assistants across all facility types and service points. Nutritionists work only in pediatric OPDs and nutrition/IMAM clinics while health educators work in all service delivery contact points. Therefore, targeting low–midlevel health cadres best enhances health facilities’ capacity to continuously integrate NACS services into routine health care delivery.
4.2. Nutrition Capacity On average, 25 percent of health workers across all health facilities had received training in NACS and eMTCT, and slightly over 10 percent had received training in IMAM. Although 19 percent of health workers had received training in IYCF in HC IIIs, only eight percent and three percent received the same training in hospitals and HC IVs, respectively. The training of health workers in BFHI and IMAM is still lacking in all health facilities. The limited training in BFHI, IMAI, and IYCF indicates capacity gaps in offering these services. To effectively integrate nutrition service in routine health care, the programs should target health workers with trainings in these areas. In addition, more health workers need to be trained in NACS and eMTCT to ensure that more health workers can offer a continuum of care including nutrition assessment, counselling and support.
4.3. NACS Services 4.3.1. Nutrition Assessment In 2013, SPRING/Uganda supported all the health facilities to continue or initiate nutrition assessment for all clients; by the time of the 2014 survey, all 46 health facilities surveyed had integrated nutrition assessment into routine health care services. One or more nutrition assessments conducted in these facilities included anthropometric, biochemical, clinical, and dietary assessment. This significant progress against an average 60 percent of all health facility types reported to be conducting nutrition assessment 2012. The 2012 report showed that over 80 percent of hospitals, 60 percent of HC IVs, and 40 percent of HC IIIs were doing nutrition assessment, meaning that many health workers did not provide nutrition assessment service in routine health service delivery. As recommended in the 2012 assessment report, SPRING/Uganda strengthened the quality of nutrition assessment, and health workers have the skills to conduct nutrition assessment (Figs. 4.1 and 4.2).

32 | SPRING/Uganda
Despite this success, documentation of nutrition data is not standard across all facilities, and anthropometric equipment needs routine calibration to ensure accuracy of the information obtained.
Figure 4.1. Improvement in the percentage of facilities providing nutrition assessment, 2012–2014
Figure 4.2. Methods of nutrition assessment improved across all health facilities, 2012–2014
Anthropometry, including taking MUAC and weight; checking for edema; checking for pallor; and taking dietary history were the assessments most commonly performed. Taking length/height and hemoglobin estimation greatly improved from 33 percent and 45 percent on average in 2012 to 82 percent and 64 percent on average, respectively, in 2014. Taking MUAC increased from 25 percent and 15 percent for HC IVs and HC IIIs to 100 percent, as it was in hospitals in 2012. Taking weight increased to 100 percent for both HC IVs and HC IIIs from 93 percent and 67 percent respectively. Hemoglobin estimation in hospitals increased to 100 percent from 80
80
60
40
100
100
100
0
10
20
30
40
50
60
70
80
90
100
Hospitals Health Center Ivs Health Center IIIs
Perc
ent
Type of Health Facility
2012 Assessment 2014 Assessment
0%
10%
20%
30%
40%
50%
60%
70%
80%
90%
100%
MUAC Weight Hemoglobinestimation
MUAC Weight Hemoglobinestimation
HEATH CENTER IVs HEALTH CENTER IIIs
2012
2014

Integration of Nutrition Assessment, Counseling, and Support into Uganda’s Routine Health Service Delivery | 33
All health facilities practice nutrition counseling, though it varies by type of facility and contact point.
Use of any indices for classification of undernutrition is significantly low in all health facilities.
Methods of nutrition assessment improved across all health facilities.
percent, in HC IVs to 71 percent from 35 percent, and in HC IIIs to 33 percent from 22 percent. Nurses and midwives performed more nutrition assessments than any other cadre. To sustain the practice of nutrition assessment, there is a need for continued coaching and mentorship of health workers on nutrition service delivery. Key areas that need more focus are taking length/height and hemoglobin estimation in all health facility types.
The most commonly used indices for classification of nutrition assessment data were MUAC cutoffs, WHZ scores, WAZ scores, BMI for age Z scores, and BMI cutoffs. The use of MUAC cutoff was 100 percent irrespective of the type of facility, which rose from 25 percent and 18 percent in HC IVs and HC IIIs, respectively. There was a very slight increase in the use of WHZ scores in 2012 from 37 percent in hospitals to 38 percent, from 19 percent in HC IVs to 25 percent, and from threepercent in HC IIIs to 13 percent. The use of BMI for age Z scores and BMI cutoff remained significantly low across all types of facilities. These findings show that classification of nutrition assessment is still a sizable gap at all facility types. Although health workers use MUAC cutoff in all facilities, there is a need to support them in the use of other indices for the classification of nutrition assessment, especially at the YCC and EID service delivery points, where MUAC cutoffs is not applicable for infants under six months of age.
4.3.2. Nutrition Counseling All health facilities surveyed in 2014 provided nutrition counseling services to their clients. The provision of counseling services increased from 66 percent among hospitals and HC IIIs and 33 percent among HC IVs in 2012 (Nekatebeb, H., A. Mokori, K. Kappos, et al, 2013). Individual counseling at the ART service delivery point increased from 50 percent to 100 percent survey among hospitals. On average, counseling at the ART contact point increased to 80 percent among HC IVs and 90 percent among HC IIIs (Fig. 3).
Figure 4.3. Improvement in nutrition counseling all facility types, 2012–2014
Hospitals and HC IVs conducted more individual counseling sessions than HC IIIs. The increased rates of nutrition counseling at the facility level should have a direct impact on the practice of recommended IYCF and maternal feeding, a practice that leads to improved maternal and child nutrition.
66
33
66
100 100 97
0 10 20 30 40 50 60 70 80 90
100
Hospitals HC IV HC III
2012 2014

34 | SPRING/Uganda
• Nutrition counseling tools, infant scales, and height boards were present in only a few health facilities.
• Health facilities continue to experience stock-out of supplies.
• No health facility manages Combined Minerals & Vitamins.
Only a few facilities have access to BFHI, IMAM, and IYCF guidelines, and implementation of the guidelines where they are present remains low.
4.3.3. Nutrition Support Health facilities receive and serve a large number of clients who need nutrition-related support services every time they visit a health facility, which makes nutrition support services important in the implementation of the NACS framework. Most of facilities did not have BFHI and IMAM guidelines to support the implementation of nutrition-related services. Only three hospitals, four HC IVs, and six HC IIIs had BFHI guidelines. Among the few health facilities that had these guidelines, implementation was still low irrespective of facility type. For effective provision of support services, all health facilities need support with nutrition-related policy guidelines at the relevant service delivery points. Program implementers should emphasize the use of these guidelines during coaching and mentorship, support supervision, and through other channels of capacity building for health workers.
All health facilities reported availability of key nutrition assessment tools, although there still exist variations in the number and type at the various service delivery points. Overall, these findings show that NACS support tools, especially anthropometric equipment, are largely available in all health facilities, as opposed to counseling tools, job aids, guidelines, and protocols. More emphasis is needed to support the implementation of support services, especially implementation of guidelines and protocols.
Most health facilities manage nutrition-related supplies and drugs but still experienced stock-outs of supplies in the three months prior to the survey. However, none of the health facilities managed combined minerals or combined minerals and vitamins, but all managed Fansidar and albendazole, though some had stock-outs.
4.3. Documentation of Nutrition Data/Information The 2014 survey assessed documentation of nutrition data/information, including MUAC assessment, length/height, checking for pallor, checking for edema, and hemoglobin estimation, at all service delivery points. Reported documentation for MUAC assessment showed an increase from 80 percent among hospitals, 19 percent among HC IVs, and seven percent among HC IIIs in the 2012 assessment for NACS to 100 percent across all facility types (Fig 4.4). Similarly, weight assessment increased to 100 percent in all health facilities from 10 percent among hospitals, 69 percent among HC IVs, and 44 percent among HC IIIs. Irrespective of the nutrition assessment service, health workers mainly documented nutrition services in patient registers and clinic cards at all health facilities and service delivery points, with the exception of the pediatric OPD, where documentation was mostly on client cards, and the young child clinic, which used mostly child health cards (Fig 4.4).

Integration of Nutrition Assessment, Counseling, and Support into Uganda’s Routine Health Service Delivery | 35
Patient registers are widely used for reported documentation of nutrition data/information at most service delivery points.
Most facilities have quality improvement teams but regular meetings and functionality are still low.
Figure 4.4. Documentation of MUAC and weight assessment, 2012–2014
Documentation of nutrition counseling in the HMIS remains low at all health facilities. Among hospitals and HC IVs, collection of nutrition counseling data is approximately 25 percent, including counseling pregnant women on nutrition, counseling caregivers of child under five on nutrition, and counseling PLHIV on nutrition. Good recordkeeping is fundamental in monitoring progress and ensuring that health workers adopt proper practices. Documentation for nutrition and related services should be emphasized during trainings for health workers and during coaching and mentorship. Emphasizing documentation for these indicators is crucial now that the MoH has integrated a number of nutrition indicators into the revised HMIS tools.
4.4. Quality Improvement The quality improvement approach is one of the cost-effective strategies for integrating nutrition services into routine health service delivery. With this approach, nutrition-related services are introduced systematically to health workers, who are encouraged include these services in routine health service delivery. Using the QI approach, QI coaches coach and mentor health workers to provide quality nutrition services to the recommended standards. Survey results showed that QI teams existed in 88 percent of hospitals, 77 percent of HC IIIs, and in all HC IVs. Slightly over one-half (57 percent) of QI teams in hospitals, 50 percent in HC IVs and 39 percent in HC IIIs had met in the 30 days preceding the survey, as observed from meeting minutes. A number of QI teams in other facilities had also met in the prior 2–6 months. Overall, 71.4 percent of QI teams in hospitals, 88.5 percent in HC IVs, and 69.5 percent in HC IIIs had met within the 12 months preceding the survey. The remaining respondents indicated that they did not know the last time the QI teams met, which implies that either these facilities’ QI teams are nonfunctional or there was an information gap between the QI teams and the facility Medical Superintendents or in-charges. Based on these findings, there was a 29 percent decrease in the implementation of QI activities in hospitals, an 18 percent decrease in HC IIIs, and a 7.5 percent increase in HC IVs. As a key strategy in the integration of nutrition services into routine health service delivery, there is a need to operationalize/re-activate QI teams where they have become nonfunctional and create QI team
0%
10%
20%
30%
40%
50%
60%
70%
80%
90%
100%
Hospitals HEATHCENTER IVs
HEALTHCENTER IIIs
Hospitals HEATHCENTER IVs
HEALTHCENTER IIIs
MUAC Assessment Weight Assessment
2012
2014

36 | SPRING/Uganda
Ninety-three percent of CHWs attached to HC IIIs, and all CHWs attached to HC IVs and hospitals, provided community-based nutrition counseling services.
Almost all health facilities had technical support supervision.
Most health facilities reported receiving referrals from communities.
Facility-community linkage is evident in almost all health facilities, and on average over two-thirds of facilities have integrated nutrition into reporting tools for CHWs.
were they don’t exist. To ensure continuous functionality of facility QI teams, nutrition program should continuously build the capacity of the District Quality Improvement Team (DQIT) to support QI teams to initiate QI activities and the DQIT to monitor such activities. DQIT teams should also support the health facility QI teams to meet regularly for effective implementation of QI activities.
4.5. Supportive Supervision for Health Care Providers Supportive supervision helps ensure that health workers follow systematic standards and protocols, and can promote an organizational culture for implementing such standards and protocols. Support supervision acts as a motivator to health workers for services offered and exposes staff to a wider scope of ideas through on-the-job training. The survey found that 100 percent of HC IIIs and HC IVs and 88 percent of hospitals reported that health workers received technical support supervision. Verbal and written feedback for HC IIIs and HC IVs were the main channels of feedback on support supervision for health workers. In addition, all health facilities revealed that commendations, discussions, and updates on administrative or technical issues related to health workers’ work were other ways in which health workers received feedback from support supervision. DQITs and Implementing Partners provided technical support supervision through coaching and mentorships. Therefore, development partners should support interventions that continually build the capacity of DQITs to sustainably conduct technical support supervision for health workers and support DQITs to develop and include nutrition in their support supervision plans and tools.
4.6. Community-Based Health Services Community-based nutrition services, including nutrition counseling on proper feeding practices for the entire population, are a key strategy in the prevention of undernutrition. If all people adopted and adhered to good nutrition practices, susceptibility to undernutrition would be limited to non-dietary factors and causes. The majority community based health workers were VHT members, nutrition peer educators family support groups, and vaccinators across all facility types. Seventy-five percent of hospitals, 50 percent of HC IVs and 57 percent of HC IIIs reported that CHWs attached to their health facilities provided community-based nutrition screening. All hospitals and HC IVs, and 93 percent of HC IIIs revealed that the most common service offered by CHWs is community-based nutrition counseling. CHWs are key actors in the prevention of undernutrition at the community level. They play an important role in promoting appropriate nutrition practices in households and communities. Partners should continuously strengthen the capacity of such health workers to enhance their capacity in delivering nutrition and other health related messages.
The functionality of a referral system is vital in disease control and prevention intervention. An established, functional referral system contributes to high standards of care by limiting over-medicalization, permitting an efficient division of tasks between generalists and specialists, freeing specialists to develop their special knowledge, and containing the cost of medical care. In the 2014 survey, 70 percent of HC IIIs, and 75 percent each of hospitals and HC IVs reported that they have a system for referring clients. Among the facilities with a referral mechanism, 87 percent of HC IIIs and all hospitals and HC IVs reported receiving referrals from the

Integration of Nutrition Assessment, Counseling, and Support into Uganda’s Routine Health Service Delivery | 37
communities. Eighty-five percent of HC IIIs and 75 percent each of hospitals and HC IVs have integrated nutrition in the reporting tools for CHWs. Health facilities have links to community-based services, including client treatment and support, home care, HIV counseling and testing, food security support, social support for PLHIV, economic and livelihood development, community-based nutrition screening, and social support for mothers.

38 | SPRING/Uganda

Integration of Nutrition Assessment, Counseling, and Support into Uganda’s Routine Health Service Delivery | 39
Chapter 5. Conclusion and Recommendations Lower health staff cadres continue to predominate in the health work force in supported health facilities, which implies a need for continuous capacity building for sustainable implementation of nutrition interventions. Program interventions can routinely reach these lower-level health workers through refresher training, coaching and mentorship, learning sessions and exchange visits, and support supervision, among other methods.
Health facilities have integrated nutrition assessment counselling and support in the continuum of care. This indicates that more and more people receive nutrition services, malnourished identified, treated and liked to care. Documentation of nutrition data is however, not standard across all facilities and anthropometric equipment need routine calibration to ensure accuracy of the nutrition assessment. Since most of health facilities are now doing nutrition assessment, it will be important to focus on the proportion of clients assessed in the upcoming surveys. Provision of length/height boards and hemoglobin-measuring devices to health facilities will increase the proportion of clients receiving the corresponding assessments.
Although nutrition assessment has improved since 2012, classification of clients’ nutrition status using BMI and Z-scores remains very low. Nutrition program interventions should therefore support health facilities to use indicators for the classification of undernutrition besides MUAC cutoffs, especially at YCC and EID service delivery points, where MUAC cutoffs for infants under six months of age are not applicable.
Within the NACS framework, health workers provide nutrition counseling coupled with support; however, few health facilities had BFHI, IYCF, and IMAM guidelines to support quality service delivery. For effective provision of nutrition support services, all health facilities should have nutrition-related policy guidelines at all service delivery points, but availability is still limited to one-third of health facilities. The MoH with partners should step up the dissemination of nutrition-related policy guidelines, as well as capacity building of health workers on the proper use of these guidelines to ensure standard delivery of support services.
While most health facilities manage nutrition-related supplies and drugs, many still experience stock-outs. None of the health facilities surveyed managed combined minerals, or combined minerals and vitamins, but all managed Fansidar and albendazole, with many experiencing stock-outs. This highlights the need to harmonize the supply chain system to ensure constant supplies at the facility level and discontinuing non-recommended drugs.
Documentation of nutrition assessment services, especially MUAC and height, had greatly improved using patient registers and clinic cards across all facility types, although documentation of nutrition counseling in the HMIS remains low. Good recordkeeping is fundamental in monitoring progress and ensuring that health workers adopt proper practices now that the revised HMIS tools have incorporated a number of nutrition indicators. Development partners should put emphasis on documentation for nutrition and other related services during trainings for health workers and during coaching and mentorship sessions.
Half of QI teams are functionally active in the health facilities where they exist, a finding that highlights the slow progress in adoption of the QI approach. Hence, as a key strategy in the integration of nutrition services into routine health service delivery, there is a need to strengthen QI teams where they are nonfunctional and initiate QI teams where they don’t exist. In addition, to ensure continuous functionality of QI teams, the MoH and partners should continuously build the capacity of DQIT to support and monitor health facilities’ QI teams to initiate QI activities. The DQIT and implementing partners provide technical support supervision through routine NACS coaching and mentorships; thus, building their capacity will ensure continuous enhancement of health workers’ capacity.

40 | SPRING/Uganda
Community health workers help provide community-based nutrition screening and nutrition counseling. Therefore, as part of a key strategy in the preventive nutrition intervention, CHWs are key actors in the prevention of undernutrition at community level. Community health workers play an important role in promoting appropriate nutrition practices at the household and community levels, and, thus, strengthening their skills ensures the delivery of appropriate nutrition and other health-related messages.
More health workers have attained nutrition capacity to identify and manage malnutrition. As a result, nutrition assessment has improved from an average from 65 percent in 2012 to 100 percent in 2014 across all facility types, although it is more skewed to anthropometric rather than clinical assessment. In addition, both nutrition counseling and support continue to improve across all health facility types, though these vary by facility type, and access to nutrition-related guidelines is still limited to one in four of the supported health facilities. For sustainable integration of NACS services into routine health care, there is a need for continued capacity building of health workers through refresher trainings, coaching and continuous nutrition education especially on clinical assessment for nutrition status and supporting health facilities with nutrition-related guidelines and protocols as well as job aids.
Integration of Nutrition Assessment, Counseling, and Support into Uganda’s Routine Health Service Delivery | 41
References CORE Group. 2012. Getting the Knack of NACS: Highlights from the State of the Art (SOTA) Meeting on Nutrition Assessment,
Counseling and Support (NACS), 22–23 February 2012, Washington, DC, Meeting Report. Washington, DC: CORE Group.
Franco L. M., S. Bennett, and R. Kanfer. 2002. “Health Sector Reform and Public Sector Health Worker Motivation: A Conceptual Framework.” Social Science and Medicine 54:1255–66.
Government of Uganda (GOU). 2011. Uganda Nutrition Action Plan 2011–2016: Scaling Up Multisectoral Efforts to Establish a Strong Nutrition Foundation for Uganda’s Development. Kampala: GOU.
Martinez, J. 2001 Assessing Quality, Outcome and Performance Management. Geneva: World Health Organization.
Nekatebeb, H., A. Mokori, K. Kappos, A. Pomeroy, M. Kyenkya, A. D’Agostino, and M. G. Wamuyu. 2013. Report on Findings from an Assessment of Nutrition Assessment, Counseling, and Support (NACS) Services in Southwestern Uganda. Washington, DC: USAID/ Strengthening Partnerships, Results and Innovations in Nutrition Globally (SPRING) project.
Uganda AIDS Commission. 2009. National HIV/AIDS Stakeholders and Services Mapping. Kampala: Uganda AIDS Commission.
Uganda Bureau of Statistics and ICF International. 2012. Uganda Demographic and Health Survey 2011. Calverton, MD: Uganda Bureau of Statistics/Macro International.
Uganda Bureau of Statistics and ICF International. 2012. Uganda Demographic and Health Survey 2011. Addendum to Chapter 11. Calverton, MD: Uganda Bureau of Statistics/Macro International.
Uganda MoH Integrated Management of Acute Malnutrition Guidelines (2010). Ministry of Health , Kampala Uganda.
World Health Organization (WHO). 1993. Training Manual on Management of Human Resources for Health. Section I, part A. Geneva: WHO.
World Health Organization, Joint United Nations Programme on HIV/AIDS, and the United Nations Children’s Fund. 2011. Global HIV/AIDS Response: Epidemic Update and Health Sector Progress Toward Universal Access: Progress Report 2011. Geneva: WHO.

42 | SPRING/Uganda

Integration of Nutrition Assessment, Counseling, and Support into Uganda’s Routine Health Service Delivery | 43
Annex 1. List of Health Facilities Surveyed by District
District Type of Health Facility
Hospitals HC IVs HC III
Kisoro
Kisoro Hospital Busanza Nyarusiza
St Francis Mutolere Rubuguri Muramba
Chahaffi Nyabihuniko
Nyakinama
Nyarubuye
Buhozi
Kinanira
Bukimbiri
Rutaka
Gasovu
Nteko
Kagano
Kagezi
Iremera
Gateriteri
Ntungamo
Itojo Kitwe Butaare
Rubaare Ruhaama
Ntungamo Nyakyera
Rwashamaire St. Lucia Kagamba; Kitondo
Bwongyera
Rukoni
Rweikiniro
Ngoma
Rugarama
Kayonza
St. Francisca Rushooka
Kabale Kabale Regional Referral
Kanungu Kambuga Hospital
Runkuguri St Kalori Hospital, Nyikibale
Sheema Kitagata Hospital
Bushenyi Ishaka Adventist Hospital
Namutumba
Nsinze Magada
Ivukula
Namutumba