Embed Size (px)
Citation preview
Vol.64: e21210140, 2021 https://doi.org/10.1590/1678-4324-75years-2021210140
ISSN 1678-4324 Online Edition
Brazilian Archives of Biology and Technology. Vol.64: e21210140, 2021 www.scielo.br/babt
Article - 75 years - Special Edition
Integration of a Pilot PV Parking Lot and an Electric Vehicle in a University Campus Located in Curitiba: a Study Case
Ana Carolina Kulik1 https://orcid.org/0000-0002-3211-3478
Josiane Gonçalves da Silva1 https://orcid.org/0000-0001-7987-7910
Jânio Denis Gabriel2 https://orcid.org/0000-0003-1349-9739
Édwin Augusto Tonolo1 https://orcid.org/0000-0002-8644-650X
Jair Urbanetz Junior1* https://orcid.org/0000-0001-9355-1730
1Federal University of Technology – Paraná (UTFPR), Curitiba, Paraná, Brazil; 2Egnex Elétrica Ltda, Curitiba, Paraná, Brazil.
Editor-in-Chief: Alexandre Rasi Aoki Associate Editor: Alexandre Rasi Aoki
Received: 2021.03.10; Accepted: 2021.03.22.
*Correspondence: [email protected], Tel.+55-41-998335729 (J.U.J.).
Abstract: Considering the increasing adoption of Hybrid Plug-in and Electric Cars, there are concerns about
recharging process of these vehicles considering the capacity of grid to provide sufficient energy to that
purpose. In the past years, the growth of distributed energy generation from renewable and clean energy
sources, especially photovoltaics, represents a possible and feasible solution to supply the energy used on
recharging electric vehicles and reduction of greenhouse emission gases as CO2. This article is a study case
that analyzes the energy production of a solar carport, located at Federal Technological University of Paraná
(UTFPR) at Neoville Campus, comparing with energy consumption of a commercial electric car for a city use
purpose. Based on solar energy generation, data from the web monitoring platform, real positioning
characteristics of the solar carport installation, irradiation data collected from the National Institute of
Meteorology basis and with a solarimetric station located at the same place as the solar carport is installed,
HIGHLIGHTS
Increasing electric vehicles against utility grid energy supplying capacity.
Solar Carport system as a solution to provide energy for EV recharging needs.
Performance analysis of a real solar carport energy production.
Comparison between energy production and electric vehicle consumption for a day use.
2 Kulik, A.C.; et al
Brazilian Archives of Biology and Technology. Vol.64: e21210140, 2021 www.scielo.br/babt
the solar energy production is rated using three different metrics: yield, performance ratio and capacity factor.
These metrics are calculated with RADIASOL2 software, a free and precise tool, developed by Federal
University of Rio Grande do Sul (UFRGS) to execute computational simulation of photovoltaic systems using
mathematical models. The results showed a slightly low energy production performance than expected, but
more than enough energy to recharge an electric vehicle for a day use, demonstrating that a solar carport
system could be a good solution to meet the energy demand for this application.
Keywords: solar carport; electric vehicles recharging; energy production analysis.
INTRODUCTION
With the introduction of electrical energy as the driving force of machines since the Industrial Revolution,
technological innovations have been increasingly associated with electricity, making economic growth
contingent on this form of energy [1].
The degradation of the environment and the projected shortage of fossil fuels in the near future highlight
the importance of generating energy with a minimum environmental impact, thus asserting the relevance of
including different sources of energy to the national energy matrix [1].
The transport sector is a major user of fossil fuel, increasing greenhouse gas emission and the global
warming. In 2019, the transport sector produced 8.2 Gt of CO2 emission, representing 24% of direct
emissions from fuel combustion [2,3]. Due to the necessity to reduce air pollution, the number of electric
vehicles (EVs) and plug-in electric vehicles (PEVs) has been continuously increasing in the last years, as
well as the use of renewable energy sources. In 2019, the global stock of electric cars reached 7.2 million
and the number of charging points worldwide were approximately 7.3 million, representing an increase of 60% from the previous year [3,4]. In this same year, the global renewable energy installed capacity had its
highest increase and grew 200 GW, in which more than 50% were from photovoltaic generation [5].
Despite the environmental benefits that electric vehicles can bring, their large-scale integration on
distribution system can cause several negative impacts such as increased system peak demand, transformer
overload operation and power quality problems. In this scenario, the integration of photovoltaic (PV)
generation into EVs and PEVs charging station infrastructure can be a possible solution to properly integrate
them on grid and reduce their negative impacts. It could reduce carbon emission and system peak demand,
avoiding transformer overload condition [3].
The joint of the two technologies could be done through solar parking lots, a structure also known as
carport system. They can be installed in the most diverse places, such as: markets, hotels, shopping malls,
restaurants, public institutions, etc., benefiting areas that may already be free for installation [6]. Reference
[12] emphasize that the creation of infrastructure stimulates the offer, since manufacturers avoid the
production and marketing of EV in countries or regions that do not exploit the infrastructure necessary to
operate them.
The dynamics of charging EVs through the carport system can be done in an optimized way [6]. The
charging can be done by making an adjustment between solar generation and the fleet needs, also
considering factors such as electricity price, or local demand. The fact that the EV fleet also represents a
storage capacity, implies the possibility of a bidirectional energy flow, in which the EV is no longer a passive
element in the network, but also provide services to it. This concept is known as vehicle-to-grid (V2G) and
results in another possibility for smart energy networks (smart-grids) [6].
In [7] and [8] a theoretical study about the energy generation potential of a carport is explored, discussing
technical, environmental, and financial aspects. In [9], a carport with 12 glass-glass PV modules, with a total
of 3kWp was installed. The system is generating electrical energy since May 2015 in Poland. The project
was developed to charge a small, urban vehicle. In [10], two years operation of two solar carports, one with
twelve and other with six parking positions, and ten electric vehicles are presented.
Although some research has been done, the use of PV generation into EVs charging infrastructure have
some challenges that need to be addressed. The output power of photovoltaic generation may have diurnal
and seasonal fluctuations and electric vehicles demand also have an uncertain pattern, which varies with
drivers’ behavior and preferences. Due to the difficulty in supply-demand matching, this problem must be
modeled based on stochastic approach exploring different scenarios to account these variabilities [3] and
although the electric mobility and the deployment of its charging infrastructure has been widely studied
[13,14], no studies have focused on planning the charging facilities in existent public car parks based on real
mobility patterns, which is essential to enable a correct public investment plan; in order to drive penetration
of electric mobility [13,15].
Integration of a Pilot PV Parking Lot and an Electric Vehicle in a University Campus Located in Curitiba: A Study Case 3
Brazilian Archives of Biology and Technology. Vol.64: e21210140, 2021 www.scielo.br/babt
This paper aims to assess the integration of a carport system with an electric vehicle in a university
campus building located in Curitiba, Paraná, Brazil. A case study is performed based on city irradiance data
and building electricity demand measurements collected by a local monitoring system. The research includes
the identification of the capacity of a photovoltaic carport system to meet the demand for electric vehicles,
manage the local energy demand and reduce the levels of CO2 emissions into the environment. The research
is limited to the Federal Technological University of Paraná (UTFPR), Curitiba, campus Neoville, where a
pilot parking plant was developed for two parking spaces.
Solar parking lot – the carport system
The usage of solar energy for electricity generation is a solution capable of supplying the demand for
electric vehicles. More specifically, useful parking areas already deployed can be converted into solar car
parks, capable of generating energy and recharging EV [6]. In fact, the potential for implanting these solar
systems into parking lots already in use is extremely high. As an example, parking spaces occupied 25% of
the total built area in the city of São Paulo in 2012 [6, 12]. With high availability of solar parking, it is easier
to charge the EV more often, which encourages users to join this technology.
Solar parking lots can be used as educational tools when installed in schools and universities. This would
allow the increase in social awareness regarding the concepts of solar generation technologies and electric
vehicles, stimulating their usage by society [13].
Solar carports are roofs built from photovoltaic panels to cover parking areas and generate energy.
However, they are different from the panels installed in an existing roofed parking lot. Solar carports have
many things in common with solar panels installed on the ground. Both eliminate the need for a surface on
which the panels can be attached, such as a roof. The main difference between a solar carport and a ground
installation is that the carports are higher to allow cars to be parked below the panels [14]. Usually, a solar
carport is two spaces wide, however they can be large enough to cover dozens of parking spaces. Depending
on consumption, installing a solar carport can generate enough energy to power your home, business cover
or industry. Although a typical parking cover offers shading for the car, its simplicity is a missed opportunity
with the existence of carports, the mayor advantage of them is to use their cover to generate energy.
Carport pilot project development
The execution of the CARPORT project at the Neoville campus of Federal University of Technology –
Paraná (UTFPR) was possible due the donation of equipment by companies of the solar energy field, as well
as the union of Solar Energy Laboratory (LABENS) students and researchers from UTFPR, for its
construction.
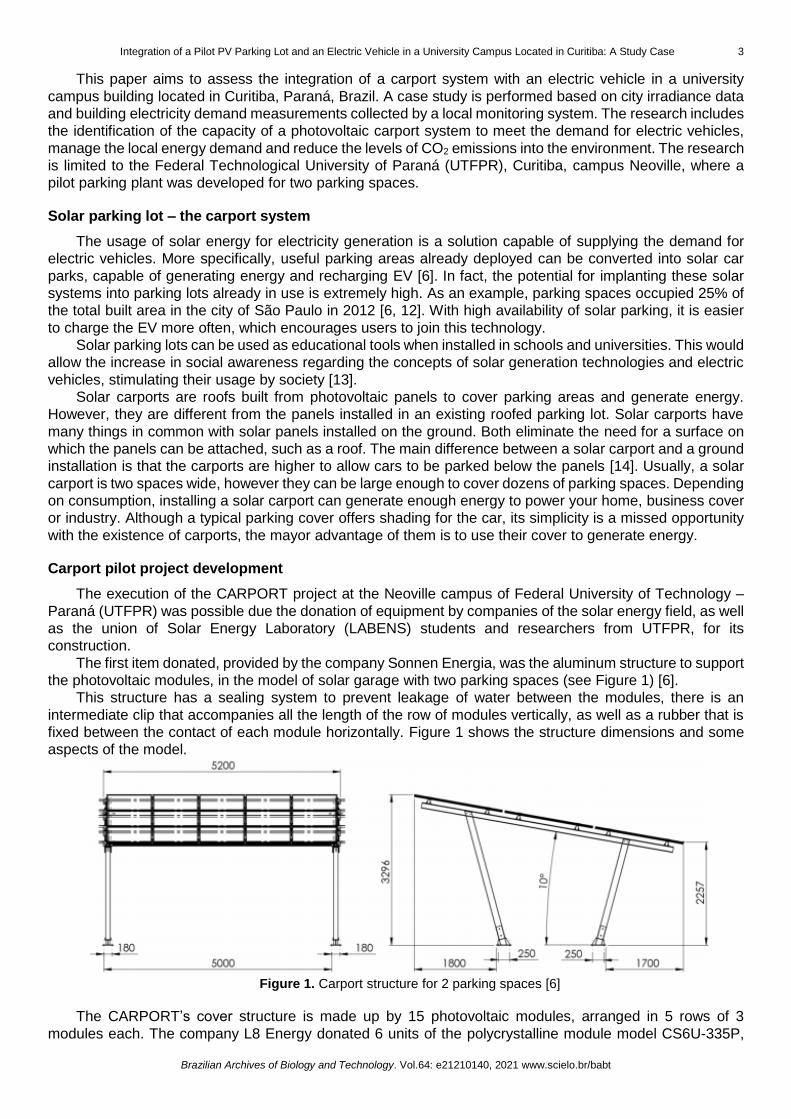
The first item donated, provided by the company Sonnen Energia, was the aluminum structure to support
the photovoltaic modules, in the model of solar garage with two parking spaces (see Figure 1) [6].
This structure has a sealing system to prevent leakage of water between the modules, there is an
intermediate clip that accompanies all the length of the row of modules vertically, as well as a rubber that is
fixed between the contact of each module horizontally. Figure 1 shows the structure dimensions and some
aspects of the model.
Figure 1. Carport structure for 2 parking spaces [6]
The CARPORT’s cover structure is made up by 15 photovoltaic modules, arranged in 5 rows of 3
modules each. The company L8 Energy donated 6 units of the polycrystalline module model CS6U-335P,
4 Kulik, A.C.; et al
Brazilian Archives of Biology and Technology. Vol.64: e21210140, 2021 www.scielo.br/babt
with 335 Wp each of Canadian Solar company and 9 units of the polycrystalline module model JKM320PP-
72-V, with 320 Wp each, from Jinko Solar company. The Table 1 describes the modules main characteristics
[6].
Table 1. Photovoltaic Modules Characteristics
JKM320PP-72-V CS6U-335P
Pmax 320Wp 335Wp Vmp 37.4V 37.4V Imp 8.56A 8.96A Voc 46.4V 45.8V Isc 9.05A 9.54A Efficiency (%) 16.49% 17.23%
Source: Jinko Solar and Canadian Solar Datasheets, adapted [28][29]
There are two models of different photovoltaic modules and they were separated into two distinct strings.
As a result, the inverter to be used in this system must have at least two independent maximum power point
tracking (MPPT).
The photovoltaic arrangement is composed of a 2.01 kWp string, from the set of 6 modules with 335 Wp;
and a 2.88 kWp string, composed of 9 modules of 320 Wp. Thus, the total power of the system, composed
of the sum of the two strings, is 4.89 kWp.
The company Fronius supplied an inverter, model Fronius Primo 5.0-1, which has 5 kWp of power and
an integrated monitoring system. In the Figure 2, the inverter used is showed in the upper right of the image.
The Table 2 presents the main characteristics of the referred inverter.
Table 2: Technical Data – Inverter Fronius Primo 5.0-1
Fronius Primo 5.0-1
MPPT number 2
MPPT1/MPPT2 12A/12A
Maximum Input DC 1000A
Voltage Range MPPT 80 – 800V
Rated Output Power AC 5000W
Maximum AC output Current AC 21.7A
Connection Network Voltage 1 – NPE 220V/230V
Network Frequency 50/60Hz
Source: Fronius Primo Datasheet, adapted [30].
For the system protection, the company Proauto donated a string-box, or connection board, with 4 inputs
and 2 outputs, which allows to separate the strings and connect them to its respective MPPT inverter channel.
The connection board contains, for each string, a set of a Dehn type II surge protection device (SPD) with a
range of 1000 V DC, specific for photovoltaic applications, and a switch-disconnector with 1000 VDC and 25
A. For protection and sectioning on the AC side of the inverter, an electrical panel with a circuit breaker and
an SPD were placed.
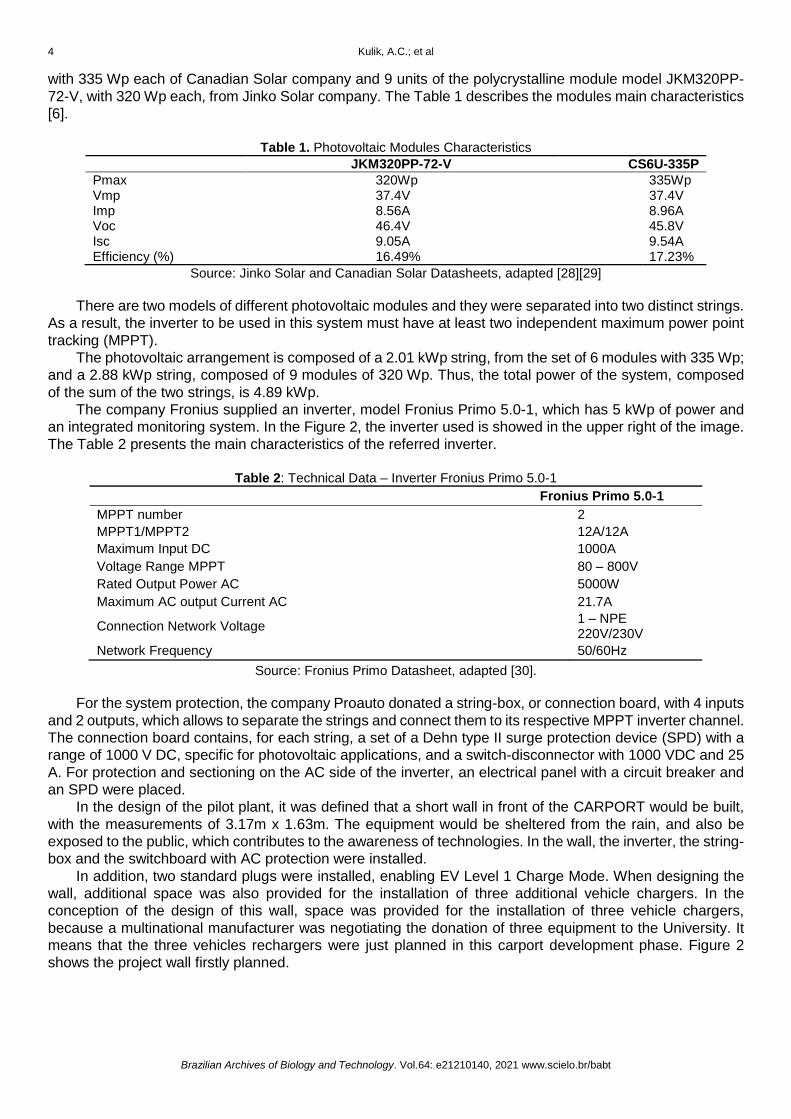
In the design of the pilot plant, it was defined that a short wall in front of the CARPORT would be built,
with the measurements of 3.17m x 1.63m. The equipment would be sheltered from the rain, and also be
exposed to the public, which contributes to the awareness of technologies. In the wall, the inverter, the string-
box and the switchboard with AC protection were installed.
In addition, two standard plugs were installed, enabling EV Level 1 Charge Mode. When designing the
wall, additional space was also provided for the installation of three additional vehicle chargers. In the
conception of the design of this wall, space was provided for the installation of three vehicle chargers,
because a multinational manufacturer was negotiating the donation of three equipment to the University. It
means that the three vehicles rechargers were just planned in this carport development phase. Figure 2
shows the project wall firstly planned.
Integration of a Pilot PV Parking Lot and an Electric Vehicle in a University Campus Located in Curitiba: A Study Case 5
Brazilian Archives of Biology and Technology. Vol.64: e21210140, 2021 www.scielo.br/babt
, Figure 2. Carport wall project to allocate the equipments [6]
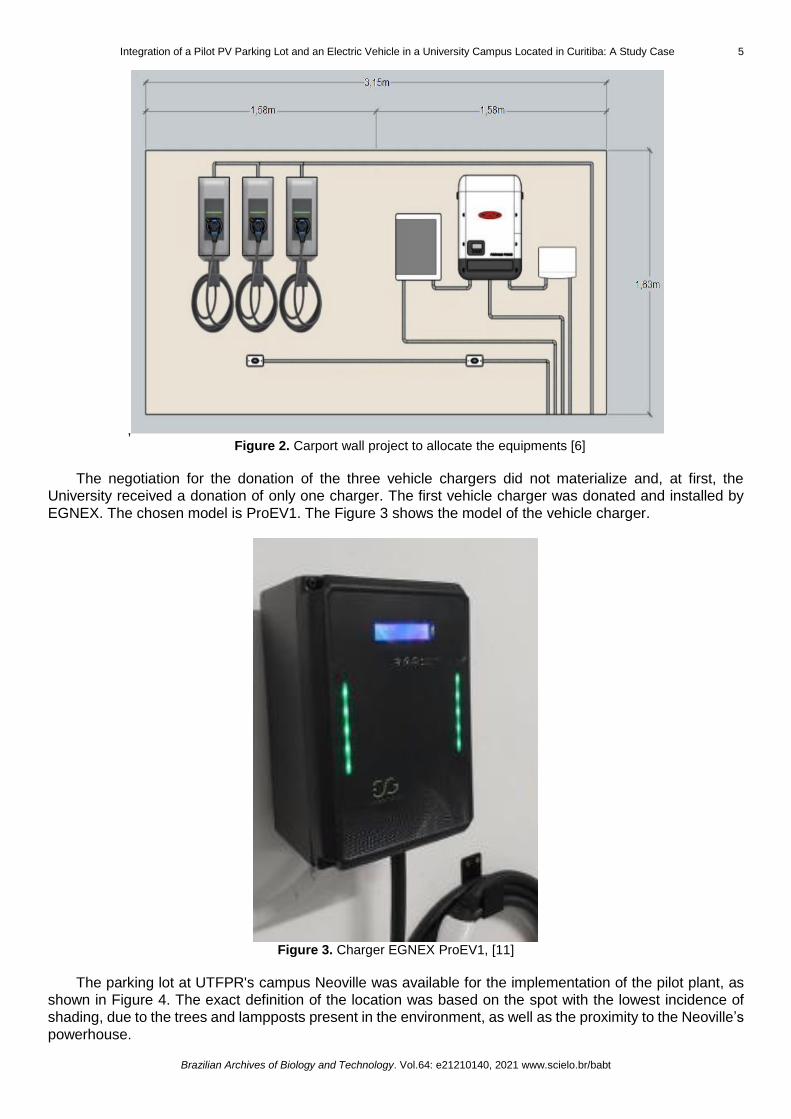
The negotiation for the donation of the three vehicle chargers did not materialize and, at first, the
University received a donation of only one charger. The first vehicle charger was donated and installed by
EGNEX. The chosen model is ProEV1. The Figure 3 shows the model of the vehicle charger.
Figure 3. Charger EGNEX ProEV1, [11]
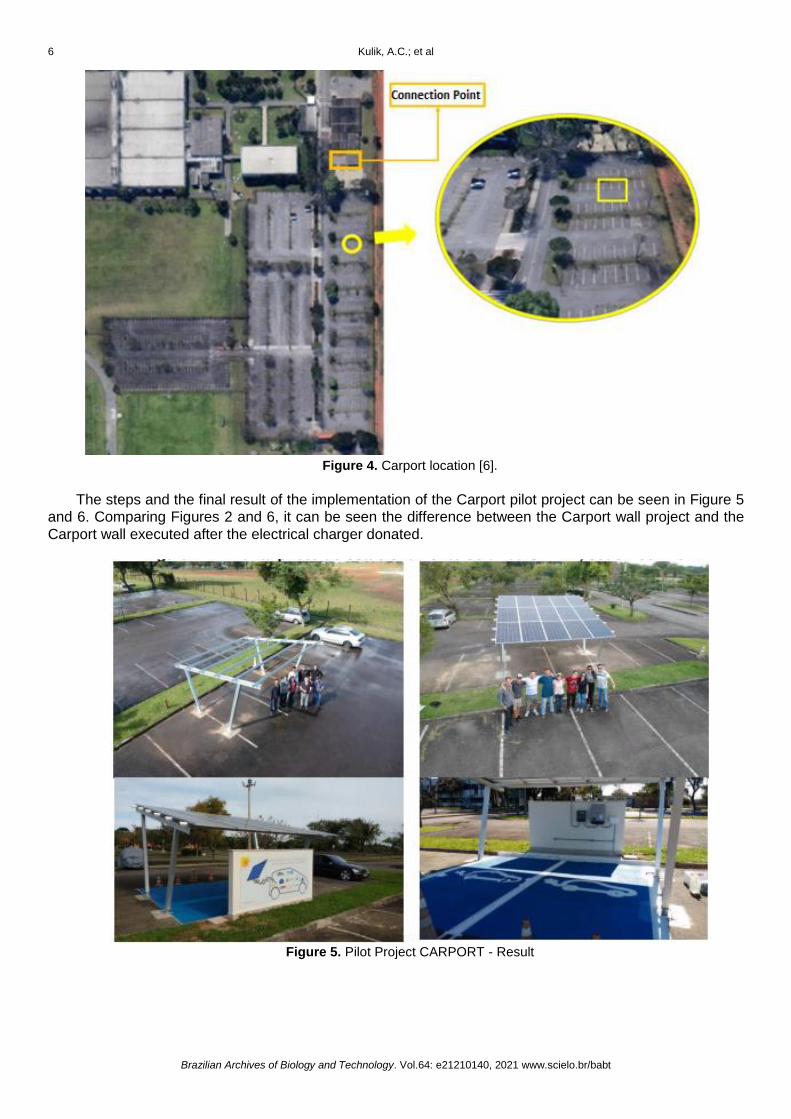
The parking lot at UTFPR's campus Neoville was available for the implementation of the pilot plant, as
shown in Figure 4. The exact definition of the location was based on the spot with the lowest incidence of
shading, due to the trees and lampposts present in the environment, as well as the proximity to the Neoville’s
powerhouse.
6 Kulik, A.C.; et al
Brazilian Archives of Biology and Technology. Vol.64: e21210140, 2021 www.scielo.br/babt
Figure 4. Carport location [6].
The steps and the final result of the implementation of the Carport pilot project can be seen in Figure 5
and 6. Comparing Figures 2 and 6, it can be seen the difference between the Carport wall project and the
Carport wall executed after the electrical charger donated.
Figure 5. Pilot Project CARPORT - Result
Integration of a Pilot PV Parking Lot and an Electric Vehicle in a University Campus Located in Curitiba: A Study Case 7
Brazilian Archives of Biology and Technology. Vol.64: e21210140, 2021 www.scielo.br/babt
Figure 6. CARPORT wall executed to allocate the equipments
Grid-connected photovoltaic system
A grid-connected photovoltaic system is composed basically by a photovoltaic panel, an inverter and
electrical protections [16]. The Neoville’s campus CARPORT has a power of 4.89kWp (6 modules Canadian
Solar, polycrystalline silicon technology, model CS6U-335P and 9 modules Jinko Solar, polycrystalline silicon
technology, model JKM320PP-72-V) connected in series in two different strings into a single-phase 220Volts
with 5kW – rated power inverter and has started operating in July 2019. The structure occupies an area of
30m² and there is an inclination of 10º according to the manufacturer's instructions. It is located in the parking
lot of UTFPR's campus Neoville, which has the following coordinates: -25.506039 latitude and -49.316472
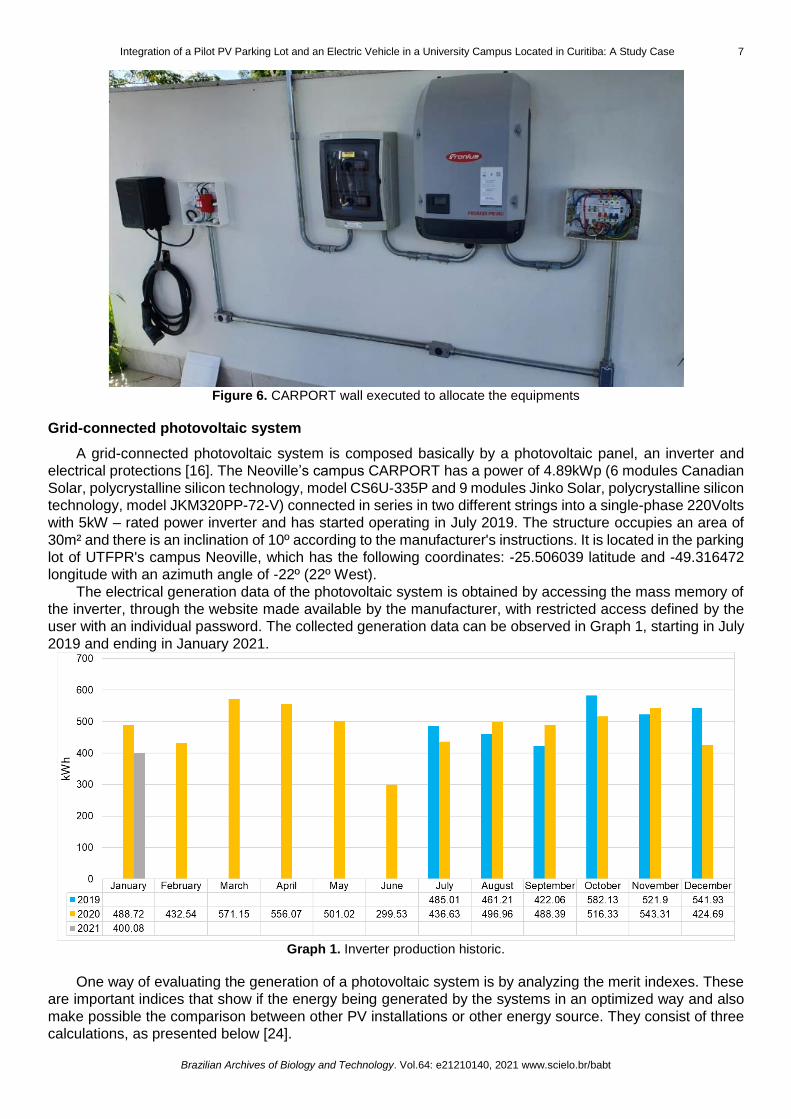
longitude with an azimuth angle of -22º (22º West). The electrical generation data of the photovoltaic system is obtained by accessing the mass memory of
the inverter, through the website made available by the manufacturer, with restricted access defined by the
user with an individual password. The collected generation data can be observed in Graph 1, starting in July
2019 and ending in January 2021.
Graph 1. Inverter production historic.
One way of evaluating the generation of a photovoltaic system is by analyzing the merit indexes. These
are important indices that show if the energy being generated by the systems in an optimized way and also
make possible the comparison between other PV installations or other energy source. They consist of three
calculations, as presented below [24].
8 Kulik, A.C.; et al
Brazilian Archives of Biology and Technology. Vol.64: e21210140, 2021 www.scielo.br/babt
Yield is the ratio between the generated energy (kWh) and the installed PV peak power (kWp) as shown
in equation 1. With this index it is possible to compare different technologies or systems of diverse power
rating [25].
𝑌𝐼𝐸𝐿𝐷 =𝐸𝑛𝑒𝑟𝑔𝑦 𝐺𝑒𝑛𝑒𝑟𝑎𝑡𝑖𝑜𝑛 (𝑘𝑊ℎ)
𝑃𝑉 𝑃𝑜𝑤𝑒𝑟 (𝑘𝑊𝑝) (1)
Performance Ratio (PR) is the relation between the previously calculate Yield (kWh / kWp) and the
number of hours of sunshine at 1,000 W / m² incident on the PV panel. In practice, it is not possible to achieve
a final value of 100%, but the higher the result, the lower the losses and the better the performance of the
system. For dimensioning photovoltaic systems, a value between 70% and 80% is commonly adopted [19].
𝑃𝑅 =
𝑌𝐼𝐸𝐿𝐷
𝐼𝑟𝑟𝑎𝑑𝑖𝑎𝑡𝑖𝑜𝑛 (𝑘𝑊𝑝)
1000, (2)
Capacity Factor (CF) aims to compare different types of energy source, it is the ratio between the
energy generated and the energy it would generate if it could stay in operation for 24 hours a day during a
chosen period of days at nominal power. As the PV is an intermittent source, it remains between 13% and
18% in Brazil.
𝐶𝐹 =𝐸𝑛𝑒𝑟𝑔𝑦 𝐺𝑒𝑛𝑒𝑟𝑎𝑡𝑖𝑜𝑛 (𝑘𝑊ℎ)
𝑃𝑉 𝑃𝑜𝑤𝑒𝑟 (𝑘𝑊𝑝)×24(ℎ𝑜𝑢𝑟𝑠)×𝐷𝑎𝑦𝑠 (3)
Merit Indexes
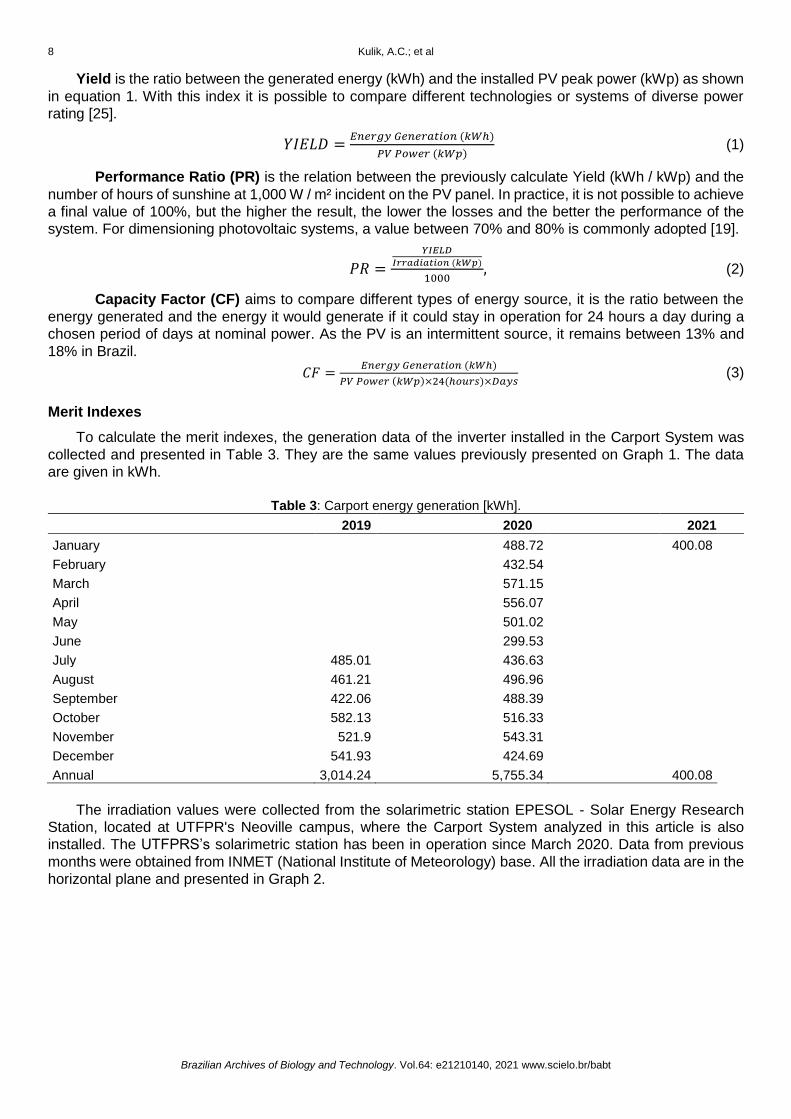
To calculate the merit indexes, the generation data of the inverter installed in the Carport System was
collected and presented in Table 3. They are the same values previously presented on Graph 1. The data
are given in kWh.
Table 3: Carport energy generation [kWh].
2019 2020 2021
January 488.72 400.08
February 432.54
March 571.15
April 556.07
May 501.02
June 299.53
July 485.01 436.63
August 461.21 496.96
September 422.06 488.39
October 582.13 516.33
November 521.9 543.31
December 541.93 424.69
Annual 3,014.24 5,755.34 400.08
The irradiation values were collected from the solarimetric station EPESOL - Solar Energy Research
Station, located at UTFPR's Neoville campus, where the Carport System analyzed in this article is also
installed. The UTFPRS’s solarimetric station has been in operation since March 2020. Data from previous
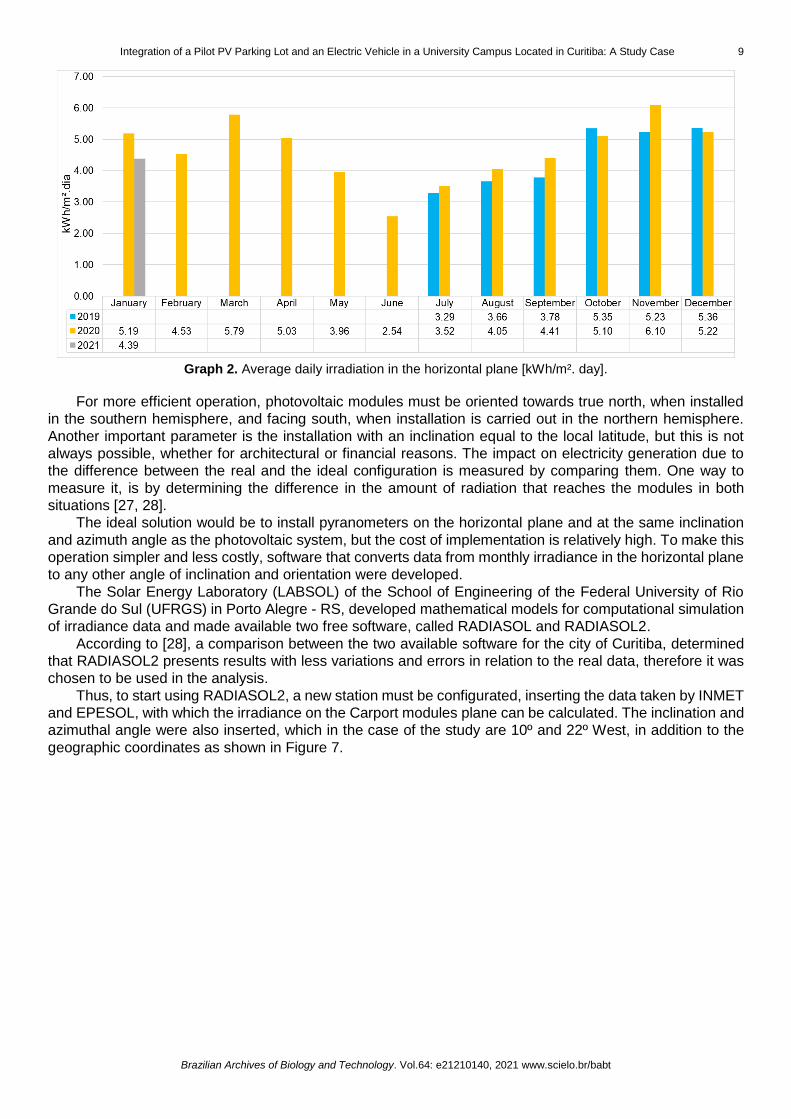
months were obtained from INMET (National Institute of Meteorology) base. All the irradiation data are in the
horizontal plane and presented in Graph 2.
Integration of a Pilot PV Parking Lot and an Electric Vehicle in a University Campus Located in Curitiba: A Study Case 9
Brazilian Archives of Biology and Technology. Vol.64: e21210140, 2021 www.scielo.br/babt
Graph 2. Average daily irradiation in the horizontal plane [kWh/m². day].
For more efficient operation, photovoltaic modules must be oriented towards true north, when installed
in the southern hemisphere, and facing south, when installation is carried out in the northern hemisphere.
Another important parameter is the installation with an inclination equal to the local latitude, but this is not
always possible, whether for architectural or financial reasons. The impact on electricity generation due to
the difference between the real and the ideal configuration is measured by comparing them. One way to
measure it, is by determining the difference in the amount of radiation that reaches the modules in both
situations [27, 28].
The ideal solution would be to install pyranometers on the horizontal plane and at the same inclination
and azimuth angle as the photovoltaic system, but the cost of implementation is relatively high. To make this
operation simpler and less costly, software that converts data from monthly irradiance in the horizontal plane
to any other angle of inclination and orientation were developed.
The Solar Energy Laboratory (LABSOL) of the School of Engineering of the Federal University of Rio
Grande do Sul (UFRGS) in Porto Alegre - RS, developed mathematical models for computational simulation
of irradiance data and made available two free software, called RADIASOL and RADIASOL2.
According to [28], a comparison between the two available software for the city of Curitiba, determined
that RADIASOL2 presents results with less variations and errors in relation to the real data, therefore it was
chosen to be used in the analysis.
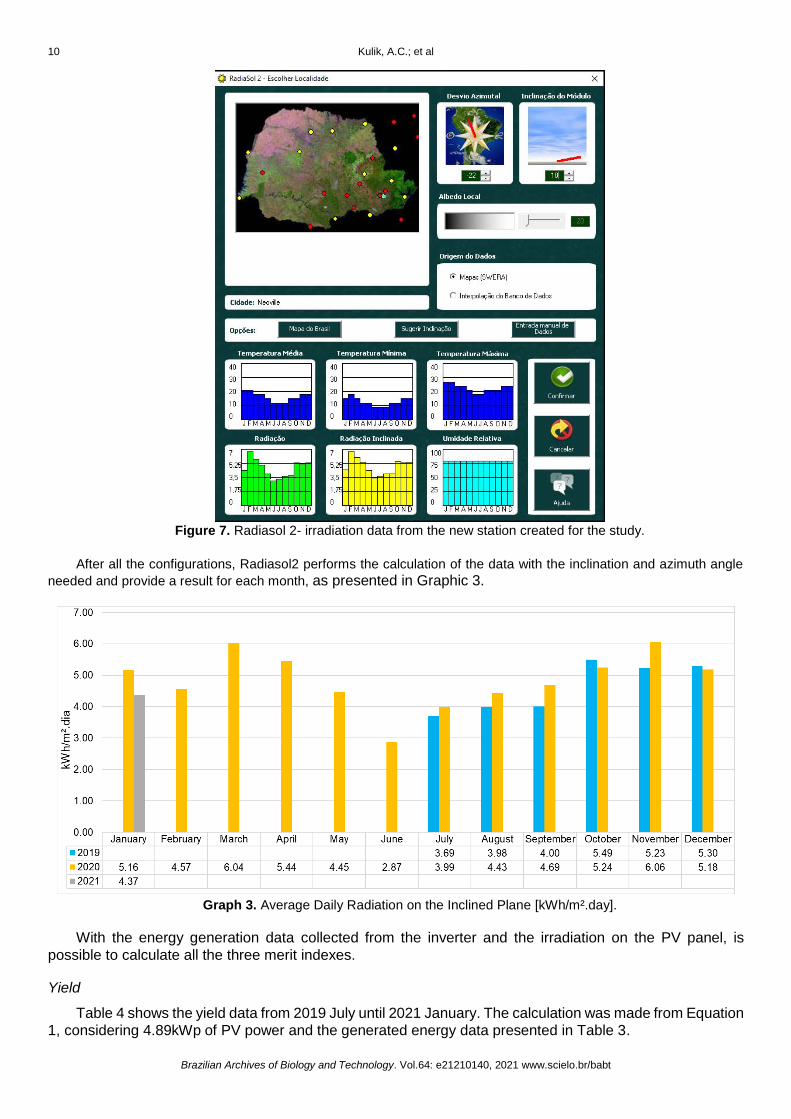
Thus, to start using RADIASOL2, a new station must be configurated, inserting the data taken by INMET
and EPESOL, with which the irradiance on the Carport modules plane can be calculated. The inclination and
azimuthal angle were also inserted, which in the case of the study are 10º and 22º West, in addition to the
geographic coordinates as shown in Figure 7.
10 Kulik, A.C.; et al
Brazilian Archives of Biology and Technology. Vol.64: e21210140, 2021 www.scielo.br/babt
Figure 7. Radiasol 2- irradiation data from the new station created for the study.
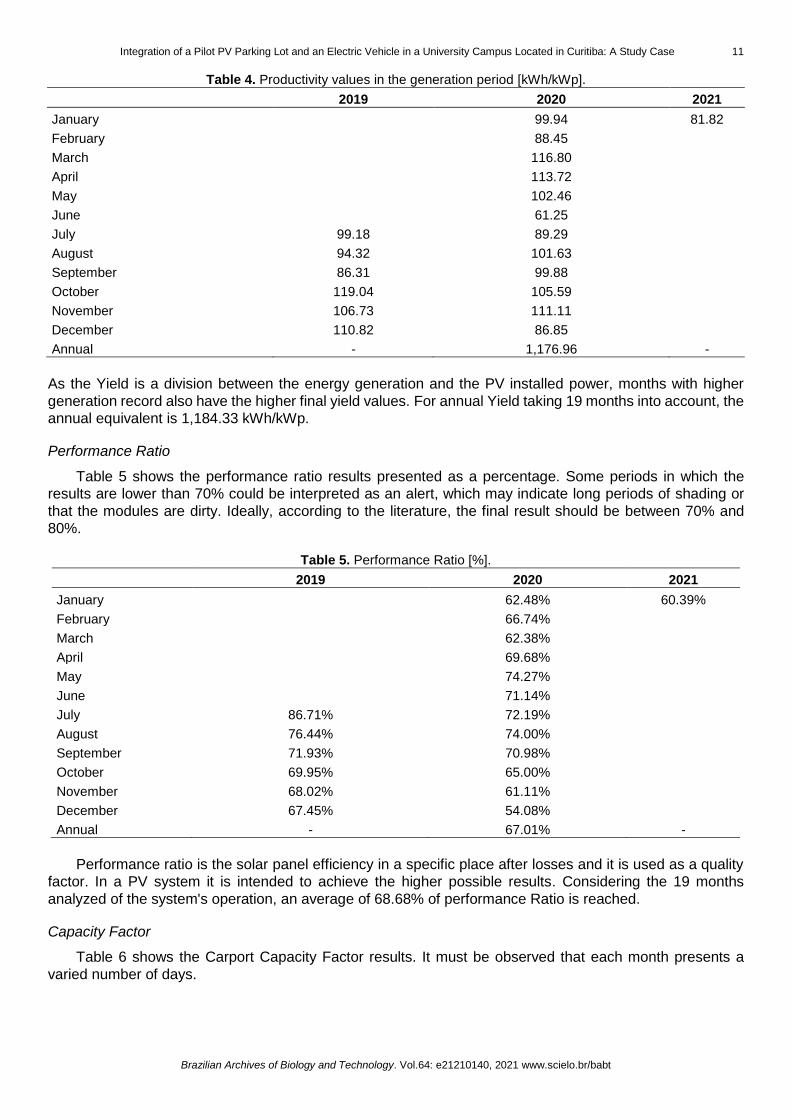
After all the configurations, Radiasol2 performs the calculation of the data with the inclination and azimuth angle
needed and provide a result for each month, as presented in Graphic 3.
Graph 3. Average Daily Radiation on the Inclined Plane [kWh/m².day].
With the energy generation data collected from the inverter and the irradiation on the PV panel, is
possible to calculate all the three merit indexes.
Yield
Table 4 shows the yield data from 2019 July until 2021 January. The calculation was made from Equation
1, considering 4.89kWp of PV power and the generated energy data presented in Table 3.
Integration of a Pilot PV Parking Lot and an Electric Vehicle in a University Campus Located in Curitiba: A Study Case 11
Brazilian Archives of Biology and Technology. Vol.64: e21210140, 2021 www.scielo.br/babt
Table 4. Productivity values in the generation period [kWh/kWp].
2019 2020 2021
January 99.94 81.82
February 88.45
March 116.80
April 113.72
May 102.46
June 61.25
July 99.18 89.29
August 94.32 101.63
September 86.31 99.88
October 119.04 105.59
November 106.73 111.11
December 110.82 86.85
Annual - 1,176.96 -
As the Yield is a division between the energy generation and the PV installed power, months with higher
generation record also have the higher final yield values. For annual Yield taking 19 months into account, the
annual equivalent is 1,184.33 kWh/kWp.
Performance Ratio
Table 5 shows the performance ratio results presented as a percentage. Some periods in which the
results are lower than 70% could be interpreted as an alert, which may indicate long periods of shading or
that the modules are dirty. Ideally, according to the literature, the final result should be between 70% and
80%.
Table 5. Performance Ratio [%].
2019 2020 2021
January 62.48% 60.39%
February 66.74%
March 62.38%
April 69.68%
May 74.27%
June 71.14%
July 86.71% 72.19%
August 76.44% 74.00%
September 71.93% 70.98%
October 69.95% 65.00%
November 68.02% 61.11%
December 67.45% 54.08%
Annual - 67.01% -
Performance ratio is the solar panel efficiency in a specific place after losses and it is used as a quality
factor. In a PV system it is intended to achieve the higher possible results. Considering the 19 months
analyzed of the system's operation, an average of 68.68% of performance Ratio is reached.
Capacity Factor
Table 6 shows the Carport Capacity Factor results. It must be observed that each month presents a
varied number of days.
12 Kulik, A.C.; et al
Brazilian Archives of Biology and Technology. Vol.64: e21210140, 2021 www.scielo.br/babt
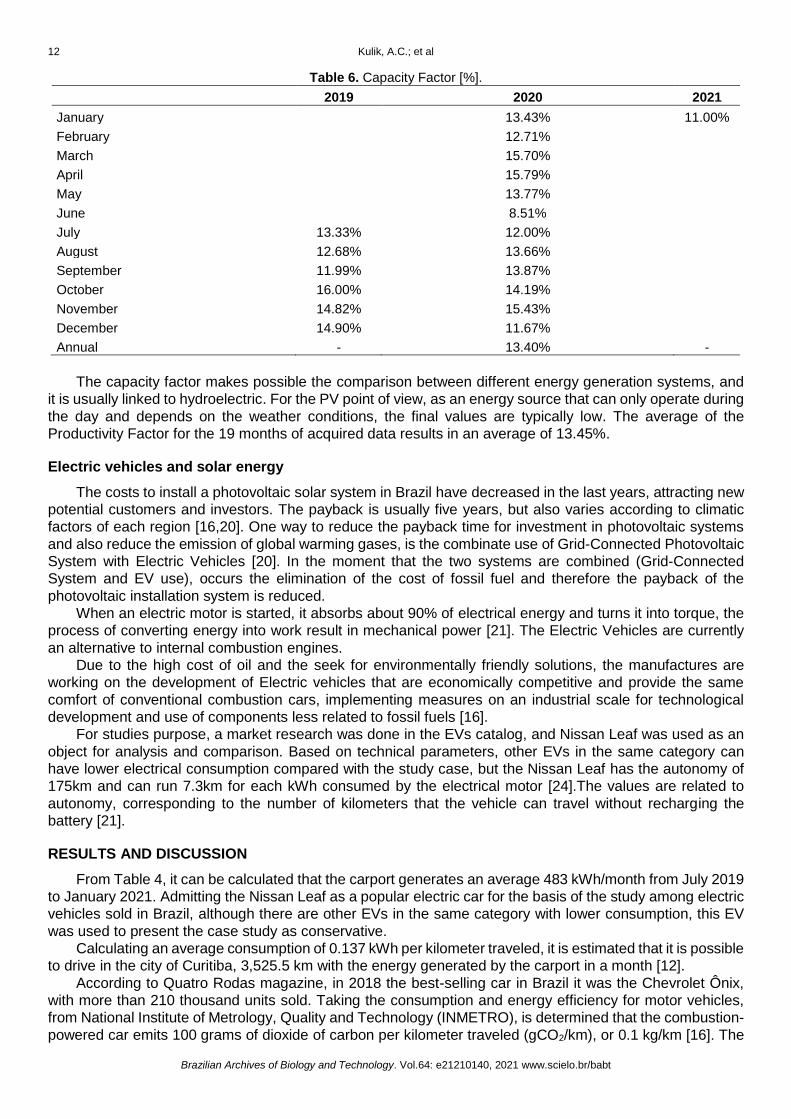
Table 6. Capacity Factor [%].
2019 2020 2021
January 13.43% 11.00%
February 12.71%
March 15.70%
April 15.79%
May 13.77%
June 8.51%
July 13.33% 12.00%
August 12.68% 13.66%
September 11.99% 13.87%
October 16.00% 14.19%
November 14.82% 15.43%
December 14.90% 11.67%
Annual - 13.40% -
The capacity factor makes possible the comparison between different energy generation systems, and
it is usually linked to hydroelectric. For the PV point of view, as an energy source that can only operate during
the day and depends on the weather conditions, the final values are typically low. The average of the
Productivity Factor for the 19 months of acquired data results in an average of 13.45%.
Electric vehicles and solar energy
The costs to install a photovoltaic solar system in Brazil have decreased in the last years, attracting new
potential customers and investors. The payback is usually five years, but also varies according to climatic
factors of each region [16,20]. One way to reduce the payback time for investment in photovoltaic systems
and also reduce the emission of global warming gases, is the combinate use of Grid-Connected Photovoltaic
System with Electric Vehicles [20]. In the moment that the two systems are combined (Grid-Connected
System and EV use), occurs the elimination of the cost of fossil fuel and therefore the payback of the
photovoltaic installation system is reduced.
When an electric motor is started, it absorbs about 90% of electrical energy and turns it into torque, the
process of converting energy into work result in mechanical power [21]. The Electric Vehicles are currently
an alternative to internal combustion engines.
Due to the high cost of oil and the seek for environmentally friendly solutions, the manufactures are
working on the development of Electric vehicles that are economically competitive and provide the same
comfort of conventional combustion cars, implementing measures on an industrial scale for technological
development and use of components less related to fossil fuels [16].
For studies purpose, a market research was done in the EVs catalog, and Nissan Leaf was used as an
object for analysis and comparison. Based on technical parameters, other EVs in the same category can
have lower electrical consumption compared with the study case, but the Nissan Leaf has the autonomy of
175km and can run 7.3km for each kWh consumed by the electrical motor [24].The values are related to
autonomy, corresponding to the number of kilometers that the vehicle can travel without recharging the
battery [21].
RESULTS AND DISCUSSION
From Table 4, it can be calculated that the carport generates an average 483 kWh/month from July 2019
to January 2021. Admitting the Nissan Leaf as a popular electric car for the basis of the study among electric
vehicles sold in Brazil, although there are other EVs in the same category with lower consumption, this EV
was used to present the case study as conservative.
Calculating an average consumption of 0.137 kWh per kilometer traveled, it is estimated that it is possible
to drive in the city of Curitiba, 3,525.5 km with the energy generated by the carport in a month [12].
According to Quatro Rodas magazine, in 2018 the best-selling car in Brazil it was the Chevrolet Ônix,
with more than 210 thousand units sold. Taking the consumption and energy efficiency for motor vehicles,
from National Institute of Metrology, Quality and Technology (INMETRO), is determined that the combustion-
powered car emits 100 grams of dioxide of carbon per kilometer traveled (gCO2/km), or 0.1 kg/km [16]. The
Integration of a Pilot PV Parking Lot and an Electric Vehicle in a University Campus Located in Curitiba: A Study Case 13
Brazilian Archives of Biology and Technology. Vol.64: e21210140, 2021 www.scielo.br/babt
Ônix 2018 consume is about 12,1km/l according the manufacturer, chevrolet. According National Agency of
Petrol (ANP), the medium price to gasoline in the Curitiba city nowadays is about R$ 4,997/l [23].
Based on the distance that can be traveled with the car only with the electricity from the carport, 3,525.5
km, it is possible to determine that the electric car would avoid the emission of 352.55 kgCO2 monthly, or
4.23 tonCO2 in a full year. The total distance that could be traveled with the energy generation of the carport
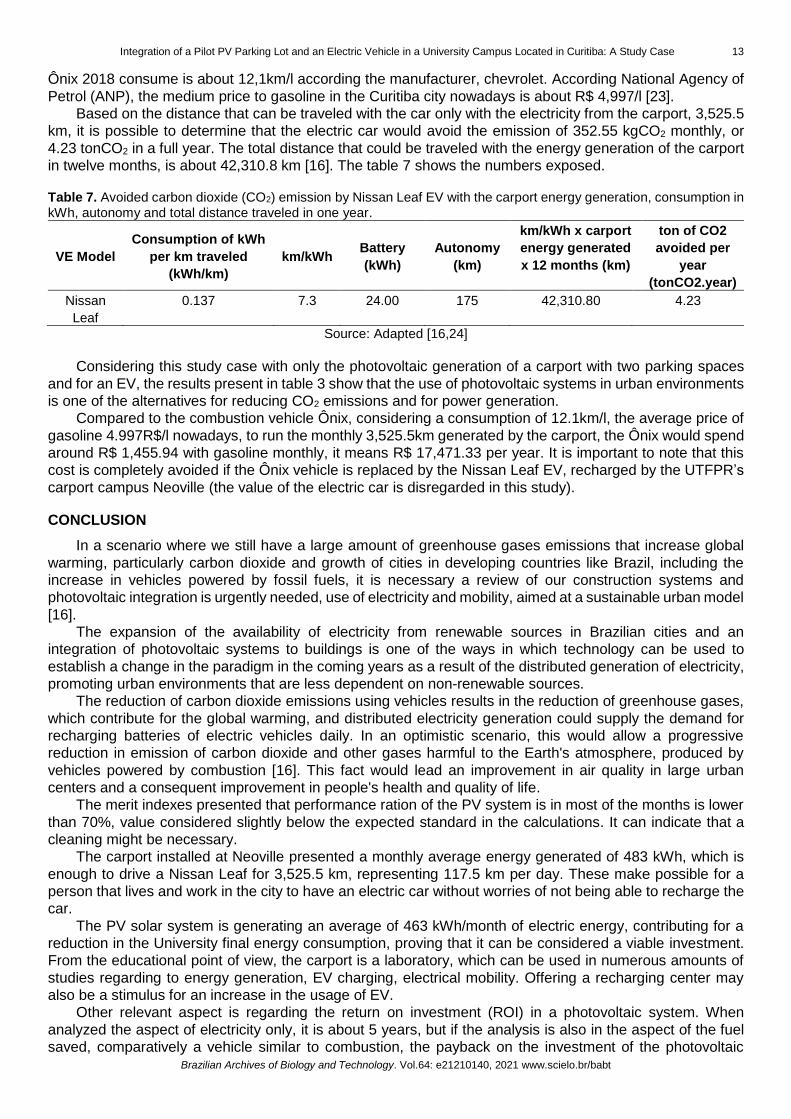
in twelve months, is about 42,310.8 km [16]. The table 7 shows the numbers exposed.
Table 7. Avoided carbon dioxide (CO2) emission by Nissan Leaf EV with the carport energy generation, consumption in kWh, autonomy and total distance traveled in one year.
VE Model
Consumption of kWh
per km traveled
(kWh/km)
km/kWh Battery
(kWh)
Autonomy
(km)
km/kWh x carport
energy generated
x 12 months (km)
ton of CO2
avoided per
year
(tonCO2.year)
Nissan
Leaf
0.137 7.3 24.00 175 42,310.80 4.23
Source: Adapted [16,24]
Considering this study case with only the photovoltaic generation of a carport with two parking spaces
and for an EV, the results present in table 3 show that the use of photovoltaic systems in urban environments
is one of the alternatives for reducing CO2 emissions and for power generation.
Compared to the combustion vehicle Ônix, considering a consumption of 12.1km/l, the average price of
gasoline 4.997R$/l nowadays, to run the monthly 3,525.5km generated by the carport, the Ônix would spend
around R$ 1,455.94 with gasoline monthly, it means R$ 17,471.33 per year. It is important to note that this
cost is completely avoided if the Ônix vehicle is replaced by the Nissan Leaf EV, recharged by the UTFPR’s
carport campus Neoville (the value of the electric car is disregarded in this study).
CONCLUSION
In a scenario where we still have a large amount of greenhouse gases emissions that increase global
warming, particularly carbon dioxide and growth of cities in developing countries like Brazil, including the
increase in vehicles powered by fossil fuels, it is necessary a review of our construction systems and
photovoltaic integration is urgently needed, use of electricity and mobility, aimed at a sustainable urban model
[16].
The expansion of the availability of electricity from renewable sources in Brazilian cities and an
integration of photovoltaic systems to buildings is one of the ways in which technology can be used to
establish a change in the paradigm in the coming years as a result of the distributed generation of electricity,
promoting urban environments that are less dependent on non-renewable sources.
The reduction of carbon dioxide emissions using vehicles results in the reduction of greenhouse gases,
which contribute for the global warming, and distributed electricity generation could supply the demand for
recharging batteries of electric vehicles daily. In an optimistic scenario, this would allow a progressive
reduction in emission of carbon dioxide and other gases harmful to the Earth's atmosphere, produced by
vehicles powered by combustion [16]. This fact would lead an improvement in air quality in large urban
centers and a consequent improvement in people's health and quality of life.
The merit indexes presented that performance ration of the PV system is in most of the months is lower
than 70%, value considered slightly below the expected standard in the calculations. It can indicate that a
cleaning might be necessary.
The carport installed at Neoville presented a monthly average energy generated of 483 kWh, which is
enough to drive a Nissan Leaf for 3,525.5 km, representing 117.5 km per day. These make possible for a
person that lives and work in the city to have an electric car without worries of not being able to recharge the
car.
The PV solar system is generating an average of 463 kWh/month of electric energy, contributing for a
reduction in the University final energy consumption, proving that it can be considered a viable investment.
From the educational point of view, the carport is a laboratory, which can be used in numerous amounts of
studies regarding to energy generation, EV charging, electrical mobility. Offering a recharging center may
also be a stimulus for an increase in the usage of EV.
Other relevant aspect is regarding the return on investment (ROI) in a photovoltaic system. When
analyzed the aspect of electricity only, it is about 5 years, but if the analysis is also in the aspect of the fuel
saved, comparatively a vehicle similar to combustion, the payback on the investment of the photovoltaic
14 Kulik, A.C.; et al
Brazilian Archives of Biology and Technology. Vol.64: e21210140, 2021 www.scielo.br/babt
system falls to about 1 year. The money saved without paying the fossil fuel yearly is near the costs to install
all the photovoltaic system nowadays.
The analyzed Carport has two parking spaces, thereby, based on the production and consumption
results of a vehicle, when considering two vehicles with the existing characteristics occupying the parking
and being loaded by this carport, each vehicle would have a range of 58 km per day, reaching 1,762 km per
month. This autonomy, per parking space, is perfectly adherent to the profile of using an urban vehicle in
daily activities.
REFERENCES
1. Garcia G, Nogueira EF, Betini, RC. Solar Energy for Residential Use and Its Contribution to the Energy Matrix of
the State of Paraná. Braz Arch Biol Technol [Internet]. 2018. [cited 2021 Feb 13]; 61 (e18000510): 1-11. Available
from: http://dx.doi.org/10.1590/1678-4324-smart-2018000510
2. Teter J. International Energy Agency. Tracking Transport 2020 [Internet]. [cited 2021 Feb 13]. Available from:
https://www.iea.org/reports/tracking-transport-2020.
3. Branco NC, Affonso CM. Probabilistic approach to integrate photovoltaic generation into PEVS charging stations
considering technical, economic and environmental aspects. Energies [Internet]. 2020 [cited 2021 Feb 13]; 13
(5086):1-18. Available from: https://doi.org/10.3390/en13195086.
4. Teter J. International Energy Agency. Global EV Outlook 2020 [Internet]. [cited 2021 Feb 13]. Available from:
https://www.iea.org/reports/globalev-outlook-2020.
5. REN21. Renewables 2020 Global Status Report [Internet]. Paris. 2020 [cited 2021 Feb 13] Available from:
https://www.ren21.net/wp-content/uploads/2019/05/gsr_2020_full_report_en.pdf
6. Pereira JS. Investigation of the energy potential of Photovoltaic solar parks to supply local energy and electric
vehicles [dissertation]. Curitiba: UTFPR; 2019. 112p. (in Portuguese).
7. Nunes P, Figueiredo R, Brito, MC. The use of parking lots to solar-charge electric vehicles. Renew. Sust. Energ.
Rev. 2016; 66: 679-693.
8. Buresh KM, Apperley MD, Booysen MJ. Three shades of green: Perspectives on at-work charging of electric
vehicles using photovoltaic carports. Energy Sustain Dev. 2020; 57: 132-140.
9. Malek A, Kosko M, Lusiak T. Urban Logistics of Small Electric Vehicle Charged from a Photovoltaic Carport. The
Archives of Automotive Engineering – Archiwum Motoryzacji. 2018; 82 (4):63-75.
10. Merten J; et al. Solar Mobility: Two Years of Practical Experience Charging Ten Cars with Solar Energy. 5th
International Conference on Integration of Renewable and Distributed Energy Resources; 2012 Dec 4-6; Berlin,
Germany.
11. Operation Manual Car Charger ProEV1. EGNEX. 2020; 6: 1-16. Curitiba. (In Portuguese).
12. Vaz LFH, Barros DC, Castro BHR. Hybrid and electric vehicles: suggestions for public policies for the segment.
2015; 41: 295-344. (In Portuguese).
13. Alcover EB, Martínez-Moll V, Rosselló JL, et al. Energetic and economic analysis of the Electric Vehicles charge
impacts on public parking lots. 18th International Conference on Renewable Energies and Power Quality; 2020;
Granada, Spain; 2020 Jun 18; 18.
14. Heuberger CF, Bains PK, Mac Dowell N. The EV-olution of the power system: A spatio-temporal optimisation model
to investigate the impact of electric vehicle deployment. Applied Energy [Internet]. 2020 [cited 2021 Feb 23]; 257,
Available from: https://www.sciencedirect.com/science/article/pii/S0306261919314023.
15. Levinson RS, West TH. Impact of public electric vehicle charging infrastructure. Transportation Research Part D:
Transport and Environment. Transportation Research [Internet]. 2018 [cited 2021 Feb 23];.64: 158–177. Available
from: https://doi.org/10.1016/j.trd.2017.10.006.
16. Casagrande Jr EF, Urbanetz J, Seratiuk AR, Tonolo EA. Photovoltaic solar energy and electrical automobiles: the
combination of a model for carbon reduction emissions in the Curitiba city. Technology and Society magazine.
2019; 15 (37): 653-678. (In Portuguese).
17. Robinson J, Brase G, Griswold W, et al. Business models for solar powered charging stations to develop
infrastructure for electric vehicles. Sustainability [Internet]. 2014; 6 (10): 7358-7387. Available from:
https://doi.org/10.3390/su6107358.
18. Rennn. Carport Solar: Quais as vantagens e quanto custa? [Internet]. Sonnen Estruturas; 2018 [cited 2021 Feb
23]. Available from: http://www.solarfix.com.br/2018/01/22/carport-solar-quais-as-vantagens-e-quanto-custa/. (In
Portuguese).
19. Cardoso K. Investing in solar energy brings good financial results: In the long run term, the economy that comes
from the sun generates a good financial return. Exame Magazine, 2018. (In Portuguese).
Integration of a Pilot PV Parking Lot and an Electric Vehicle in a University Campus Located in Curitiba: A Study Case 15
Brazilian Archives of Biology and Technology. Vol.64: e21210140, 2021 www.scielo.br/babt
20. Silva JE, Tonin FS, Urbanetz Jr J. Electric vehicles and generation distributed from photovoltaic systems
[dissertation]. Curitiba: UTFPR; 2019. 115p. (In Portuguese).
21. Silva JE, Urbanetz Jr J. Converting a Conventional Vehicle into an Electric Vehicle (EV). Brazilian Archives of
Biology and Technology [Internet]. 2019. [cited 2021 Feb 25]; 62 (e19190007): 1-12. Available from: https://utfpr-
ct-static-content.s3.amazonaws.com/labens.ct.utfpr.edu.br/wp-content/uploads/2019/11/BABT2019-Jardel.pdf.
22. National Agency of Petrol (ANP) [Internet]. [cited 2021 Feb 25] Available from:
http://preco.anp.gov.br/include/Resumo_Por_Municipio_Posto.asp. (In Portuguese).
23. Meunier N. La vérité sur la consommation des voitures électriques. Magazine Challenges [Internet]. 2012 [cited
2021 Feb 26]. Available from: http://automobile.challenges.fr/dossiers/20120807.LQA3178/la-verite-sur-
la.consommationdes-voitures-electriques.html.
24. Urbanetz JR J, Tiepolo GM, Casagrande JR EF, Tonin FS, Mariano JDA. Distributed Photovoltaic Generation: The
Case of Systems UTFPR Photovoltaics in Curitiba. X Brazilian Energy Planning Congress, 2016. (In Portuguese).
25. Tonolo EA. Analysis of Loss Factors in Photovoltaic Systems UTFPR Campus Curitiba [dissertation]. Curitiba (PR):
Federal Technological University of Paraná; 2019. (In Portuguese).
26. Pinho JT, Galdino MA. Engineering manual for photovoltaic systems. 1st ed. Rio de Janeiro: 2014. Portuguese.
27. Freitas DV, Souza MB, Tonolo EA, Urbanetz JR J, Tiepolo GM. Comparison between irradiation values in the
inclined plane at latitude measured and calculated from the software Radiasol and Radiasol2. VIII Brazilian
Congress of Solar Energy. 2020. (In Portuguese).
28. Jinko Solar [Internet]. Eagle 72P 320 – 340 Watt Poly Crystalline Module; [cited 2021 Apr 24]. Available from:
https://www.jinkosolar.com/uploads/5e93f9cc/Eagle%20JKM320-340PP-72-(V)-A3,1-EN.pdf.
29. Canadian Solar [Internet]. MAXPOWER CS6U – 325 | 330 | 335P; [cited 2021 Apr 24]. Available from:
https://solar.ourolux.com.br/media/sparsh/product_attachment/Datasheet_M_dulo_330W_-_Canadian_-
_CS6U330P.pdf.
30. Fronius Solar Energy [Internet]. Fronius Primo 5.0-1. [cited 2021 Apr 24]. Available from:
https://www.fronius.com/pt-br/brasil/energia-solar/instaladores-e-parceiros/dados-tecnicos/todos-os-
produtos/inversor/fronius-primo/fronius-primo-5-0-1.
© 2021 by the authors. Submitted for possible open access publication under the terms and
conditions of the Creative Commons Attribution (CC BY NC) license
(https://creativecommons.org/licenses/by-nc/4.0/).