Embed Size (px)
Citation preview
Integration and visualization of genome-wide data
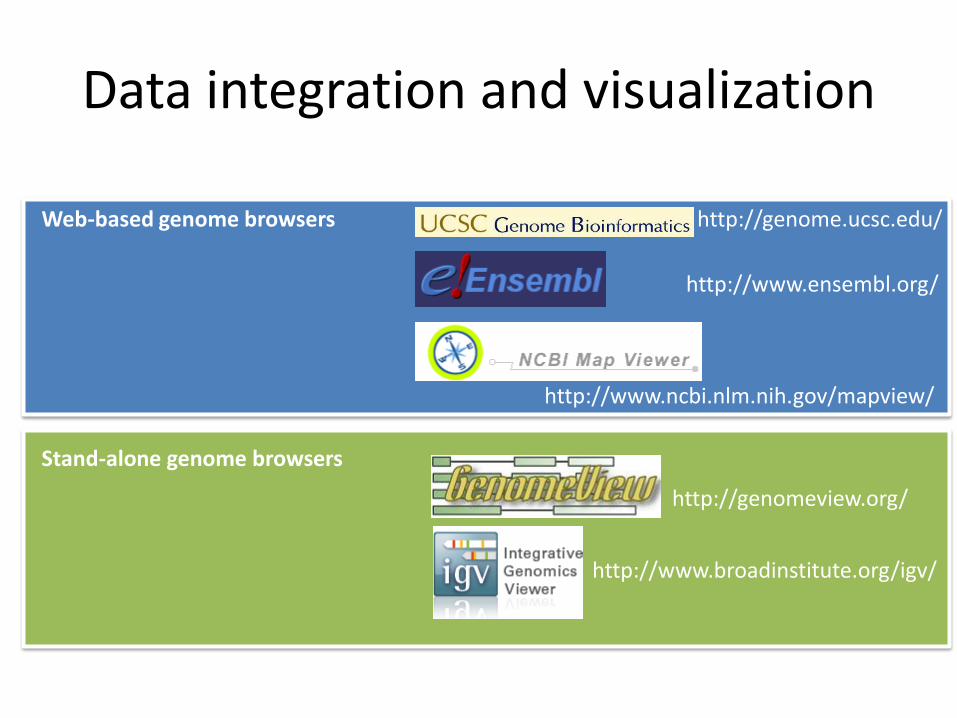
Data integration and visualization
http://genomeview.org/
http://www.broadinstitute.org/igv/
Stand-alone genome browsers
http://genome.ucsc.edu/
http://www.ensembl.org/
http://www.ncbi.nlm.nih.gov/mapview/
Web-based genome browsers
Web-based Genome Browsers
• Software designed to enable a user to access and display genome sequence data
• Visual integration and correlation of different types of information
• Organize large amounts of genome sequence data
Web-based Genome Browsers
• UCSC, Ensembl and NCBI are based on the same reference genome
• The three genome browser mainly change at interface level and annotations available.
• Some genomes are available in one genome browser but not the other.
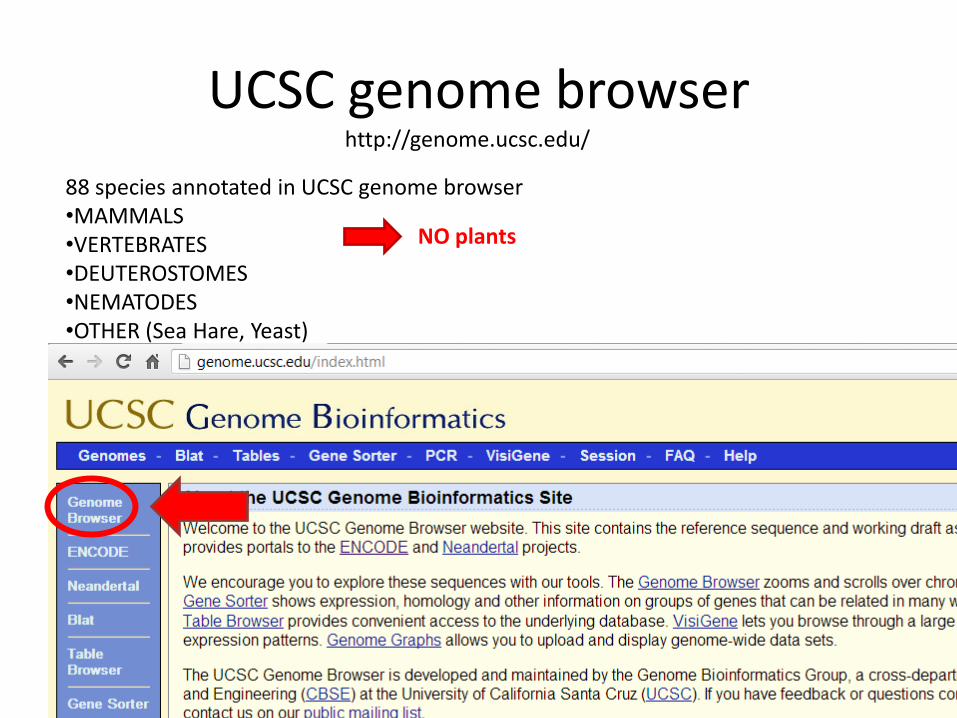
UCSC genome browser http://genome.ucsc.edu/
88 species annotated in UCSC genome browser •MAMMALS •VERTEBRATES •DEUTEROSTOMES •NEMATODES •OTHER (Sea Hare, Yeast)
NO plants
UCSC genome browser
• Allows aligning to genome sequence via BLAT
• Table Browser
• Creation of PDF
• Provides access to all the data produced by the project, and to the software used to analyze and present it
• Site produces and maintains annotation tracks
http://genome.ucsc.edu/
Annotation tracks
• Genomic data: known genes, predicted genes, ESTs, mRNAs, CpG islands, assembly gaps and coverage, chromosomal bands, homologies, Chip-Seq data, DNAse-Seq data, Expression data, …
• Annotation tracks are both computed at UCSC from publicly available sequence data and provided by collaborators
• Users can also add their own custom tracks to the browser
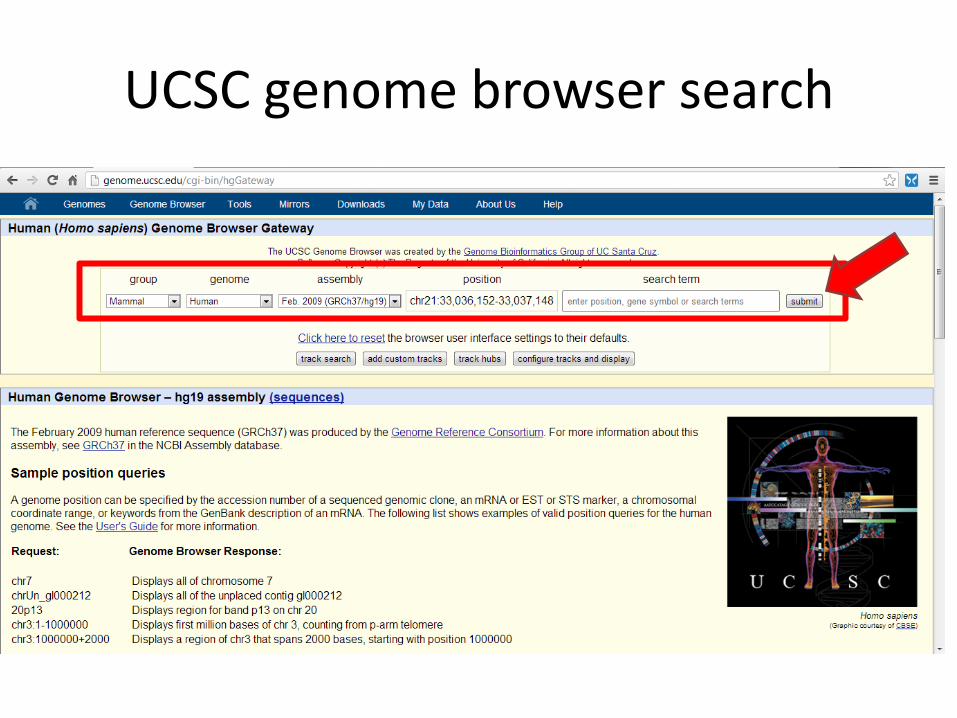
UCSC genome browser search
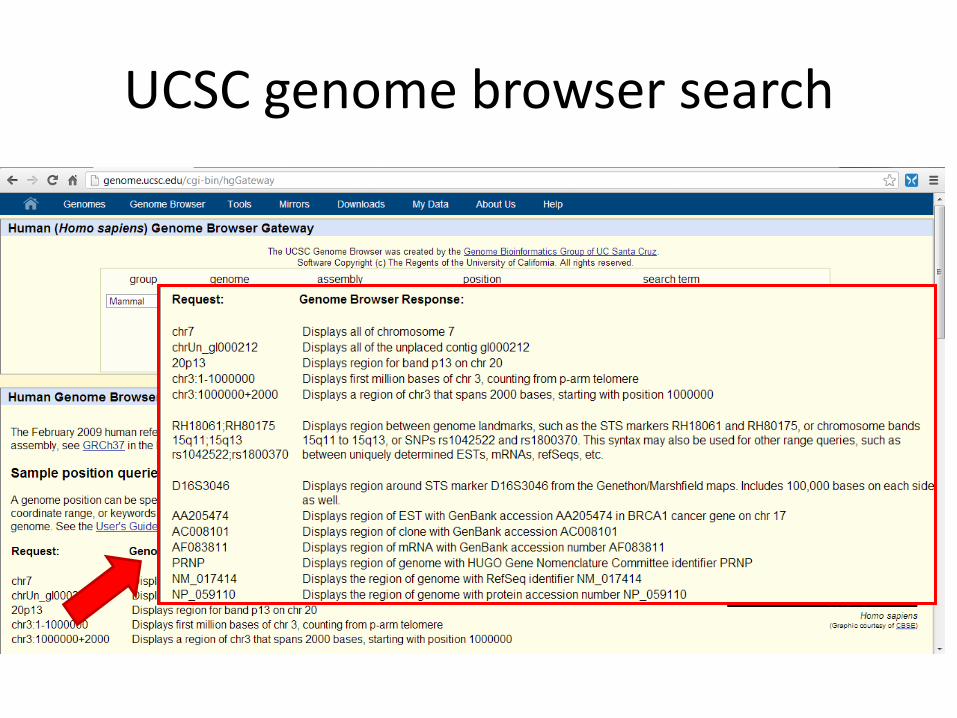
UCSC genome browser search
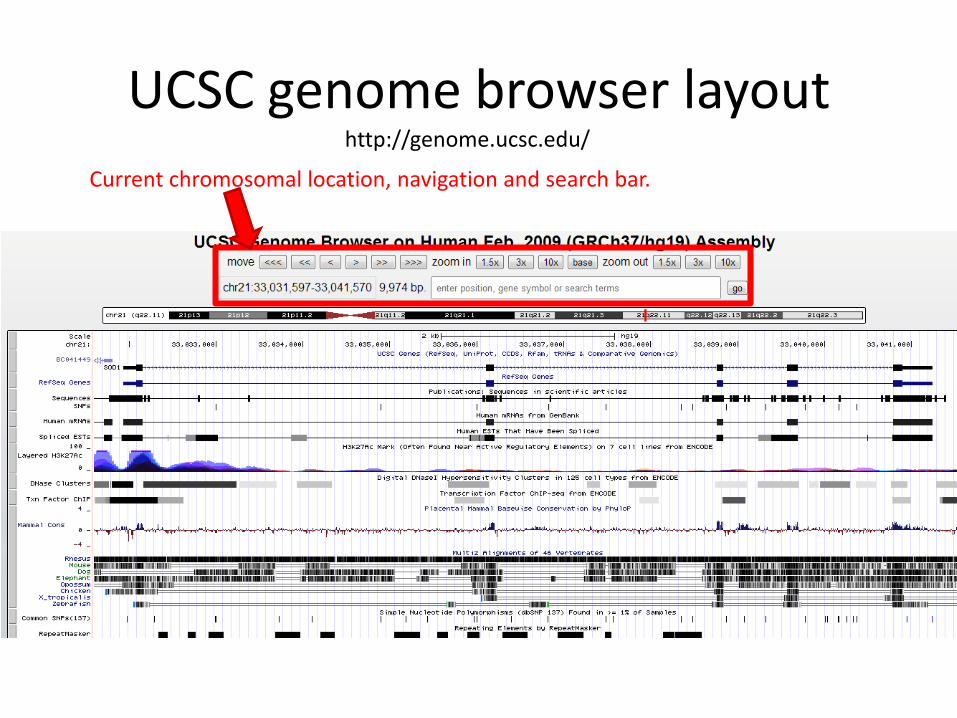
UCSC genome browser layout http://genome.ucsc.edu/
Current chromosomal location, navigation and search bar.
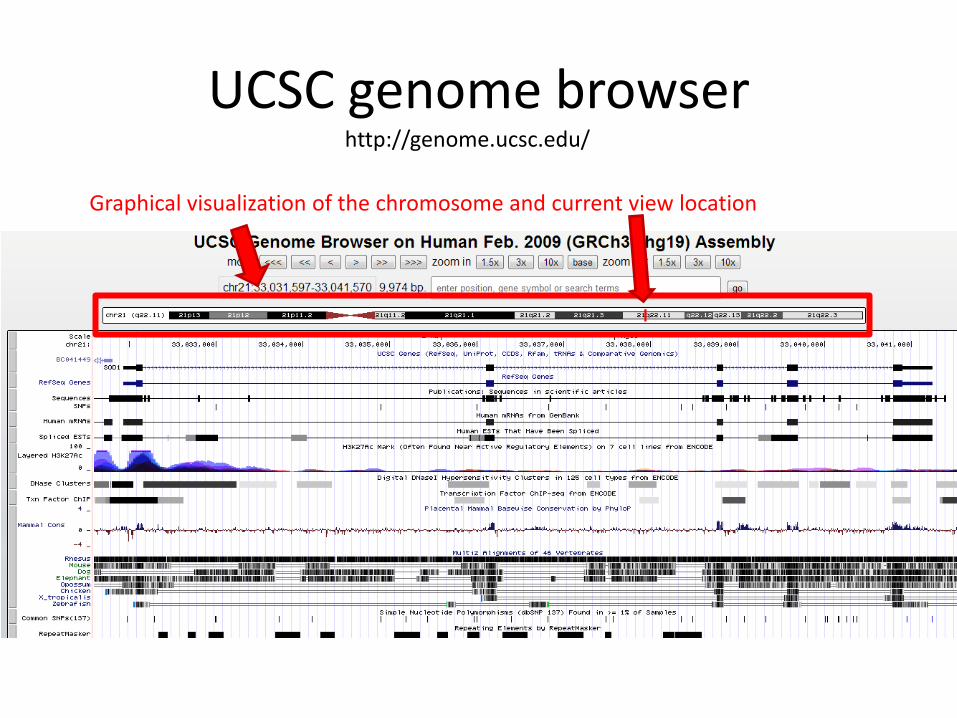
UCSC genome browser http://genome.ucsc.edu/
Graphical visualization of the chromosome and current view location
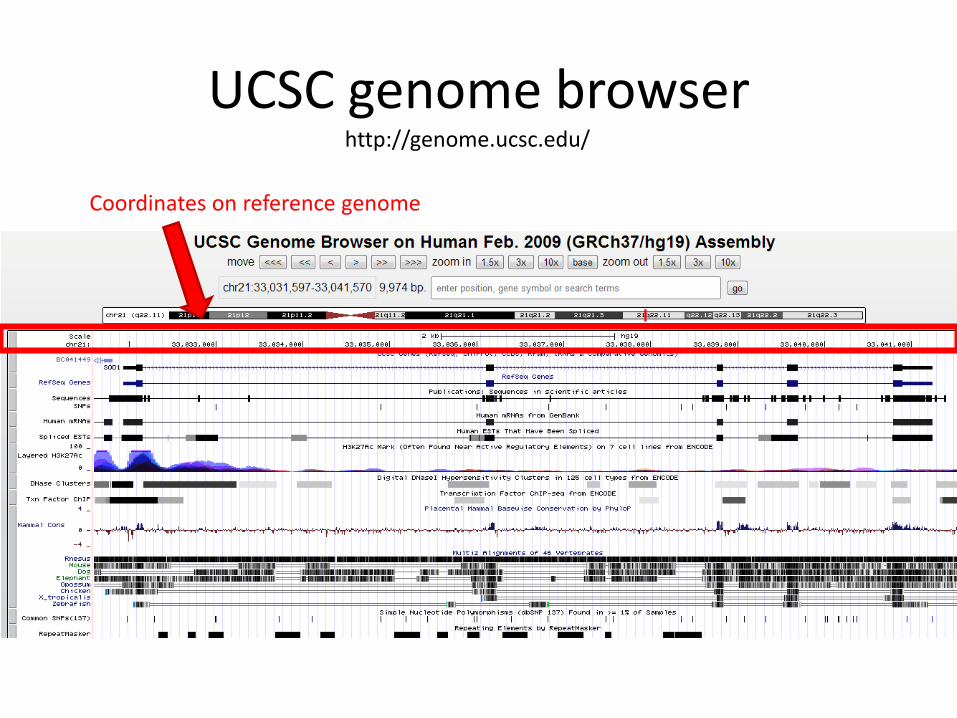
UCSC genome browser http://genome.ucsc.edu/
Coordinates on reference genome
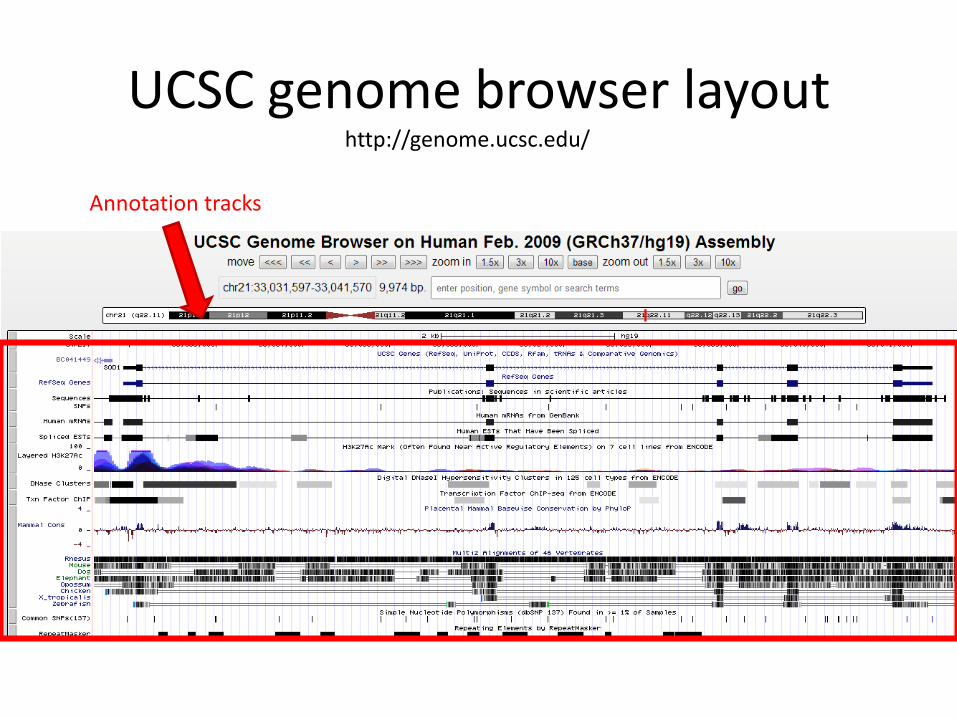
UCSC genome browser layout http://genome.ucsc.edu/
Annotation tracks
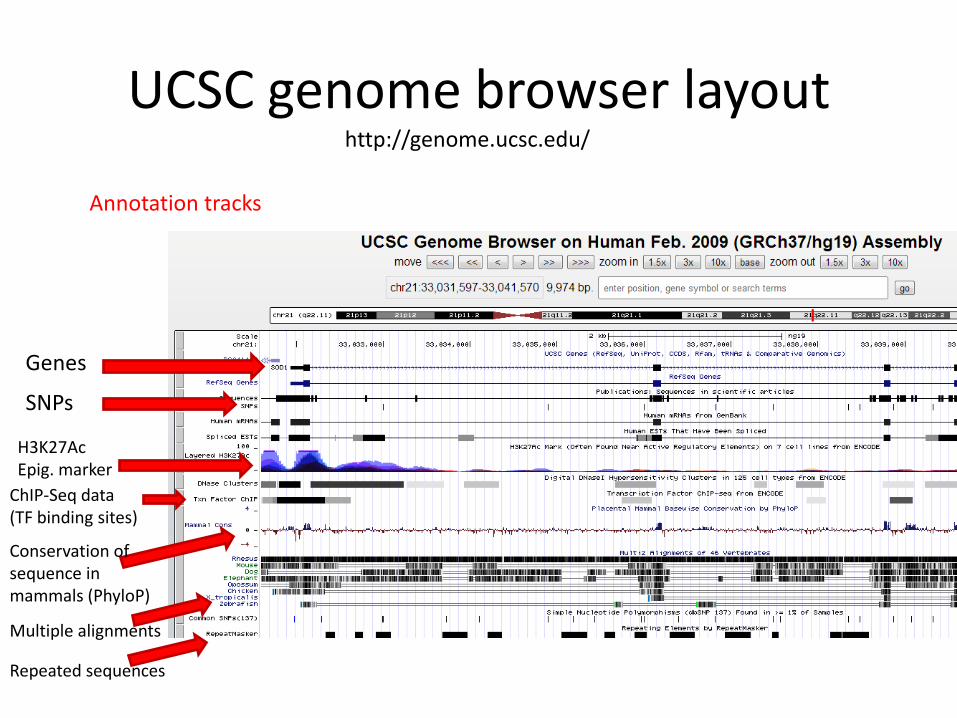
UCSC genome browser layout http://genome.ucsc.edu/
Annotation tracks
Genes
SNPs
H3K27Ac Epig. marker
ChIP-Seq data (TF binding sites)
Conservation of sequence in mammals (PhyloP)
Multiple alignments
Repeated sequences
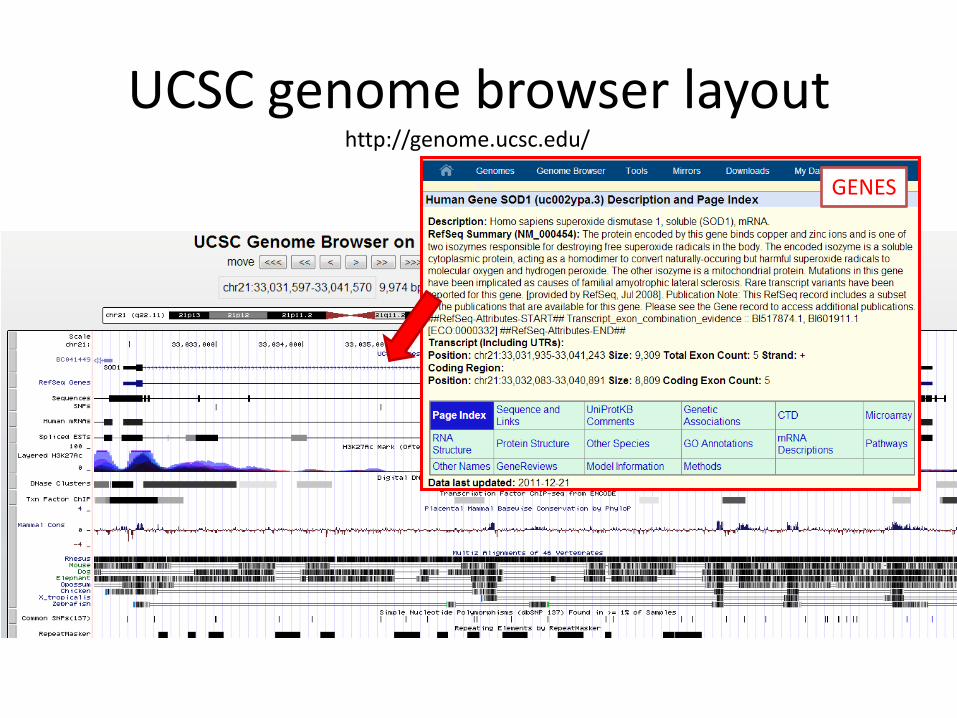
UCSC genome browser layout http://genome.ucsc.edu/
GENES
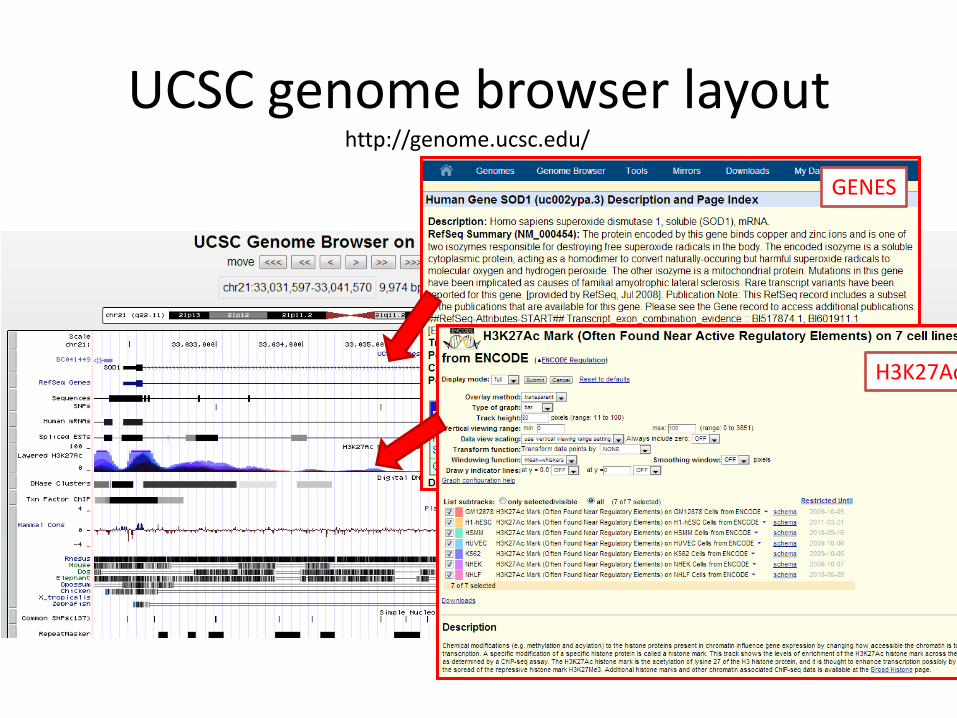
UCSC genome browser layout http://genome.ucsc.edu/
GENES
H3K27Ac
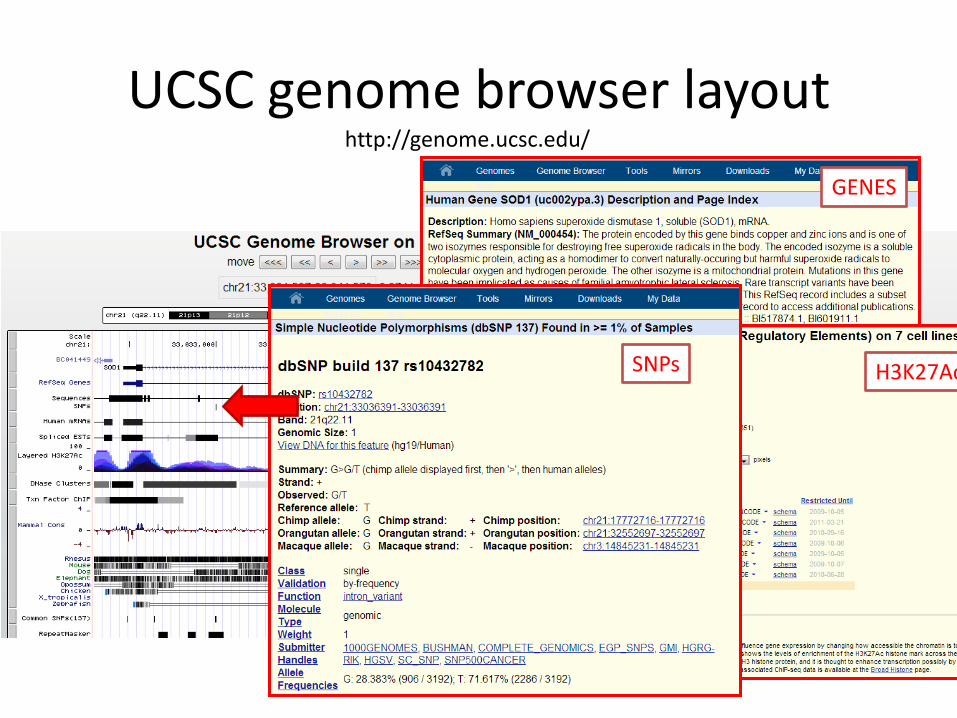
UCSC genome browser layout http://genome.ucsc.edu/
GENES
H3K27Ac SNPs
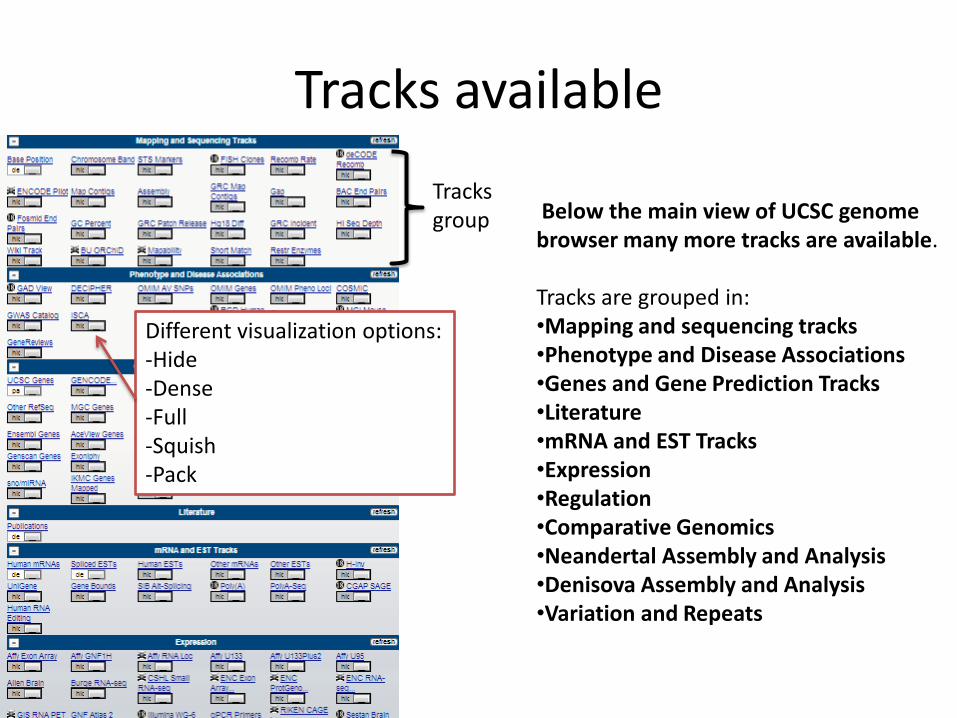
Tracks available
Below the main view of UCSC genome browser many more tracks are available. Tracks are grouped in: •Mapping and sequencing tracks •Phenotype and Disease Associations •Genes and Gene Prediction Tracks •Literature •mRNA and EST Tracks •Expression •Regulation •Comparative Genomics •Neandertal Assembly and Analysis •Denisova Assembly and Analysis •Variation and Repeats
Tracks group
Different visualization options: -Hide -Dense -Full -Squish -Pack
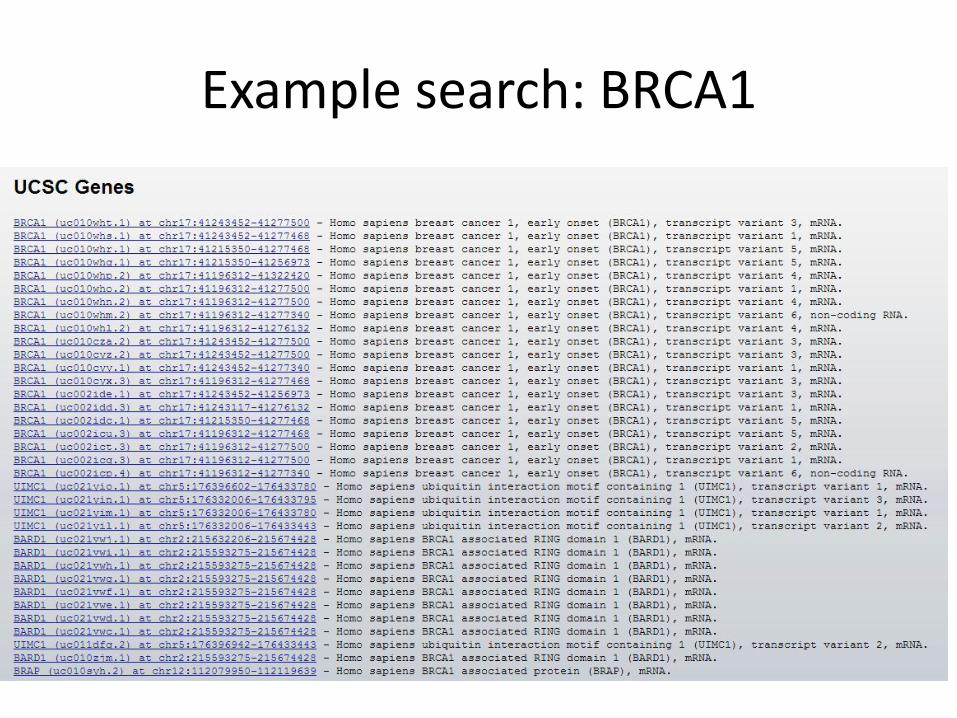
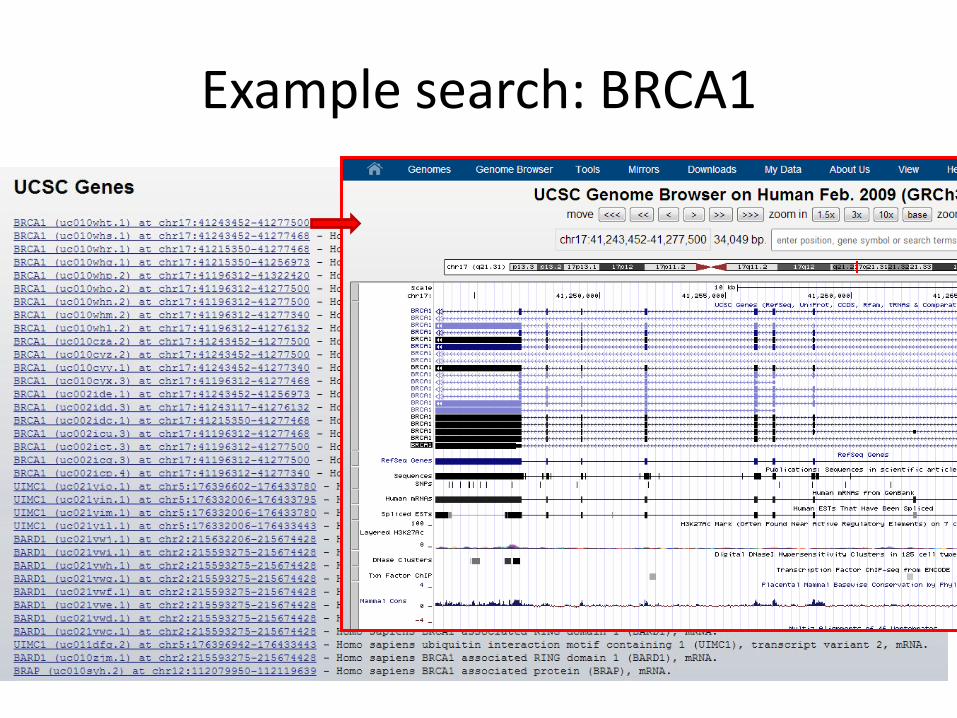
Example search: BRCA1
Example search: BRCA1
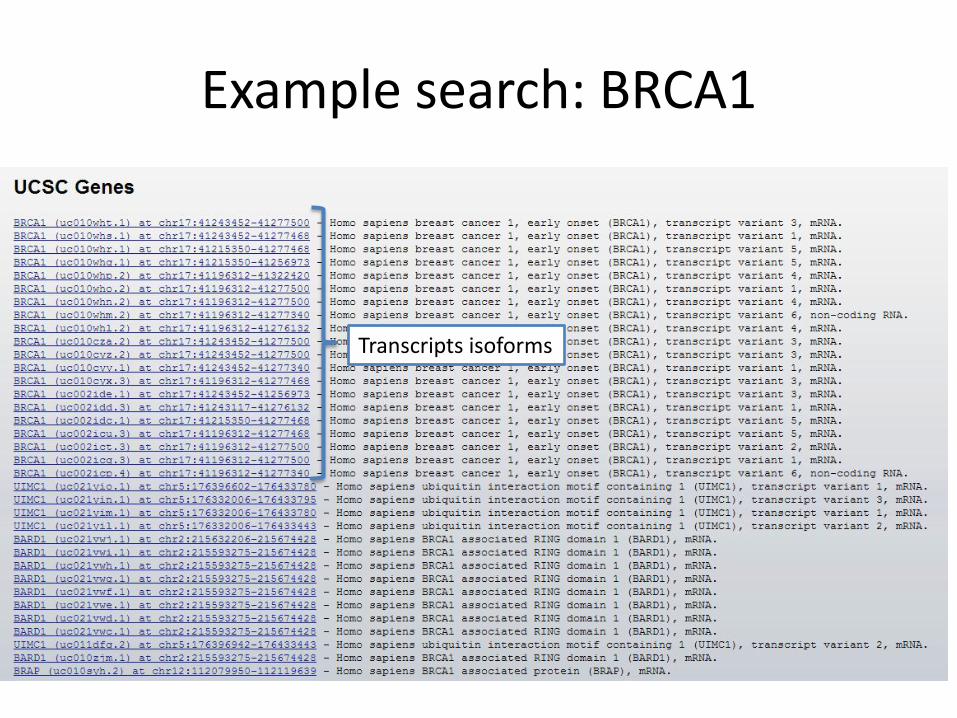
Transcripts isoforms
Example search: BRCA1
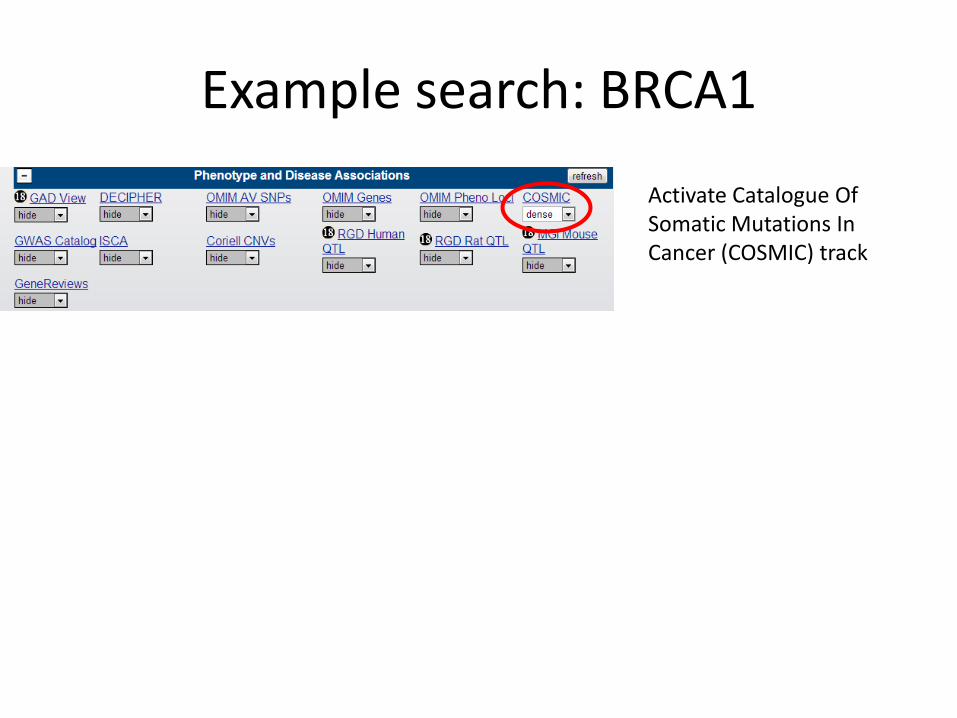
Example search: BRCA1
Activate Catalogue Of Somatic Mutations In Cancer (COSMIC) track
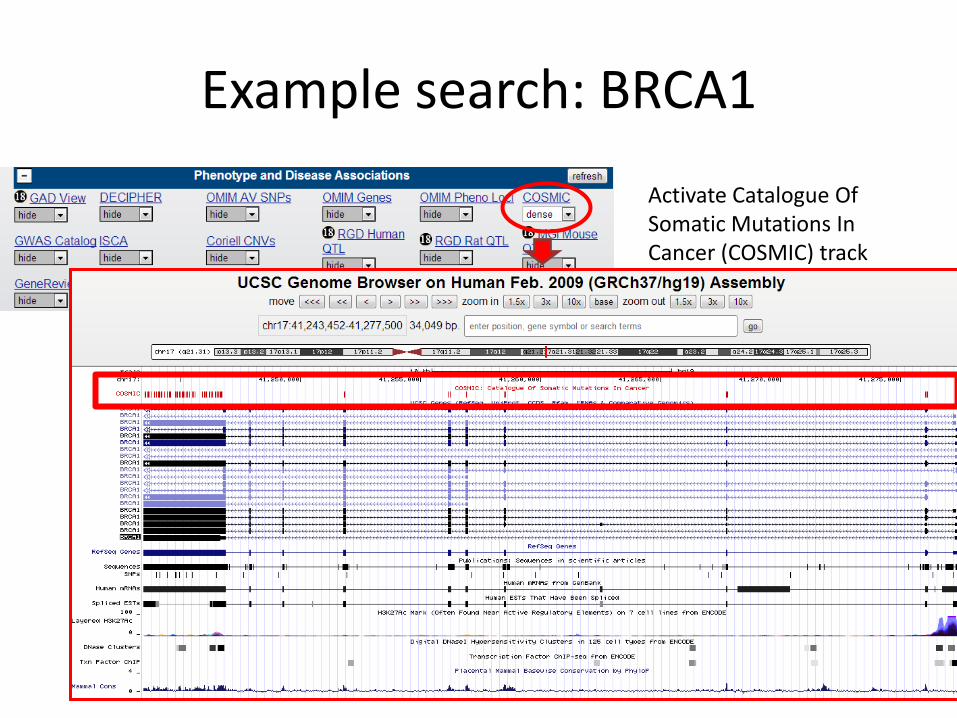
Example search: BRCA1
Activate Catalogue Of Somatic Mutations In Cancer (COSMIC) track
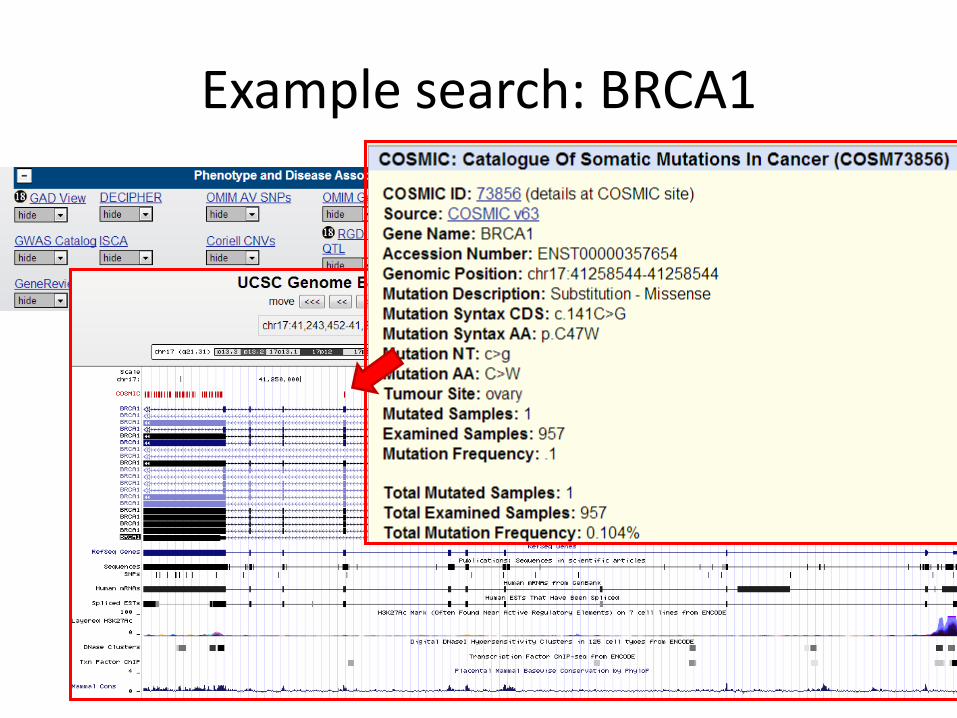
Example search: BRCA1
Activate Catalogue Of Somatic Mutations In Cancer (COSMIC) track
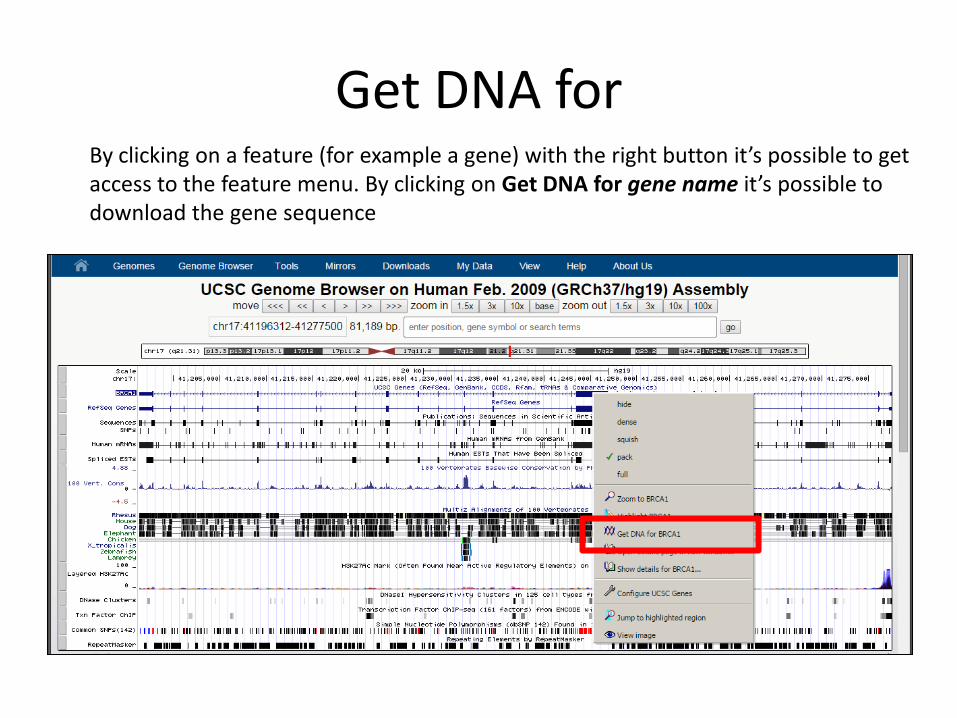
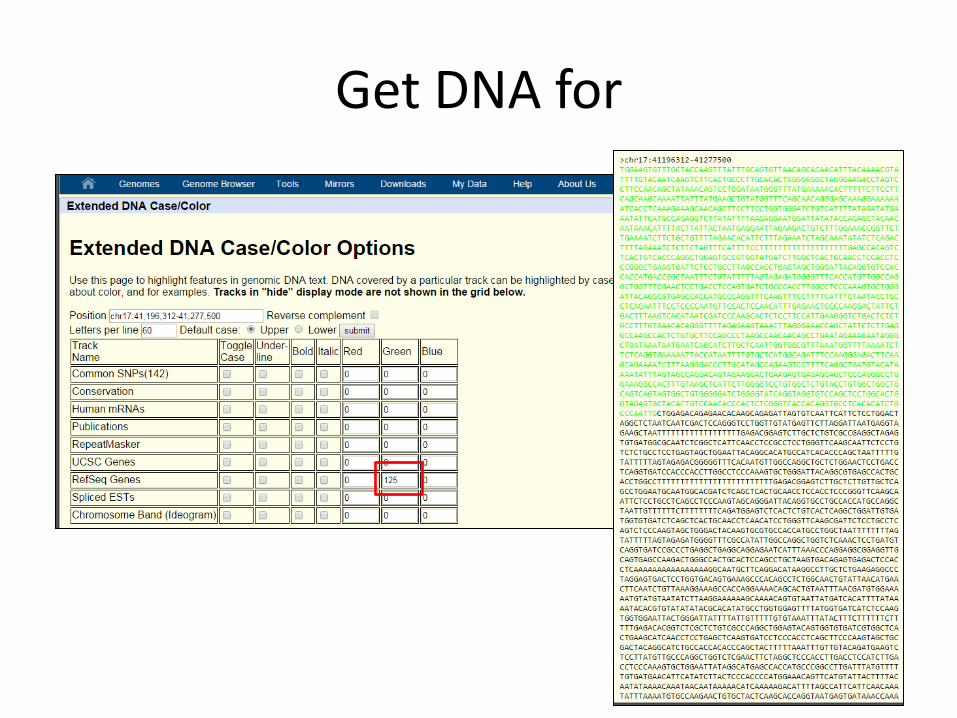
Get DNA for By clicking on a feature (for example a gene) with the right button it’s possible to get access to the feature menu. By clicking on Get DNA for gene name it’s possible to download the gene sequence
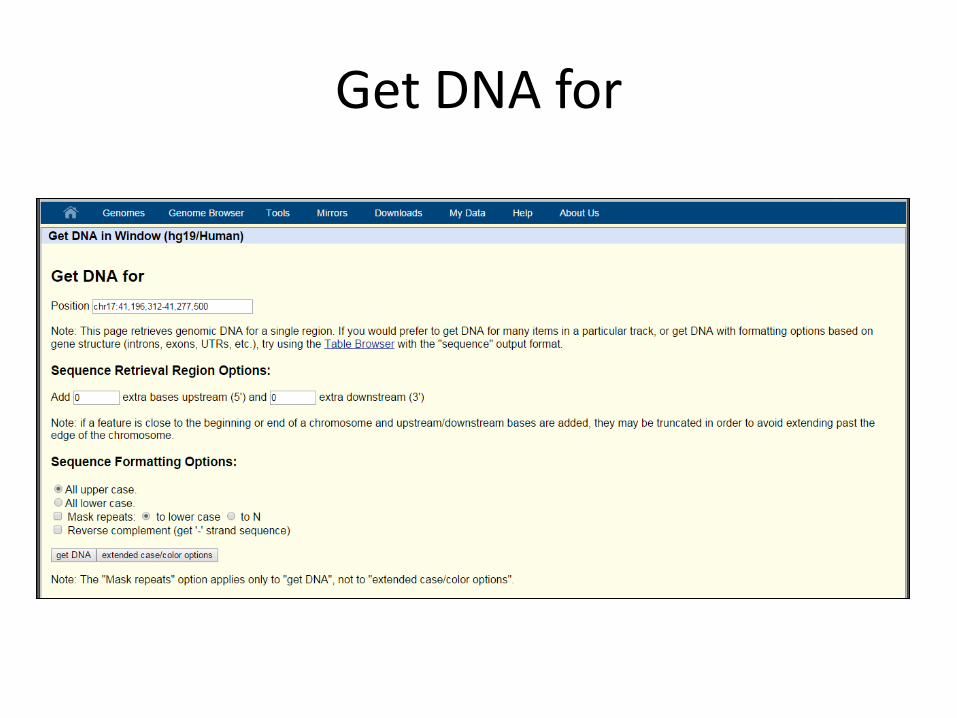
Get DNA for
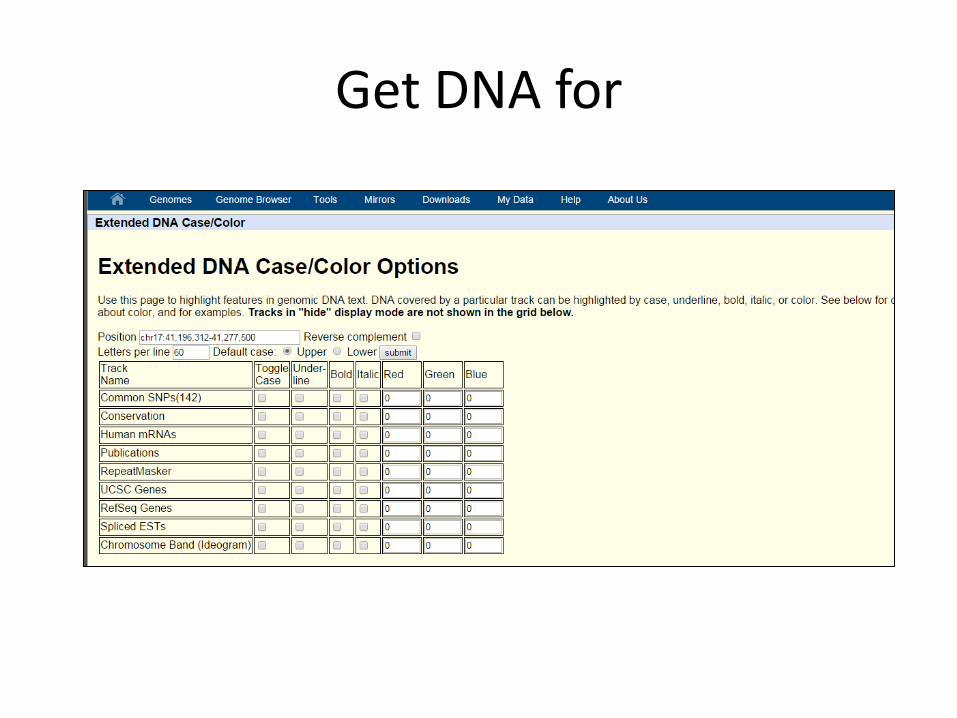
Get DNA for
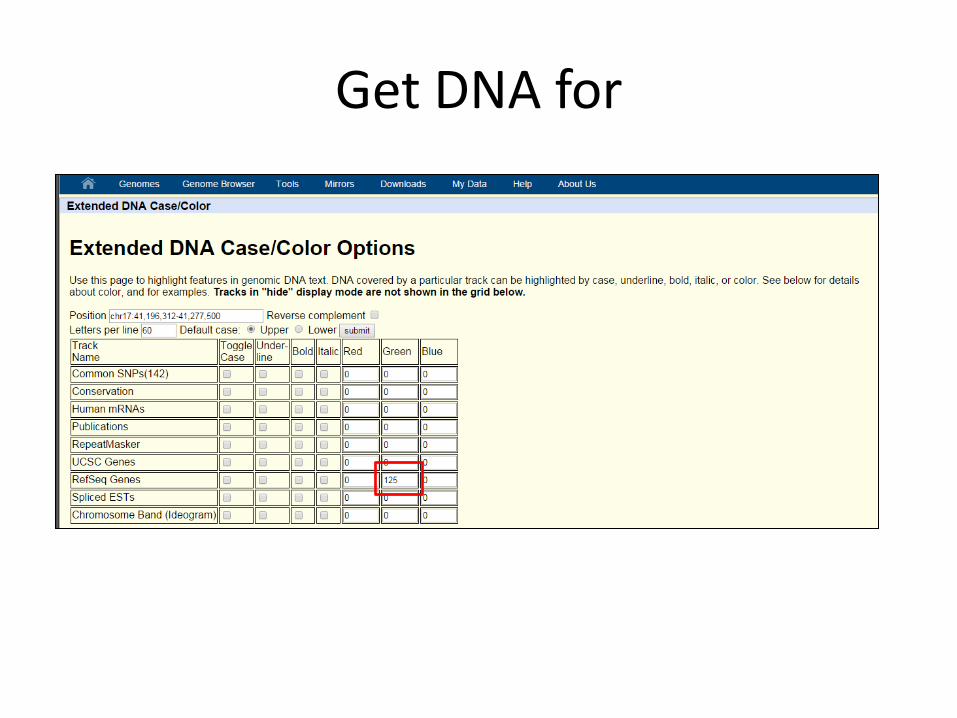
Get DNA for
Get DNA for
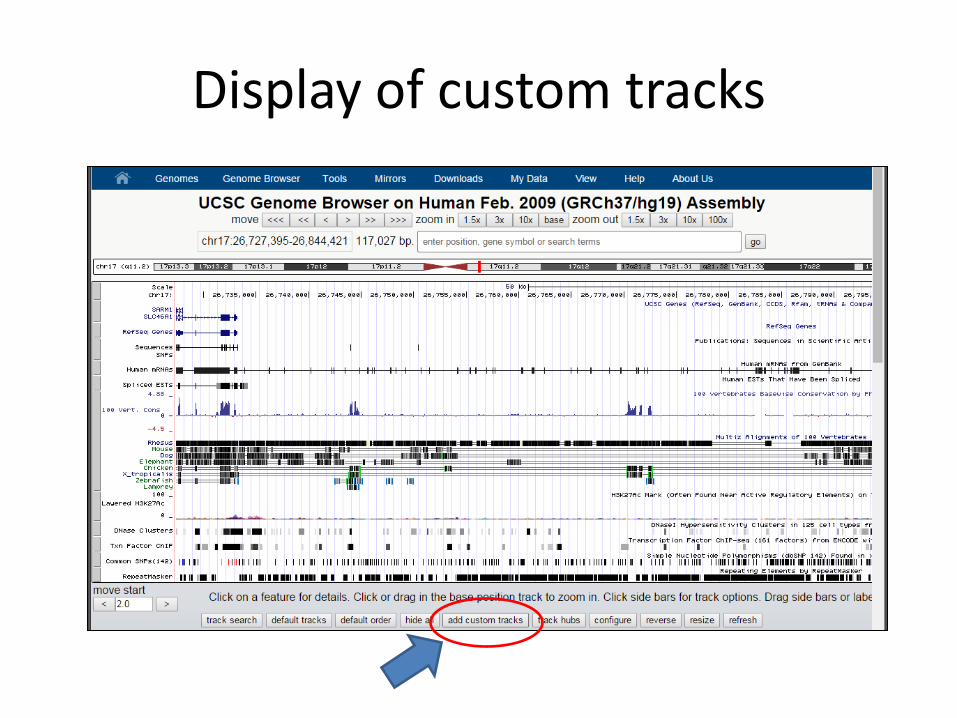
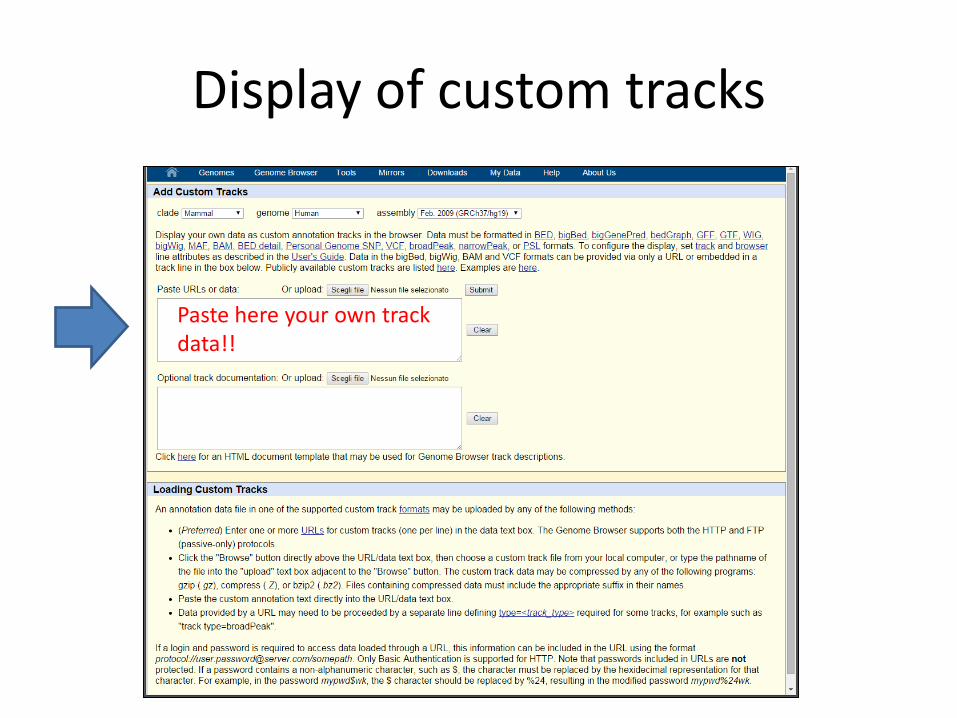
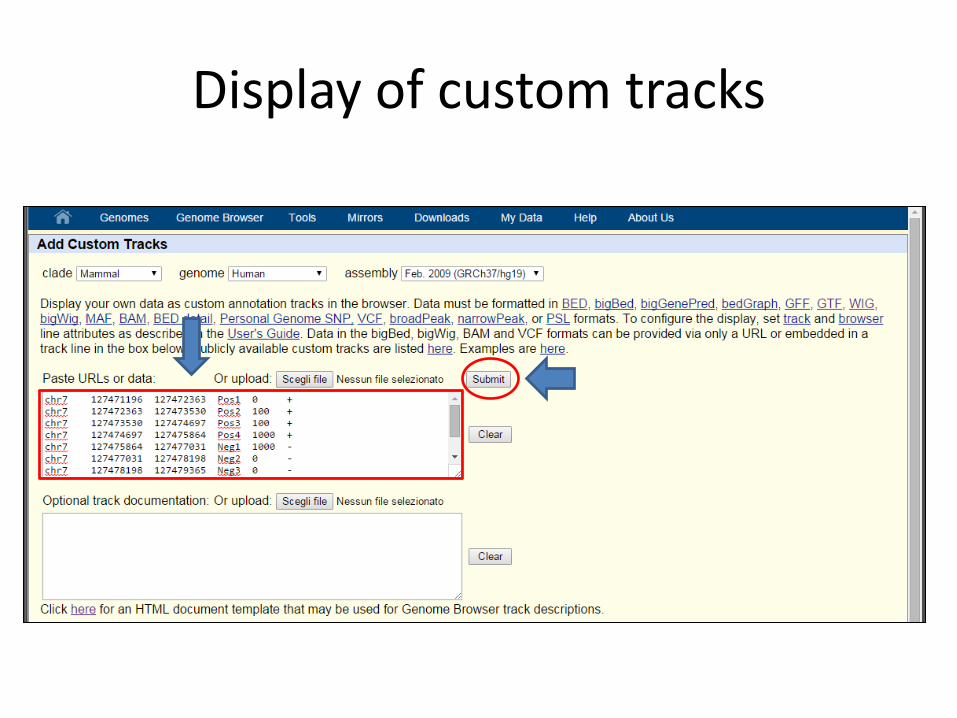
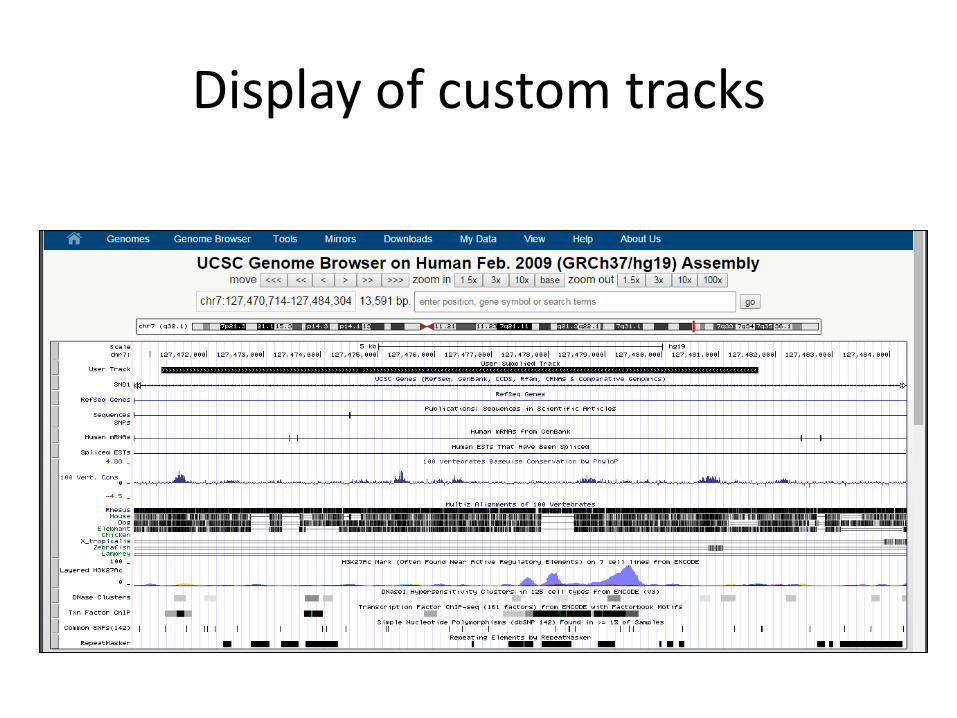
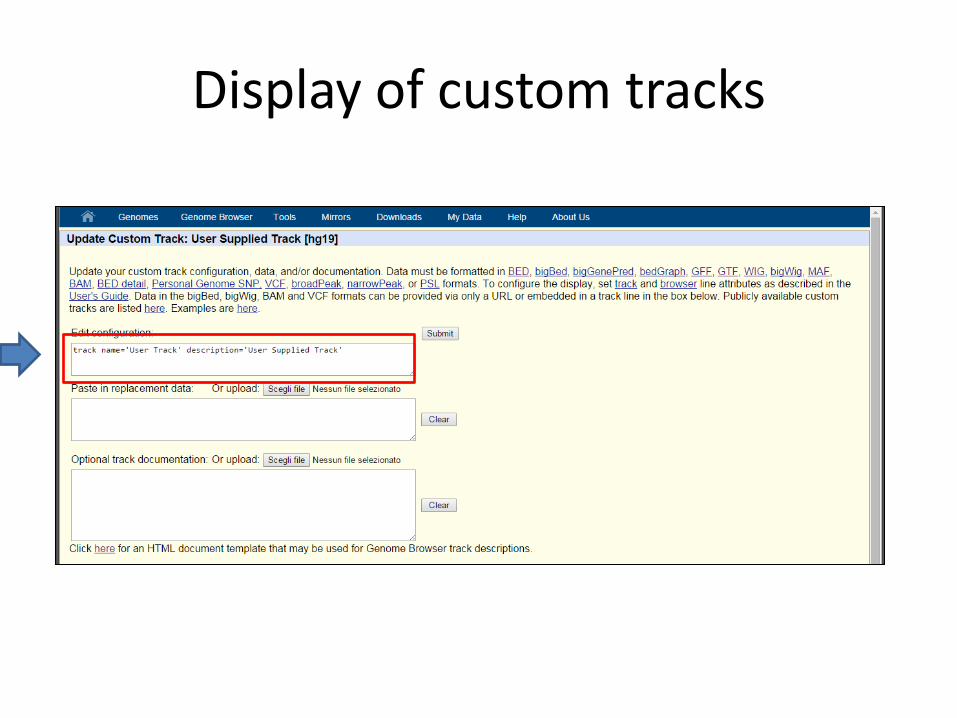
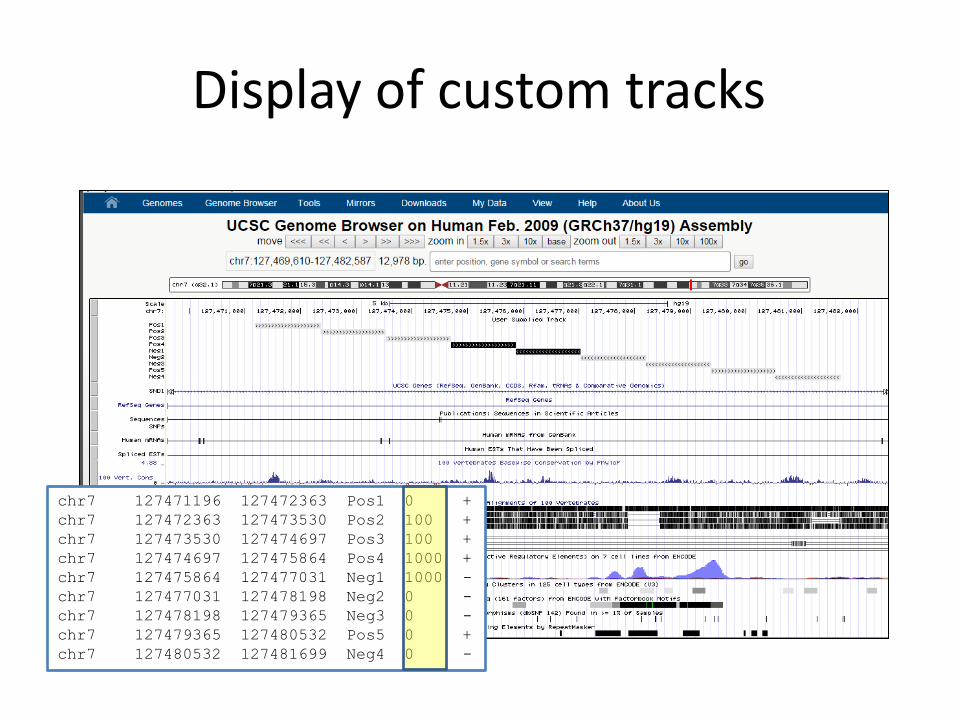
Display of custom tracks
Display of custom tracks
Paste here your own track data!!
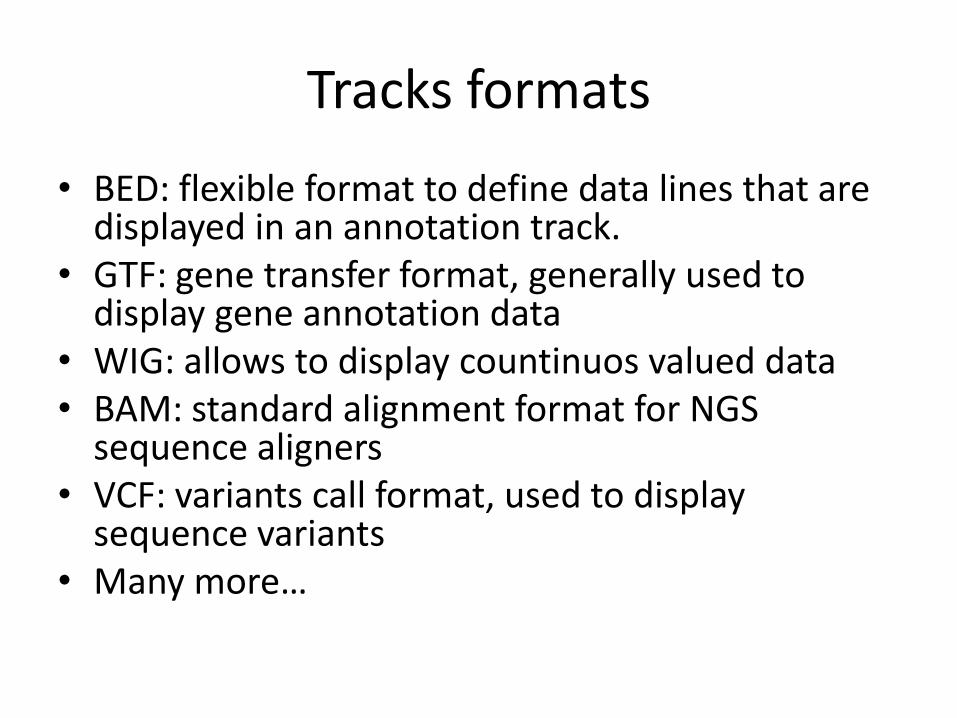
Tracks formats
• BED: flexible format to define data lines that are displayed in an annotation track.
• GTF: gene transfer format, generally used to display gene annotation data
• WIG: allows to display countinuos valued data • BAM: standard alignment format for NGS
sequence aligners • VCF: variants call format, used to display
sequence variants • Many more…
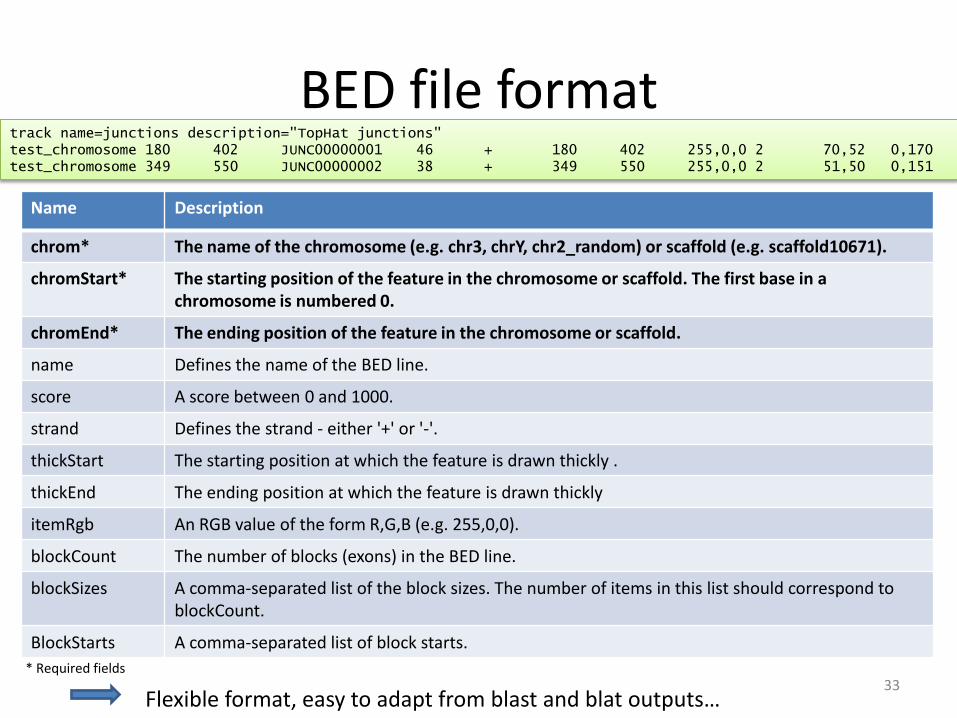
BED file format
Name Description
chrom* The name of the chromosome (e.g. chr3, chrY, chr2_random) or scaffold (e.g. scaffold10671).
chromStart* The starting position of the feature in the chromosome or scaffold. The first base in a chromosome is numbered 0.
chromEnd* The ending position of the feature in the chromosome or scaffold.
name Defines the name of the BED line.
score A score between 0 and 1000.
strand Defines the strand - either '+' or '-'.
thickStart The starting position at which the feature is drawn thickly .
thickEnd The ending position at which the feature is drawn thickly
itemRgb An RGB value of the form R,G,B (e.g. 255,0,0).
blockCount The number of blocks (exons) in the BED line.
blockSizes A comma-separated list of the block sizes. The number of items in this list should correspond to blockCount.
BlockStarts A comma-separated list of block starts.
track name=junctions description="TopHat junctions" test_chromosome 180 402 JUNC00000001 46 + 180 402 255,0,0 2 70,52 0,170 test_chromosome 349 550 JUNC00000002 38 + 349 550 255,0,0 2 51,50 0,151
33 * Required fields
Flexible format, easy to adapt from blast and blat outputs…
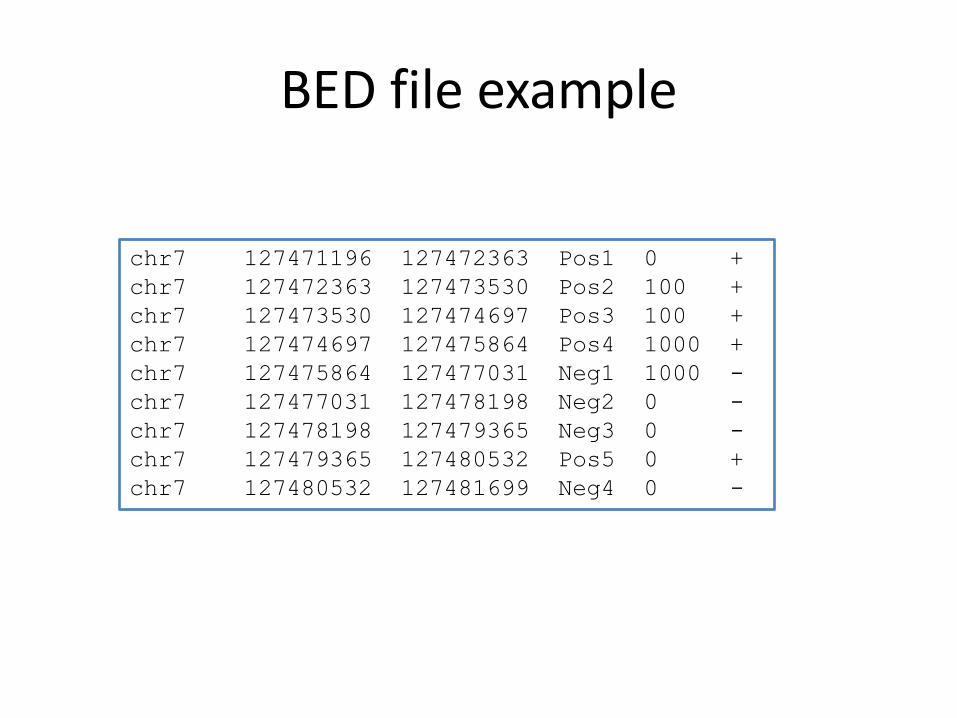
BED file example
chr7 127471196 127472363 Pos1 0 +
chr7 127472363 127473530 Pos2 100 +
chr7 127473530 127474697 Pos3 100 +
chr7 127474697 127475864 Pos4 1000 +
chr7 127475864 127477031 Neg1 1000 -
chr7 127477031 127478198 Neg2 0 -
chr7 127478198 127479365 Neg3 0 -
chr7 127479365 127480532 Pos5 0 +
chr7 127480532 127481699 Neg4 0 -
Display of custom tracks
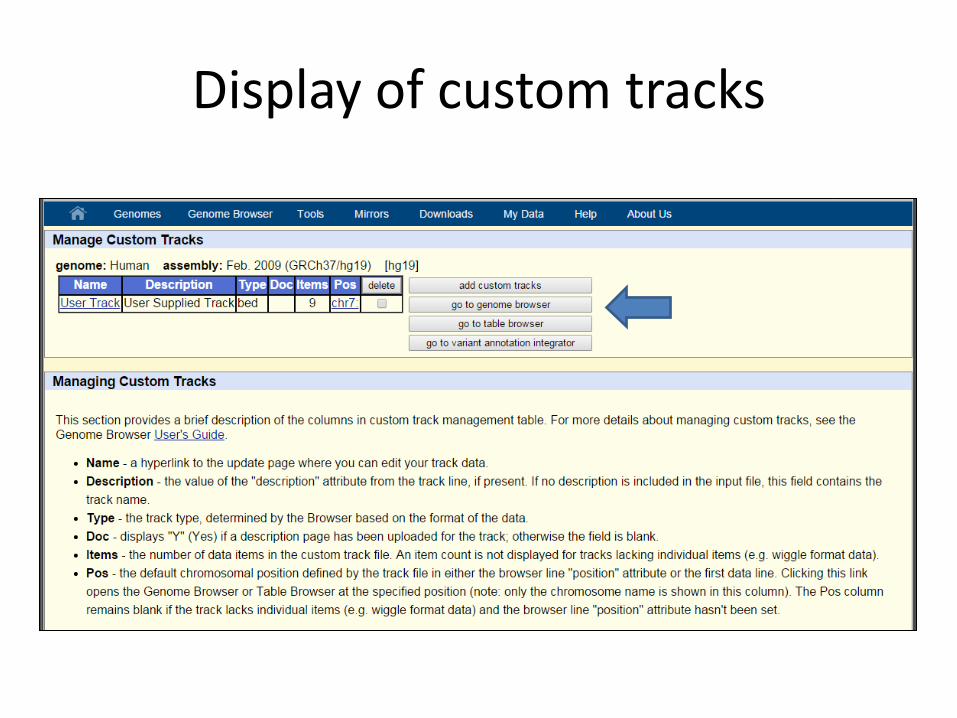
Display of custom tracks
Display of custom tracks
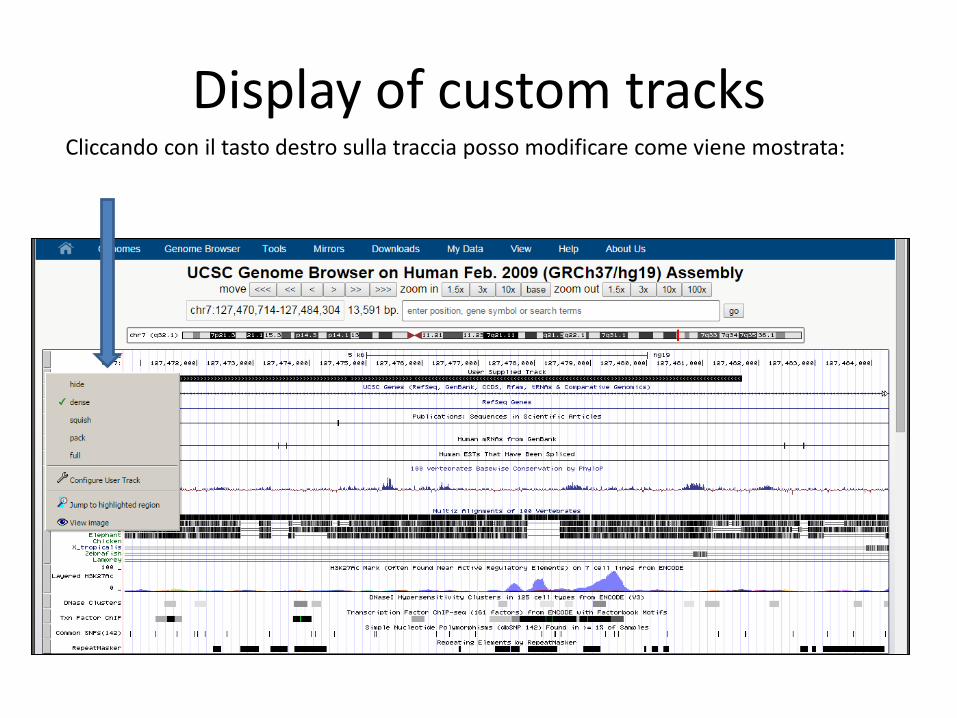
Display of custom tracks Cliccando con il tasto destro sulla traccia posso modificare come viene mostrata:
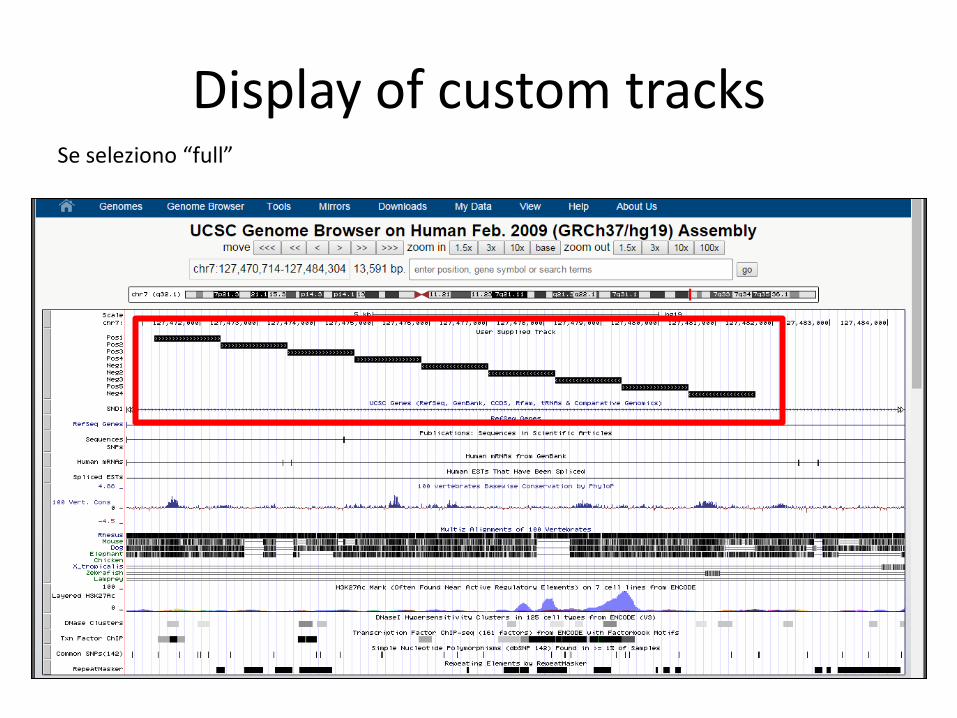
Display of custom tracks Se seleziono “full”
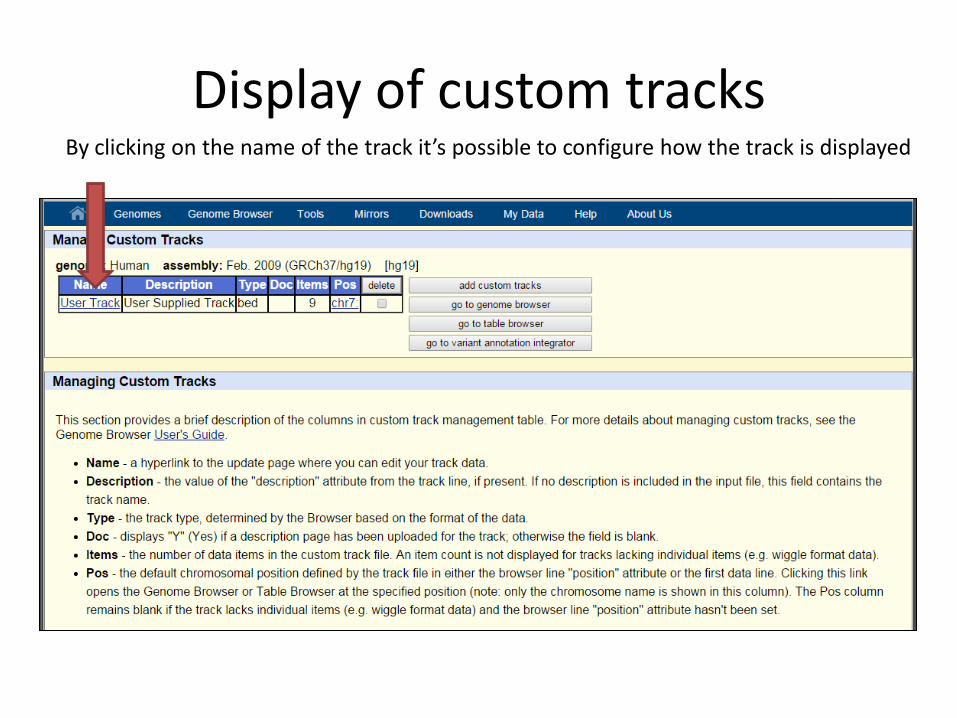
Display of custom tracks By clicking on the name of the track it’s possible to configure how the track is displayed
Display of custom tracks
Display of custom tracks
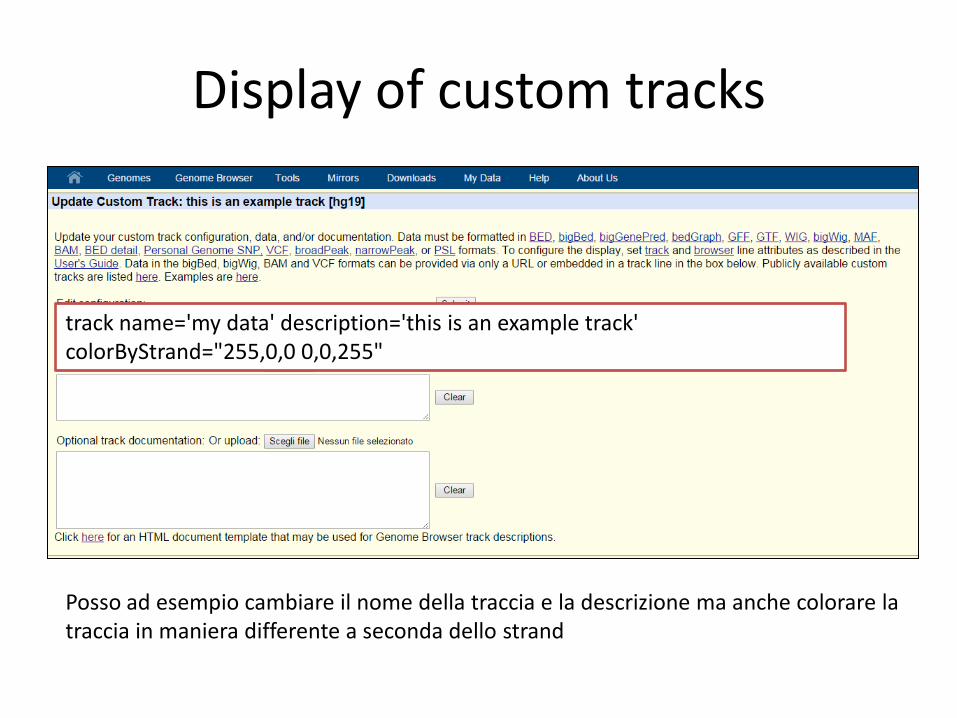
Posso ad esempio cambiare il nome della traccia e la descrizione ma anche colorare la traccia in maniera differente a seconda dello strand
track name='my data' description='this is an example track' colorByStrand="255,0,0 0,0,255"
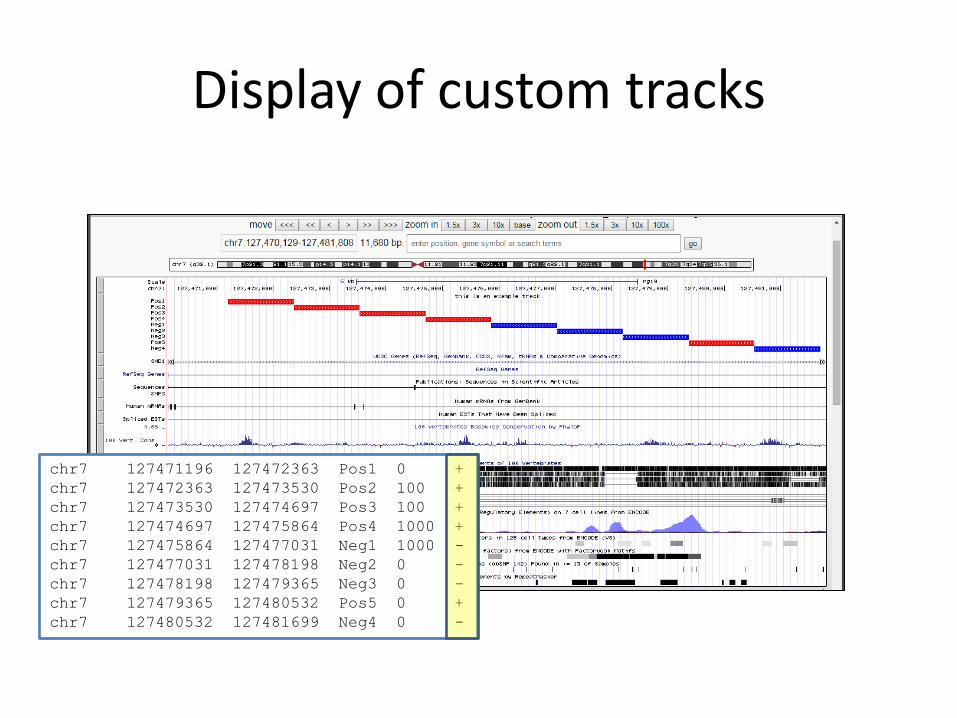
Display of custom tracks
chr7 127471196 127472363 Pos1 0 +
chr7 127472363 127473530 Pos2 100 +
chr7 127473530 127474697 Pos3 100 +
chr7 127474697 127475864 Pos4 1000 +
chr7 127475864 127477031 Neg1 1000 -
chr7 127477031 127478198 Neg2 0 -
chr7 127478198 127479365 Neg3 0 -
chr7 127479365 127480532 Pos5 0 +
chr7 127480532 127481699 Neg4 0 -
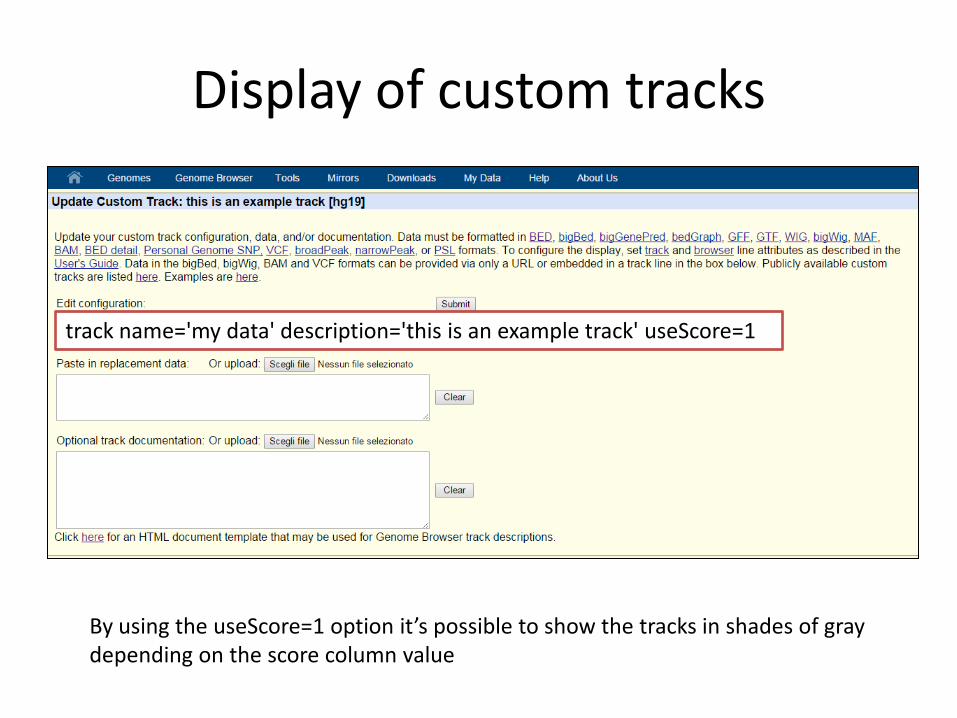
Display of custom tracks
track name='my data' description='this is an example track' useScore=1
By using the useScore=1 option it’s possible to show the tracks in shades of gray depending on the score column value
Display of custom tracks
chr7 127471196 127472363 Pos1 0 +
chr7 127472363 127473530 Pos2 100 +
chr7 127473530 127474697 Pos3 100 +
chr7 127474697 127475864 Pos4 1000 +
chr7 127475864 127477031 Neg1 1000 -
chr7 127477031 127478198 Neg2 0 -
chr7 127478198 127479365 Neg3 0 -
chr7 127479365 127480532 Pos5 0 +
chr7 127480532 127481699 Neg4 0 -
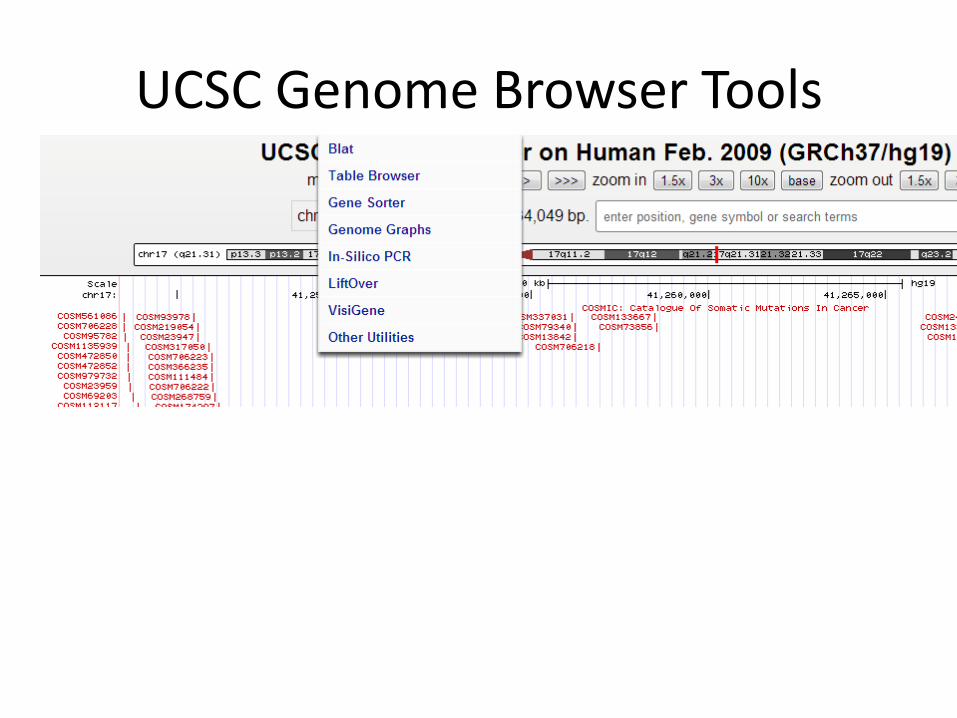
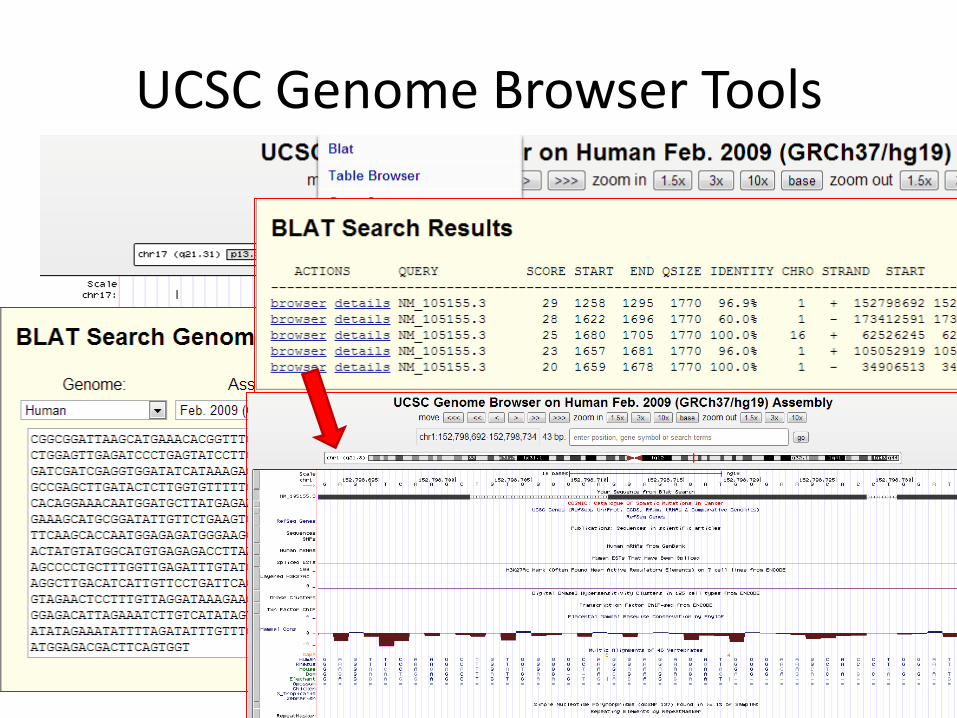
UCSC Genome Browser Tools
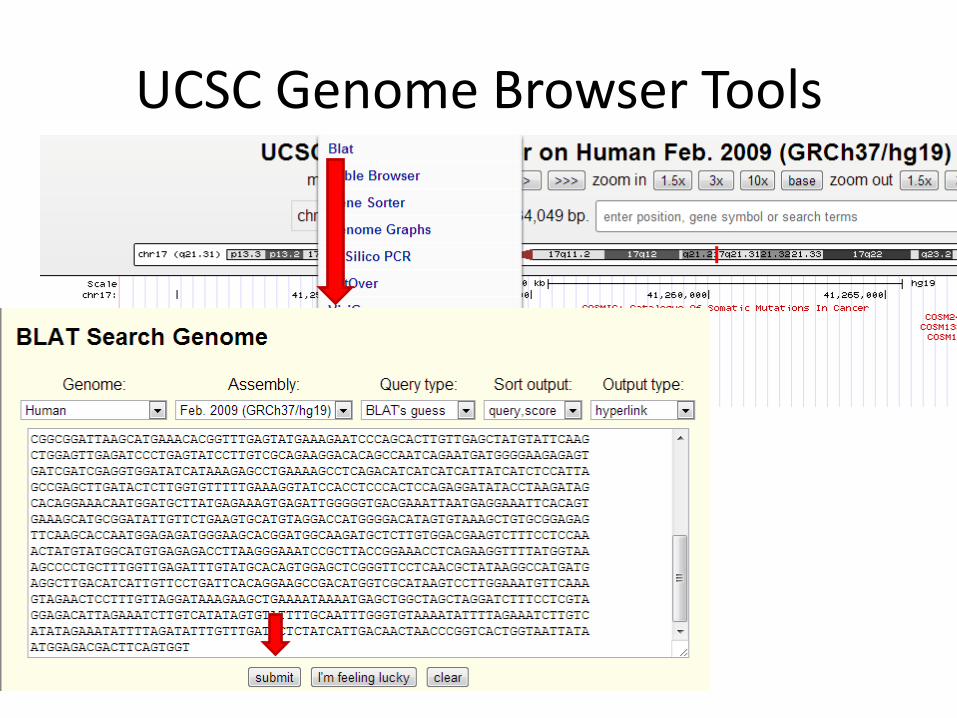
UCSC Genome Browser Tools
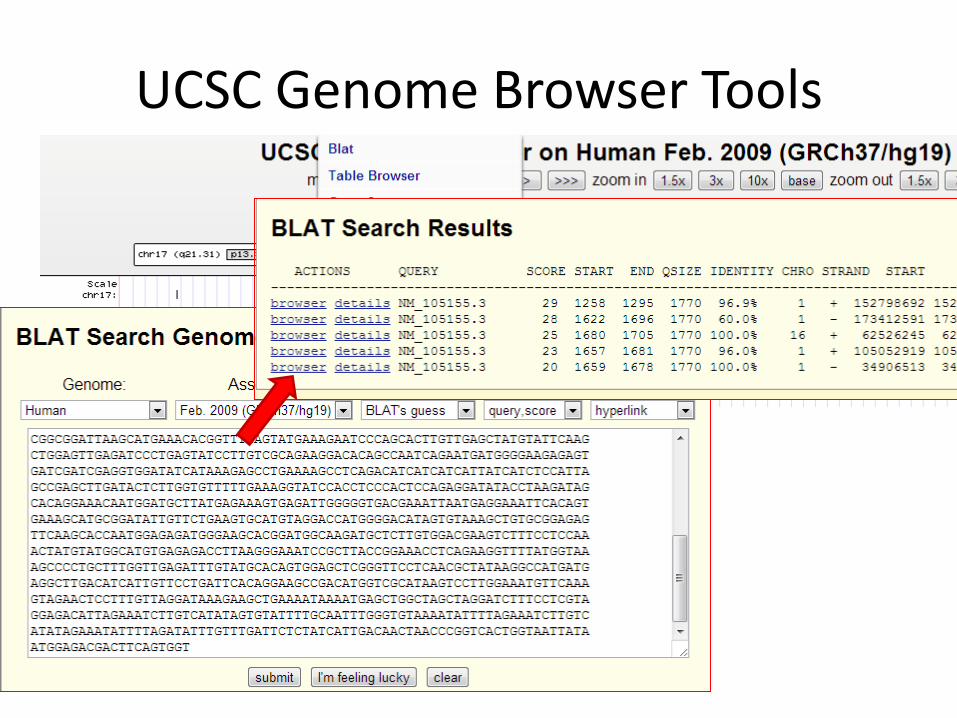
UCSC Genome Browser Tools
UCSC Genome Browser Tools
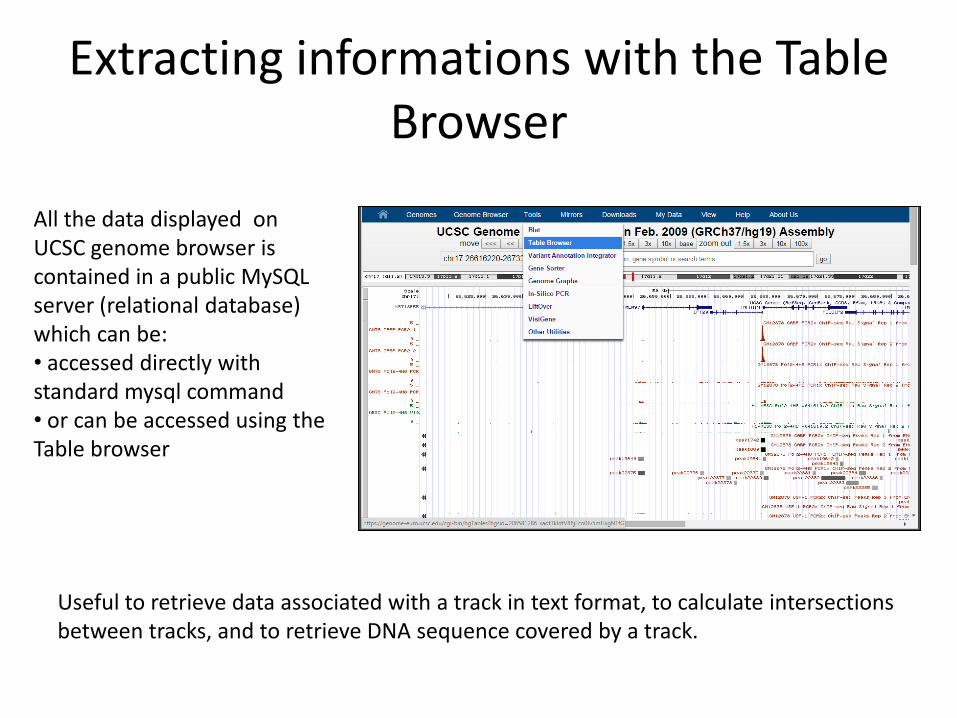
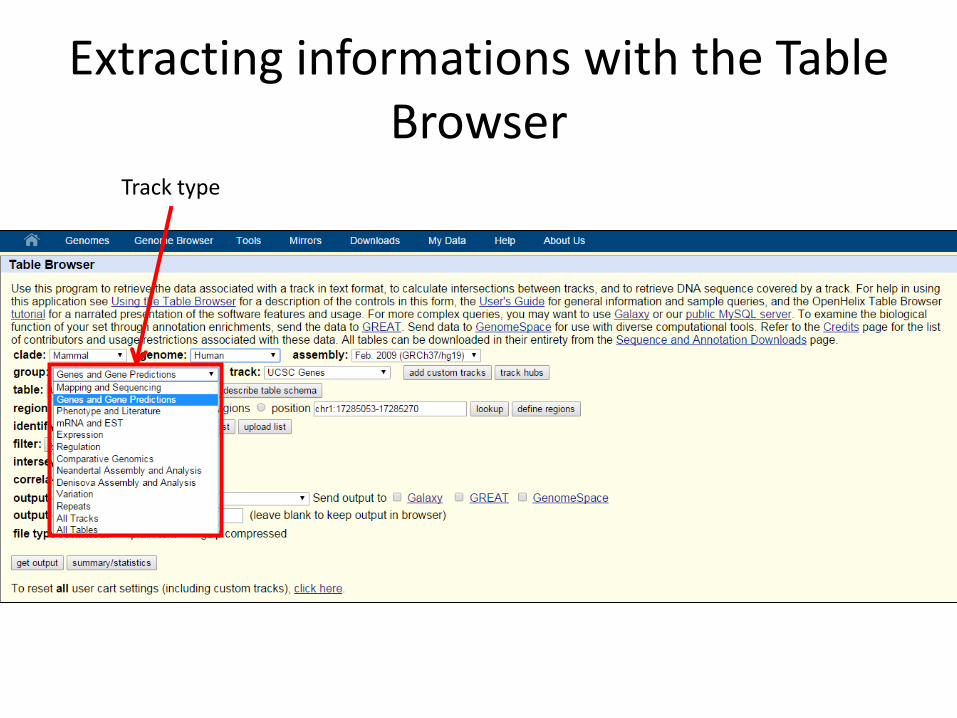
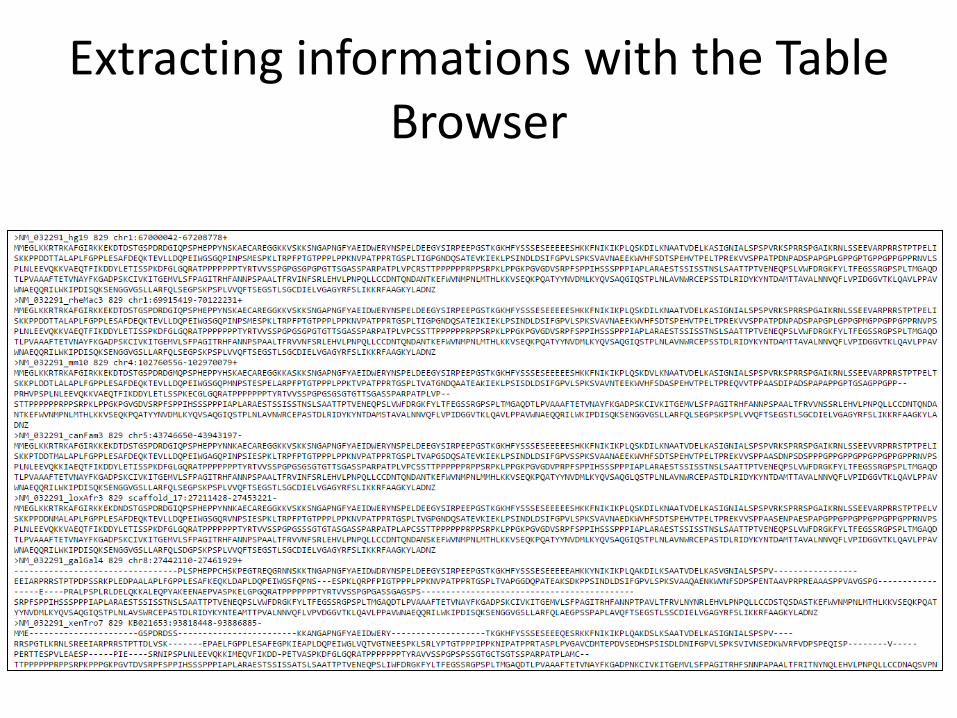
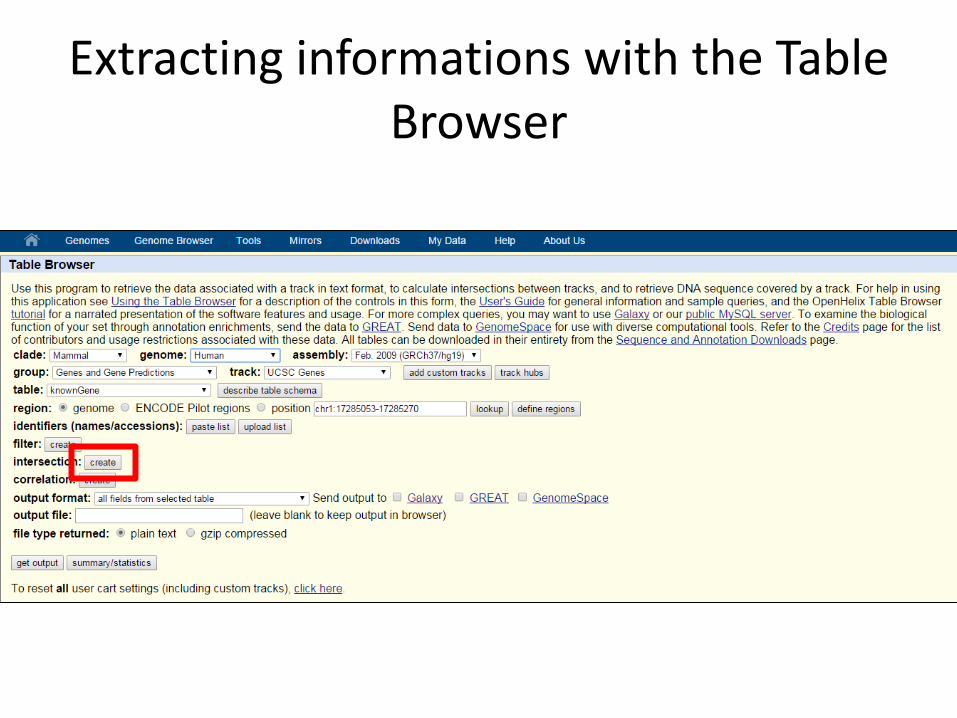
Extracting informations with the Table Browser
All the data displayed on UCSC genome browser is contained in a public MySQL server (relational database) which can be: • accessed directly with standard mysql command • or can be accessed using the Table browser
Useful to retrieve data associated with a track in text format, to calculate intersections between tracks, and to retrieve DNA sequence covered by a track.
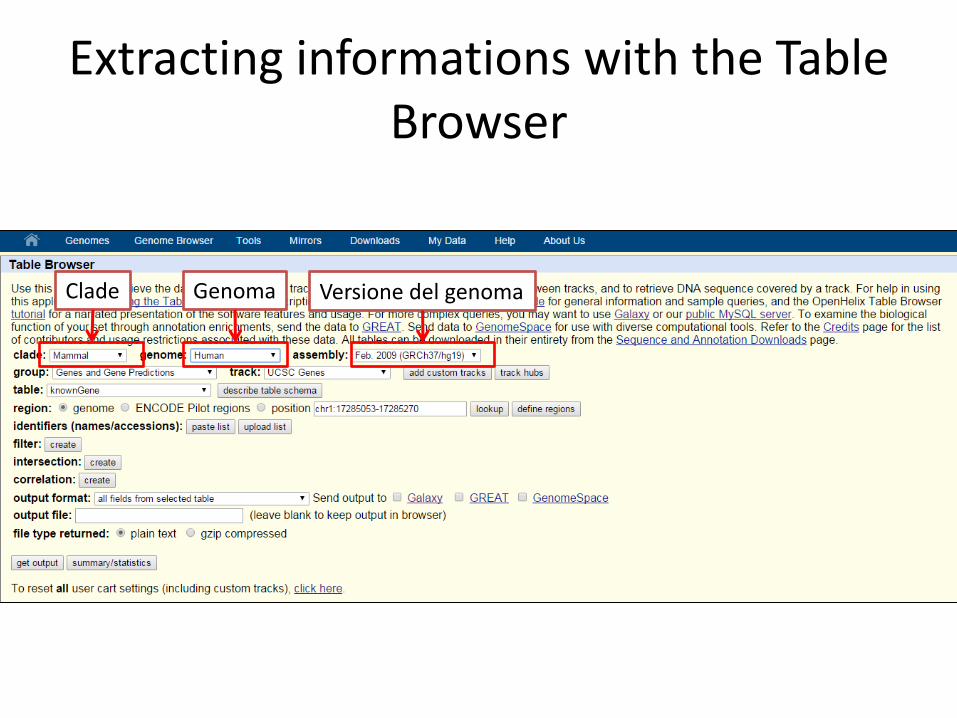
Extracting informations with the Table Browser
Clade Genoma Versione del genoma
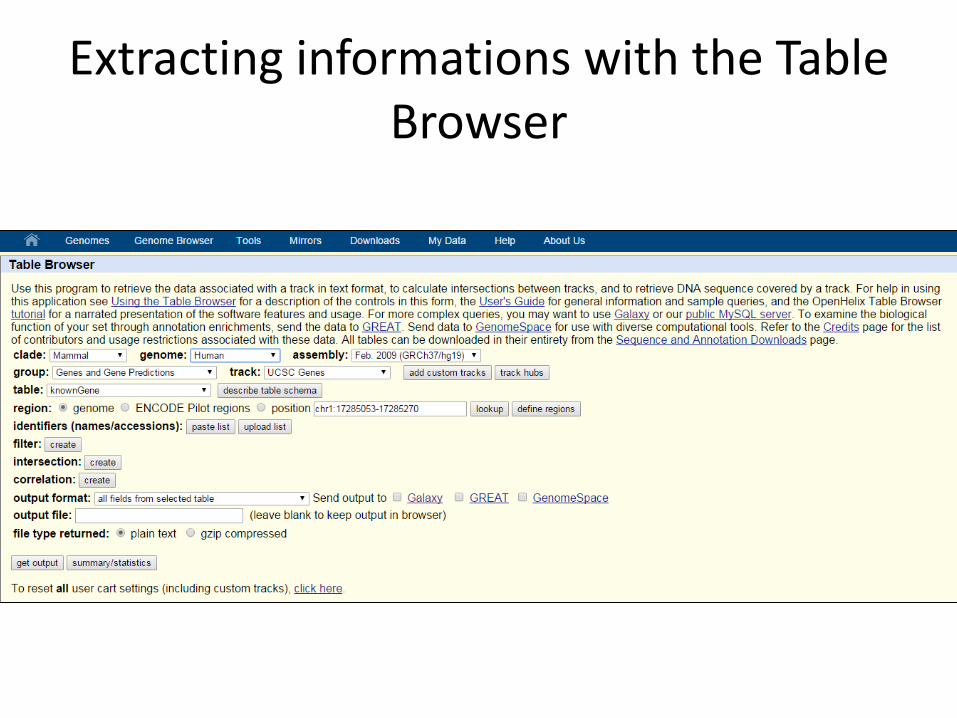
Extracting informations with the Table Browser
Extracting informations with the Table Browser
Track type
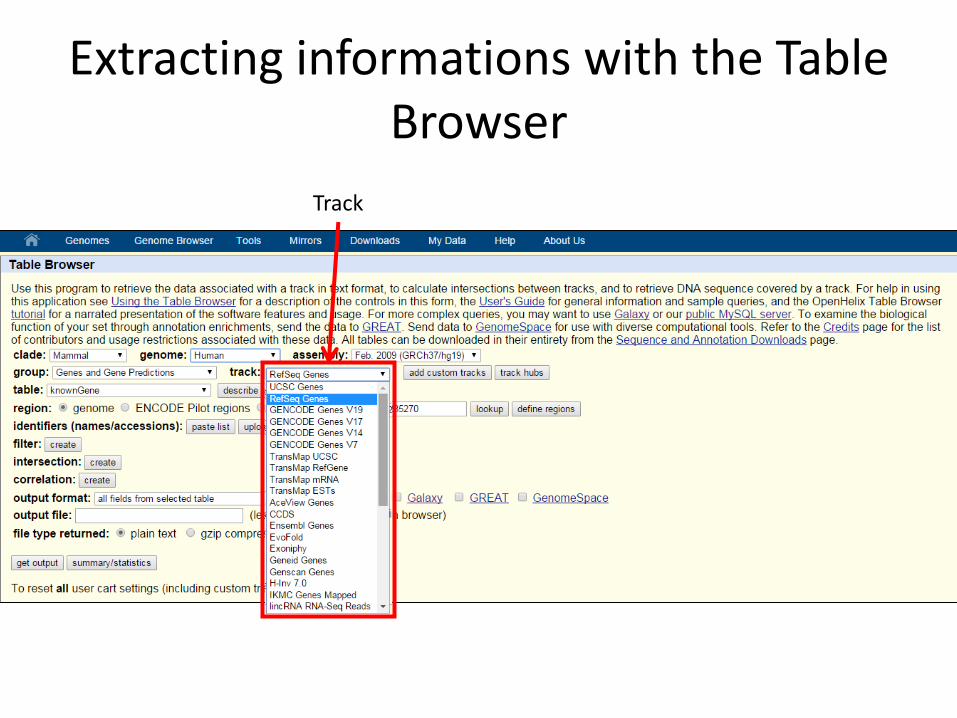
Extracting informations with the Table Browser
Track
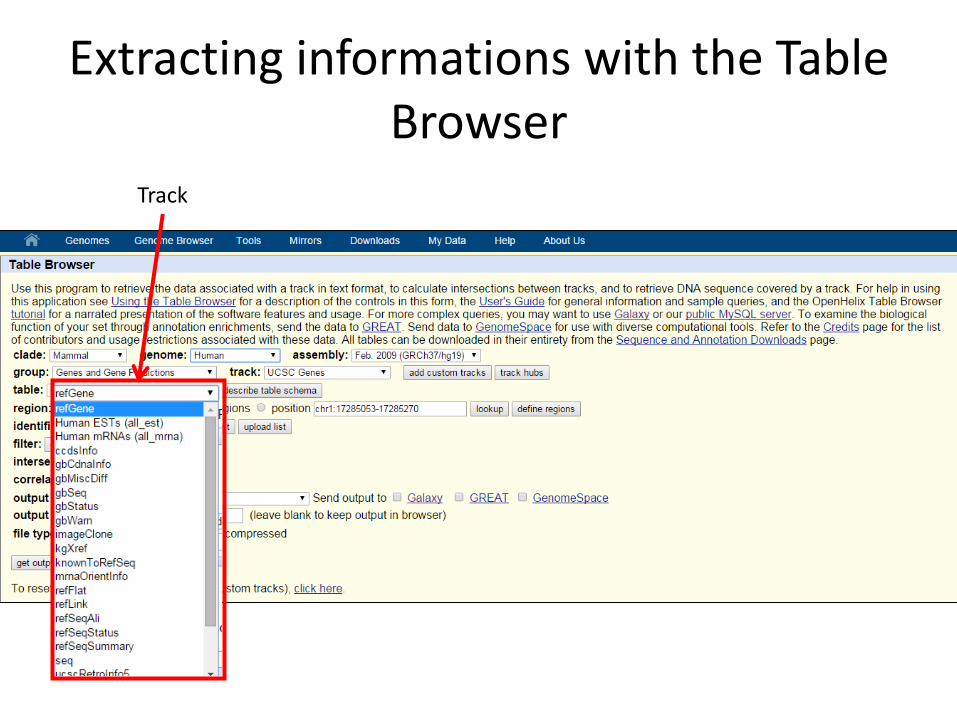
Extracting informations with the Table Browser
Track
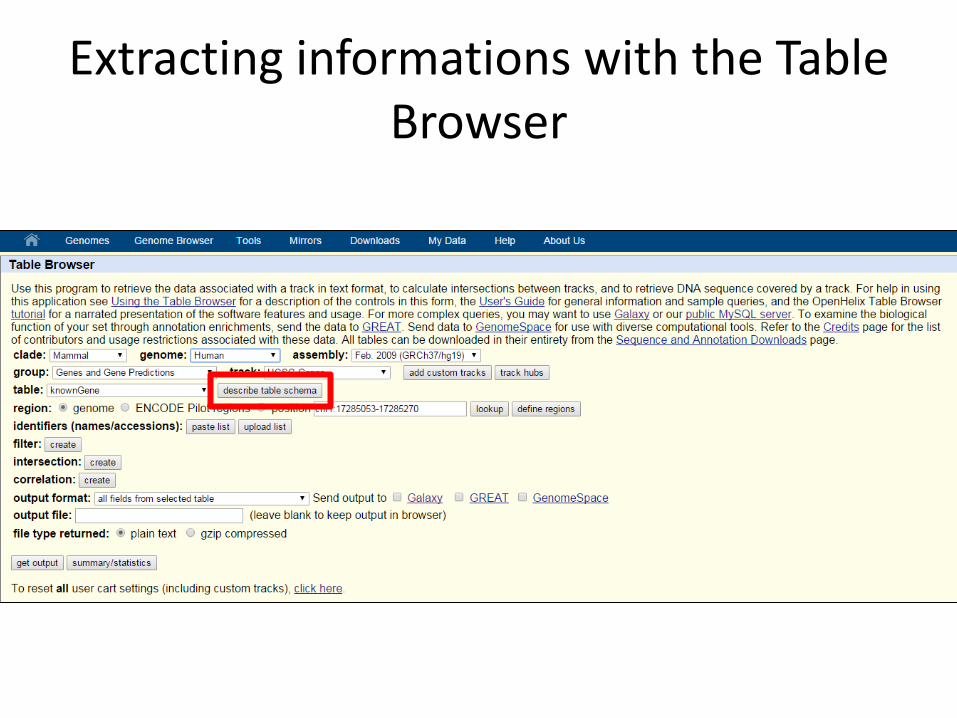
Extracting informations with the Table Browser
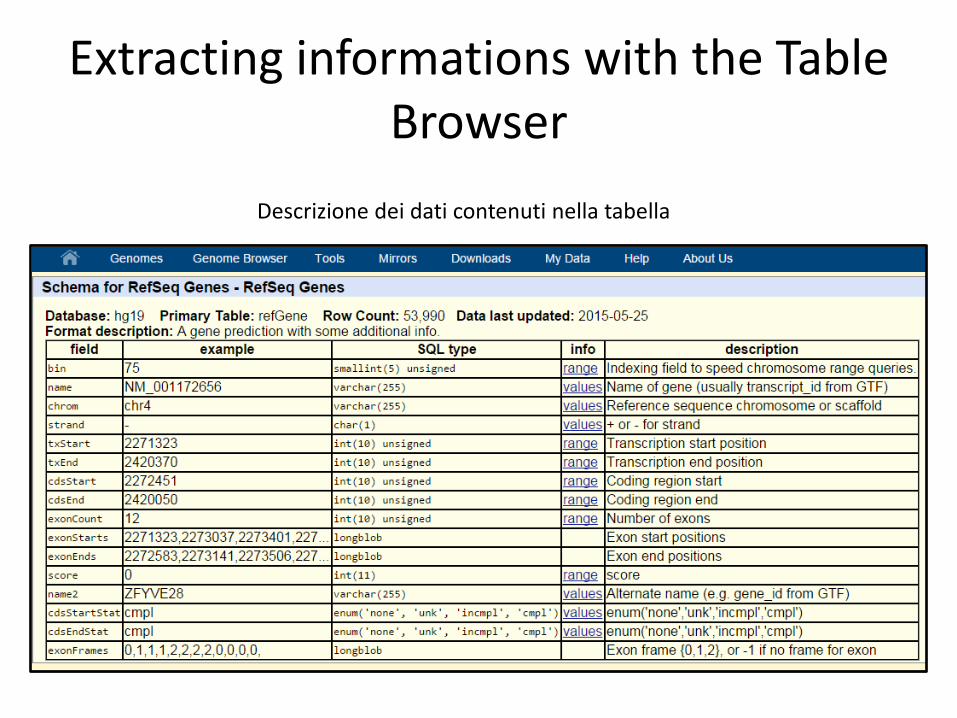
Extracting informations with the Table Browser
Descrizione dei dati contenuti nella tabella
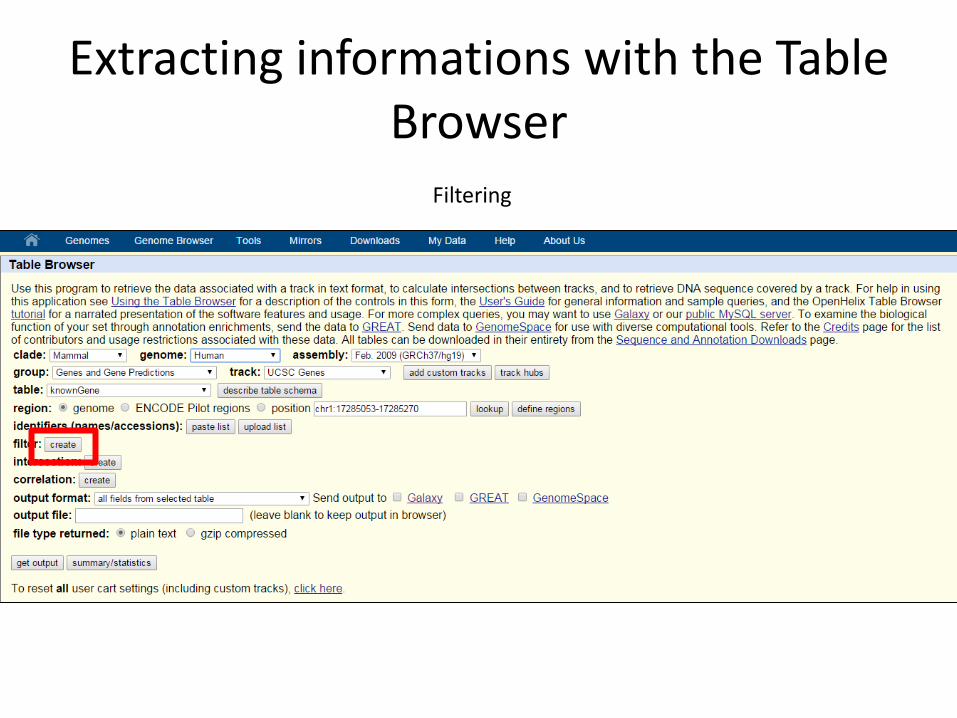
Extracting informations with the Table Browser
Filtering
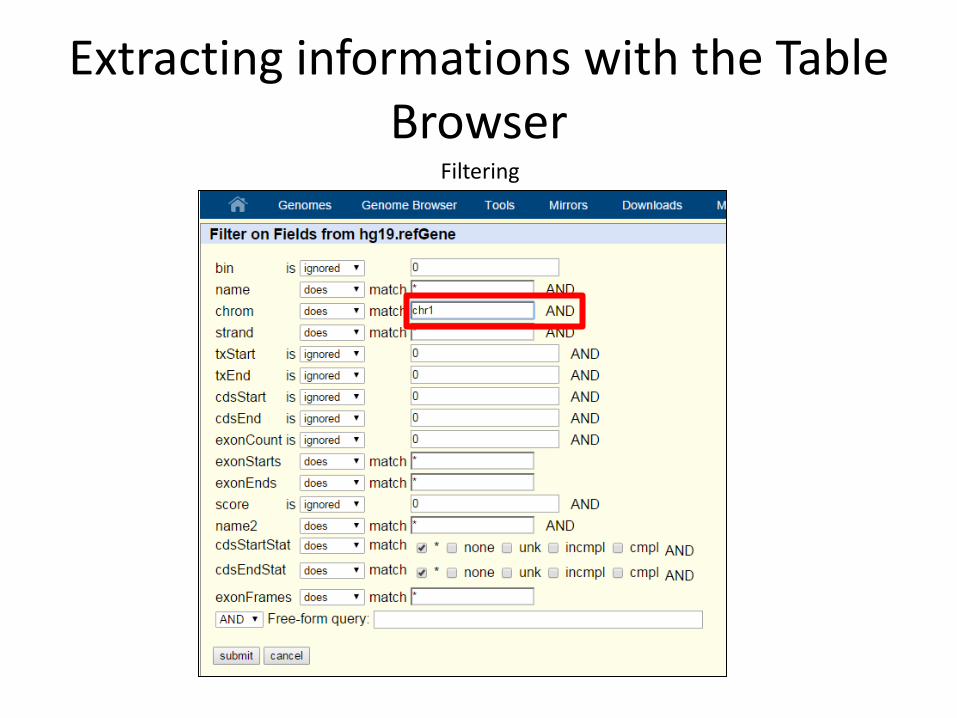
Extracting informations with the Table Browser
Filtering
Extracting informations with the Table Browser
Extracting informations with the Table Browser
Extracting informations with the Table Browser
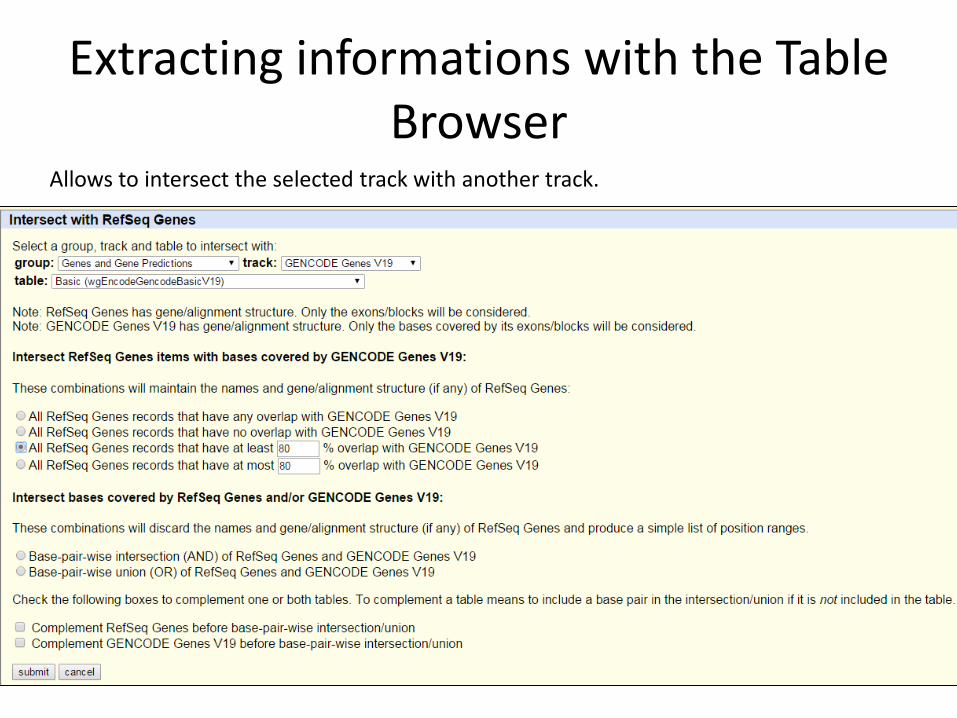
Extracting informations with the Table Browser
Allows to intersect the selected track with another track.
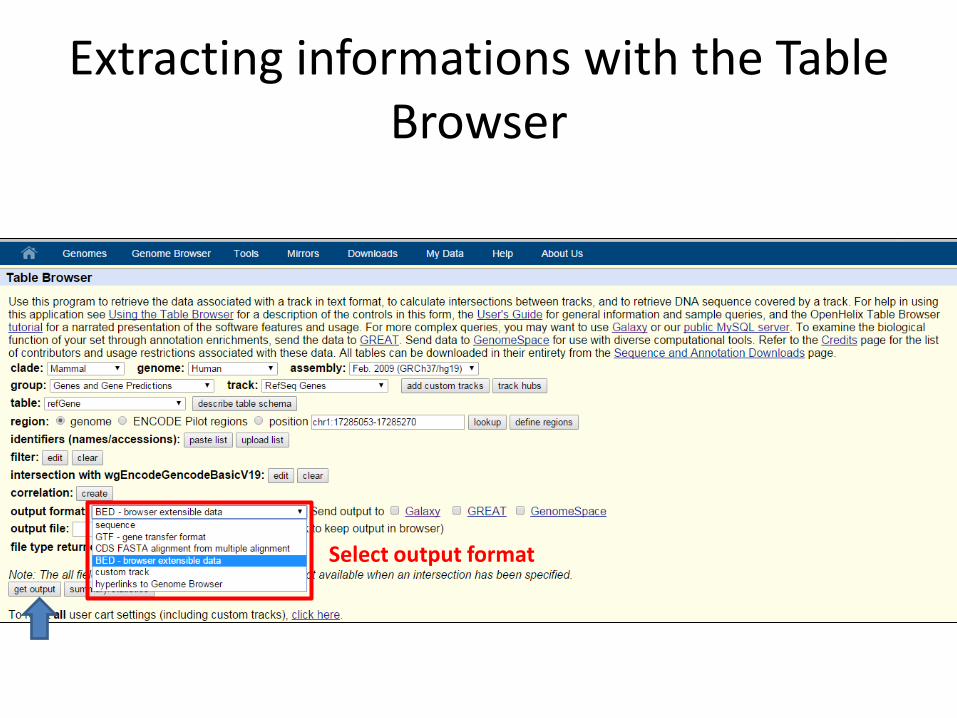
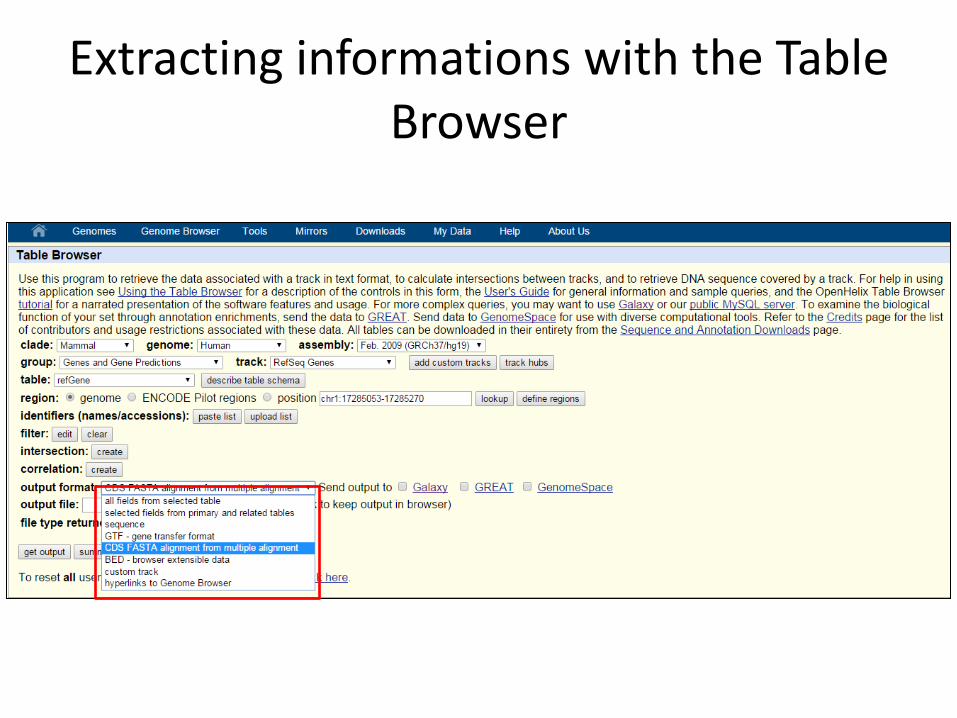
Extracting informations with the Table Browser
Select output format
Extracting informations with the Table Browser
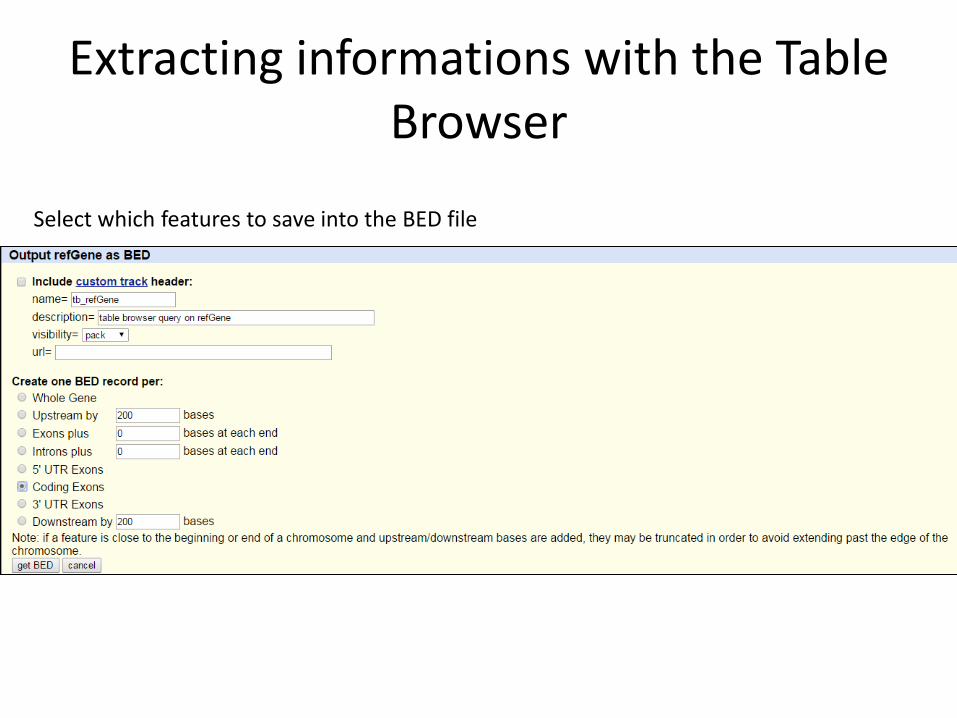
Select which features to save into the BED file
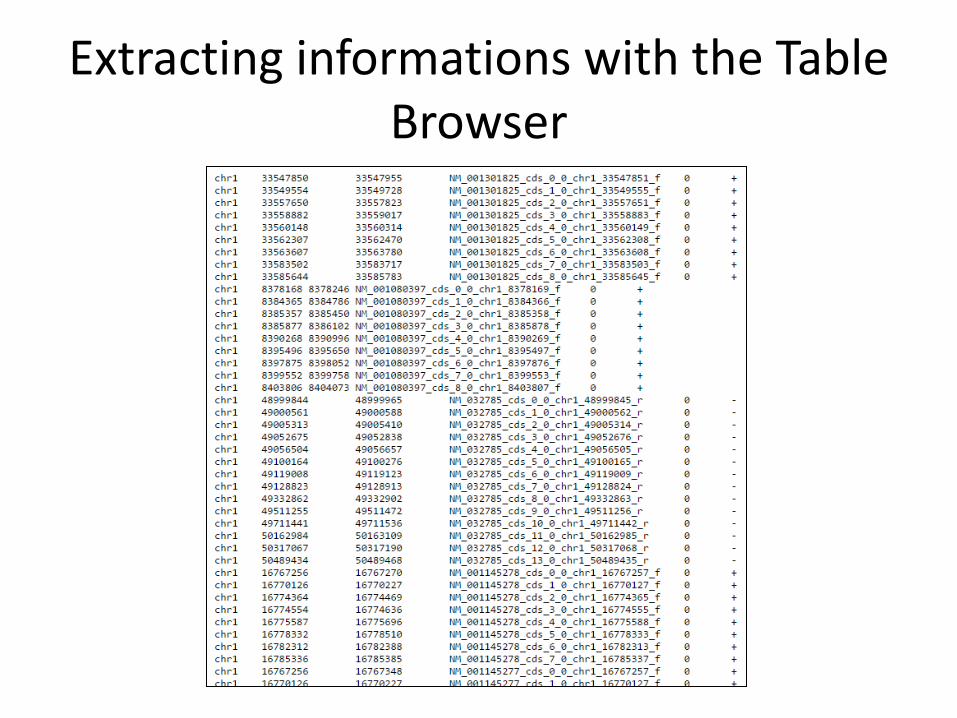
Extracting informations with the Table Browser
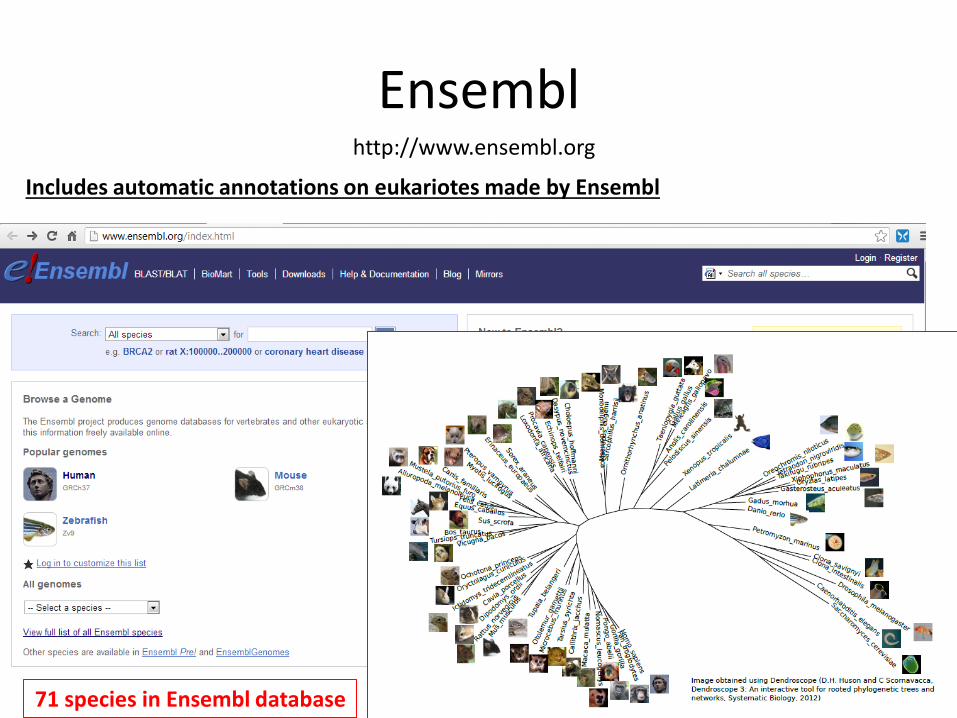
Ensembl http://www.ensembl.org
71 species in Ensembl database
Includes automatic annotations on eukariotes made by Ensembl
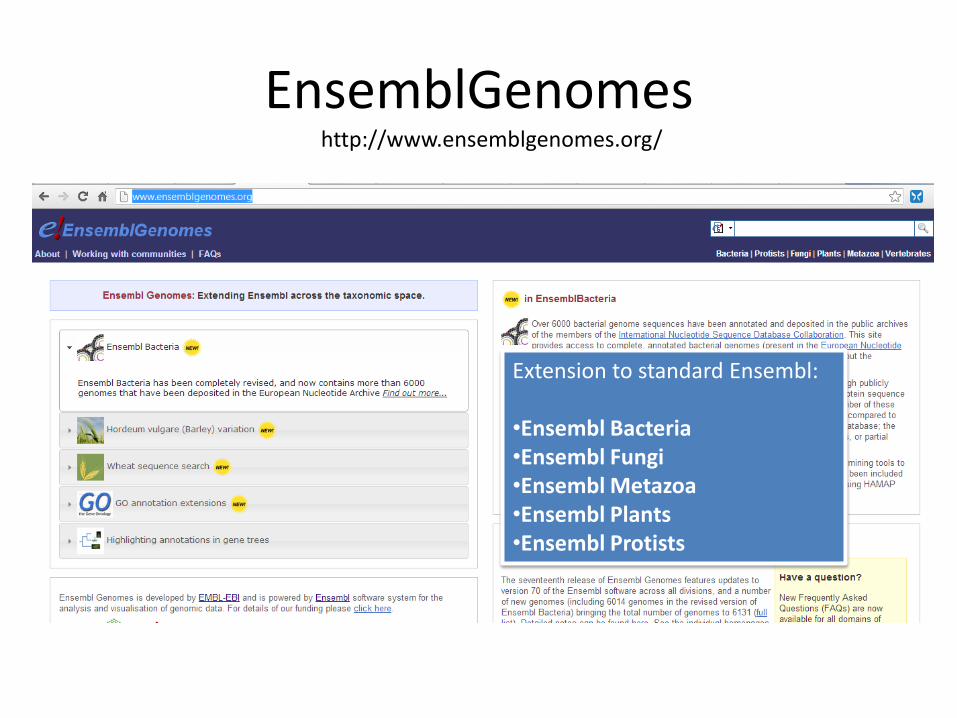
EnsemblGenomes http://www.ensemblgenomes.org/
Extension to standard Ensembl: •Ensembl Bacteria •Ensembl Fungi •Ensembl Metazoa •Ensembl Plants •Ensembl Protists
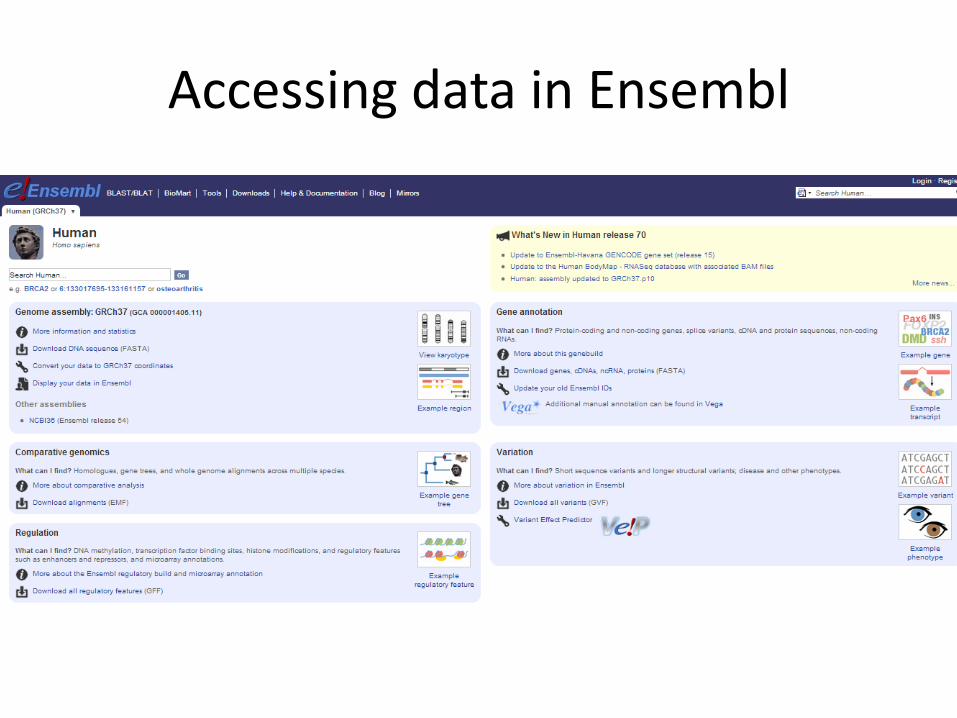
Accessing data in Ensembl
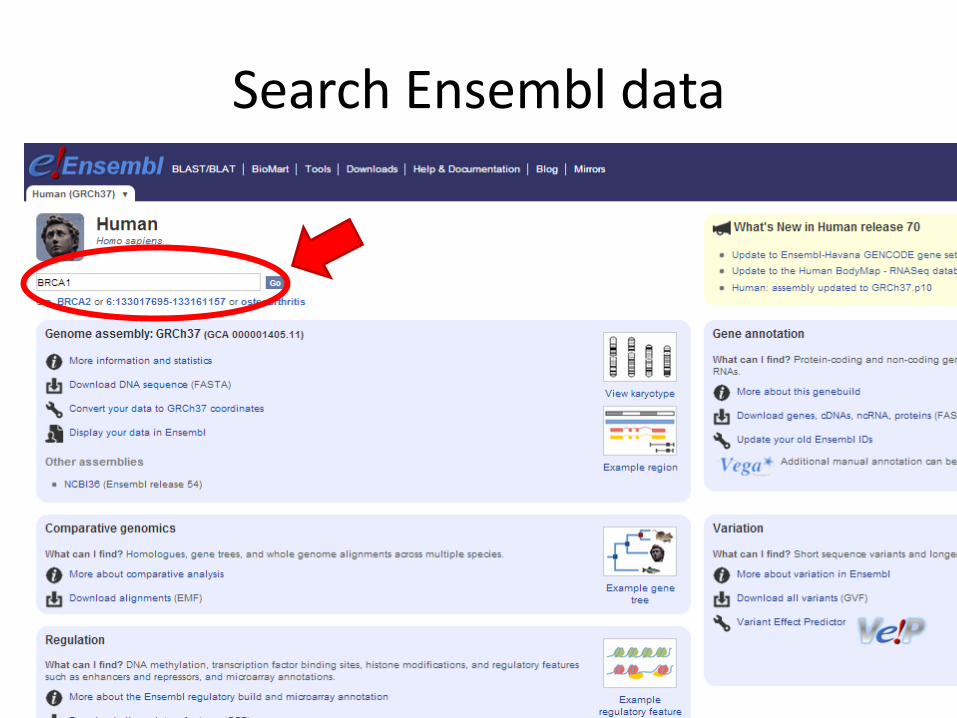
Search Ensembl data
Search Ensembl data
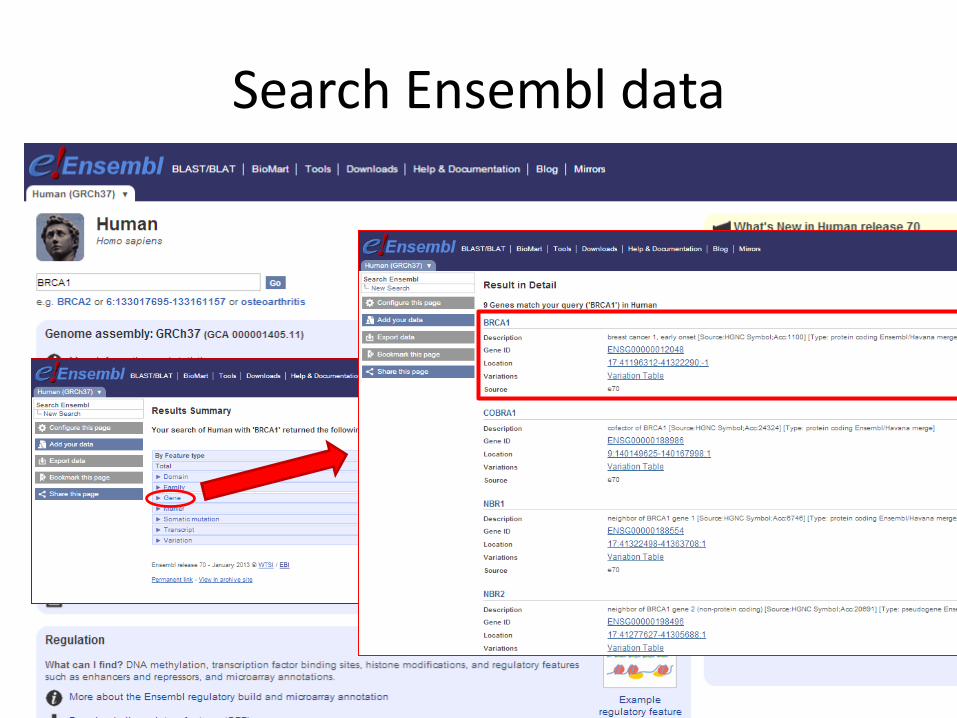
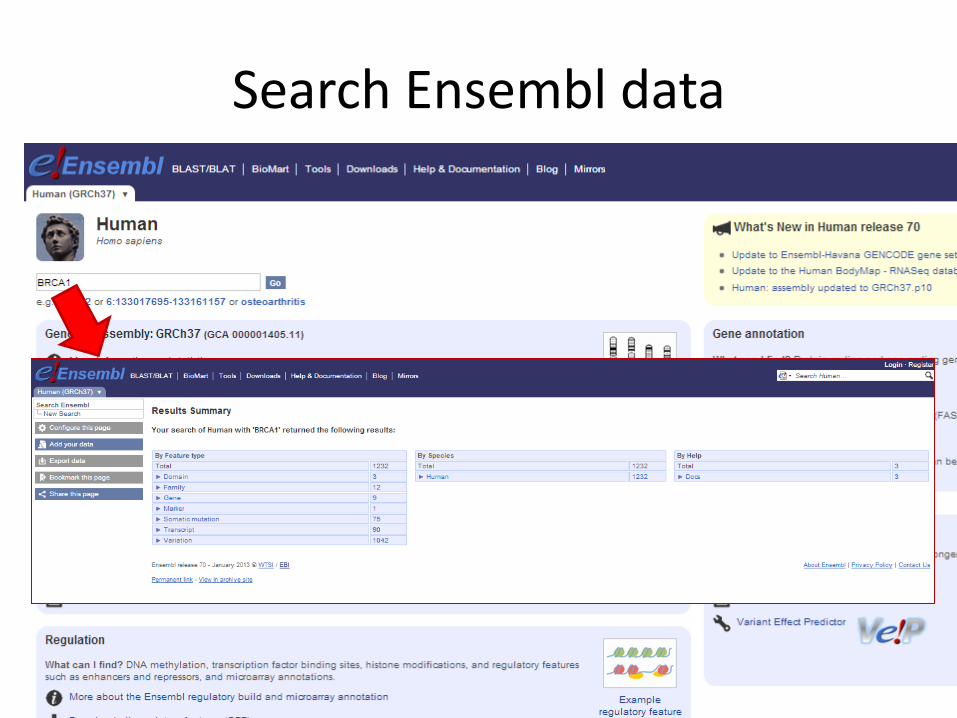
Search Ensembl data
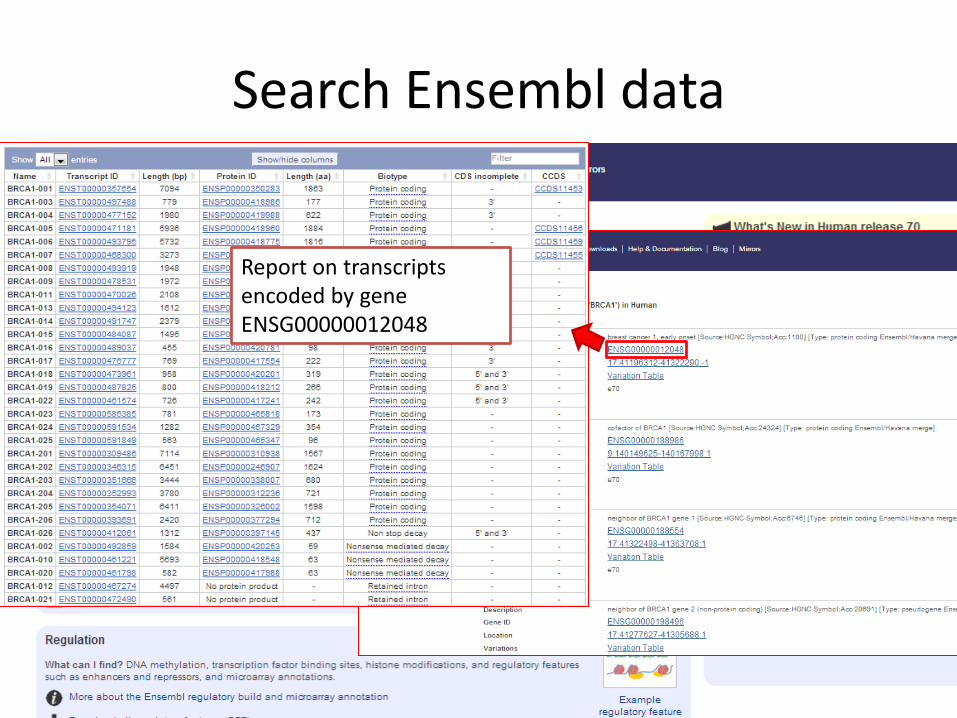
Search Ensembl data
Report on transcripts encoded by gene ENSG00000012048
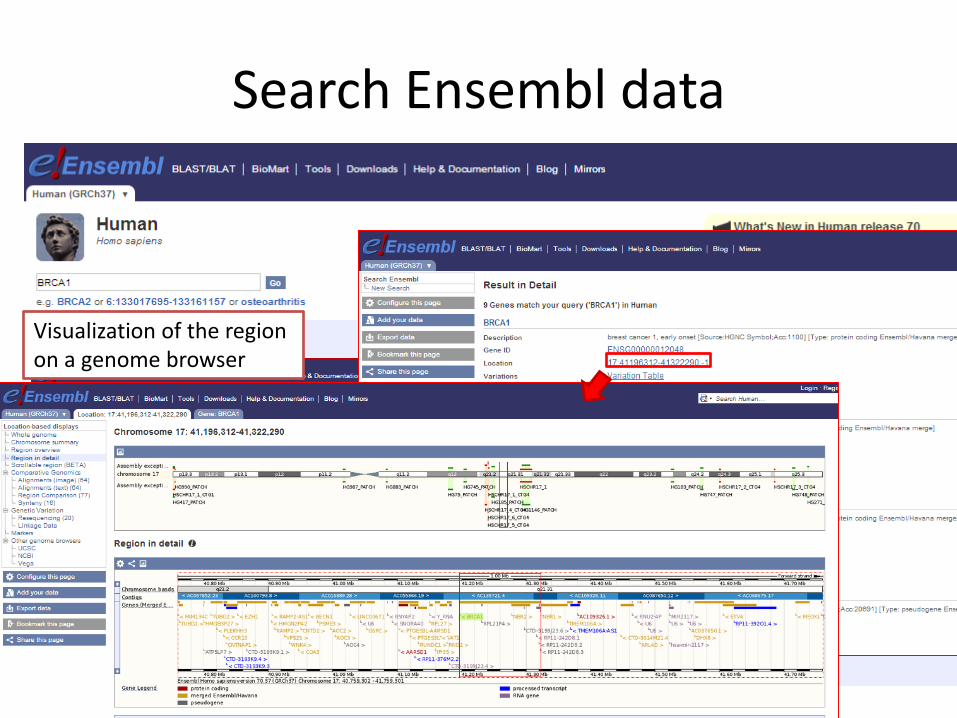
Search Ensembl data
Visualization of the region on a genome browser
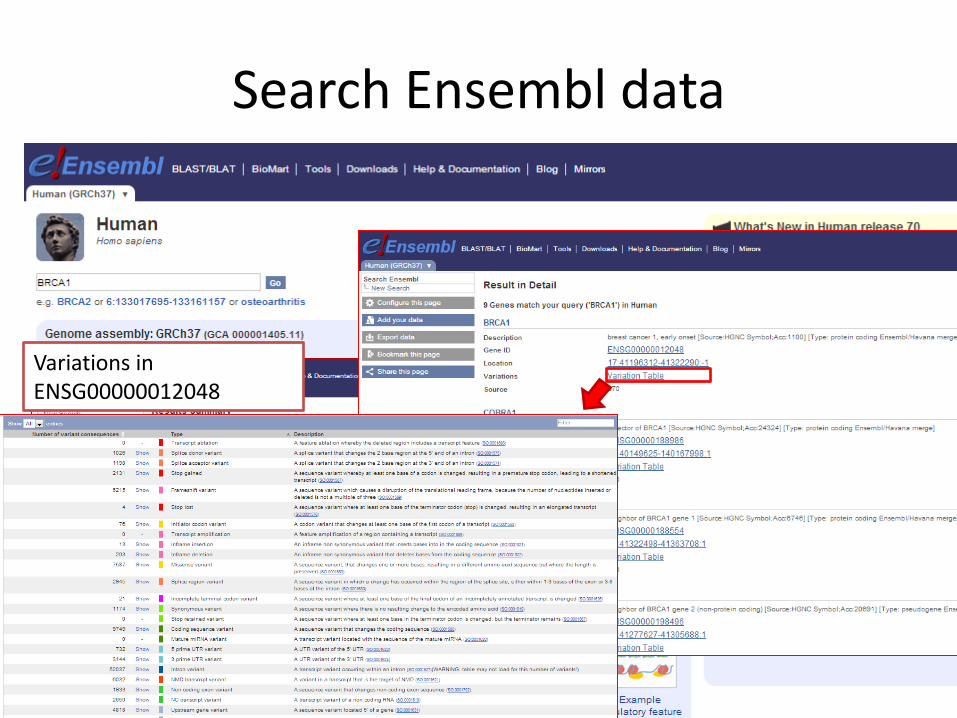
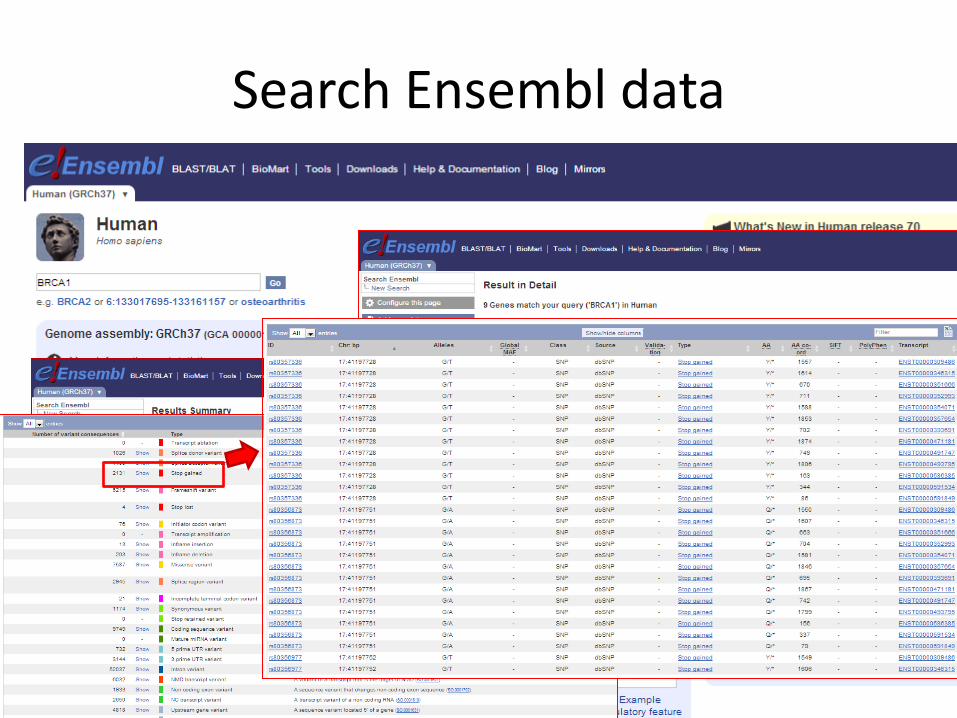
Search Ensembl data
Variations in ENSG00000012048
Search Ensembl data
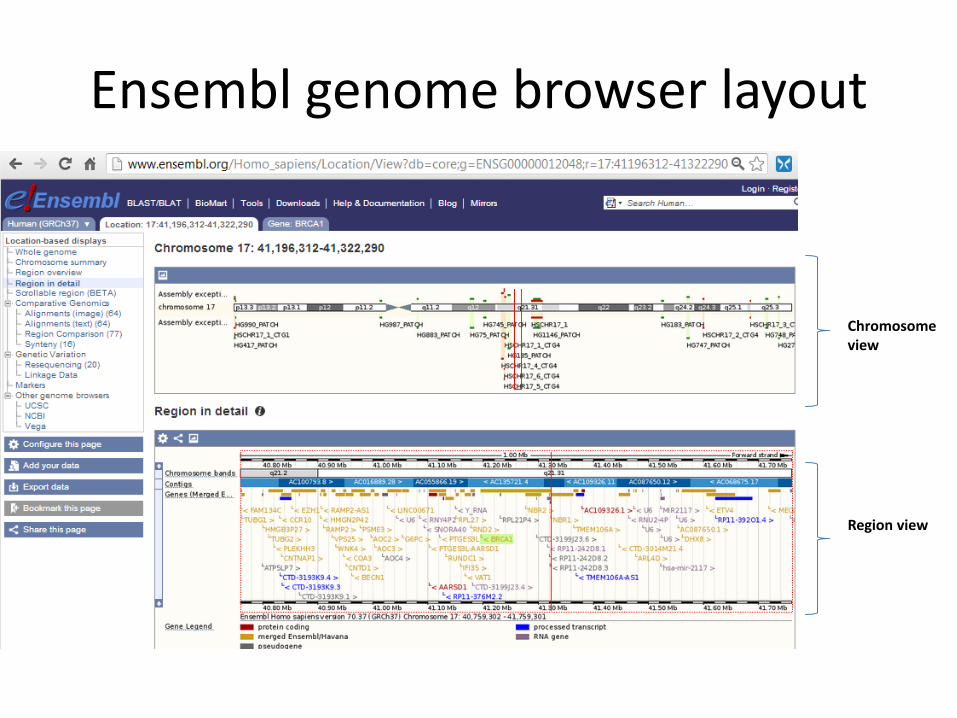
Ensembl genome browser layout
Chromosome view
Region view
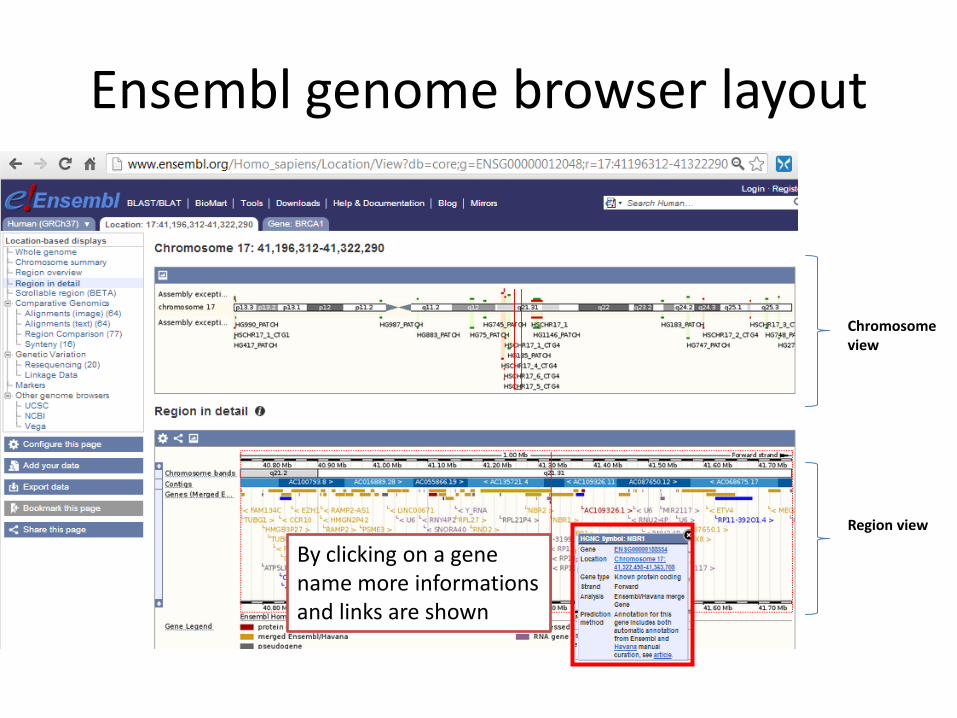
Ensembl genome browser layout
Chromosome view
Region view
By clicking on a gene name more informations and links are shown
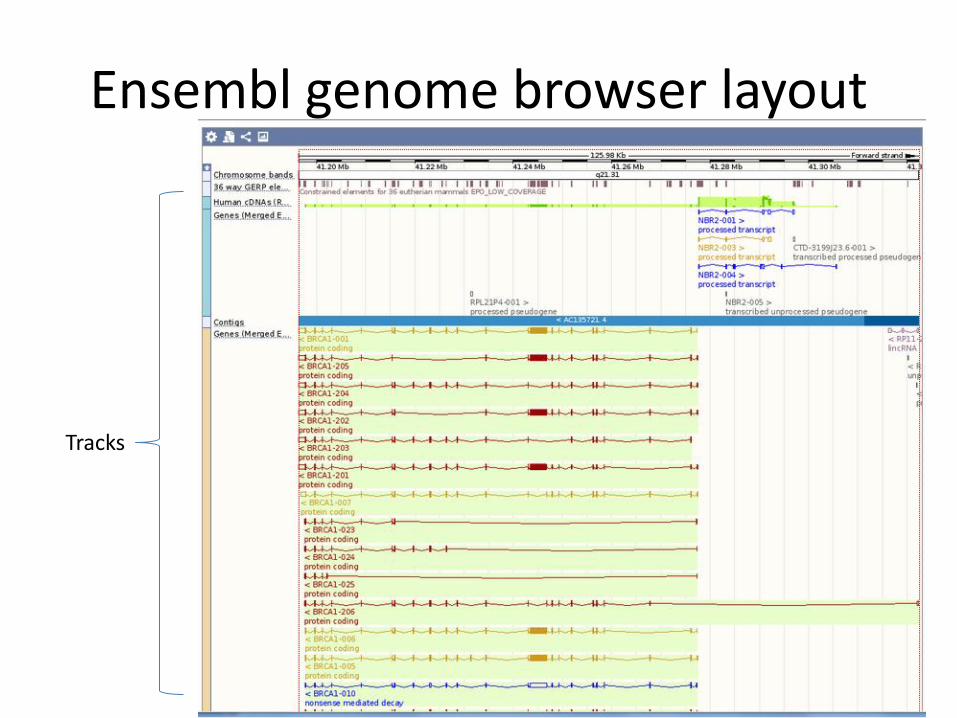
Ensembl genome browser layout
Tracks
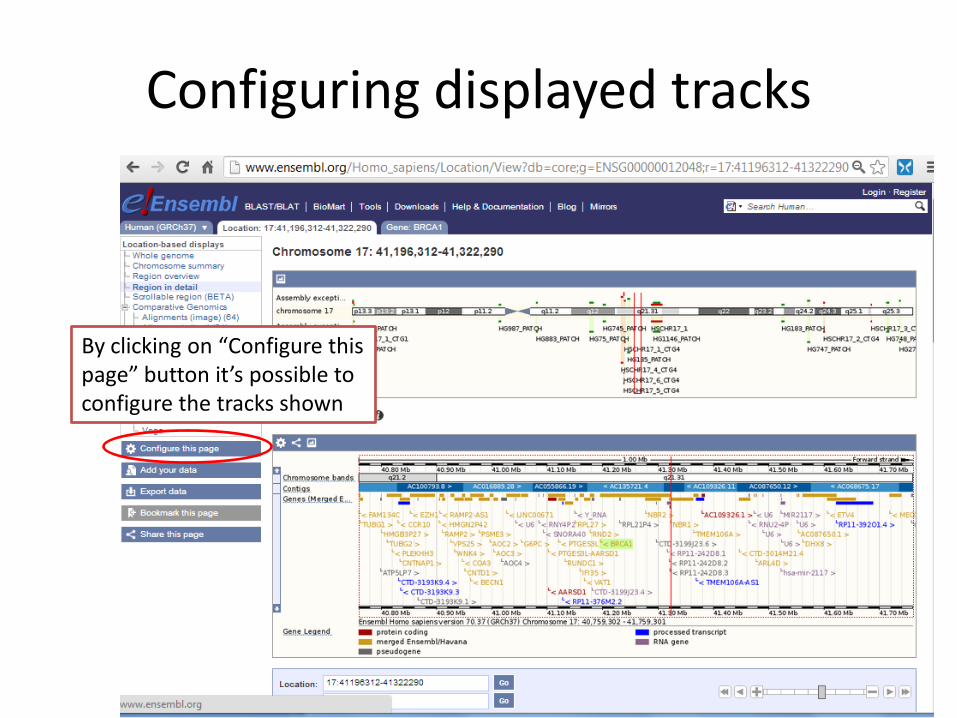
Configuring displayed tracks
By clicking on “Configure this page” button it’s possible to configure the tracks shown
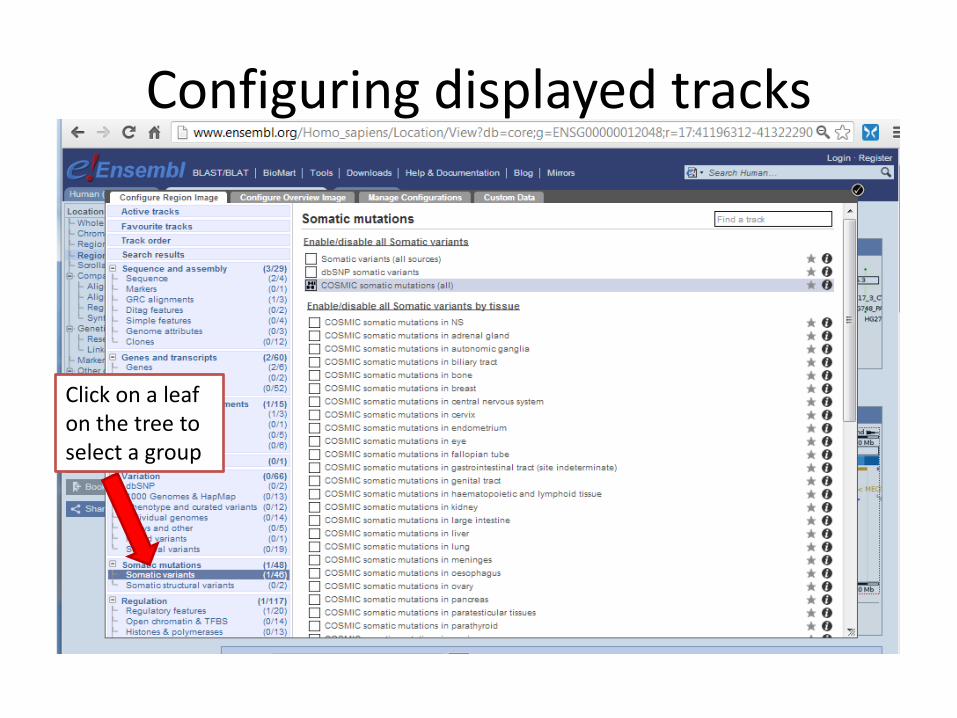
Configuring displayed tracks
Click on a leaf on the tree to select a group
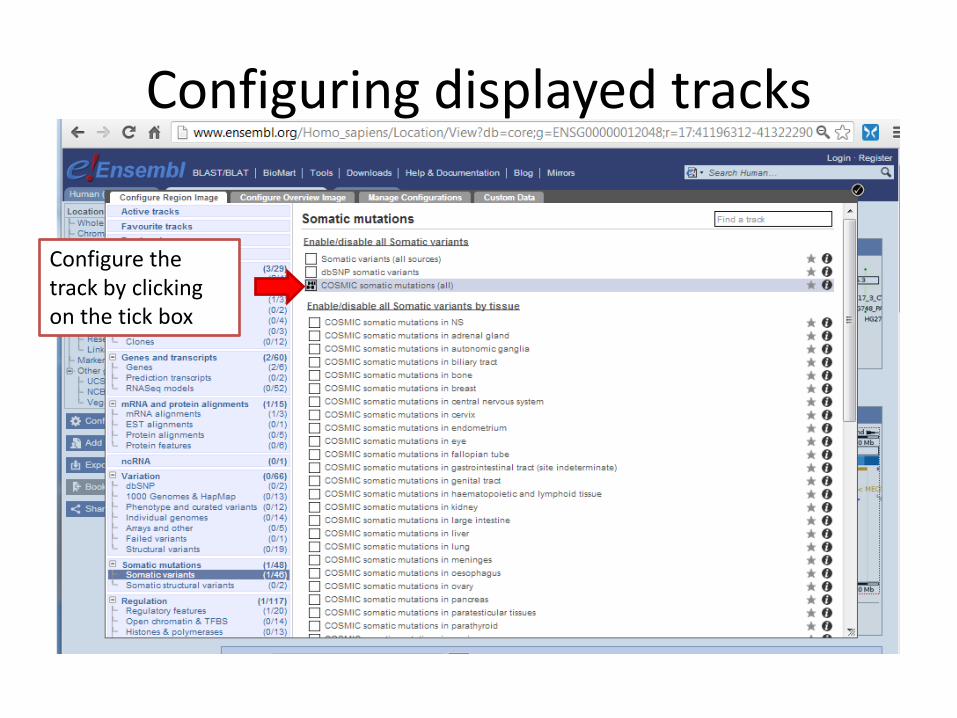
Configuring displayed tracks
Configure the track by clicking on the tick box
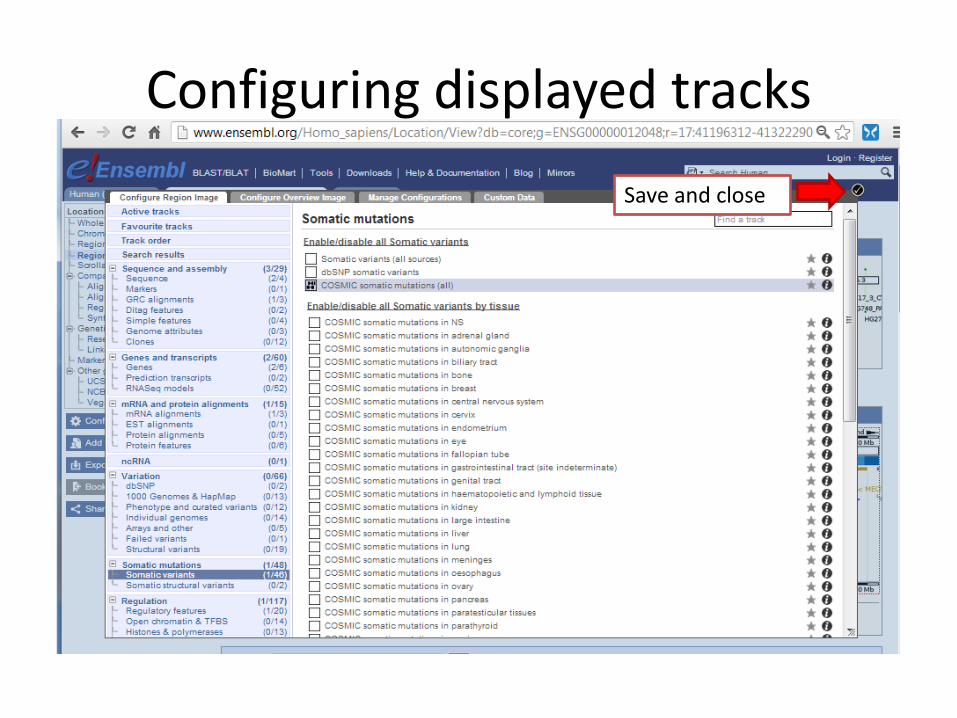
Configuring displayed tracks
Save and close
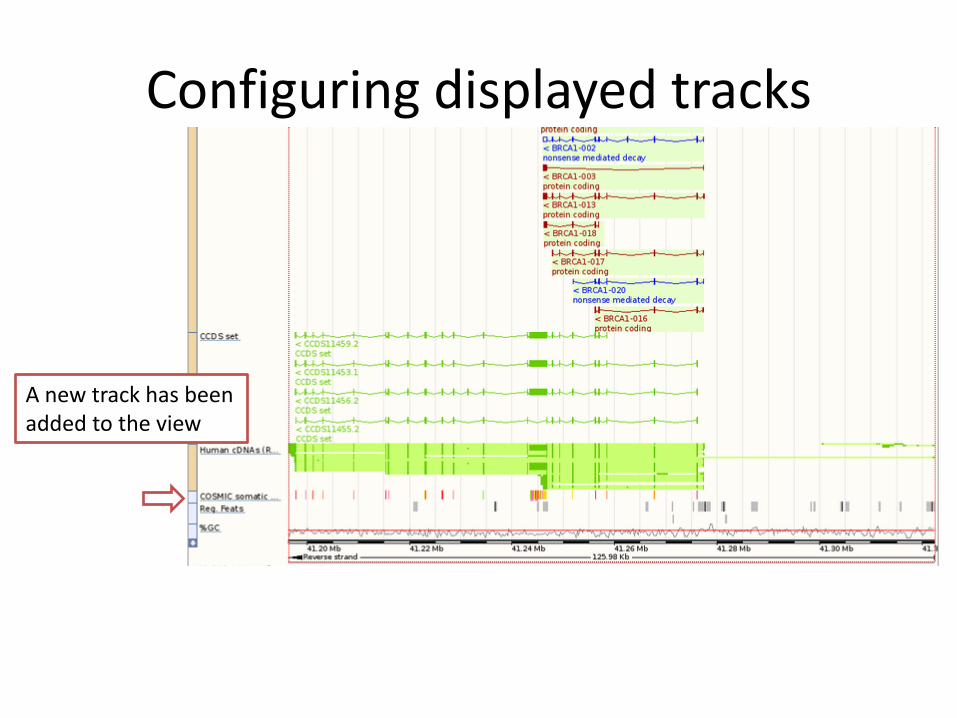
Configuring displayed tracks
A new track has been added to the view
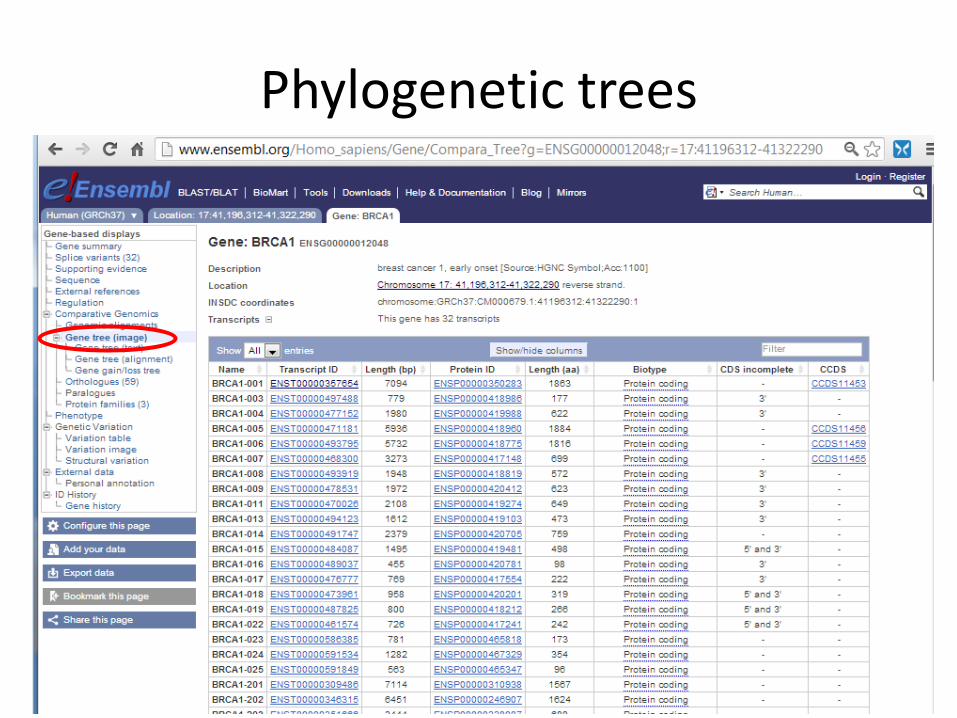
Phylogenetic trees
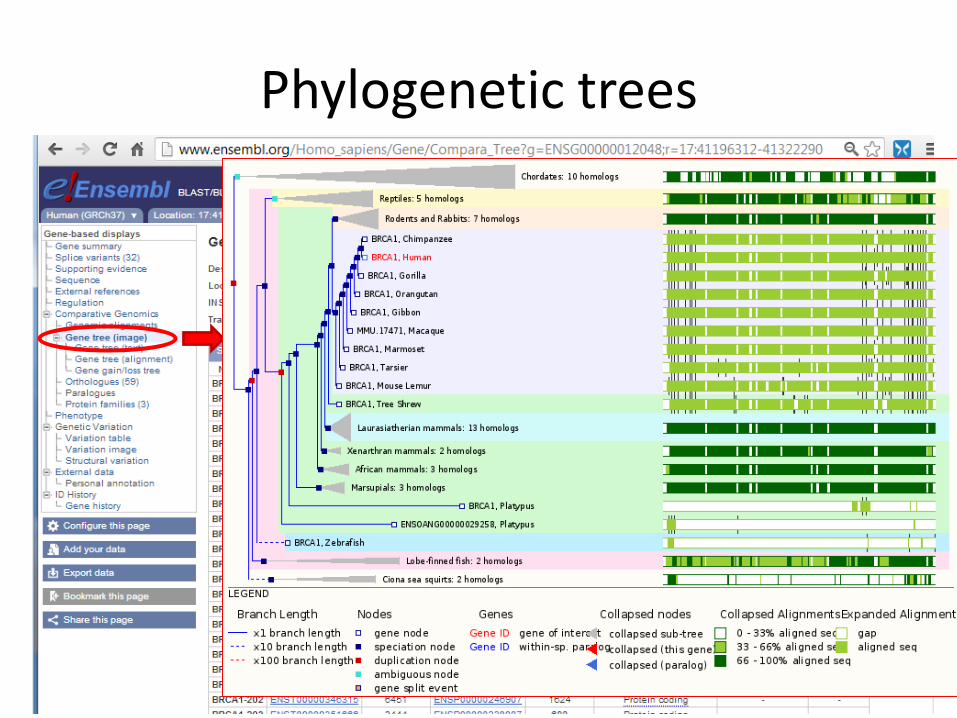
Phylogenetic trees
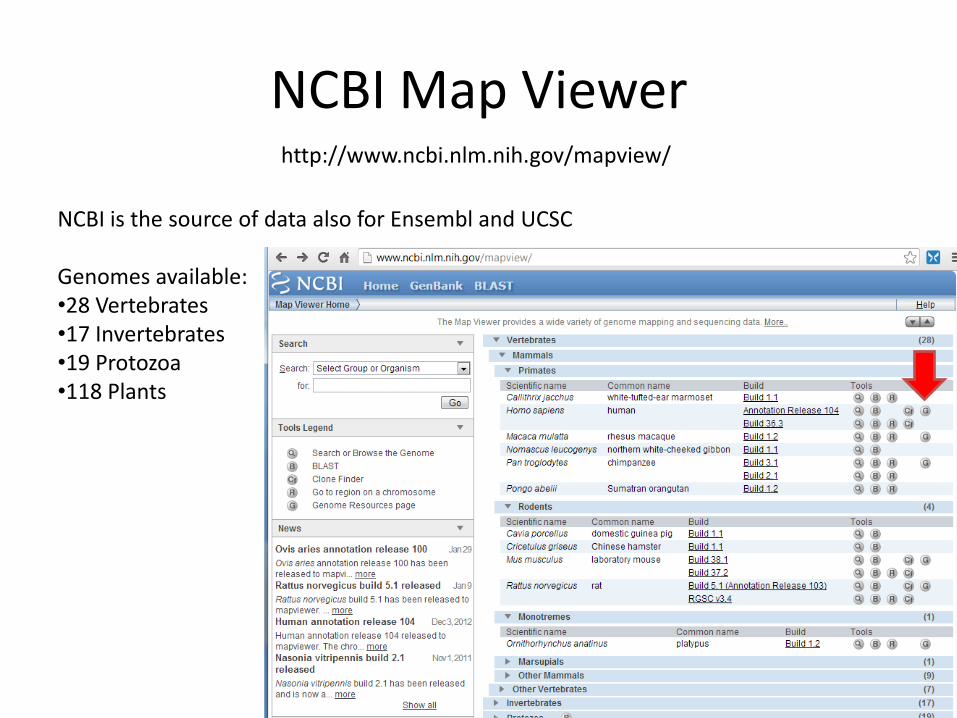
NCBI Map Viewer
NCBI is the source of data also for Ensembl and UCSC Genomes available: •28 Vertebrates •17 Invertebrates •19 Protozoa •118 Plants
http://www.ncbi.nlm.nih.gov/mapview/
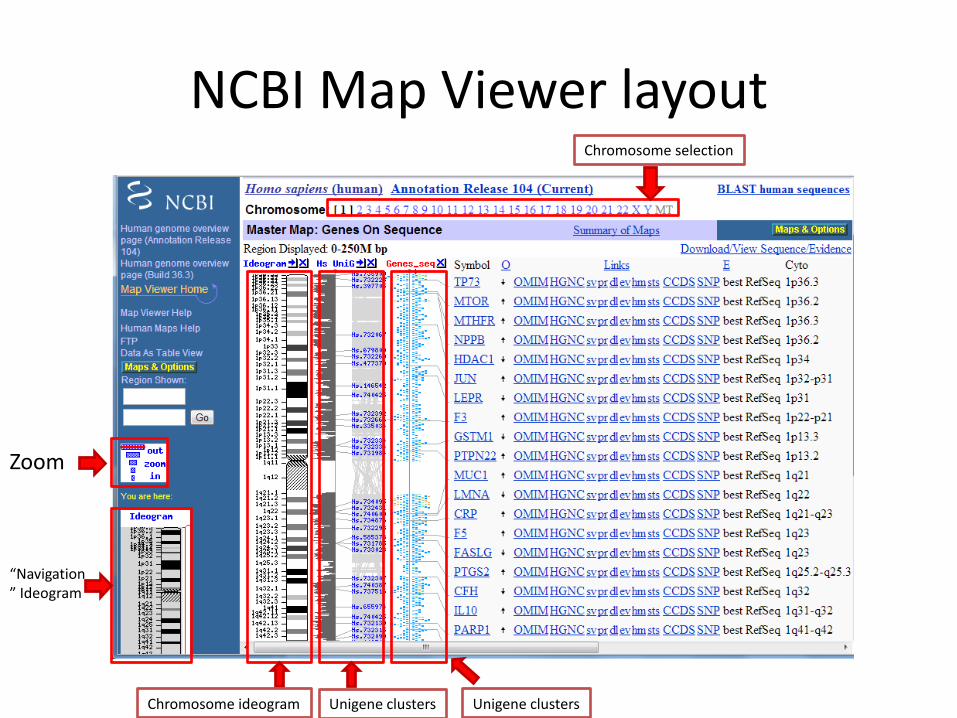
NCBI Map Viewer layout Chromosome selection
Chromosome ideogram Unigene clusters Unigene clusters
Zoom
“Navigation” Ideogram
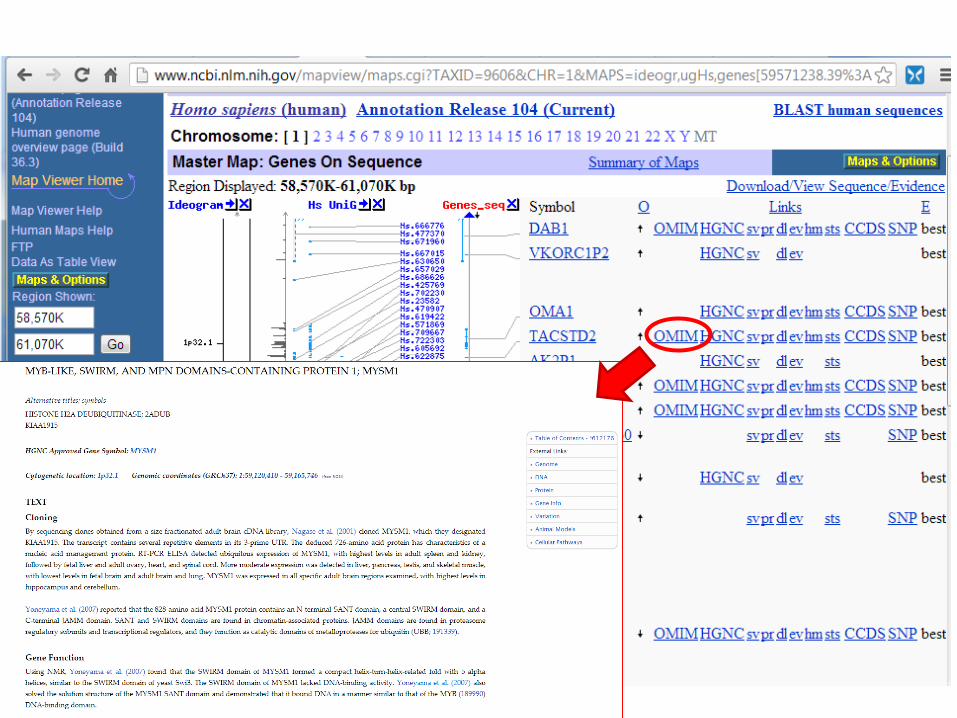
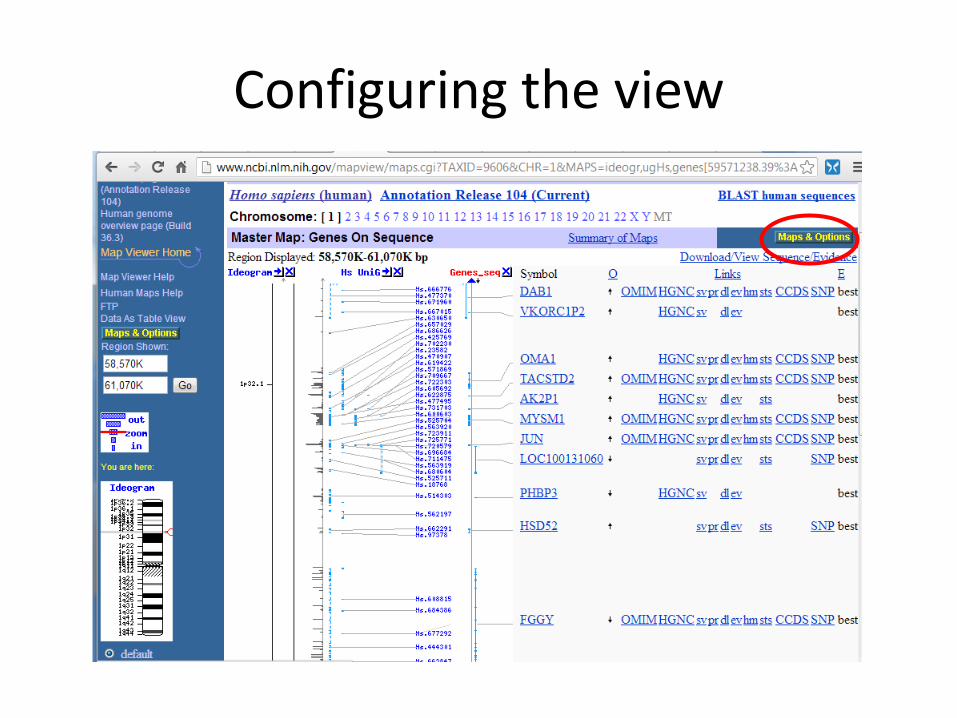
Configuring the view

Configuring the view
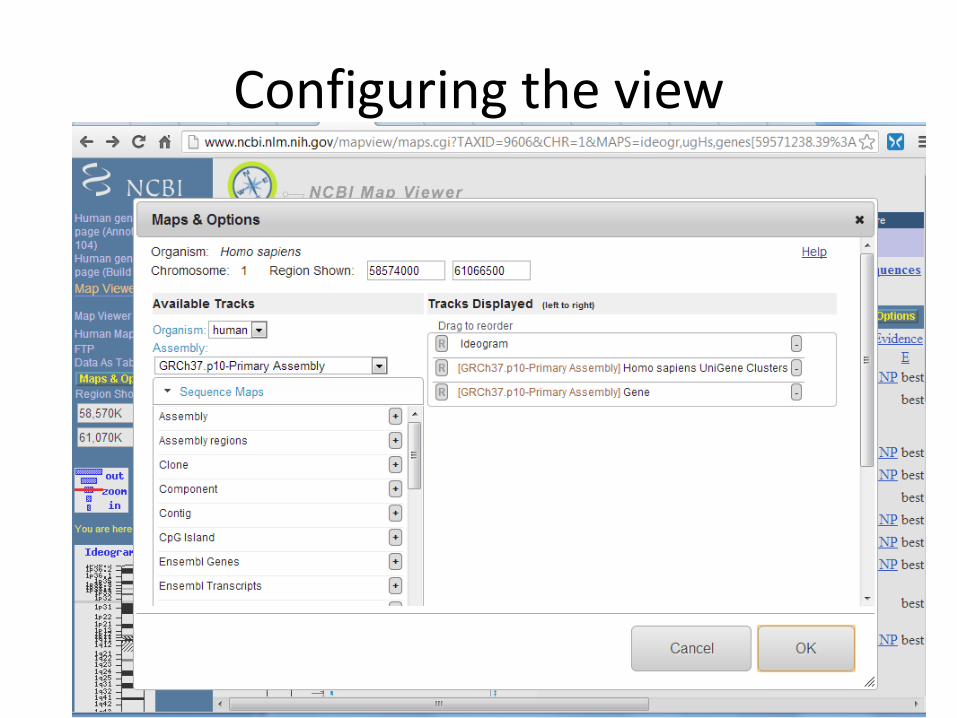
Configuring the view
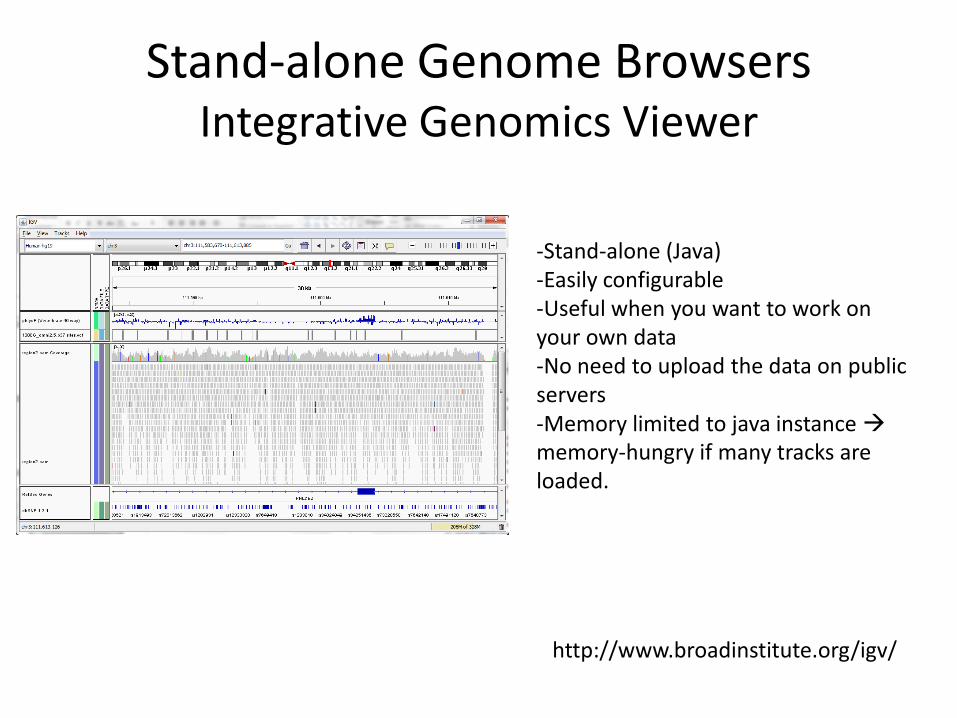
Stand-alone Genome Browsers Integrative Genomics Viewer
-Stand-alone (Java) -Easily configurable -Useful when you want to work on your own data -No need to upload the data on public servers -Memory limited to java instance memory-hungry if many tracks are loaded.
http://www.broadinstitute.org/igv/
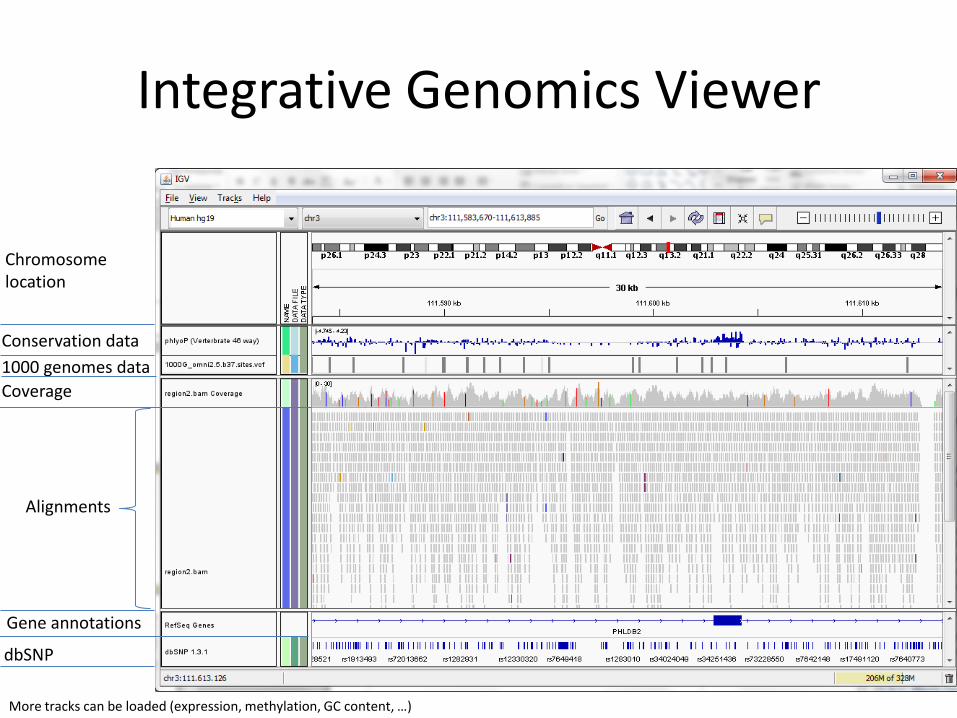
Integrative Genomics Viewer
Chromosome location
Conservation data
1000 genomes data
Alignments
Coverage
Gene annotations
dbSNP
More tracks can be loaded (expression, methylation, GC content, …)