Embed Size (px)
Citation preview
NEW TURBINE DESIGNSARE MORE SYSTEM-FRIENDLY, LEADING TO HIGHER CAPACITY FACTORS AND SMOOTHER OUTPUTS
The network capacity is better utilised, leading to lower network costs Forecast errors are reduced, leading to lower balancing costs Power production is more evenly distributed, leading to higher market value
MARKET DESIGN AND SYSTEM OPERATORS’ COOPERATION LEADS TO LOWER BALANCING RESERVES COSTS, EVEN WITH HIGHER SHARE OF RENEWABLES
2-5 MW100m100-140m
15 MW150m240m
0.3 MW30m33m
STATUE OF LIBERTY: 93m
EIFFEL TOWER: 324m
ONSHORE 2017
OFFSHORE 2025
1990
Nameplate Capacity
Hub Height
Rotor Diameter
Since 2008, balancing reserves in Germany decreased by 20%, and their costs by 70%
while wind and solar capacity tripled.
Source: Neon
Larger bladesand higher towers
Low wind speeds
Lower energy density (Generator to rotor ratio (W/m2)
The German balancing paradox
Balancing reserves (GW) Wind and solar (GW)
2008 2009 2010 2011 2012 2013 2014 20150 0
2 30
604
906
Ba
lanc
ing
rese
rves
(GW
)
Win
d a
nd s
ola
r ca
pa
city
(GW
)
Intraday market Share of reserves among TSOs New market participantsTSOs crossborder coordination
INTEGRATING WIND INTO THE ENERGY SYSTEMGetting more windin the grid at lower cost
RENEWABLESWORK TOGETHER
TURBINEDESIGNS
MARKET DESIGN & TSO COOPERATION
STORAGESOLUTIONS
DEMANDMANAGEMENT
SYSTEM INTEGRATION
COST REDUCTION
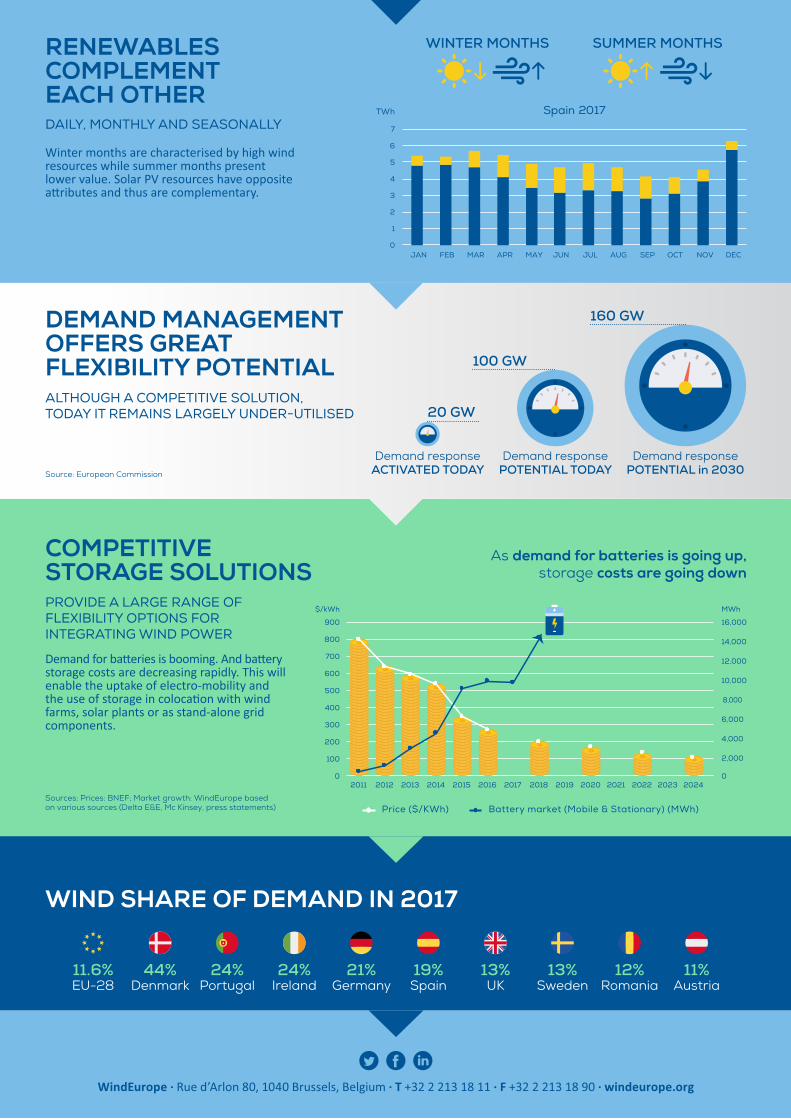
WIND SHARE OF DEMAND IN 2017
11.6%EU-28
44%Denmark
24%Portugal
24%Ireland
21%Germany
19%Spain
13%UK
13%Sweden
12%Romania
11%Austria
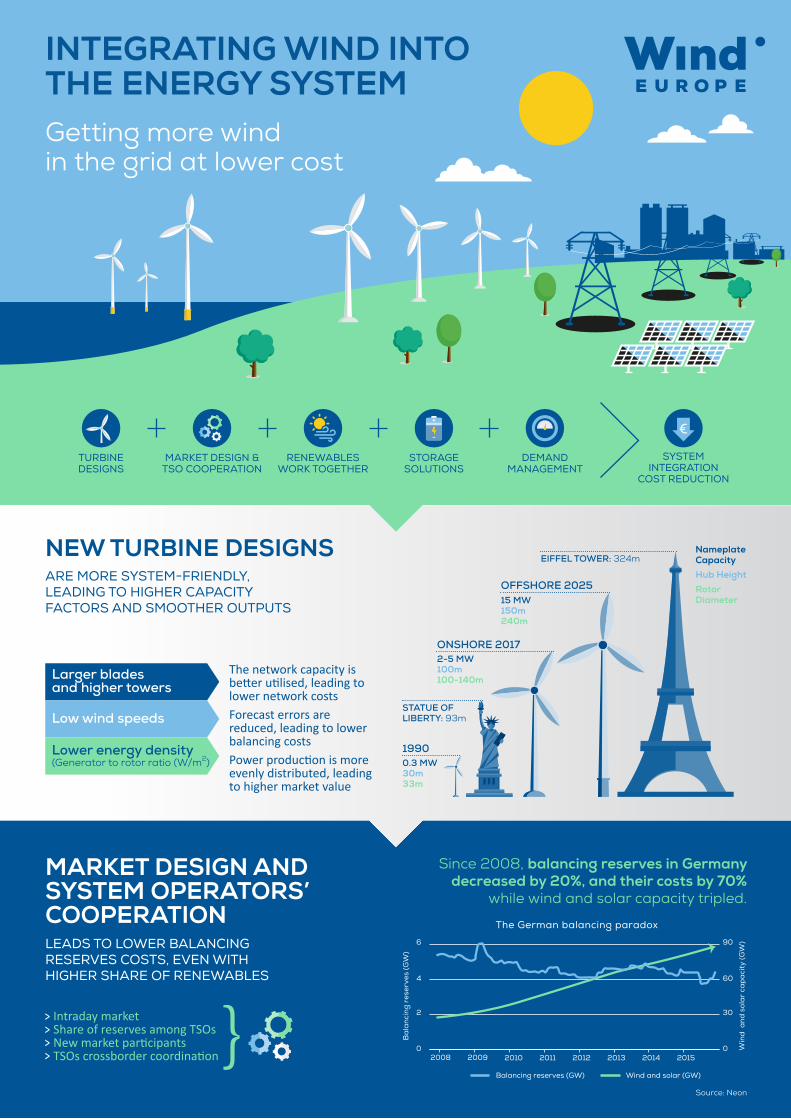
COMPETITIVE STORAGE SOLUTIONSPROVIDE A LARGE RANGE OF FLEXIBILITY OPTIONS FOR INTEGRATING WIND POWER
Demand for batteries is booming. And battery storage costs are decreasing rapidly. This will enable the uptake of electro-mobility and the use of storage in colocation with wind farms, solar plants or as stand-alone grid components.
As demand for batteries is going up,storage costs are going down
Sources: Prices: BNEF; Market growth: WindEurope basedon various sources (Delta E&E, Mc Kinsey, press statements)
0
2,000
4,000
6,000
8,000
10,000
12,000
14,000
16,000
0
100
200
300
400
500
600
700
800
900
2011 2012 2013 2014 2015 2016 2017 2018 2019 2020 2021 2022 2023 2024
MWh$/kWh
Price ($/KWh) Battery market (Mobile & Stationary) (MWh)
DEMAND MANAGEMENTOFFERS GREATFLEXIBILITY POTENTIALALTHOUGH A COMPETITIVE SOLUTION,TODAY IT REMAINS LARGELY UNDER-UTILISED
Demand responsePOTENTIAL in 2030
Demand response POTENTIAL TODAY
Demand response ACTIVATED TODAY
160 GW
100 GW
20 GW
Source: European Commission
DAILY, MONTHLY AND SEASONALLY
RENEWABLESCOMPLEMENTEACH OTHER
Winter months are characterised by high wind resources while summer months present lower value. Solar PV resources have opposite attributes and thus are complementary.
0
1
2
3
4
5
6
7
JAN FEB MAR APR MAY JUN JUL AUG SEP OCT NOV DEC
TWh Spain 2017
SUMMER MONTHSWINTER MONTHS