Embed Size (px)
Citation preview
Integrating various energy saving initiatives on compressed air systems
of typical South African gold mines
Jaco-Albert Snyman
Dissertation submitted in partial fulfilment of the requirements for
the degree: Magister in Mechanical Engineering a t the Faculty of
Engineering at the North-West University, Potchefstroom Campus
Supervisor: Dr J. F. van Rensburg
Date: November 2011

Integrating various energy saving initiatives on compressed air systems of typical South African gold mines
Page I
Acknowledgements
I have God to thank for the opportunity and ability to complete this study. This was not done
through any ability I deserve, or acquired myself. To God, Jesus Christ and the Holy Spirit all
the glory.
Prof. Eddie Mathews and Prof. Marius Kleingeld, thank you for providing me with the platform
and opportunity to conduct this study. God is working through you and you’re in His hands.
Marius, your guidance and willingness to always provide input is greatly appreciated.
Dr Johann van Rensburg, my study leader, thank you for your guidance and patience with me.
All your recommendations and feedback are greatly appreciated.
Mr Doug Velleman, thank you for editing all of my work. I value and appreciate your feedback.
To all my colleagues at HVAC International, including Prof. Leon Liebenberg and Dr Ruan
Pelzer, thank you for your input as well as your willingness to answer questions and provide
guidance.
To all mining personnel, thank you for your assistance, patience and time, especially during all
the late nights of testing. I have learnt a great deal from you and appreciate all your efforts.
All my friends and family, specifically Dirkie, Jan-Louis, Gerhard, Jan, Mom and Dad, thank you
for your patience and understanding when I was not available. You have never slipped my
thoughts.
All examiners thank you for taking the time to examine this study. It is my wish that you will
find value in this study.
Integrating various energy saving initiatives on compressed air systems of typical South African gold mines
Page II
Abstract
Electrical energy is commonly used in households and in industry – demand continues to rise
due to economic and population growth. This requires that energy suppliers must increase
their supply capacity. The result is that end-user energy costs continue to increase, therefore a
growing need exists to reduce electrical energy demand in South Africa and internationally.
Households account for the majority of electrical energy customers, but they only consume a
fraction of the total energy supplied. The industrial sector and mines combined consume
approximately 42% of the total electrical energy produced. Approximately 10% of this energy
goes into compressed air production.
This study focuses on methods of reducing the requirement of compressed air in industry so
that the demand for electrical energy can be reduced. Many studies have focused on specific
methods of reducing energy usage associated with compressed air production. These methods
are categorised into methods of reducing compressed air requirements and methods of
increasing compressed air supply efficiency.
This study aims to combine these efforts into a single optimised solution. Although this study
includes industry in general, the central focus is on the South African mining industry. Two
different mining sites are considered and analysed as case studies. Methods of reducing
energy required to produce compressed air were applied to each case study. Case Study 1 only
allowed limited control of the compressed air system. In Case Study 2 integrated control was
realised. Energy usage of compressors was reduced by 18.9% and 42.9% respectively.
Results show that system savings can be doubled by combining different methods of reducing
energy usage of compressed air. This, however, requires continuous monitoring and control of
the air network at each section supplied with compressed air.
The study is limited to achieving savings by changing the air system. Additional savings can be
achieved by training personnel, altering schedules of production activities and implementing a
system designed to locate air leaks.
Keywords: Compressed air, air network optimisation, demand-side management (DSM),
energy savings, mine compressed air.
Integrasie van verskeie energiebesparings metodes in die druklugstelstels van tipiese Suid-Afrikaanse goudmyne
Page III
Samevatting
Elektriese energie word algemeen in huishoudings, asook in die industriële sektore gebruik.
Energieverbruikers neem daagliks toe. Dit veroorsaak dat energieverskaffers hul kapasiteit
moet vergroot. Die gevolg hiervan is dat energiekostes aanhou om toe te neem en
energieverbruikers hul verbruik moet verminder om sodoende kostes te verlaag.
Huishoudelike verbruikers beslaan die grootste deel van energieverbruikers, maar gebruik
slegs ‘n fraksie van die totale gegenereerde energie. Gekombineerd gebruik die industriële
sektor en myne ongeveer 42% van die totale gegenereerde energie. Ongeveer 10% van hierdie
energie word gebruik om druklug te verskaf.
Hierdie studie fokus op metodes om die verbruik van druklug in die industrie te verminder om
sodoende die verbruik van elektriese energie te verminder. ‘n Aantal studies het reeds fokus
geplaas op die metodes om energieverbruik, wat spesifiek verband hou met die vervaardiging
van druklug, te verminder. Hierdie metodes kan gekategoriseer word as: metodes wat die
verbruik van druklug verminder; of metodes wat die produksie van druklug meer effektief
maak.
Die studie beoog om hierdie metodes te kombineer om sodoende ‘n geoptimaliseerde
oplossing te bied. Alhoewel hierdie studie industrie in die algemeen insluit, fokus dit op die
Suid-Afrikaanse mynindustrie. Twee myne word gebruik as gevallestudies. Metodes om die
energieverbruik geassosieerd met die verskaffing van druklug te verminder word toegepas op
elke gevallestudie. Gevallestudie 1 het slegs toegelaat dat beperkte beheer op die
druklugstelsel toegepas kon word. In Gevallestudie 2 was totale geïntegreerde beheer
toegepas. Energieverbruik van kompressors was onderskeidelik verminder met 18.9% en
42.9%.
Resultate wys dat die besparing verdubbel kan word deur die energieverbruik van
druklugstelstels te verminder deur verskillende metodes toe te pas. Dit vereis egter dat elke
gedeelte van die druklugstelsel deurlopend gemonitor, en beheer kan word.
Die studie word ingeperk deurdat besparings slegs verkry kan word deur die aanpassing van
die druklugstelsel. Verdere besparings kan verkry word deur personeel op te lei, produksie
aktiwiteits skedules te verander, en ‘n sisteem in plek te sit wat luglekke uitwys.
Sleutel woorde: Druklug, lugnetwerk optimisering, DSM, energiebesparings, druklug op myne.
Integrating various energy saving initiatives on compressed air systems of typical South African gold mines
Page IV
Table of Contents
List of Figures ................................................................................................................................. v
List of Tables ................................................................................................................................ viii
List of Units.................................................................................................................................... ix
List of Symbols ............................................................................................................................... x
List of Abbreviations ..................................................................................................................... xi
General Terminology .................................................................................................................... xii
1 Introduction ............................................................................................................................ 1
1.1 Background .................................................................................................................... 1 1.2 Energy usage in industry and the mining environment ................................................. 2 1.3 Compressed air usage in industry .................................................................................. 3 1.4 Present methods of reducing energy required to produce compressed air ................. 4 1.5 Objectives and problem statement ............................................................................... 8 1.6 Overview of this document ............................................................................................ 8
2 Developing an integrated solution ......................................................................................... 9
2.1 Introduction ................................................................................................................... 9 2.2 Calculating compressed air usage .................................................................................. 9 2.3 Electrical power required to produce compressed air ................................................18 2.4 Optimising a mine compressed air network ................................................................21 2.5 Calculating the energy savings of these initiatives ......................................................24 2.6 Conclusion ....................................................................................................................25
3 Case Study 1: Limited application of energy savings initiatives ...........................................27
3.1 General introduction to case studies ...........................................................................27 3.2 Introduction to the case study .....................................................................................28 3.3 First-off Investigation – Overview of compressed air network....................................30 3.4 Proposal – Demand optimisation and equipment selection .......................................39 3.5 Results ..........................................................................................................................46 3.6 Conclusion ....................................................................................................................47
4 Case Study 2: Integrating various energy saving initiatives .................................................49
4.1 Introduction .................................................................................................................49 4.2 First-off Investigation – Overview of compressed air network....................................49 4.3 Proposal – Demand optimisation and equipment selection .......................................60 4.4 Results ..........................................................................................................................69 4.5 Conclusion ....................................................................................................................74
5 Conclusion and recommendations .......................................................................................75
5.1 Conclusion ....................................................................................................................75 5.2 Limits of this study and recommendations for future work ........................................78
Bibliography .................................................................................................................................80
Appendix A - Calculations ............................................................................................................83
A.1 Calculations related to Section 2 .................................................................................83 A.2 Calculations of correction factors related to case study 2...........................................90
Integrating various energy saving initiatives on compressed air systems of typical South African gold mines
Page V
List of Figures
Figure 1.1 – Electrical energy supply and demand of South Africa. ............................................. 1
Figure 1.2 – Eskom electrical energy reserve supply. ................................................................... 1
Figure 1.3 – Eskom average electricity price history. ................................................................... 2
Figure 1.4 – Eskom electricity sales for year ended 31 March 2011. ........................................... 3
Figure 1.5 – Typical compressed air network. .............................................................................. 3
Figure 1.6 – Cost of energy delivery methods. ............................................................................. 4
Figure 1.7 – Common compressed air network layouts. .............................................................. 6
Figure 1.8 – Energy usage and cost of compressed air network configurations
for a manufacturing plant. ............................................................................................................ 7
Figure 2.1 – Typical pneumatic cylinder operations in the mining environment. ...................... 10
Figure 2.2 – Typical pneumatic valve actuator setup. ................................................................ 11
Figure 2.3 – Air consumption of a pneumatic cylinder. .............................................................. 11
Figure 2.4 – Pneumatic loaders used underground. ................................................................... 12
Figure 2.5 – Typical hand-held rock drill. .................................................................................... 12
Figure 2.6 – Flow through a diameter 50 mm nozzle. ................................................................ 13
Figure 2.7 – Calculated pressure loss due to pipe friction for air at 600 kPa
absolute pressure through pipes with internal diameter 10 – 40 mm. ...................................... 14
Figure 2.8 – Calculated pressure loss due to pipe friction for air at 600 kPa
absolute pressure through pipes with internal diameter 50 – 100 mm. .................................... 14
Figure 2.9 – Calculated pressure drop due to pipe friction for air at 600 kPa
absolute pressure through pipes with internal diameter 150 – 450 mm. .................................. 14
Figure 2.10 – Calculated pressure loss due to pipe friction for airflow through a
500 mm internal diameter pipe. ................................................................................................. 15
Figure 2.11 – Pressure loss due to friction as a function of pipe roughness for
air compressed to 500 kPa. ......................................................................................................... 16
Figure 2.12 – Pressure loss due to friction as a function of pipe flow rate for air
compressed at 600kPa absolute pressure. ................................................................................. 16
Figure 2.13 – Typical unmaintained piping sections. .................................................................. 17
Figure 2.14 – Air losses as a function of hole diameter smaller than 60 mm. ............................ 18
Figure 2.15 – Air losses as a function of hole diameter smaller than 25 mm. ............................ 18
Figure 2.16 – Estimated electrical power required to compress air from
atmospheric conditions............................................................................................................... 19
Figure 2.17 – Estimated power required to produce compressed air at 3.34
kg/s compared to actual data. .................................................................................................... 19
Figure 2.18 – Electrical power saved per 1000 m3/h normalised airflow
reduced. ...................................................................................................................................... 24
Integrating various energy saving initiatives on compressed air systems of typical South African gold mines
Page VI
Figure 2.19 – Electrical power saved by reducing final supply pressure. ................................... 25
Figure 3.1 – Case Study 1: Schematic surface layout. ................................................................. 29
Figure 3.2 – Case Study 1: Typical compressor installation. ....................................................... 30
Figure 3.3 – Case Study 1: Valves installed on surface before implementation of
optimisation methods. ................................................................................................................ 31
Figure 3.4 – Case Study 1: Underground layout before implementation of
optimisation methods. ................................................................................................................ 33
Figure 3.5 – Case Study 1: Typical underground control valve setup. ........................................ 34
Figure 3.6 – Case Study 1: Shaft #1 compressed air pressure requirement on
surface. ........................................................................................................................................ 35
Figure 3.7 – Case Study 1: Shaft #1 normalised compressed airflow
requirements. .............................................................................................................................. 36
Figure 3.8 – Case Study 1: Total compressed airflow requirement. ........................................... 37
Figure 3.9 – Case Study 1: Minimum and maximum power requirement. ................................. 38
Figure 3.10 – Case Study 1: Power consumption during July 2009 – end
September 2009. ......................................................................................................................... 39
Figure 3.11 – Case Study 1: Proposed installations. ................................................................... 42
Figure 3.12 – Case Study 1: Surface layout after optimisation methods are
applied. ........................................................................................................................................ 43
Figure 3.13 – Case Study 1: Accumulated expected power usage and saving
profiles. ....................................................................................................................................... 45
Figure 3.14 – Case Study 1: Estimated average daily power usage, minimum
saving and possible additional savings........................................................................................ 45
Figure 3.15 – Case Study 1: Power demand of compressors during
implementation of saving interventions. .................................................................................... 46
Figure 3.16 – Case Study 1: Power profiles. ............................................................................... 47
Figure 4.1 - Case Study 2: Surface site layout before project implementation. ......................... 50
Figure 4.2 – Case Study 2: Valves installed on surface at 1# compressor house. ....................... 52
Figure 4.3 – Case Study 2: Underground layout before project implementation. ..................... 53
Figure 4.4 – Case Study 2: Shaft #1 and Shaft #2 compressed air pressure
requirement on surface. ............................................................................................................. 55
Figure 4.5 – Case Study2: Shaft #1 and Shaft #2 compressed air normalised
flow requirements. ...................................................................................................................... 56
Figure 4.6 – Case Study 2: Minimum and maximum compressed air pressure
required on surface. .................................................................................................................... 57
Figure 4.7 – Case Study 2: Total compressed airflow requirement. ........................................... 58
Figure 4.8 – Case study 2: Minimum and maximum power requirement. ................................. 58
Figure 4.9 – Case Study 2: Pressure supplied from 01 January 2009 – 31 March
2009. ........................................................................................................................................... 59
Figure 4.10 – Case Study 2: Compressed airflow supplied from 01 January 2009
– 31 March 2009. ........................................................................................................................ 59
Integrating various energy saving initiatives on compressed air systems of typical South African gold mines
Page VII
Figure 4.11 – Case Study 2: Power consumption during January 2009 – March
2009. ........................................................................................................................................... 60
Figure 4.12 – Case Study 2: Average compressed air pressure supplied during
January 2009 – March 2009. ....................................................................................................... 62
Figure 4.13 - Case Study 2: Underground control valve setup. .................................................. 63
Figure 4.14 – Case Study 2: Average flow requirement and supply to Shaft #1
and Shaft #2 combined from 01 January 2009 to 31 March 2009. ............................................ 63
Figure 4.15 - Case Study 2: Control valves installed on surface. ................................................. 65
Figure 4.16 - Case Study 2: Underground installations. .............................................................. 66
Figure 4.17 – Case Study 2: Proposed changes to the surface air network. ............................... 67
Figure 4.18 – Case Study 2: Accumulated expected power usage and saving
profiles for Case Study 1. ............................................................................................................ 68
Figure 4.19 – Case Study 2: Estimated average daily power usage, minimum
saving and possible additional savings........................................................................................ 69
Figure 4.20 – Case Study 2: Breakdown of expected power savings for Case
Study 1. ....................................................................................................................................... 69
Figure 4.21 – Case Study 2: Power usage of compressors during
implementation of saving interventions. .................................................................................... 70
Figure 4.22 – Case Study 2: Power profiles . ............................................................................... 71
Figure 4.23 – Case Study 2: Average surface pressure requirement and supply
to Shaft #1 and Shaft #2 after implementation of all saving initiatives. ..................................... 72
Figure 4.24 – Case Study 2: Average daily airflow consumption of Shaft #1 and
Shaft #2 after implementation of saving interventions. ............................................................. 72
Figure 4.25 – Case Study 2: Average surface pressure requirement and supply
to Shaft #3 and the gold plant after implementation of all saving initiatives. ........................... 73
Figure 4.26 – Case Study 2: Average total flow requirement and supply to Shaft
#3 and the gold plant after implementation of saving initiatives. .............................................. 73
Figure A.1 – Estimated electrical power required to produce compressed air. ......................... 89
Figure A.2 – Estimated power required to produce compressed air compared
to actual data. ............................................................................................................................. 89
Integrating various energy saving initiatives on compressed air systems of typical South African gold mines
Page VIII
List of Tables
Table 2.1 – Typical mining activities conducted in the case studies. ............................................ 9
Table 2.2 – Estimated power required to supply compressed air for general
mining activities and network losses. ......................................................................................... 20
Table 2.3 – Possible replacements for pneumatic equipment. .................................................. 21
Table 2.4 – Methods for reducing energy requirement to produce compressed
air. ............................................................................................................................................... 25
Table 3.1 – Procedure followed for implementation of energy saving initiatives
(case studies). .............................................................................................................................. 27
Table 3.2 – Case Study 1: Ratings of installed compressors. ...................................................... 32
Table 3.3 – Case Study 1: Typical daily mining activity schedule. ............................................... 34
Table 3.4 – Case Study 1: Considering methods for reducing power
requirements of the compressed air network. ........................................................................... 39
Table 4.1 – Case Study 2: Ratings of installed compressors. ...................................................... 51
Table 4.2 – Case Study 2: Typical daily mining activity schedule. ............................................... 54
Table 4.3 – Case Study 2: Considering methods for reducing compressed air
demand. ...................................................................................................................................... 60
Table 5.1 – Comparison of energy saving initiatives. .................................................................. 77
Table A.1 – Typical pipe roughness. ............................................................................................ 85

Integrating various energy saving initiatives on compressed air systems of typical South African gold mines
Page IX
List of Units
Symbol Unit Description
# N/A Denotes a mining shaft, i.e. 3# refers to the Number 3 shaft
$ Dollar Amercican currency
A Ampere Electric current
c Cents South African currency
G Giga Denotes 1x10⁹
h Hour Measure of time. 1h = 60s
J Joule Measure of energy
K Kelvin Measure of absolute temperature
k Kilo Denotes 1x10³
kg Kilogram Measure of weight
M Mega Denotes 1x10⁶
m Metre Metric unit for distance
mm Millimetre Measure of distance (1x10⁻³ m)
N Newton Measure of force
Pa Pascal Measurement for pressure
s Second Measure of time
V Volt Electric potential difference
W Watt Power
Integrating various energy saving initiatives on compressed air systems of typical South African gold mines
Page X
List of Symbols
Symbol Description Unit
Volume flow rate m3/s
Mass flow kg/s
D Diameter m
d Diameter m
e Pipe roughness m
f Friction factor none
g Gravitational acceleration Taken as 9.81 m/s2
h Head or Height m
I Electric current A
k Specific heat ratio none
L Length m
M Mach number none
n Polytropic exponent none
P Power or Pressure W or Pa
R Gas constant kJ/kg-K
Re Reynolds number none
S Stroke length m
T Temperature or Time period K or h or s
t Time h or s
v Velocity m/s
V Volume or Electric potential difference m3 or V
W Power W
μ Viscosity Ns/m2
π Pi none
ρ Density kg/m3
ς Angle Degrees or Radians
Efficiency none

Integrating various energy saving initiatives on compressed air systems of typical South African gold mines
Page XI
List of Abbreviations
Symbol Breakdown
CALDS Compressed Air Leakage Documentation System
CV Control Valve
DME Department of Minerals and Energy
DSM Demand-side Management
EE Energy Efficiency
IGVC Inlet Guide Vane Control
LG Local Generation
M&V Maintenance and Verification
MV Manual Valve
PA Performance Assessment
PG Pressure Gage
PLC Programmable Logic Controller
POU Point of Use
PT Pressure Transmitter
SCADA Supervisory Control and Data Acquisitioning
VSD Variable Speed Drive
WBS Work Breakdown Structure
Integrating various energy saving initiatives on compressed air systems of typical South African gold mines
Page XII
General Terminology
Term Description
Normalised In this study normalised conditions refer to standard atmospheric
conditions:
Absolute air pressure: 101.3 kPa
Air temperature: 20 ⁰C (293.15 K)
Unless otherwise specified flow rate refers to normalised flow
rate.
Compressed Air Pressure This refers to the gage pressure to which air is compressed. Gage
pressure is taken as the difference between the absolute
pressure of compressed air and normalised air pressure.
Local Generation Refers to a type of air network layout. Refer to Figure 1.7.
Point of Use Refers to a type of air network layout. Refer to Figure 1.7.
Inlet Guide Vane Control A control philosophy and system where the inlet guide vanes of
compressors are opened/closed to reduce airflow through the
compressor to enable the compressor to vary the compressed air
supply.
Tramming Transportation of ore by locomotive.
Set Point A control loop will adjust outputs which affect a certain process
variable. The outputs will be adjusted such that the process
variable is changed to the set point.
Integrating various energy saving initiatives on compressed air systems of typical South African gold mines
Page 1
1 Introduction
1.1 Background
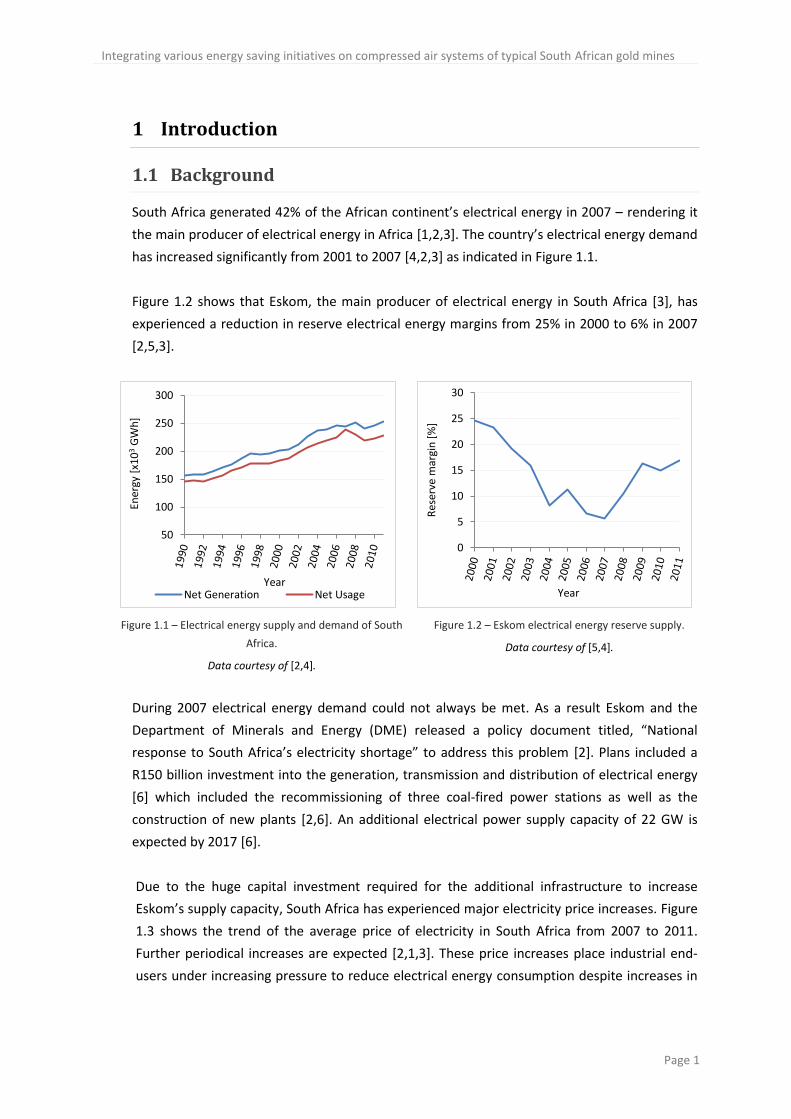
South Africa generated 42% of the African continent’s electrical energy in 2007 – rendering it
the main producer of electrical energy in Africa [1,2,3]. The country’s electrical energy demand
has increased significantly from 2001 to 2007 [4,2,3] as indicated in Figure 1.1.
Figure 1.2 shows that Eskom, the main producer of electrical energy in South Africa [3], has
experienced a reduction in reserve electrical energy margins from 25% in 2000 to 6% in 2007
[2,5,3].
Figure 1.1 – Electrical energy supply and demand of South
Africa.
Data courtesy of [2,4].
Figure 1.2 – Eskom electrical energy reserve supply.
Data courtesy of [5,4].
During 2007 electrical energy demand could not always be met. As a result Eskom and the
Department of Minerals and Energy (DME) released a policy document titled, “National
response to South Africa’s electricity shortage” to address this problem [2]. Plans included a
R150 billion investment into the generation, transmission and distribution of electrical energy
[6] which included the recommissioning of three coal-fired power stations as well as the
construction of new plants [2,6]. An additional electrical power supply capacity of 22 GW is
expected by 2017 [6].
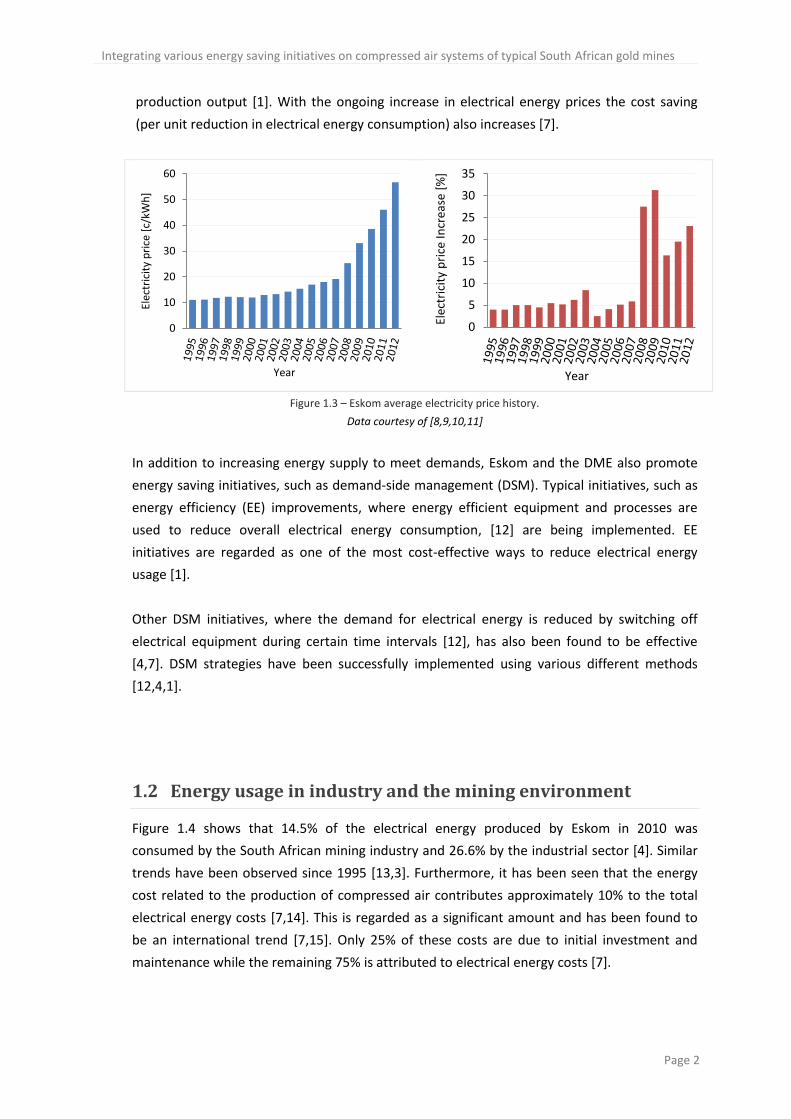
Due to the huge capital investment required for the additional infrastructure to increase
Eskom’s supply capacity, South Africa has experienced major electricity price increases. Figure
1.3 shows the trend of the average price of electricity in South Africa from 2007 to 2011.
Further periodical increases are expected [2,1,3]. These price increases place industrial end-
users under increasing pressure to reduce electrical energy consumption despite increases in
50
100
150
200
250
300
Ener
gy [
x10
3 G
Wh
]
Year Net Generation Net Usage
0
5
10
15
20
25
30
Res
erve
mar
gin
[%
]
Year
Integrating various energy saving initiatives on compressed air systems of typical South African gold mines
Page 2
production output [1]. With the ongoing increase in electrical energy prices the cost saving
(per unit reduction in electrical energy consumption) also increases [7].
Figure 1.3 – Eskom average electricity price history.
Data courtesy of [8,9,10,11]
In addition to increasing energy supply to meet demands, Eskom and the DME also promote
energy saving initiatives, such as demand-side management (DSM). Typical initiatives, such as
energy efficiency (EE) improvements, where energy efficient equipment and processes are
used to reduce overall electrical energy consumption, [12] are being implemented. EE
initiatives are regarded as one of the most cost-effective ways to reduce electrical energy
usage [1].
Other DSM initiatives, where the demand for electrical energy is reduced by switching off
electrical equipment during certain time intervals [12], has also been found to be effective
[4,7]. DSM strategies have been successfully implemented using various different methods
[12,4,1].
1.2 Energy usage in industry and the mining environment
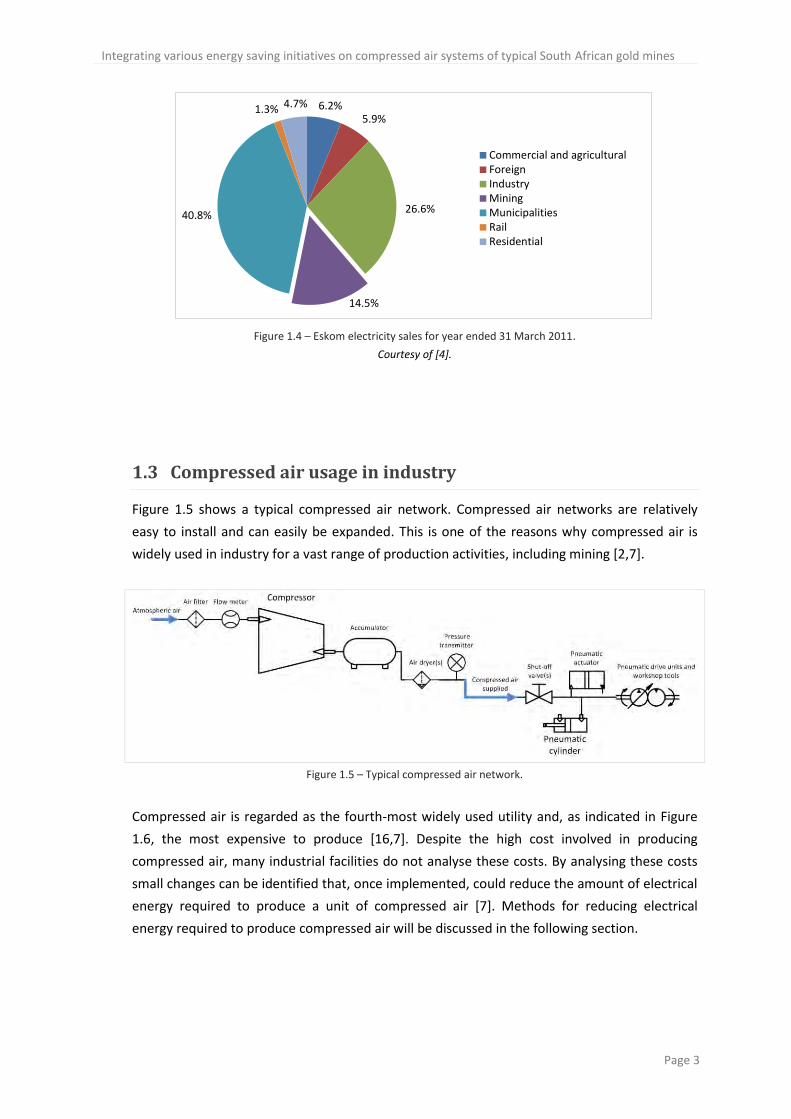
Figure 1.4 shows that 14.5% of the electrical energy produced by Eskom in 2010 was
consumed by the South African mining industry and 26.6% by the industrial sector [4]. Similar
trends have been observed since 1995 [13,3]. Furthermore, it has been seen that the energy
cost related to the production of compressed air contributes approximately 10% to the total
electrical energy costs [7,14]. This is regarded as a significant amount and has been found to
be an international trend [7,15]. Only 25% of these costs are due to initial investment and
maintenance while the remaining 75% is attributed to electrical energy costs [7].
0
10
20
30
40
50
60
Elec
tric
ity
pri
ce [
c/kW
h]
Year
0
5
10
15
20
25
30
35
Elec
tric
ity
pri
ce In
crea
se [
%]
Year
Integrating various energy saving initiatives on compressed air systems of typical South African gold mines
Page 3
Figure 1.4 – Eskom electricity sales for year ended 31 March 2011.
Courtesy of [4].
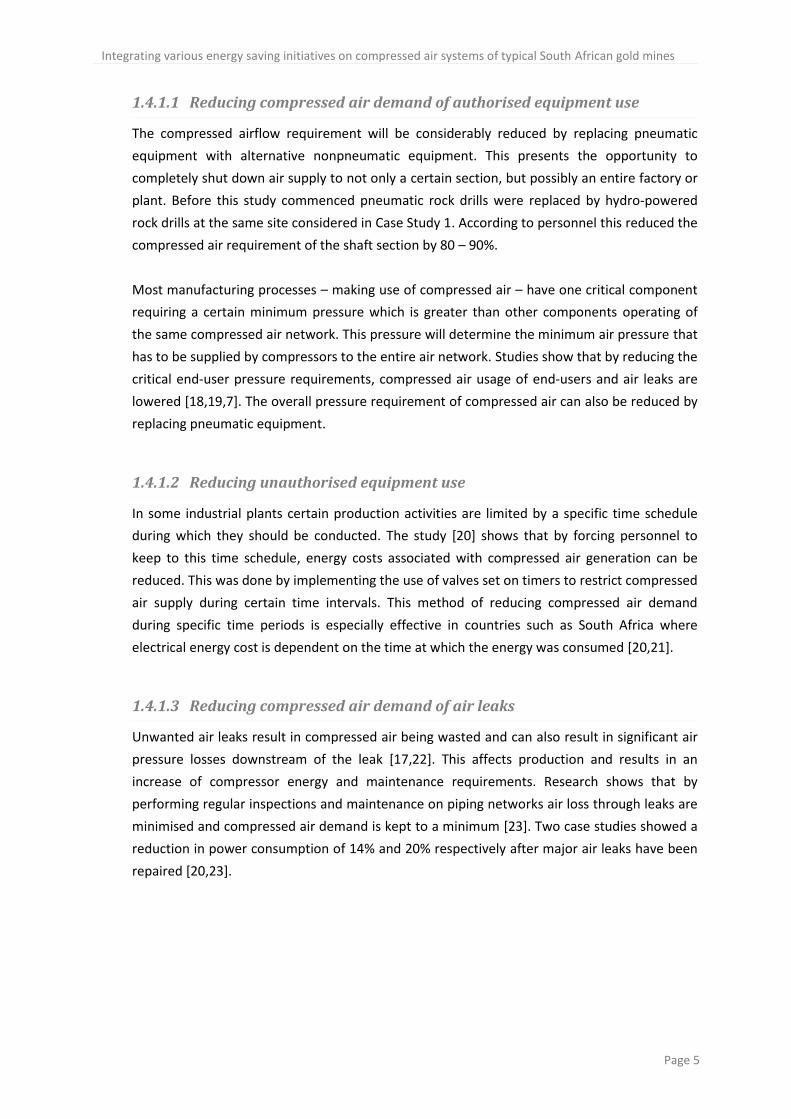
1.3 Compressed air usage in industry
Figure 1.5 shows a typical compressed air network. Compressed air networks are relatively
easy to install and can easily be expanded. This is one of the reasons why compressed air is
widely used in industry for a vast range of production activities, including mining [2,7].
Figure 1.5 – Typical compressed air network.
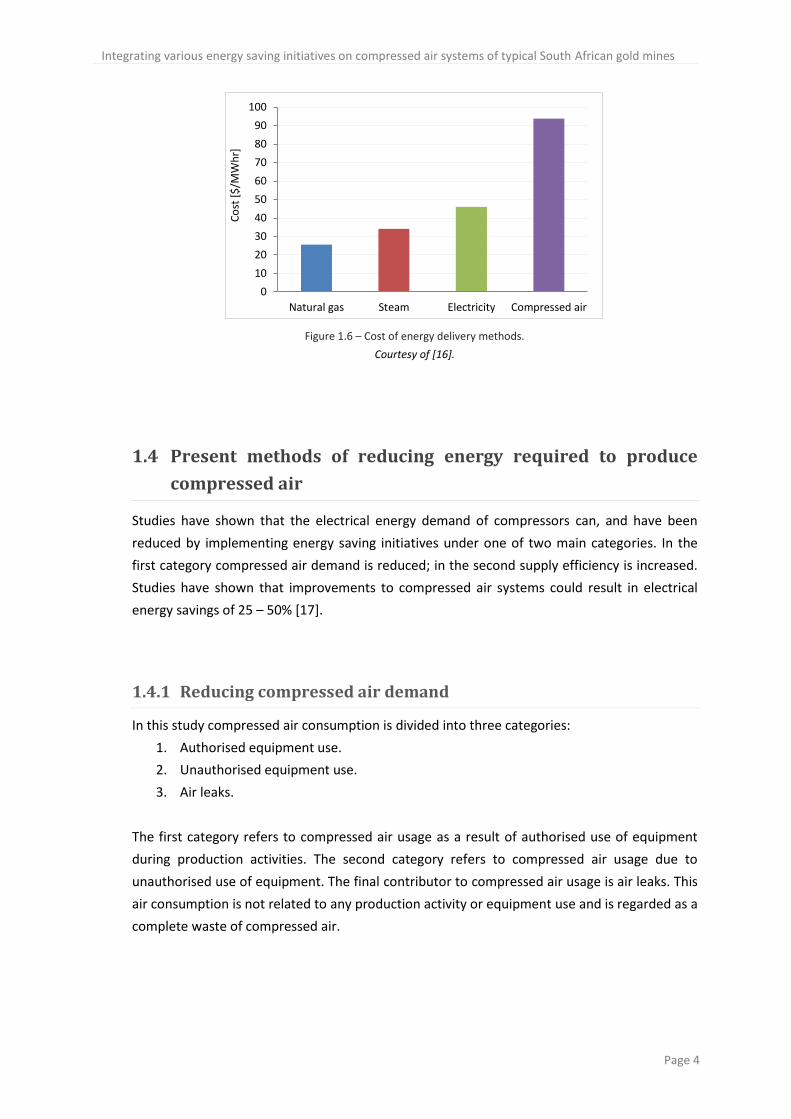
Compressed air is regarded as the fourth-most widely used utility and, as indicated in Figure
1.6, the most expensive to produce [16,7]. Despite the high cost involved in producing
compressed air, many industrial facilities do not analyse these costs. By analysing these costs
small changes can be identified that, once implemented, could reduce the amount of electrical
energy required to produce a unit of compressed air [7]. Methods for reducing electrical
energy required to produce compressed air will be discussed in the following section.
6.2% 5.9%
26.6%
14.5%
40.8%
1.3% 4.7%
Commercial and agriculturalForeignIndustryMiningMunicipalitiesRailResidential
Integrating various energy saving initiatives on compressed air systems of typical South African gold mines
Page 4
Figure 1.6 – Cost of energy delivery methods.
Courtesy of [16].
1.4 Present methods of reducing energy required to produce
compressed air
Studies have shown that the electrical energy demand of compressors can, and have been
reduced by implementing energy saving initiatives under one of two main categories. In the
first category compressed air demand is reduced; in the second supply efficiency is increased.
Studies have shown that improvements to compressed air systems could result in electrical
energy savings of 25 – 50% [17].
1.4.1 Reducing compressed air demand
In this study compressed air consumption is divided into three categories:
1. Authorised equipment use.
2. Unauthorised equipment use.
3. Air leaks.
The first category refers to compressed air usage as a result of authorised use of equipment
during production activities. The second category refers to compressed air usage due to
unauthorised use of equipment. The final contributor to compressed air usage is air leaks. This
air consumption is not related to any production activity or equipment use and is regarded as a
complete waste of compressed air.
0
10
20
30
40
50
60
70
80
90
100
Natural gas Steam Electricity Compressed air
Co
st [
$/M
Wh
r]
Integrating various energy saving initiatives on compressed air systems of typical South African gold mines
Page 5
1.4.1.1 Reducing compressed air demand of authorised equipment use
The compressed airflow requirement will be considerably reduced by replacing pneumatic
equipment with alternative nonpneumatic equipment. This presents the opportunity to
completely shut down air supply to not only a certain section, but possibly an entire factory or
plant. Before this study commenced pneumatic rock drills were replaced by hydro-powered
rock drills at the same site considered in Case Study 1. According to personnel this reduced the
compressed air requirement of the shaft section by 80 – 90%.
Most manufacturing processes – making use of compressed air – have one critical component
requiring a certain minimum pressure which is greater than other components operating of
the same compressed air network. This pressure will determine the minimum air pressure that
has to be supplied by compressors to the entire air network. Studies show that by reducing the
critical end-user pressure requirements, compressed air usage of end-users and air leaks are
lowered [18,19,7]. The overall pressure requirement of compressed air can also be reduced by
replacing pneumatic equipment.
1.4.1.2 Reducing unauthorised equipment use
In some industrial plants certain production activities are limited by a specific time schedule
during which they should be conducted. The study [20] shows that by forcing personnel to
keep to this time schedule, energy costs associated with compressed air generation can be
reduced. This was done by implementing the use of valves set on timers to restrict compressed
air supply during certain time intervals. This method of reducing compressed air demand
during specific time periods is especially effective in countries such as South Africa where
electrical energy cost is dependent on the time at which the energy was consumed [20,21].
1.4.1.3 Reducing compressed air demand of air leaks
Unwanted air leaks result in compressed air being wasted and can also result in significant air
pressure losses downstream of the leak [17,22]. This affects production and results in an
increase of compressor energy and maintenance requirements. Research shows that by
performing regular inspections and maintenance on piping networks air loss through leaks are
minimised and compressed air demand is kept to a minimum [23]. Two case studies showed a
reduction in power consumption of 14% and 20% respectively after major air leaks have been
repaired [20,23].
Integrating various energy saving initiatives on compressed air systems of typical South African gold mines
Page 6
1.4.2 Increasing the efficiency of compressed air supply
Two of the major factors that contribute to the cost of producing compressed air are the type
of compressor control and compressor sizing [7]. Inefficient and oversized compressors were
found to have the highest annual operating cost per unit compressed air produced [24,7,25].
For this reason EE projects have been implemented on compressed air networks in order to
reduce costs.
Improvements include coordinating and synchronising supply with demand by correctly sizing
compressors and switching off compressors when demand is reduced. Other methods include:
reducing average air inlet temperature to the compressor; using high-efficiency motors; and
using an aftercooler [7,26].
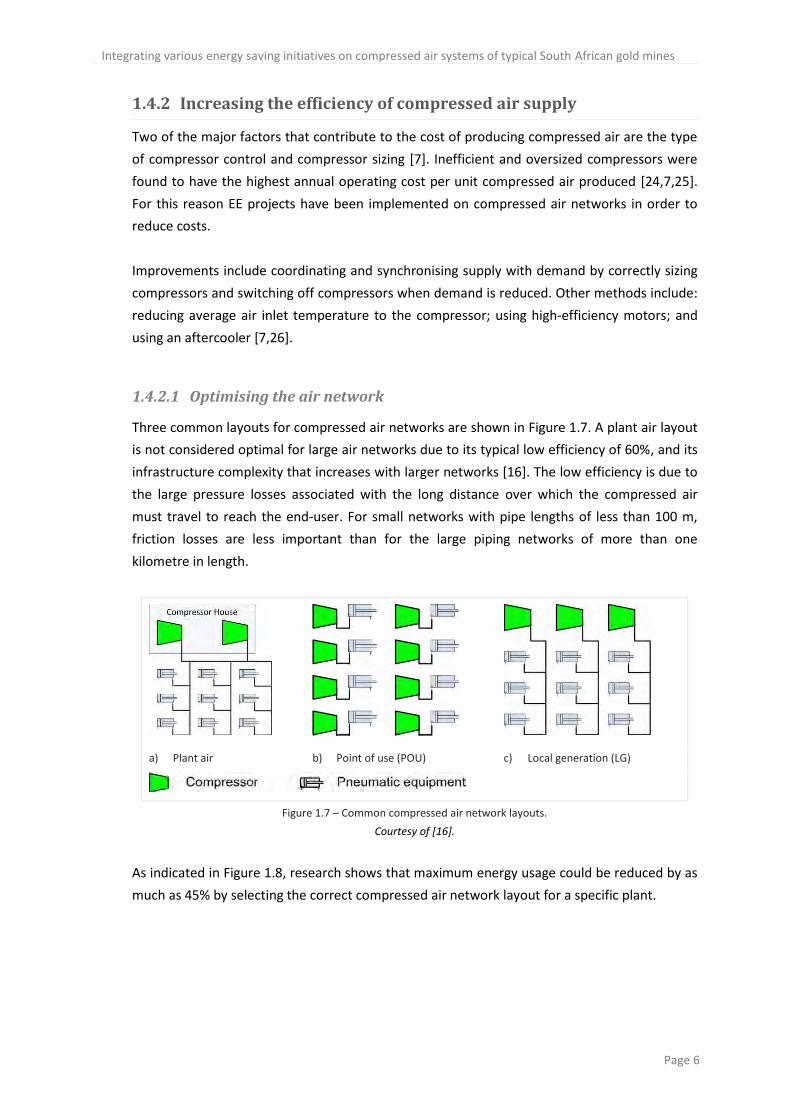
1.4.2.1 Optimising the air network
Three common layouts for compressed air networks are shown in Figure 1.7. A plant air layout
is not considered optimal for large air networks due to its typical low efficiency of 60%, and its
infrastructure complexity that increases with larger networks [16]. The low efficiency is due to
the large pressure losses associated with the long distance over which the compressed air
must travel to reach the end-user. For small networks with pipe lengths of less than 100 m,
friction losses are less important than for the large piping networks of more than one
kilometre in length.
a) Plant air b) Point of use (POU) c) Local generation (LG)
Figure 1.7 – Common compressed air network layouts.
Courtesy of [16].
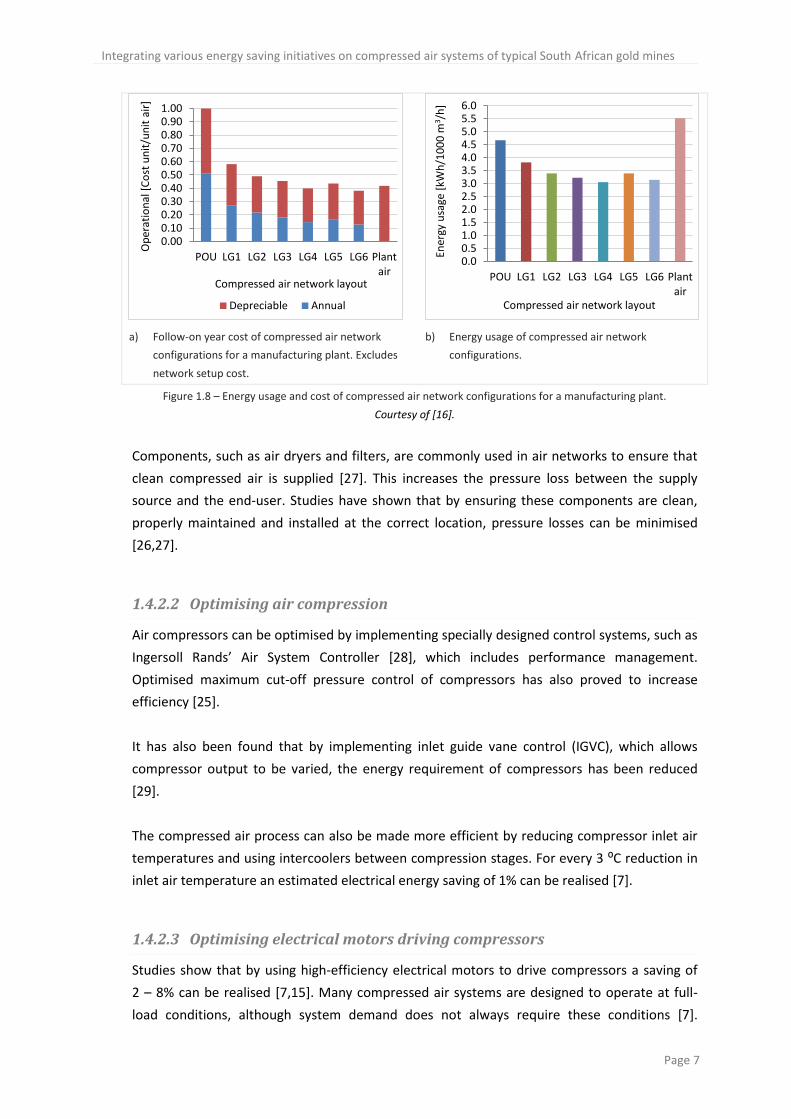
As indicated in Figure 1.8, research shows that maximum energy usage could be reduced by as
much as 45% by selecting the correct compressed air network layout for a specific plant.
Integrating various energy saving initiatives on compressed air systems of typical South African gold mines
Page 7
a) Follow-on year cost of compressed air network
configurations for a manufacturing plant. Excludes
network setup cost.
b) Energy usage of compressed air network
configurations.
Figure 1.8 – Energy usage and cost of compressed air network configurations for a manufacturing plant.
Courtesy of [16].
Components, such as air dryers and filters, are commonly used in air networks to ensure that
clean compressed air is supplied [27]. This increases the pressure loss between the supply
source and the end-user. Studies have shown that by ensuring these components are clean,
properly maintained and installed at the correct location, pressure losses can be minimised
[26,27].
1.4.2.2 Optimising air compression
Air compressors can be optimised by implementing specially designed control systems, such as
Ingersoll Rands’ Air System Controller [28], which includes performance management.
Optimised maximum cut-off pressure control of compressors has also proved to increase
efficiency [25].
It has also been found that by implementing inlet guide vane control (IGVC), which allows
compressor output to be varied, the energy requirement of compressors has been reduced
[29].
The compressed air process can also be made more efficient by reducing compressor inlet air
temperatures and using intercoolers between compression stages. For every 3 ⁰C reduction in
inlet air temperature an estimated electrical energy saving of 1% can be realised [7].
1.4.2.3 Optimising electrical motors driving compressors
Studies show that by using high-efficiency electrical motors to drive compressors a saving of
2 – 8% can be realised [7,15]. Many compressed air systems are designed to operate at full-
load conditions, although system demand does not always require these conditions [7].
0.000.100.200.300.400.500.600.700.800.901.00
POU LG1 LG2 LG3 LG4 LG5 LG6 Plantair
Op
erat
ion
al [
Co
st u
nit
/un
it a
ir]
Compressed air network layout
Depreciable Annual
0.00.51.01.52.02.53.03.54.04.55.05.56.0
POU LG1 LG2 LG3 LG4 LG5 LG6 Plantair
Ener
gy u
sage
[kW
h/1
00
0 m
3 /h
]
Compressed air network layout
Integrating various energy saving initiatives on compressed air systems of typical South African gold mines
Page 8
By making use of a variable speed drive (VSD) the speed of an electric motor can be regulated
to match actual load conditions [7,30,31] which will reduce energy consumption of the
relevant motor. The benefit of using a VSD to regulate the motor speed increases with an
increase in the motor’s rating, however costs also increase. For large motors (more than one
megawatt) this cost renders the use of VSDs unfeasible.
1.5 Objectives and problem statement
With the ongoing increase in electrical energy prices it becomes essential for end-users to
reduce their energy demand. This not only applies to domestic households, but is vital for the
survival of industrial, manufacturing and mining institutions.
The objective of this study is to investigate and combine methods for reducing electrical
energy usage by improving on, and optimising the use of compressed air. The study will focus
on the mining industry where large compressed air networks, consisting of several kilometres
of piping, are installed. The aim is to provide a solution where existing methods are combined
into a single integrated cost-saving solution.
1.6 Overview of this document
In Chapter 1 an overview of energy usage in industrial sectors is shown. Studies have shown
that 14.5% of overall electrical energy produced is consumed by the mining sector.
Furthermore, 10% of this energy is consumed by air compressors. Several methods of reducing
compressed air usage in general have also been reviewed.
The study will continue in Chapter 2 by investigating compressed air usage in the mining
environment and estimating related electrical energy costs. Methods for reducing compressed
air usage in the mining environment will be further investigated and proposed in Section 2.4.
Electrical energy savings obtained by the proposed methods are then approximated in
Section 2.5.
In Chapter 3 and Chapter 4 a selection of proposed compressed air saving methods is applied
to two case studies. The study is concluded in Chapter 5 by briefly reviewing the proposed
solutions, results, applications in industrial sectors, limits of this study and presenting
recommendations for future studies.
Integrating various energy saving initiatives on compressed air systems of typical South African gold mines
Page 9
2 Developing an integrated solution
2.1 Introduction
In order to develop an integrated solution, parameters affecting the electrical power
requirement of a compressed air system must first be identified and their effect on the system
determined. The parameters include: the system compressed air demand; and the efficiency at
which compressed air is delivered. These parameters are in turn determined by additional
secondary parameters which will be analysed further in this chapter.
After quantifying the effects of these secondary parameters, methods to reduce electrical
power requirements of a typical mine compressed air network are proposed. These methods
are analysed further to estimate and quantify their respective effects on the electrical power
requirement of an air network. Some of the proposed methods have been implemented in
case studies which are discussed in Chapter 3 and Chapter 4.
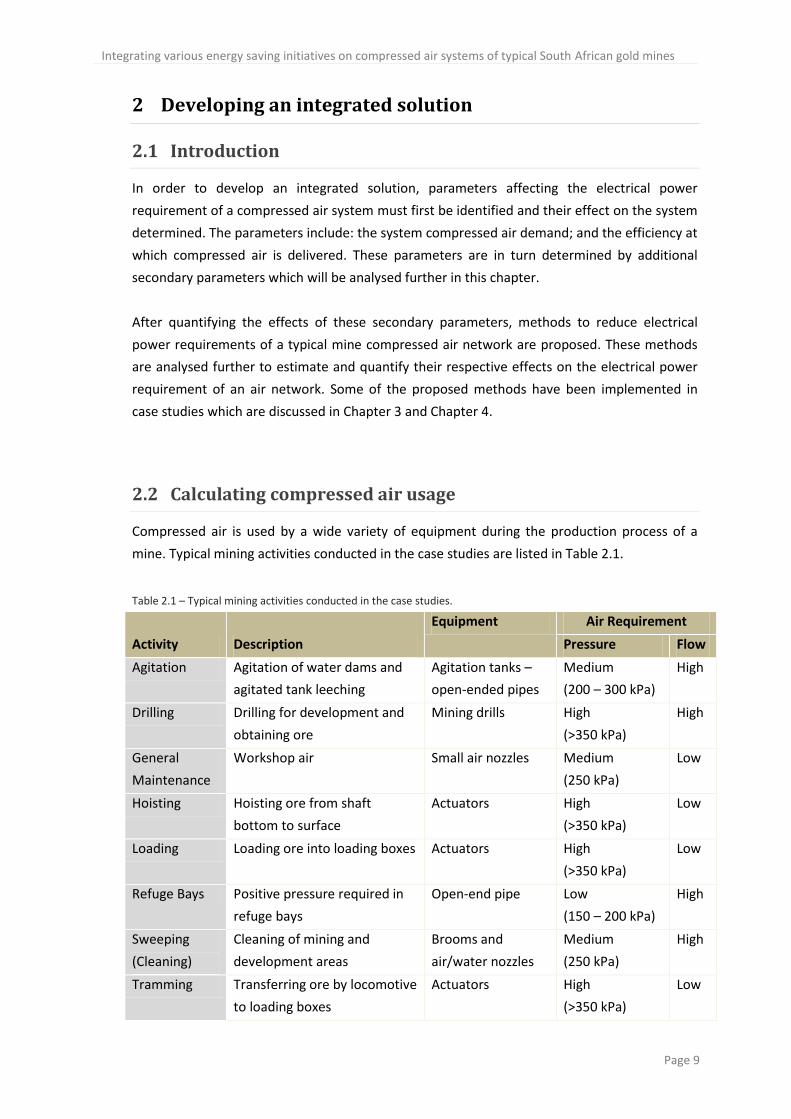
2.2 Calculating compressed air usage
Compressed air is used by a wide variety of equipment during the production process of a
mine. Typical mining activities conducted in the case studies are listed in Table 2.1.
Table 2.1 – Typical mining activities conducted in the case studies.
Activity Description
Equipment Air Requirement
Pressure Flow
Agitation Agitation of water dams and
agitated tank leeching
Agitation tanks –
open-ended pipes
Medium
(200 – 300 kPa)
High
Drilling Drilling for development and
obtaining ore
Mining drills High
(>350 kPa)
High
General
Maintenance
Workshop air Small air nozzles Medium
(250 kPa)
Low
Hoisting Hoisting ore from shaft
bottom to surface
Actuators High
(>350 kPa)
Low
Loading Loading ore into loading boxes Actuators High
(>350 kPa)
Low
Refuge Bays Positive pressure required in
refuge bays
Open-end pipe Low
(150 – 200 kPa)
High
Sweeping
(Cleaning)
Cleaning of mining and
development areas
Brooms and
air/water nozzles
Medium
(250 kPa)
High
Tramming Transferring ore by locomotive
to loading boxes
Actuators High
(>350 kPa)
Low
Integrating various energy saving initiatives on compressed air systems of typical South African gold mines
Page 10
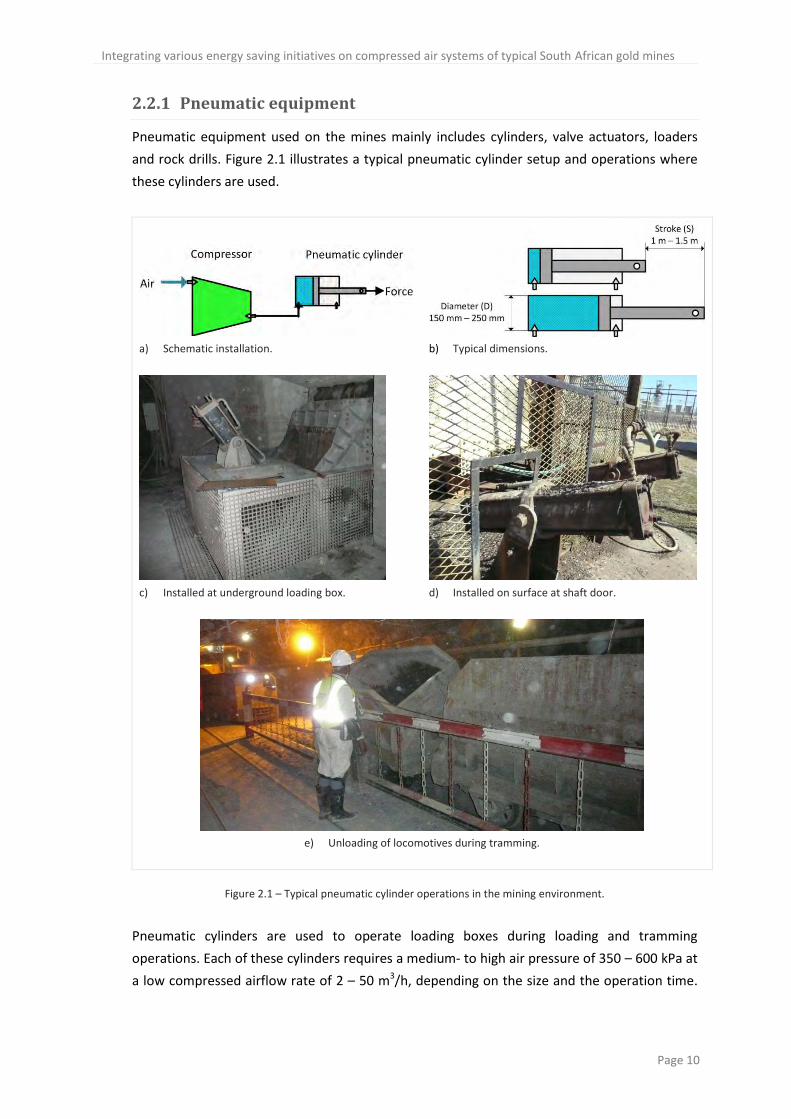
2.2.1 Pneumatic equipment
Pneumatic equipment used on the mines mainly includes cylinders, valve actuators, loaders
and rock drills. Figure 2.1 illustrates a typical pneumatic cylinder setup and operations where
these cylinders are used.
a) Schematic installation. b) Typical dimensions.
c) Installed at underground loading box.
d) Installed on surface at shaft door.
e) Unloading of locomotives during tramming.
Figure 2.1 – Typical pneumatic cylinder operations in the mining environment.
Pneumatic cylinders are used to operate loading boxes during loading and tramming
operations. Each of these cylinders requires a medium- to high air pressure of 350 – 600 kPa at
a low compressed airflow rate of 2 – 50 m3/h, depending on the size and the operation time.
Integrating various energy saving initiatives on compressed air systems of typical South African gold mines
Page 11
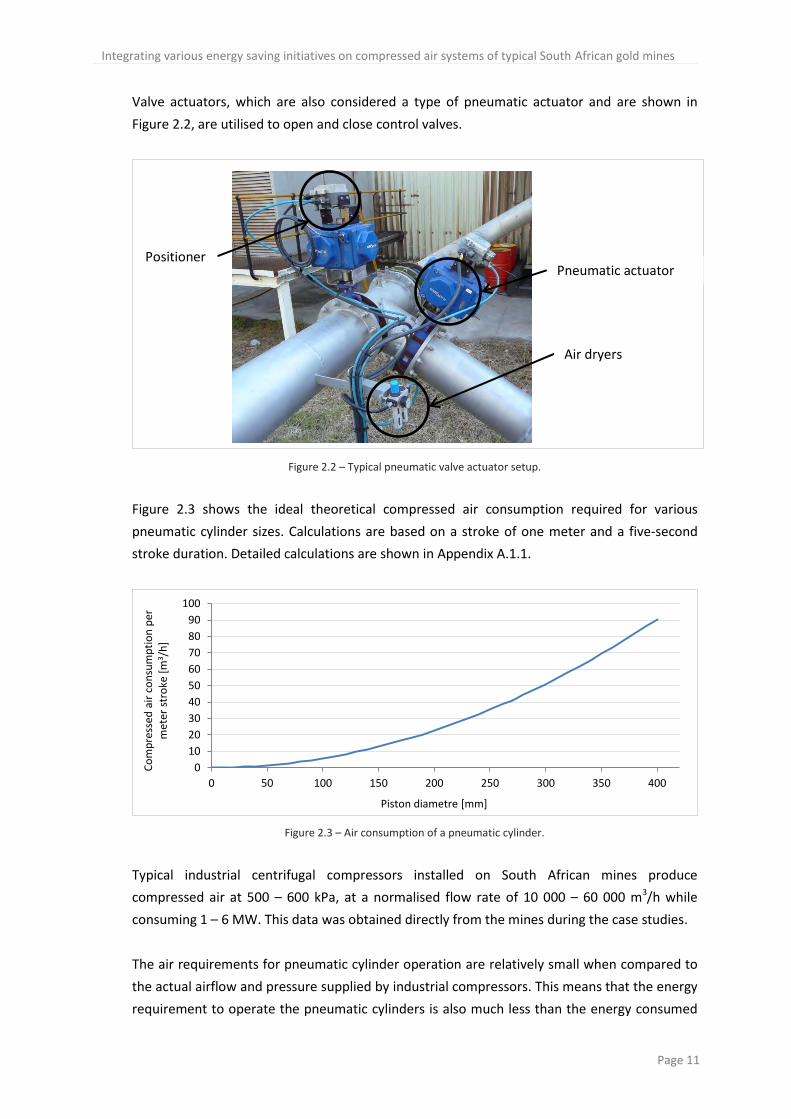
Valve actuators, which are also considered a type of pneumatic actuator and are shown in
Figure 2.2, are utilised to open and close control valves.
Figure 2.2 – Typical pneumatic valve actuator setup.
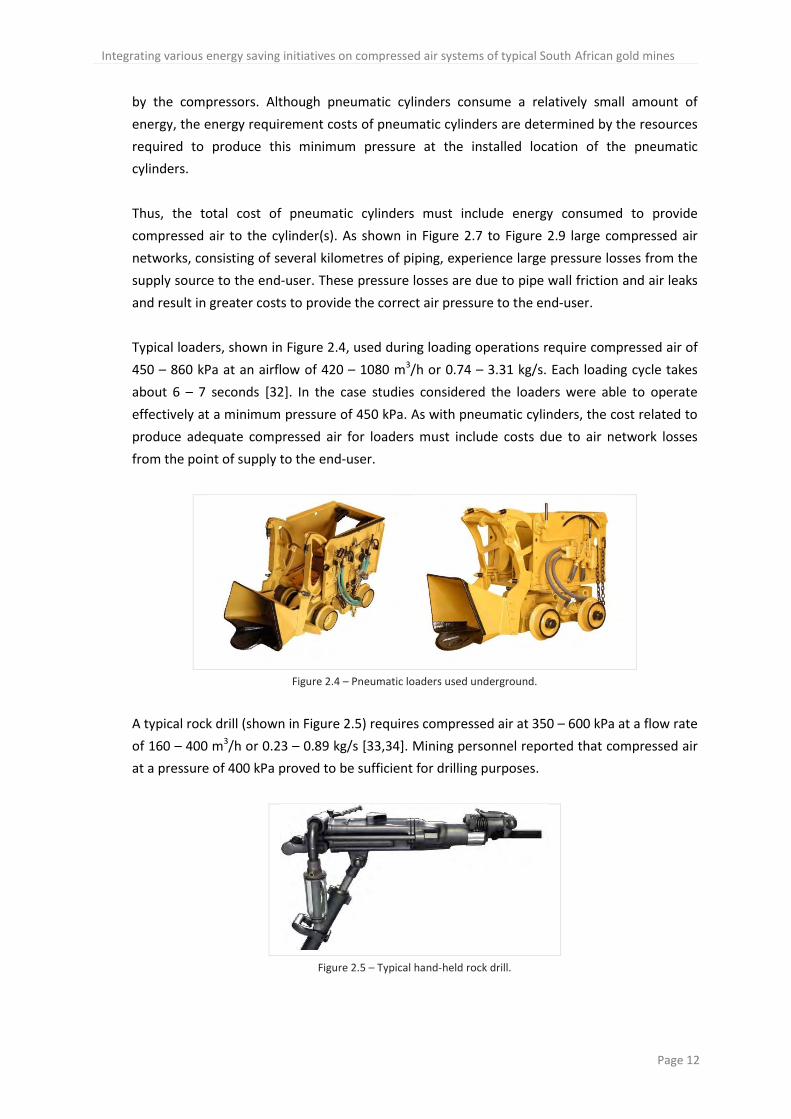
Figure 2.3 shows the ideal theoretical compressed air consumption required for various
pneumatic cylinder sizes. Calculations are based on a stroke of one meter and a five-second
stroke duration. Detailed calculations are shown in Appendix A.1.1.
Figure 2.3 – Air consumption of a pneumatic cylinder.
Typical industrial centrifugal compressors installed on South African mines produce
compressed air at 500 – 600 kPa, at a normalised flow rate of 10 000 – 60 000 m3/h while
consuming 1 – 6 MW. This data was obtained directly from the mines during the case studies.
The air requirements for pneumatic cylinder operation are relatively small when compared to
the actual airflow and pressure supplied by industrial compressors. This means that the energy
requirement to operate the pneumatic cylinders is also much less than the energy consumed
0
10
20
30
40
50
60
70
80
90
100
0 50 100 150 200 250 300 350 400
Co
mp
ress
ed a
ir c
on
sum
pti
on
per
m
eter
str
oke
[m
3 /h
]
Piston diametre [mm]
Pneumatic actuator Positioner
Air dryers
Integrating various energy saving initiatives on compressed air systems of typical South African gold mines
Page 12
by the compressors. Although pneumatic cylinders consume a relatively small amount of
energy, the energy requirement costs of pneumatic cylinders are determined by the resources
required to produce this minimum pressure at the installed location of the pneumatic
cylinders.
Thus, the total cost of pneumatic cylinders must include energy consumed to provide
compressed air to the cylinder(s). As shown in Figure 2.7 to Figure 2.9 large compressed air
networks, consisting of several kilometres of piping, experience large pressure losses from the
supply source to the end-user. These pressure losses are due to pipe wall friction and air leaks
and result in greater costs to provide the correct air pressure to the end-user.
Typical loaders, shown in Figure 2.4, used during loading operations require compressed air of
450 – 860 kPa at an airflow of 420 – 1080 m3/h or 0.74 – 3.31 kg/s. Each loading cycle takes
about 6 – 7 seconds [32]. In the case studies considered the loaders were able to operate
effectively at a minimum pressure of 450 kPa. As with pneumatic cylinders, the cost related to
produce adequate compressed air for loaders must include costs due to air network losses
from the point of supply to the end-user.
Figure 2.4 – Pneumatic loaders used underground.
A typical rock drill (shown in Figure 2.5) requires compressed air at 350 – 600 kPa at a flow rate
of 160 – 400 m3/h or 0.23 – 0.89 kg/s [33,34]. Mining personnel reported that compressed air
at a pressure of 400 kPa proved to be sufficient for drilling purposes.
Figure 2.5 – Typical hand-held rock drill.
Integrating various energy saving initiatives on compressed air systems of typical South African gold mines
Page 13
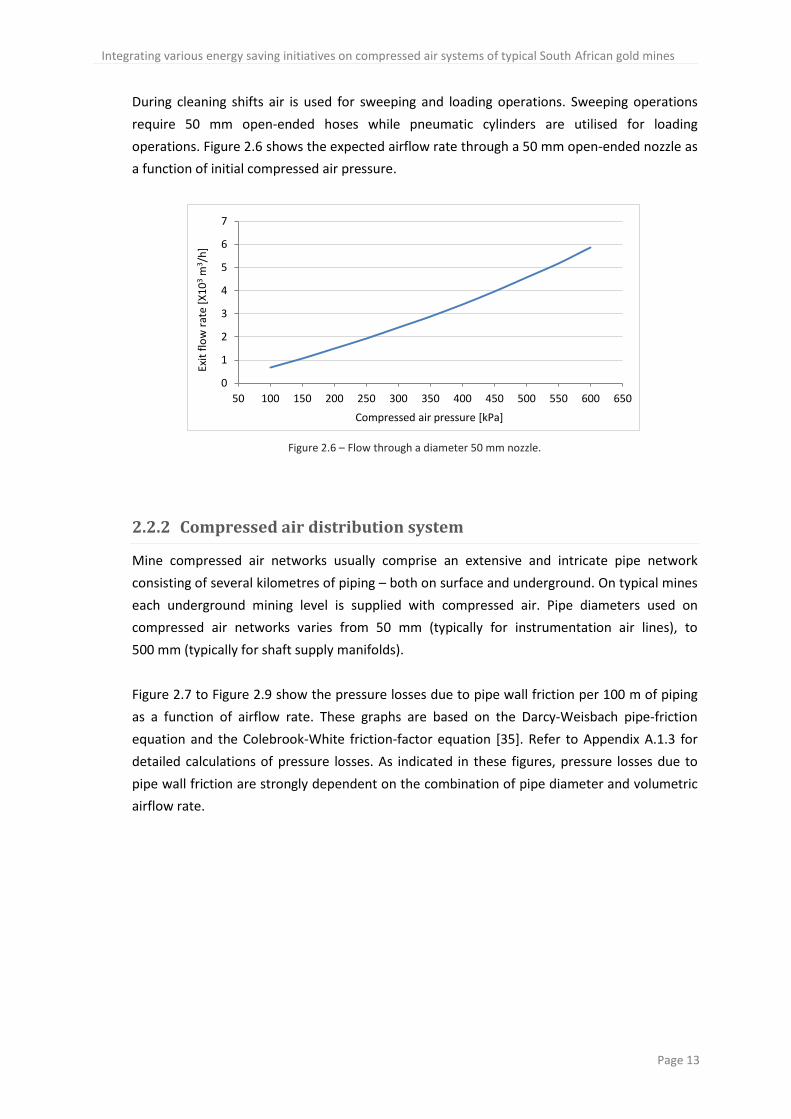
During cleaning shifts air is used for sweeping and loading operations. Sweeping operations
require 50 mm open-ended hoses while pneumatic cylinders are utilised for loading
operations. Figure 2.6 shows the expected airflow rate through a 50 mm open-ended nozzle as
a function of initial compressed air pressure.
Figure 2.6 – Flow through a diameter 50 mm nozzle.
2.2.2 Compressed air distribution system
Mine compressed air networks usually comprise an extensive and intricate pipe network
consisting of several kilometres of piping – both on surface and underground. On typical mines
each underground mining level is supplied with compressed air. Pipe diameters used on
compressed air networks varies from 50 mm (typically for instrumentation air lines), to
500 mm (typically for shaft supply manifolds).
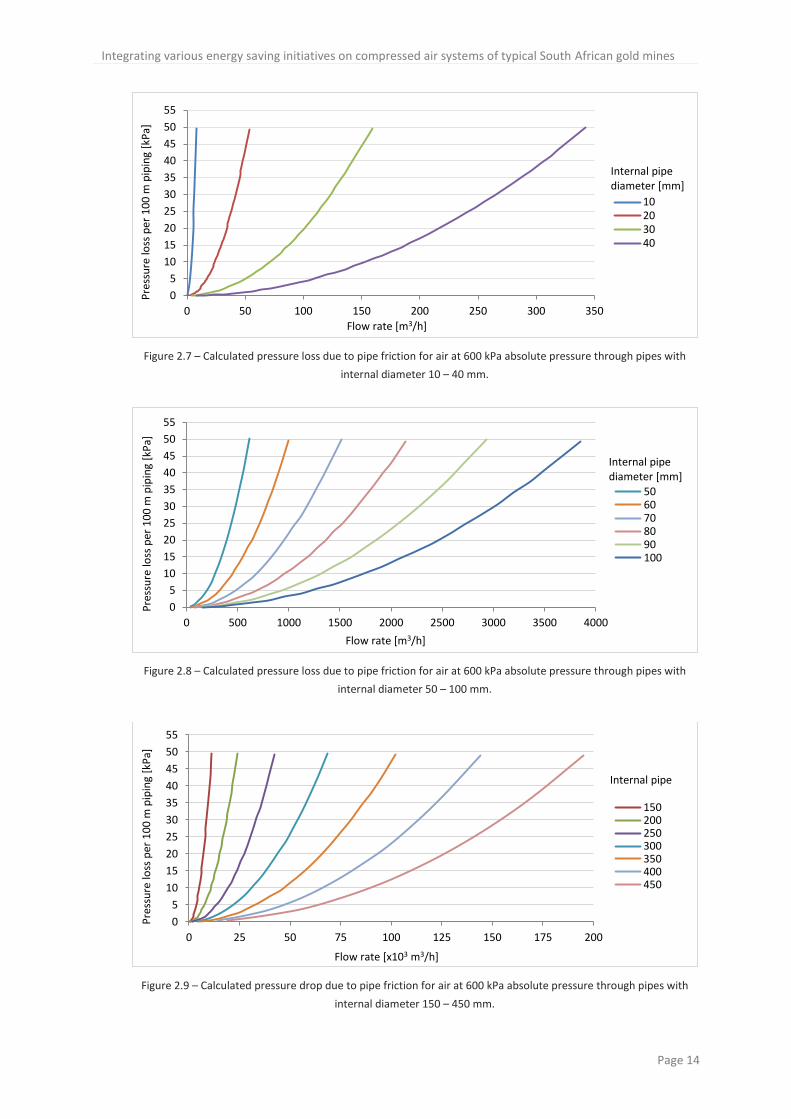
Figure 2.7 to Figure 2.9 show the pressure losses due to pipe wall friction per 100 m of piping
as a function of airflow rate. These graphs are based on the Darcy-Weisbach pipe-friction
equation and the Colebrook-White friction-factor equation [35]. Refer to Appendix A.1.3 for
detailed calculations of pressure losses. As indicated in these figures, pressure losses due to
pipe wall friction are strongly dependent on the combination of pipe diameter and volumetric
airflow rate.
0
1
2
3
4
5
6
7
50 100 150 200 250 300 350 400 450 500 550 600 650
Exit
flo
w r
ate
[X1
03
m3 /
h]
Compressed air pressure [kPa]
Integrating various energy saving initiatives on compressed air systems of typical South African gold mines
Page 14
Figure 2.7 – Calculated pressure loss due to pipe friction for air at 600 kPa absolute pressure through pipes with
internal diameter 10 – 40 mm.
Figure 2.8 – Calculated pressure loss due to pipe friction for air at 600 kPa absolute pressure through pipes with
internal diameter 50 – 100 mm.
Figure 2.9 – Calculated pressure drop due to pipe friction for air at 600 kPa absolute pressure through pipes with
internal diameter 150 – 450 mm.
0
5
10
15
20
25
30
35
40
45
50
55
0 50 100 150 200 250 300 350
Pre
ssu
re lo
ss p
er 1
00
m p
ipin
g [k
Pa]
Flow rate [m3/h]
10203040
Internal pipe diameter [mm]
0
5
10
15
20
25
30
35
40
45
50
55
0 500 1000 1500 2000 2500 3000 3500 4000
Pre
ssu
re lo
ss p
er 1
00
m p
ipin
g [k
Pa]
Flow rate [m3/h]
5060708090100
Internal pipe diameter [mm]
0
5
10
15
20
25
30
35
40
45
50
55
0 25 50 75 100 125 150 175 200
Pre
ssu
re lo
ss p
er 1
00
m p
ipin
g [k
Pa]
Flow rate [x103 m3/h]
150200250300350400450
Internal pipe
Integrating various energy saving initiatives on compressed air systems of typical South African gold mines
Page 15
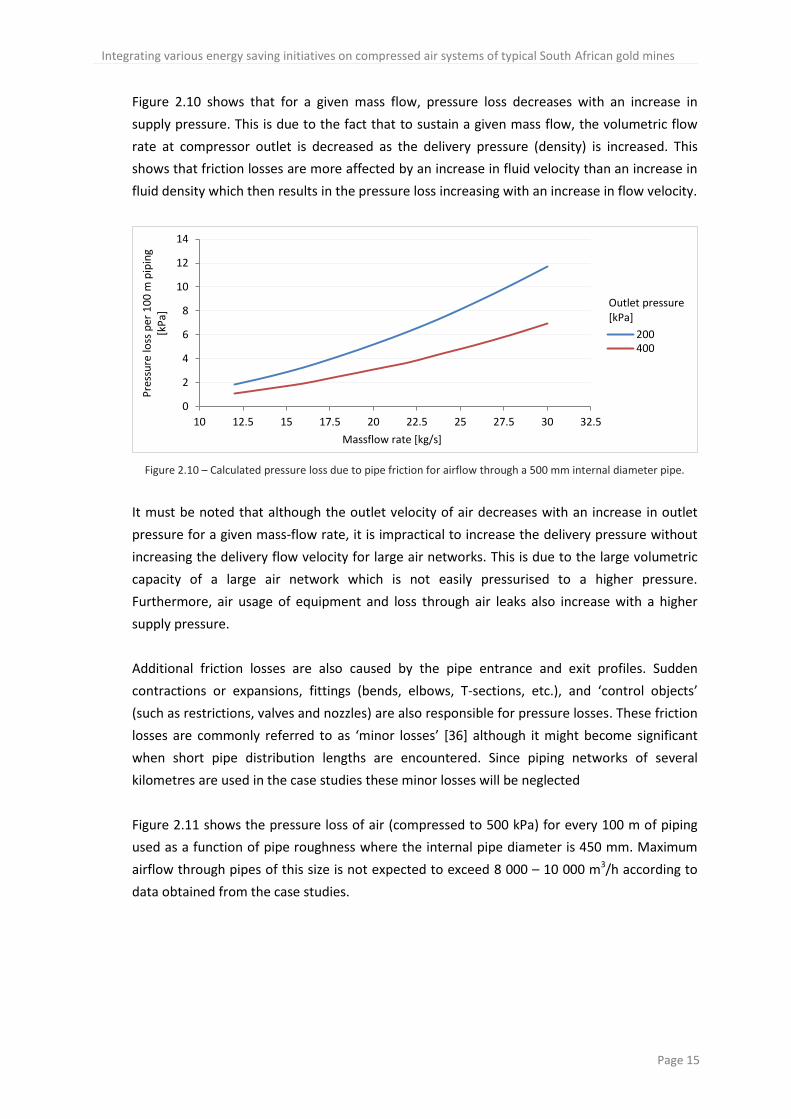
Figure 2.10 shows that for a given mass flow, pressure loss decreases with an increase in
supply pressure. This is due to the fact that to sustain a given mass flow, the volumetric flow
rate at compressor outlet is decreased as the delivery pressure (density) is increased. This
shows that friction losses are more affected by an increase in fluid velocity than an increase in
fluid density which then results in the pressure loss increasing with an increase in flow velocity.
Figure 2.10 – Calculated pressure loss due to pipe friction for airflow through a 500 mm internal diameter pipe.
It must be noted that although the outlet velocity of air decreases with an increase in outlet
pressure for a given mass-flow rate, it is impractical to increase the delivery pressure without
increasing the delivery flow velocity for large air networks. This is due to the large volumetric
capacity of a large air network which is not easily pressurised to a higher pressure.
Furthermore, air usage of equipment and loss through air leaks also increase with a higher
supply pressure.
Additional friction losses are also caused by the pipe entrance and exit profiles. Sudden
contractions or expansions, fittings (bends, elbows, T-sections, etc.), and ‘control objects’
(such as restrictions, valves and nozzles) are also responsible for pressure losses. These friction
losses are commonly referred to as ‘minor losses’ [36] although it might become significant
when short pipe distribution lengths are encountered. Since piping networks of several
kilometres are used in the case studies these minor losses will be neglected
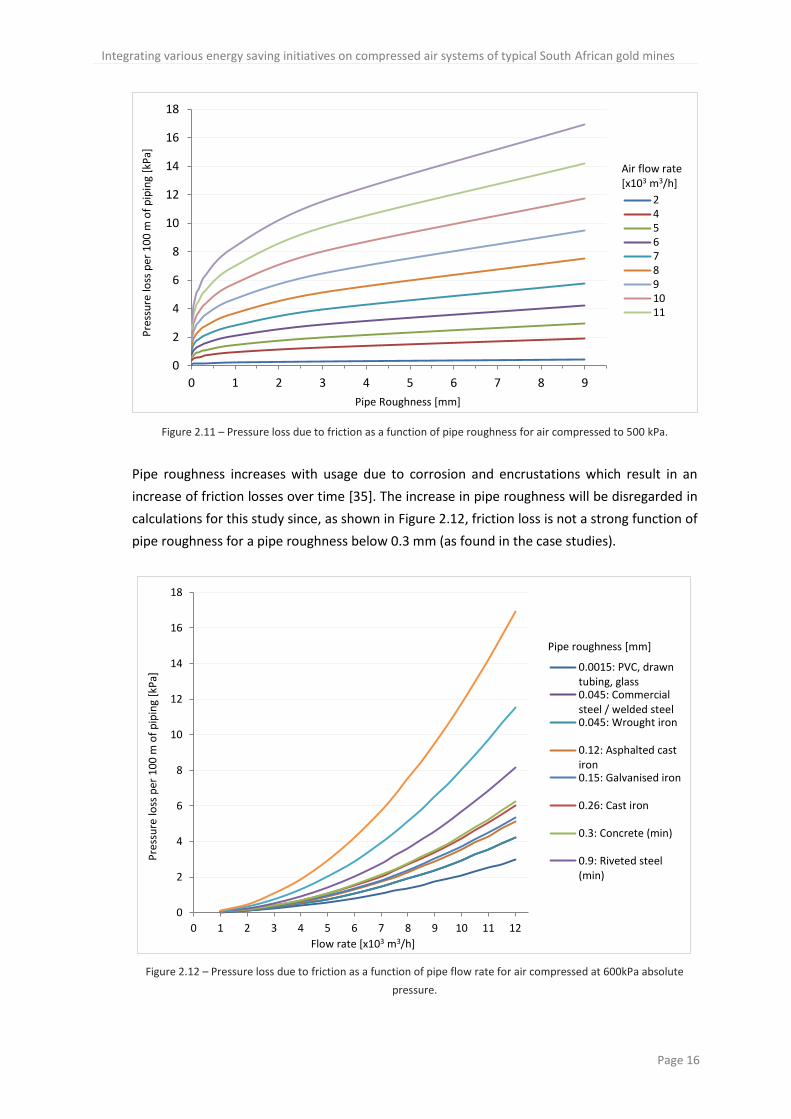
Figure 2.11 shows the pressure loss of air (compressed to 500 kPa) for every 100 m of piping
used as a function of pipe roughness where the internal pipe diameter is 450 mm. Maximum
airflow through pipes of this size is not expected to exceed 8 000 – 10 000 m3/h according to
data obtained from the case studies.
0
2
4
6
8
10
12
14
10 12.5 15 17.5 20 22.5 25 27.5 30 32.5
Pre
ssu
re lo
ss p
er 1
00
m p
ipin
g [k
Pa]
Massflow rate [kg/s]
200400
Outlet pressure [kPa]
Integrating various energy saving initiatives on compressed air systems of typical South African gold mines
Page 16
Figure 2.11 – Pressure loss due to friction as a function of pipe roughness for air compressed to 500 kPa.
Pipe roughness increases with usage due to corrosion and encrustations which result in an
increase of friction losses over time [35]. The increase in pipe roughness will be disregarded in
calculations for this study since, as shown in Figure 2.12, friction loss is not a strong function of
pipe roughness for a pipe roughness below 0.3 mm (as found in the case studies).
Figure 2.12 – Pressure loss due to friction as a function of pipe flow rate for air compressed at 600kPa absolute
pressure.
0
2
4
6
8
10
12
14
16
18
0 1 2 3 4 5 6 7 8 9
Pre
ssu
re lo
ss p
er 1
00
m o
f p
ipin
g [k
Pa]
Pipe Roughness [mm]
24567891011
Air flow rate [x103 m3/h]
0
2
4
6
8
10
12
14
16
18
0 1 2 3 4 5 6 7 8 9 10 11 12
Pre
ssu
re lo
ss p
er 1
00
m o
f p
ipin
g [k
Pa]
Flow rate [x103 m3/h]
0.0015: PVC, drawntubing, glass0.045: Commercialsteel / welded steel0.045: Wrought iron
0.12: Asphalted castiron0.15: Galvanised iron
0.26: Cast iron
0.3: Concrete (min)
0.9: Riveted steel(min)
Pipe roughness [mm]
Integrating various energy saving initiatives on compressed air systems of typical South African gold mines
Page 17
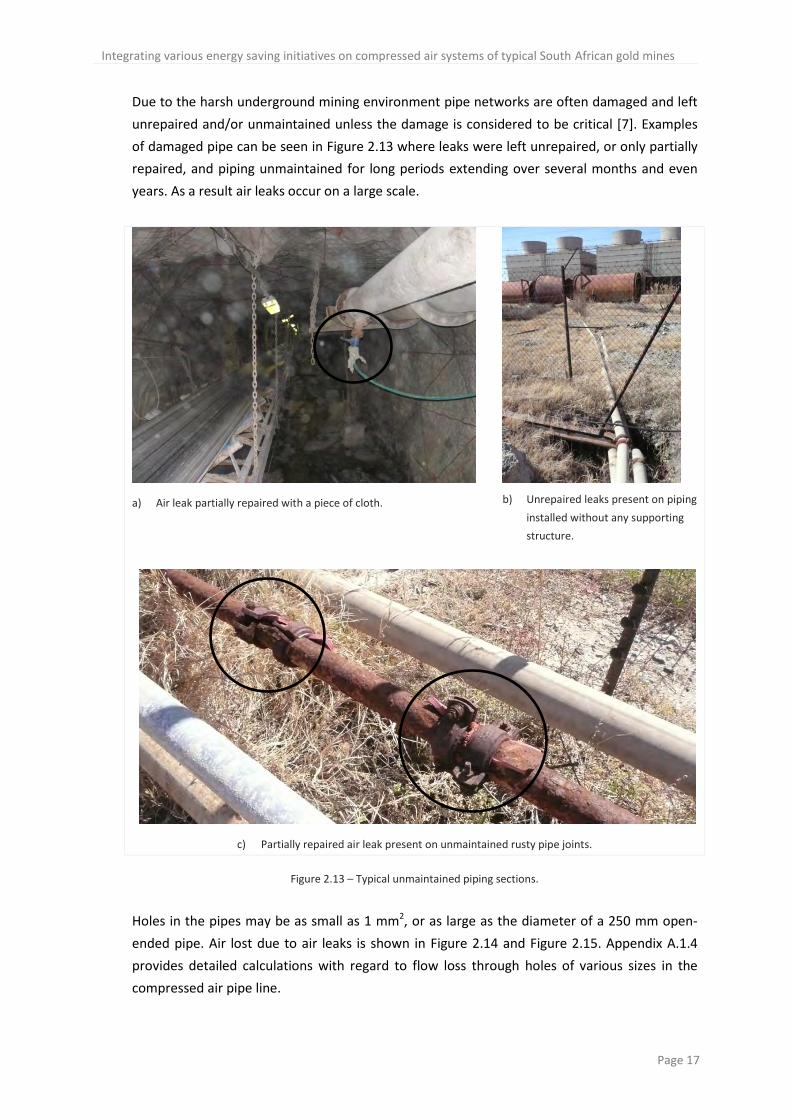
Due to the harsh underground mining environment pipe networks are often damaged and left
unrepaired and/or unmaintained unless the damage is considered to be critical [7]. Examples
of damaged pipe can be seen in Figure 2.13 where leaks were left unrepaired, or only partially
repaired, and piping unmaintained for long periods extending over several months and even
years. As a result air leaks occur on a large scale.
a) Air leak partially repaired with a piece of cloth.
b) Unrepaired leaks present on piping
installed without any supporting
structure.
c) Partially repaired air leak present on unmaintained rusty pipe joints.
Figure 2.13 – Typical unmaintained piping sections.
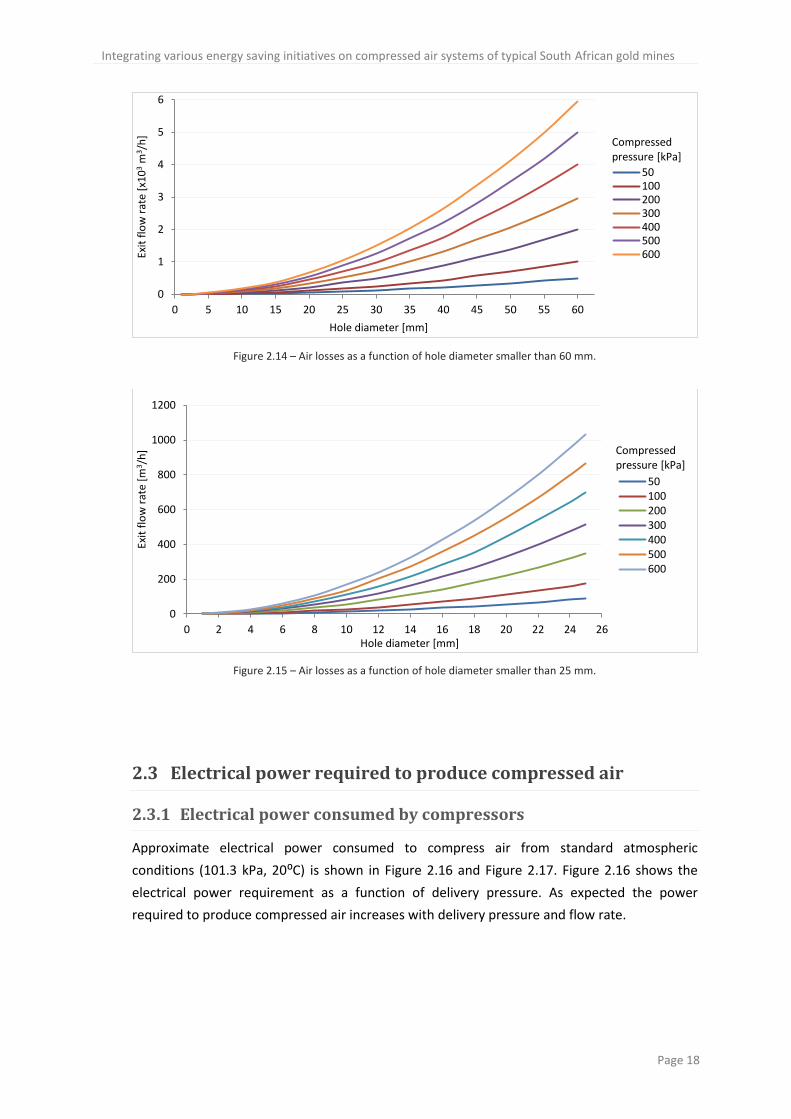
Holes in the pipes may be as small as 1 mm2, or as large as the diameter of a 250 mm open-
ended pipe. Air lost due to air leaks is shown in Figure 2.14 and Figure 2.15. Appendix A.1.4
provides detailed calculations with regard to flow loss through holes of various sizes in the
compressed air pipe line.
Integrating various energy saving initiatives on compressed air systems of typical South African gold mines
Page 18
Figure 2.14 – Air losses as a function of hole diameter smaller than 60 mm.
Figure 2.15 – Air losses as a function of hole diameter smaller than 25 mm.
2.3 Electrical power required to produce compressed air
2.3.1 Electrical power consumed by compressors
Approximate electrical power consumed to compress air from standard atmospheric
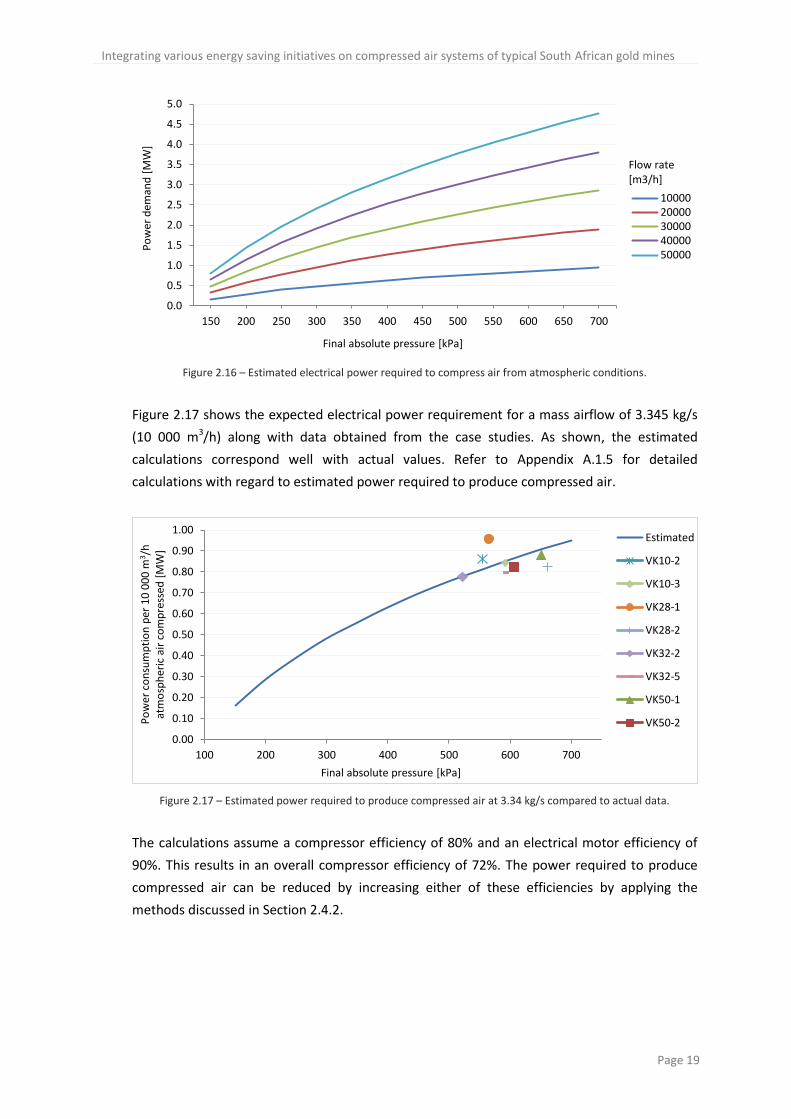
conditions (101.3 kPa, 20⁰C) is shown in Figure 2.16 and Figure 2.17. Figure 2.16 shows the
electrical power requirement as a function of delivery pressure. As expected the power
required to produce compressed air increases with delivery pressure and flow rate.
0
1
2
3
4
5
6
0 5 10 15 20 25 30 35 40 45 50 55 60
Exit
flo
w r
ate
[x1
03
m3 /
h]
Hole diameter [mm]
50100200300400500600
Compressed pressure [kPa]
0
200
400
600
800
1000
1200
0 2 4 6 8 10 12 14 16 18 20 22 24 26
Exit
flo
w r
ate
[m3 /
h]
Hole diameter [mm]
50100200300400500600
Compressed pressure [kPa]
Integrating various energy saving initiatives on compressed air systems of typical South African gold mines
Page 19
Figure 2.16 – Estimated electrical power required to compress air from atmospheric conditions.
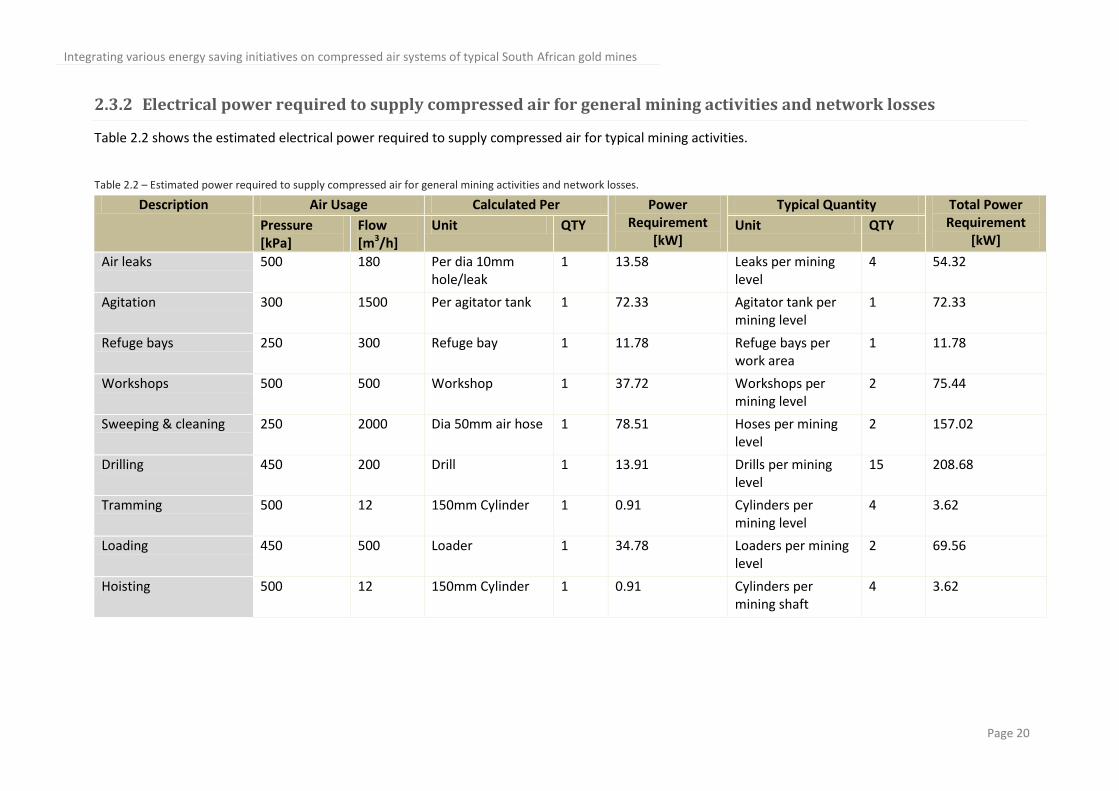
Figure 2.17 shows the expected electrical power requirement for a mass airflow of 3.345 kg/s
(10 000 m3/h) along with data obtained from the case studies. As shown, the estimated
calculations correspond well with actual values. Refer to Appendix A.1.5 for detailed
calculations with regard to estimated power required to produce compressed air.
Figure 2.17 – Estimated power required to produce compressed air at 3.34 kg/s compared to actual data.
The calculations assume a compressor efficiency of 80% and an electrical motor efficiency of
90%. This results in an overall compressor efficiency of 72%. The power required to produce
compressed air can be reduced by increasing either of these efficiencies by applying the
methods discussed in Section 2.4.2.
0.0
0.5
1.0
1.5
2.0
2.5
3.0
3.5
4.0
4.5
5.0
150 200 250 300 350 400 450 500 550 600 650 700
Po
wer
dem
and
[M
W]
Final absolute pressure [kPa]
1000020000300004000050000
Flow rate [m3/h]
0.00
0.10
0.20
0.30
0.40
0.50
0.60
0.70
0.80
0.90
1.00
100 200 300 400 500 600 700
Po
wer
co
nsu
mp
tio
n p
er 1
0 0
00
m3 /
h
atm
osp
her
ic a
ir c
om
pre
ssed
[M
W]
Final absolute pressure [kPa]
Estimated
VK10-2
VK10-3
VK28-1
VK28-2
VK32-2
VK32-5
VK50-1
VK50-2
Integrating various energy saving initiatives on compressed air systems of typical South African gold mines
Page 20
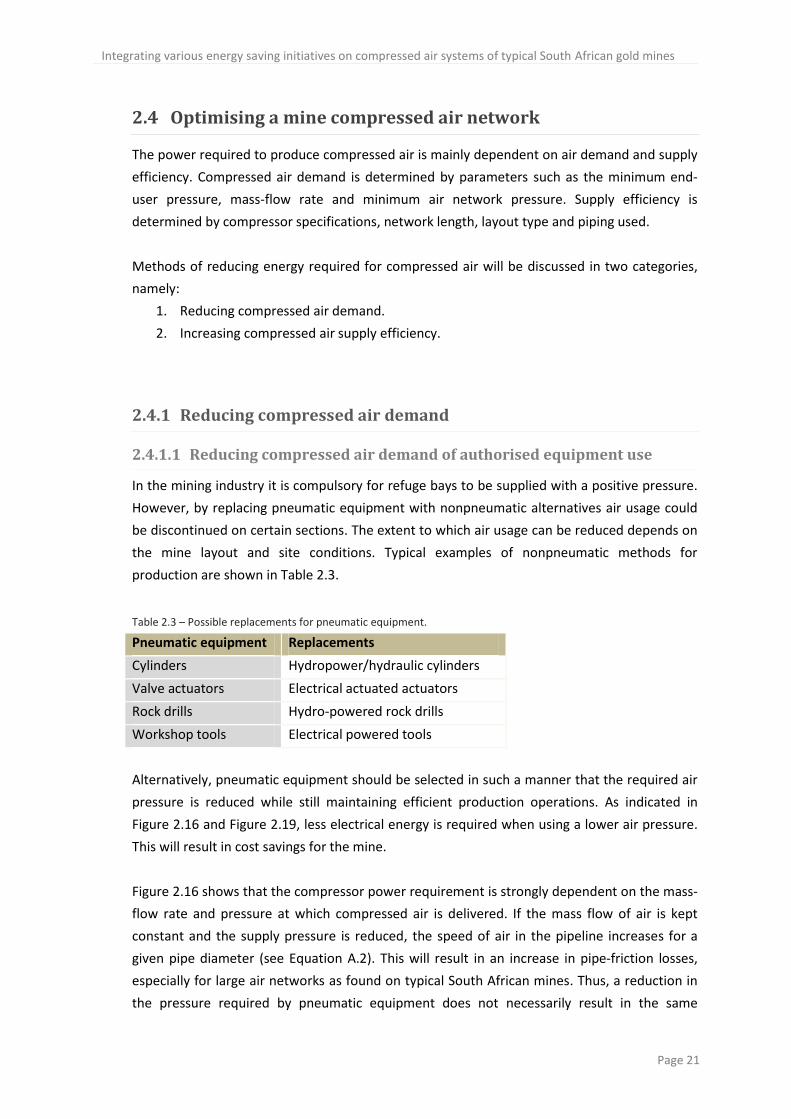
2.3.2 Electrical power required to supply compressed air for general mining activities and network losses
Table 2.2 shows the estimated electrical power required to supply compressed air for typical mining activities.
Table 2.2 – Estimated power required to supply compressed air for general mining activities and network losses.
Description Air Usage Calculated Per Power Requirement
[kW]
Typical Quantity Total Power Requirement
[kW] Pressure [kPa]
Flow [m3/h]
Unit QTY Unit QTY
Air leaks 500 180 Per dia 10mm hole/leak
1 13.58 Leaks per mining level
4 54.32
Agitation 300 1500 Per agitator tank 1 72.33 Agitator tank per mining level
1 72.33
Refuge bays 250 300 Refuge bay 1 11.78 Refuge bays per work area
1 11.78
Workshops 500 500 Workshop 1 37.72 Workshops per mining level
2 75.44
Sweeping & cleaning 250 2000 Dia 50mm air hose 1 78.51 Hoses per mining level
2 157.02
Drilling 450 200 Drill 1 13.91 Drills per mining level
15 208.68
Tramming 500 12 150mm Cylinder 1 0.91 Cylinders per mining level
4 3.62
Loading 450 500 Loader 1 34.78 Loaders per mining level
2 69.56
Hoisting 500 12 150mm Cylinder 1 0.91 Cylinders per mining shaft
4 3.62
Integrating various energy saving initiatives on compressed air systems of typical South African gold mines
Page 21
2.4 Optimising a mine compressed air network
The power required to produce compressed air is mainly dependent on air demand and supply
efficiency. Compressed air demand is determined by parameters such as the minimum end-
user pressure, mass-flow rate and minimum air network pressure. Supply efficiency is
determined by compressor specifications, network length, layout type and piping used.
Methods of reducing energy required for compressed air will be discussed in two categories,
namely:
1. Reducing compressed air demand.
2. Increasing compressed air supply efficiency.
2.4.1 Reducing compressed air demand
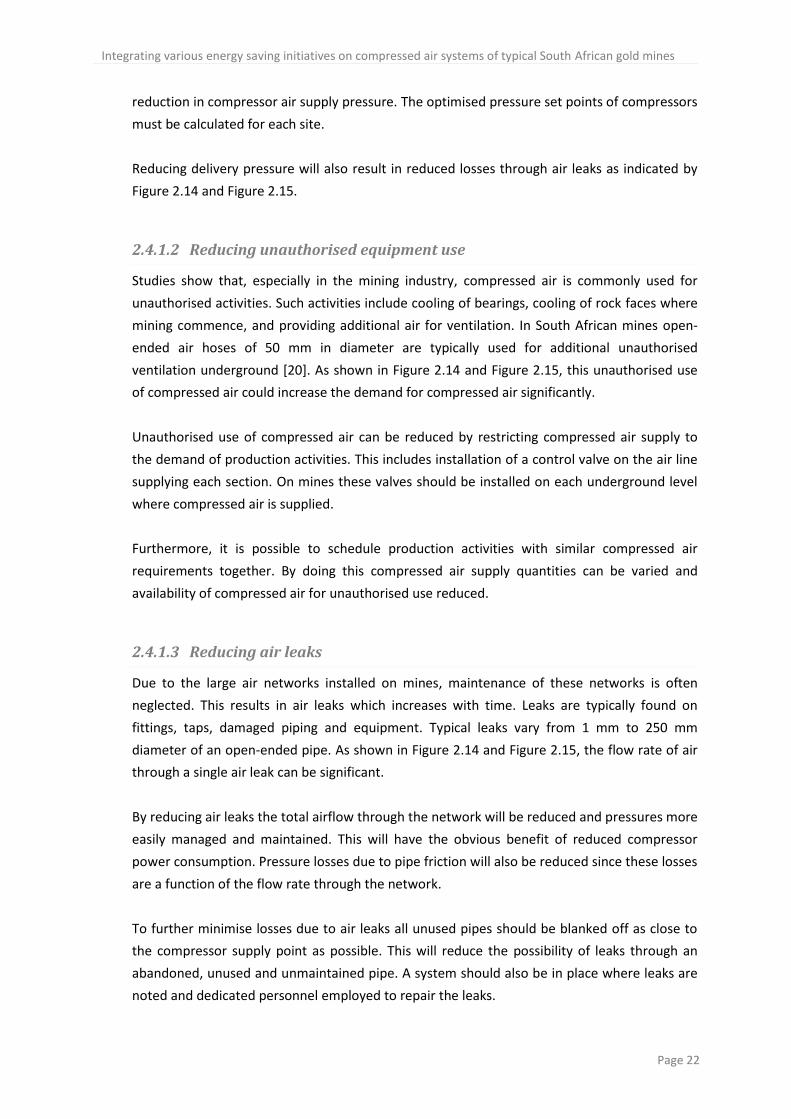
2.4.1.1 Reducing compressed air demand of authorised equipment use
In the mining industry it is compulsory for refuge bays to be supplied with a positive pressure.
However, by replacing pneumatic equipment with nonpneumatic alternatives air usage could
be discontinued on certain sections. The extent to which air usage can be reduced depends on
the mine layout and site conditions. Typical examples of nonpneumatic methods for
production are shown in Table 2.3.
Table 2.3 – Possible replacements for pneumatic equipment.
Pneumatic equipment Replacements
Cylinders Hydropower/hydraulic cylinders
Valve actuators Electrical actuated actuators
Rock drills Hydro-powered rock drills
Workshop tools Electrical powered tools
Alternatively, pneumatic equipment should be selected in such a manner that the required air
pressure is reduced while still maintaining efficient production operations. As indicated in
Figure 2.16 and Figure 2.19, less electrical energy is required when using a lower air pressure.
This will result in cost savings for the mine.
Figure 2.16 shows that the compressor power requirement is strongly dependent on the mass-
flow rate and pressure at which compressed air is delivered. If the mass flow of air is kept
constant and the supply pressure is reduced, the speed of air in the pipeline increases for a
given pipe diameter (see Equation A.2). This will result in an increase in pipe-friction losses,
especially for large air networks as found on typical South African mines. Thus, a reduction in
the pressure required by pneumatic equipment does not necessarily result in the same
Integrating various energy saving initiatives on compressed air systems of typical South African gold mines
Page 22
reduction in compressor air supply pressure. The optimised pressure set points of compressors
must be calculated for each site.
Reducing delivery pressure will also result in reduced losses through air leaks as indicated by
Figure 2.14 and Figure 2.15.
2.4.1.2 Reducing unauthorised equipment use
Studies show that, especially in the mining industry, compressed air is commonly used for
unauthorised activities. Such activities include cooling of bearings, cooling of rock faces where
mining commence, and providing additional air for ventilation. In South African mines open-
ended air hoses of 50 mm in diameter are typically used for additional unauthorised
ventilation underground [20]. As shown in Figure 2.14 and Figure 2.15, this unauthorised use
of compressed air could increase the demand for compressed air significantly.
Unauthorised use of compressed air can be reduced by restricting compressed air supply to
the demand of production activities. This includes installation of a control valve on the air line
supplying each section. On mines these valves should be installed on each underground level
where compressed air is supplied.
Furthermore, it is possible to schedule production activities with similar compressed air
requirements together. By doing this compressed air supply quantities can be varied and
availability of compressed air for unauthorised use reduced.
2.4.1.3 Reducing air leaks
Due to the large air networks installed on mines, maintenance of these networks is often
neglected. This results in air leaks which increases with time. Leaks are typically found on
fittings, taps, damaged piping and equipment. Typical leaks vary from 1 mm to 250 mm
diameter of an open-ended pipe. As shown in Figure 2.14 and Figure 2.15, the flow rate of air
through a single air leak can be significant.
By reducing air leaks the total airflow through the network will be reduced and pressures more
easily managed and maintained. This will have the obvious benefit of reduced compressor
power consumption. Pressure losses due to pipe friction will also be reduced since these losses
are a function of the flow rate through the network.
To further minimise losses due to air leaks all unused pipes should be blanked off as close to
the compressor supply point as possible. This will reduce the possibility of leaks through an
abandoned, unused and unmaintained pipe. A system should also be in place where leaks are
noted and dedicated personnel employed to repair the leaks.
Integrating various energy saving initiatives on compressed air systems of typical South African gold mines
Page 23
2.4.2 Increasing compressed air supply efficiency
2.4.2.1 Optimising the air network
Typically, mines make use of a ‘plant air’ or ‘local generation’ compressed air network layout
extending from 1 km to as long as 70 km. For these large networks maintenance requirements
increase and the effect of unmaintained piping escalates to all operations [16].
Where site conditions allow for modifications to the air network, it might be beneficial to alter
the network layout from one type to another. Whether this will prove to be more efficient is
dependent on a detailed site investigation and analysis of the air network.
Figure 2.7 to Figure 2.10 clearly show that pressure losses, due to pipe friction, are strongly
dependent on the pipe diameter and airspeed inside the pipe. Pressure losses through the
supply network are accommodated by increasing the pressure supplied by compressors. It is
important that a mine air network is designed to accommodate the required flow rate while
keeping pressure losses to a minimum. This can be done by increasing the diameter of pipes as
shown in Figure 2.7 to Figure 2.10.
Where end-user requirements differ, and compressed air cannot be varied, air must be
supplied at the maximum end-user pressure demand. This increases compressed air usage and
losses through air leaks. By altering the air network layout, to separate the network into
separate high- and low-pressure systems, reduced energy consumption can be expected.
2.4.2.2 Optimising air compression
Compressor efficiency can be increased by controlling inlet guide vanes optimally, reducing
compressor air inlet temperature and ensuring filters and coolers are regularly monitored and
maintained [7].
Additional, and regular maintenance, has been found to improve efficiency of the compression
process which includes supply of clean, dry compressed air [19]. This maintenance includes:
1. Regular inspection and cleaning of filters and air dryers [26,37].
2. Proper maintenance of the compressor cooling system and lubricants [7]. This includes
pumps, fans and lubricant fluids.
3. Proper and regular maintenance of coolers and heat exchangers.
2.4.2.3 Optimising electrical motors driving compressors
Compressed air demand usually varies significantly between production activities. By
implementing VSDs on the electrical motors that drive compressors, electrical energy
consumption will be reduced as compressed air demand is reduced [7]. Electrical motors can
also be replaced with high-efficiency motors.

Integrating various energy saving initiatives on compressed air systems of typical South African gold mines
Page 24
2.5 Calculating the energy savings of these initiatives
Energy required to compress air is directly proportional to the overall compression ratio and
the mass -flow rate. Thus, by reducing either the final pressure of compressed air, or the mass-
flow rate of compressed air, the work required to produce compressed air will be reduced. The
expected electrical power saving realised by these initiatives can be determined by using
Figure 2.18 and Figure 2.19.
Figure 2.18 shows the estimated reduction in electrical power required to produce
compressed air for a reduction of 1 000 m3/h in inlet airflow rate. For example, if air is being
compressed from atmospheric conditions to 350 kPa and the airflow rate at the compressor
inlet is reduced by 1 000 m3/h, then the compressor’s power consumption will be reduced by
an estimated 70 kW.
Figure 2.18 – Electrical power saved per 1000 m3/h normalised airflow reduced.
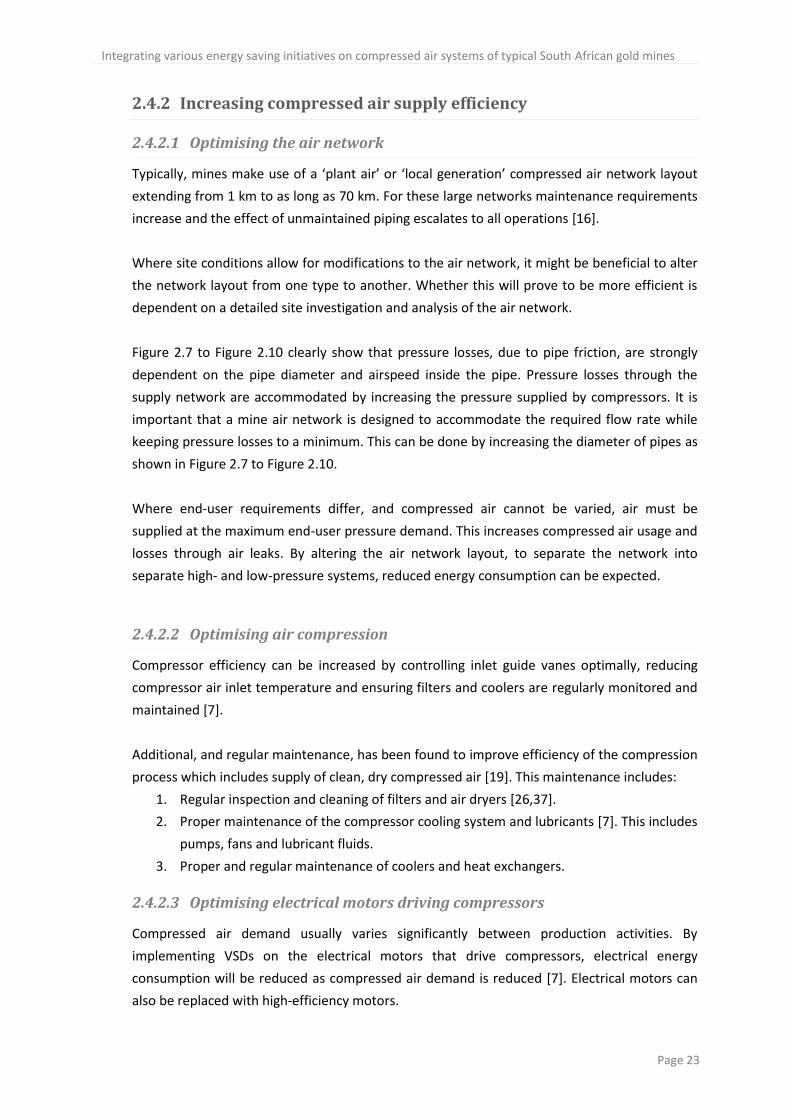
Figure 2.19 shows the estimated reduction in electrical power consumption as a function of
reduction in delivery pressure per 10 000 m3/h air compressed. For example, if compressed air
is supplied at a flow rate of 10 000 m3/h, and the supply pressure is reduced by 50 kPa from
600 kPa to 550 kPa, the reduction in electrical power requirement is approximately 50 kW.
0
2
4
6
8
10
12
100 150 200 250 300 350 400 450 500 550 600 650 700 750
Po
wer
red
uct
ion
per
10
0m
3 /h
re
du
ctio
n in
flo
w r
ate[
kW]
Final absolute pressure [kPa]
Integrating various energy saving initiatives on compressed air systems of typical South African gold mines
Page 25
Figure 2.19 – Electrical power saved by reducing final supply pressure.
These graphs can be used to determine estimated energy savings where the flow rate of air
and/or delivery pressure of compressors are varied. Other graphs presented in Section 2.2 can
be used to determine to what extent changes to the air network will affect the compressed air
requirement. In conjunction with Figure 2.18 and Figure 2.19 energy saving can be
approximated.
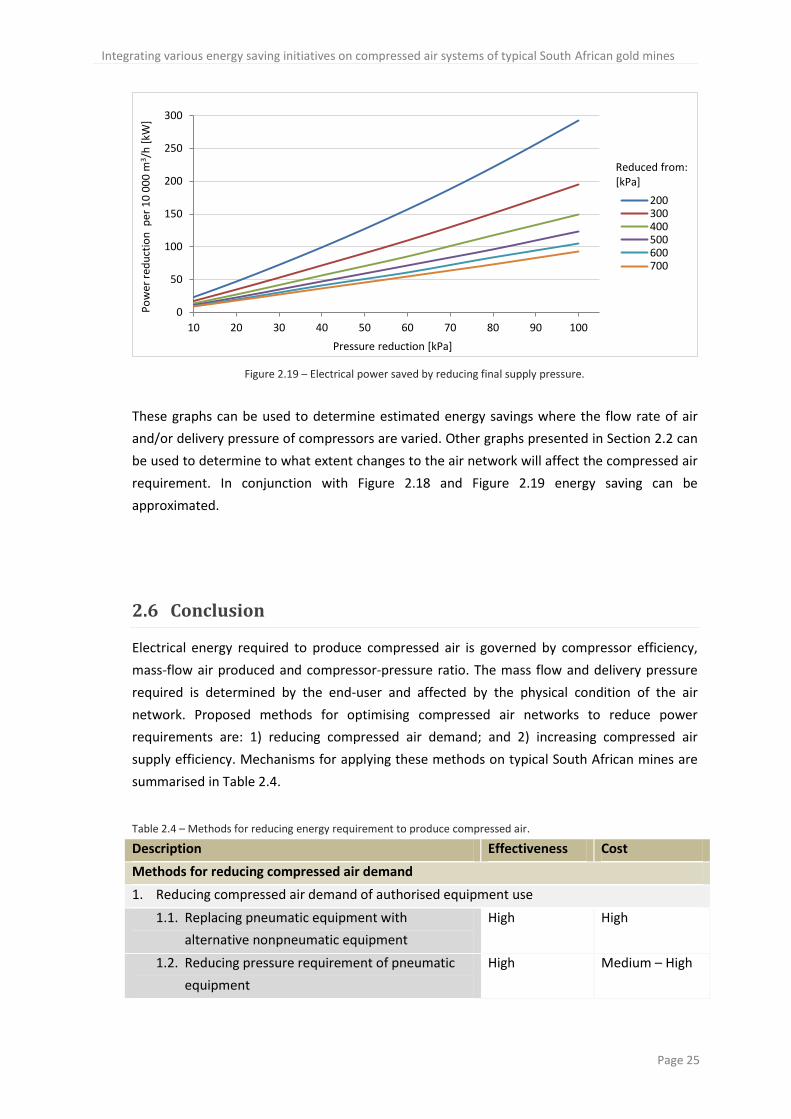
2.6 Conclusion
Electrical energy required to produce compressed air is governed by compressor efficiency,
mass-flow air produced and compressor-pressure ratio. The mass flow and delivery pressure
required is determined by the end-user and affected by the physical condition of the air
network. Proposed methods for optimising compressed air networks to reduce power
requirements are: 1) reducing compressed air demand; and 2) increasing compressed air
supply efficiency. Mechanisms for applying these methods on typical South African mines are
summarised in Table 2.4.
Table 2.4 – Methods for reducing energy requirement to produce compressed air.
Description Effectiveness Cost
Methods for reducing compressed air demand
1. Reducing compressed air demand of authorised equipment use
1.1. Replacing pneumatic equipment with
alternative nonpneumatic equipment
High High
1.2. Reducing pressure requirement of pneumatic
equipment
High Medium – High
0
50
100
150
200
250
300
10 20 30 40 50 60 70 80 90 100
Po
wer
red
uct
ion
per
10
00
0 m
3 /h
[kW
]
Pressure reduction [kPa]
200300400500600700
Reduced from: [kPa]
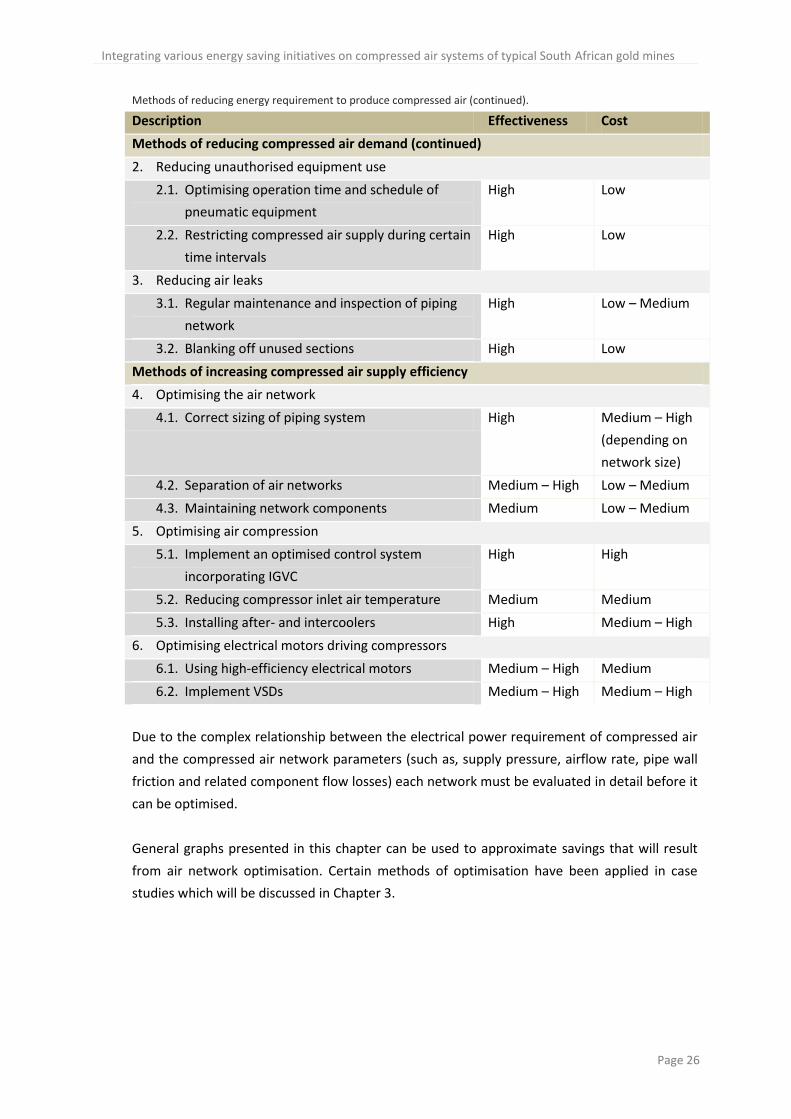
Integrating various energy saving initiatives on compressed air systems of typical South African gold mines
Page 26
Methods of reducing energy requirement to produce compressed air (continued).
Description Effectiveness Cost
Methods of reducing compressed air demand (continued)
2. Reducing unauthorised equipment use
2.1. Optimising operation time and schedule of
pneumatic equipment
High Low
2.2. Restricting compressed air supply during certain
time intervals
High Low
3. Reducing air leaks
3.1. Regular maintenance and inspection of piping
network
High Low – Medium
3.2. Blanking off unused sections High Low
Methods of increasing compressed air supply efficiency
4. Optimising the air network
4.1. Correct sizing of piping system High Medium – High
(depending on
network size)
4.2. Separation of air networks Medium – High Low – Medium
4.3. Maintaining network components Medium Low – Medium
5. Optimising air compression
5.1. Implement an optimised control system
incorporating IGVC
High High
5.2. Reducing compressor inlet air temperature Medium Medium
5.3. Installing after- and intercoolers High Medium – High
6. Optimising electrical motors driving compressors
6.1. Using high-efficiency electrical motors Medium – High Medium
6.2. Implement VSDs Medium – High Medium – High
Due to the complex relationship between the electrical power requirement of compressed air
and the compressed air network parameters (such as, supply pressure, airflow rate, pipe wall
friction and related component flow losses) each network must be evaluated in detail before it
can be optimised.
General graphs presented in this chapter can be used to approximate savings that will result
from air network optimisation. Certain methods of optimisation have been applied in case
studies which will be discussed in Chapter 3.
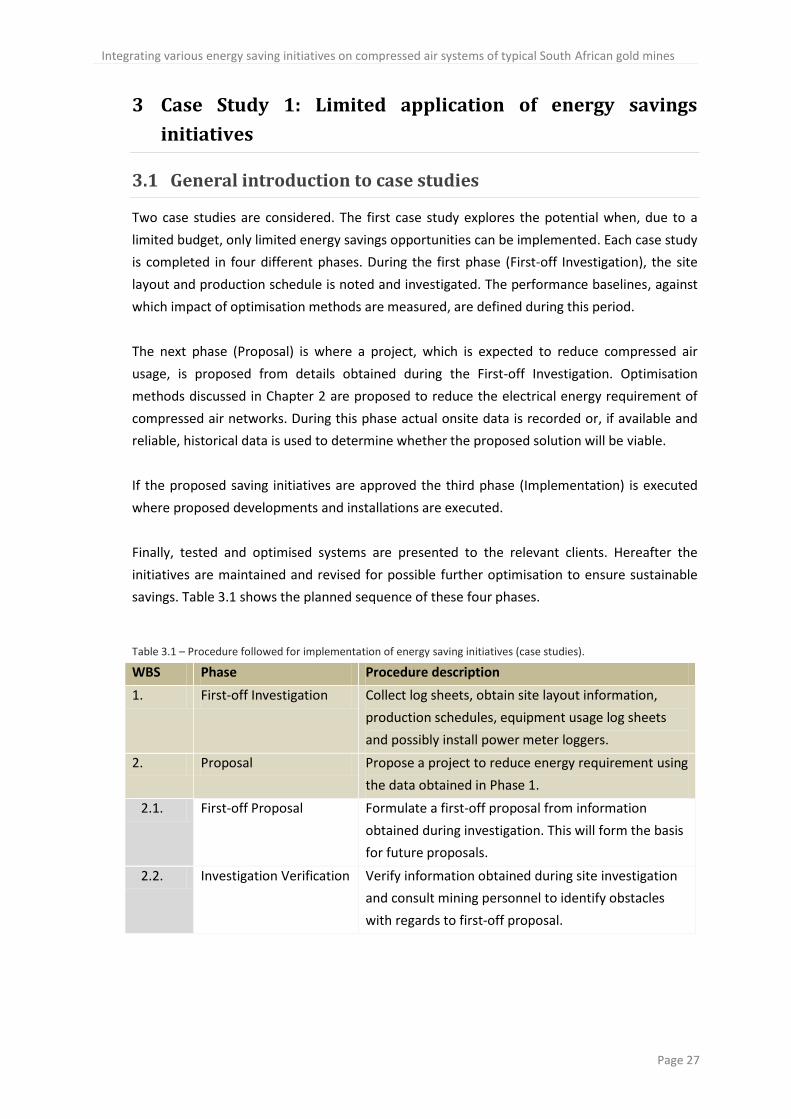
Integrating various energy saving initiatives on compressed air systems of typical South African gold mines
Page 27
3 Case Study 1: Limited application of energy savings
initiatives
3.1 General introduction to case studies
Two case studies are considered. The first case study explores the potential when, due to a
limited budget, only limited energy savings opportunities can be implemented. Each case study
is completed in four different phases. During the first phase (First-off Investigation), the site
layout and production schedule is noted and investigated. The performance baselines, against
which impact of optimisation methods are measured, are defined during this period.
The next phase (Proposal) is where a project, which is expected to reduce compressed air
usage, is proposed from details obtained during the First-off Investigation. Optimisation
methods discussed in Chapter 2 are proposed to reduce the electrical energy requirement of
compressed air networks. During this phase actual onsite data is recorded or, if available and
reliable, historical data is used to determine whether the proposed solution will be viable.
If the proposed saving initiatives are approved the third phase (Implementation) is executed
where proposed developments and installations are executed.
Finally, tested and optimised systems are presented to the relevant clients. Hereafter the
initiatives are maintained and revised for possible further optimisation to ensure sustainable
savings. Table 3.1 shows the planned sequence of these four phases.
Table 3.1 – Procedure followed for implementation of energy saving initiatives (case studies).
WBS Phase Procedure description
1. First-off Investigation Collect log sheets, obtain site layout information,
production schedules, equipment usage log sheets
and possibly install power meter loggers.
2. Proposal Propose a project to reduce energy requirement using
the data obtained in Phase 1.
2.1. First-off Proposal Formulate a first-off proposal from information
obtained during investigation. This will form the basis
for future proposals.
2.2. Investigation Verification Verify information obtained during site investigation
and consult mining personnel to identify obstacles
with regards to first-off proposal.
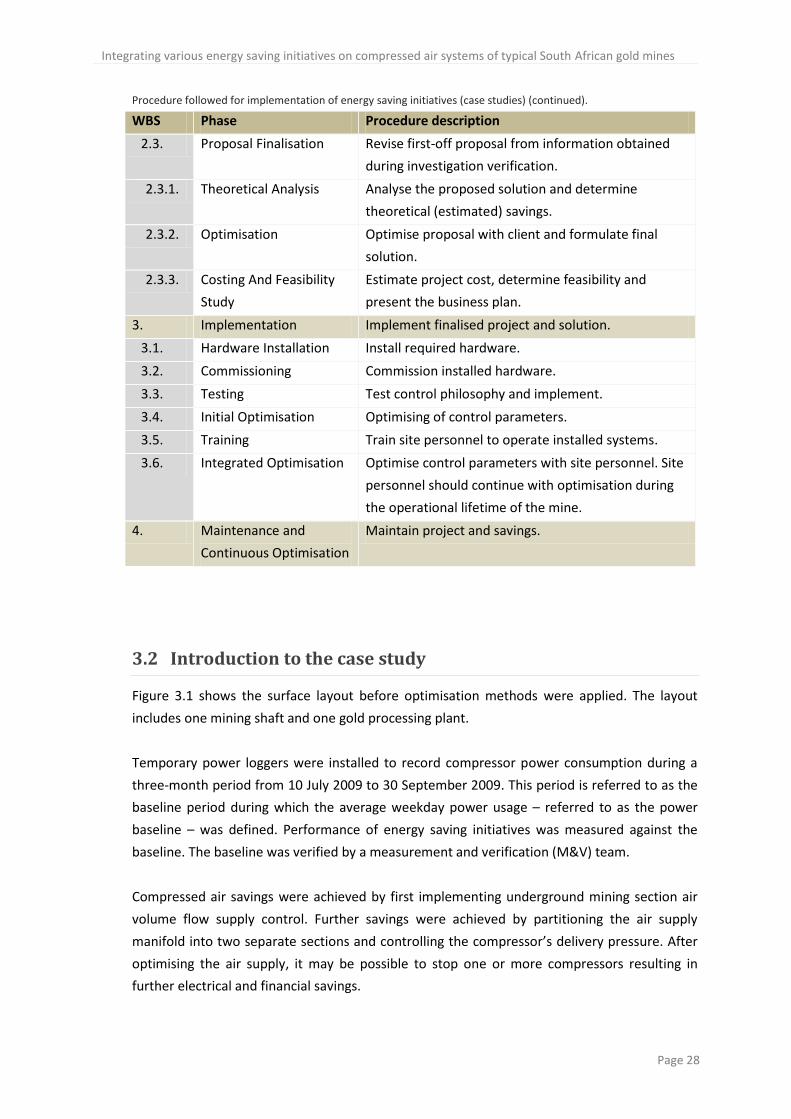
Integrating various energy saving initiatives on compressed air systems of typical South African gold mines
Page 28
Procedure followed for implementation of energy saving initiatives (case studies) (continued).
WBS Phase Procedure description
2.3. Proposal Finalisation Revise first-off proposal from information obtained
during investigation verification.
2.3.1. Theoretical Analysis Analyse the proposed solution and determine
theoretical (estimated) savings.
2.3.2. Optimisation Optimise proposal with client and formulate final
solution.
2.3.3. Costing And Feasibility
Study
Estimate project cost, determine feasibility and
present the business plan.
3. Implementation Implement finalised project and solution.
3.1. Hardware Installation Install required hardware.
3.2. Commissioning Commission installed hardware.
3.3. Testing Test control philosophy and implement.
3.4. Initial Optimisation Optimising of control parameters.
3.5. Training Train site personnel to operate installed systems.
3.6. Integrated Optimisation Optimise control parameters with site personnel. Site
personnel should continue with optimisation during
the operational lifetime of the mine.
4. Maintenance and
Continuous Optimisation
Maintain project and savings.
3.2 Introduction to the case study
Figure 3.1 shows the surface layout before optimisation methods were applied. The layout
includes one mining shaft and one gold processing plant.
Temporary power loggers were installed to record compressor power consumption during a
three-month period from 10 July 2009 to 30 September 2009. This period is referred to as the
baseline period during which the average weekday power usage – referred to as the power
baseline – was defined. Performance of energy saving initiatives was measured against the
baseline. The baseline was verified by a measurement and verification (M&V) team.
Compressed air savings were achieved by first implementing underground mining section air
volume flow supply control. Further savings were achieved by partitioning the air supply
manifold into two separate sections and controlling the compressor’s delivery pressure. After
optimising the air supply, it may be possible to stop one or more compressors resulting in
further electrical and financial savings.
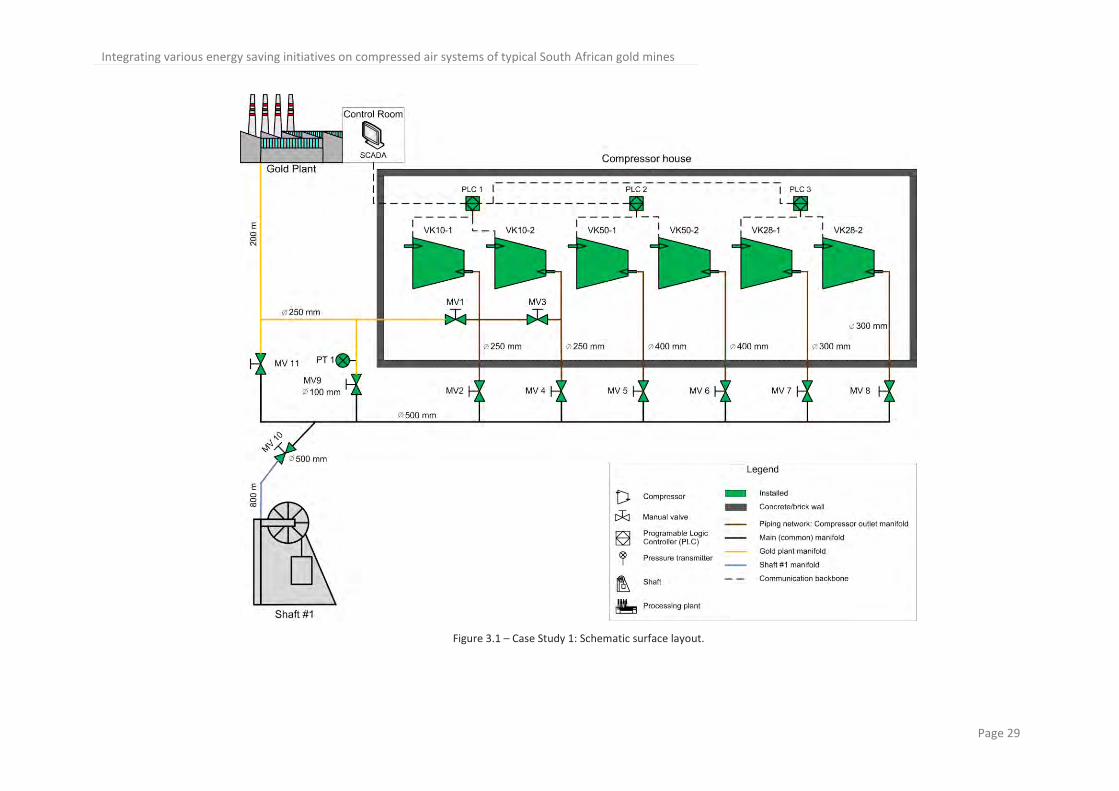
Integrating various energy saving initiatives on compressed air systems of typical South African gold mines
Page 29
Figure 3.1 – Case Study 1: Schematic surface layout.
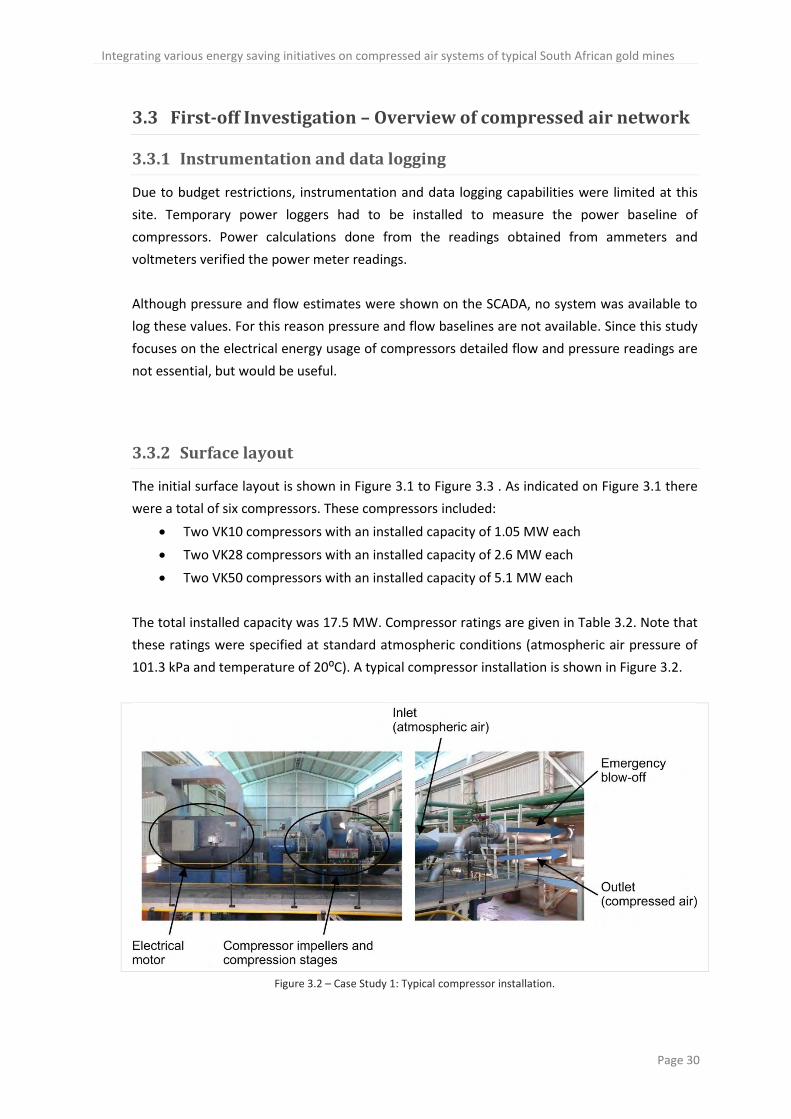
Integrating various energy saving initiatives on compressed air systems of typical South African gold mines
Page 30
3.3 First-off Investigation – Overview of compressed air network
3.3.1 Instrumentation and data logging
Due to budget restrictions, instrumentation and data logging capabilities were limited at this
site. Temporary power loggers had to be installed to measure the power baseline of
compressors. Power calculations done from the readings obtained from ammeters and
voltmeters verified the power meter readings.
Although pressure and flow estimates were shown on the SCADA, no system was available to
log these values. For this reason pressure and flow baselines are not available. Since this study
focuses on the electrical energy usage of compressors detailed flow and pressure readings are
not essential, but would be useful.
3.3.2 Surface layout
The initial surface layout is shown in Figure 3.1 to Figure 3.3 . As indicated on Figure 3.1 there
were a total of six compressors. These compressors included:
Two VK10 compressors with an installed capacity of 1.05 MW each
Two VK28 compressors with an installed capacity of 2.6 MW each
Two VK50 compressors with an installed capacity of 5.1 MW each
The total installed capacity was 17.5 MW. Compressor ratings are given in Table 3.2. Note that
these ratings were specified at standard atmospheric conditions (atmospheric air pressure of
101.3 kPa and temperature of 20⁰C). A typical compressor installation is shown in Figure 3.2.
Figure 3.2 – Case Study 1: Typical compressor installation.
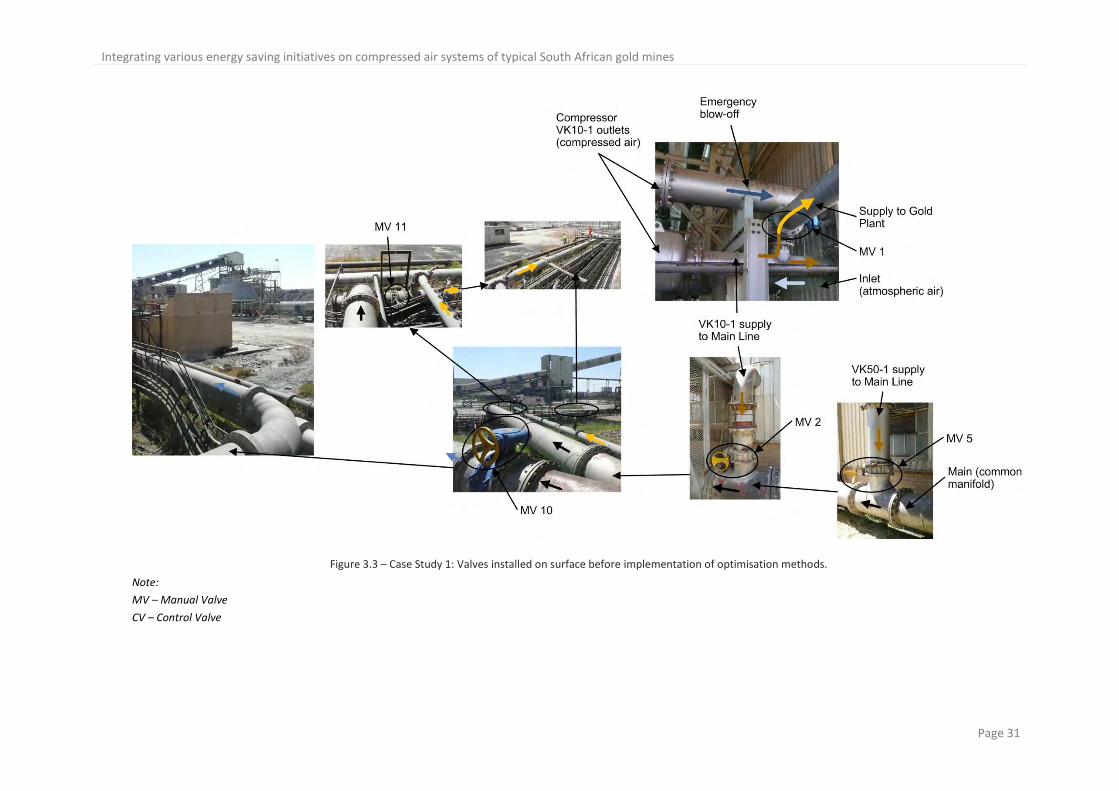
Integrating various energy saving initiatives on compressed air systems of typical South African gold mines
Page 31
Figure 3.3 – Case Study 1: Valves installed on surface before implementation of optimisation methods.
Note:
MV – Manual Valve
CV – Control Valve
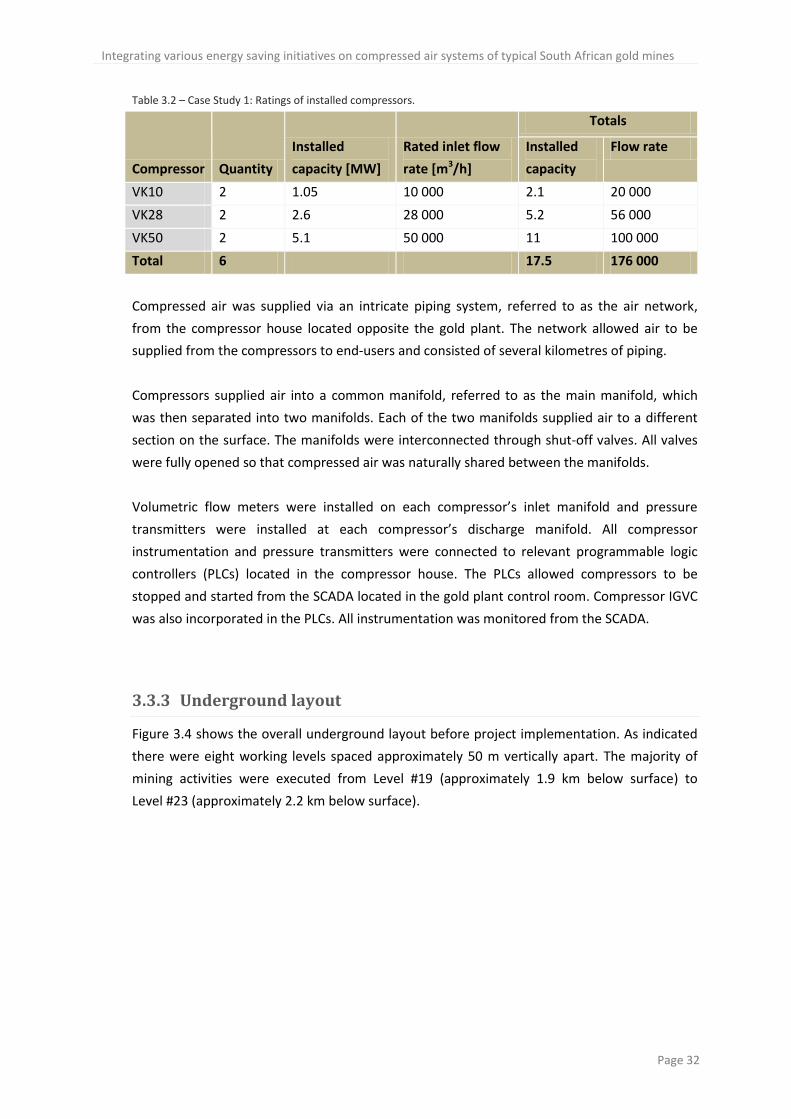
Integrating various energy saving initiatives on compressed air systems of typical South African gold mines
Page 32
Table 3.2 – Case Study 1: Ratings of installed compressors.
Compressor Quantity
Installed
capacity [MW]
Rated inlet flow
rate [m3/h]
Totals
Installed
capacity
Flow rate
VK10 2 1.05 10 000 2.1 20 000
VK28 2 2.6 28 000 5.2 56 000
VK50 2 5.1 50 000 11 100 000
Total 6 17.5 176 000
Compressed air was supplied via an intricate piping system, referred to as the air network,
from the compressor house located opposite the gold plant. The network allowed air to be
supplied from the compressors to end-users and consisted of several kilometres of piping.
Compressors supplied air into a common manifold, referred to as the main manifold, which
was then separated into two manifolds. Each of the two manifolds supplied air to a different
section on the surface. The manifolds were interconnected through shut-off valves. All valves
were fully opened so that compressed air was naturally shared between the manifolds.
Volumetric flow meters were installed on each compressor’s inlet manifold and pressure
transmitters were installed at each compressor’s discharge manifold. All compressor
instrumentation and pressure transmitters were connected to relevant programmable logic
controllers (PLCs) located in the compressor house. The PLCs allowed compressors to be
stopped and started from the SCADA located in the gold plant control room. Compressor IGVC
was also incorporated in the PLCs. All instrumentation was monitored from the SCADA.
3.3.3 Underground layout
Figure 3.4 shows the overall underground layout before project implementation. As indicated
there were eight working levels spaced approximately 50 m vertically apart. The majority of
mining activities were executed from Level #19 (approximately 1.9 km below surface) to
Level #23 (approximately 2.2 km below surface).
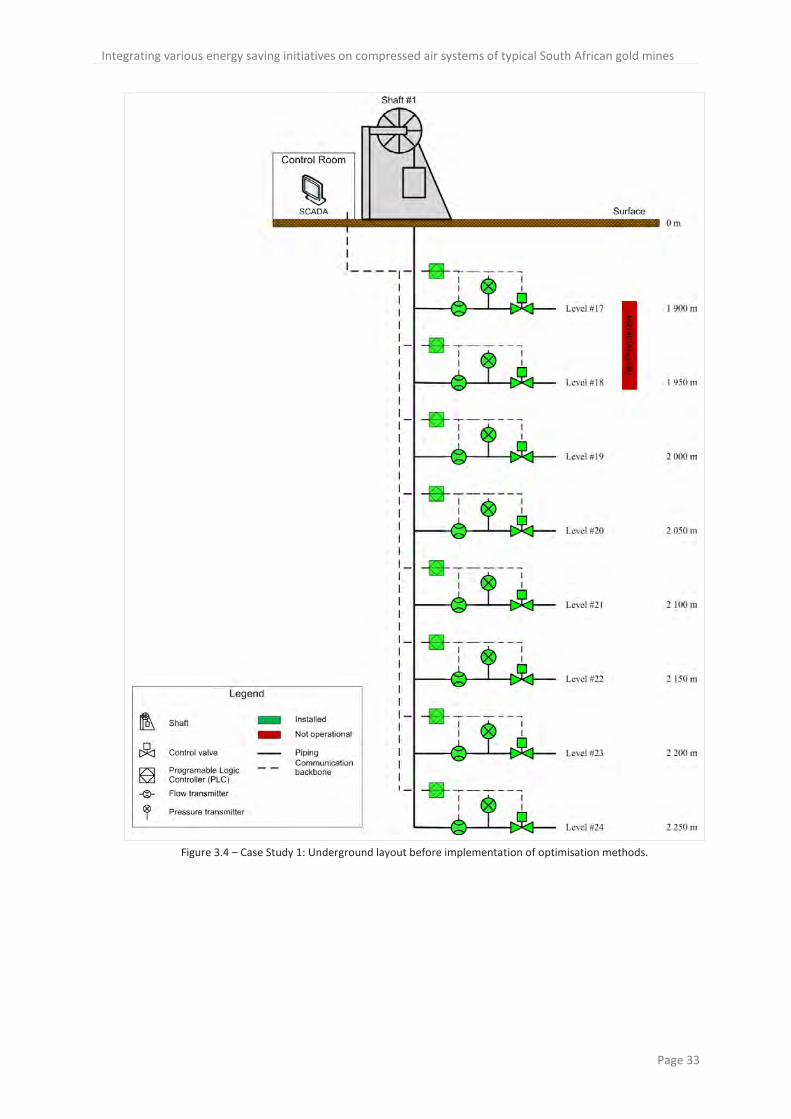
Integrating various energy saving initiatives on compressed air systems of typical South African gold mines
Page 33
Figure 3.4 – Case Study 1: Underground layout before implementation of optimisation methods.
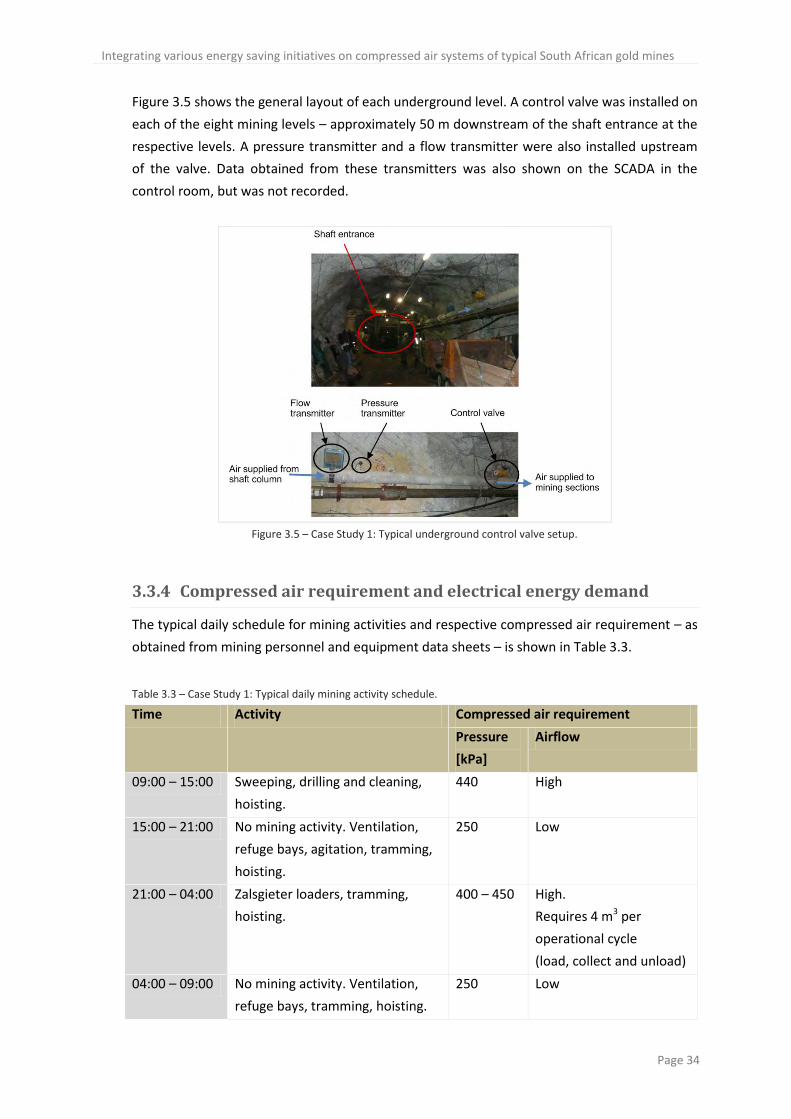
Integrating various energy saving initiatives on compressed air systems of typical South African gold mines
Page 34
Figure 3.5 shows the general layout of each underground level. A control valve was installed on
each of the eight mining levels – approximately 50 m downstream of the shaft entrance at the
respective levels. A pressure transmitter and a flow transmitter were also installed upstream
of the valve. Data obtained from these transmitters was also shown on the SCADA in the
control room, but was not recorded.
Figure 3.5 – Case Study 1: Typical underground control valve setup.
3.3.4 Compressed air requirement and electrical energy demand
The typical daily schedule for mining activities and respective compressed air requirement – as
obtained from mining personnel and equipment data sheets – is shown in Table 3.3.
Table 3.3 – Case Study 1: Typical daily mining activity schedule.
Time Activity Compressed air requirement
Pressure
[kPa]
Airflow
09:00 – 15:00 Sweeping, drilling and cleaning,
hoisting.
440 High
15:00 – 21:00 No mining activity. Ventilation,
refuge bays, agitation, tramming,
hoisting.
250 Low
21:00 – 04:00 Zalsgieter loaders, tramming,
hoisting.
400 – 450 High.
Requires 4 m3 per
operational cycle
(load, collect and unload)
04:00 – 09:00 No mining activity. Ventilation,
refuge bays, tramming, hoisting.
250 Low
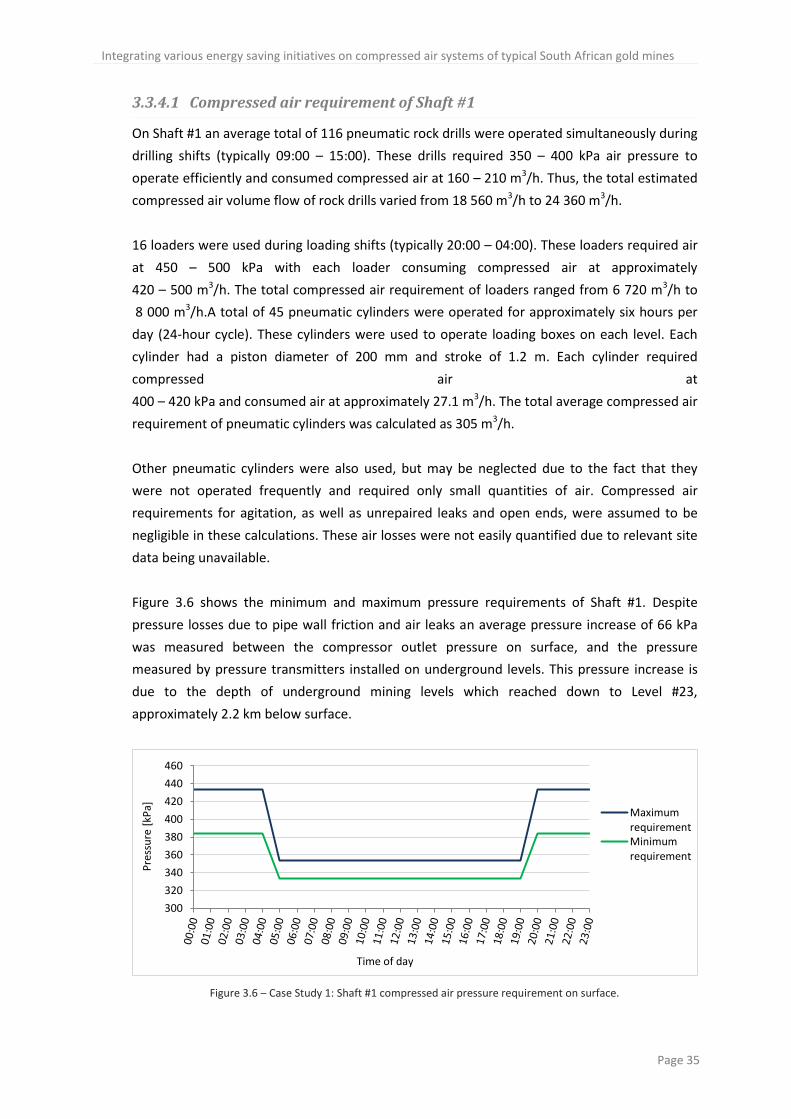
Integrating various energy saving initiatives on compressed air systems of typical South African gold mines
Page 35
3.3.4.1 Compressed air requirement of Shaft #1
On Shaft #1 an average total of 116 pneumatic rock drills were operated simultaneously during
drilling shifts (typically 09:00 – 15:00). These drills required 350 – 400 kPa air pressure to
operate efficiently and consumed compressed air at 160 – 210 m3/h. Thus, the total estimated
compressed air volume flow of rock drills varied from 18 560 m3/h to 24 360 m3/h.
16 loaders were used during loading shifts (typically 20:00 – 04:00). These loaders required air
at 450 – 500 kPa with each loader consuming compressed air at approximately
420 – 500 m3/h. The total compressed air requirement of loaders ranged from 6 720 m3/h to
8 000 m3/h.A total of 45 pneumatic cylinders were operated for approximately six hours per
day (24-hour cycle). These cylinders were used to operate loading boxes on each level. Each
cylinder had a piston diameter of 200 mm and stroke of 1.2 m. Each cylinder required
compressed air at
400 – 420 kPa and consumed air at approximately 27.1 m3/h. The total average compressed air
requirement of pneumatic cylinders was calculated as 305 m3/h.
Other pneumatic cylinders were also used, but may be neglected due to the fact that they
were not operated frequently and required only small quantities of air. Compressed air
requirements for agitation, as well as unrepaired leaks and open ends, were assumed to be
negligible in these calculations. These air losses were not easily quantified due to relevant site
data being unavailable.
Figure 3.6 shows the minimum and maximum pressure requirements of Shaft #1. Despite
pressure losses due to pipe wall friction and air leaks an average pressure increase of 66 kPa
was measured between the compressor outlet pressure on surface, and the pressure
measured by pressure transmitters installed on underground levels. This pressure increase is
due to the depth of underground mining levels which reached down to Level #23,
approximately 2.2 km below surface.
Figure 3.6 – Case Study 1: Shaft #1 compressed air pressure requirement on surface.
300
320
340
360
380
400
420
440
460
Pre
ssu
re [
kPa]
Time of day
MaximumrequirementMinimumrequirement
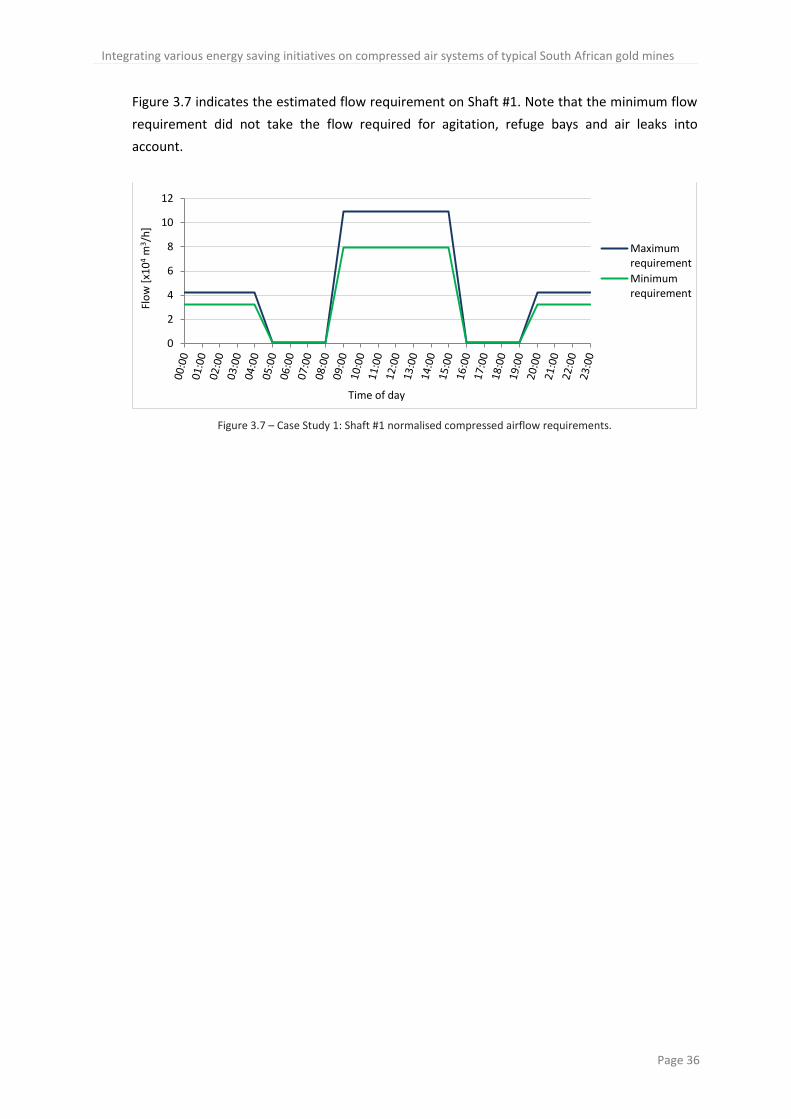
Integrating various energy saving initiatives on compressed air systems of typical South African gold mines
Page 36
Figure 3.7 indicates the estimated flow requirement on Shaft #1. Note that the minimum flow
requirement did not take the flow required for agitation, refuge bays and air leaks into
account.
Figure 3.7 – Case Study 1: Shaft #1 normalised compressed airflow requirements.
0
2
4
6
8
10
12
Flo
w [
x10
4 m
3 /h
]
Time of day
Maximumrequirement
Minimumrequirement
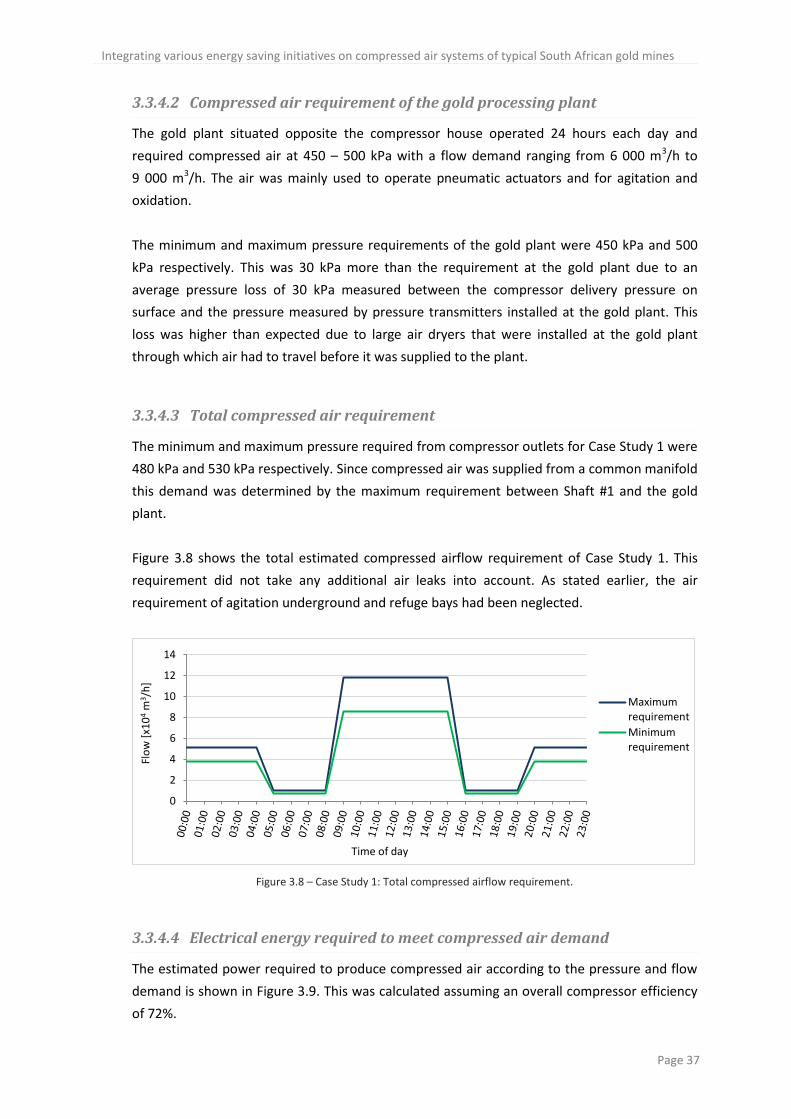
Integrating various energy saving initiatives on compressed air systems of typical South African gold mines
Page 37
3.3.4.2 Compressed air requirement of the gold processing plant
The gold plant situated opposite the compressor house operated 24 hours each day and
required compressed air at 450 – 500 kPa with a flow demand ranging from 6 000 m3/h to
9 000 m3/h. The air was mainly used to operate pneumatic actuators and for agitation and
oxidation.
The minimum and maximum pressure requirements of the gold plant were 450 kPa and 500
kPa respectively. This was 30 kPa more than the requirement at the gold plant due to an
average pressure loss of 30 kPa measured between the compressor delivery pressure on
surface and the pressure measured by pressure transmitters installed at the gold plant. This
loss was higher than expected due to large air dryers that were installed at the gold plant
through which air had to travel before it was supplied to the plant.
3.3.4.3 Total compressed air requirement
The minimum and maximum pressure required from compressor outlets for Case Study 1 were
480 kPa and 530 kPa respectively. Since compressed air was supplied from a common manifold
this demand was determined by the maximum requirement between Shaft #1 and the gold
plant.
Figure 3.8 shows the total estimated compressed airflow requirement of Case Study 1. This
requirement did not take any additional air leaks into account. As stated earlier, the air
requirement of agitation underground and refuge bays had been neglected.
Figure 3.8 – Case Study 1: Total compressed airflow requirement.
3.3.4.4 Electrical energy required to meet compressed air demand
The estimated power required to produce compressed air according to the pressure and flow
demand is shown in Figure 3.9. This was calculated assuming an overall compressor efficiency
of 72%.
0
2
4
6
8
10
12
14
Flo
w [
x10
4 m
3 /h
]
Time of day
Maximumrequirement
Minimumrequirement
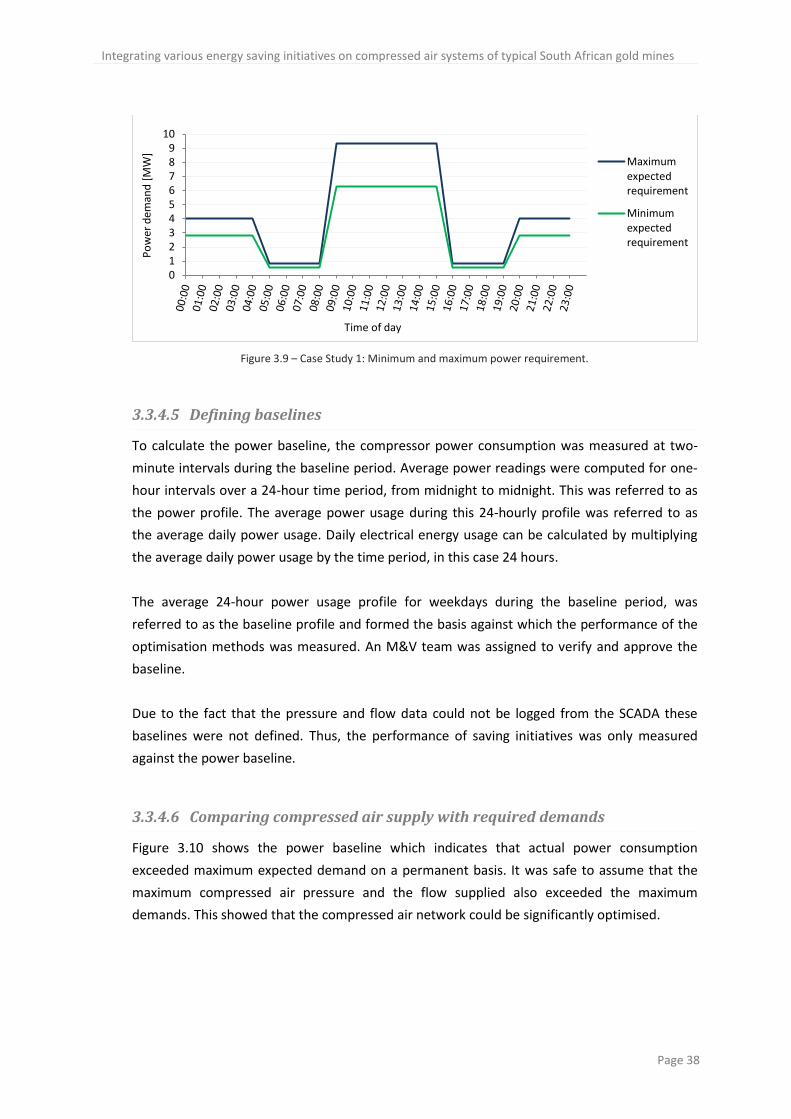
Integrating various energy saving initiatives on compressed air systems of typical South African gold mines
Page 38
Figure 3.9 – Case Study 1: Minimum and maximum power requirement.
3.3.4.5 Defining baselines
To calculate the power baseline, the compressor power consumption was measured at two-
minute intervals during the baseline period. Average power readings were computed for one-
hour intervals over a 24-hour time period, from midnight to midnight. This was referred to as
the power profile. The average power usage during this 24-hourly profile was referred to as
the average daily power usage. Daily electrical energy usage can be calculated by multiplying
the average daily power usage by the time period, in this case 24 hours.
The average 24-hour power usage profile for weekdays during the baseline period, was
referred to as the baseline profile and formed the basis against which the performance of the
optimisation methods was measured. An M&V team was assigned to verify and approve the
baseline.
Due to the fact that the pressure and flow data could not be logged from the SCADA these
baselines were not defined. Thus, the performance of saving initiatives was only measured
against the power baseline.
3.3.4.6 Comparing compressed air supply with required demands
Figure 3.10 shows the power baseline which indicates that actual power consumption
exceeded maximum expected demand on a permanent basis. It was safe to assume that the
maximum compressed air pressure and the flow supplied also exceeded the maximum
demands. This showed that the compressed air network could be significantly optimised.
0123456789
10P
ow
er d
eman
d [
MW
]
Time of day
Maximumexpectedrequirement
Minimumexpectedrequirement
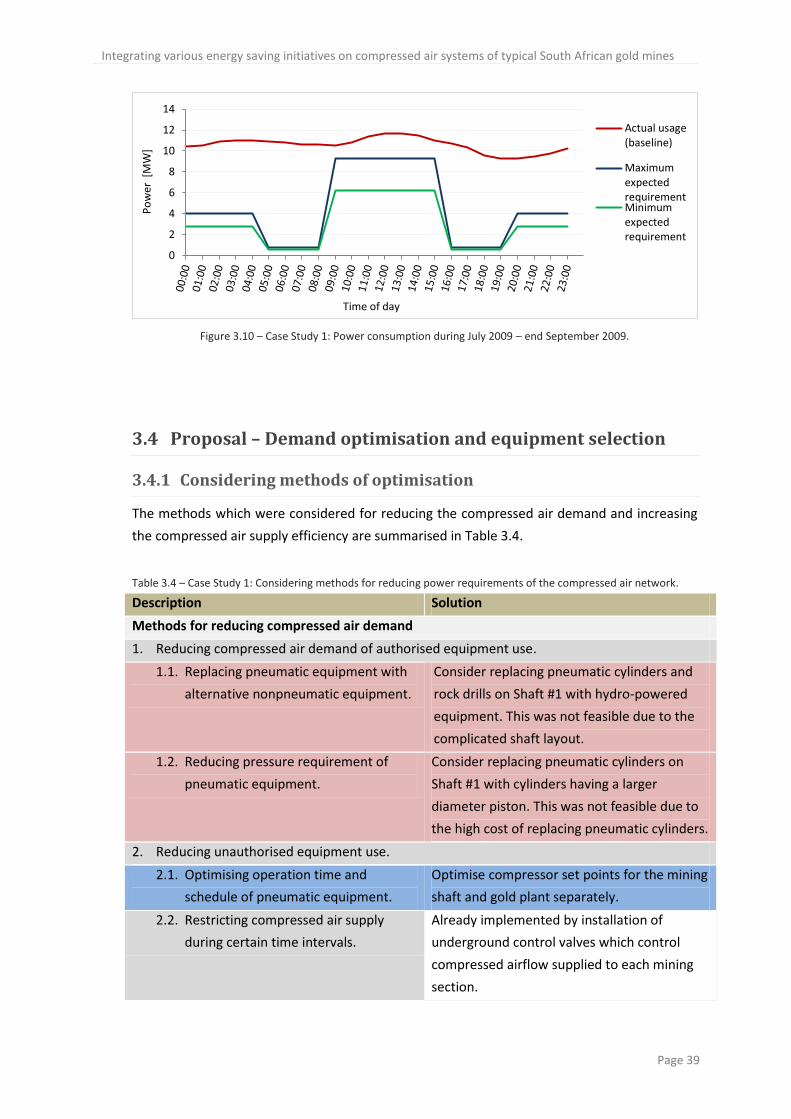
Integrating various energy saving initiatives on compressed air systems of typical South African gold mines
Page 39
Figure 3.10 – Case Study 1: Power consumption during July 2009 – end September 2009.
3.4 Proposal – Demand optimisation and equipment selection
3.4.1 Considering methods of optimisation
The methods which were considered for reducing the compressed air demand and increasing
the compressed air supply efficiency are summarised in Table 3.4.
Table 3.4 – Case Study 1: Considering methods for reducing power requirements of the compressed air network.
Description Solution
Methods for reducing compressed air demand
1. Reducing compressed air demand of authorised equipment use.
1.1. Replacing pneumatic equipment with
alternative nonpneumatic equipment.
Consider replacing pneumatic cylinders and
rock drills on Shaft #1 with hydro-powered
equipment. This was not feasible due to the
complicated shaft layout.
1.2. Reducing pressure requirement of
pneumatic equipment.
Consider replacing pneumatic cylinders on
Shaft #1 with cylinders having a larger
diameter piston. This was not feasible due to
the high cost of replacing pneumatic cylinders.
2. Reducing unauthorised equipment use.
2.1. Optimising operation time and
schedule of pneumatic equipment.
Optimise compressor set points for the mining
shaft and gold plant separately.
2.2. Restricting compressed air supply
during certain time intervals.
Already implemented by installation of
underground control valves which control
compressed airflow supplied to each mining
section.
0
2
4
6
8
10
12
14
Po
wer
[M
W]
Time of day
Actual usage(baseline)
MaximumexpectedrequirementMinimumexpectedrequirement
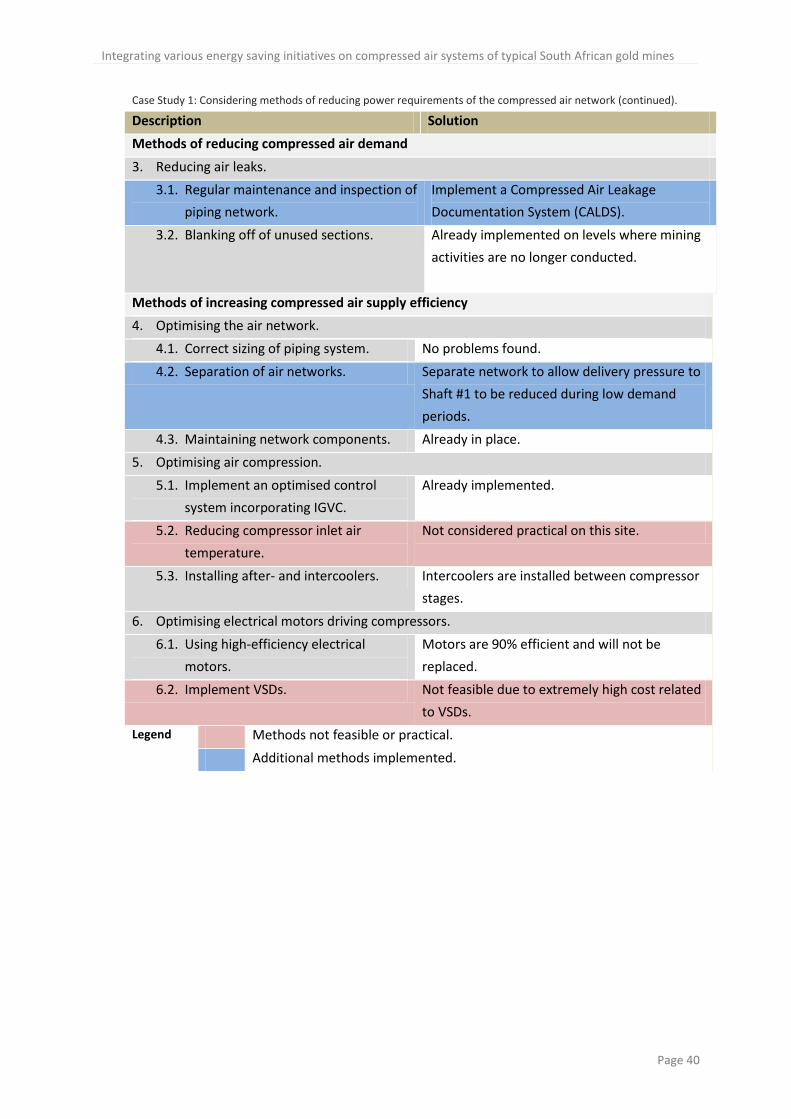
Integrating various energy saving initiatives on compressed air systems of typical South African gold mines
Page 40
Case Study 1: Considering methods of reducing power requirements of the compressed air network (continued).
Description Solution
Methods of reducing compressed air demand
3. Reducing air leaks.
3.1. Regular maintenance and inspection of
piping network.
Implement a Compressed Air Leakage
Documentation System (CALDS).
3.2. Blanking off of unused sections. Already implemented on levels where mining
activities are no longer conducted.
Methods of increasing compressed air supply efficiency
4. Optimising the air network.
4.1. Correct sizing of piping system. No problems found.
4.2. Separation of air networks. Separate network to allow delivery pressure to
Shaft #1 to be reduced during low demand
periods.
4.3. Maintaining network components. Already in place.
5. Optimising air compression.
5.1. Implement an optimised control
system incorporating IGVC.
Already implemented.
5.2. Reducing compressor inlet air
temperature.
Not considered practical on this site.
5.3. Installing after- and intercoolers. Intercoolers are installed between compressor
stages.
6. Optimising electrical motors driving compressors.
6.1. Using high-efficiency electrical
motors.
Motors are 90% efficient and will not be
replaced.
6.2. Implement VSDs. Not feasible due to extremely high cost related
to VSDs.
Legend Methods not feasible or practical.
Additional methods implemented.
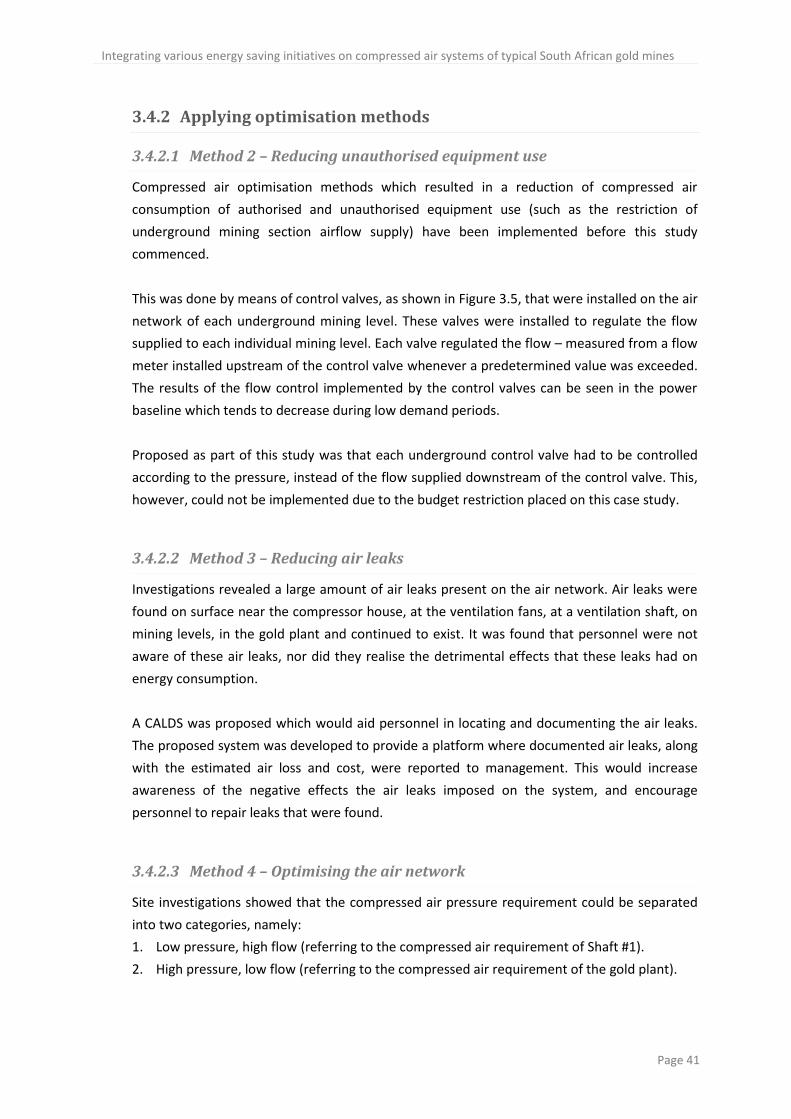
Integrating various energy saving initiatives on compressed air systems of typical South African gold mines
Page 41
3.4.2 Applying optimisation methods
3.4.2.1 Method 2 – Reducing unauthorised equipment use
Compressed air optimisation methods which resulted in a reduction of compressed air
consumption of authorised and unauthorised equipment use (such as the restriction of
underground mining section airflow supply) have been implemented before this study
commenced.
This was done by means of control valves, as shown in Figure 3.5, that were installed on the air
network of each underground mining level. These valves were installed to regulate the flow
supplied to each individual mining level. Each valve regulated the flow – measured from a flow
meter installed upstream of the control valve whenever a predetermined value was exceeded.
The results of the flow control implemented by the control valves can be seen in the power
baseline which tends to decrease during low demand periods.
Proposed as part of this study was that each underground control valve had to be controlled
according to the pressure, instead of the flow supplied downstream of the control valve. This,
however, could not be implemented due to the budget restriction placed on this case study.
3.4.2.2 Method 3 – Reducing air leaks
Investigations revealed a large amount of air leaks present on the air network. Air leaks were
found on surface near the compressor house, at the ventilation fans, at a ventilation shaft, on
mining levels, in the gold plant and continued to exist. It was found that personnel were not
aware of these air leaks, nor did they realise the detrimental effects that these leaks had on
energy consumption.
A CALDS was proposed which would aid personnel in locating and documenting the air leaks.
The proposed system was developed to provide a platform where documented air leaks, along
with the estimated air loss and cost, were reported to management. This would increase
awareness of the negative effects the air leaks imposed on the system, and encourage
personnel to repair leaks that were found.
3.4.2.3 Method 4 – Optimising the air network
Site investigations showed that the compressed air pressure requirement could be separated
into two categories, namely:
1. Low pressure, high flow (referring to the compressed air requirement of Shaft #1).
2. High pressure, low flow (referring to the compressed air requirement of the gold plant).
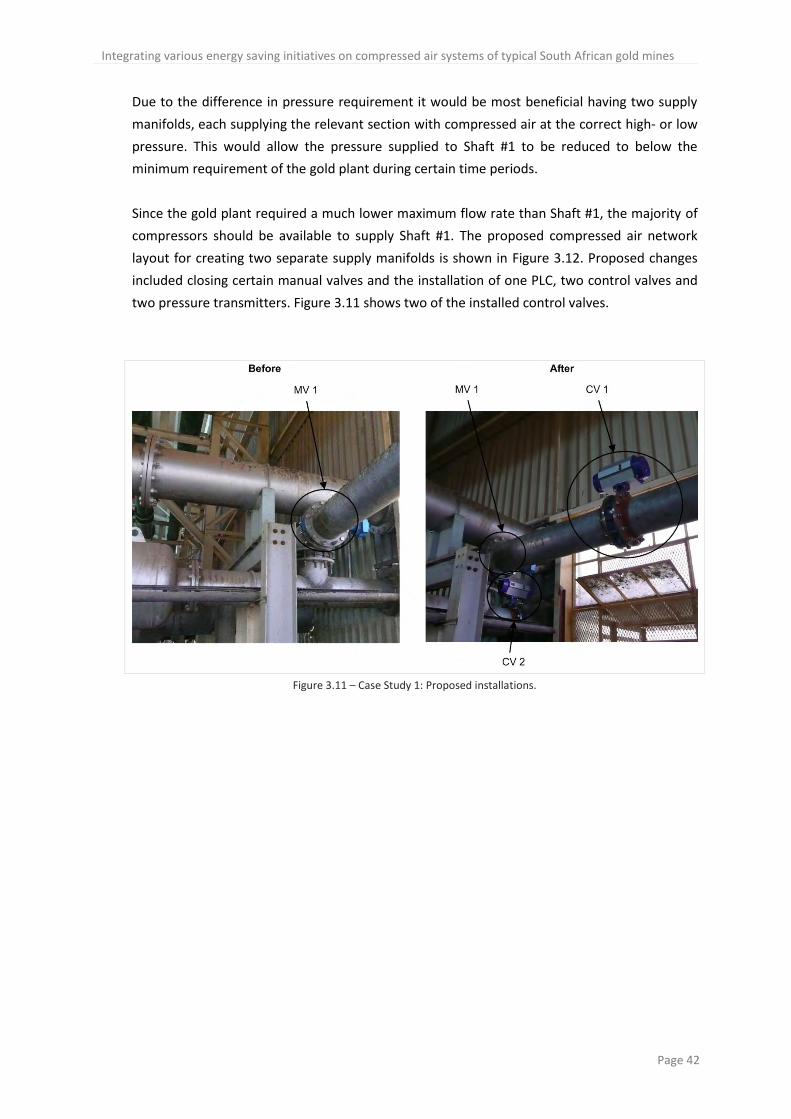
Integrating various energy saving initiatives on compressed air systems of typical South African gold mines
Page 42
Due to the difference in pressure requirement it would be most beneficial having two supply
manifolds, each supplying the relevant section with compressed air at the correct high- or low
pressure. This would allow the pressure supplied to Shaft #1 to be reduced to below the
minimum requirement of the gold plant during certain time periods.
Since the gold plant required a much lower maximum flow rate than Shaft #1, the majority of
compressors should be available to supply Shaft #1. The proposed compressed air network
layout for creating two separate supply manifolds is shown in Figure 3.12. Proposed changes
included closing certain manual valves and the installation of one PLC, two control valves and
two pressure transmitters. Figure 3.11 shows two of the installed control valves.
Figure 3.11 – Case Study 1: Proposed installations.
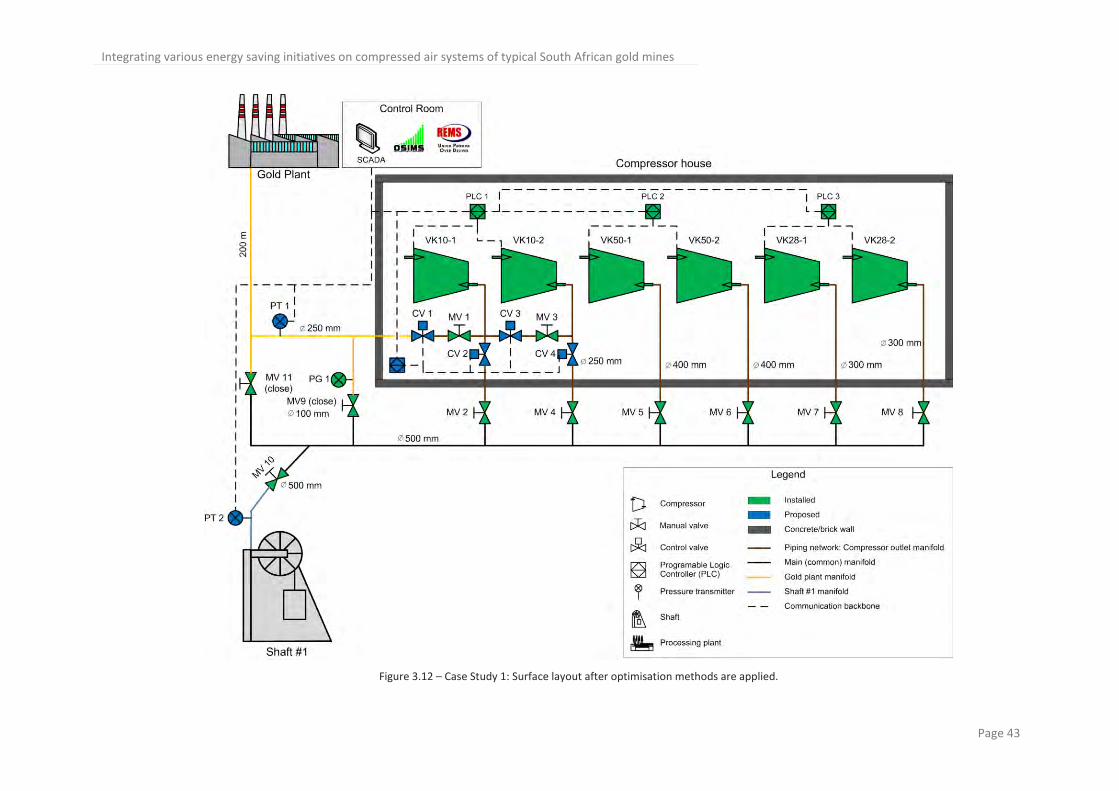
Integrating various energy saving initiatives on compressed air systems of typical South African gold mines
Page 43
Figure 3.12 – Case Study 1: Surface layout after optimisation methods are applied.
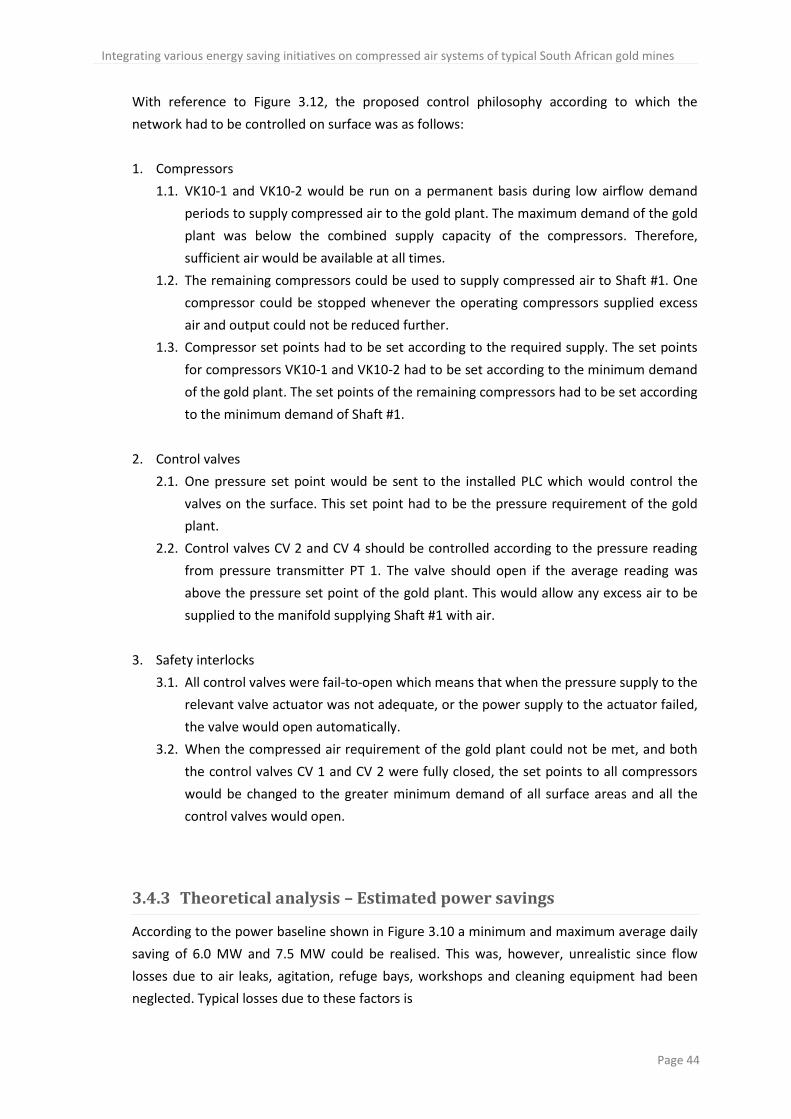
Integrating various energy saving initiatives on compressed air systems of typical South African gold mines
Page 44
With reference to Figure 3.12, the proposed control philosophy according to which the
network had to be controlled on surface was as follows:
1. Compressors
1.1. VK10-1 and VK10-2 would be run on a permanent basis during low airflow demand
periods to supply compressed air to the gold plant. The maximum demand of the gold
plant was below the combined supply capacity of the compressors. Therefore,
sufficient air would be available at all times.
1.2. The remaining compressors could be used to supply compressed air to Shaft #1. One
compressor could be stopped whenever the operating compressors supplied excess
air and output could not be reduced further.
1.3. Compressor set points had to be set according to the required supply. The set points
for compressors VK10-1 and VK10-2 had to be set according to the minimum demand
of the gold plant. The set points of the remaining compressors had to be set according
to the minimum demand of Shaft #1.
2. Control valves
2.1. One pressure set point would be sent to the installed PLC which would control the
valves on the surface. This set point had to be the pressure requirement of the gold
plant.
2.2. Control valves CV 2 and CV 4 should be controlled according to the pressure reading
from pressure transmitter PT 1. The valve should open if the average reading was
above the pressure set point of the gold plant. This would allow any excess air to be
supplied to the manifold supplying Shaft #1 with air.
3. Safety interlocks
3.1. All control valves were fail-to-open which means that when the pressure supply to the
relevant valve actuator was not adequate, or the power supply to the actuator failed,
the valve would open automatically.
3.2. When the compressed air requirement of the gold plant could not be met, and both
the control valves CV 1 and CV 2 were fully closed, the set points to all compressors
would be changed to the greater minimum demand of all surface areas and all the
control valves would open.
3.4.3 Theoretical analysis – Estimated power savings
According to the power baseline shown in Figure 3.10 a minimum and maximum average daily
saving of 6.0 MW and 7.5 MW could be realised. This was, however, unrealistic since flow
losses due to air leaks, agitation, refuge bays, workshops and cleaning equipment had been
neglected. Typical losses due to these factors is
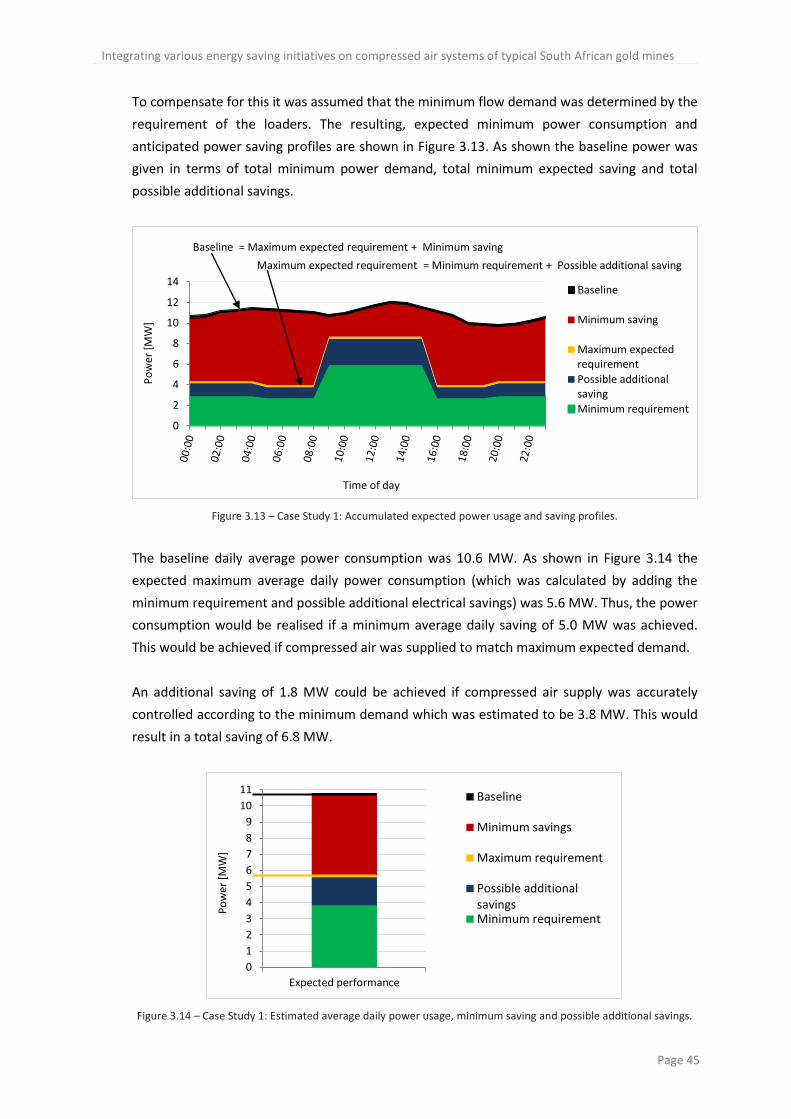
Integrating various energy saving initiatives on compressed air systems of typical South African gold mines
Page 45
To compensate for this it was assumed that the minimum flow demand was determined by the
requirement of the loaders. The resulting, expected minimum power consumption and
anticipated power saving profiles are shown in Figure 3.13. As shown the baseline power was
given in terms of total minimum power demand, total minimum expected saving and total
possible additional savings.
Figure 3.13 – Case Study 1: Accumulated expected power usage and saving profiles.
The baseline daily average power consumption was 10.6 MW. As shown in Figure 3.14 the
expected maximum average daily power consumption (which was calculated by adding the
minimum requirement and possible additional electrical savings) was 5.6 MW. Thus, the power
consumption would be realised if a minimum average daily saving of 5.0 MW was achieved.
This would be achieved if compressed air was supplied to match maximum expected demand.
An additional saving of 1.8 MW could be achieved if compressed air supply was accurately
controlled according to the minimum demand which was estimated to be 3.8 MW. This would
result in a total saving of 6.8 MW.
Figure 3.14 – Case Study 1: Estimated average daily power usage, minimum saving and possible additional savings.
0
2
4
6
8
10
12
14
Po
wer
[M
W]
Time of day
Baseline
Minimum saving
Maximum expectedrequirement
Possible additionalsaving
Minimum requirement
Baseline = Maximum expected requirement + Minimum saving
Maximum expected requirement = Minimum requirement + Possible additional saving
0
1
2
3
4
5
6
7
8
9
10
11
Expected performance
Po
wer
[M
W]
Baseline
Minimum savings
Maximum requirement
Possible additionalsavingsMinimum requirement
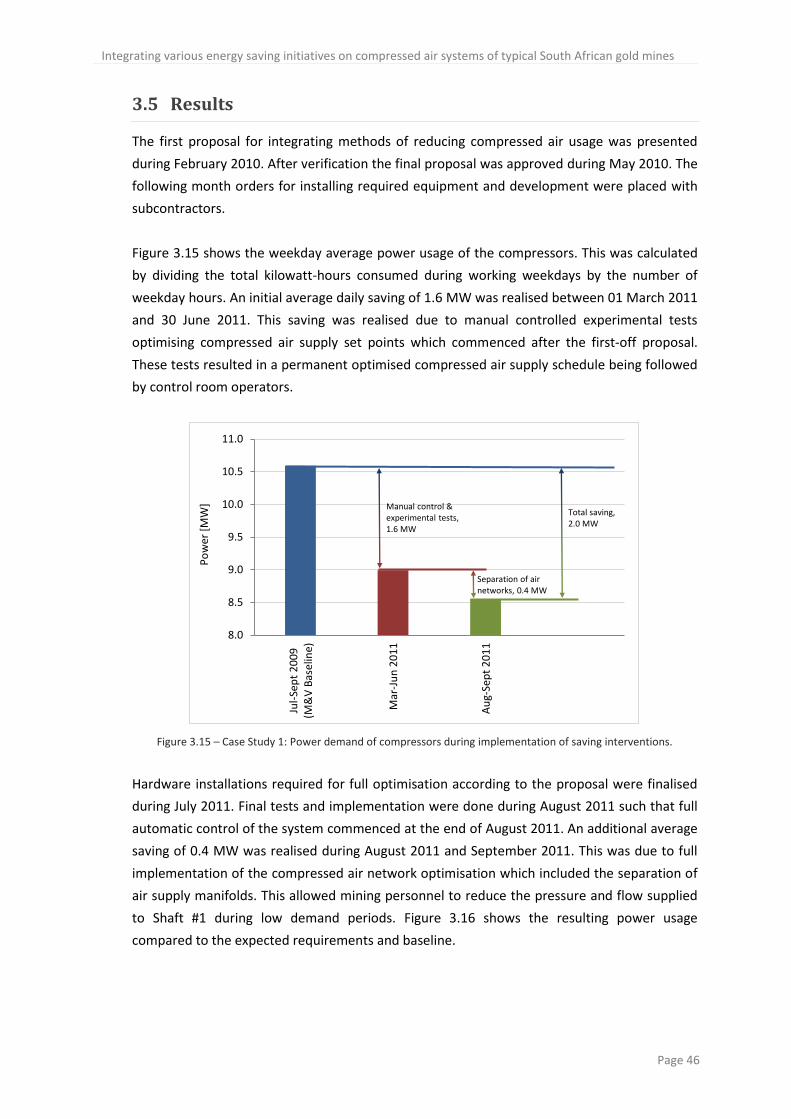
Integrating various energy saving initiatives on compressed air systems of typical South African gold mines
Page 46
3.5 Results
The first proposal for integrating methods of reducing compressed air usage was presented
during February 2010. After verification the final proposal was approved during May 2010. The
following month orders for installing required equipment and development were placed with
subcontractors.
Figure 3.15 shows the weekday average power usage of the compressors. This was calculated
by dividing the total kilowatt-hours consumed during working weekdays by the number of
weekday hours. An initial average daily saving of 1.6 MW was realised between 01 March 2011
and 30 June 2011. This saving was realised due to manual controlled experimental tests
optimising compressed air supply set points which commenced after the first-off proposal.
These tests resulted in a permanent optimised compressed air supply schedule being followed
by control room operators.
Figure 3.15 – Case Study 1: Power demand of compressors during implementation of saving interventions.
Hardware installations required for full optimisation according to the proposal were finalised
during July 2011. Final tests and implementation were done during August 2011 such that full
automatic control of the system commenced at the end of August 2011. An additional average
saving of 0.4 MW was realised during August 2011 and September 2011. This was due to full
implementation of the compressed air network optimisation which included the separation of
air supply manifolds. This allowed mining personnel to reduce the pressure and flow supplied
to Shaft #1 during low demand periods. Figure 3.16 shows the resulting power usage
compared to the expected requirements and baseline.
8.0
8.5
9.0
9.5
10.0
10.5
11.0
Jul-
Sep
t 2
00
9(M
&V
Bas
elin
e)
Mar
-Ju
n 2
01
1
Au
g-Se
pt
20
11
Po
wer
[M
W] Manual control &
experimental tests, 1.6 MW
Separation of air networks, 0.4 MW
Total saving, 2.0 MW
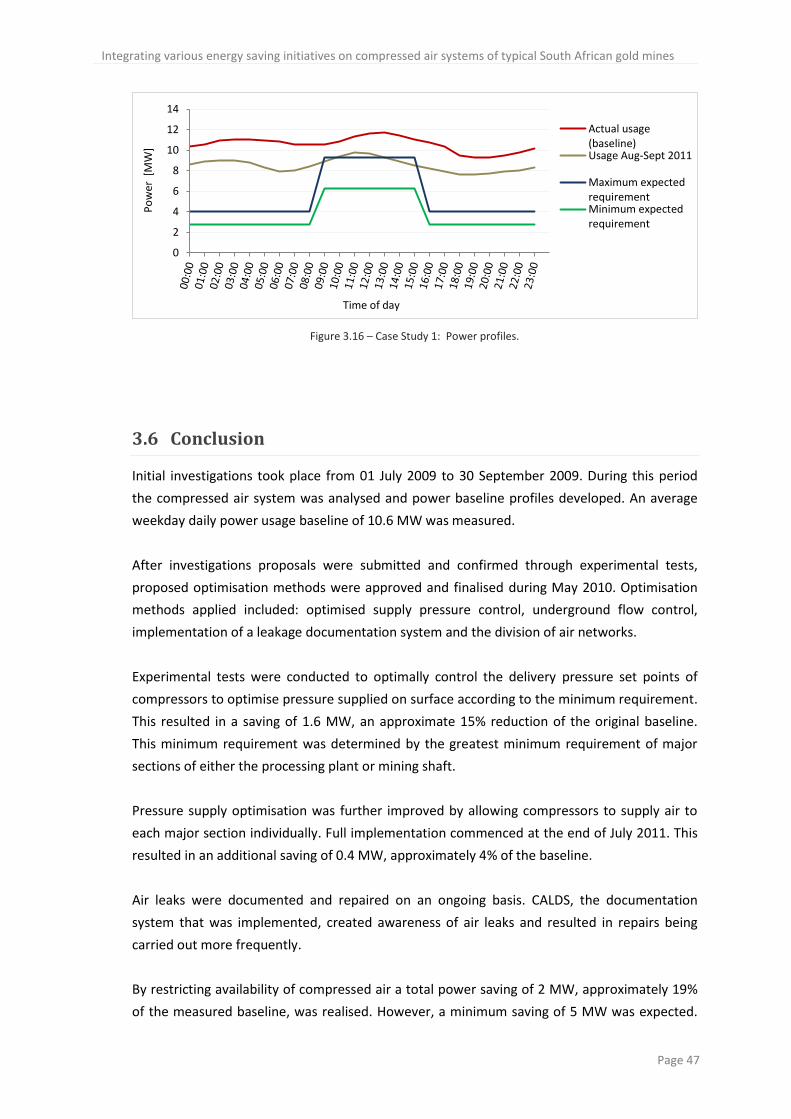
Integrating various energy saving initiatives on compressed air systems of typical South African gold mines
Page 47
Figure 3.16 – Case Study 1: Power profiles.
3.6 Conclusion
Initial investigations took place from 01 July 2009 to 30 September 2009. During this period
the compressed air system was analysed and power baseline profiles developed. An average
weekday daily power usage baseline of 10.6 MW was measured.
After investigations proposals were submitted and confirmed through experimental tests,
proposed optimisation methods were approved and finalised during May 2010. Optimisation
methods applied included: optimised supply pressure control, underground flow control,
implementation of a leakage documentation system and the division of air networks.
Experimental tests were conducted to optimally control the delivery pressure set points of
compressors to optimise pressure supplied on surface according to the minimum requirement.
This resulted in a saving of 1.6 MW, an approximate 15% reduction of the original baseline.
This minimum requirement was determined by the greatest minimum requirement of major
sections of either the processing plant or mining shaft.
Pressure supply optimisation was further improved by allowing compressors to supply air to
each major section individually. Full implementation commenced at the end of July 2011. This
resulted in an additional saving of 0.4 MW, approximately 4% of the baseline.
Air leaks were documented and repaired on an ongoing basis. CALDS, the documentation
system that was implemented, created awareness of air leaks and resulted in repairs being
carried out more frequently.
By restricting availability of compressed air a total power saving of 2 MW, approximately 19%
of the measured baseline, was realised. However, a minimum saving of 5 MW was expected.
0
2
4
6
8
10
12
14
Po
wer
[M
W]
Time of day
Actual usage(baseline)Usage Aug-Sept 2011
Maximum expectedrequirementMinimum expectedrequirement

Integrating various energy saving initiatives on compressed air systems of typical South African gold mines
Page 48
Investigations showed that the underground control valves proved to be unreliable and did not
regulate the flow accurately. This was due to the flow meters not measuring the flow rates
correctly due to a large amount of moisture in the compressed air supply lines which resulted
in limited control of the air system.
Despite increases in production during 2011 the overall compressed air usage and power
requirement was reduced. It is expected that the air consumption of Shaft #1 could be reduced
further by providing accurate control of air supplied to mining levels. This will require the
following to be done:
1. Installation of pressure transmitters downstream of control valves on each
underground mining level.
2. Repairing control valves installed on underground mining levels.
3. Infrastructure that will allow compressed air system data to be monitored and
captured continuously.
Integrating various energy saving initiatives on compressed air systems of typical South African gold mines
Page 49
4 Case Study 2: Integrating various energy saving initiatives
4.1 Introduction
Figure 4.1 shows the surface site layout for Case Study 2 before project implementation. This
study was conducted at a different mining site than the first study. The layout included three
mining shafts and one gold plant. All valves on surface were in the fully open position and
compressed air was supplied from the compressor house located at Shaft #1 via a common
manifold.
Compressed air savings were achieved through the implementation of similar methods
implemented in Case Study 1 – with the exception of the method in which underground
control valves were controlled. During this case study all sections of the compressed air
network were continuously monitored and controlled. Unlike Case Study 1 both pressure and
flow was considdered in the control loops. This allowed for full integrated control of the
compressed air system which caused a significant increase in energy savings.
4.2 First-off Investigation – Overview of compressed air network
4.2.1 Instrumentation and data logging
Instrumentation installed onsite (such as flow meters, pressure transmitters, ammeters,
voltmeters and electrical power meters) were used to obtain site data. The data was used to
measure the performance of energy saving initiatives.
After calibration, a correction factor of 1.16 was used to obtain accurate compressor motor
power readings logged by the SCADA. This factor was determined by calculating actual power
usage from the ammeter and voltmeter readings, and comparing the results with the power
logged on the SCADA.
The correction factor used on power readings was verified by calculating the expected total
power consumption of compressors using the average delivery pressure and total flow and
comparing results with the corrected power readings.
Results showed that the expected total power consumption calculated from the average
delivery pressure and flow was within 6% of the corrected power readings.
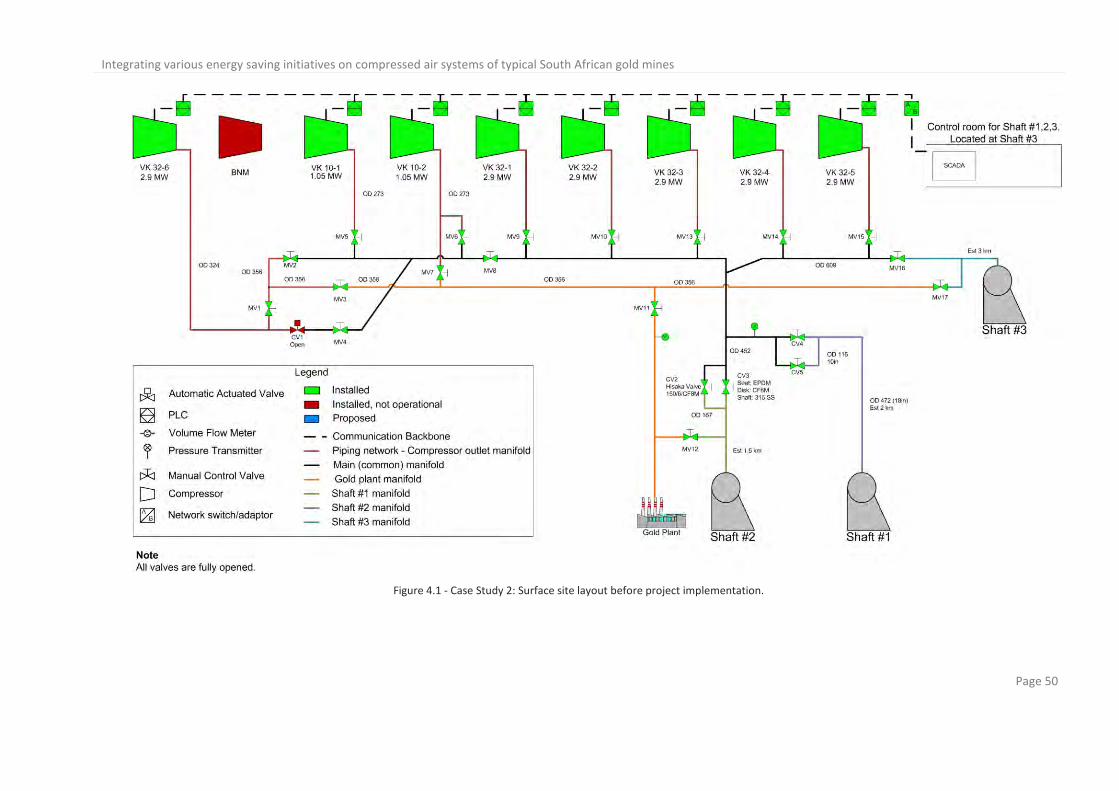
Integrating various energy saving initiatives on compressed air systems of typical South African gold mines
Page 50
Figure 4.1 - Case Study 2: Surface site layout before project implementation.
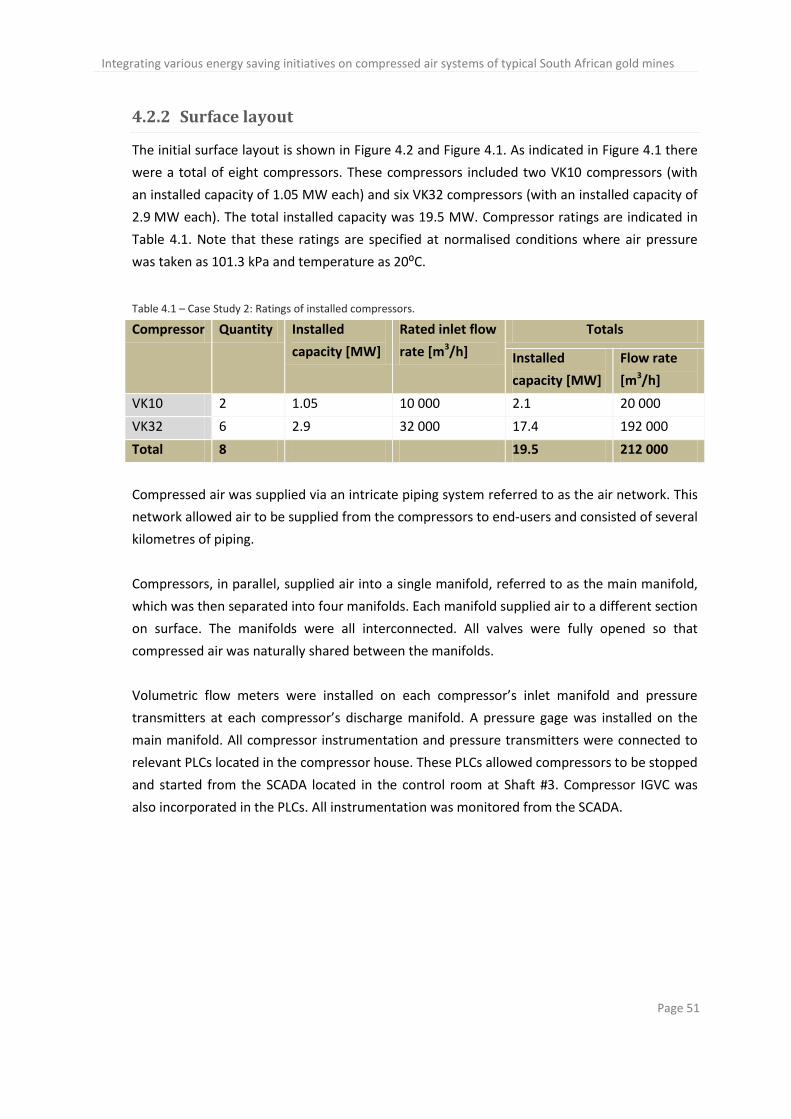
Integrating various energy saving initiatives on compressed air systems of typical South African gold mines
Page 51
4.2.2 Surface layout
The initial surface layout is shown in Figure 4.2 and Figure 4.1. As indicated in Figure 4.1 there
were a total of eight compressors. These compressors included two VK10 compressors (with
an installed capacity of 1.05 MW each) and six VK32 compressors (with an installed capacity of
2.9 MW each). The total installed capacity was 19.5 MW. Compressor ratings are indicated in
Table 4.1. Note that these ratings are specified at normalised conditions where air pressure
was taken as 101.3 kPa and temperature as 20⁰C.
Table 4.1 – Case Study 2: Ratings of installed compressors.
Compressor Quantity Installed
capacity [MW]
Rated inlet flow
rate [m3/h]
Totals
Installed
capacity [MW]
Flow rate
[m3/h]
VK10 2 1.05 10 000 2.1 20 000
VK32 6 2.9 32 000 17.4 192 000
Total 8 19.5 212 000
Compressed air was supplied via an intricate piping system referred to as the air network. This
network allowed air to be supplied from the compressors to end-users and consisted of several
kilometres of piping.
Compressors, in parallel, supplied air into a single manifold, referred to as the main manifold,
which was then separated into four manifolds. Each manifold supplied air to a different section
on surface. The manifolds were all interconnected. All valves were fully opened so that
compressed air was naturally shared between the manifolds.
Volumetric flow meters were installed on each compressor’s inlet manifold and pressure
transmitters at each compressor’s discharge manifold. A pressure gage was installed on the
main manifold. All compressor instrumentation and pressure transmitters were connected to
relevant PLCs located in the compressor house. These PLCs allowed compressors to be stopped
and started from the SCADA located in the control room at Shaft #3. Compressor IGVC was
also incorporated in the PLCs. All instrumentation was monitored from the SCADA.

Integrating various energy saving initiatives on compressed air systems of typical South African gold mines
Page 52
Figure 4.2 – Case Study 2: Valves installed on surface at 1# compressor house.
Note:
MV – Manual Valve
CV – Control Valve
MV1 MV2 CV1
MV4
MV5
MV7
MV6
MV8
MV15 MV17 MV16
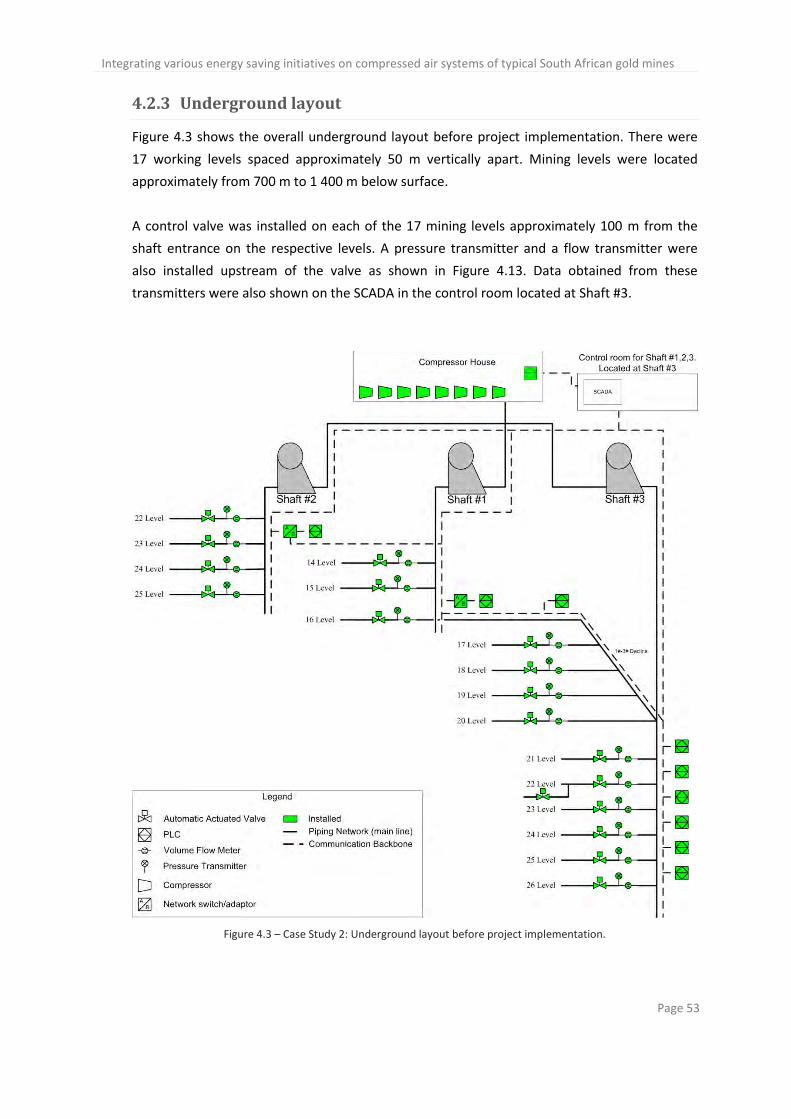
Integrating various energy saving initiatives on compressed air systems of typical South African gold mines
Page 53
4.2.3 Underground layout
Figure 4.3 shows the overall underground layout before project implementation. There were
17 working levels spaced approximately 50 m vertically apart. Mining levels were located
approximately from 700 m to 1 400 m below surface.
A control valve was installed on each of the 17 mining levels approximately 100 m from the
shaft entrance on the respective levels. A pressure transmitter and a flow transmitter were
also installed upstream of the valve as shown in Figure 4.13. Data obtained from these
transmitters were also shown on the SCADA in the control room located at Shaft #3.
Figure 4.3 – Case Study 2: Underground layout before project implementation.
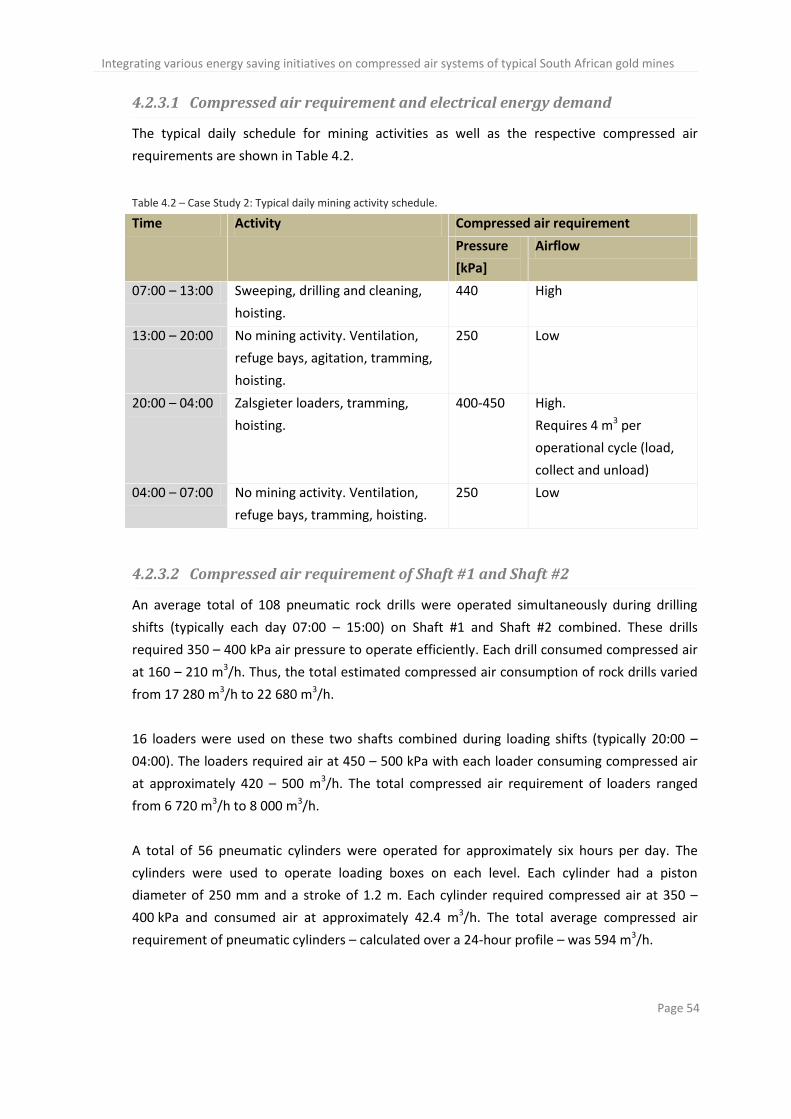
Integrating various energy saving initiatives on compressed air systems of typical South African gold mines
Page 54
4.2.3.1 Compressed air requirement and electrical energy demand
The typical daily schedule for mining activities as well as the respective compressed air
requirements are shown in Table 4.2.
Table 4.2 – Case Study 2: Typical daily mining activity schedule.
Time Activity Compressed air requirement
Pressure
[kPa]
Airflow
07:00 – 13:00 Sweeping, drilling and cleaning,
hoisting.
440 High
13:00 – 20:00 No mining activity. Ventilation,
refuge bays, agitation, tramming,
hoisting.
250 Low
20:00 – 04:00 Zalsgieter loaders, tramming,
hoisting.
400-450 High.
Requires 4 m3 per
operational cycle (load,
collect and unload)
04:00 – 07:00 No mining activity. Ventilation,
refuge bays, tramming, hoisting.
250 Low
4.2.3.2 Compressed air requirement of Shaft #1 and Shaft #2
An average total of 108 pneumatic rock drills were operated simultaneously during drilling
shifts (typically each day 07:00 – 15:00) on Shaft #1 and Shaft #2 combined. These drills
required 350 – 400 kPa air pressure to operate efficiently. Each drill consumed compressed air
at 160 – 210 m3/h. Thus, the total estimated compressed air consumption of rock drills varied
from 17 280 m3/h to 22 680 m3/h.
16 loaders were used on these two shafts combined during loading shifts (typically 20:00 –
04:00). The loaders required air at 450 – 500 kPa with each loader consuming compressed air
at approximately 420 – 500 m3/h. The total compressed air requirement of loaders ranged
from 6 720 m3/h to 8 000 m3/h.
A total of 56 pneumatic cylinders were operated for approximately six hours per day. The
cylinders were used to operate loading boxes on each level. Each cylinder had a piston
diameter of 250 mm and a stroke of 1.2 m. Each cylinder required compressed air at 350 –
400 kPa and consumed air at approximately 42.4 m3/h. The total average compressed air
requirement of pneumatic cylinders – calculated over a 24-hour profile – was 594 m3/h.
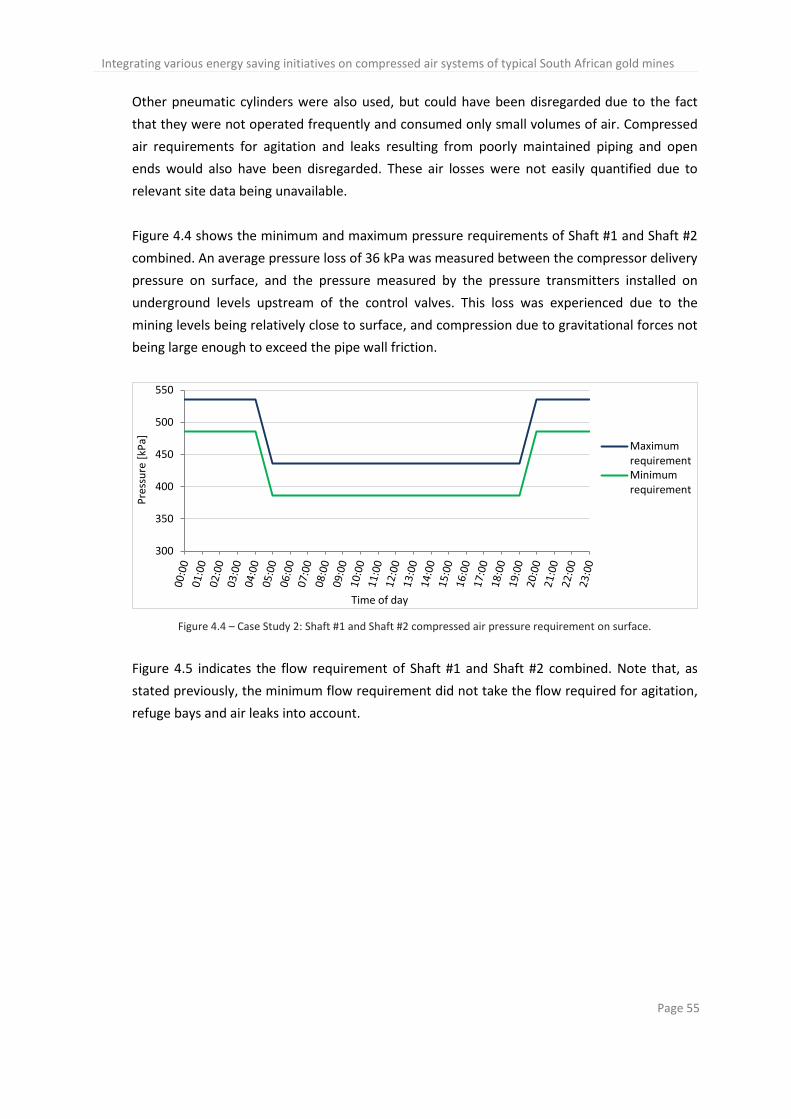
Integrating various energy saving initiatives on compressed air systems of typical South African gold mines
Page 55
Other pneumatic cylinders were also used, but could have been disregarded due to the fact
that they were not operated frequently and consumed only small volumes of air. Compressed
air requirements for agitation and leaks resulting from poorly maintained piping and open
ends would also have been disregarded. These air losses were not easily quantified due to
relevant site data being unavailable.
Figure 4.4 shows the minimum and maximum pressure requirements of Shaft #1 and Shaft #2
combined. An average pressure loss of 36 kPa was measured between the compressor delivery
pressure on surface, and the pressure measured by the pressure transmitters installed on
underground levels upstream of the control valves. This loss was experienced due to the
mining levels being relatively close to surface, and compression due to gravitational forces not
being large enough to exceed the pipe wall friction.
Figure 4.4 – Case Study 2: Shaft #1 and Shaft #2 compressed air pressure requirement on surface.
Figure 4.5 indicates the flow requirement of Shaft #1 and Shaft #2 combined. Note that, as
stated previously, the minimum flow requirement did not take the flow required for agitation,
refuge bays and air leaks into account.
300
350
400
450
500
550
Pre
ssu
re [
kPa]
Time of day
MaximumrequirementMinimumrequirement
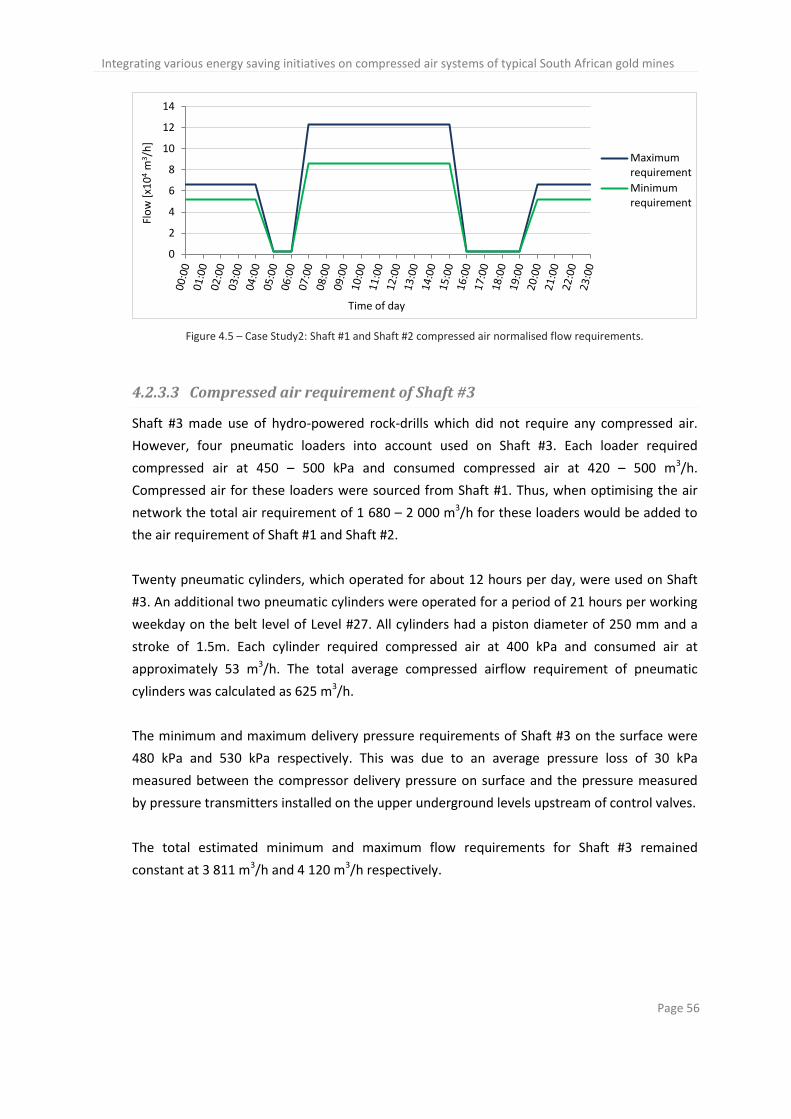
Integrating various energy saving initiatives on compressed air systems of typical South African gold mines
Page 56
Figure 4.5 – Case Study2: Shaft #1 and Shaft #2 compressed air normalised flow requirements.
4.2.3.3 Compressed air requirement of Shaft #3
Shaft #3 made use of hydro-powered rock-drills which did not require any compressed air.
However, four pneumatic loaders into account used on Shaft #3. Each loader required
compressed air at 450 – 500 kPa and consumed compressed air at 420 – 500 m3/h.
Compressed air for these loaders were sourced from Shaft #1. Thus, when optimising the air
network the total air requirement of 1 680 – 2 000 m3/h for these loaders would be added to
the air requirement of Shaft #1 and Shaft #2.
Twenty pneumatic cylinders, which operated for about 12 hours per day, were used on Shaft
#3. An additional two pneumatic cylinders were operated for a period of 21 hours per working
weekday on the belt level of Level #27. All cylinders had a piston diameter of 250 mm and a
stroke of 1.5m. Each cylinder required compressed air at 400 kPa and consumed air at
approximately 53 m3/h. The total average compressed airflow requirement of pneumatic
cylinders was calculated as 625 m3/h.
The minimum and maximum delivery pressure requirements of Shaft #3 on the surface were
480 kPa and 530 kPa respectively. This was due to an average pressure loss of 30 kPa
measured between the compressor delivery pressure on surface and the pressure measured
by pressure transmitters installed on the upper underground levels upstream of control valves.
The total estimated minimum and maximum flow requirements for Shaft #3 remained
constant at 3 811 m3/h and 4 120 m3/h respectively.
0
2
4
6
8
10
12
14
Flo
w [
x10
4 m
3 /h
]
Time of day
Maximumrequirement
Minimumrequirement
Integrating various energy saving initiatives on compressed air systems of typical South African gold mines
Page 57
4.2.3.4 Compressed air requirement of the gold processing plant
The gold plant situated at Shaft 1# operated 24 hours each day and required compressed air at
450 – 500 kPa, with the compressed airflow demand ranging from 1000 m3/h to 1500 m3/h.
This air was mainly used to operate pneumatic actuators and for agitation and oxidation.
The minimum and maximum delivery pressure requirements of the gold plant were 465 kPa
and 505 kPa respectively. This was 25 kPa more than the requirement at the gold plant due to
the pressure loss between the compressor delivery pressure on surface and the pressure
measured by pressure transmitters installed at the gold plant. This pressure loss correlated
well with expected pressure loss, as shown in Figure 2.9, for a pipe of 1 km in length and with
an internal diameter of 250 mm.
The total minimum and maximum estimated flow requirements for the gold plant remained
constant at 5 795 m3/h and 9 433 m3/h respectively.
4.2.3.5 Total compressed air requirement
Figure 4.6 shows the minimum and maximum pressure required on surface for Case Study 2.
Due to the pressure loss between surface and underground levels the minimum pressure
required on surface was higher than the minimum pressure required underground.
Figure 4.6 – Case Study 2: Minimum and maximum compressed air pressure required on surface.
Figure 4.7 shows the total estimated compressed airflow requirement for Case Study 2. This
requirement did not take any additional air leaks into account. As stated previously, the air
requirement of agitation underground and refuge bays had also been neglected.
450460470480490500510520530540550
Pre
ssu
re [
kPa]
Time of day
MaximumrequirementMinimumrequirement

Integrating various energy saving initiatives on compressed air systems of typical South African gold mines
Page 58
Figure 4.7 – Case Study 2: Total compressed airflow requirement.
4.2.3.6 Electrical energy required to meet compressed air demand
The estimated power required to produce compressed air according to the pressure and flow
demand is shown in Figure 4.8. This was calculated assuming an overall compressor efficiency
of 72%.
Figure 4.8 – Case study 2: Minimum and maximum power requirement.
4.2.3.7 Defining baselines
Initial investigations on this case study commenced during January 2009. The three-month
period from 01 January 2009 to 31 March 2009 is referred to as the baseline period. During
this period compressor power consumption, delivery pressure and flow were measured at
two-minute intervals.
0
2
4
6
8
10
12
14
16
Flo
w [
x10
4 m
3 /h
]
Time of day
Maximumrequirement
Minimumrequirement
0
2
4
6
8
10
12
Po
wer
dem
and
[M
W]
Time of day
Maximumrequirement
Minimumrequirement
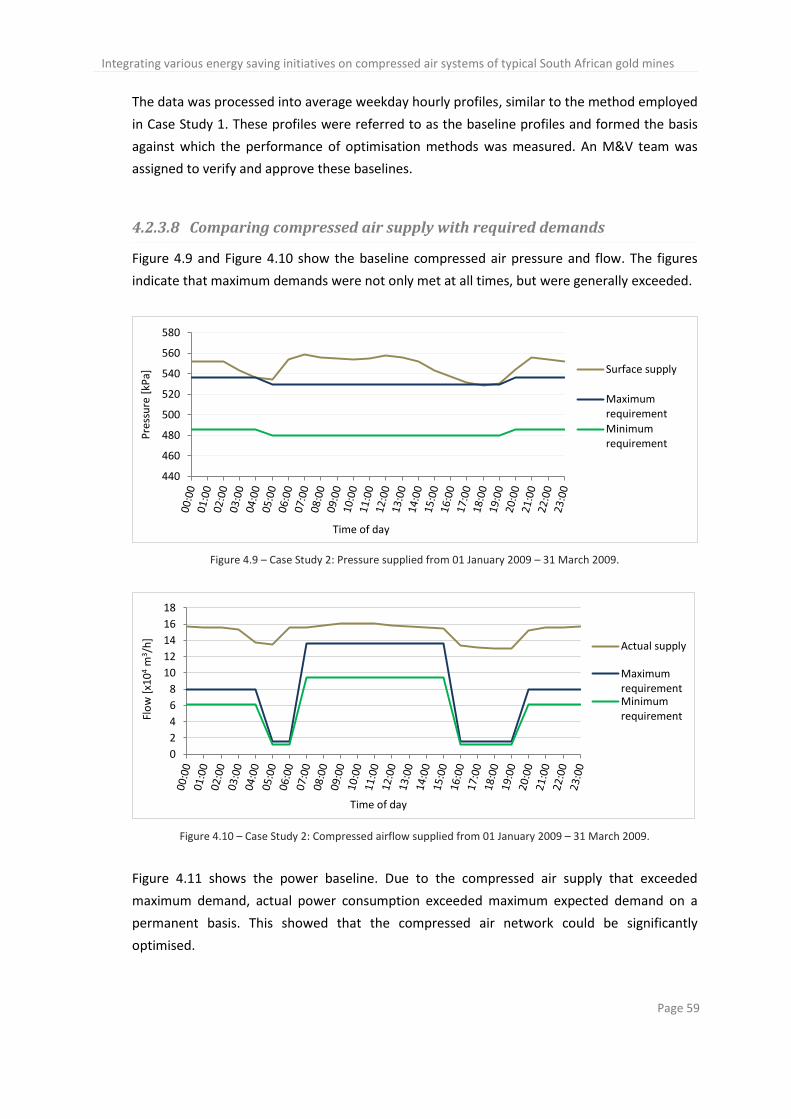
Integrating various energy saving initiatives on compressed air systems of typical South African gold mines
Page 59
The data was processed into average weekday hourly profiles, similar to the method employed
in Case Study 1. These profiles were referred to as the baseline profiles and formed the basis
against which the performance of optimisation methods was measured. An M&V team was
assigned to verify and approve these baselines.
4.2.3.8 Comparing compressed air supply with required demands
Figure 4.9 and Figure 4.10 show the baseline compressed air pressure and flow. The figures
indicate that maximum demands were not only met at all times, but were generally exceeded.
Figure 4.9 – Case Study 2: Pressure supplied from 01 January 2009 – 31 March 2009.
Figure 4.10 – Case Study 2: Compressed airflow supplied from 01 January 2009 – 31 March 2009.
Figure 4.11 shows the power baseline. Due to the compressed air supply that exceeded
maximum demand, actual power consumption exceeded maximum expected demand on a
permanent basis. This showed that the compressed air network could be significantly
optimised.
440
460
480
500
520
540
560
580
Pre
ssu
re [
kPa]
Time of day
Surface supply
Maximumrequirement
Minimumrequirement
0
2
4
6
8
10
12
14
16
18
Flo
w [
x10
4 m
3 /h
]
Time of day
Actual supply
MaximumrequirementMinimumrequirement
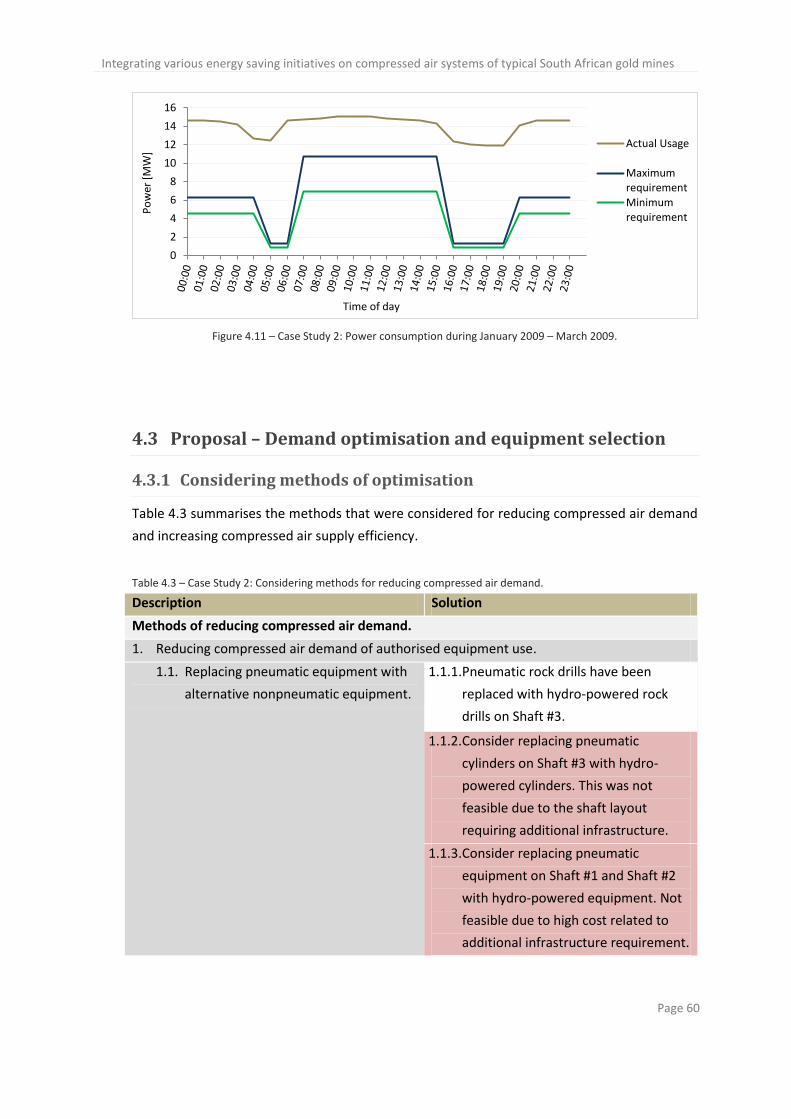
Integrating various energy saving initiatives on compressed air systems of typical South African gold mines
Page 60
Figure 4.11 – Case Study 2: Power consumption during January 2009 – March 2009.
4.3 Proposal – Demand optimisation and equipment selection
4.3.1 Considering methods of optimisation
Table 4.3 summarises the methods that were considered for reducing compressed air demand
and increasing compressed air supply efficiency.
Table 4.3 – Case Study 2: Considering methods for reducing compressed air demand.
Description Solution
Methods of reducing compressed air demand.
1. Reducing compressed air demand of authorised equipment use.
1.1. Replacing pneumatic equipment with
alternative nonpneumatic equipment.
1.1.1. Pneumatic rock drills have been
replaced with hydro-powered rock
drills on Shaft #3.
1.1.2. Consider replacing pneumatic
cylinders on Shaft #3 with hydro-
powered cylinders. This was not
feasible due to the shaft layout
requiring additional infrastructure.
1.1.3. Consider replacing pneumatic
equipment on Shaft #1 and Shaft #2
with hydro-powered equipment. Not
feasible due to high cost related to
additional infrastructure requirement.
0
2
4
6
8
10
12
14
16
Po
wer
[M
W]
Time of day
Actual Usage
MaximumrequirementMinimumrequirement
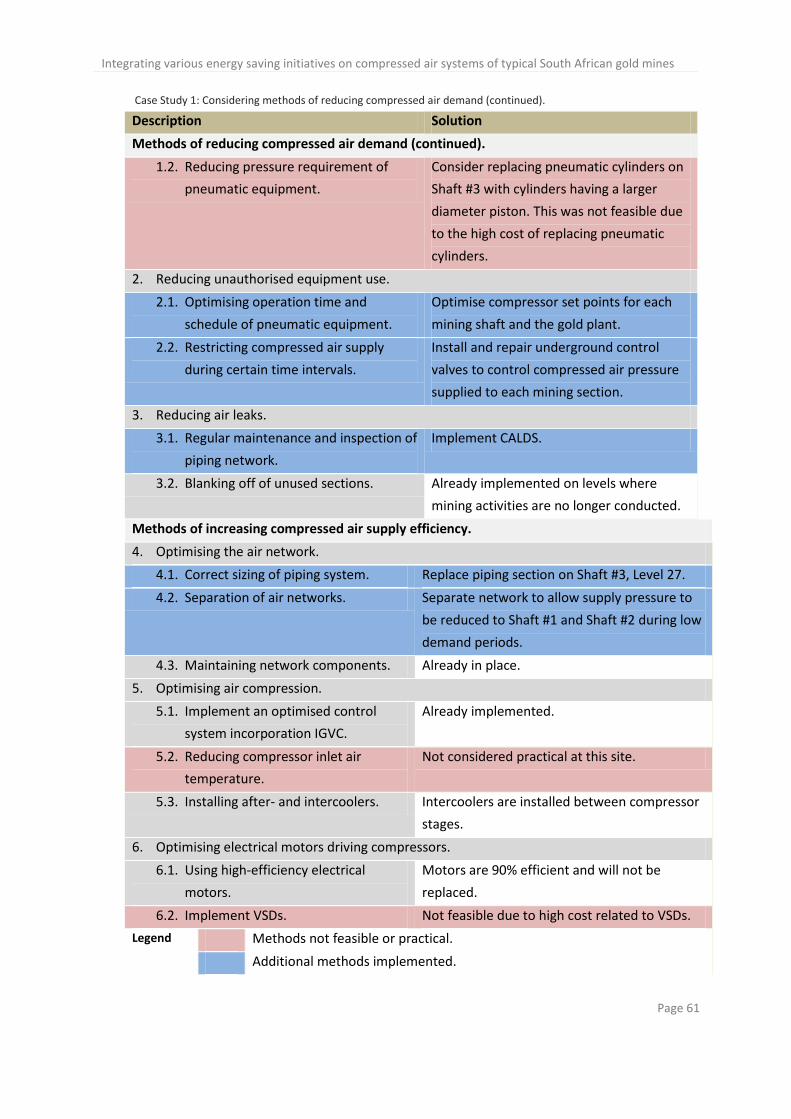
Integrating various energy saving initiatives on compressed air systems of typical South African gold mines
Page 61
Case Study 1: Considering methods of reducing compressed air demand (continued).
Description Solution
Methods of reducing compressed air demand (continued).
1.2. Reducing pressure requirement of
pneumatic equipment.
Consider replacing pneumatic cylinders on
Shaft #3 with cylinders having a larger
diameter piston. This was not feasible due
to the high cost of replacing pneumatic
cylinders.
2. Reducing unauthorised equipment use.
2.1. Optimising operation time and
schedule of pneumatic equipment.
Optimise compressor set points for each
mining shaft and the gold plant.
2.2. Restricting compressed air supply
during certain time intervals.
Install and repair underground control
valves to control compressed air pressure
supplied to each mining section.
3. Reducing air leaks.
3.1. Regular maintenance and inspection of
piping network.
Implement CALDS.
3.2. Blanking off of unused sections. Already implemented on levels where
mining activities are no longer conducted.
Methods of increasing compressed air supply efficiency.
4. Optimising the air network.
4.1. Correct sizing of piping system. Replace piping section on Shaft #3, Level 27.
4.2. Separation of air networks. Separate network to allow supply pressure to
be reduced to Shaft #1 and Shaft #2 during low
demand periods.
4.3. Maintaining network components. Already in place.
5. Optimising air compression.
5.1. Implement an optimised control
system incorporation IGVC.
Already implemented.
5.2. Reducing compressor inlet air
temperature.
Not considered practical at this site.
5.3. Installing after- and intercoolers. Intercoolers are installed between compressor
stages.
6. Optimising electrical motors driving compressors.
6.1. Using high-efficiency electrical
motors.
Motors are 90% efficient and will not be
replaced.
6.2. Implement VSDs. Not feasible due to high cost related to VSDs.
Legend Methods not feasible or practical.
Additional methods implemented.
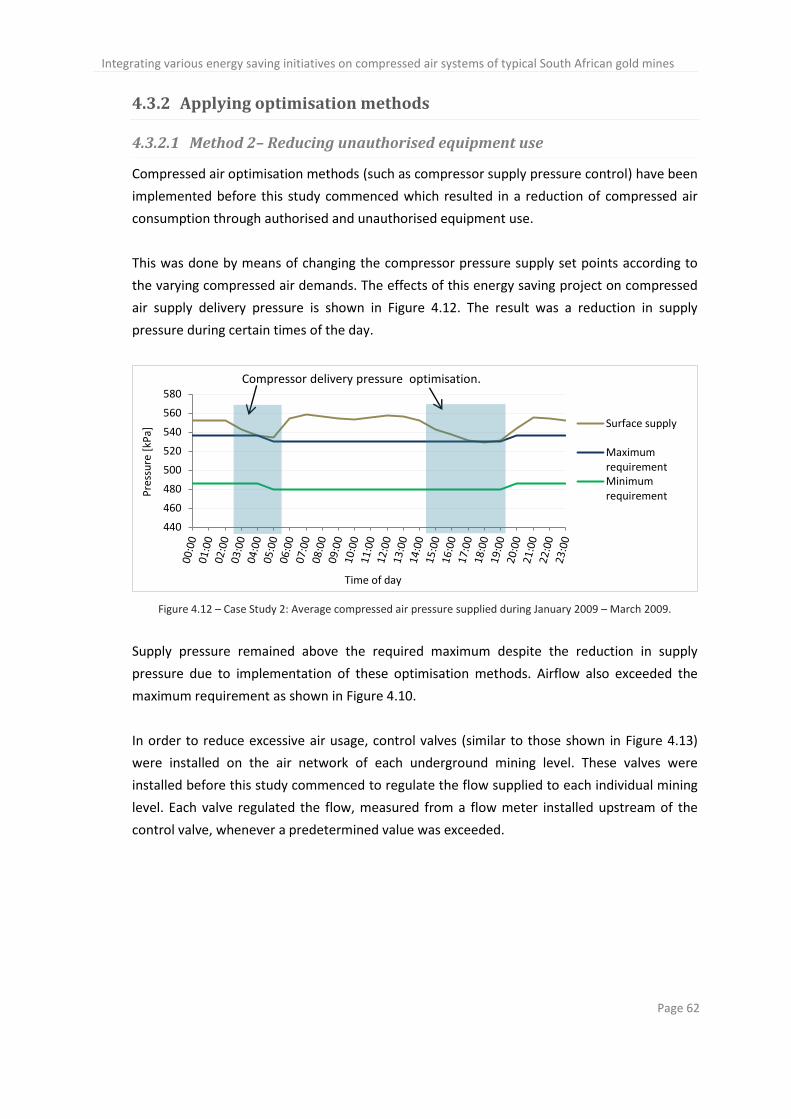
Integrating various energy saving initiatives on compressed air systems of typical South African gold mines
Page 62
4.3.2 Applying optimisation methods
4.3.2.1 Method 2– Reducing unauthorised equipment use
Compressed air optimisation methods (such as compressor supply pressure control) have been
implemented before this study commenced which resulted in a reduction of compressed air
consumption through authorised and unauthorised equipment use.
This was done by means of changing the compressor pressure supply set points according to
the varying compressed air demands. The effects of this energy saving project on compressed
air supply delivery pressure is shown in Figure 4.12. The result was a reduction in supply
pressure during certain times of the day.
Figure 4.12 – Case Study 2: Average compressed air pressure supplied during January 2009 – March 2009.
Supply pressure remained above the required maximum despite the reduction in supply
pressure due to implementation of these optimisation methods. Airflow also exceeded the
maximum requirement as shown in Figure 4.10.
In order to reduce excessive air usage, control valves (similar to those shown in Figure 4.13)
were installed on the air network of each underground mining level. These valves were
installed before this study commenced to regulate the flow supplied to each individual mining
level. Each valve regulated the flow, measured from a flow meter installed upstream of the
control valve, whenever a predetermined value was exceeded.
440
460
480
500
520
540
560
580
Pre
ssu
re [
kPa]
Time of day
Surface supply
MaximumrequirementMinimumrequirement
Compressor delivery pressure optimisation.
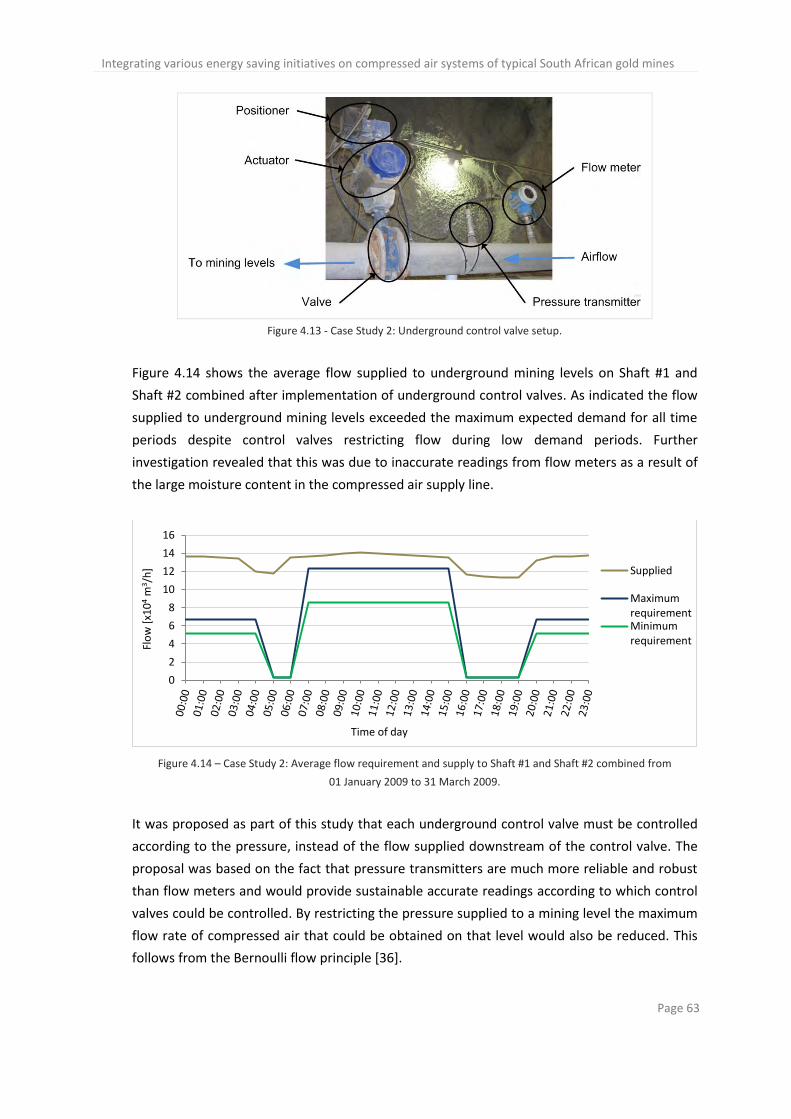
Integrating various energy saving initiatives on compressed air systems of typical South African gold mines
Page 63
Figure 4.13 - Case Study 2: Underground control valve setup.
Figure 4.14 shows the average flow supplied to underground mining levels on Shaft #1 and
Shaft #2 combined after implementation of underground control valves. As indicated the flow
supplied to underground mining levels exceeded the maximum expected demand for all time
periods despite control valves restricting flow during low demand periods. Further
investigation revealed that this was due to inaccurate readings from flow meters as a result of
the large moisture content in the compressed air supply line.
Figure 4.14 – Case Study 2: Average flow requirement and supply to Shaft #1 and Shaft #2 combined from
01 January 2009 to 31 March 2009.
It was proposed as part of this study that each underground control valve must be controlled
according to the pressure, instead of the flow supplied downstream of the control valve. The
proposal was based on the fact that pressure transmitters are much more reliable and robust
than flow meters and would provide sustainable accurate readings according to which control
valves could be controlled. By restricting the pressure supplied to a mining level the maximum
flow rate of compressed air that could be obtained on that level would also be reduced. This
follows from the Bernoulli flow principle [36].
0
2
4
6
8
10
12
14
16
Flo
w [
x10
4 m
3 /h
]
Time of day
Supplied
MaximumrequirementMinimumrequirement
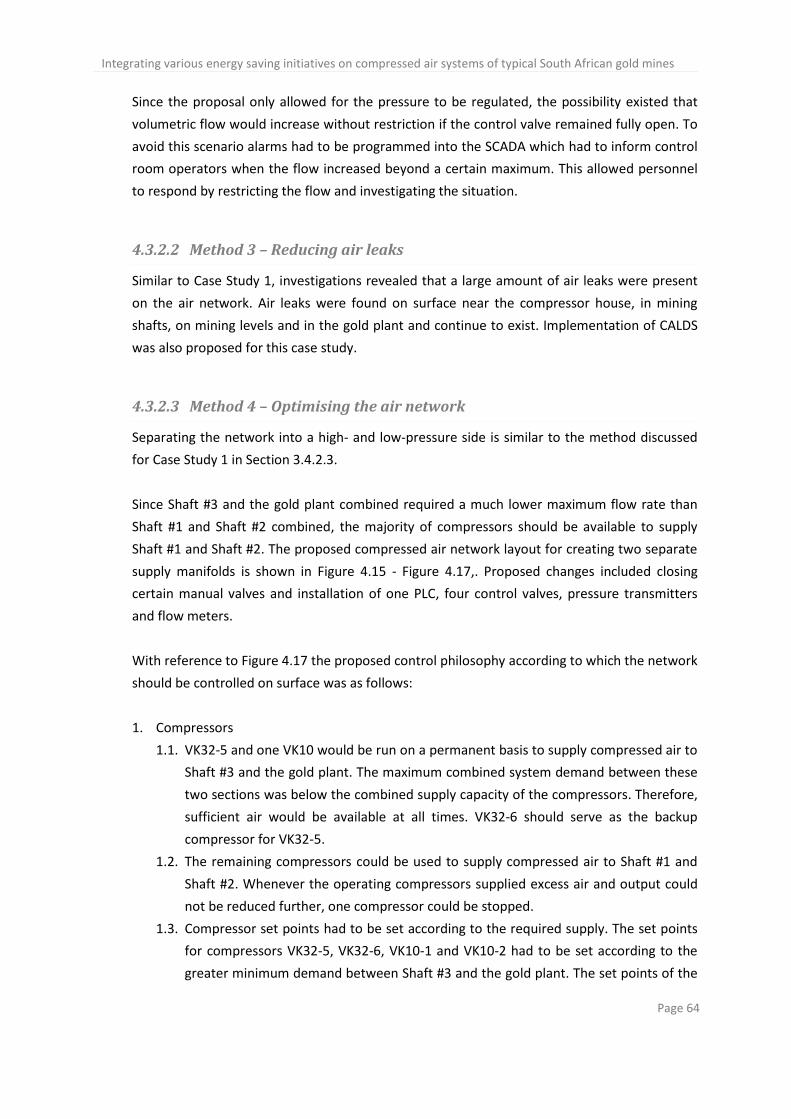
Integrating various energy saving initiatives on compressed air systems of typical South African gold mines
Page 64
Since the proposal only allowed for the pressure to be regulated, the possibility existed that
volumetric flow would increase without restriction if the control valve remained fully open. To
avoid this scenario alarms had to be programmed into the SCADA which had to inform control
room operators when the flow increased beyond a certain maximum. This allowed personnel
to respond by restricting the flow and investigating the situation.
4.3.2.2 Method 3 – Reducing air leaks
Similar to Case Study 1, investigations revealed that a large amount of air leaks were present
on the air network. Air leaks were found on surface near the compressor house, in mining
shafts, on mining levels and in the gold plant and continue to exist. Implementation of CALDS
was also proposed for this case study.
4.3.2.3 Method 4 – Optimising the air network
Separating the network into a high- and low-pressure side is similar to the method discussed
for Case Study 1 in Section 3.4.2.3.
Since Shaft #3 and the gold plant combined required a much lower maximum flow rate than
Shaft #1 and Shaft #2 combined, the majority of compressors should be available to supply
Shaft #1 and Shaft #2. The proposed compressed air network layout for creating two separate
supply manifolds is shown in Figure 4.15 - Figure 4.17,. Proposed changes included closing
certain manual valves and installation of one PLC, four control valves, pressure transmitters
and flow meters.
With reference to Figure 4.17 the proposed control philosophy according to which the network
should be controlled on surface was as follows:
1. Compressors
1.1. VK32-5 and one VK10 would be run on a permanent basis to supply compressed air to
Shaft #3 and the gold plant. The maximum combined system demand between these
two sections was below the combined supply capacity of the compressors. Therefore,
sufficient air would be available at all times. VK32-6 should serve as the backup
compressor for VK32-5.
1.2. The remaining compressors could be used to supply compressed air to Shaft #1 and
Shaft #2. Whenever the operating compressors supplied excess air and output could
not be reduced further, one compressor could be stopped.
1.3. Compressor set points had to be set according to the required supply. The set points
for compressors VK32-5, VK32-6, VK10-1 and VK10-2 had to be set according to the
greater minimum demand between Shaft #3 and the gold plant. The set points of the
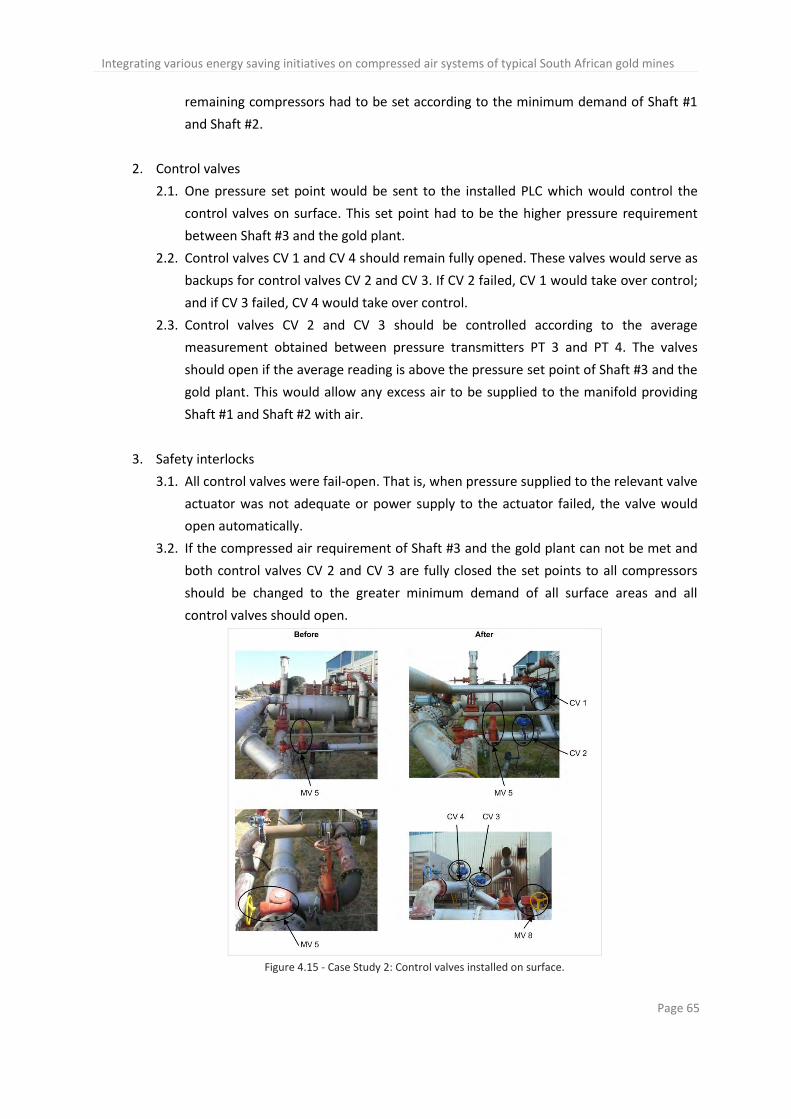
Integrating various energy saving initiatives on compressed air systems of typical South African gold mines
Page 65
remaining compressors had to be set according to the minimum demand of Shaft #1
and Shaft #2.
2. Control valves
2.1. One pressure set point would be sent to the installed PLC which would control the
control valves on surface. This set point had to be the higher pressure requirement
between Shaft #3 and the gold plant.
2.2. Control valves CV 1 and CV 4 should remain fully opened. These valves would serve as
backups for control valves CV 2 and CV 3. If CV 2 failed, CV 1 would take over control;
and if CV 3 failed, CV 4 would take over control.
2.3. Control valves CV 2 and CV 3 should be controlled according to the average
measurement obtained between pressure transmitters PT 3 and PT 4. The valves
should open if the average reading is above the pressure set point of Shaft #3 and the
gold plant. This would allow any excess air to be supplied to the manifold providing
Shaft #1 and Shaft #2 with air.
3. Safety interlocks
3.1. All control valves were fail-open. That is, when pressure supplied to the relevant valve
actuator was not adequate or power supply to the actuator failed, the valve would
open automatically.
3.2. If the compressed air requirement of Shaft #3 and the gold plant can not be met and
both control valves CV 2 and CV 3 are fully closed the set points to all compressors
should be changed to the greater minimum demand of all surface areas and all
control valves should open.
Figure 4.15 - Case Study 2: Control valves installed on surface.
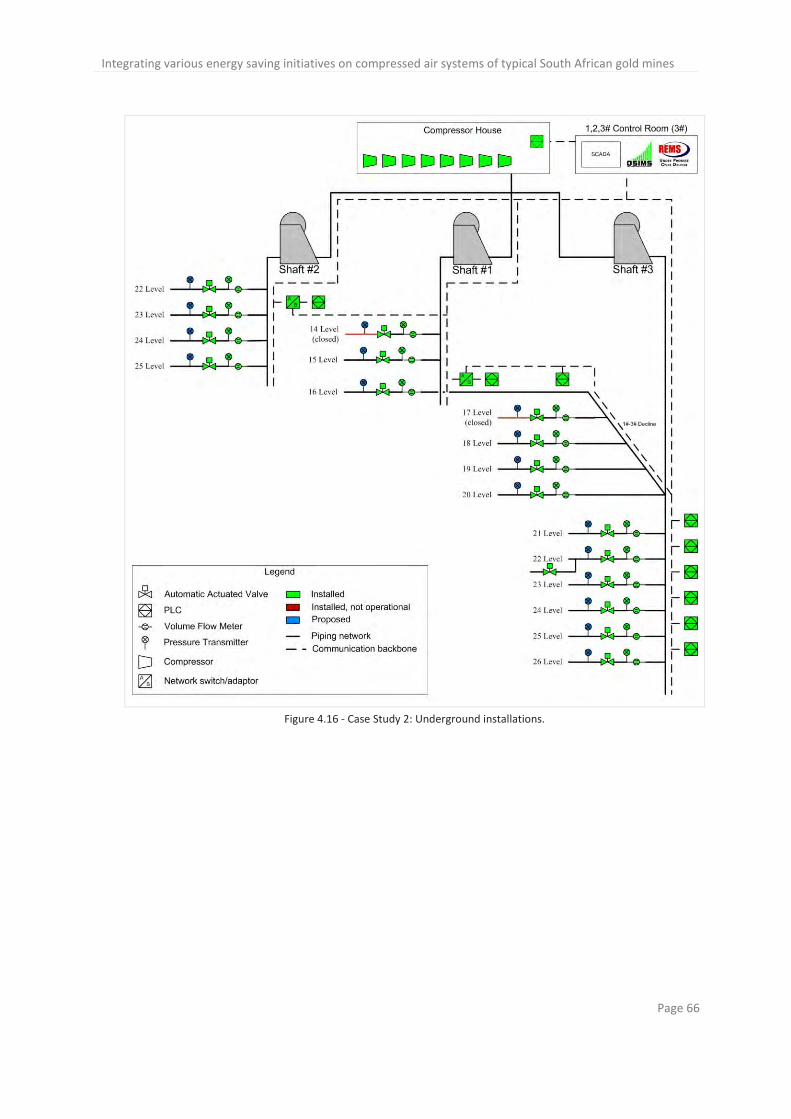
Integrating various energy saving initiatives on compressed air systems of typical South African gold mines
Page 66
Figure 4.16 - Case Study 2: Underground installations.
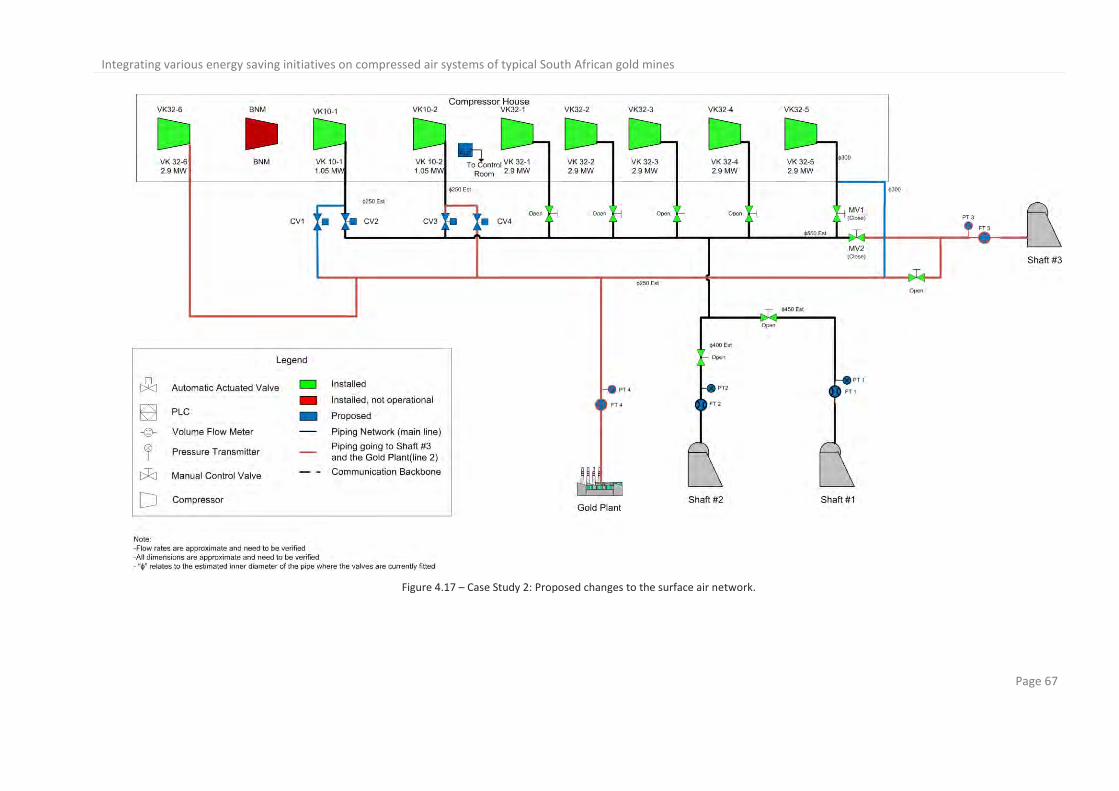
Integrating various energy saving initiatives on compressed air systems of typical South African gold mines
Page 67
Figure 4.17 – Case Study 2: Proposed changes to the surface air network.

Integrating various energy saving initiatives on compressed air systems of typical South African gold mines
Page 68
4.3.3 Theoretical analysis – Estimated power savings
According to Figure 4.11 a minimum and maximum average saving of 7.3 MW and 9.5 MW
could be realised respectively. These savings were, however, overoptimistic since flow losses
due to air leaks, agitation, refuge bays, workshops and cleaning equipment had been
neglected.
Similar to Case Study 1, it would be assumed that the minimum flow demand was determined
by the requirement of the loaders. The resulting, expected minimum power consumption and
anticipated power saving profiles are shown in Figure 4.18. As shown the baseline power
supplied could be broken down into the sums of total minimum power demand, total
minimum expected saving and total possible additional savings for each of the major sections
supplied with compressed air.
Figure 4.18 – Case Study 2: Accumulated expected power usage and saving profiles for Case Study 1.
The average daily baseline power consumption was 14.0 MW. As shown in Figure 4.19 the
expected maximum average daily power consumption – which was calculated using the same
method used in Case Study 1 – was 8.3 MW. If the power consumption was lowered from the
baseline to this maximum expected demand of 8.3 MW, the minimum expected saving of
5.3 MW was achieved.
A possible additional saving of 2.6 MW could be achieved if the compressed air supply was
accurately controlled according to the minimum demand which was estimated to be 5.8 MW.
0
2
4
6
8
10
12
14
16
18
Po
wer
[M
W]
Time of day
Baseline
Minimum saving
Maximum expectedrequirementPossible additional saving
Minimum requirement
Baseline = Maximum expected requirement + Minimum saving
Maximum expected requirement = Minimum requirement + Possible additional saving
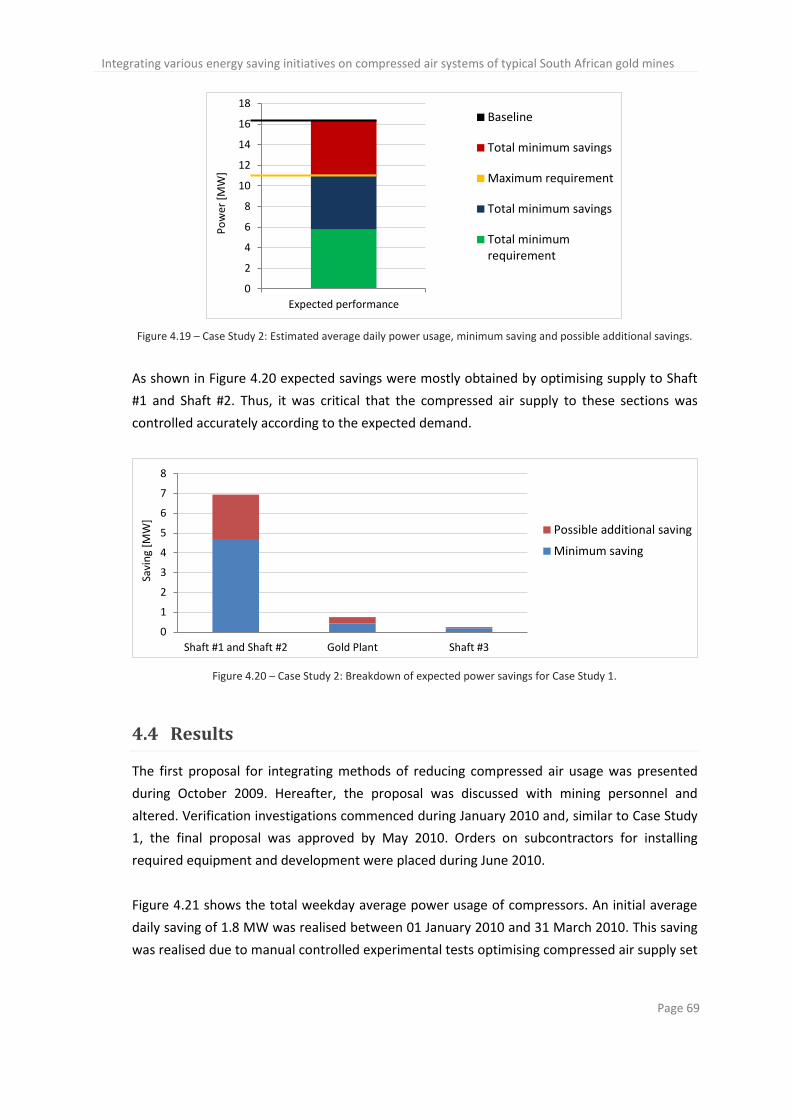
Integrating various energy saving initiatives on compressed air systems of typical South African gold mines
Page 69
Figure 4.19 – Case Study 2: Estimated average daily power usage, minimum saving and possible additional savings.
As shown in Figure 4.20 expected savings were mostly obtained by optimising supply to Shaft
#1 and Shaft #2. Thus, it was critical that the compressed air supply to these sections was
controlled accurately according to the expected demand.
Figure 4.20 – Case Study 2: Breakdown of expected power savings for Case Study 1.
4.4 Results
The first proposal for integrating methods of reducing compressed air usage was presented
during October 2009. Hereafter, the proposal was discussed with mining personnel and
altered. Verification investigations commenced during January 2010 and, similar to Case Study
1, the final proposal was approved by May 2010. Orders on subcontractors for installing
required equipment and development were placed during June 2010.
Figure 4.21 shows the total weekday average power usage of compressors. An initial average
daily saving of 1.8 MW was realised between 01 January 2010 and 31 March 2010. This saving
was realised due to manual controlled experimental tests optimising compressed air supply set
0
2
4
6
8
10
12
14
16
18
Expected performance
Po
wer
[M
W]
Baseline
Total minimum savings
Maximum requirement
Total minimum savings
Total minimumrequirement
0
1
2
3
4
5
6
7
8
Shaft #1 and Shaft #2 Gold Plant Shaft #3
Savi
ng
[MW
]
Possible additional saving
Minimum saving
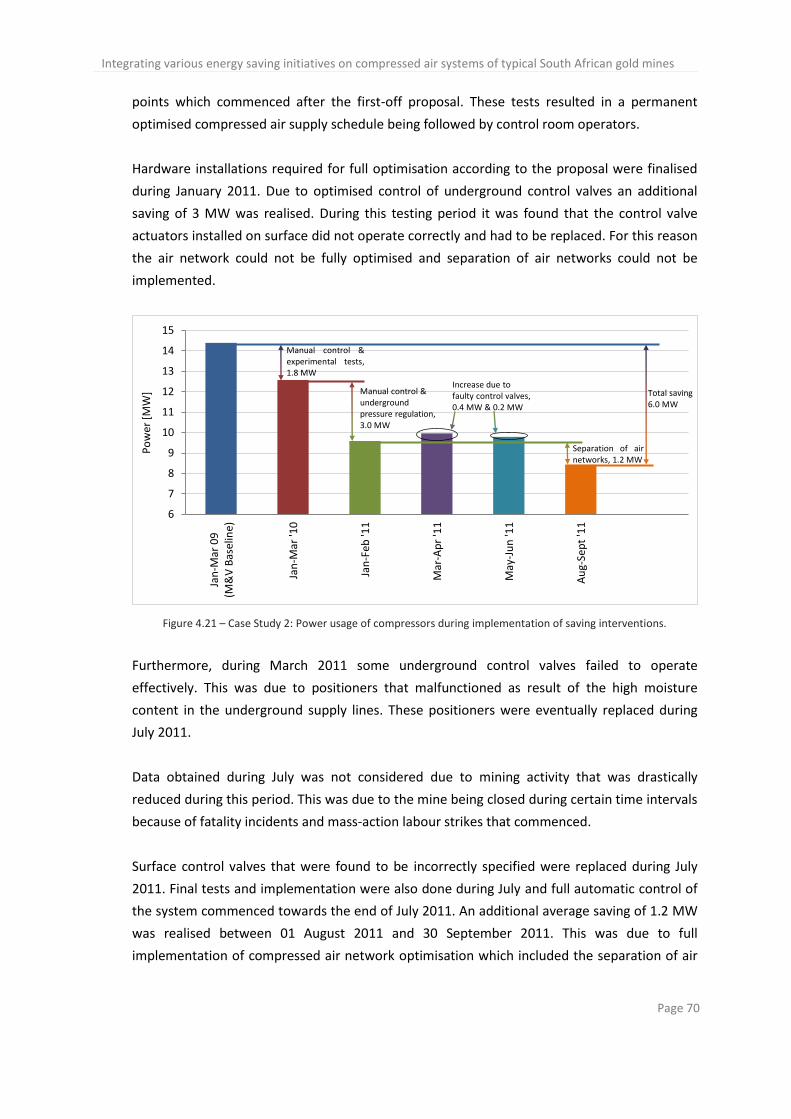
Integrating various energy saving initiatives on compressed air systems of typical South African gold mines
Page 70
points which commenced after the first-off proposal. These tests resulted in a permanent
optimised compressed air supply schedule being followed by control room operators.
Hardware installations required for full optimisation according to the proposal were finalised
during January 2011. Due to optimised control of underground control valves an additional
saving of 3 MW was realised. During this testing period it was found that the control valve
actuators installed on surface did not operate correctly and had to be replaced. For this reason
the air network could not be fully optimised and separation of air networks could not be
implemented.
Figure 4.21 – Case Study 2: Power usage of compressors during implementation of saving interventions.
Furthermore, during March 2011 some underground control valves failed to operate
effectively. This was due to positioners that malfunctioned as result of the high moisture
content in the underground supply lines. These positioners were eventually replaced during
July 2011.
Data obtained during July was not considered due to mining activity that was drastically
reduced during this period. This was due to the mine being closed during certain time intervals
because of fatality incidents and mass-action labour strikes that commenced.
Surface control valves that were found to be incorrectly specified were replaced during July
2011. Final tests and implementation were also done during July and full automatic control of
the system commenced towards the end of July 2011. An additional average saving of 1.2 MW
was realised between 01 August 2011 and 30 September 2011. This was due to full
implementation of compressed air network optimisation which included the separation of air
6
7
8
9
10
11
12
13
14
15
Jan
-Mar
09
(M&
V B
asel
ine)
Jan
-Mar
'10
Jan
-Feb
'11
Mar
-Ap
r '1
1
May
-Ju
n '1
1
Au
g-Se
pt
'11
Po
wer
[M
W] Manual control &
underground pressure regulation, 3.0 MW
Increase due to faulty control valves, 0.4 MW & 0.2 MW
Total saving 6.0 MW
Manual control & experimental tests, 1.8 MW
Separation of air networks, 1.2 MW
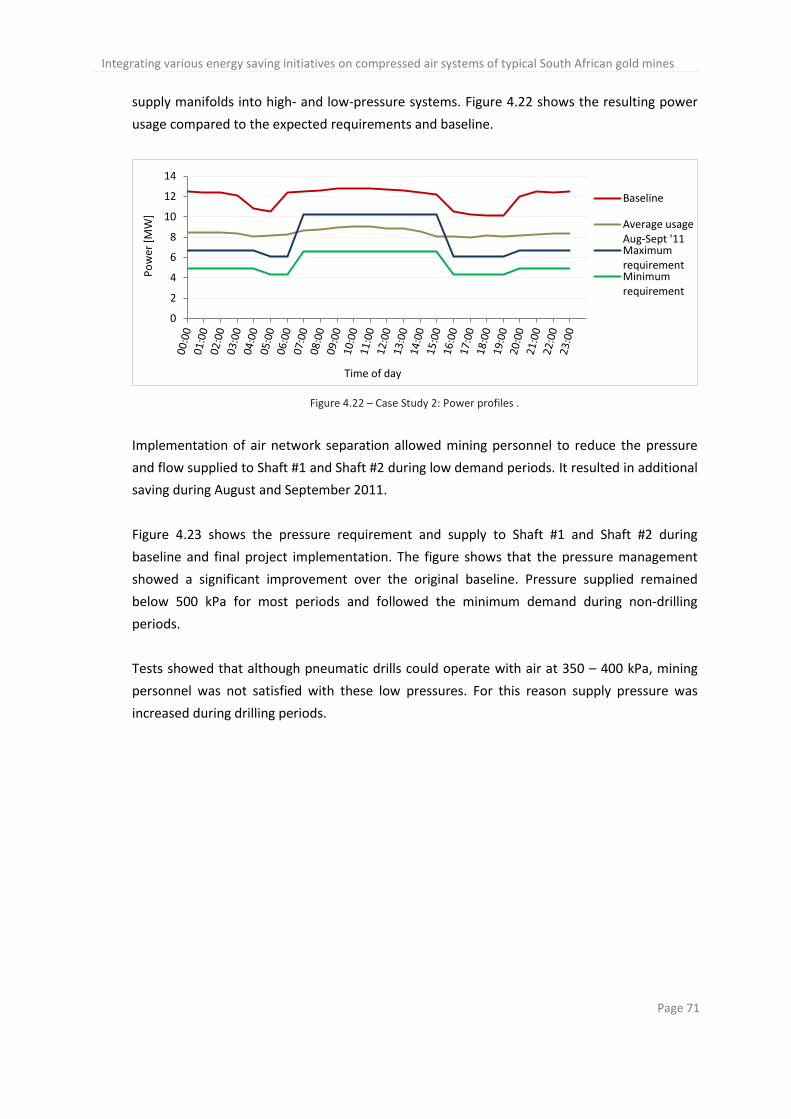
Integrating various energy saving initiatives on compressed air systems of typical South African gold mines
Page 71
supply manifolds into high- and low-pressure systems. Figure 4.22 shows the resulting power
usage compared to the expected requirements and baseline.
Figure 4.22 – Case Study 2: Power profiles .
Implementation of air network separation allowed mining personnel to reduce the pressure
and flow supplied to Shaft #1 and Shaft #2 during low demand periods. It resulted in additional
saving during August and September 2011.
Figure 4.23 shows the pressure requirement and supply to Shaft #1 and Shaft #2 during
baseline and final project implementation. The figure shows that the pressure management
showed a significant improvement over the original baseline. Pressure supplied remained
below 500 kPa for most periods and followed the minimum demand during non-drilling
periods.
Tests showed that although pneumatic drills could operate with air at 350 – 400 kPa, mining
personnel was not satisfied with these low pressures. For this reason supply pressure was
increased during drilling periods.
0
2
4
6
8
10
12
14
Po
wer
[M
W]
Time of day
Baseline
Average usageAug-Sept '11MaximumrequirementMinimumrequirement
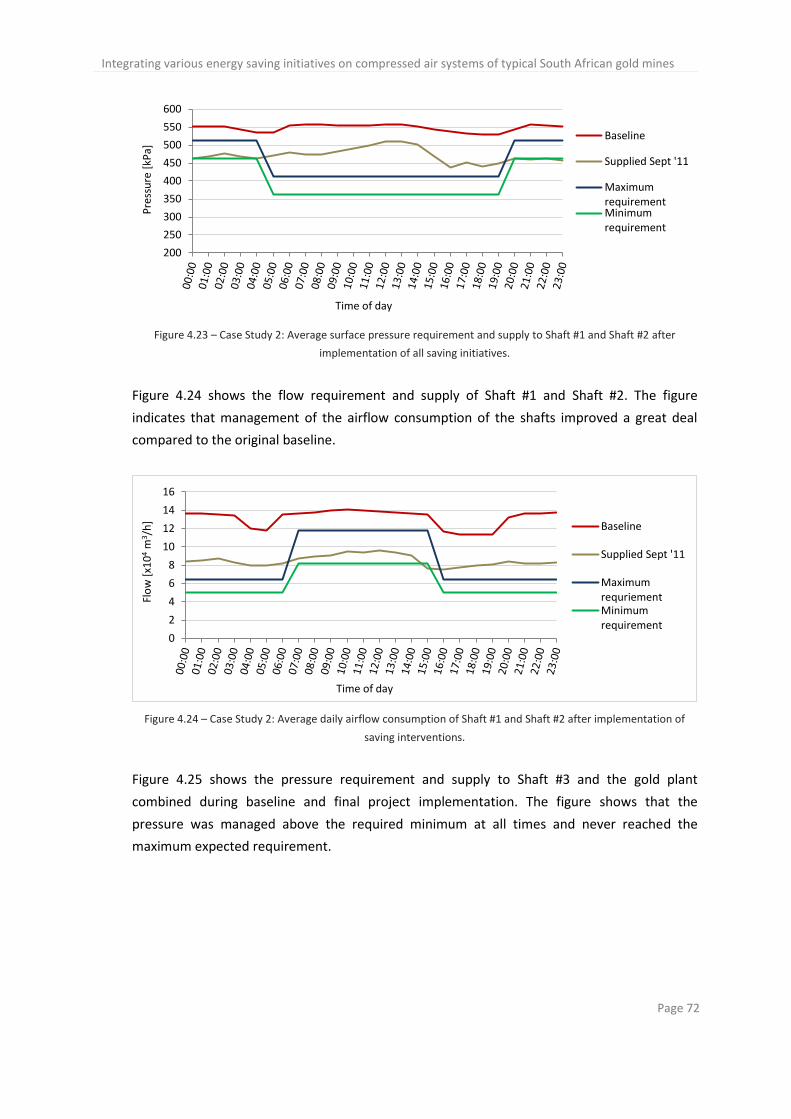
Integrating various energy saving initiatives on compressed air systems of typical South African gold mines
Page 72
Figure 4.23 – Case Study 2: Average surface pressure requirement and supply to Shaft #1 and Shaft #2 after
implementation of all saving initiatives.
Figure 4.24 shows the flow requirement and supply of Shaft #1 and Shaft #2. The figure
indicates that management of the airflow consumption of the shafts improved a great deal
compared to the original baseline.
Figure 4.24 – Case Study 2: Average daily airflow consumption of Shaft #1 and Shaft #2 after implementation of
saving interventions.
Figure 4.25 shows the pressure requirement and supply to Shaft #3 and the gold plant
combined during baseline and final project implementation. The figure shows that the
pressure was managed above the required minimum at all times and never reached the
maximum expected requirement.
200
250
300
350
400
450
500
550
600
Pre
ssu
re [
kPa]
Time of day
Baseline
Supplied Sept '11
MaximumrequirementMinimumrequirement
0
2
4
6
8
10
12
14
16
Flo
w [
x10
4 m
3 /h
]
Time of day
Baseline
Supplied Sept '11
MaximumrequriementMinimumrequirement
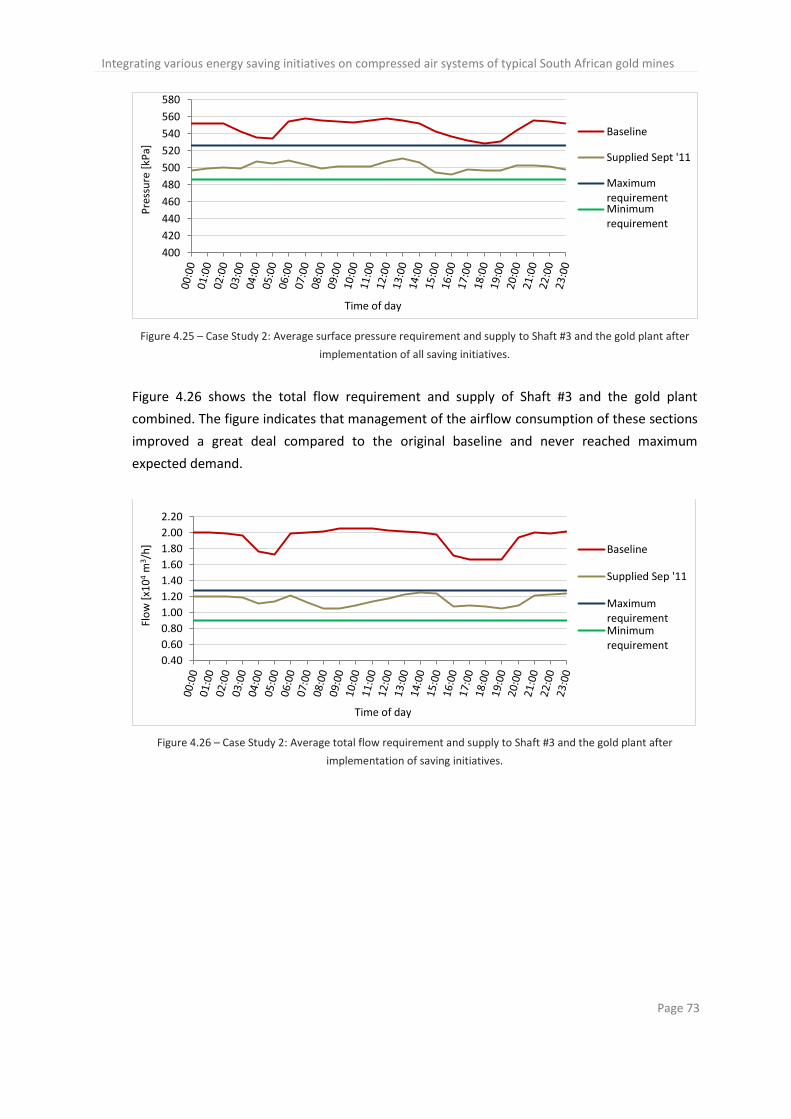
Integrating various energy saving initiatives on compressed air systems of typical South African gold mines
Page 73
Figure 4.25 – Case Study 2: Average surface pressure requirement and supply to Shaft #3 and the gold plant after
implementation of all saving initiatives.
Figure 4.26 shows the total flow requirement and supply of Shaft #3 and the gold plant
combined. The figure indicates that management of the airflow consumption of these sections
improved a great deal compared to the original baseline and never reached maximum
expected demand.
Figure 4.26 – Case Study 2: Average total flow requirement and supply to Shaft #3 and the gold plant after
implementation of saving initiatives.
400
420
440
460
480
500
520
540
560
580
Pre
ssu
re [
kPa]
Time of day
Baseline
Supplied Sept '11
MaximumrequirementMinimumrequirement
0.40
0.60
0.80
1.00
1.20
1.40
1.60
1.80
2.00
2.20
Flo
w [
x10
4 m
3 /h
]
Time of day
Baseline
Supplied Sep '11
MaximumrequirementMinimumrequirement
Integrating various energy saving initiatives on compressed air systems of typical South African gold mines
Page 74
4.5 Conclusion
Initial investigations commenced during January 2009 and proceeded until end March 2009.
An average weekday daily power usage baseline of 14.4 MW was measured.
The delivery pressure set points of compressors were optimised. This resulted in a saving of
1.8 MW, which was approximately 13% of the original power baseline.
The compressed air consumption of authorised and unauthorised equipment used was
reduced significantly by optimising compressed air pressure supply. This was implemented in
two stages during different time periods. Stage 1 of pressure supply optimisation, where air
pressure supplied to each underground mining section was restricted individually, was
operational from January 2011. Flow meters were used to raise alarms should the flow
through a section exceed the maximum flow allowance. This stage of pressure supply
optimisation resulted in a saving of 2.9 MW, approximately 21% of the power baseline.
Stage 2 of the pressure supply optimisation was implemented on surface. The single
compressed air system was separated into two distinct high- and low-pressure systems. This
resulted in a saving of 1.2 MW, approximately 8% of the power baseline.
Air leaks were documented and repaired. CALDS created a strong awareness of air leaks and
resulted in greater attention given by personnel to maintenance and repairs of these leaks.
By restricting availability of compressed air a total power saving of 6 MW, approximately 42%
of the measured baseline, was realised. Pressure and flow supplied to Shaft #1 and Shaft #2
were improved on average by 11% and 35.5% respectively. Pressure and flow supplied to
Shaft #3 and the gold processing plant were improved by 8.5% and 60% respectively. Total
airflow consumed by compressors was reduced by 40 000 m3/h, approximately 30% of the
baseline.
Despite increases in production during 2011, the compressed air usage and power
requirements were reduced significantly. The air consumption of Shaft #1 and Shaft #2 could
be reduced further; however, additional savings that could be realised without major new
developments would be small and would not justify related costs and effort.
By implementing integrated control the air supplied to each end-user could be continuously
controlled and monitored. This resulted in a significant increase in savings compared to limited
control implemented in Case Study 1.
Integrating various energy saving initiatives on compressed air systems of typical South African gold mines
Page 75
5 Conclusion and recommendations
5.1 Conclusion
Studies showed that 14.5% of the total energy produced in South Africa was consumed by the
mining sector and another 26.6% by the industrial sector. Furthermore, 10% of this energy was
consumed to produce compressed air.
Many studies have focused on reducing electrical energy required to produce compressed air.
However, these studies focused on single methods in isolation. This study investigated the
effect of combining these methods to obtain maximum energy savings. Further investigations
were done to determine how these methods could specifically be applied to typical South
African mines. Thus, the study included industrial sectors, but focused on the mining sector in
particular.
Two different mining sites were considered as case studies. Each case study utilised a plant air
compressed air network layout which supplied air to at least one mining shaft and one gold
processing plant.
Certain optimisation methods were already implemented before these case studies
commenced.
Application of additional methods to reduce compressed air energy requirements were
analysed for each site. This was done by first doing a detailed site investigation. Various
methods were then considered to optimise the compressed air system. Electrical energy
savings and costs were then evaluated. Graphs, showing initial baseline power profiles, were
presented together with the electrical power profiles showing the proposed electrical energy
savings. Practical application methods were discussed with mining personnel, and finally
implemented after the proposed initiatives were approved.
Although proposed solutions for both studies were similar, a unique proposal was presented
for each study. Both studies incorporated pneumatic-actuated, variable-opening control valves
to control compressed air supplied to end-users. In the first study, only the compressed air
supplied directly from the compressors on the surface was controlled.
In the second case study, where integrated control was applied, air pressure supplied on
surface and to the each individual underground mining level was controlled. Both case studies
also included further control optimisation, such as separation of air manifolds to allow multiple
header supply pressures.
Integrating various energy saving initiatives on compressed air systems of typical South African gold mines
Page 76
The implemented systems were tested and optimised for a minimum period of three
consecutive months, referred to as the performance assessment (PA). During this period
training was also given to mining personnel. After the PA period the system was officially
handed over to the mine.
During initial investigations the energy usage of compressors were measured and captured at
two-minute intervals over three consecutive calendar months. From this data the reference
power baseline – averaged out over a typical 24-hour working weekday – was established.
Similarly, where possible, compressed air pressure and flow data was also recorded to
establish appropriate baselines. It was against these baselines that the performance of the
energy saving initiatives was measured.
Table 5.1 shows a comparison between the two case studies and their limitations. In Case
Study 1, due to a limited budget, full optimisation could not be implemented. This resulted in
limited application of energy saving methods and control of air supply. Results showed that
where full integration could be implemented savings were doubled.
Case Study 2 did not have the same budget constraint and the full integrated control of air
supply could be implemented. The average 24-hour power usage for this study was measured
as 14 MW. Minimum and maximum savings were estimated to be 5.3 MW and 7.9 MW
respectively. A final saving of 6.0 MW, approximately 42.9% of the baseline, was realised.
Maximum savings could not be obtained due to the malfunctioning instrumentation
controlling the air supply.
Pressure and flow transmitters installed during Case Study 2 allowed compressed airflow and
pressure supply to be monitored at each underground mining level. This resulted in the
following benefits:
1. Continuous monitoring of compressor power usage allowed personnel to make use of
the most efficient compressors.
2. Irregular peaks in flow consumption allowed mining personnel to effectively identify
air leaks and unauthorised use of compressed air on each mining level.
3. By monitoring the pressure supplied to underground mining levels the required
compressor delivery pressure could be accurately determined.
4. Pressure transmitters allowed sustainable control of air underground. Flow meters
allowed maximum flow supplied to be limited, however these instrumentation were
not reliable or accurate.
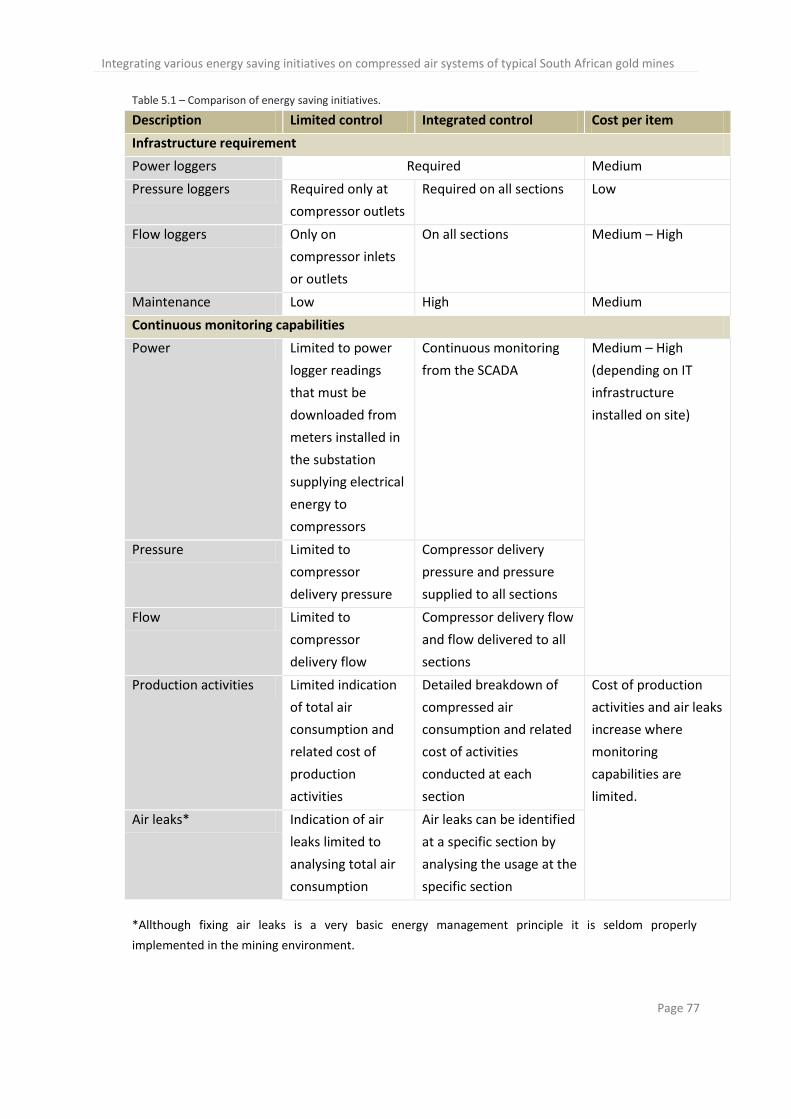
Integrating various energy saving initiatives on compressed air systems of typical South African gold mines
Page 77
Table 5.1 – Comparison of energy saving initiatives.
Description Limited control Integrated control Cost per item
Infrastructure requirement
Power loggers Required Medium
Pressure loggers Required only at
compressor outlets
Required on all sections Low
Flow loggers Only on
compressor inlets
or outlets
On all sections Medium – High
Maintenance Low High Medium
Continuous monitoring capabilities
Power Limited to power
logger readings
that must be
downloaded from
meters installed in
the substation
supplying electrical
energy to
compressors
Continuous monitoring
from the SCADA
Medium – High
(depending on IT
infrastructure
installed on site)
Pressure Limited to
compressor
delivery pressure
Compressor delivery
pressure and pressure
supplied to all sections
Flow Limited to
compressor
delivery flow
Compressor delivery flow
and flow delivered to all
sections
Production activities Limited indication
of total air
consumption and
related cost of
production
activities
Detailed breakdown of
compressed air
consumption and related
cost of activities
conducted at each
section
Cost of production
activities and air leaks
increase where
monitoring
capabilities are
limited.
Air leaks* Indication of air
leaks limited to
analysing total air
consumption
Air leaks can be identified
at a specific section by
analysing the usage at the
specific section
*Allthough fixing air leaks is a very basic energy management principle it is seldom properly
implemented in the mining environment.
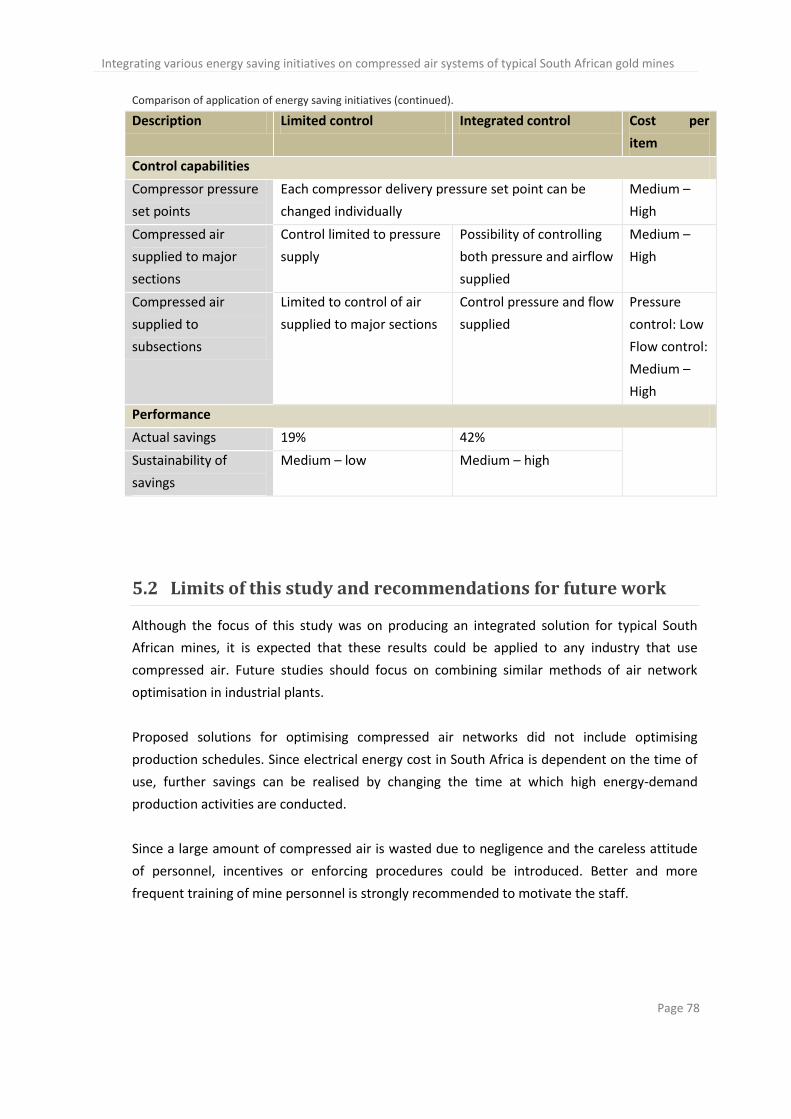
Integrating various energy saving initiatives on compressed air systems of typical South African gold mines
Page 78
Comparison of application of energy saving initiatives (continued).
Description Limited control Integrated control Cost per
item
Control capabilities
Compressor pressure
set points
Each compressor delivery pressure set point can be
changed individually
Medium –
High
Compressed air
supplied to major
sections
Control limited to pressure
supply
Possibility of controlling
both pressure and airflow
supplied
Medium –
High
Compressed air
supplied to
subsections
Limited to control of air
supplied to major sections
Control pressure and flow
supplied
Pressure
control: Low
Flow control:
Medium –
High
Performance
Actual savings 19% 42%
Sustainability of
savings
Medium – low Medium – high
5.2 Limits of this study and recommendations for future work
Although the focus of this study was on producing an integrated solution for typical South
African mines, it is expected that these results could be applied to any industry that use
compressed air. Future studies should focus on combining similar methods of air network
optimisation in industrial plants.
Proposed solutions for optimising compressed air networks did not include optimising
production schedules. Since electrical energy cost in South Africa is dependent on the time of
use, further savings can be realised by changing the time at which high energy-demand
production activities are conducted.
Since a large amount of compressed air is wasted due to negligence and the careless attitude
of personnel, incentives or enforcing procedures could be introduced. Better and more
frequent training of mine personnel is strongly recommended to motivate the staff.

Integrating various energy saving initiatives on compressed air systems of typical South African gold mines
Page 79
A CALDS was implemented on each of the case studies. This system only allows the
documenting of located air leaks. The actual location of each leak is determined by manual
inspection. The viability of sourcing or developing a leak-detection system that could
accurately locate the position of a leak would add significant value to the CALDS.
This study did not include increasing the efficiency of pneumatic equipment. Additional savings
can be realised by increasing the efficiency of pneumatic drills, loaders and cleaning hoses
and/or nozzles.
Integrating various energy saving initiatives on compressed air systems of typical South African gold mines
Page 80
Bibliography
[1] J. N. Blignaut and R. Inglesi-Lotz, "South Africa's electricity consumption: A sectoral
decomposition analysis," Applied Energy, pp. 4779-4784, June 2011.
[2] Energy Information Administration (EIA). (2011, Oct.) U.S. Energy Information
Administration (EIA). [Online]. http://www.eia.gov/countries/country-
data.cfm?fips=SF#elec
[3] K. Amusa, R. Mabugu, and H. Amusa, "Aggregate demand for electricity in South Africa:
An analysis using the bound testing approach to cointegration," Energy Policy, pp. 4167-
4175, June 2009.
[4] Eskom, "Integrated report," Eskom, Johannesburg, Ann. Rep. 2011.
[5] B. Dames, "State of the power system," Eskom, Update 2011.
[6] Eskom, "Build programme in South Africa fact sheet," ESKOM, Johannesburg, Update NB
0001, 2011.
[7] N. A. Rahim, M. Hasanuzzaman, and R. Saidur, "A review on compressed-air energy use
and energy savings," Renewable and Sustainable Energy Reviews, pp. 1135-1153, Nov.
2009.
[8] Eskom. (2011, Oct.) Tariffs and charges. [Online].
http://www.eskom.co.za/c/article/141/tariff-history/
[9] Statistics South Africa. (2011, Oct.) Publications. [Online].
http://www.statssa.gov.za/publications/findpublication.asp
[10] Eskom. (2009, Mar.) Eskom Tarrifs & charges 2009-2010. [Online].
http://www.eskom.co.za/content/KSACS6Jan2010.pdf
[11] Eskom. (2011, Oct.) Eskom retail tariff adjustment for 2011/12. [Online].
http://www.eskom.co.za/content/priceincrease2011.pdf
[12] National Energy Regulator of South Africa (NERSA), "Annual report," National Energy
Regulator of South Africa (NERSA), Pretoria, Ann. Rep. 2009-2010.
[13] Statistics South Africa, "Natural resource accounts: Energy accounts for South Africa,
1995 - 2001," Statistics South Africa, Pretoria, 2005.
[14] Eskom, "Energy efficiency and demand side management in South Africa," Johannesburg,
2007.
[15] N. A. Rahim et al., "End-use energy analysis in the Malaysian industrial sector," Energy,
pp. 153-158, Jan. 2009.
[16] C. Y. Yuan and T. Zhang, "A decision-based analysis of compressed air usage patterns in
automotive manufacturing," Journal of Manufacturing Systems, vol. 25, no. 4, pp. 293-
300, 2006.
Integrating various energy saving initiatives on compressed air systems of typical South African gold mines
Page 81
[17] A. McKane and H. Q. Shanghai, "Improving energy efficiency of compressed air system
based on system audit," Lawrence Berkeley National Laboratory, June 2008.
[18] G. Epstein, S. Moray, C. Schmidt, and M. D' Antonio, "Compressed air load reduction
approaches and innovations," in Proc. of the 27th Industrial Energy Technology Conf., LA,
2005.
[19] C. Galitsky and E. Worrell, "Energy efficiency improvement and cost saving opportunities
for the vehicle assembly industry," Ernest Orlando Lawrence Berkeley National
Laboratory, 2008.
[20] M. Kleingeld and A. J. Schutte, "Case studies of optimised compressed air usage on gold
mines," in Industrial and Commercial Use of Energy, Cape Town, South Africa, 2010, pp.
85-90.
[21] Eskom. (2011, Oct.) Eskom Tarrifs & charges 2010-2011. [Online].
http://www.eskom.co.za/content/TariffGuide2010.pdf
[22] Compressed Air Challenge. (2003, Aug.) Compressed Air System Leaks. [Online].
http://www.compressedairchallenge.org/library/factsheets/factsheet07.pdf
[23] A. J. M. van Tonder, "Sustaining compressed air DSM project savings using an air leakage
management system," North-West University, Potchefstroom, Masters dissertation 2010.
[24] C. Schmidt, "Modeling and simulation of air compressor energy use," in 2005 ACEEE
Summer Study on Energy Efficiency in Industry, New York, 2005.
[25] M. Yang, "Air compressor efficiency in a Vietnamese enterprise," Energy Policy, pp. 2327-
2337, March 2009.
[26] R. Sweeney. (2002, Feb.) Article. [Online]. http://machinedesign.com/article/cutting-the-
cost-of-compressed-air-1107
[27] P. Hannifin and C. Harris, "Air filtration and efficiency: Cutting the cost of compressed
air," Filtration + Separation, pp. 32-34, November 2008.
[28] Ingersoll Rand. (2011, Oct.) Centrifugal System Automation. [Online].
http://www.ingersollrandproducts.com/IS/Product.aspx-am_en-32854
[29] W. Booysen, "Reducing energy consumption on RSA mines through optimised compressor
control.," North-West University, Potchefstroom, Masters dissertation 2010.
[30] A. Levi et al., "Energy saving in agricultural buildings through fan motor control by
variable frequency drives," Energy and Buildings, vol. 40, pp. 953-960, 2008.
[31] GAMBICA, "Variable speed driven pumps: Best practice guide," GAMBICA, London, Guide
2011.
[32] Trident South Africa. (2002-2005) Trident South Africa. [Online].
http://www.tridentsa.co.za/eimcoload.php
[33] Sandvik, Sandvik hand held rock drills product catalogue, 2011.
[34] Atlas Copco. (2010) Atlas Copco Construction & Mining Technique. [Online].

Integrating various energy saving initiatives on compressed air systems of typical South African gold mines
Page 82
http://pol.atlascopco.com/SGSite/default_prod.asp?redirpage=products/area.asp&rediri
d=Rock%20Drills&view=&plid=EN&slid=ES&GetonBoard=Yes&LanguageID=Yes
[35] E. S. Menon, Piping calculations manual.: McGraw-Hill, 2005.
[36] F. M. White, Fluid mechanics , 6th ed.: McGraw-Hill, 2009.
[37] E. Blaustein and P. Radgen, "Compressed air systems in the European Union," European
Commission, Project Report ISBN 3-932298-16-0, 2000.
[38] R. A. Walsh, Electromechanical design handbook.: McGraw-Hill, 2000.
[39] T. C. Dickenson, Valves, piping and pipelines handbook, 3rd ed. New York, USA: Elsevier,
1999.
[40] M. A. Boles and Y. A. Cengel, Thermodynamics: An engineering approach, 5th ed.:
McGraw-Hill, 2006.
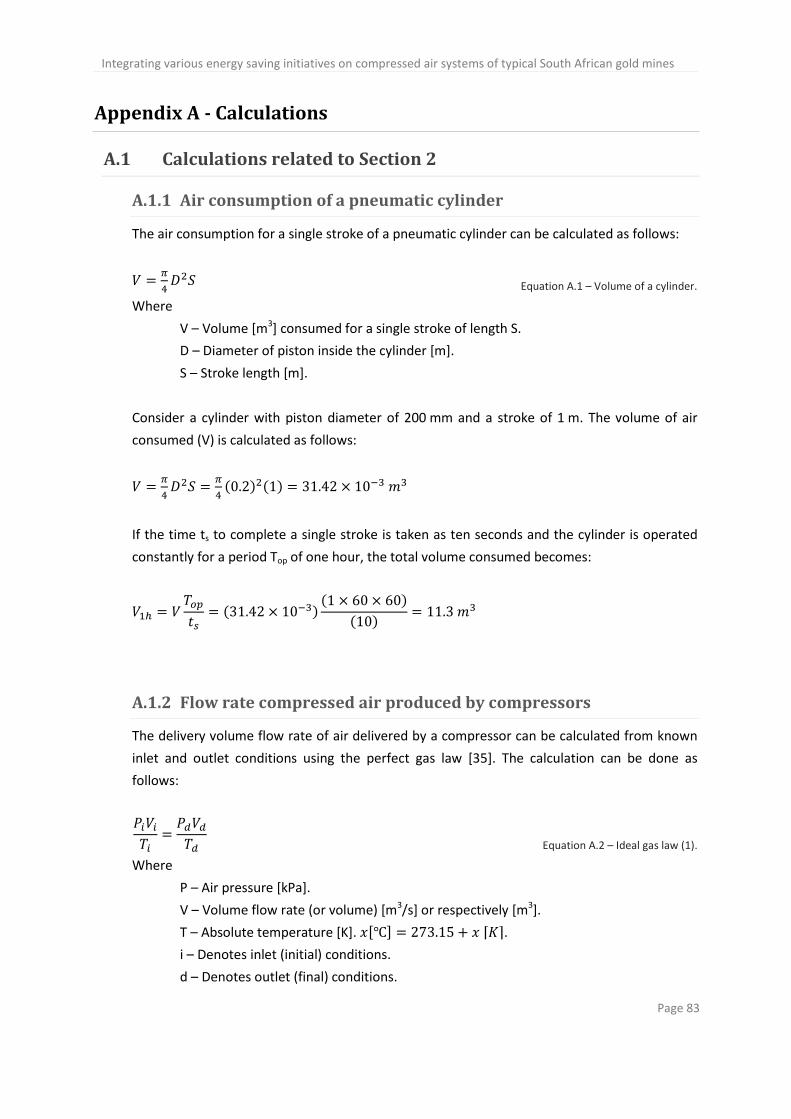
Integrating various energy saving initiatives on compressed air systems of typical South African gold mines
Page 83
Appendix A - Calculations
A.1 Calculations related to Section 2
A.1.1 Air consumption of a pneumatic cylinder
The air consumption for a single stroke of a pneumatic cylinder can be calculated as follows:
Equation A.1 – Volume of a cylinder.
Where
V – Volume [m3] consumed for a single stroke of length S.
D – Diameter of piston inside the cylinder [m].
S – Stroke length [m].
Consider a cylinder with piston diameter of 200 mm and a stroke of 1 m. The volume of air
consumed (V) is calculated as follows:
( ) ( )
If the time ts to complete a single stroke is taken as ten seconds and the cylinder is operated
constantly for a period Top of one hour, the total volume consumed becomes:
( )
( )
( )
A.1.2 Flow rate compressed air produced by compressors
The delivery volume flow rate of air delivered by a compressor can be calculated from known
inlet and outlet conditions using the perfect gas law [35]. The calculation can be done as
follows:
Equation A.2 – Ideal gas law (1).
Where
P – Air pressure [kPa].
V – Volume flow rate (or volume) [m3/s] or respectively [m3].
T – Absolute temperature [K]. [ ] ⌈ ⌉.
i – Denotes inlet (initial) conditions.
d – Denotes outlet (final) conditions.
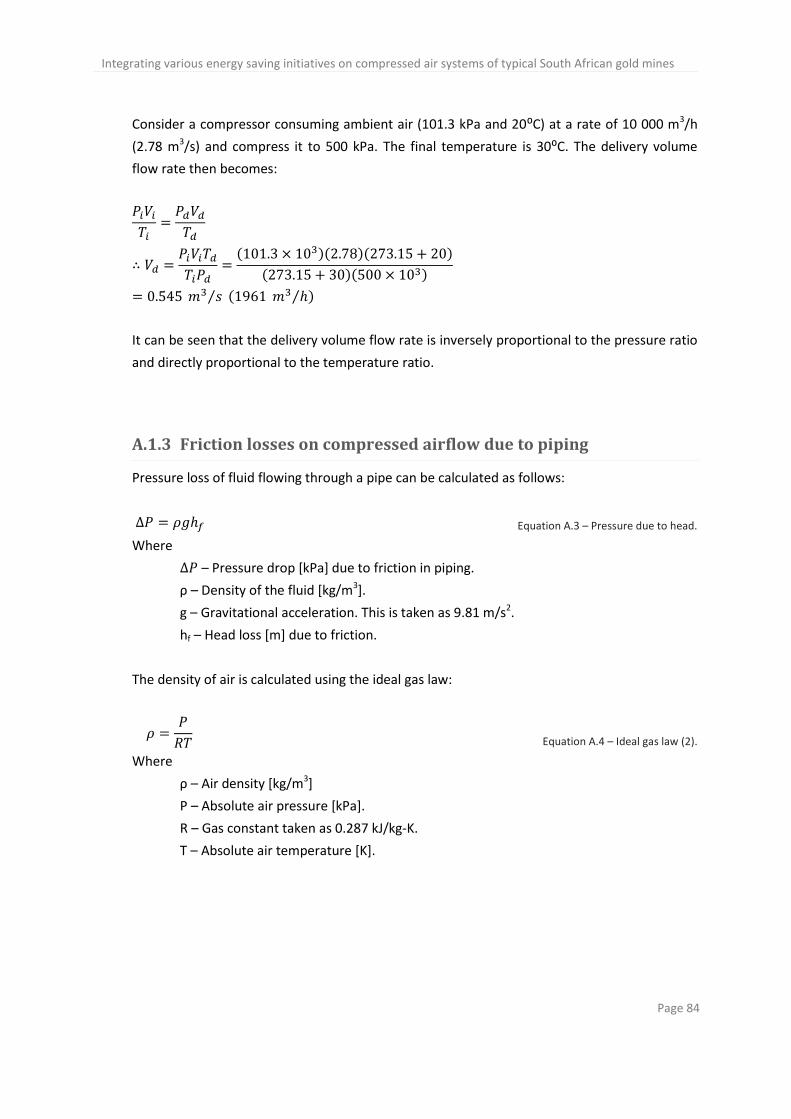
Integrating various energy saving initiatives on compressed air systems of typical South African gold mines
Page 84
Consider a compressor consuming ambient air (101.3 kPa and 20⁰C) at a rate of 10 000 m3/h
(2.78 m3/s) and compress it to 500 kPa. The final temperature is 30⁰C. The delivery volume
flow rate then becomes:
( )( )( )
( )( )
⁄ ( ⁄ )
It can be seen that the delivery volume flow rate is inversely proportional to the pressure ratio
and directly proportional to the temperature ratio.
A.1.3 Friction losses on compressed airflow due to piping
Pressure loss of fluid flowing through a pipe can be calculated as follows:
Equation A.3 – Pressure due to head.
Where
– Pressure drop [kPa] due to friction in piping.
ρ – Density of the fluid [kg/m3].
g – Gravitational acceleration. This is taken as 9.81 m/s2.
hf – Head loss [m] due to friction.
The density of air is calculated using the ideal gas law:
Equation A.4 – Ideal gas law (2).
Where
ρ – Air density [kg/m3]
P – Absolute air pressure [kPa].
R – Gas constant taken as 0.287 kJ/kg-K.
T – Absolute air temperature [K].
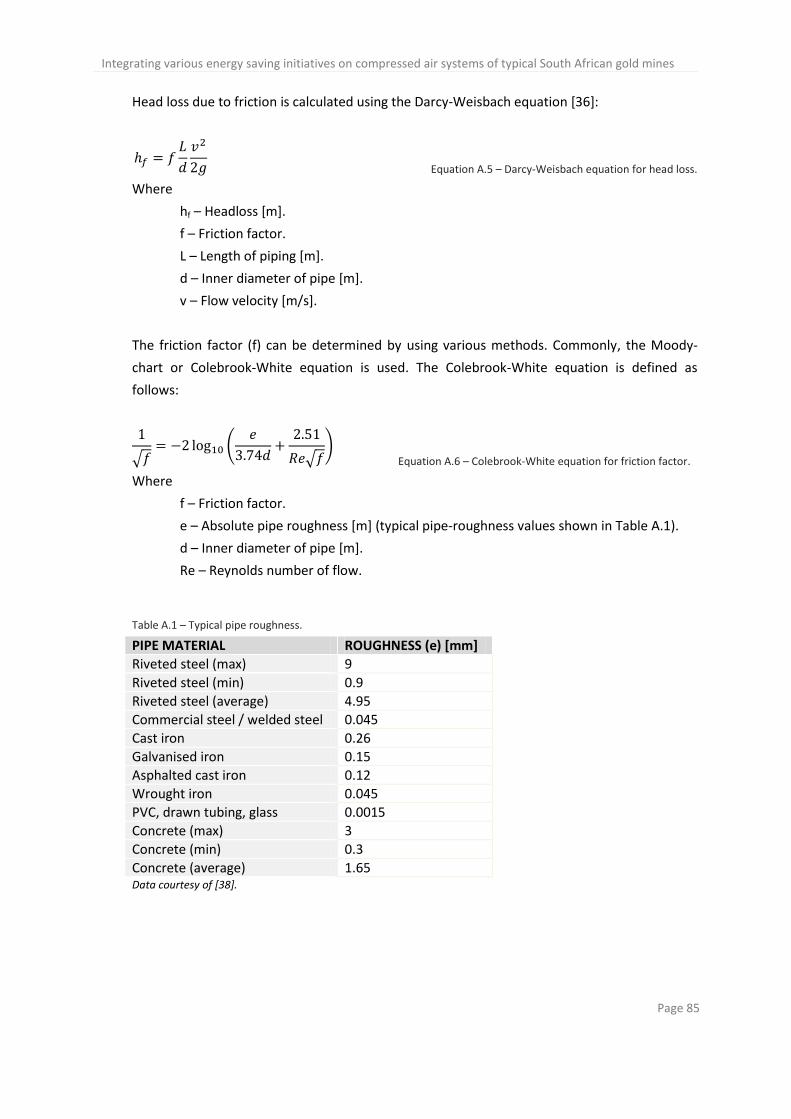
Integrating various energy saving initiatives on compressed air systems of typical South African gold mines
Page 85
Head loss due to friction is calculated using the Darcy-Weisbach equation [36]:
Equation A.5 – Darcy-Weisbach equation for head loss.
Where
hf – Headloss [m].
f – Friction factor.
L – Length of piping [m].
d – Inner diameter of pipe [m].
v – Flow velocity [m/s].
The friction factor (f) can be determined by using various methods. Commonly, the Moody-
chart or Colebrook-White equation is used. The Colebrook-White equation is defined as
follows:
√ (
√ )
Equation A.6 – Colebrook-White equation for friction factor.
Where
f – Friction factor.
e – Absolute pipe roughness [m] (typical pipe-roughness values shown in Table A.1).
d – Inner diameter of pipe [m].
Re – Reynolds number of flow.
Table A.1 – Typical pipe roughness.
PIPE MATERIAL ROUGHNESS (e) [mm]
Riveted steel (max) 9
Riveted steel (min) 0.9
Riveted steel (average) 4.95
Commercial steel / welded steel 0.045
Cast iron 0.26
Galvanised iron 0.15
Asphalted cast iron 0.12
Wrought iron 0.045
PVC, drawn tubing, glass 0.0015
Concrete (max) 3
Concrete (min) 0.3
Concrete (average) 1.65 Data courtesy of [38].
Integrating various energy saving initiatives on compressed air systems of typical South African gold mines
Page 86
The Reynolds number can be calculated as follows:
Equation A.7 – Reynolds number.
Where
Re – Reynolds number.
ρ – Density of the fluid [kg/m3].
v – Flow velocity through pipe [m/s].
d – Inner diameter of pipe [m].
μ – Dynamic viscosity of fluid [Ns/m2].
Assuming isothermal flow the head loss can be adjusted for compressible flow in pipes [39]:
|
|
Equation A.8 – Head loss in compressible flow.
Where
h – Headloss [m]. “f” refers to friction loss where compressibility effects are
disregarded. “f,comp” refers to the friction loss where compressibility effects are
accounted for.
k – Specific heat ratio of fluid (taken as 1.4 for air).
M – Mach number of flow.
A.1.4 Air loss through unwanted air leaks
Determining exact volumetric flow rates through leaks present in piping is beyond the scope of
this study. For approximation purposes flow through air leaks will be treated as flow through
an orifice. Flow through an orifice can be calculated as follows [39]:
√
Equation A.9 – Volumetric airflow through an orifice.
Where
– Volumetric flow through orifice [m3/s].
P – Upstream gage pressure [kPa].
D – Orifice inner diameter [m].
T – Absolute air temperature [K].
Consider flow through a diameter 5 mm air leak where air is initially compressed at 500 kPa
and 20⁰C. Flow rate through this air leak is calculated as:
Integrating various energy saving initiatives on compressed air systems of typical South African gold mines
Page 87
√
( )( )
√ ( ) ⁄
A.1.5 Electrical power required to produce compressed air
Power required for polytropic compression of air can be calculated as follows [40]:
[( )( ⁄ )
] Equation A.10 – Power required for polytropic compression (1).
Where
Wc– Work input [kW] required to compress gas.
– Mass flow rate [kg/s] of the gas being compressed.
n – Polytropic exponent.
R – Universal gas constant taken as 0.287 kJ/kg-K.
T1 – Inlet temperature [K].
P – Absolute pressure [kPa] (subscript ‘1’ denotes inlet conditions and ‘2’ outlet
conditions.
Mass flow through the compressor is calculated by:
Equation A.11 – Mass-flow rate.
Where
– Mass-flow rate [kg/s].
ρ – Air density [kg/m3] calculated by Equation A.4.
– Volumetric airflow rate [m3/s].
The power required for polytropic compression of air can be calculated by substituting air
density as calculated by the perfect gas law (Equation A.4) into Equation A.11 and rearranging
Equation A.10 as follows:
[( )( ⁄ )
] Equation A.12 – Power required for polytropic compression (2).
Compressor and motor-efficiencies should be included in order to find the actual power
consumed. This can be calculated by:
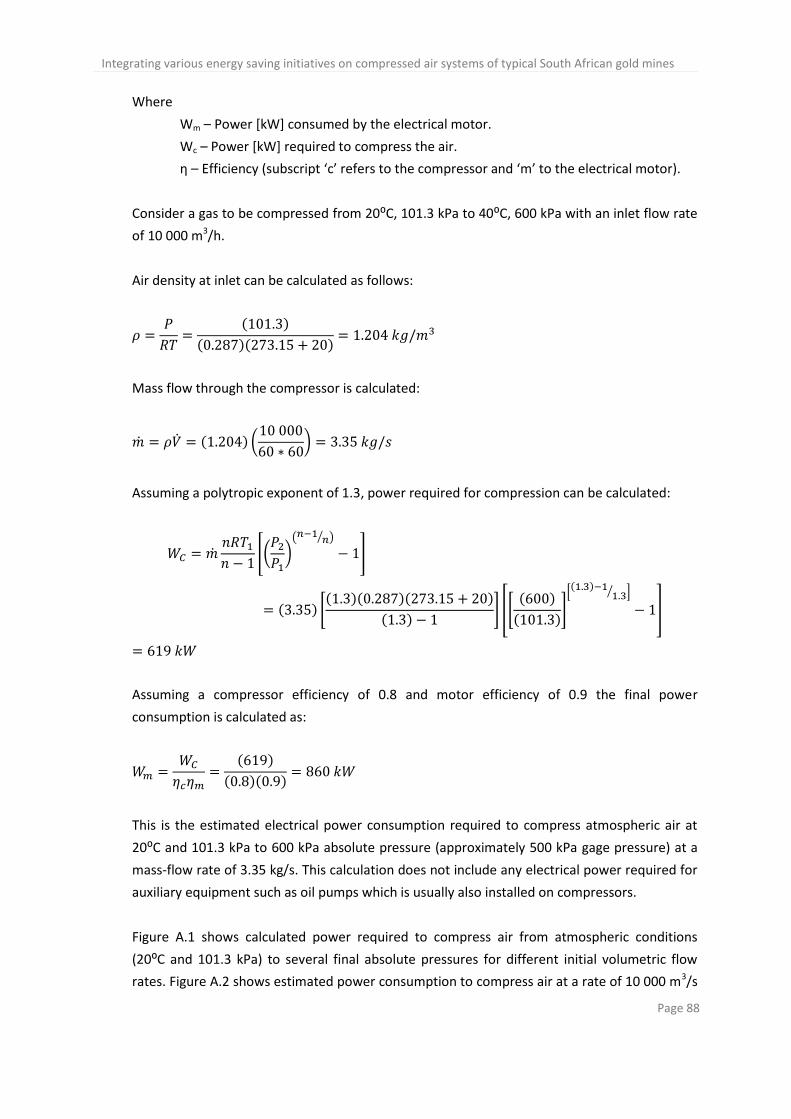
Integrating various energy saving initiatives on compressed air systems of typical South African gold mines
Page 88
Where
Wm – Power [kW] consumed by the electrical motor.
Wc – Power [kW] required to compress the air.
η – Efficiency (subscript ‘c’ refers to the compressor and ‘m’ to the electrical motor).
Consider a gas to be compressed from 20⁰C, 101.3 kPa to 40⁰C, 600 kPa with an inlet flow rate
of 10 000 m3/h.
Air density at inlet can be calculated as follows:
( )
( )( )
Mass flow through the compressor is calculated:
( ) (
)
Assuming a polytropic exponent of 1.3, power required for compression can be calculated:
[( )( ⁄ )
]
( ) *( )( )( )
( ) + [*
( )
( )+
[( )
⁄ ]
]
Assuming a compressor efficiency of 0.8 and motor efficiency of 0.9 the final power
consumption is calculated as:
( )
( )( )
This is the estimated electrical power consumption required to compress atmospheric air at
20⁰C and 101.3 kPa to 600 kPa absolute pressure (approximately 500 kPa gage pressure) at a
mass-flow rate of 3.35 kg/s. This calculation does not include any electrical power required for
auxiliary equipment such as oil pumps which is usually also installed on compressors.
Figure A.1 shows calculated power required to compress air from atmospheric conditions
(20⁰C and 101.3 kPa) to several final absolute pressures for different initial volumetric flow
rates. Figure A.2 shows estimated power consumption to compress air at a rate of 10 000 m3/s
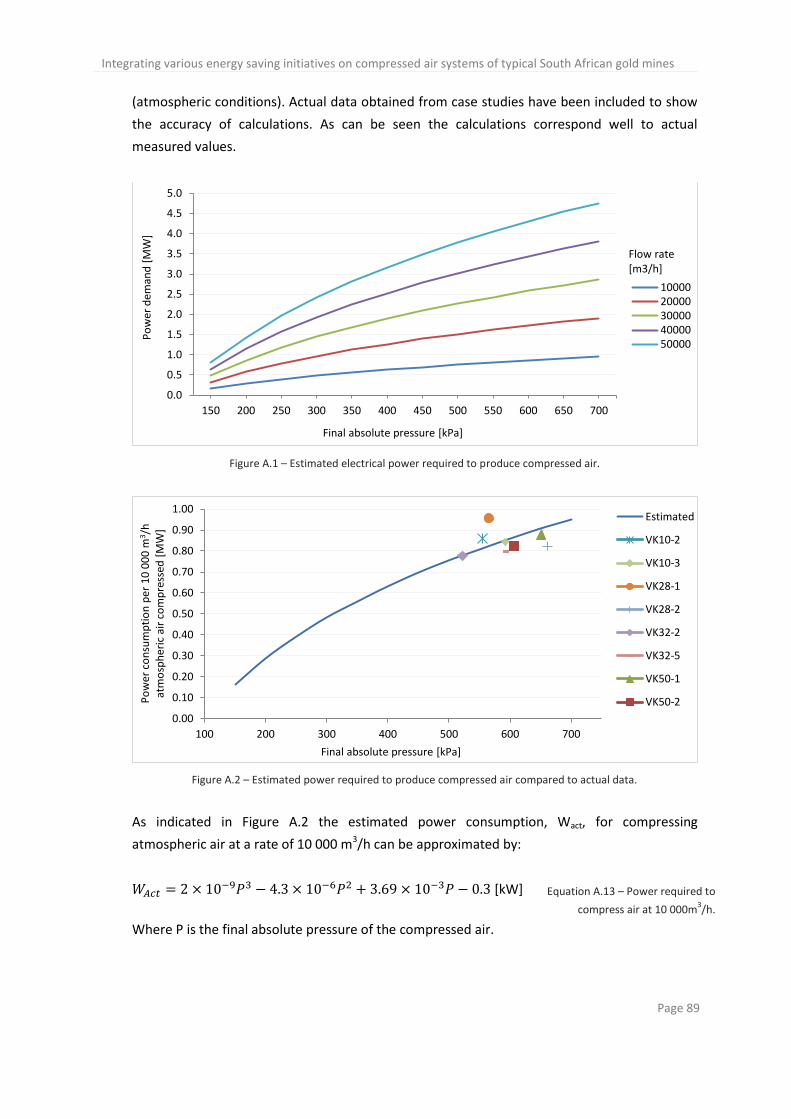
Integrating various energy saving initiatives on compressed air systems of typical South African gold mines
Page 89
(atmospheric conditions). Actual data obtained from case studies have been included to show
the accuracy of calculations. As can be seen the calculations correspond well to actual
measured values.
Figure A.1 – Estimated electrical power required to produce compressed air.
Figure A.2 – Estimated power required to produce compressed air compared to actual data.
As indicated in Figure A.2 the estimated power consumption, Wact, for compressing
atmospheric air at a rate of 10 000 m3/h can be approximated by:
[kW] Equation A.13 – Power required to
compress air at 10 000m3/h.
Where P is the final absolute pressure of the compressed air.
0.0
0.5
1.0
1.5
2.0
2.5
3.0
3.5
4.0
4.5
5.0
150 200 250 300 350 400 450 500 550 600 650 700
Po
wer
dem
and
[M
W]
Final absolute pressure [kPa]
1000020000300004000050000
Flow rate [m3/h]
0.00
0.10
0.20
0.30
0.40
0.50
0.60
0.70
0.80
0.90
1.00
100 200 300 400 500 600 700
Po
wer
co
nsu
mp
tio
n p
er 1
0 0
00
m3 /
h
atm
osp
her
ic a
ir c
om
pre
ssed
[M
W]
Final absolute pressure [kPa]
Estimated
VK10-2
VK10-3
VK28-1
VK28-2
VK32-2
VK32-5
VK50-1
VK50-2
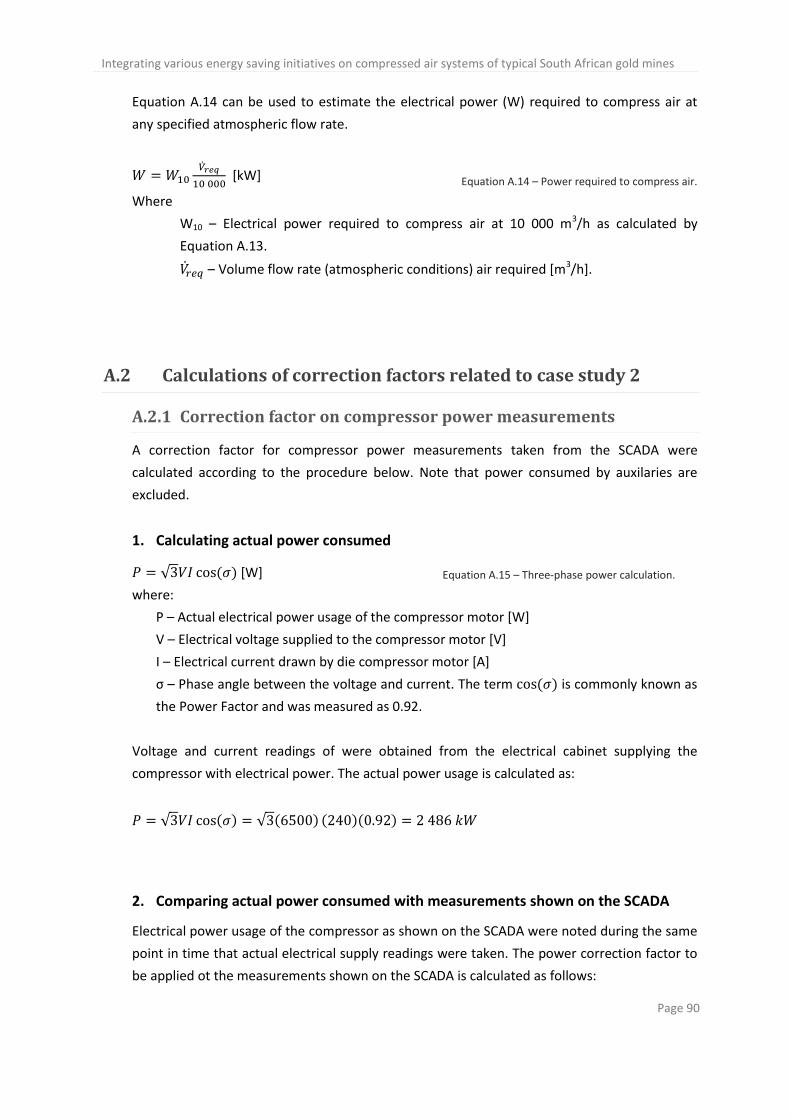
Integrating various energy saving initiatives on compressed air systems of typical South African gold mines
Page 90
Equation A.14 can be used to estimate the electrical power (W) required to compress air at
any specified atmospheric flow rate.
[kW] Equation A.14 – Power required to compress air.
Where
W10 – Electrical power required to compress air at 10 000 m3/h as calculated by
Equation A.13.
– Volume flow rate (atmospheric conditions) air required [m3/h].
A.2 Calculations of correction factors related to case study 2
A.2.1 Correction factor on compressor power measurements
A correction factor for compressor power measurements taken from the SCADA were
calculated according to the procedure below. Note that power consumed by auxilaries are
excluded.
1. Calculating actual power consumed
√ ( ) [W] Equation A.15 – Three-phase power calculation.
where:
P – Actual electrical power usage of the compressor motor [W]
V – Electrical voltage supplied to the compressor motor [V]
I – Electrical current drawn by die compressor motor [A]
ς – Phase angle between the voltage and current. The term ( ) is commonly known as
the Power Factor and was measured as 0.92.
Voltage and current readings of were obtained from the electrical cabinet supplying the
compressor with electrical power. The actual power usage is calculated as:
√ ( ) √ ( ) ( )( )
2. Comparing actual power consumed with measurements shown on the SCADA
Electrical power usage of the compressor as shown on the SCADA were noted during the same
point in time that actual electrical supply readings were taken. The power correction factor to
be applied ot the measurements shown on the SCADA is calculated as follows:

Integrating various energy saving initiatives on compressed air systems of typical South African gold mines
Page 91
1.19
Equation A.16 – SCADA Power correction factor.
The average power correction factor between all six compressors was calculated as 1.16.