Embed Size (px)
Citation preview
Renewables Integra.on into Power Grid Systems
Prof. G.R. Tynan UC San Diego MAE Dept.
MAE 119
Outline: Hierarchy of Issues to Consider • What does a grid really look like? • Instantaneous Power: Genera.on = Load • Characterizing Renewable Electricity Varia.ons:
– Time-‐scales & Magnitudes • A (painfully) simplified model to see the physics: AC Circuit
• Synchronous Generators • Response to transient load-‐mismatch: Frequency Stability, Reac.ve Power Transients & Voltage Stability
• Need for Storage: Time-‐scales of response; Power & Energy Required
Outline: Hierarchy of Issues • What does a grid really look like? • Instantaneous Power: Genera.on = Load • Characterizing Renewable Electricity Varia.ons:
– Time-‐scales & Magnitudes • A (painfully) simplified model to see the physics: AC Circuit
• Synchronous Generators • Response to transient load-‐mismatch: Frequency Stability, Reac.ve Power Transients & Voltage Stability
• Need for Storage: Time-‐scales of response; Power & Energy Required
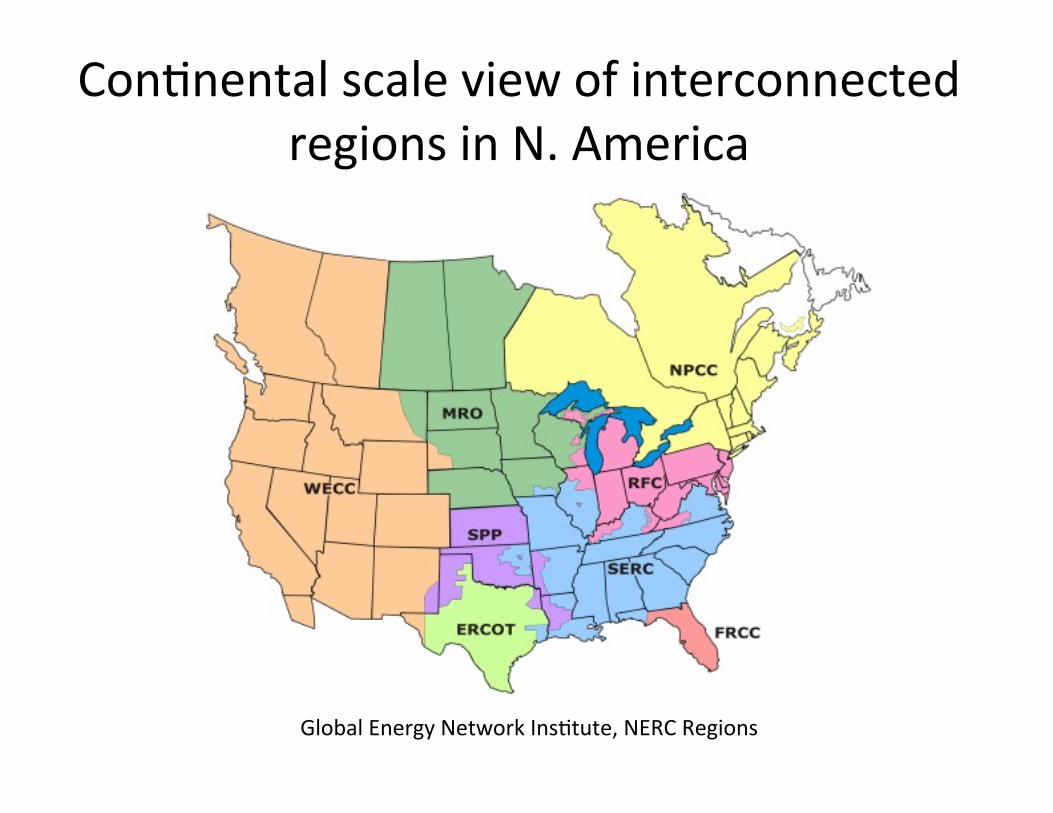
Con.nental scale view of interconnected regions in N. America
Global Energy Network Ins.tute, NERC Regions
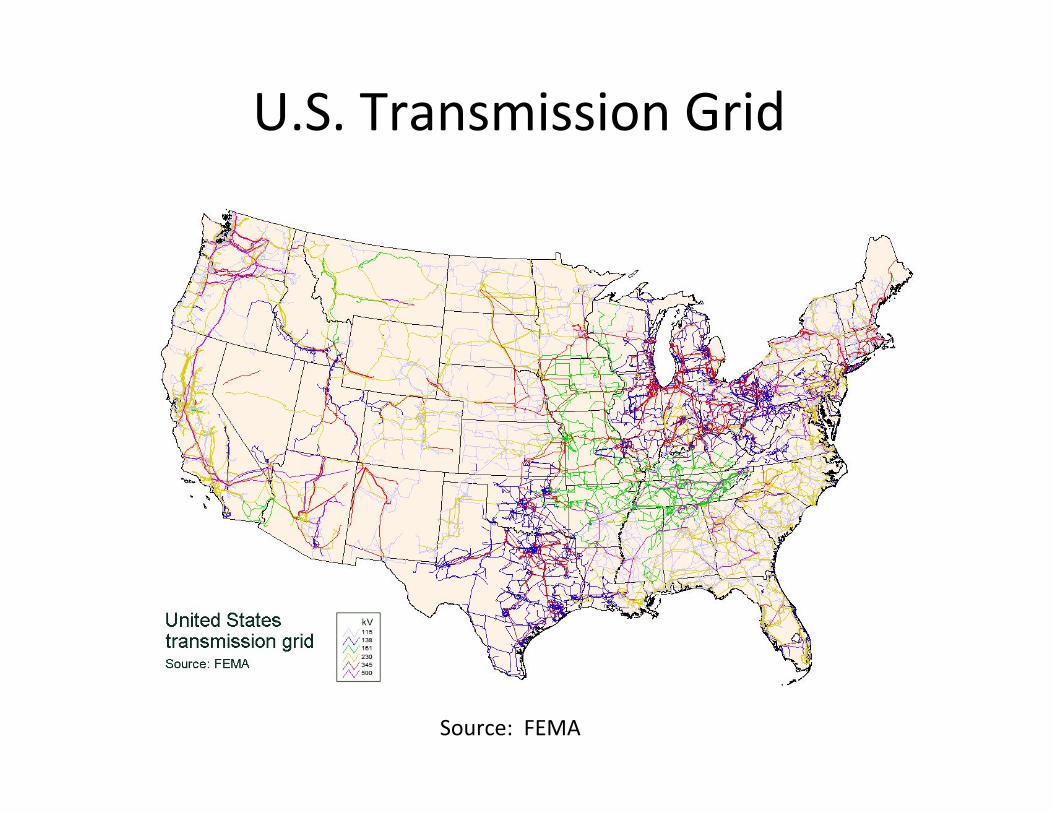
U.S. Transmission Grid
Source: FEMA
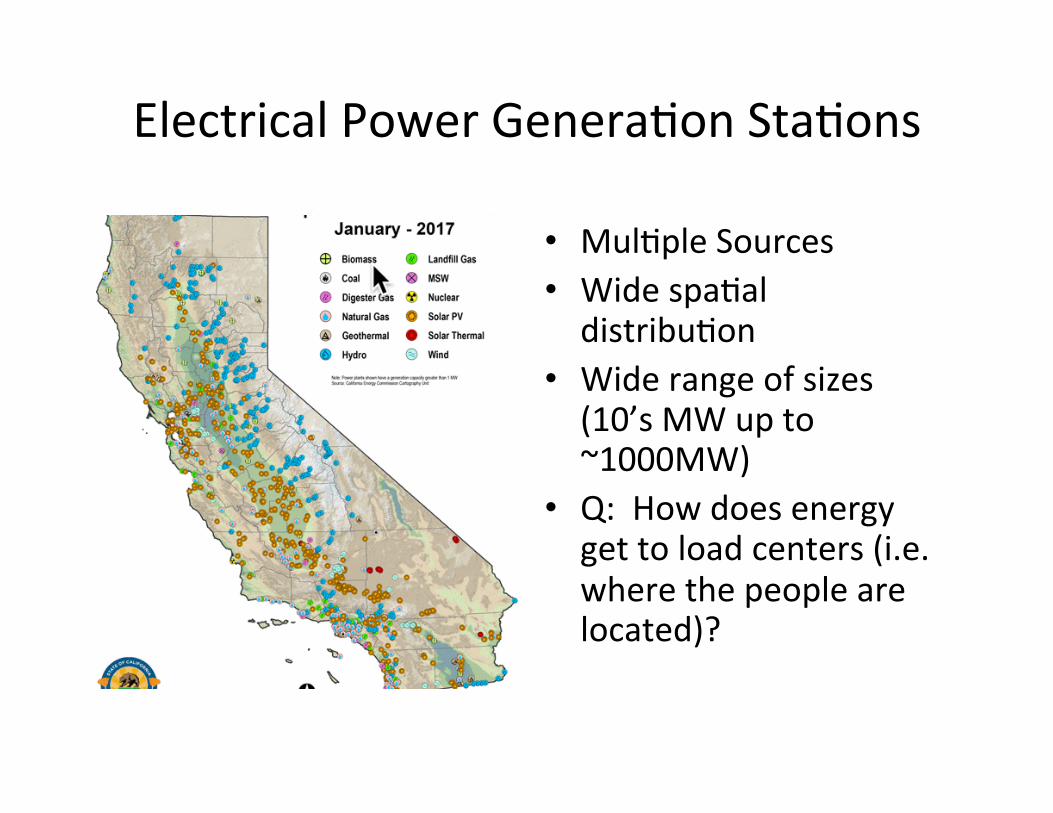
Electrical Power Genera.on Sta.ons
• Mul.ple Sources • Wide spa.al distribu.on
• Wide range of sizes (10’s MW up to ~1000MW)
• Q: How does energy get to load centers (i.e. where the people are located)?
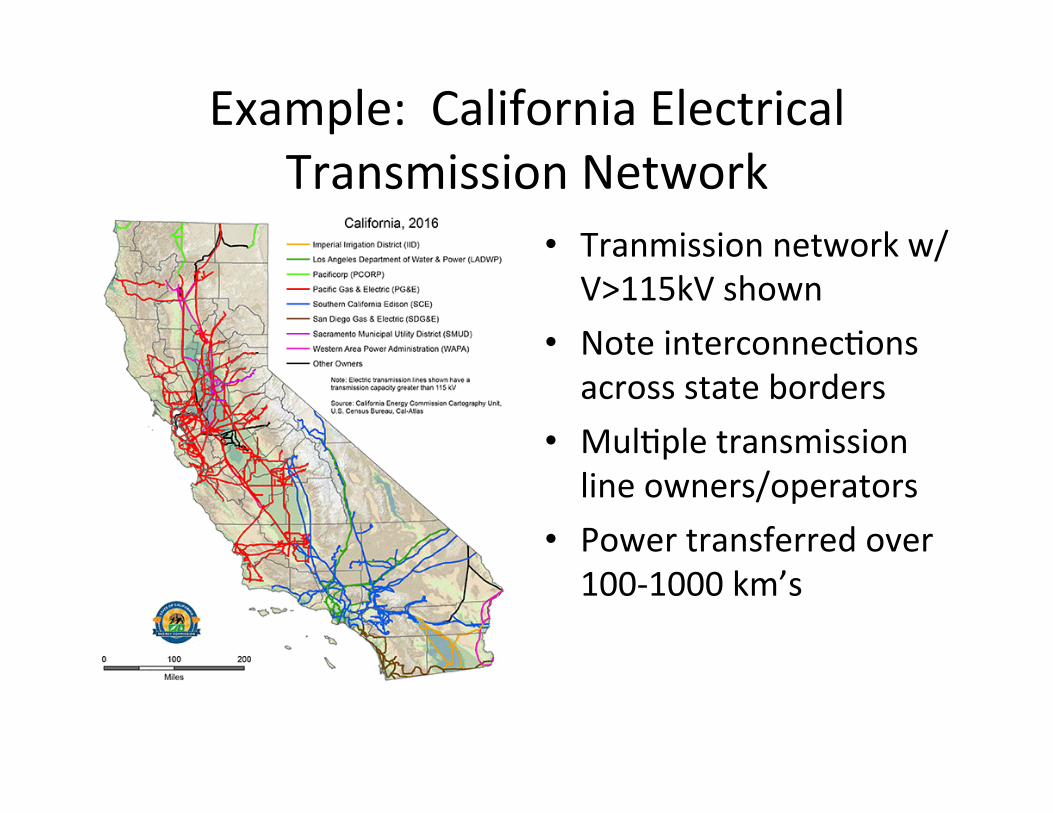
Example: California Electrical Transmission Network
• Tranmission network w/ V>115kV shown
• Note interconnec.ons across state borders
• Mul.ple transmission line owners/operators
• Power transferred over 100-‐1000 km’s
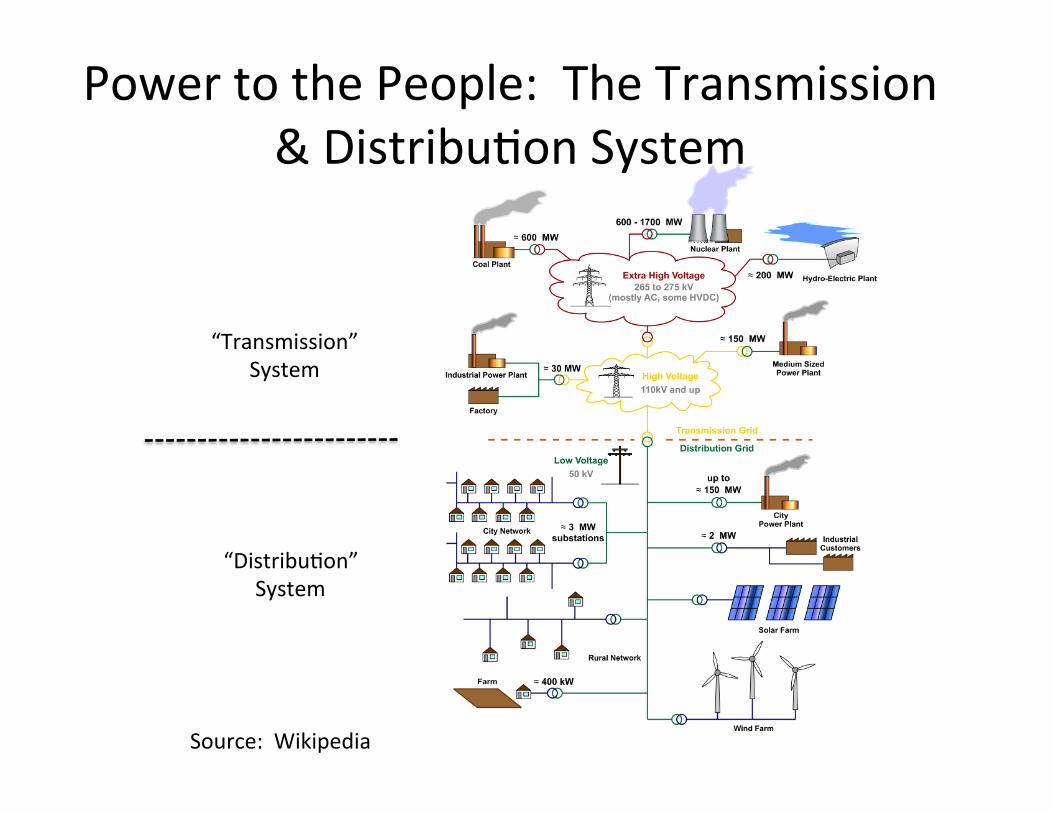
Power to the People: The Transmission & Distribu.on System
Source: Wikipedia
“Transmission” System
“Distribu.on” System
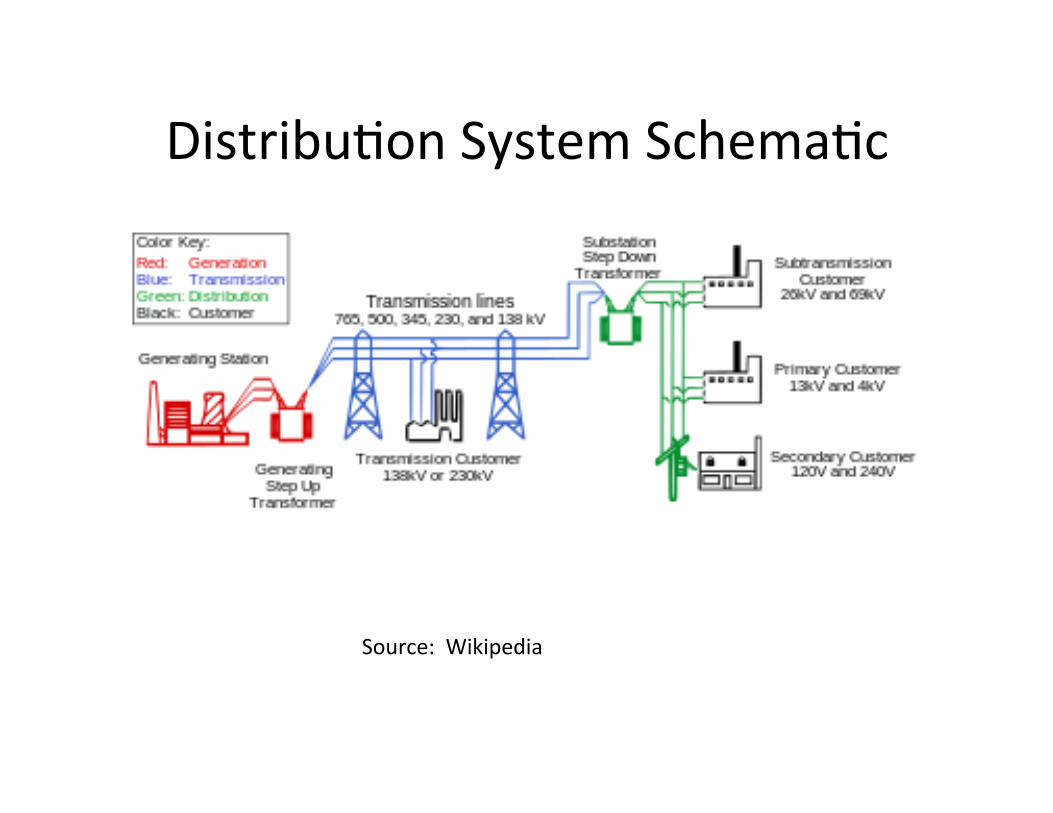
Distribu.on System Schema.c
Source: Wikipedia
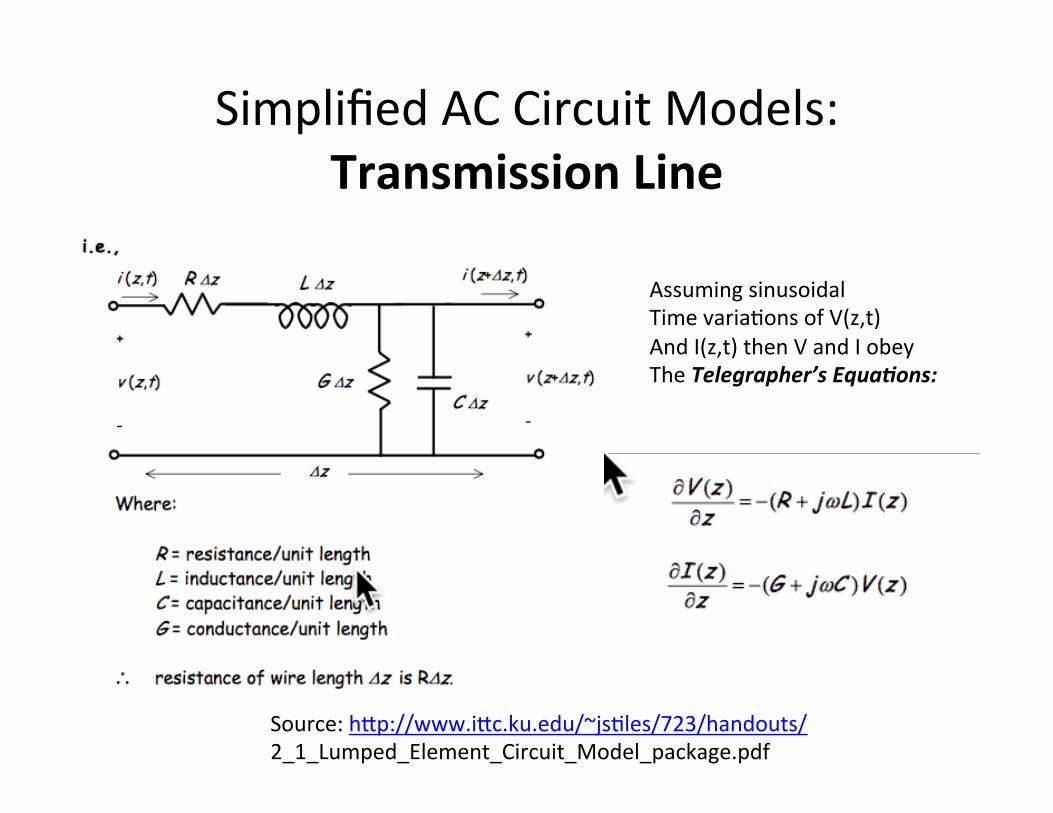
Simplified AC Circuit Models: Transmission Line
Assuming sinusoidal Time varia.ons of V(z,t) And I(z,t) then V and I obey The Telegrapher’s Equa/ons:
Source: hep://www.iec.ku.edu/~js.les/723/handouts/ 2_1_Lumped_Element_Circuit_Model_package.pdf
Simplified AC Circuit Models: Transmission Line (cont’d)
Can show V(z) and I(z) obey:
Source: hep://www.iec.ku.edu/~js.les/723/handouts/ 2_1_Lumped_Element_Circuit_Model_package.pdf

Outline: Hierarchy of Issues • What does a grid really look like? • Instantaneous Power: Genera.on = Load • Characterizing Renewable Electricity Varia.ons:
– Time-‐scales & Magnitudes • A (painfully) simplified model to see the physics: AC Circuit
• Synchronous Generators • Response to transient load-‐mismatch: Frequency Stability, Reac.ve Power Transients & Voltage Stability
• Need for Storage: Time-‐scales of response; Power & Energy Required
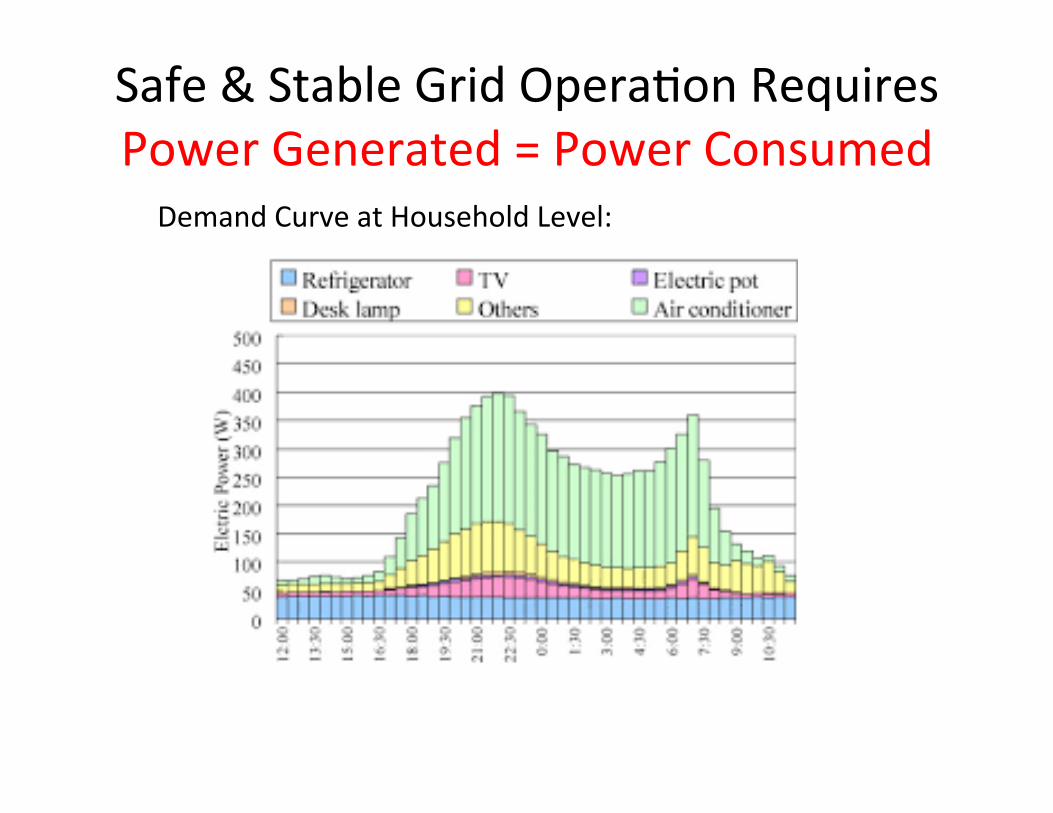
Safe & Stable Grid Opera.on Requires Power Generated = Power Consumed
Demand Curve at Household Level:
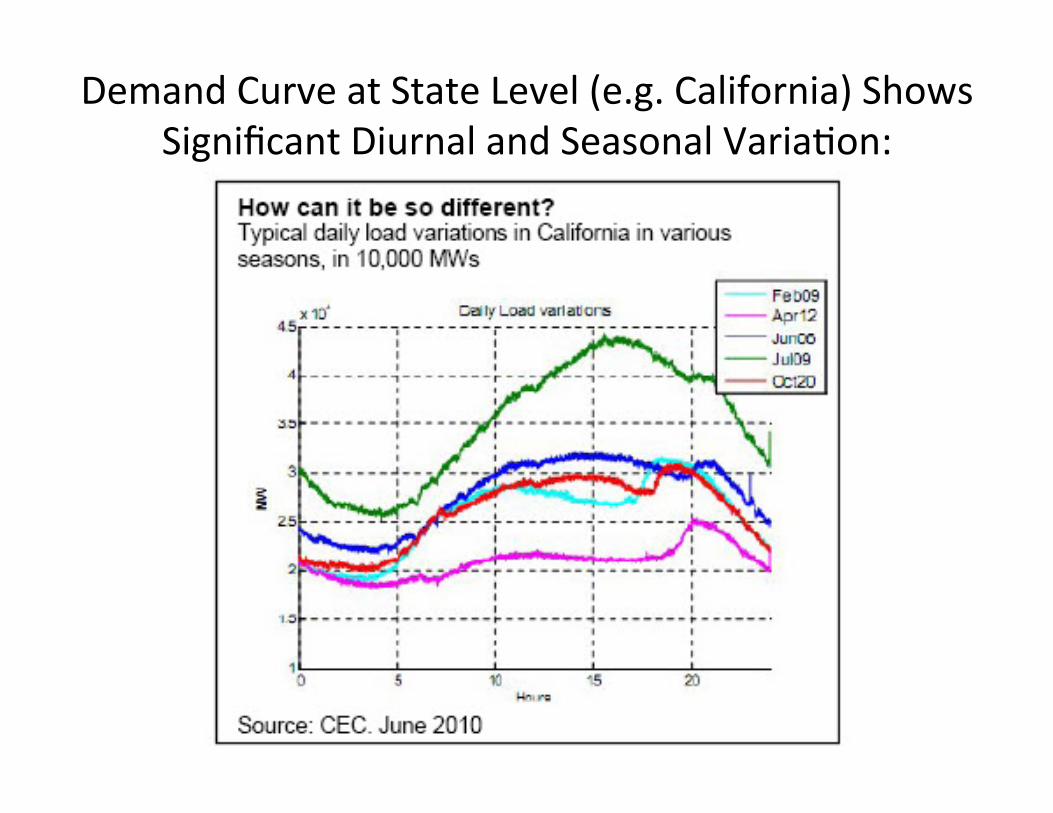
Demand Curve at State Level (e.g. California) Shows Significant Diurnal and Seasonal Varia.on:
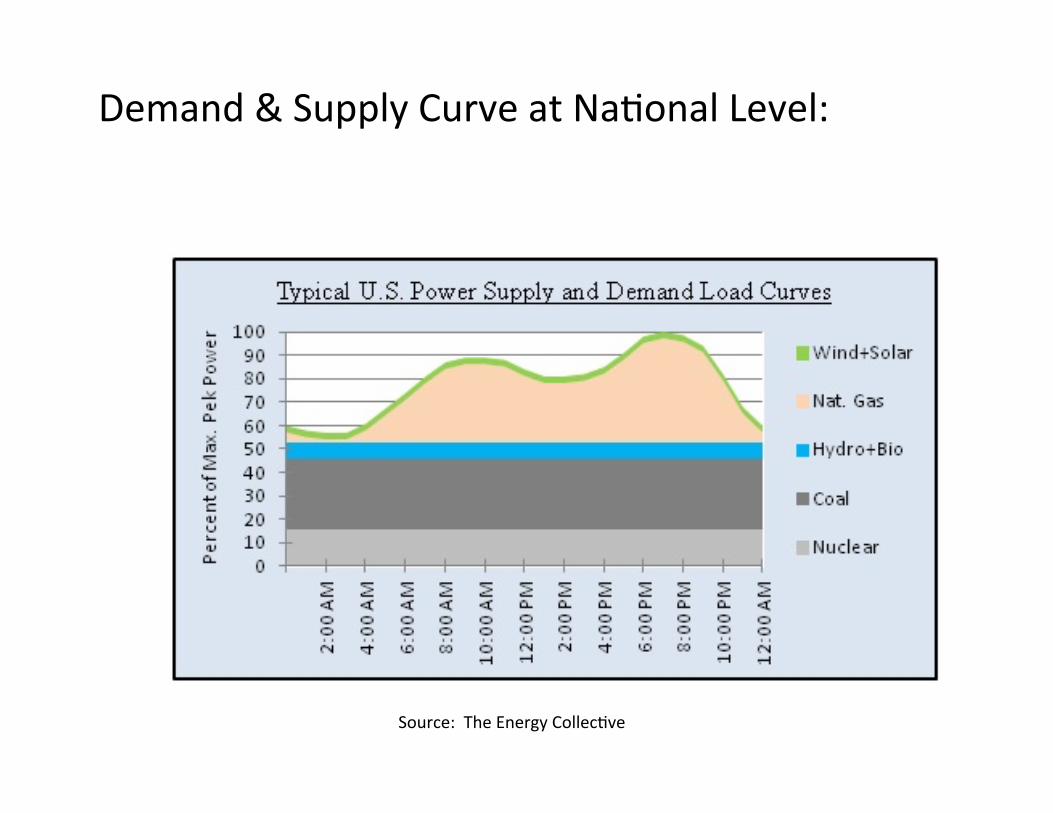
Demand & Supply Curve at Na.onal Level:
Source: The Energy Collec.ve
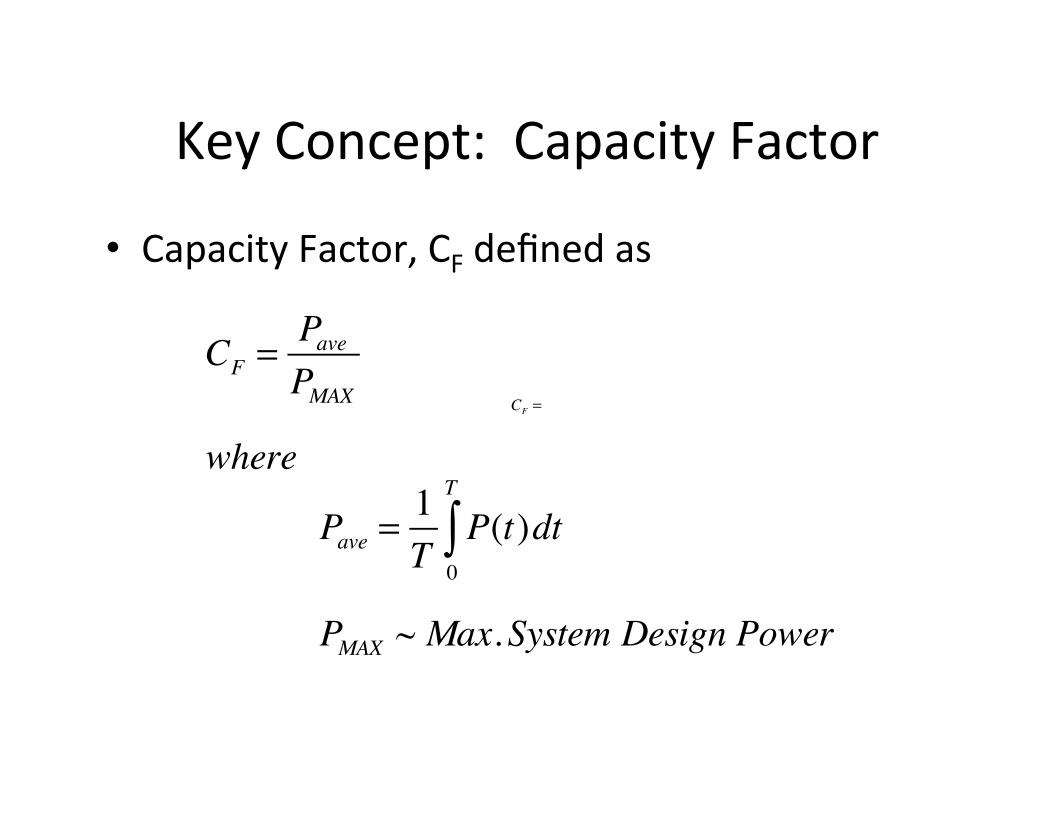
Key Concept: Capacity Factor
• Capacity Factor, CF defined as
CF =
CF =PavePMAX
where
Pave =1T
P(t)dt0
T
∫
PMAX ~ Max.System Design Power
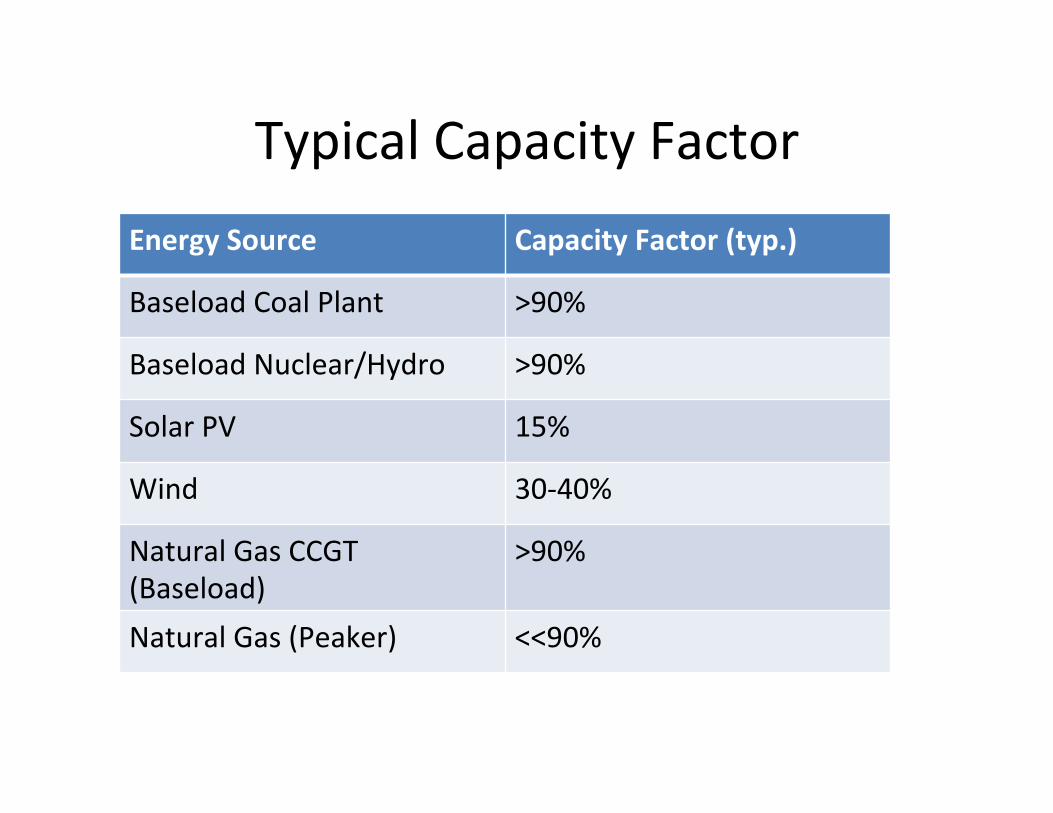
Typical Capacity Factor Energy Source Capacity Factor (typ.)
Baseload Coal Plant >90%
Baseload Nuclear/Hydro >90%
Solar PV 15%
Wind 30-‐40%
Natural Gas CCGT (Baseload)
>90%
Natural Gas (Peaker) <<90%
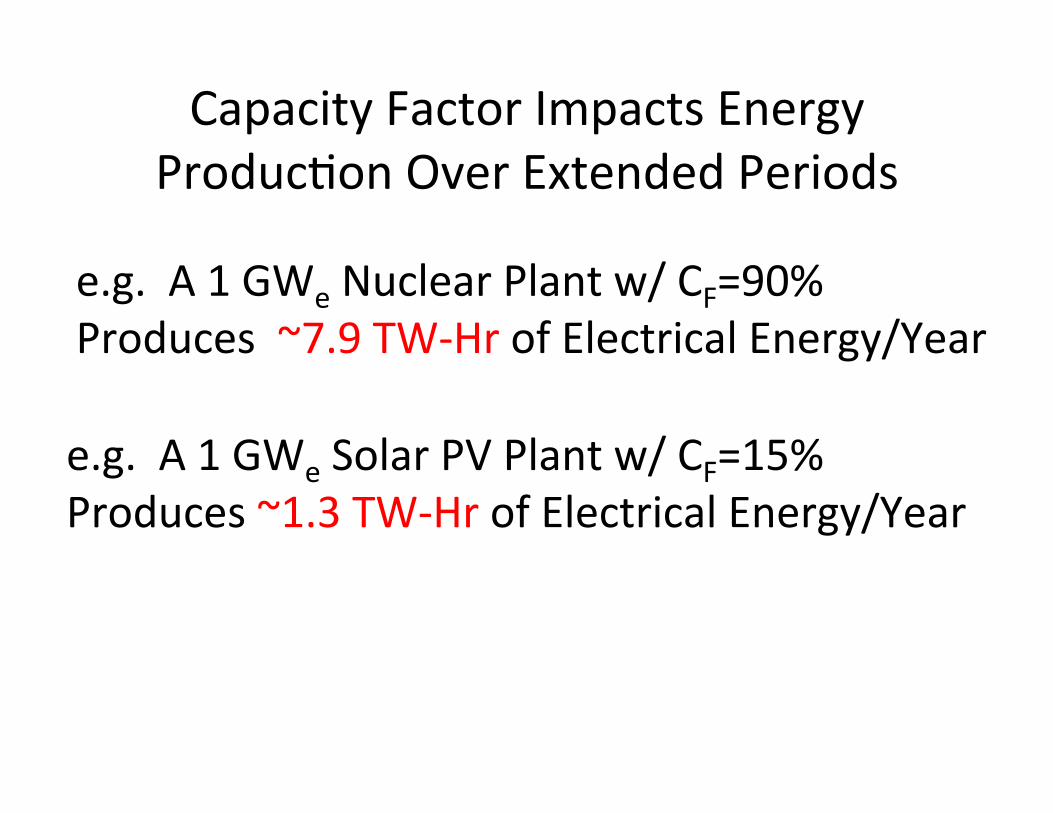
Capacity Factor Impacts Energy Produc.on Over Extended Periods
e.g. A 1 GWe Nuclear Plant w/ CF=90% Produces ~7.9 TW-‐Hr of Electrical Energy/Year
e.g. A 1 GWe Solar PV Plant w/ CF=15% Produces ~1.3 TW-‐Hr of Electrical Energy/Year
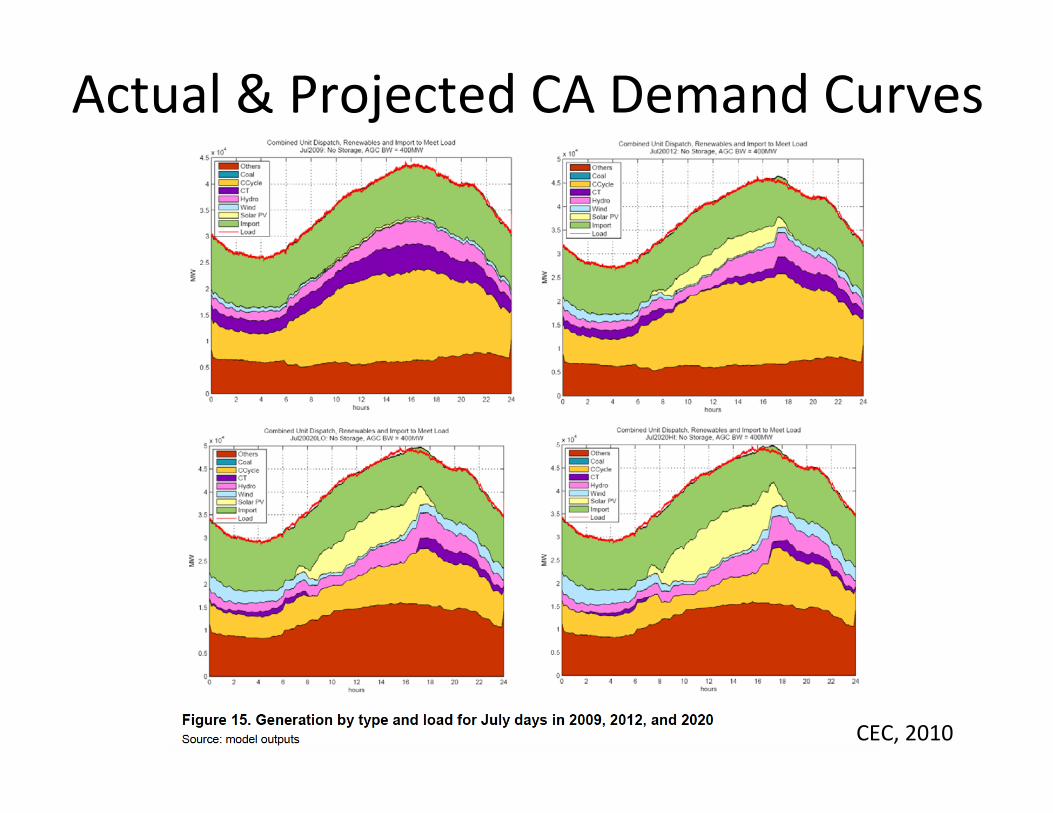
Actual & Projected CA Demand Curves
CEC, 2010
Outline: Hierarchy of Issues • What does a grid really look like? • Instantaneous Power: Genera.on = Load • Characterizing Renewable Electricity Varia@ons:
– Time-‐scales & Magnitudes • A (painfully) simplified model to see the physics: AC Circuit
• Synchronous Generators • Response to transient load-‐mismatch: Frequency Stability, Reac.ve Power Transients & Voltage Stability
• Need for Storage: Time-‐scales of response; Power & Energy Required
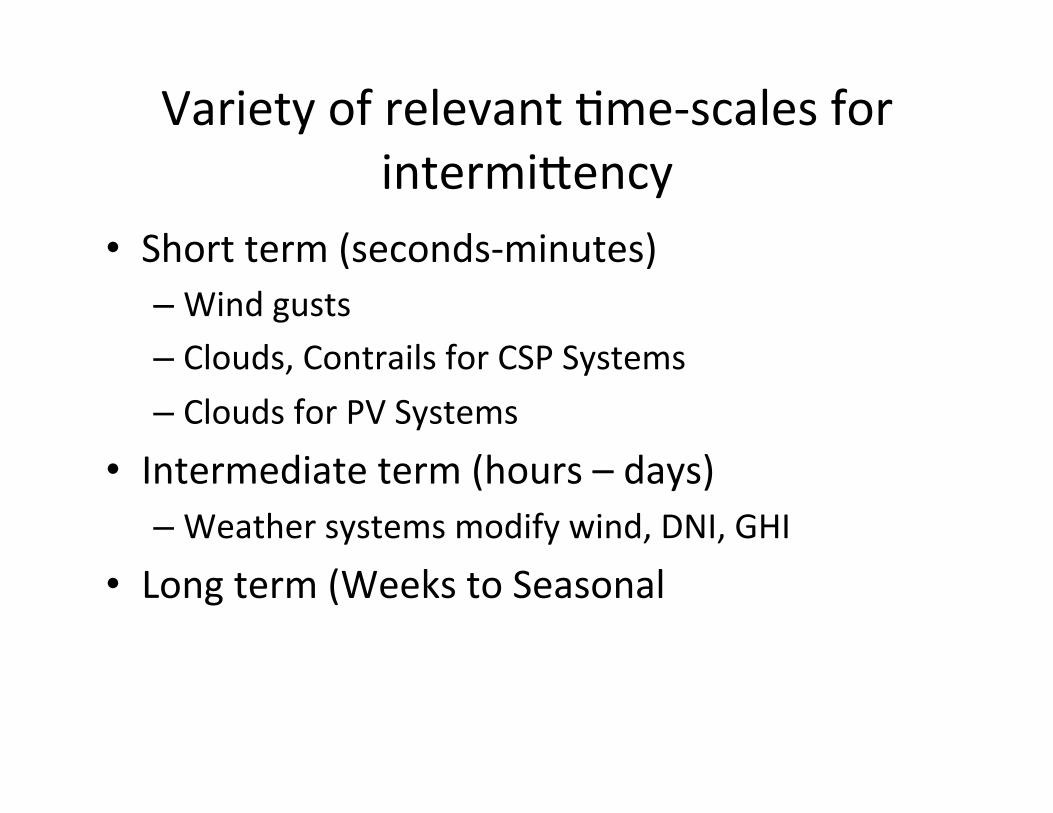
Variety of relevant .me-‐scales for intermieency
• Short term (seconds-‐minutes) – Wind gusts – Clouds, Contrails for CSP Systems – Clouds for PV Systems
• Intermediate term (hours – days) – Weather systems modify wind, DNI, GHI
• Long term (Weeks to Seasonal
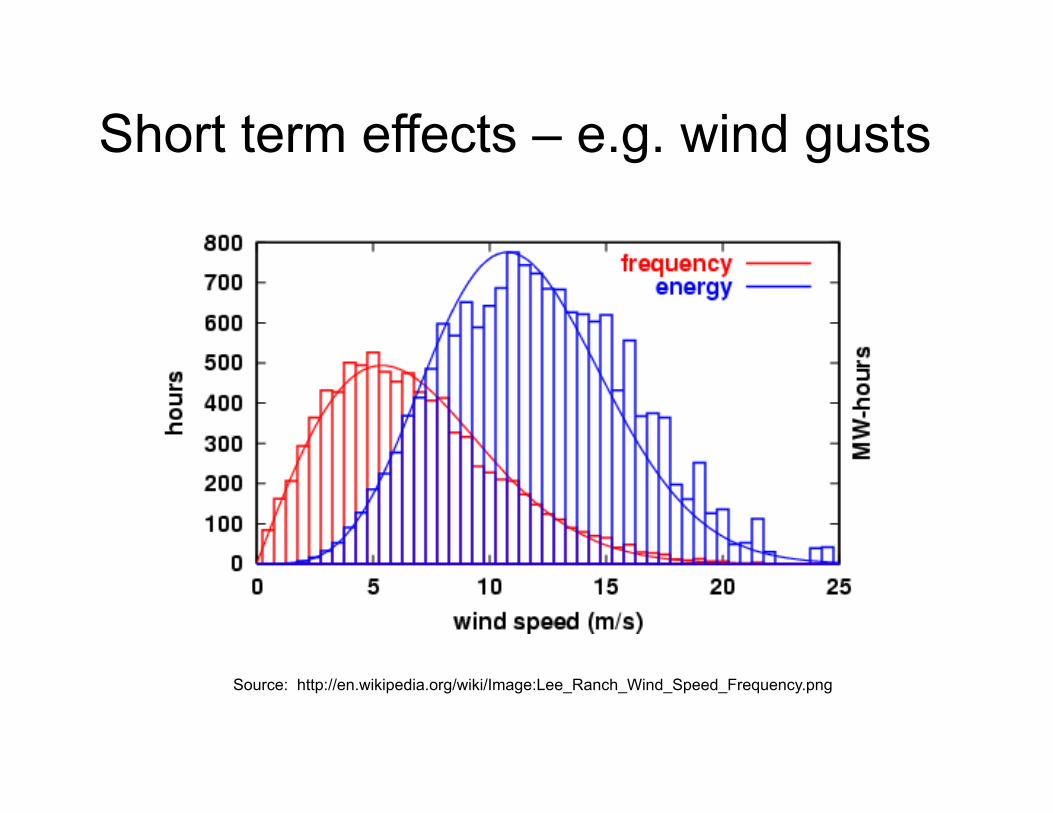
Short term effects – e.g. wind gusts
Source: http://en.wikipedia.org/wiki/Image:Lee_Ranch_Wind_Speed_Frequency.png
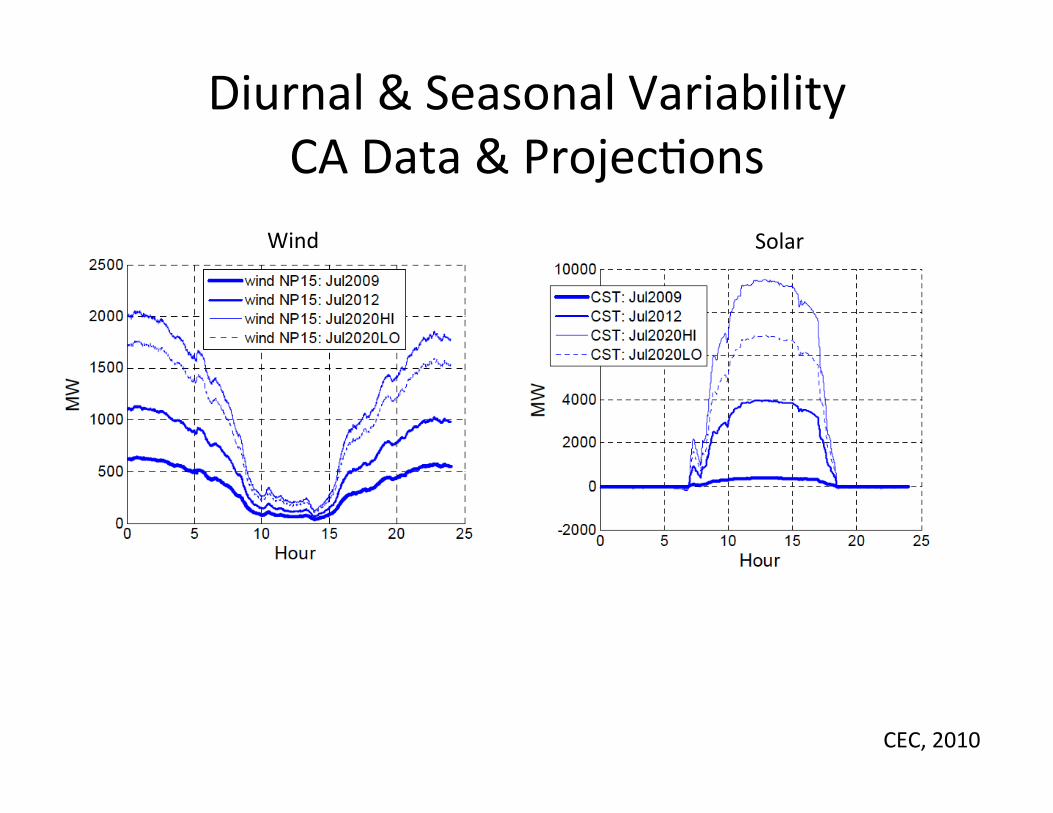
Diurnal & Seasonal Variability CA Data & Projec.ons
Solar
CEC, 2010
Wind
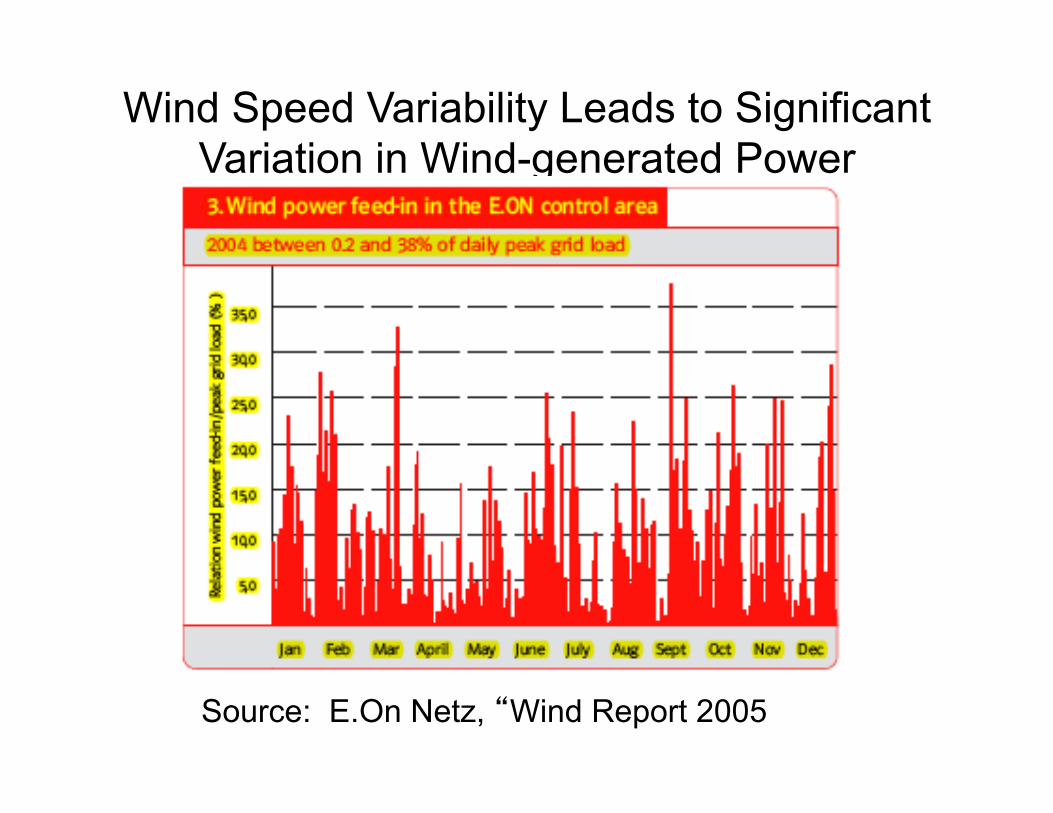
Wind Speed Variability Leads to Significant Variation in Wind-generated Power
Source: E.On Netz, “Wind Report 2005
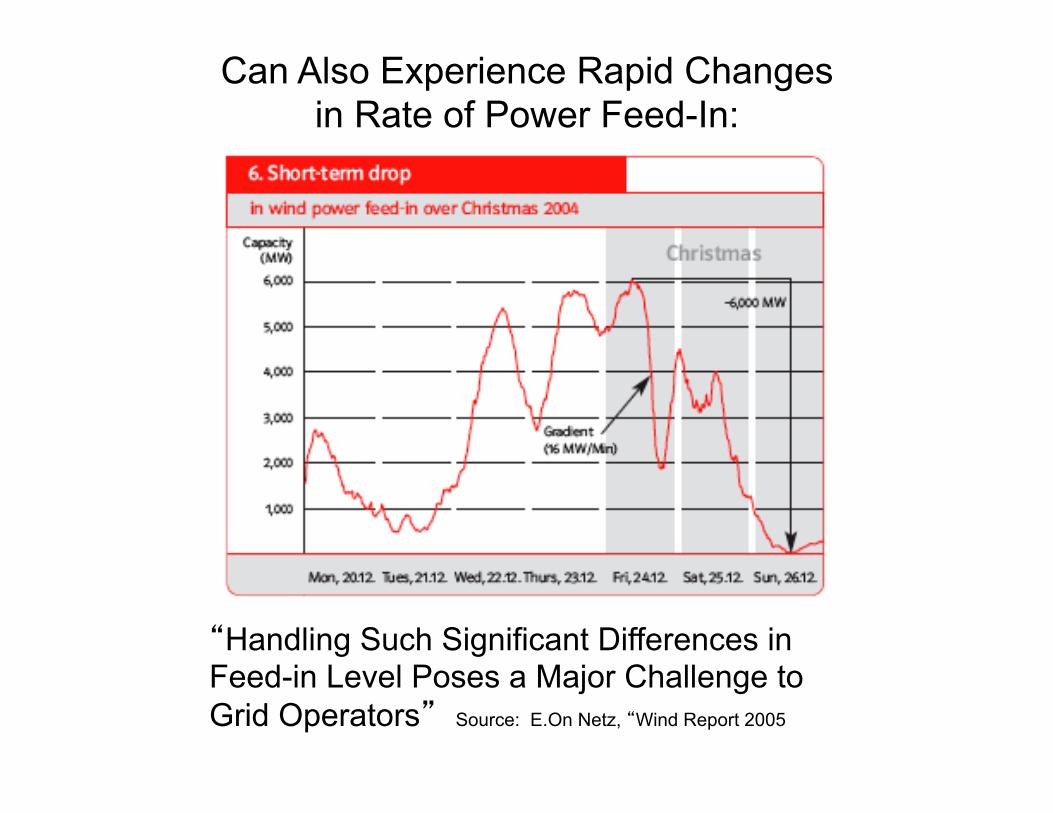
Can Also Experience Rapid Changes in Rate of Power Feed-In:
“Handling Such Significant Differences in Feed-in Level Poses a Major Challenge to Grid Operators” Source: E.On Netz, “Wind Report 2005
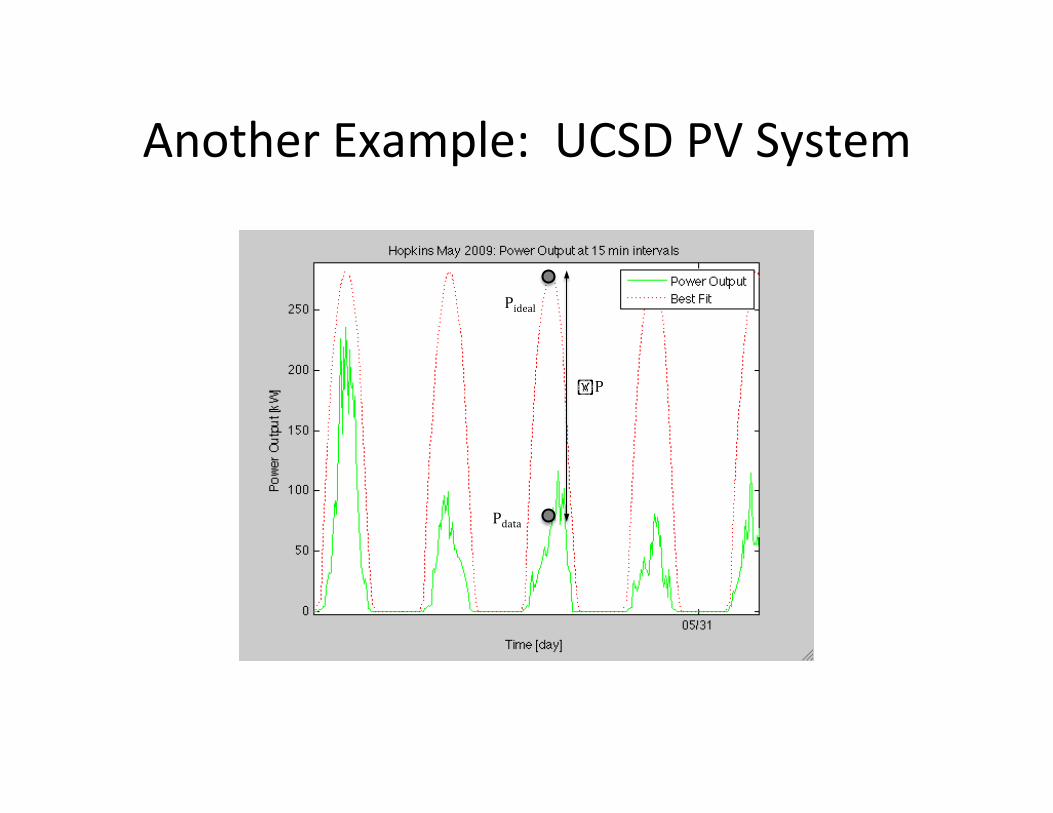
Another Example: UCSD PV System
Pideal
Pdata
P
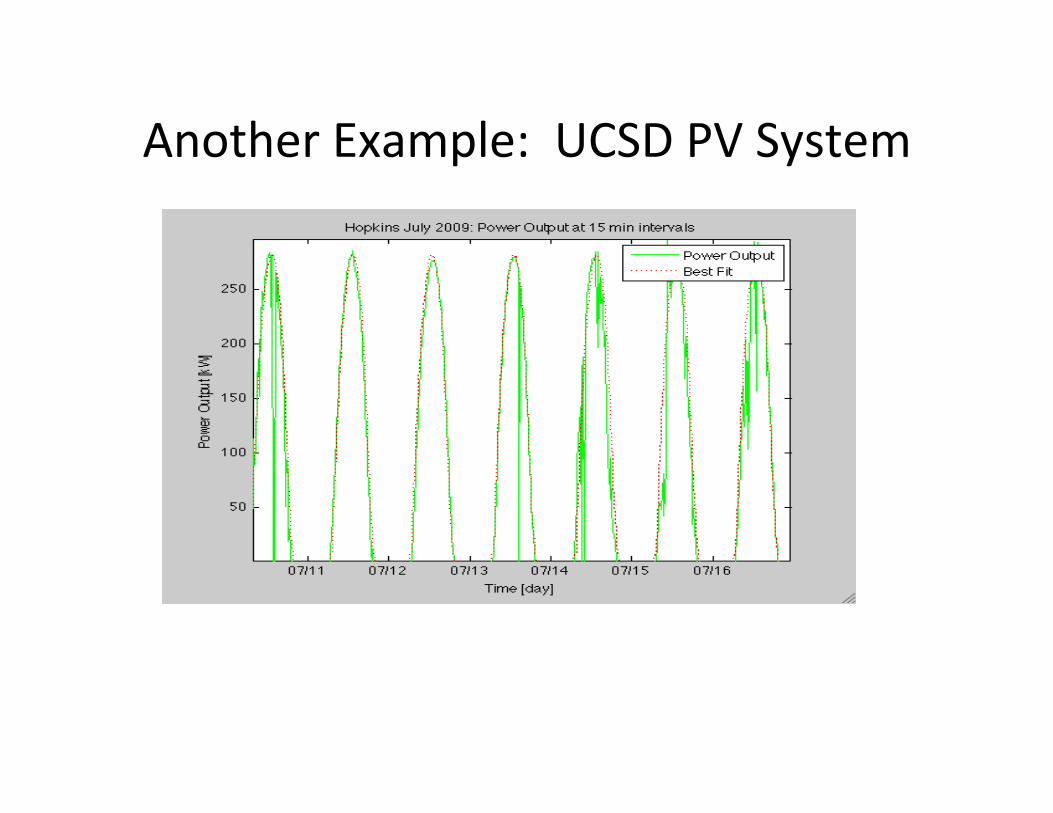
Another Example: UCSD PV System
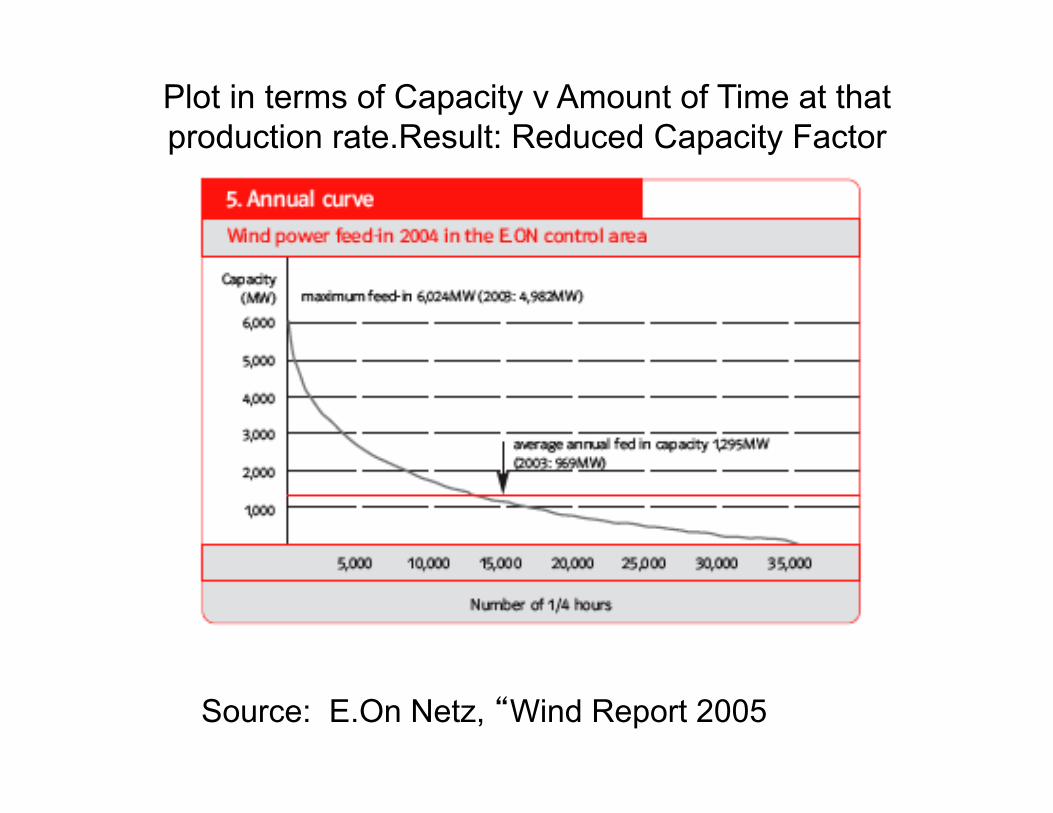
Plot in terms of Capacity v Amount of Time at that production rate.Result: Reduced Capacity Factor
Source: E.On Netz, “Wind Report 2005
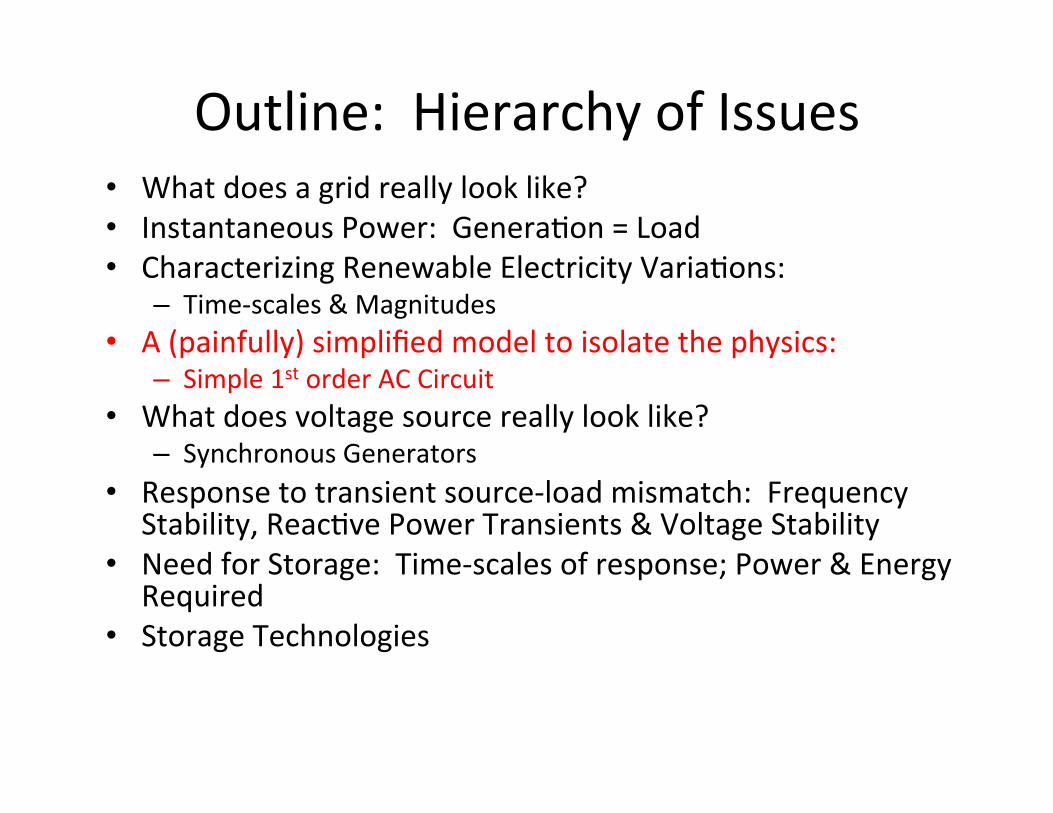
Outline: Hierarchy of Issues • What does a grid really look like? • Instantaneous Power: Genera.on = Load • Characterizing Renewable Electricity Varia.ons:
– Time-‐scales & Magnitudes • A (painfully) simplified model to isolate the physics:
– Simple 1st order AC Circuit • What does voltage source really look like?
– Synchronous Generators • Response to transient source-‐load mismatch: Frequency
Stability, Reac.ve Power Transients & Voltage Stability • Need for Storage: Time-‐scales of response; Power & Energy
Required • Storage Technologies
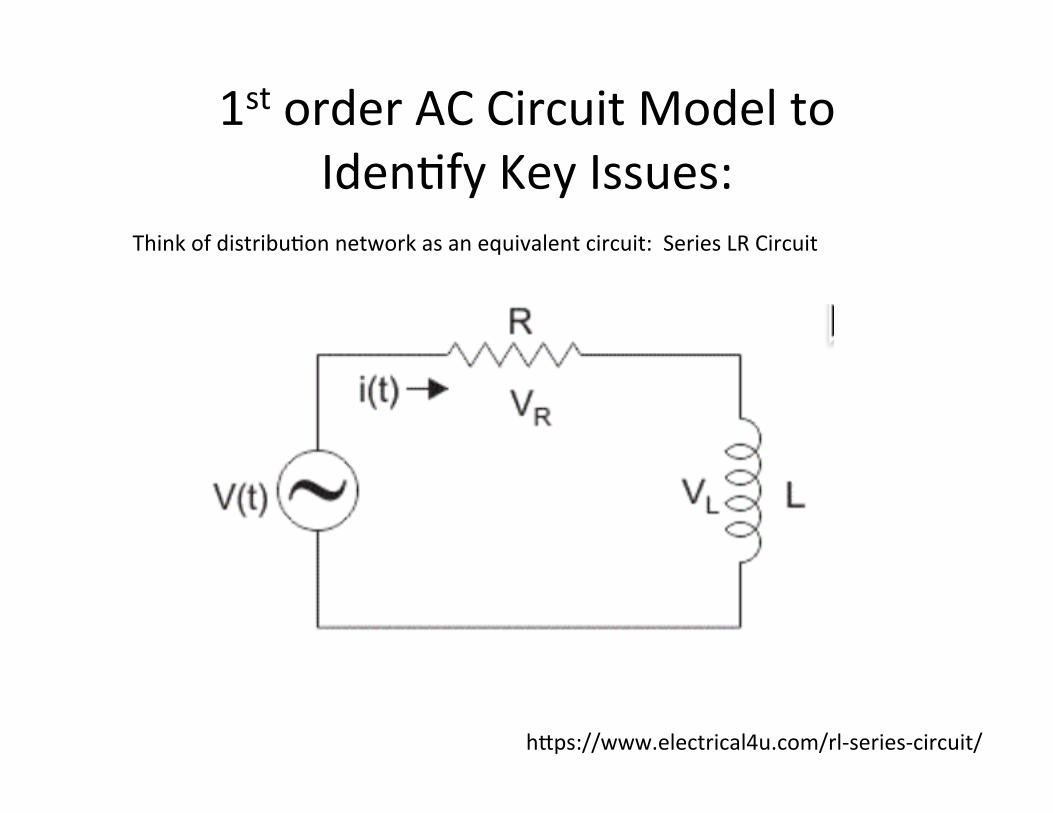
1st order AC Circuit Model to Iden.fy Key Issues:
Think of distribu.on network as an equivalent circuit: Series LR Circuit
heps://www.electrical4u.com/rl-‐series-‐circuit/
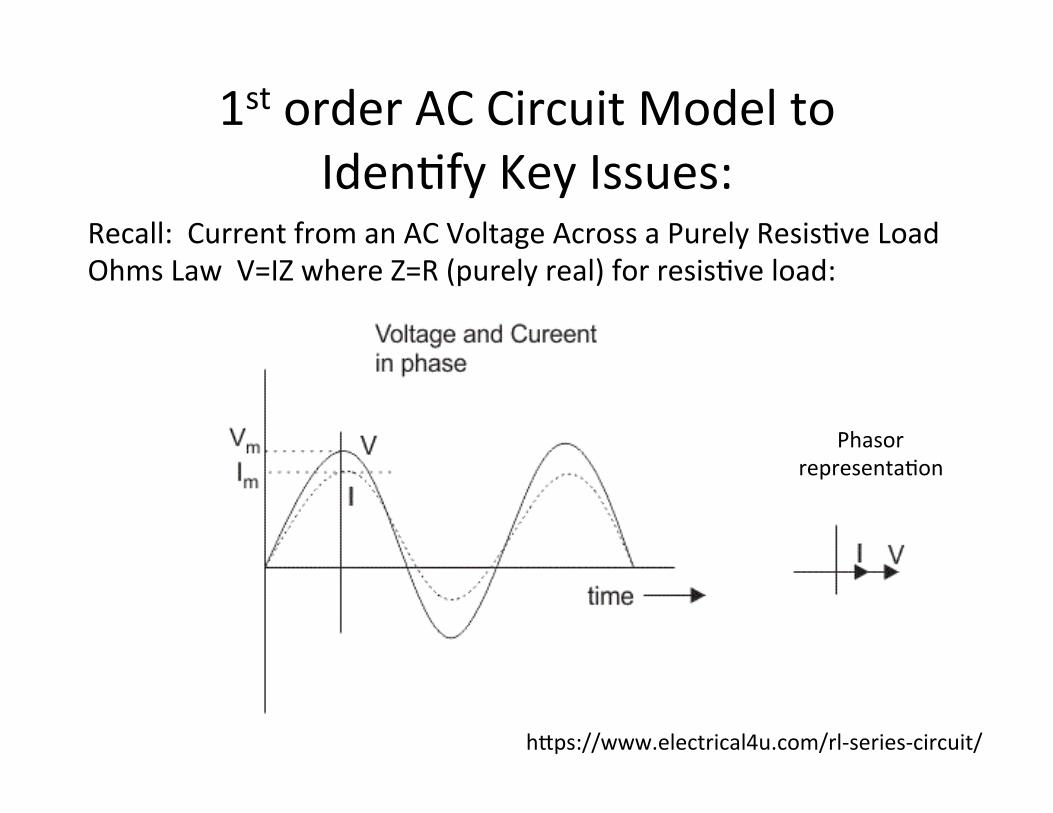
1st order AC Circuit Model to Iden.fy Key Issues:
Recall: Current from an AC Voltage Across a Purely Resis.ve Load Ohms Law V=IZ where Z=R (purely real) for resis.ve load:
Phasor representa.on
heps://www.electrical4u.com/rl-‐series-‐circuit/
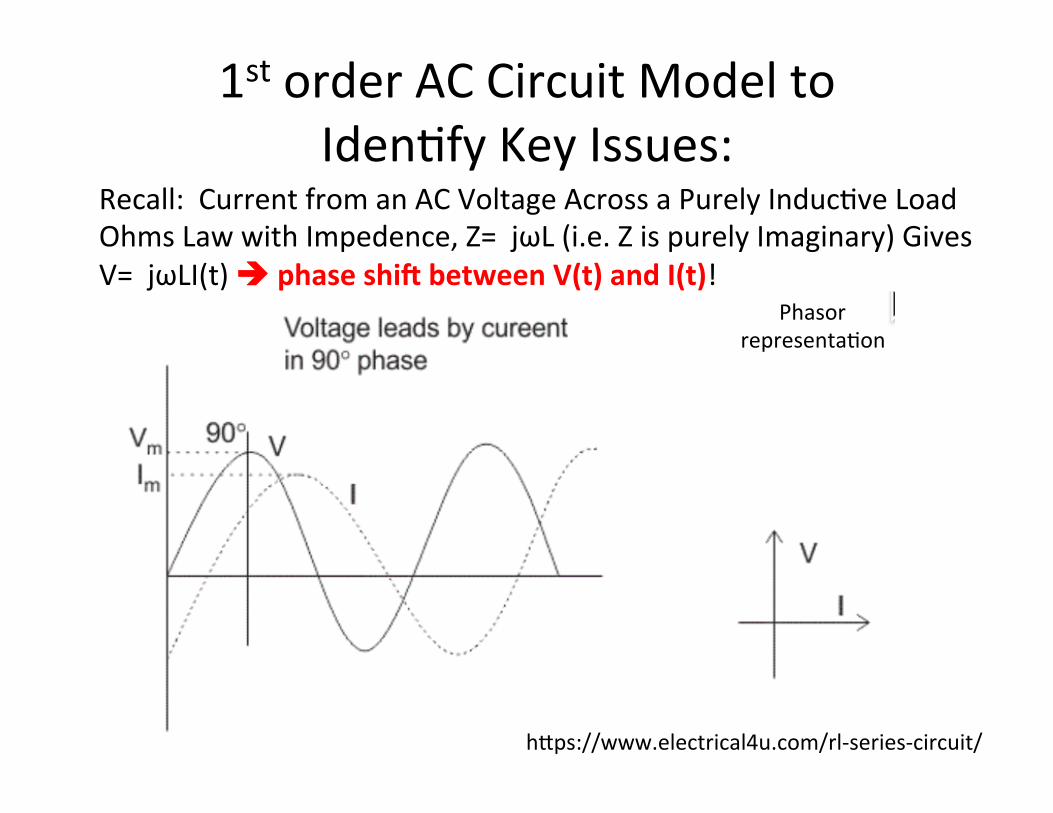
1st order AC Circuit Model to Iden.fy Key Issues:
Recall: Current from an AC Voltage Across a Purely Induc.ve Load Ohms Law with Impedence, Z= jωL (i.e. Z is purely Imaginary) Gives V= jωLI(t) è phase shiB between V(t) and I(t)! Phasor
representa.on
heps://www.electrical4u.com/rl-‐series-‐circuit/
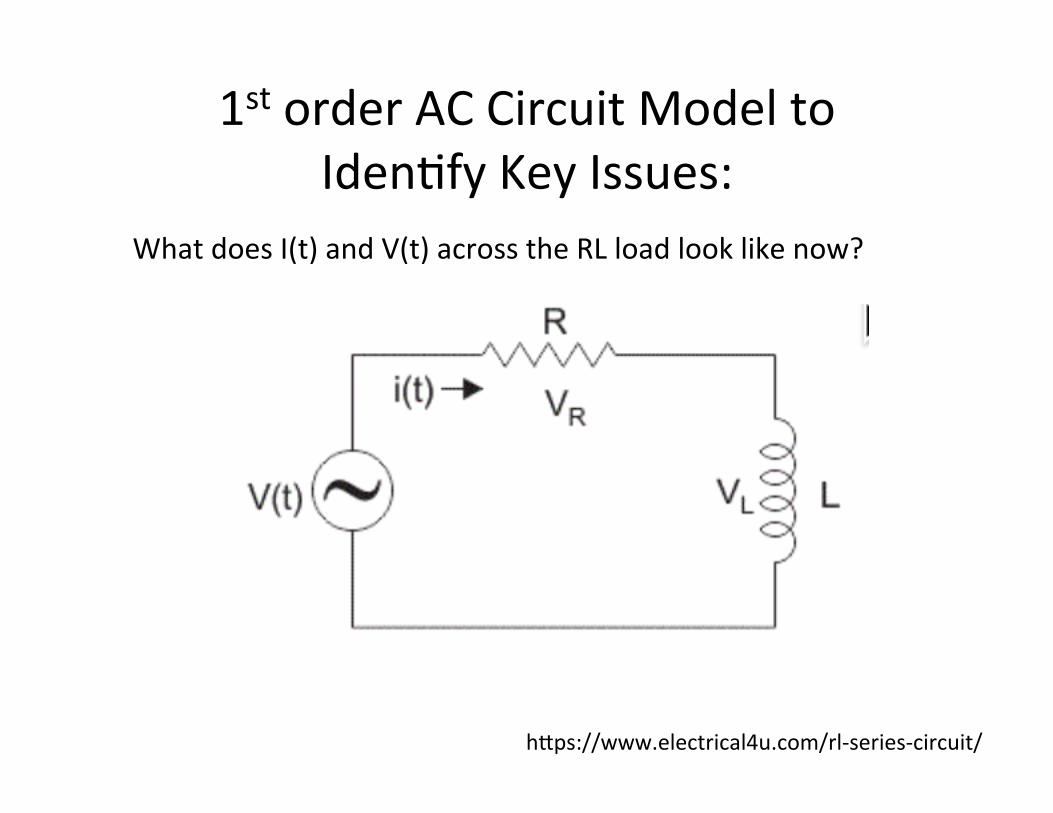
1st order AC Circuit Model to Iden.fy Key Issues:
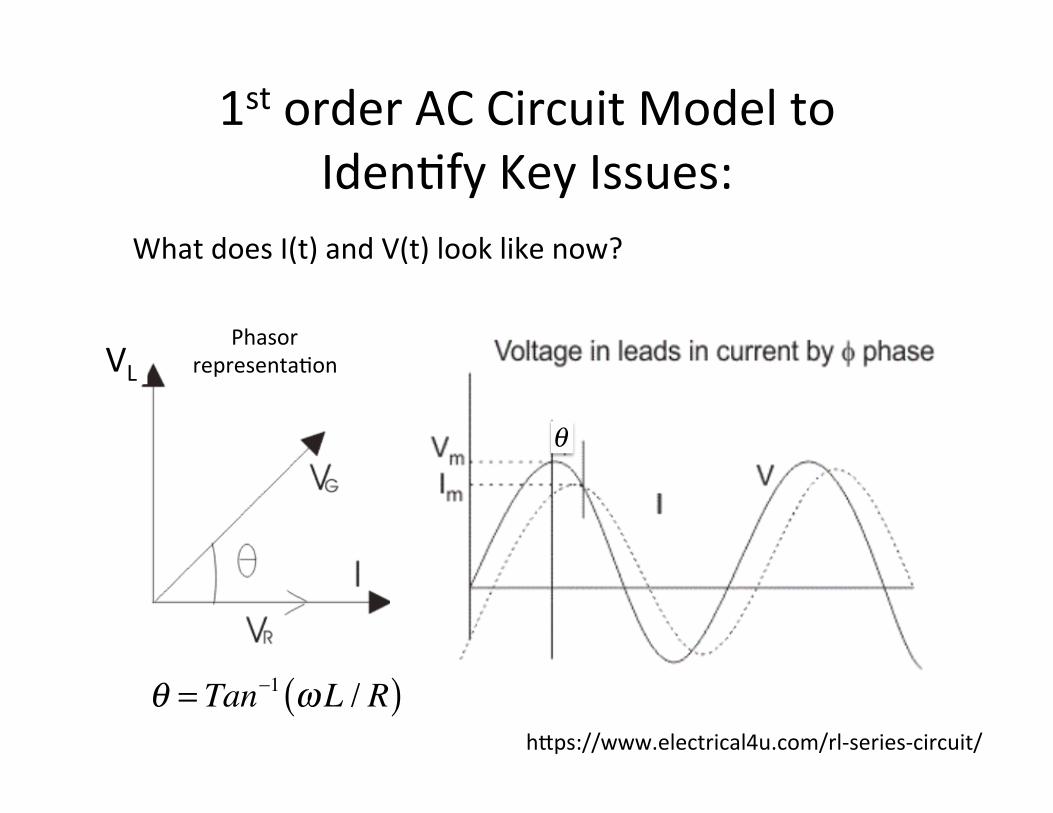
What does I(t) and V(t) across the RL load look like now?
heps://www.electrical4u.com/rl-‐series-‐circuit/
1st order AC Circuit Model to Iden.fy Key Issues:
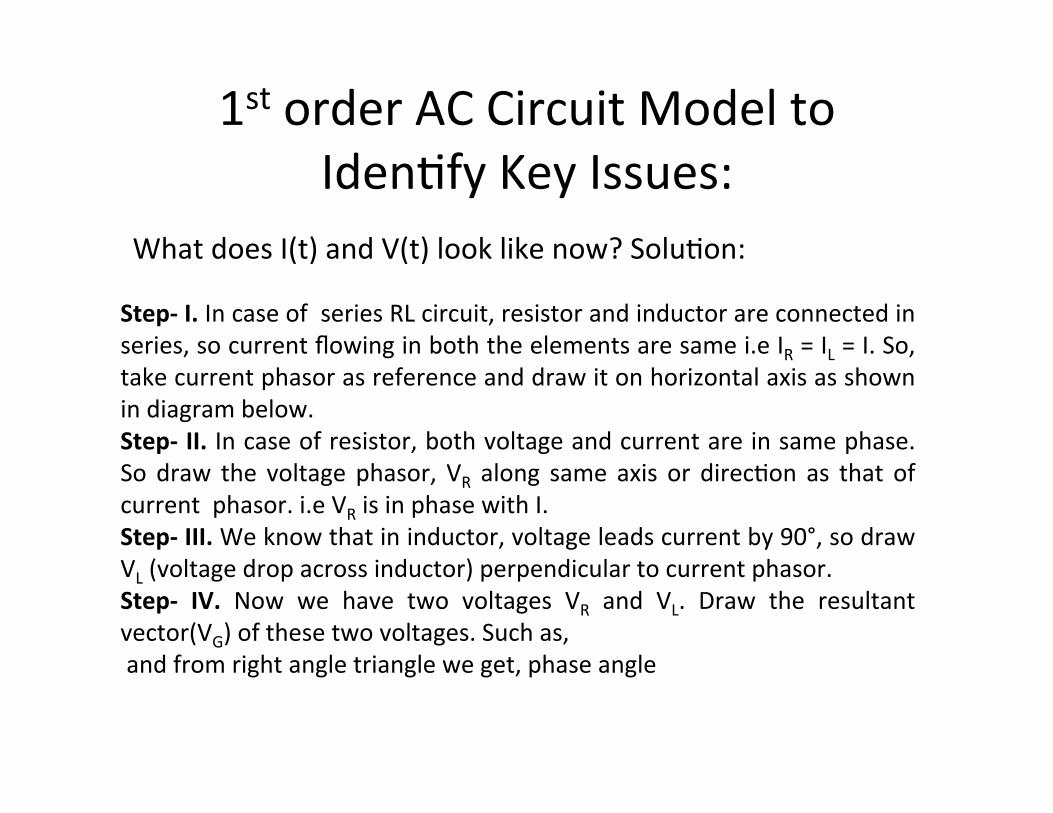
What does I(t) and V(t) look like now? Solu.on:
Step-‐ I. In case of series RL circuit, resistor and inductor are connected in series, so current flowing in both the elements are same i.e IR = IL = I. So, take current phasor as reference and draw it on horizontal axis as shown in diagram below. Step-‐ II. In case of resistor, both voltage and current are in same phase. So draw the voltage phasor, VR along same axis or direc.on as that of current phasor. i.e VR is in phase with I. Step-‐ III. We know that in inductor, voltage leads current by 90°, so draw VL (voltage drop across inductor) perpendicular to current phasor. Step-‐ IV. Now we have two voltages VR and VL. Draw the resultant vector(VG) of these two voltages. Such as, and from right angle triangle we get, phase angle
1st order AC Circuit Model to Iden.fy Key Issues:
What does I(t) and V(t) look like now?
VL Phasor
representa.on
θ = Tan−1 ωL / R( )
θ
heps://www.electrical4u.com/rl-‐series-‐circuit/
1st order AC Circuit Model to Iden.fy Key Issues:
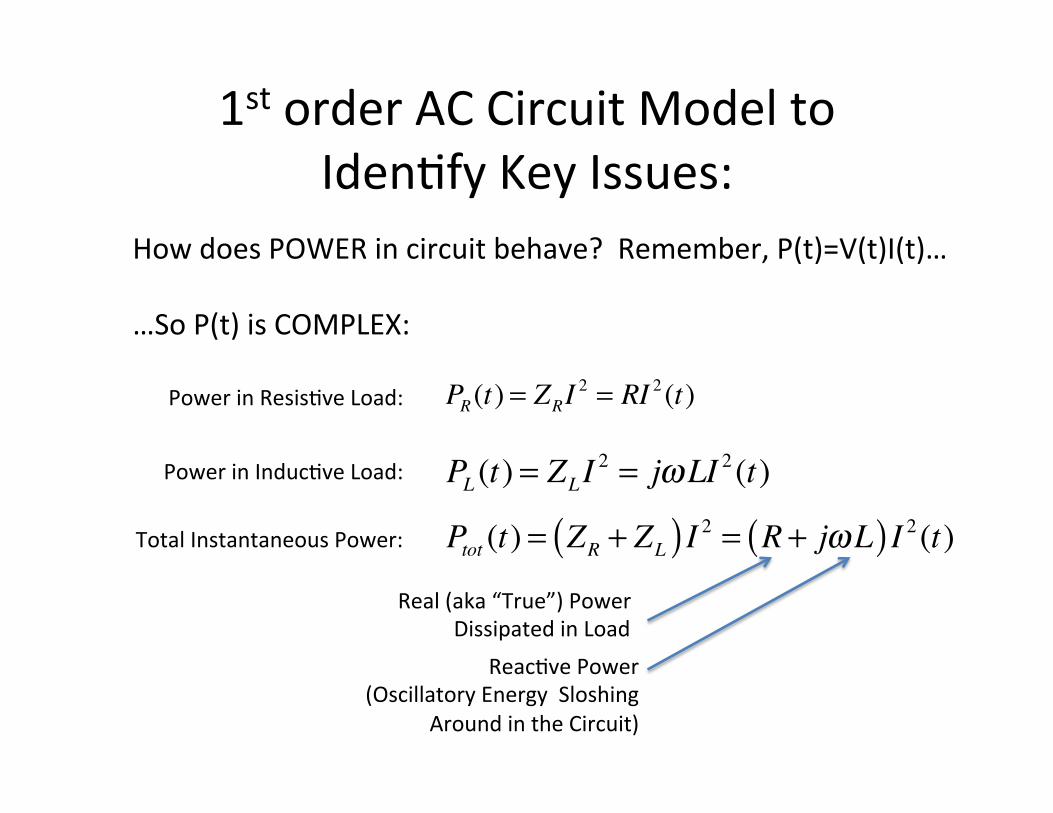
How does POWER in circuit behave? Remember, P(t)=V(t)I(t)… …So P(t) is COMPLEX:
Power in Resis.ve Load:
Power in Induc.ve Load:
Total Instantaneous Power:
PR(t) = ZRI2 = RI 2 (t)
PL (t) = ZLI2 = jωLI 2 (t)
Ptot (t) = ZR + ZL( ) I 2 = R + jωL( ) I 2 (t)Real (aka “True”) Power
Dissipated in Load Reac.ve Power
(Oscillatory Energy Sloshing Around in the Circuit)
1st order AC Circuit Model to Iden.fy Key Issues:
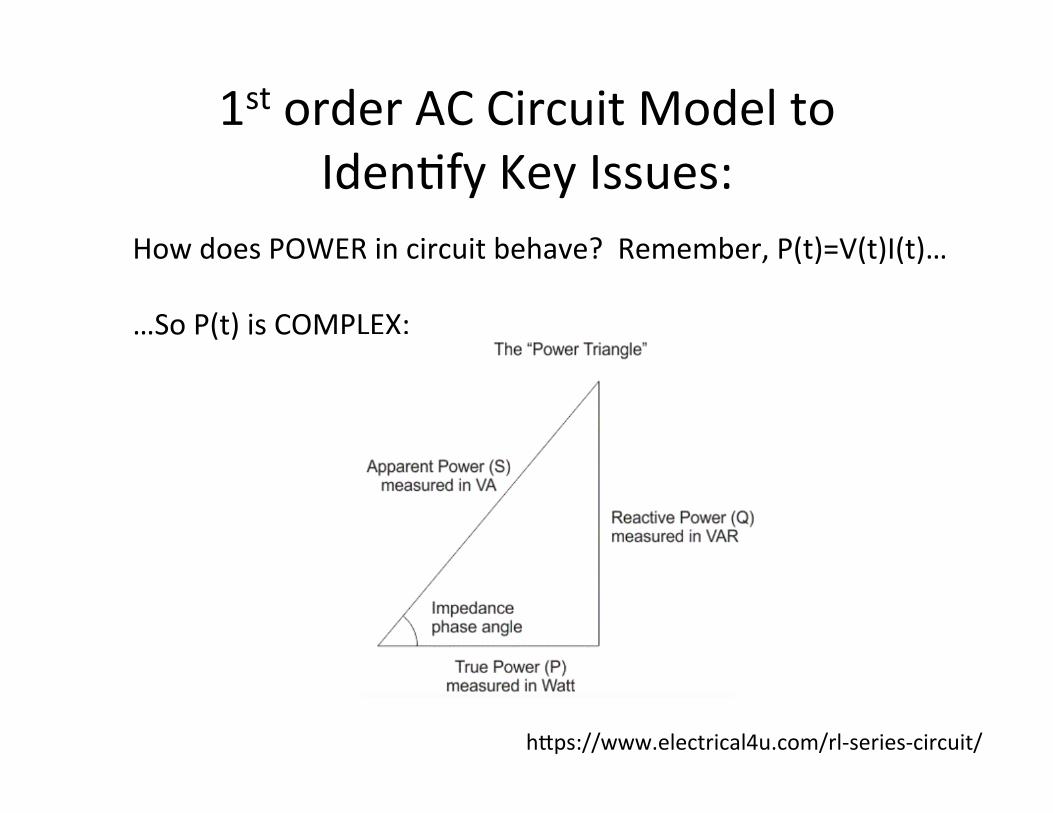
How does POWER in circuit behave? Remember, P(t)=V(t)I(t)… …So P(t) is COMPLEX:
heps://www.electrical4u.com/rl-‐series-‐circuit/
1st order AC Circuit Model to Iden.fy Key Issues:
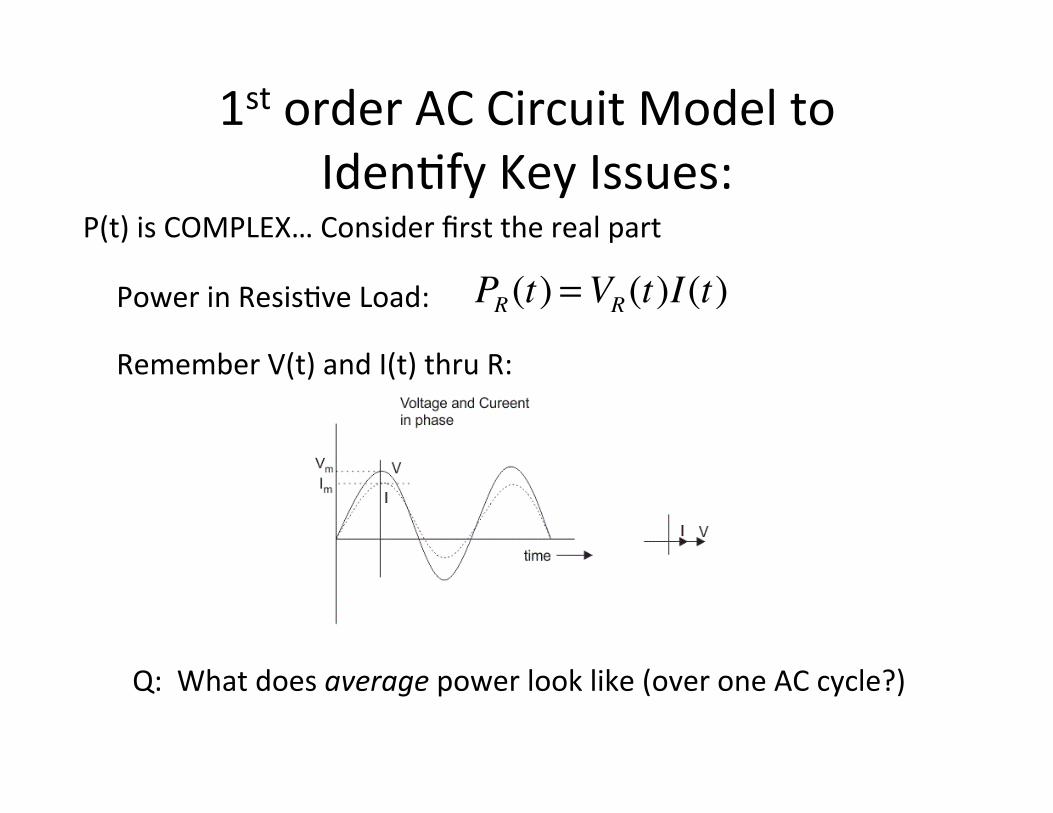
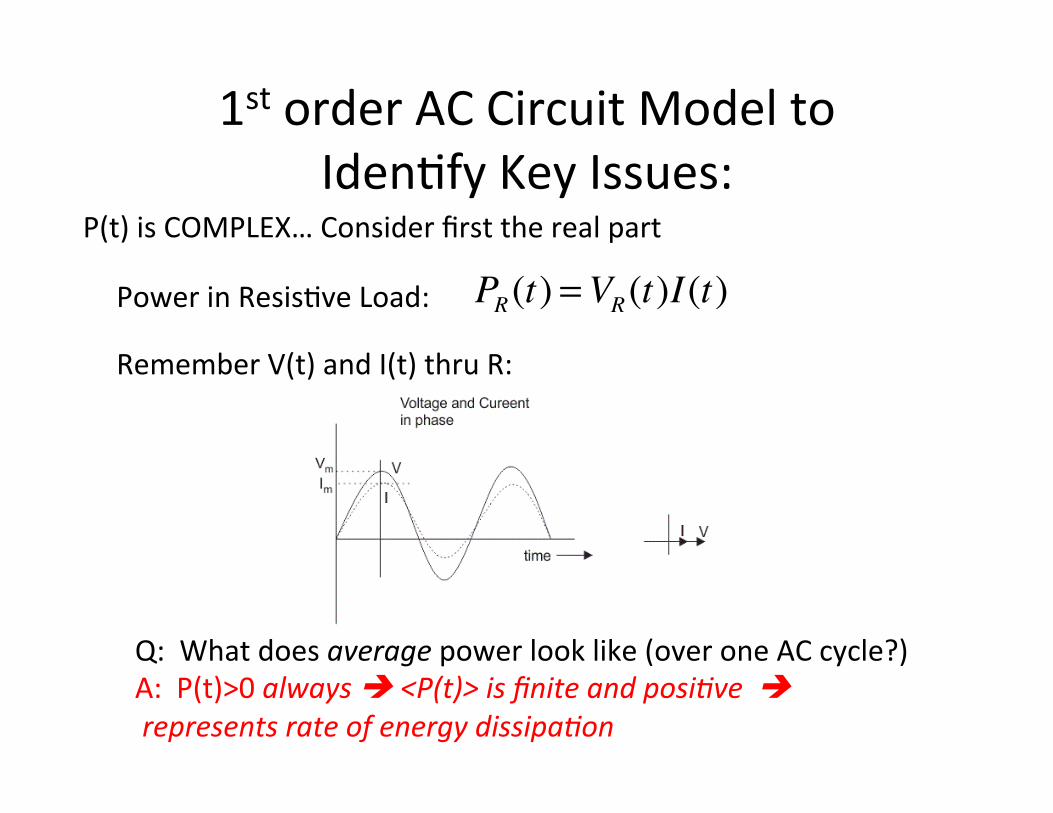
P(t) is COMPLEX… Consider first the real part
Power in Resis.ve Load:
Remember V(t) and I(t) thru R:
Q: What does average power look like (over one AC cycle?)
PR(t) =VR(t)I(t)
1st order AC Circuit Model to Iden.fy Key Issues:
P(t) is COMPLEX… Consider first the real part
Power in Resis.ve Load:
Remember V(t) and I(t) thru R:
Q: What does average power look like (over one AC cycle?) A: P(t)>0 always è <P(t)> is finite and posi7ve è represents rate of energy dissipa7on
PR(t) =VR(t)I(t)
1st order AC Circuit Model to Iden.fy Key Issues:
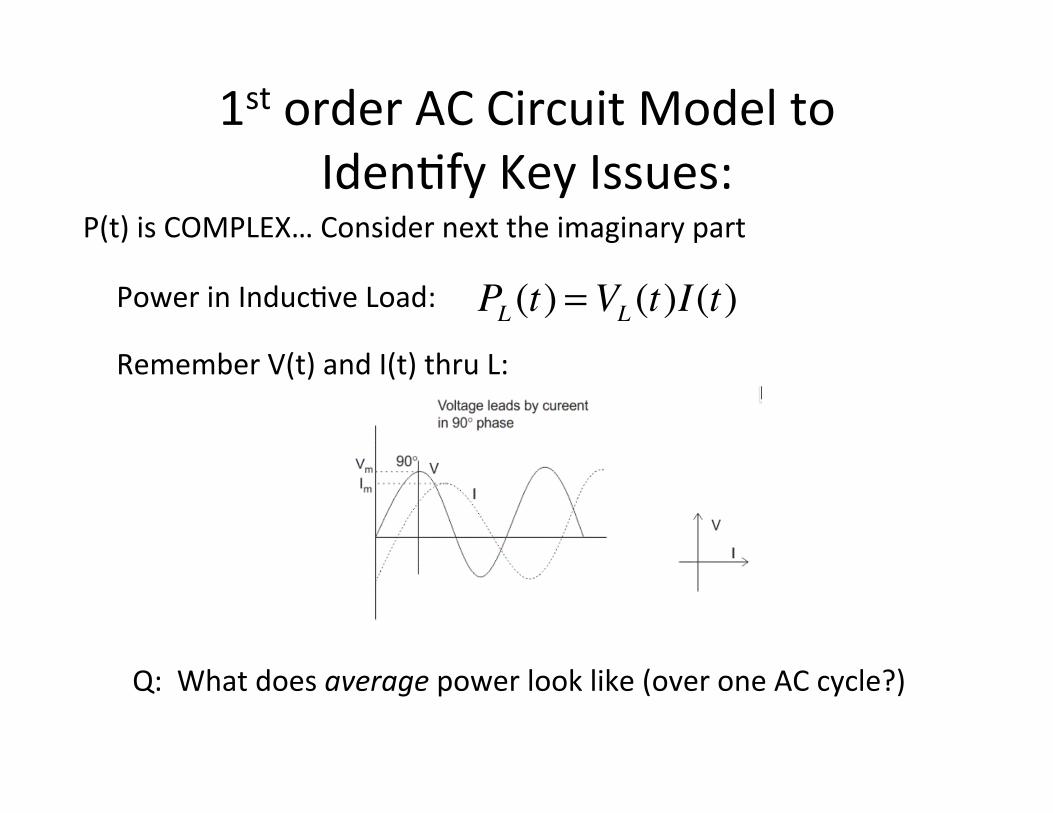
P(t) is COMPLEX… Consider next the imaginary part
Power in Induc.ve Load:
Remember V(t) and I(t) thru L:
Q: What does average power look like (over one AC cycle?)
PL (t) =VL (t)I(t)
1st order AC Circuit Model to Iden.fy Key Issues:
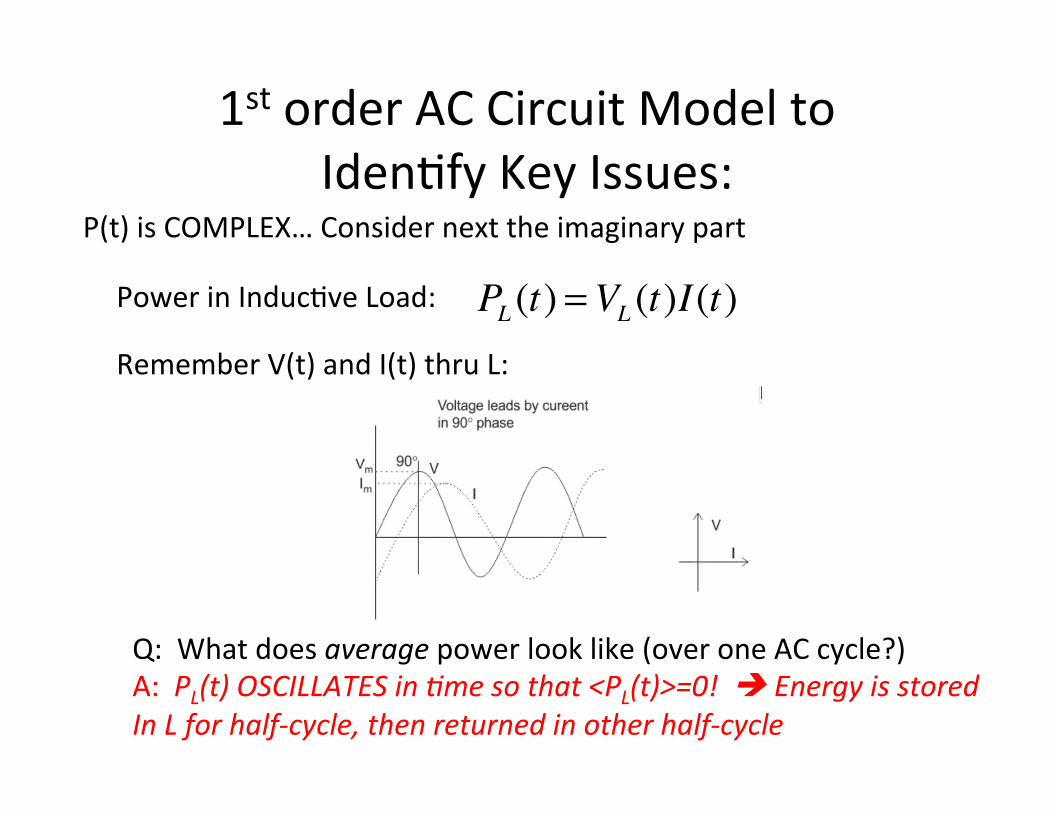
P(t) is COMPLEX… Consider next the imaginary part
Power in Induc.ve Load:
Remember V(t) and I(t) thru L:
Q: What does average power look like (over one AC cycle?) A: PL(t) OSCILLATES in 7me so that <PL(t)>=0! è Energy is stored In L for half-‐cycle, then returned in other half-‐cycle
PL (t) =VL (t)I(t)
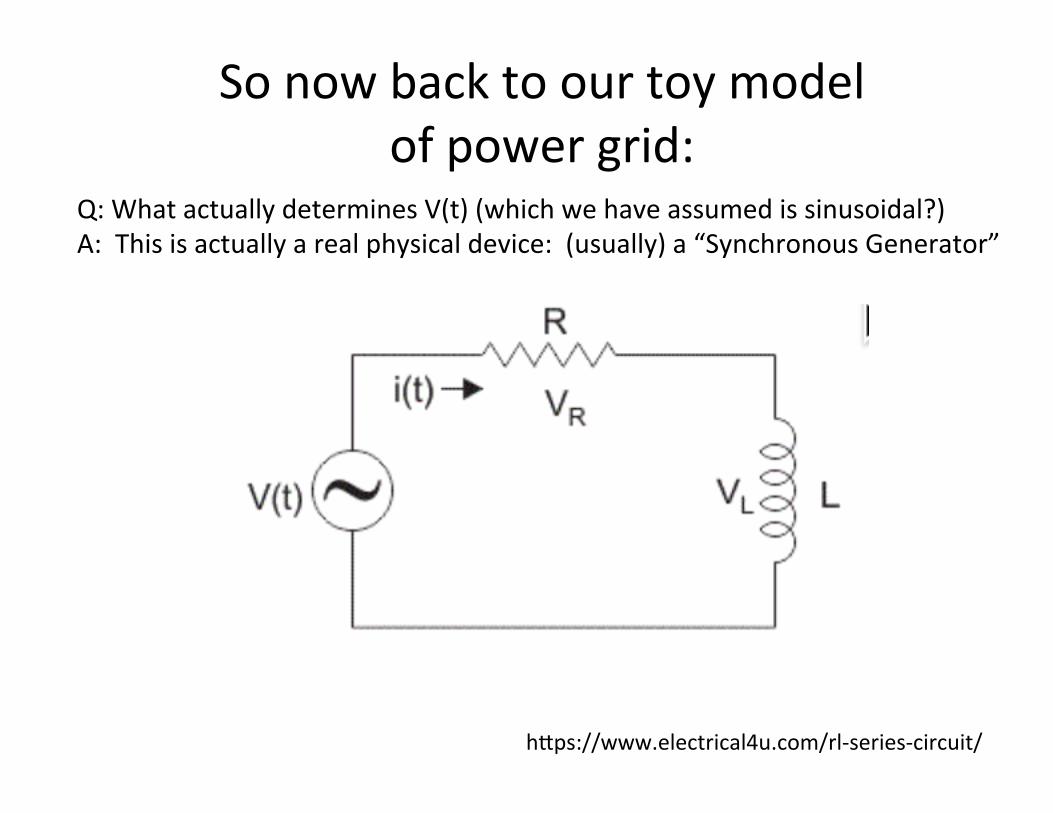
So now back to our toy model of power grid:
Q: What actually determines V(t) (which we have assumed is sinusoidal?) A: This is actually a real physical device: (usually) a “Synchronous Generator”
heps://www.electrical4u.com/rl-‐series-‐circuit/
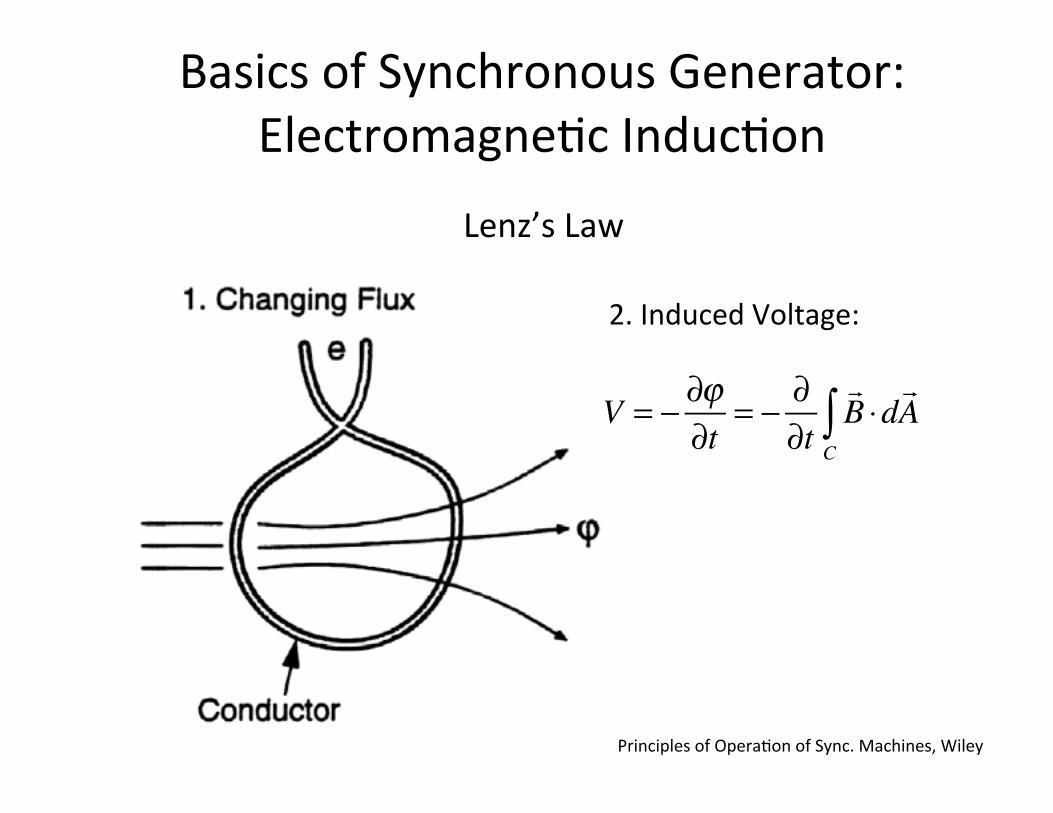
Basics of Synchronous Generator: Electromagne.c Induc.on
Lenz’s Law
V = − ∂ϕ
∂t= − ∂
∂t!B ⋅d!A
C∫
2. Induced Voltage:
Principles of Opera.on of Sync. Machines, Wiley
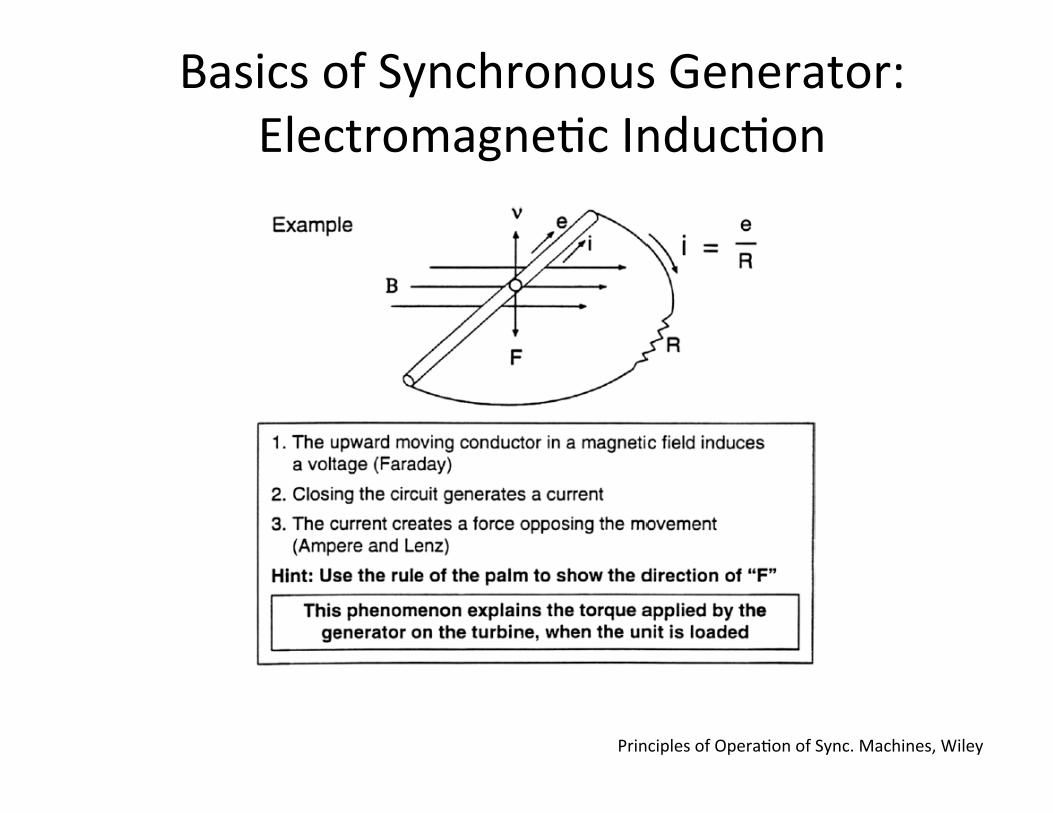
Basics of Synchronous Generator: Electromagne.c Induc.on
Principles of Opera.on of Sync. Machines, Wiley
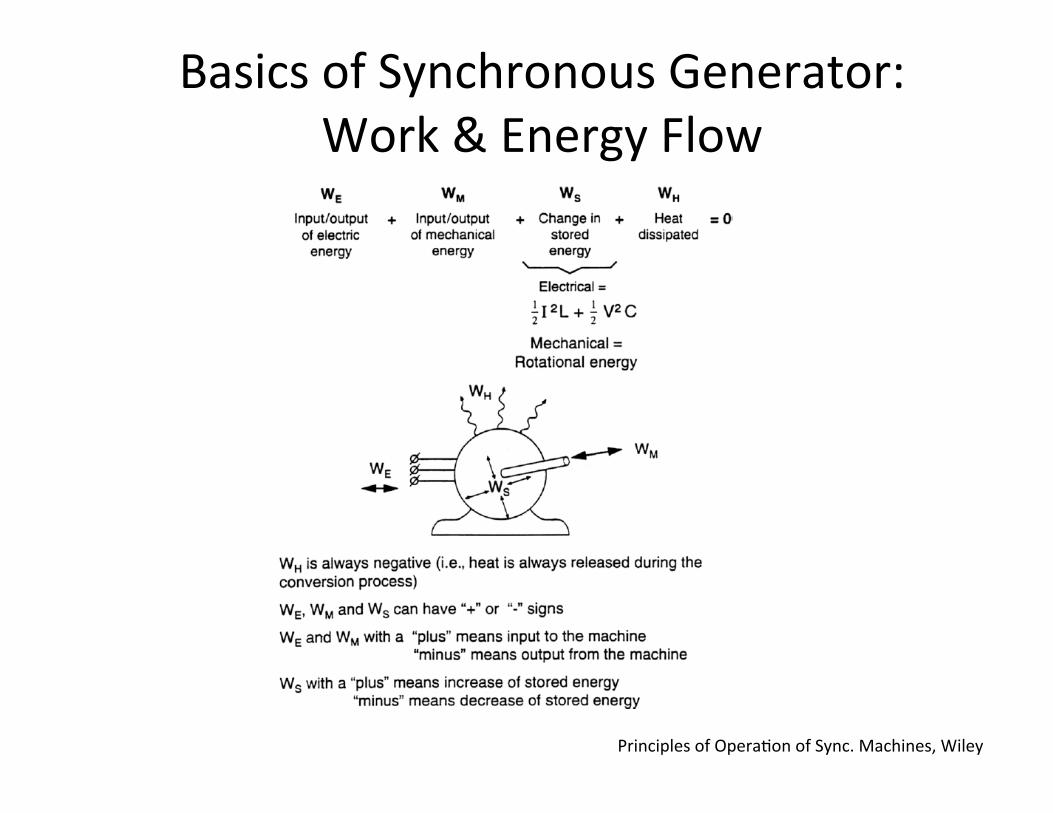
Basics of Synchronous Generator: Work & Energy Flow
Principles of Opera.on of Sync. Machines, Wiley
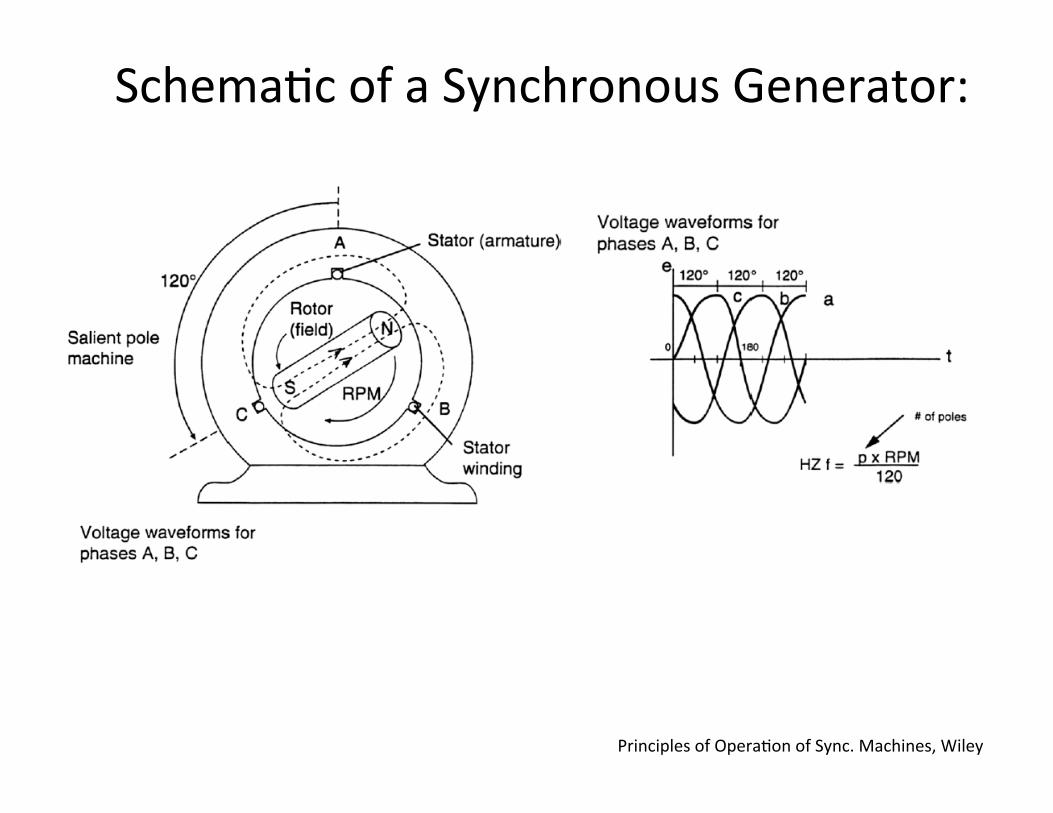
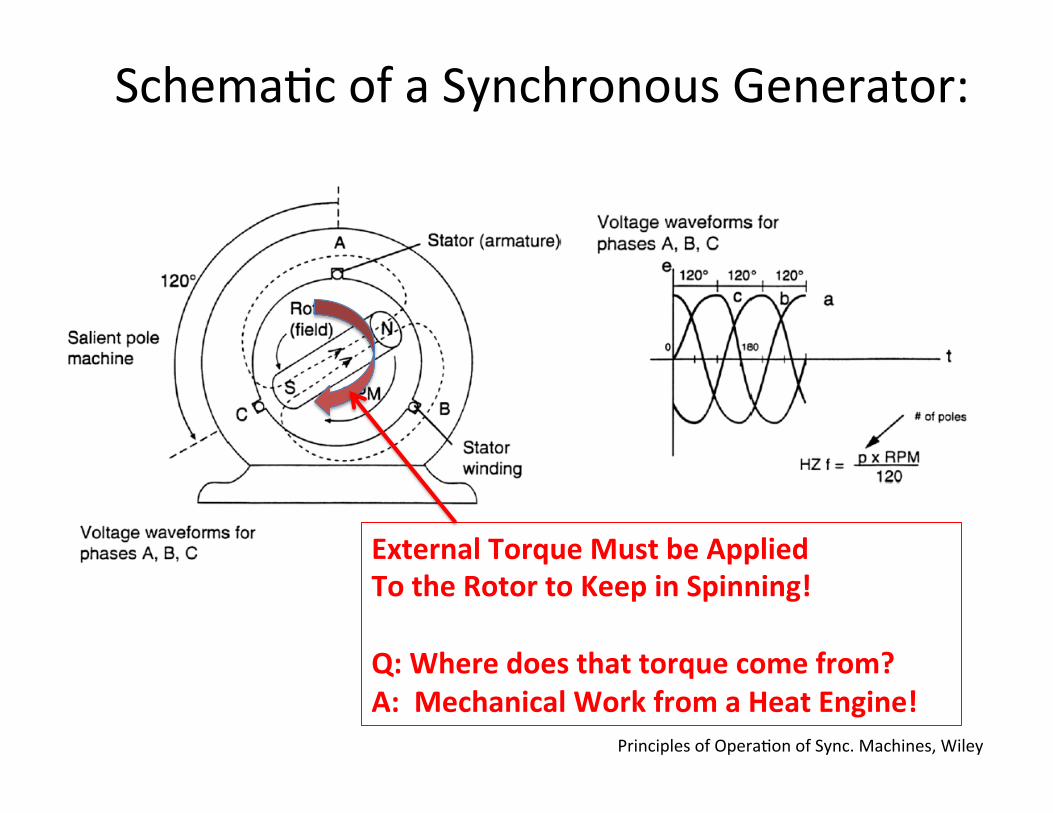
Schema.c of a Synchronous Generator:
Principles of Opera.on of Sync. Machines, Wiley
Schema.c of a Synchronous Generator:
Principles of Opera.on of Sync. Machines, Wiley
External Torque Must be Applied To the Rotor to Keep in Spinning! Q: Where does that torque come from? A: Mechanical Work from a Heat Engine!
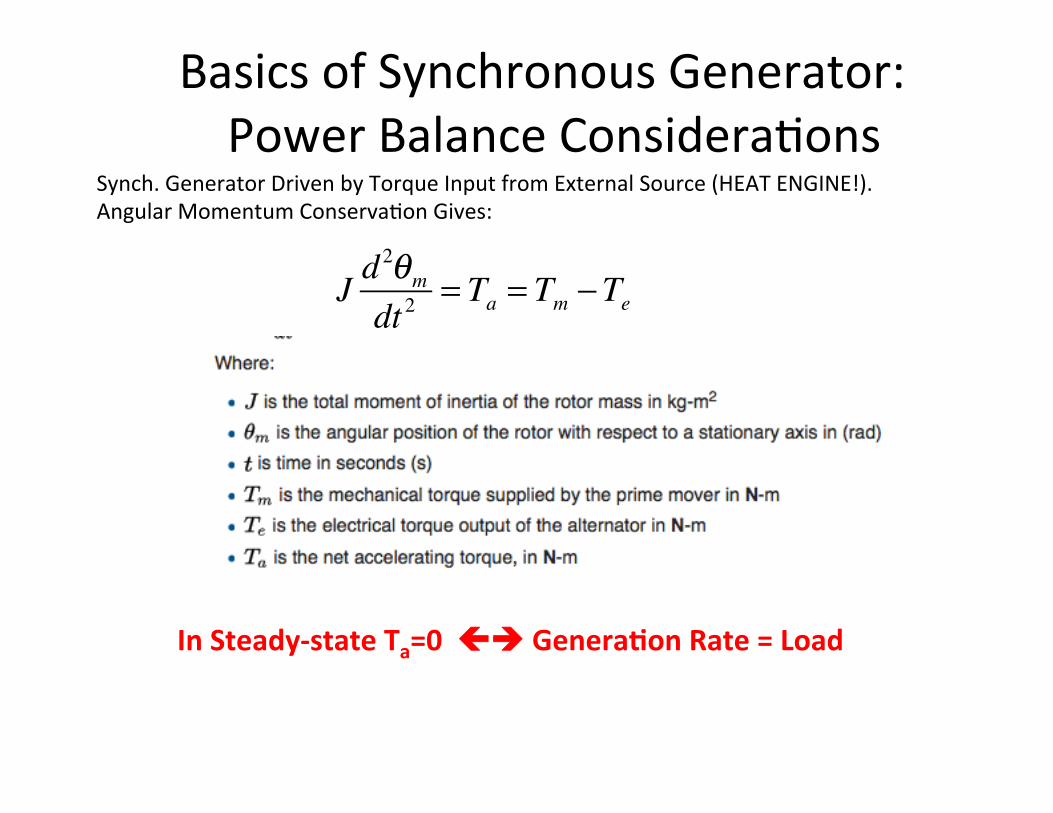
Basics of Synchronous Generator: Power Balance Considera.ons
Synch. Generator Driven by Torque Input from External Source (HEAT ENGINE!). Angular Momentum Conserva.on Gives:
J d2θm
dt 2= Ta = Tm −Te
In Steady-‐state Ta=0 çè Genera@on Rate = Load
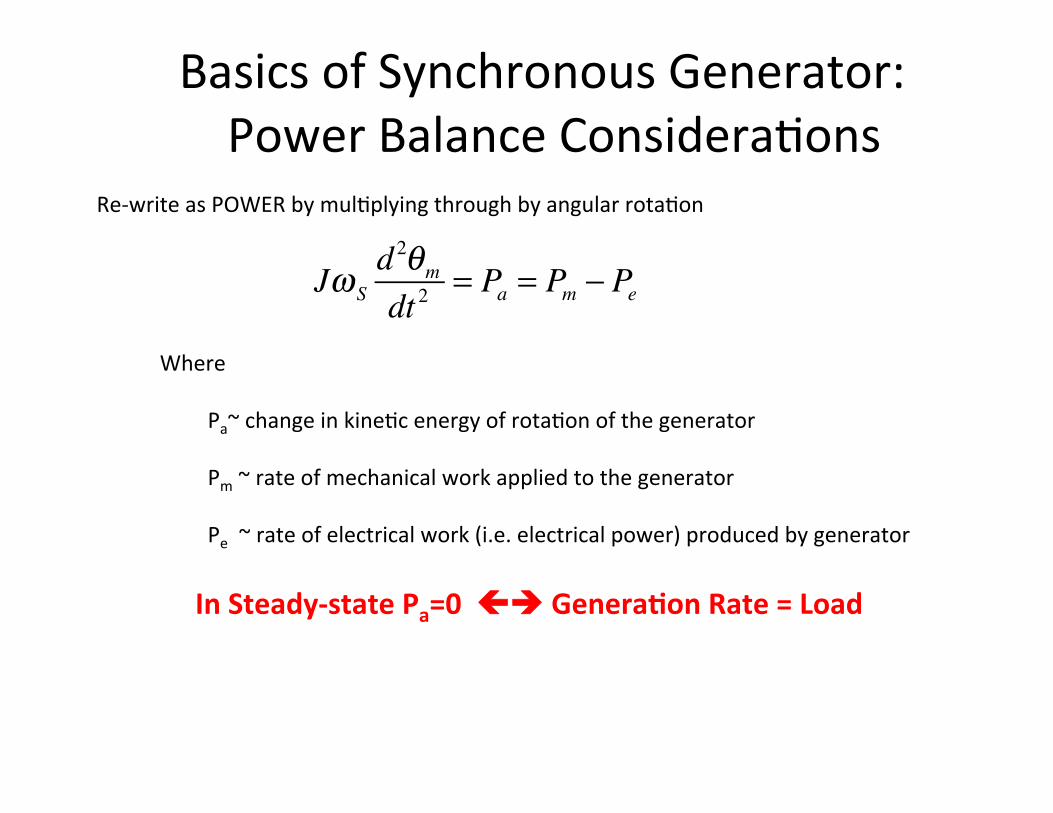
Basics of Synchronous Generator: Power Balance Considera.ons
Re-‐write as POWER by mul.plying through by angular rota.on
In Steady-‐state Pa=0 çè Genera@on Rate = Load
Jω Sd 2θm
dt 2= Pa = Pm − Pe
Where
Pa~ change in kine.c energy of rota.on of the generator
Pm ~ rate of mechanical work applied to the generator
Pe ~ rate of electrical work (i.e. electrical power) produced by generator
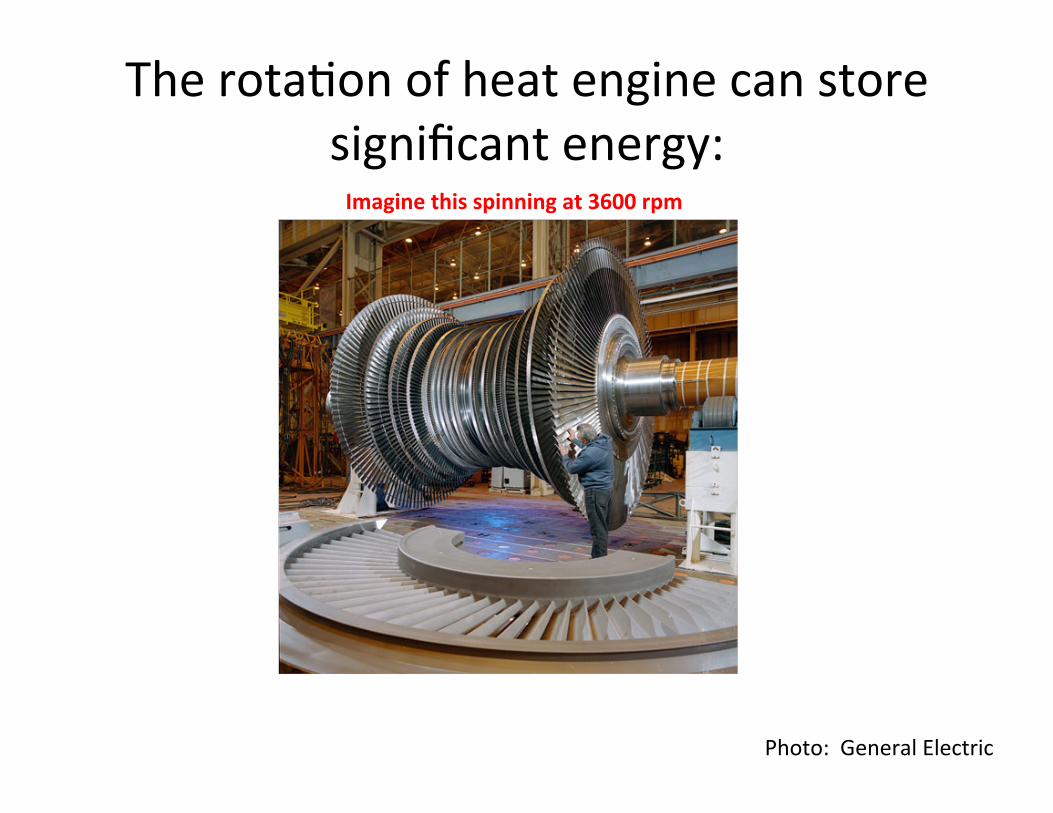
The rota.on of heat engine can store significant energy:
Photo: General Electric
Imagine this spinning at 3600 rpm
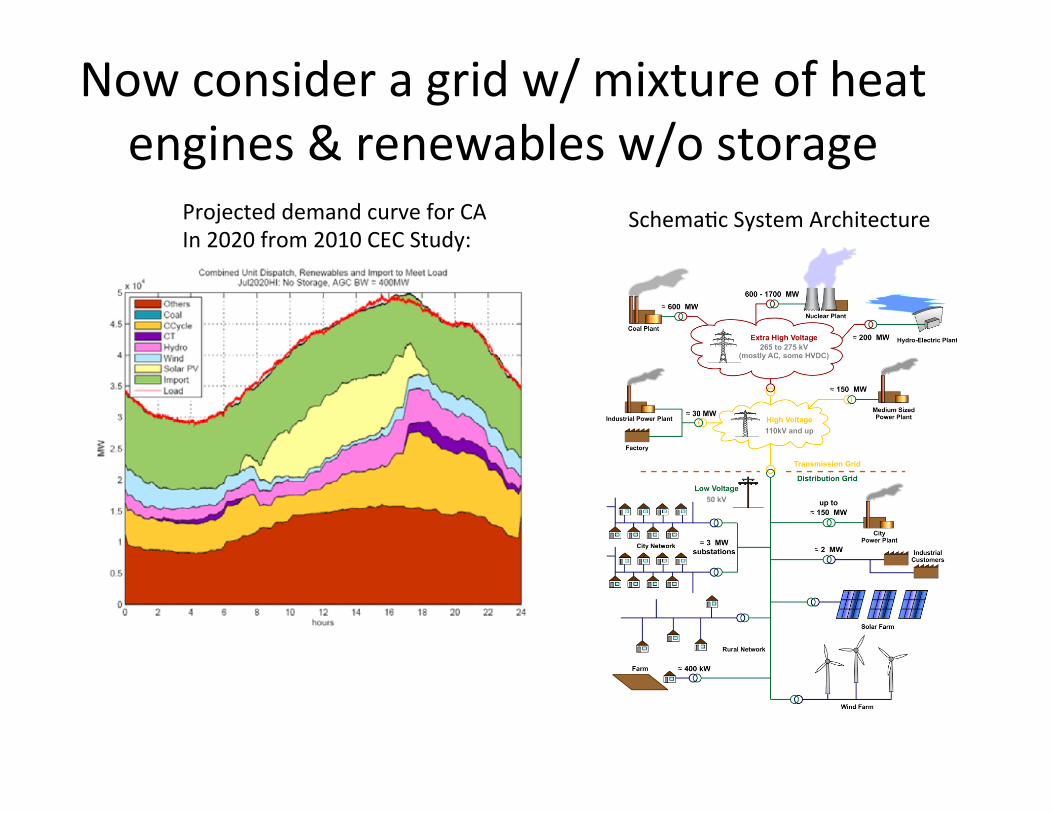
Now consider a grid w/ mixture of heat engines & renewables w/o storage
Projected demand curve for CA In 2020 from 2010 CEC Study:
Schema.c System Architecture
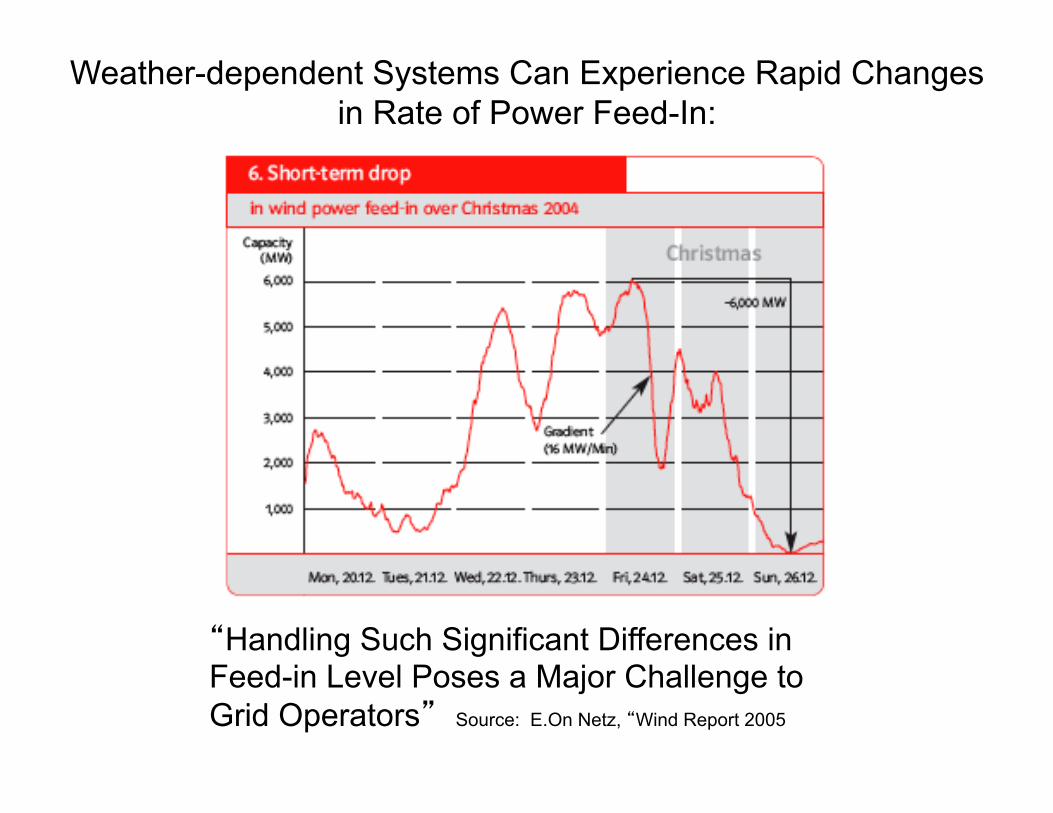
Weather-dependent Systems Can Experience Rapid Changes in Rate of Power Feed-In:
“Handling Such Significant Differences in Feed-in Level Poses a Major Challenge to Grid Operators” Source: E.On Netz, “Wind Report 2005
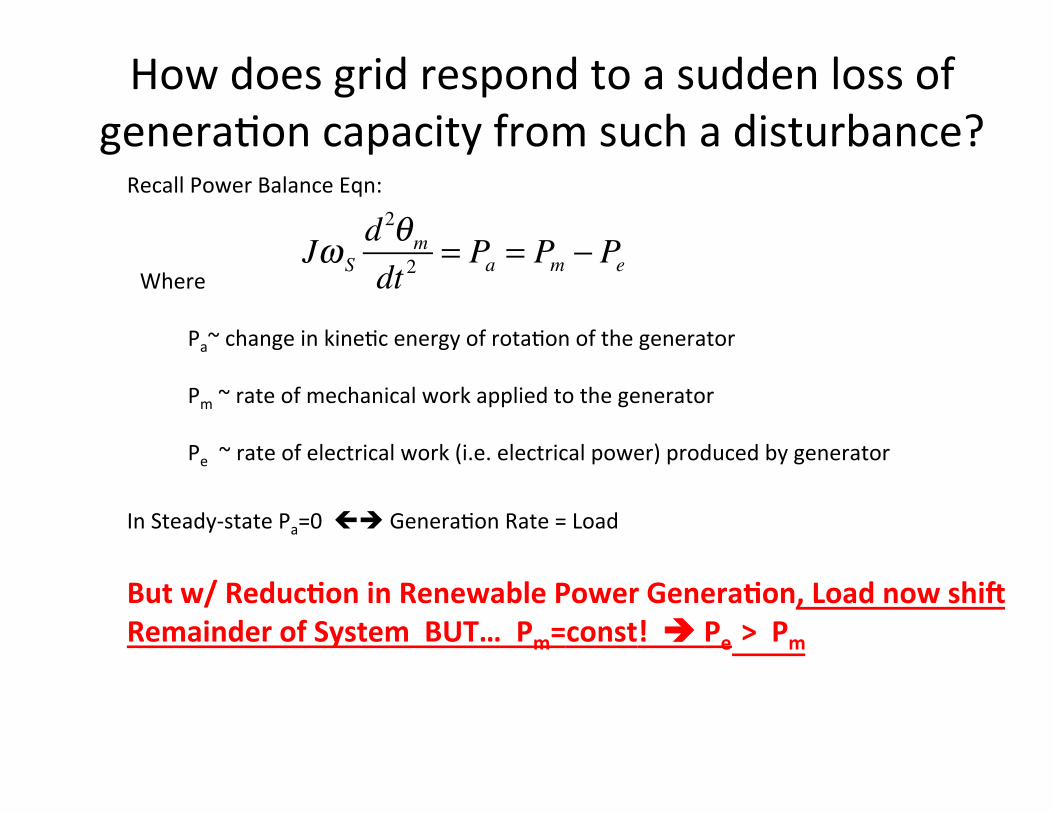
How does grid respond to a sudden loss of genera.on capacity from such a disturbance?
Recall Power Balance Eqn:
In Steady-‐state Pa=0 çè Genera.on Rate = Load But w/ Reduc@on in Renewable Power Genera@on, Load now shiBs to Remainder of System BUT… Pm=const! è Pe > Pm
Jω Sd 2θm
dt 2= Pa = Pm − Pe
Where
Pa~ change in kine.c energy of rota.on of the generator
Pm ~ rate of mechanical work applied to the generator
Pe ~ rate of electrical work (i.e. electrical power) produced by generator
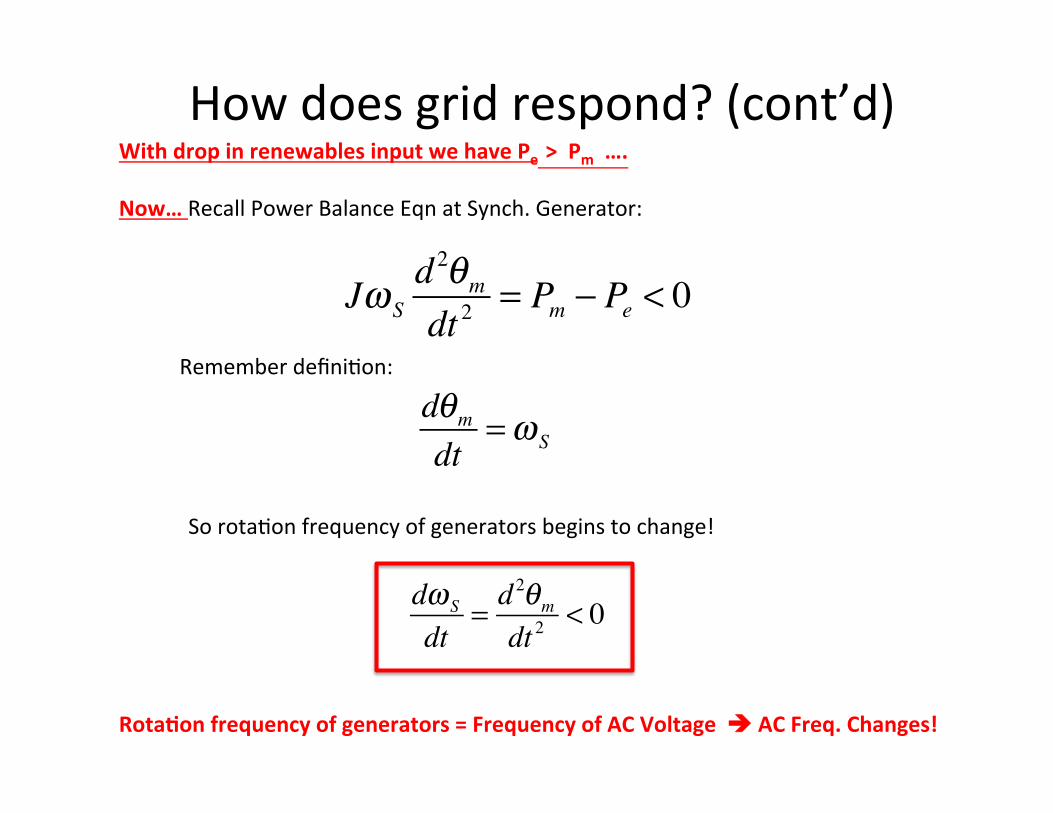
How does grid respond? (cont’d) With drop in renewables input we have Pe > Pm …. Now… Recall Power Balance Eqn at Synch. Generator:
Jω Sd 2θm
dt 2= Pm − Pe < 0
dθm
dt=ω S
Remember defini.on:
So rota.on frequency of generators begins to change!
dω S
dt= d
2θm
dt 2< 0
Rota@on frequency of generators = Frequency of AC Voltage è AC Freq. Changes!
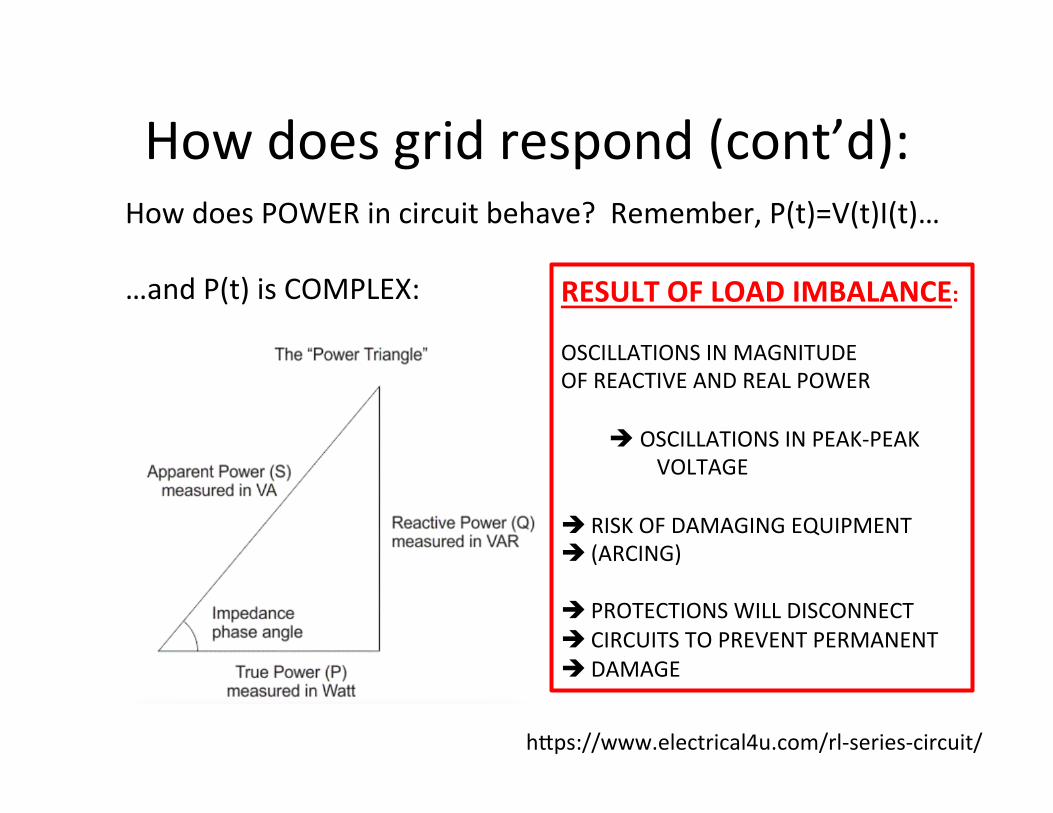
How does grid respond (cont’d): How does POWER in circuit behave? Remember, P(t)=V(t)I(t)… …and P(t) is COMPLEX:
heps://www.electrical4u.com/rl-‐series-‐circuit/
RESULT OF LOAD IMBALANCE: OSCILLATIONS IN MAGNITUDE OF REACTIVE AND REAL POWER
è OSCILLATIONS IN PEAK-‐PEAK VOLTAGE
è RISK OF DAMAGING EQUIPMENT è (ARCING)
è PROTECTIONS WILL DISCONNECT è CIRCUITS TO PREVENT PERMANENT è DAMAGE

Illustra.on of this…
hep://www.news.com.au/technology/environment/aemos-‐third-‐report-‐highlights-‐wind-‐power-‐link-‐to-‐south-‐australia-‐blackout/news-‐story/2bbf105bc613f70966659465043633b0
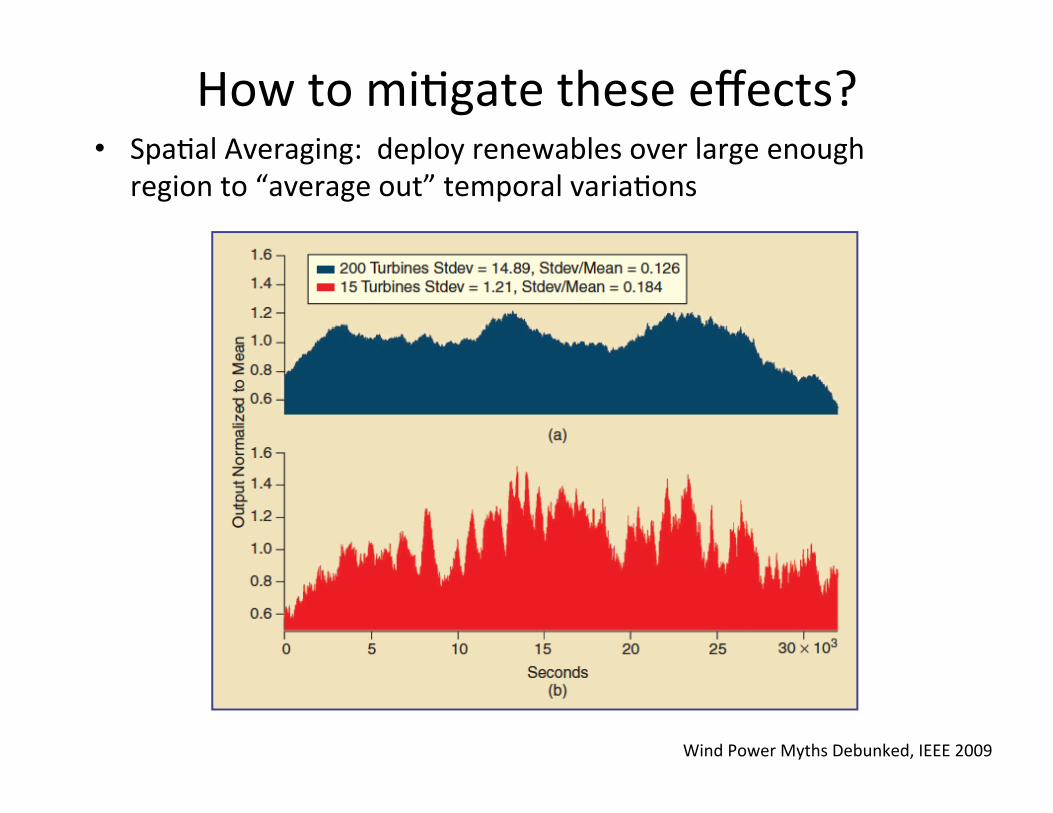
How to mi.gate these effects? • Spa.al Averaging: deploy renewables over large enough
region to “average out” temporal varia.ons
Wind Power Myths Debunked, IEEE 2009
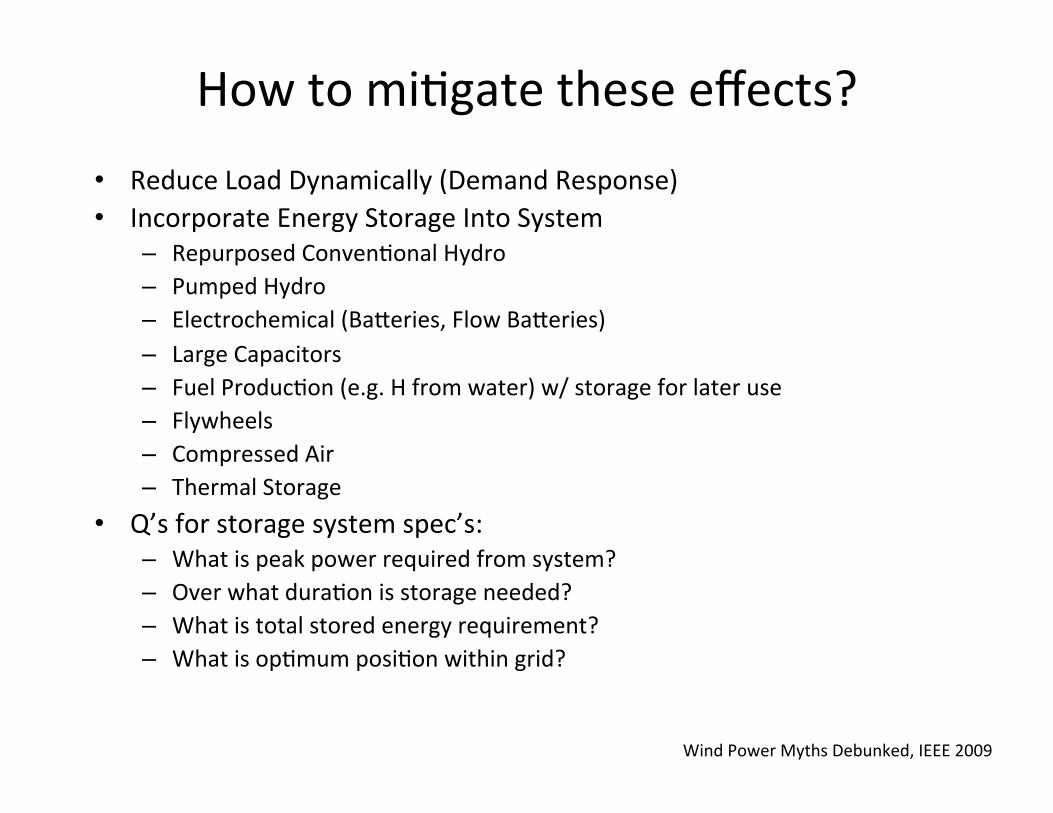
How to mi.gate these effects? • Reduce Load Dynamically (Demand Response) • Incorporate Energy Storage Into System
– Repurposed Conven.onal Hydro – Pumped Hydro – Electrochemical (Baeeries, Flow Baeeries) – Large Capacitors – Fuel Produc.on (e.g. H from water) w/ storage for later use – Flywheels – Compressed Air – Thermal Storage
• Q’s for storage system spec’s: – What is peak power required from system? – Over what dura.on is storage needed? – What is total stored energy requirement? – What is op.mum posi.on within grid?
Wind Power Myths Debunked, IEEE 2009
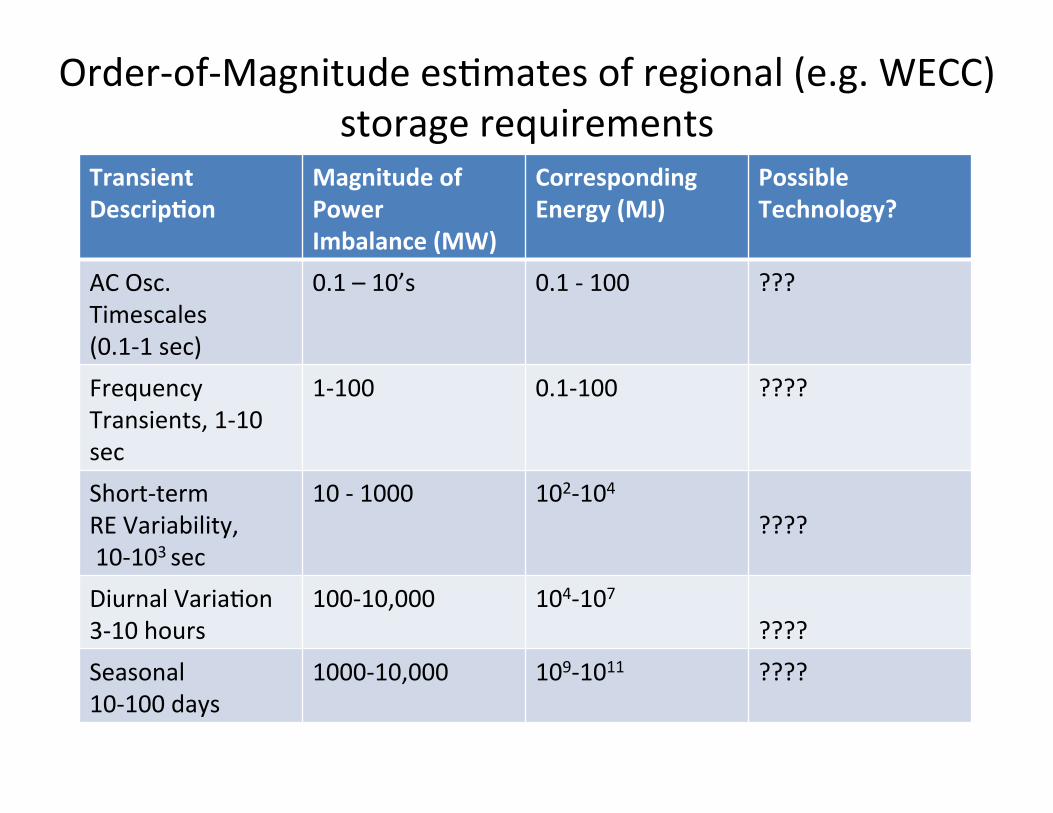
Order-‐of-‐Magnitude es.mates of regional (e.g. WECC) storage requirements
Transient Descrip@on
Magnitude of Power Imbalance (MW)
Corresponding Energy (MJ)
Possible Technology?
AC Osc. Timescales (0.1-‐1 sec)
0.1 – 10’s 0.1 -‐ 100 ???
Frequency Transients, 1-‐10 sec
1-‐100 0.1-‐100 ????
Short-‐term RE Variability, 10-‐103 sec
10 -‐ 1000 102-‐104 ????
Diurnal Varia.on 3-‐10 hours
100-‐10,000 104-‐107 ????
Seasonal 10-‐100 days
1000-‐10,000 109-‐1011 ????