Embed Size (px)
Citation preview
MODULE 3.
Integrating the value of water and wetlands into
decision-making
Objectives of Module 3� To introduce the Rural Upland Payment for Environmental Service
programme
� To discuss how the ES approach can contribute to the wise use of
wetlands in Southeast Asia
� To present the most important policy tools that can be used to
promote a wise use of wetlands
� To discuss advantages and disadvantages of each of them
� To give some examples to illustrate how the policy tools are used to
improve wetland management
� To practice the use of some of these policy tools
Rewarding the Upland Poor for Environmental Services (RUPES)
http://www.dailymotion.com/video/xeazkw_rupes-mud-to-power_shortfilms#.Ue4rSayE7_M
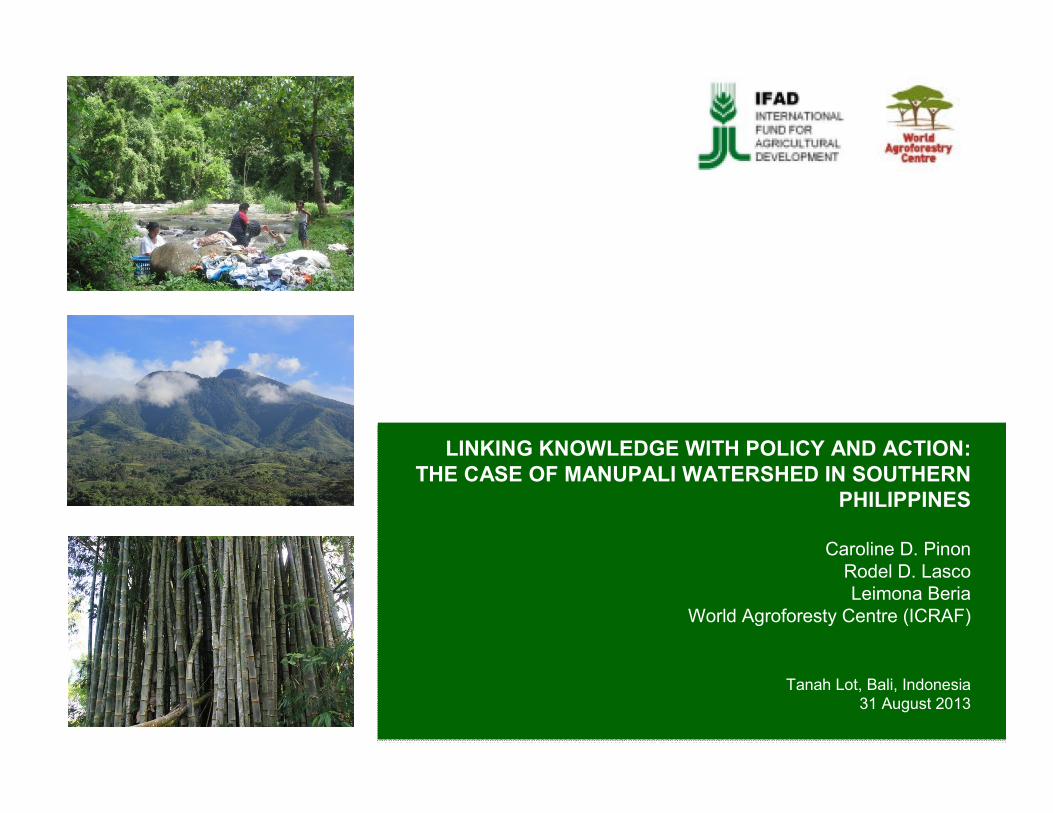
LINKING KNOWLEDGE WITH POLICY AND ACTION:
THE CASE OF MANUPALI WATERSHED IN SOUTHERN
PHILIPPINES
Caroline D. Pinon
Rodel D. Lasco
Leimona Beria
World Agroforesty Centre (ICRAF)
Tanah Lot, Bali, Indonesia
31 August 2013
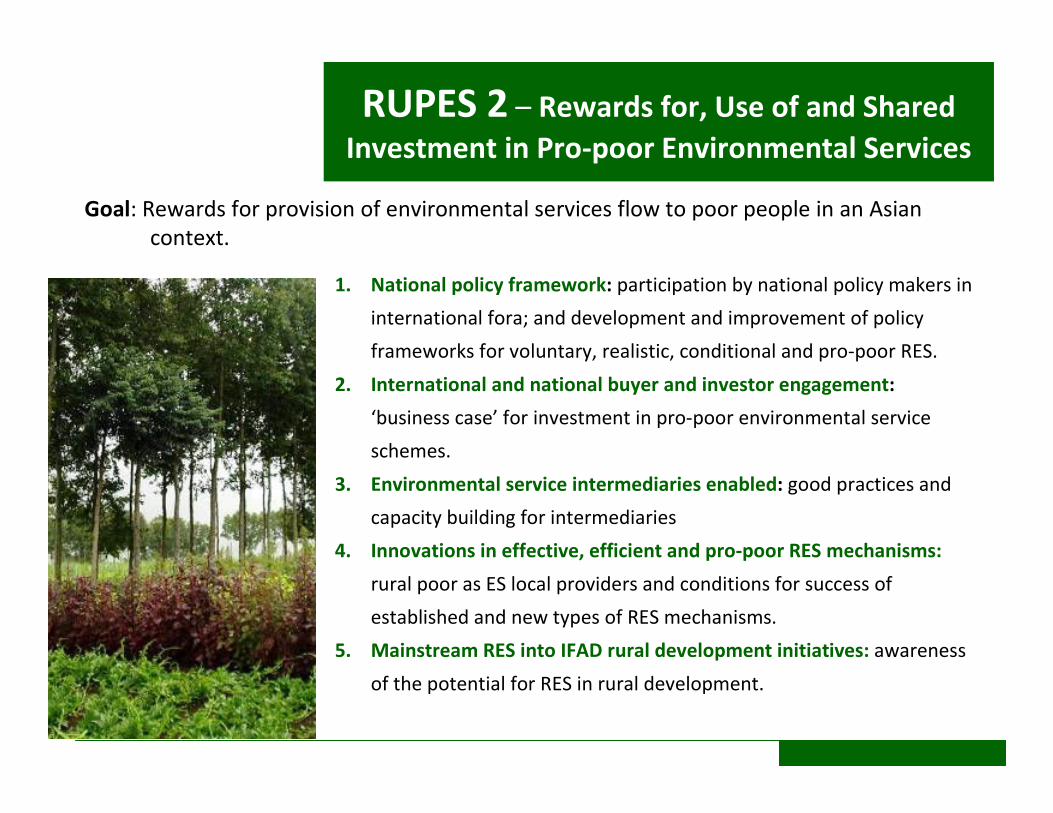
RUPES 2 – Rewards for, Use of and Shared
Investment in Pro-poor Environmental Services
Goal: Rewards for provision of environmental services flow to poor people in an Asian
context.
1. National policy framework: participation by national policy makers in
international fora; and development and improvement of policy
frameworks for voluntary, realistic, conditional and pro-poor RES.
2. International and national buyer and investor engagement:
‘business case’ for investment in pro-poor environmental service
schemes.
3. Environmental service intermediaries enabled: good practices and
capacity building for intermediaries
4. Innovations in effective, efficient and pro-poor RES mechanisms:
rural poor as ES local providers and conditions for success of
established and new types of RES mechanisms.
5. Mainstream RES into IFAD rural development initiatives: awareness
of the potential for RES in rural development.
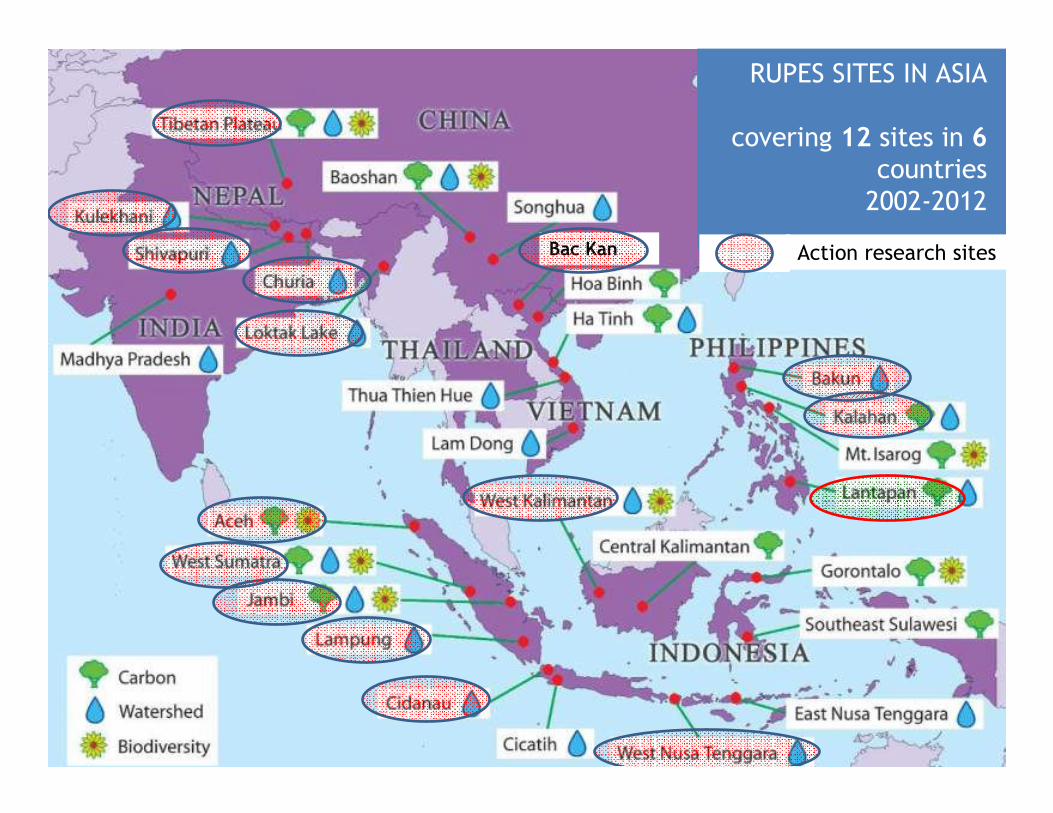
Bac Kan
RUPES SITES IN ASIA
covering 12 sites in 6
countries
2002-2012
Action research sites
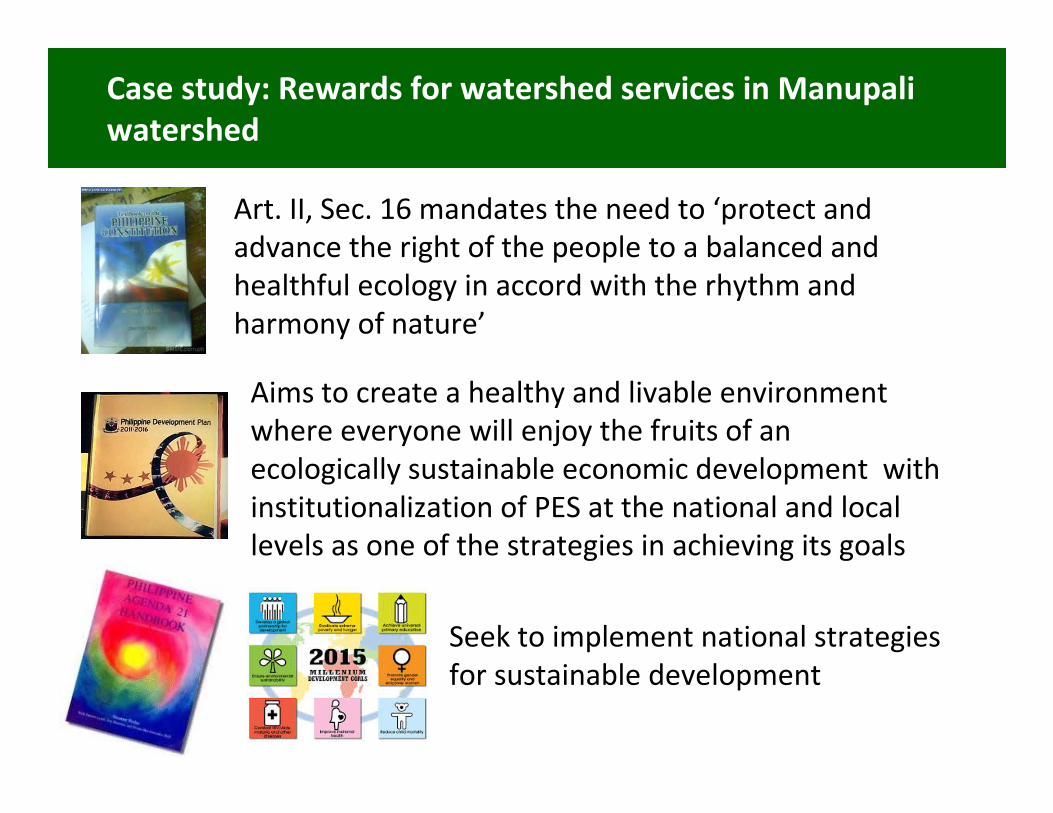
Case study: Rewards for watershed services in Manupali
watershed
Seek to implement national strategies
for sustainable development
Art. II, Sec. 16 mandates the need to ‘protect and
advance the right of the people to a balanced and
healthful ecology in accord with the rhythm and
harmony of nature’
Aims to create a healthy and livable environment
where everyone will enjoy the fruits of an
ecologically sustainable economic development with
institutionalization of PES at the national and local
levels as one of the strategies in achieving its goals
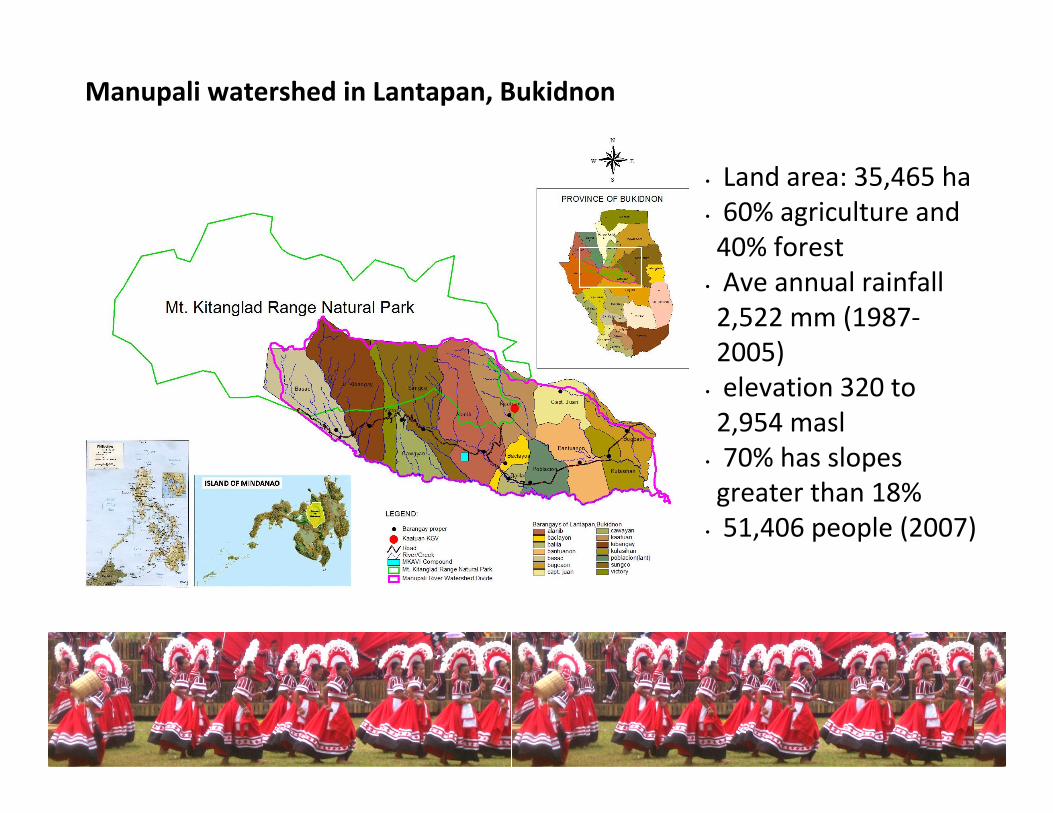
• Land area: 35,465 ha
• 60% agriculture and
40% forest
• Ave annual rainfall
2,522 mm (1987-
2005)
• elevation 320 to
2,954 masl
• 70% has slopes
greater than 18%
• 51,406 people (2007)
Manupali watershed in Lantapan, Bukidnon
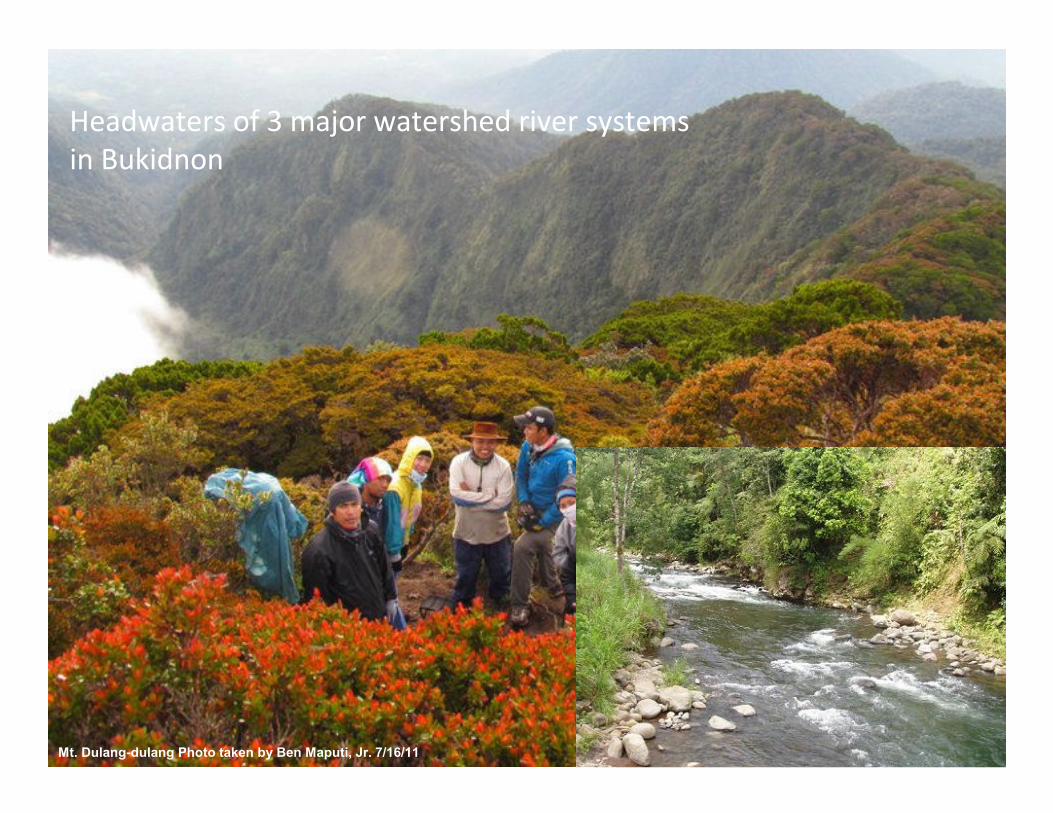
Mt. Dulang-dulang Photo taken by Ben Maputi, Jr. 7/16/11
Headwaters of 3 major watershed river systems
in Bukidnon
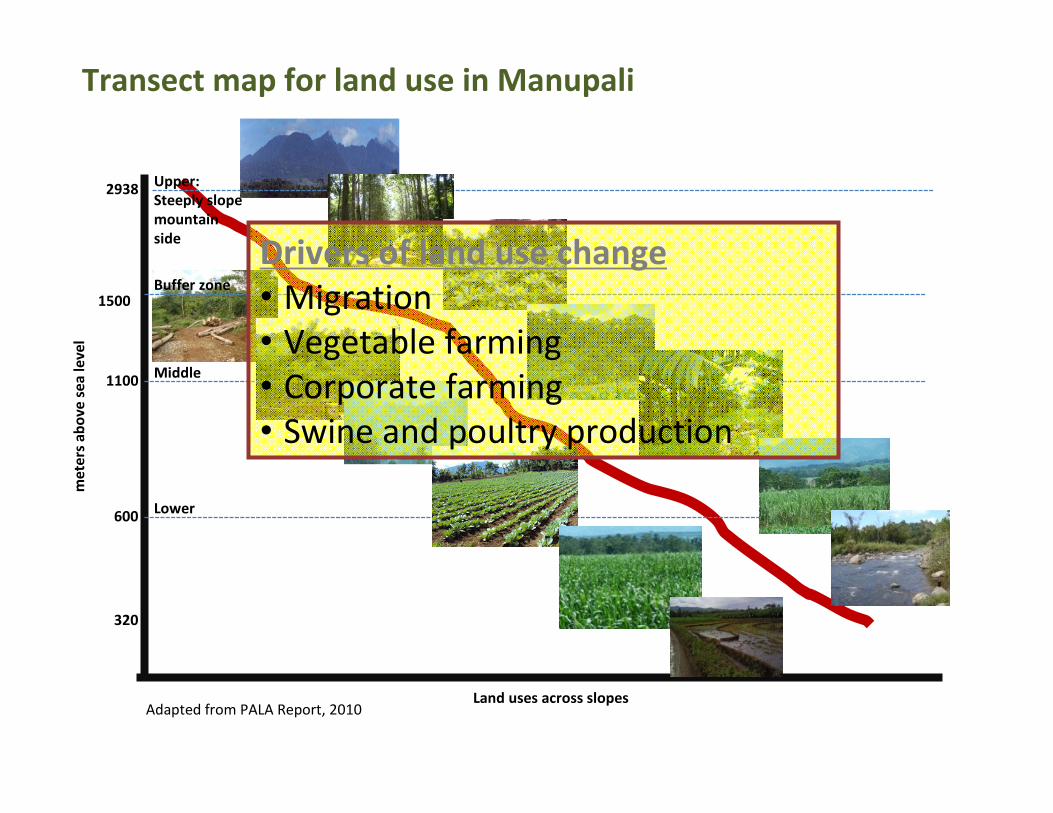
Transect map for land use in Manupali
320
600
1500
2938
Adapted from PALA Report, 2010
me
ters
ab
ov
e s
ea
le
ve
l
Lower
1100Middle
Upper:
Steeply slope
mountain
side
Buffer zone
Land uses across slopes
Drivers of land use change
• Migration
• Vegetable farming
• Corporate farming
• Swine and poultry production
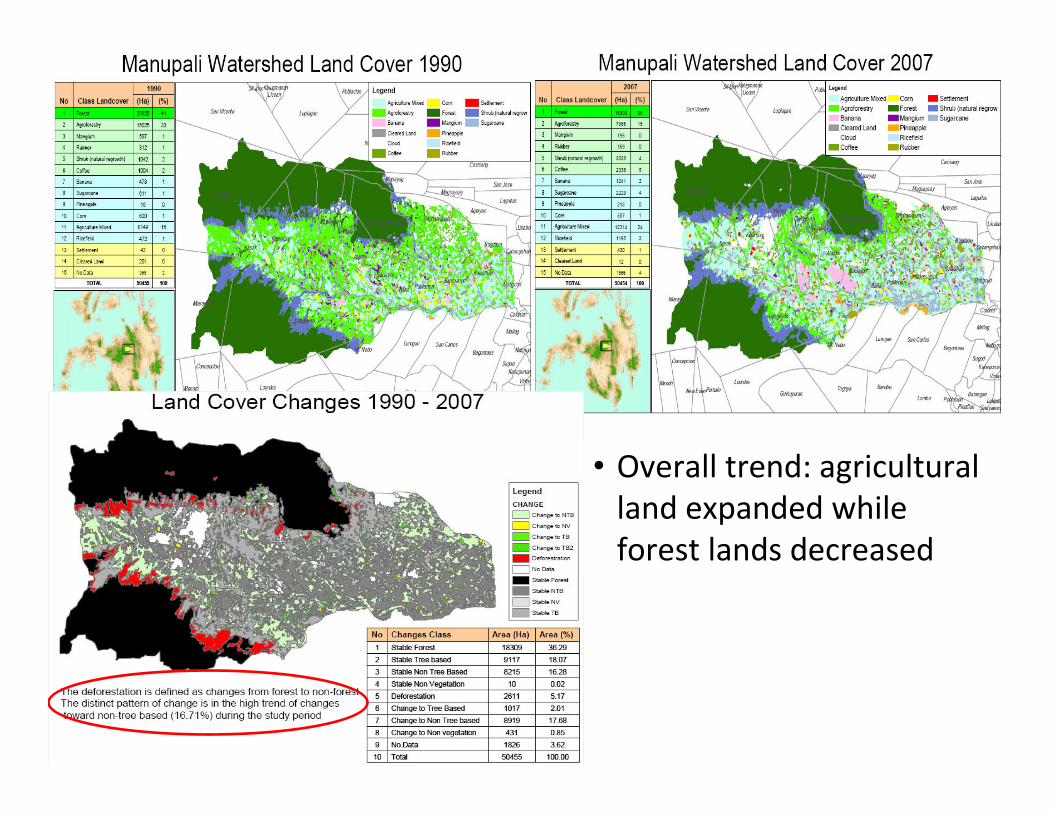
• Overall trend: agricultural
land expanded while
forest lands decreased
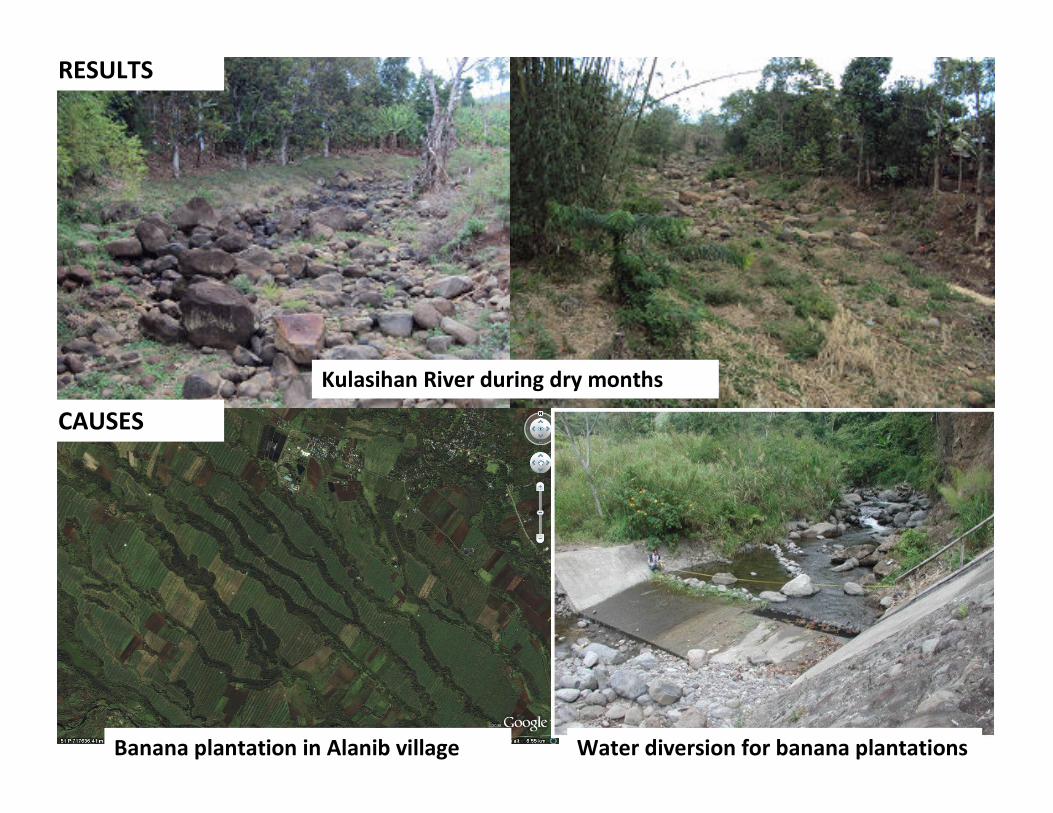
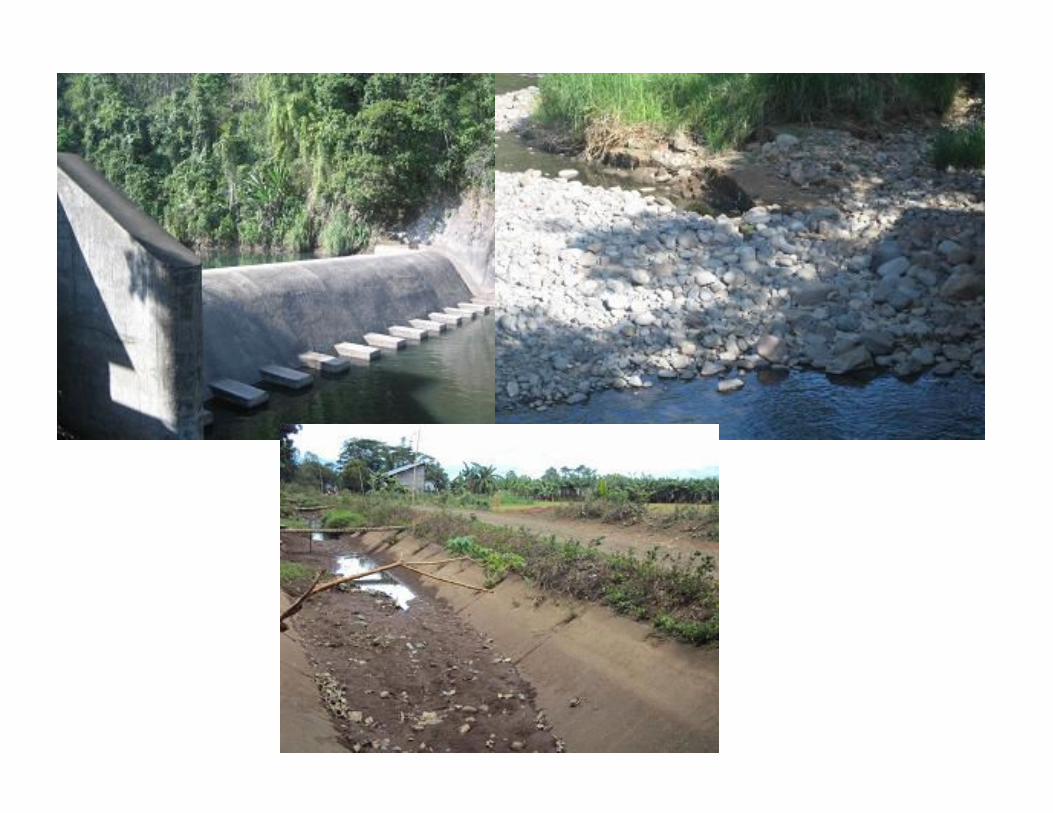
Kulasihan River during dry months
RESULTS
Banana plantation in Alanib village Water diversion for banana plantations
CAUSES
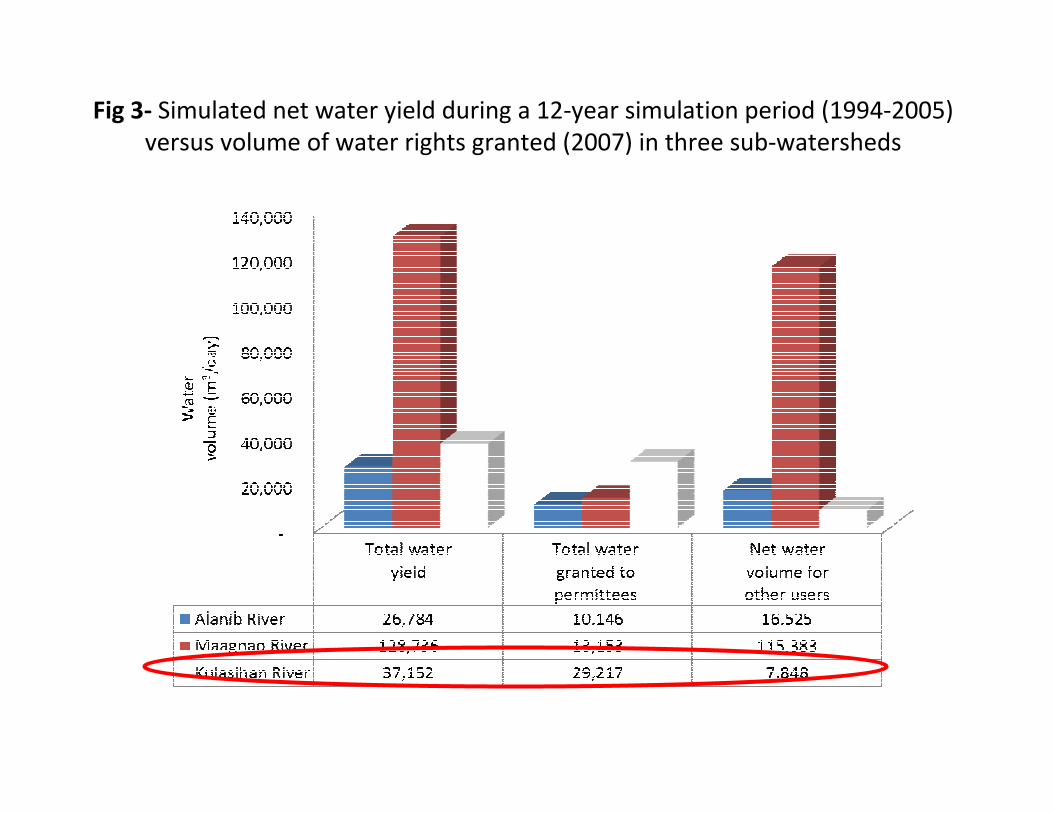
Fig 3- Simulated net water yield during a 12-year simulation period (1994-2005)
versus volume of water rights granted (2007) in three sub-watersheds
Source: NPC, 2006

1. DENR – NIPAS
Act
3. NCIP – IPRA Law
4. NWRB – Water Code
2. LGU – Local Government Code
Overlapping of water management regimes and
uncoordinated watershed management efforts
TugasanMaagnao
Alanib
Kulasihan
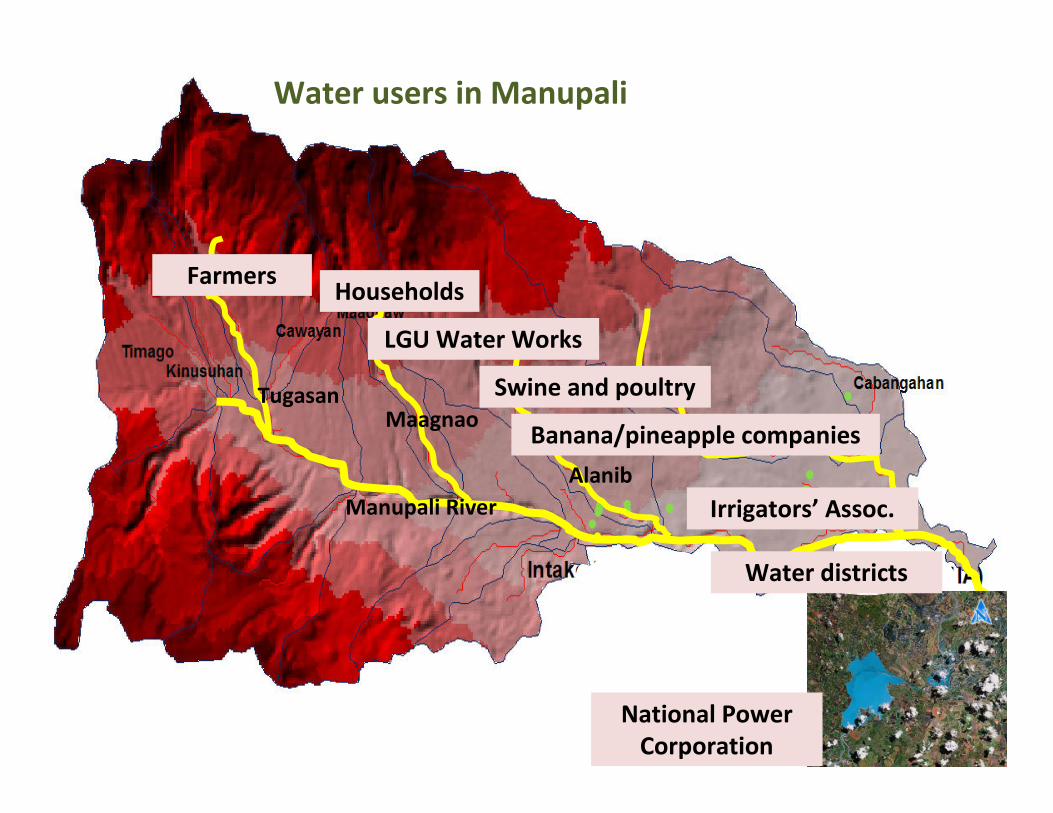
Water users in Manupali
Manupali River
Farmers
LGU Water Works
Banana/pineapple companies
Swine and poultry
Irrigators’ Assoc.
National Power
Corporation
Households
Water districts
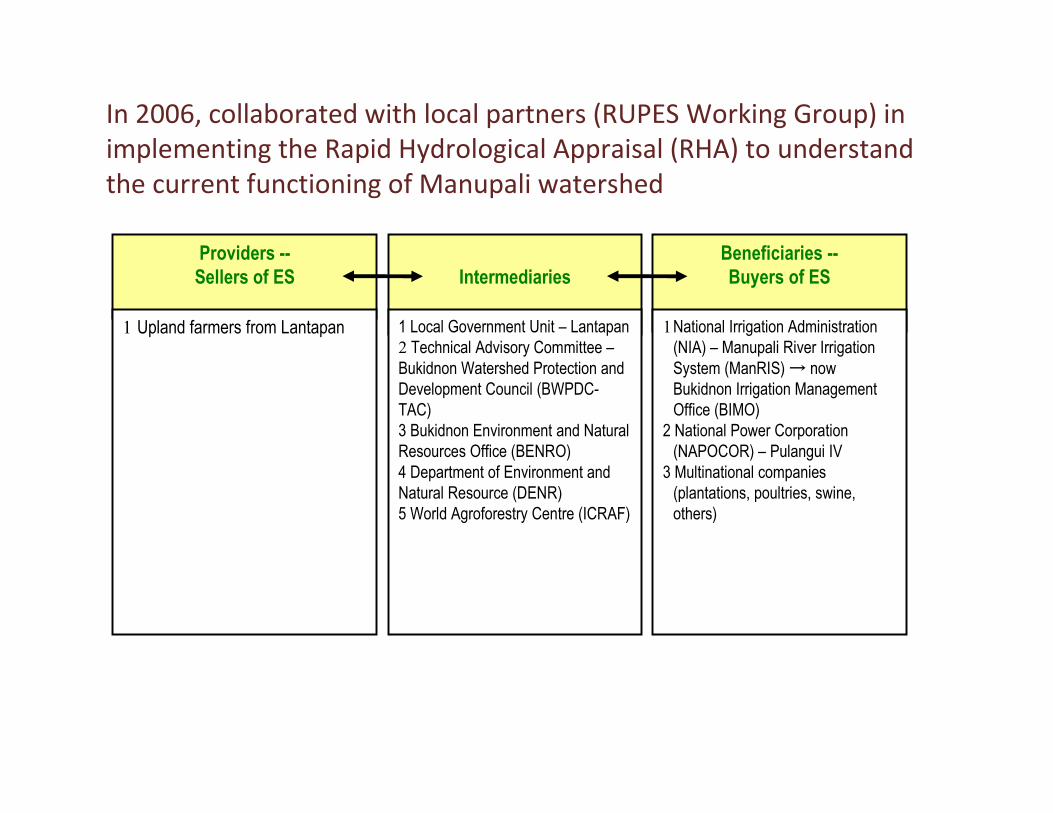
In 2006, collaborated with local partners (RUPES Working Group) in
implementing the Rapid Hydrological Appraisal (RHA) to understand
the current functioning of Manupali watershed
Providers --
Sellers of ES
1 Upland farmers from Lantapan
Beneficiaries --
Buyers of ES
1National Irrigation Administration
(NIA) – Manupali River Irrigation
System (ManRIS) → now
Bukidnon Irrigation Management
Office (BIMO)
2 National Power Corporation
(NAPOCOR) – Pulangui IV
3 Multinational companies
(plantations, poultries, swine,
others)
Intermediaries
1 Local Government Unit – Lantapan
2 Technical Advisory Committee –
Bukidnon Watershed Protection and
Development Council (BWPDC-
TAC)
3 Bukidnon Environment and Natural
Resources Office (BENRO)
4 Department of Environment and
Natural Resource (DENR)
5 World Agroforestry Centre (ICRAF)
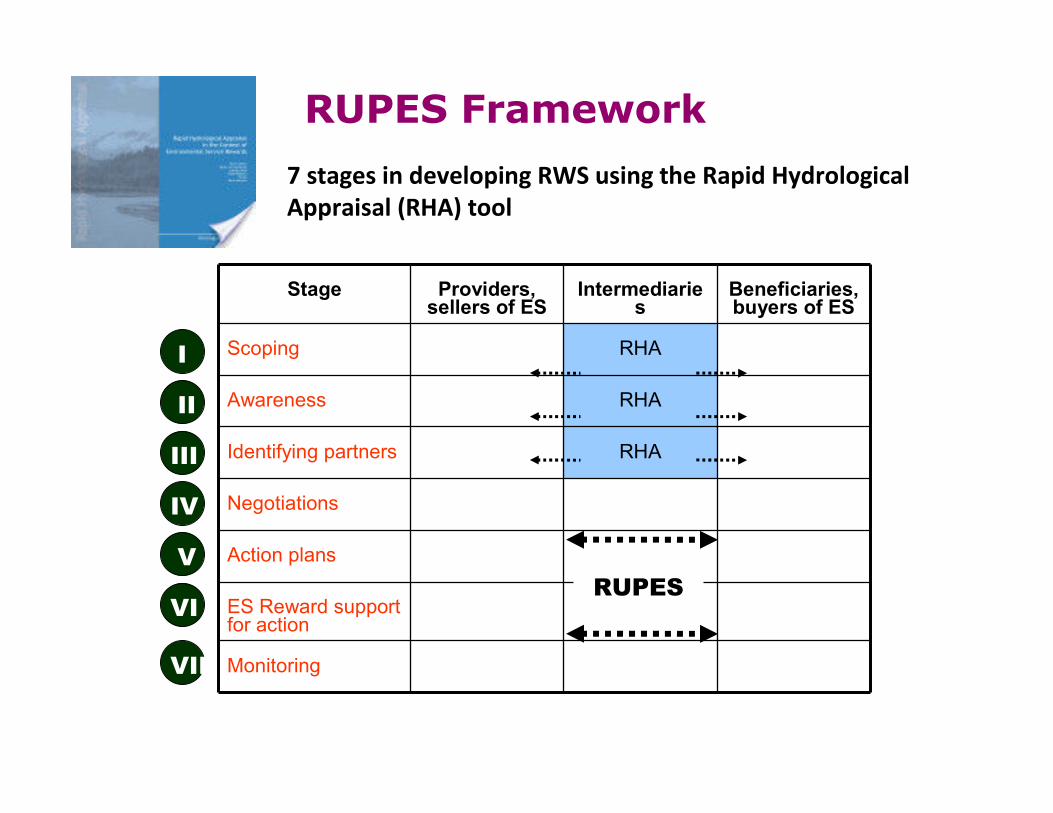
RUPES Framework
Stage Providers, sellers of ES
Intermediaries
Beneficiaries, buyers of ES
Scoping RHA
Awareness RHA
Identifying partners RHA
Negotiations
Action plans
ES Reward support for action
Monitoring
7 stages in developing RWS using the Rapid Hydrological
Appraisal (RHA) tool
I
II
III
IV
V
VI
VII
RUPES
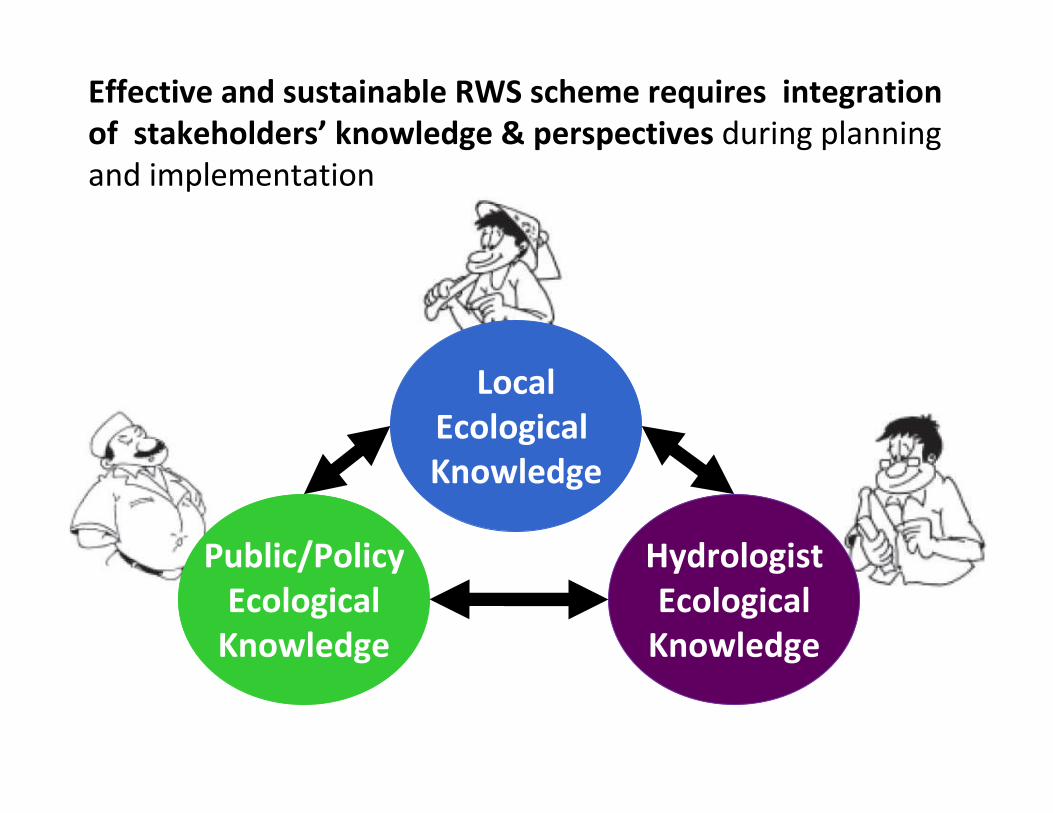
Effective and sustainable RWS scheme requires integration
of stakeholders’ knowledge & perspectives during planning
and implementation
Local
Ecological
Knowledge
Public/Policy
Ecological
Knowledge
Hydrologist
Ecological
Knowledge
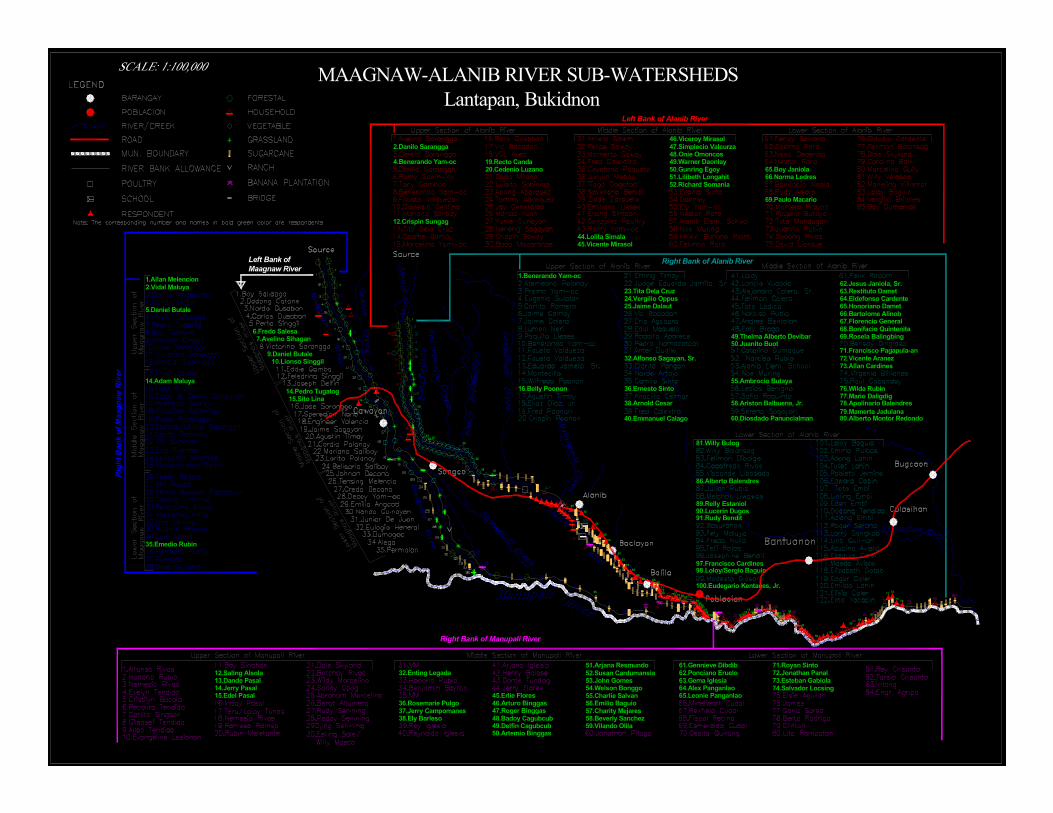
MAAGNAW-ALANIB RIVER SUB-WATERSHEDS
Lantapan, Bukidnon
6.Fredo Salesa7.Avelino Sihagan
9.Daniel Butale10.Lionso Singgil
14.Pedro Tugatog15.Sito Lina
1.Allan Melencion2.Vidal Maluya
5.Daniel Butale
14.Adam Maluya
35.Emedio Rubin
14
15
1
2
35
71.Royan Sinto72.Jonathan Panal73.Esteban Gabiola74.Salvador Locsing
61.Gennieve Dibdib62.Ponciano Eruelo63.Gema Iglesia64.Alex Panganlao65.Leonie Panganlao
51.Arjana Resmundo52.Susan Cardumansia53.John Gomes54.Welson Bonggo55.Charlie Salvan56.Emilio Baguio57.Charity Mejares58.Beverly Sanchez59.Vilando Olila
45.Erlie Flores46.Arturo Binggas47.Roger Binggas48.Badoy Cagubcub49.Delfin Cagubcub50.Artemio Binggas
32.Enting Legada
36.Rosemarie Pulgo37.Jerry Campomanes38.Ely Barleso
12.Saling Alsola13.Dande Pasal14.Jerry Pasal15.Edel Pasal
2.Danilo Sarangga
4.Benerando Yam-oc
12.Crispin Sungag
19.Recto Canda20.Cedenio Luzano
44.Lolita Simala45.Vicente Mirasol
46.Viceroy Mirasol47.Simplecio Valcurza48.Onie Omoncos49.Warner Daonlay50.Gunring Egoy51.Lilibeth Longahit52.Richard Somania
65.Boy Janiola66.Norma Ledres
69.Paulo Macario
1
1.Benerando Yam-oc
16.Belly Poonon
23.Tita Dela Cruz24.Vergilio Oppus25.Jaime Dalaut
32.Alfonso Sagayan, Sr.
36.Ernesto Sinto
38.Arnold Cesar
40.Emmanuel Calago
49.Thelma Alberto Devibar50.Juanito Buot
55.Ambrocio Butaya
58.Ariston Balbuena, Jr.
60.Diosdado Panuncialman
81.Willy Bulog
86.Alberto Balendres
89.Relly Estaniol90.Lucerin Dugos91.Rudy Bendit
97.Francisco Cardines98.Loloy/Sergio Baguio
100.Eudegario Kentanes, Jr.
62.Jesus Janiola, Sr.63.Restituto Damet64.Eldefonso Cardente65.Honoriano Damet66.Bartolome Alinob67.Florencio General68.Bonifacio Quintenita69.Rosela Balingbing
71.Francisco Pagapula-an72.Vicente Aranez73.Allan Cardines
76.Wilda Rubin77.Mario Daligdig
79.Mamerta Jadulana
78.Apolinario Balendres
80.Alberto Montor Redondo
32
40
69
Right Bank of Maagnaw River
Left Bank of
Maagnaw River
Left Bank of Alanib River
Right Bank of Alanib River
Right Bank of Manupali River
15
16
2325
38
36
49
50
58
62
71
817673
8689
91
100
97
90
98
7778 8079
72
63
64
65
66
67 68
60
55
24
1413
12
38
45
50
54
59
65
61
7172
7374
32

Table 1- Perceptions on current hydrological situation in
Manupali (LEK and PEK results)
Causes Effects Actions
LEK -Decreasing forest cover
-Expansion of banana and
pineapple plantations
-Rivers utilized for local water
system
-Decreasing water supply
(e.g. drying up of rivers)
-Degrading water quality
-Flooding
-Siltation in irrigation canals
-Protect forest
-Plant trees
-Efficient use of water
PEK -Population growth
-Expansion of banana
plantations
-Decreasing forest cover
-Intensive agricultural
production
-Improper waste disposal
-Increasing water demand
-Unsustainable farming
systems
-Decreasing water supply
(e.g. drying up of rivers)
-Degrading water quality
-Siltation in irrigation canals
-Sedimentation in reservoir
-High treatment costs
-Poor rice production
-Massive
environmental
awareness
-Implement
environmental policies
-Plant trees
-Water recycling
-Provide incentives
-Regulate banana and
agricultural expansion
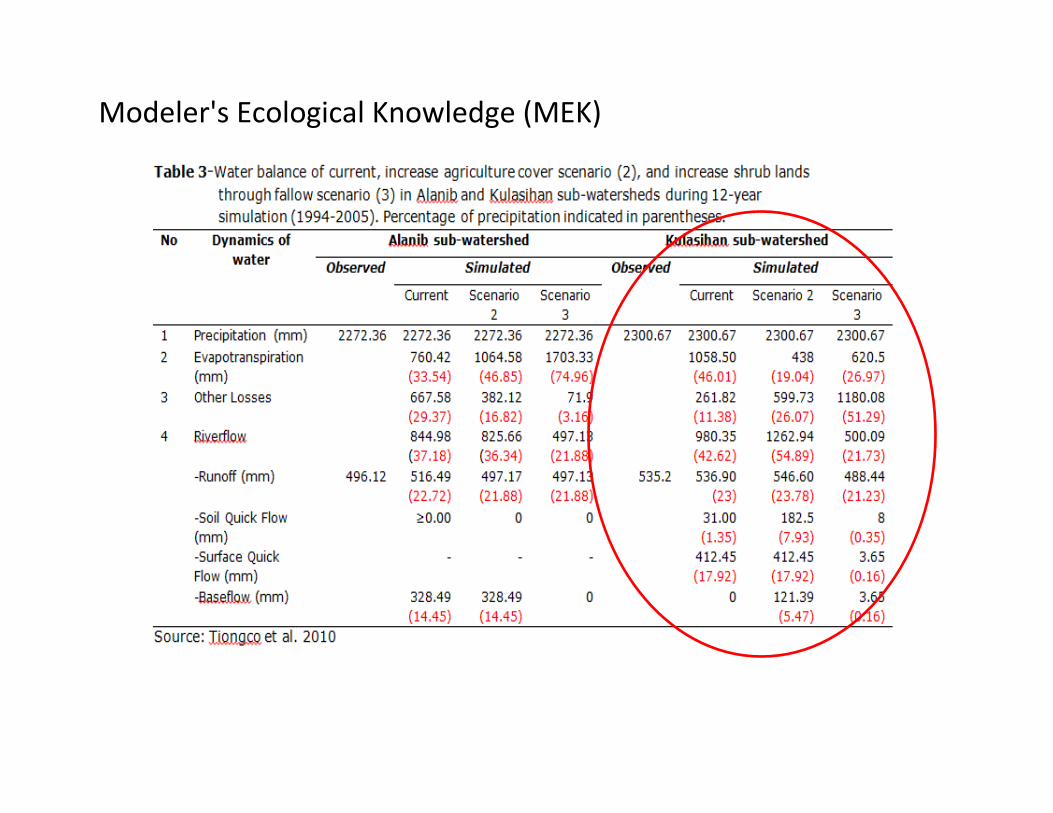
Modeler's Ecological Knowledge (MEK)
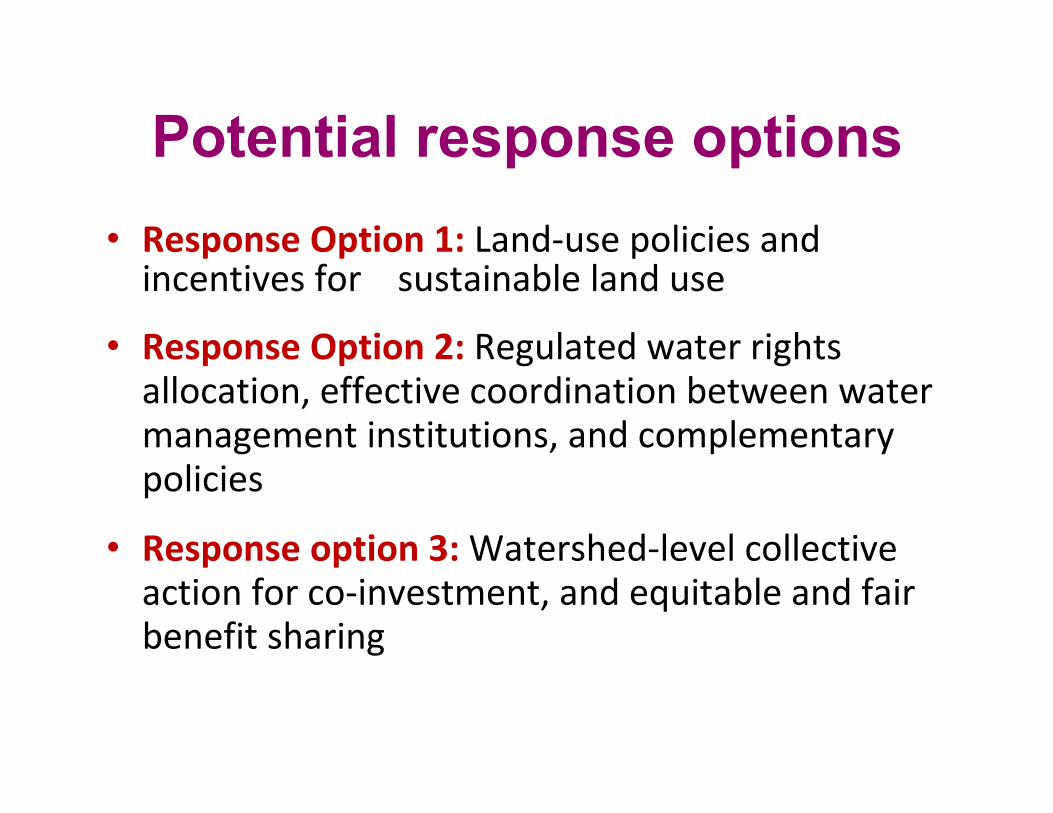
Potential response options
• Response Option 1: Land-use policies and incentives for sustainable land use
• Response Option 2: Regulated water rights allocation, effective coordination between water management institutions, and complementary policies
• Response option 3: Watershed-level collective action for co-investment, and equitable and fair benefit sharing
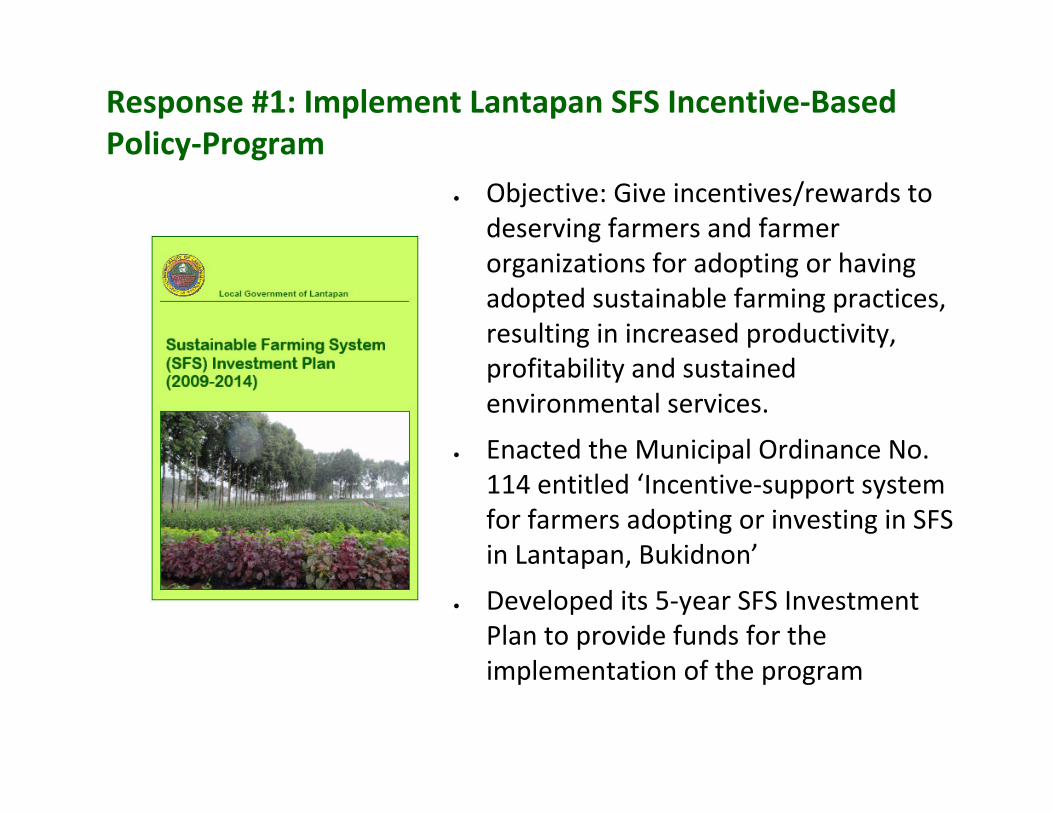
Response #1: Implement Lantapan SFS Incentive-Based
Policy-Program
• Objective: Give incentives/rewards to
deserving farmers and farmer
organizations for adopting or having
adopted sustainable farming practices,
resulting in increased productivity,
profitability and sustained
environmental services.
• Enacted the Municipal Ordinance No.
114 entitled ‘Incentive-support system
for farmers adopting or investing in SFS
in Lantapan, Bukidnon’
• Developed its 5-year SFS Investment
Plan to provide funds for the
implementation of the program

Focus of ES Focus of ES Conditionality appliedConditionality applied Type of scheme and Type of scheme and
current status current status
-Watershed services
-Carbon
sequestration
-Biodiversity
conservation
-Agri-ecotourism
- Adoption of SFS farming system • Provision of input
subsidies for crop
production and
NRM-based
livelihood projects
• Provision of
improved extension
services
• Subsidized crop
insurance
• Micro-financing
support
• Infrastructure
support
• Support for
marketing
• Awards and
recognition
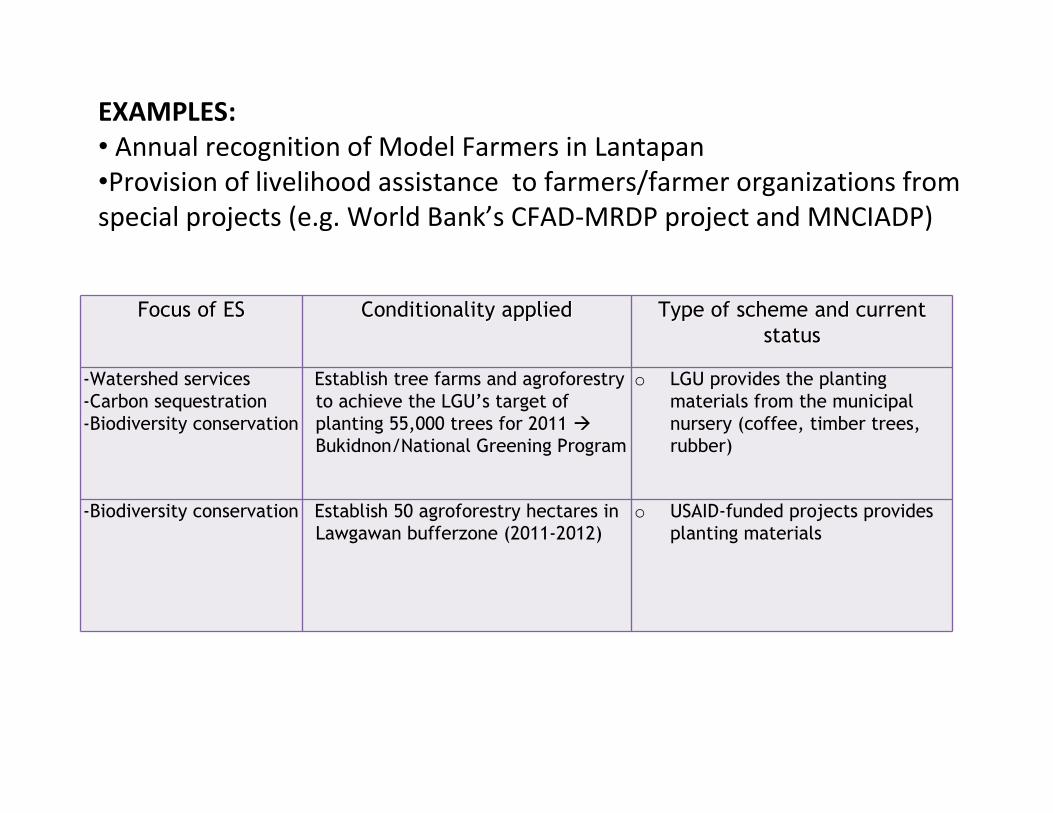
EXAMPLES:
• Annual recognition of Model Farmers in Lantapan
•Provision of livelihood assistance to farmers/farmer organizations from
special projects (e.g. World Bank’s CFAD-MRDP project and MNCIADP)
Focus of ES Focus of ES Conditionality appliedConditionality applied Type of scheme and current Type of scheme and current
status status
-Watershed services
-Carbon sequestration
-Biodiversity conservation
Establish tree farms and agroforestry
to achieve the LGU’s target of
planting 55,000 trees for 2011 �
Bukidnon/National Greening Program
o LGU provides the planting
materials from the municipal
nursery (coffee, timber trees,
rubber)
-Biodiversity conservation Establish 50 agroforestry hectares in
Lawgawan bufferzone (2011-2012)
o USAID-funded projects provides
planting materials
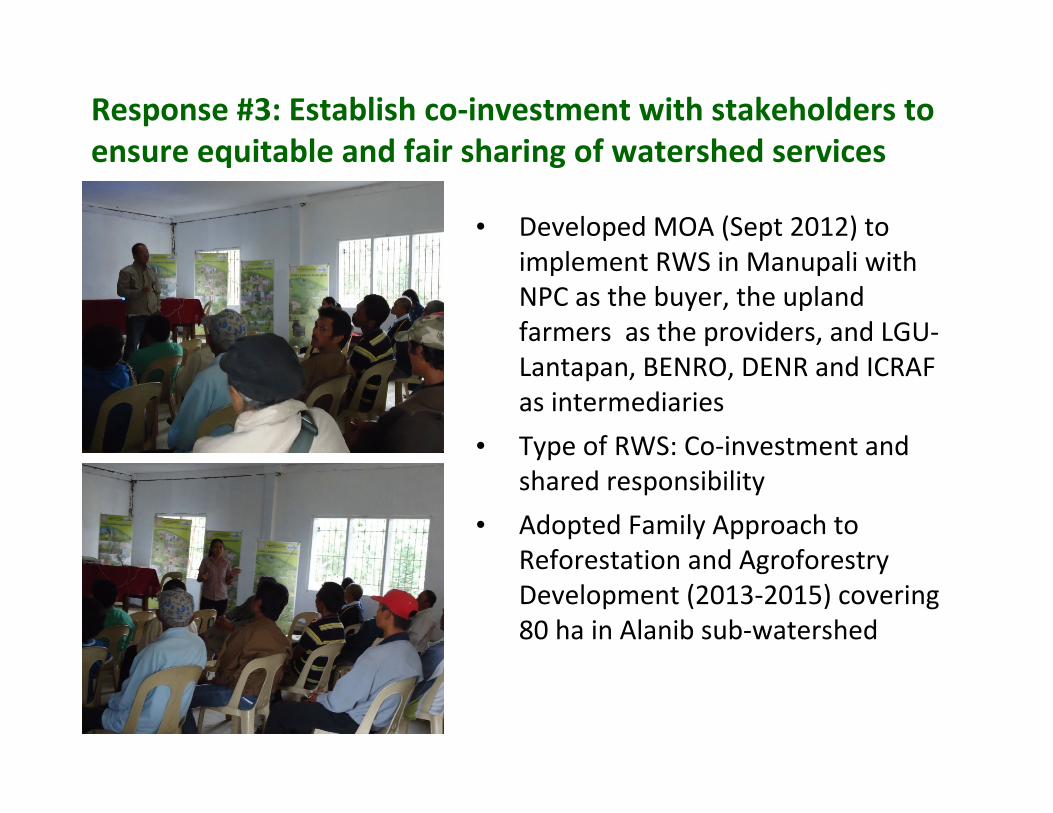
Response #3: Establish co-investment with stakeholders to
ensure equitable and fair sharing of watershed services
• Developed MOA (Sept 2012) to
implement RWS in Manupali with
NPC as the buyer, the upland
farmers as the providers, and LGU-
Lantapan, BENRO, DENR and ICRAF
as intermediaries
• Type of RWS: Co-investment and
shared responsibility
• Adopted Family Approach to
Reforestation and Agroforestry
Development (2013-2015) covering
80 ha in Alanib sub-watershed
ES: Water quality and soil erosion control
Obligation of NPC
-Provide TA to the farmer-cooperator
-Allocate funds (3 years)
-P35,641.96/ha for reforestation
-P19,001.70/ha for agroforestry (fruit
bearing trees)
-NPC shall provide quality tree seedlings
-Provide backyard livelihood projects
-Not exert claim of ownership over the
developed agroforestry or tree farm
-But have the authority to monitor the
status of the project even after the
expiration of the contract
-Conduct pre-and-prior informed consent
from the tribal community
Obligation of the farmer cooperator
-Develop area into reforestation farm or
agroforestry
-Provide labor, equipment, supplies and
materials
-Not plant the seedlings underneath the
transmission lines or within 7.5 m and 15
m radius on both sides of 69 kv and 138
kv transmission lines respectively
-Maintain and protect the plantation to
achieve 90% tree survival
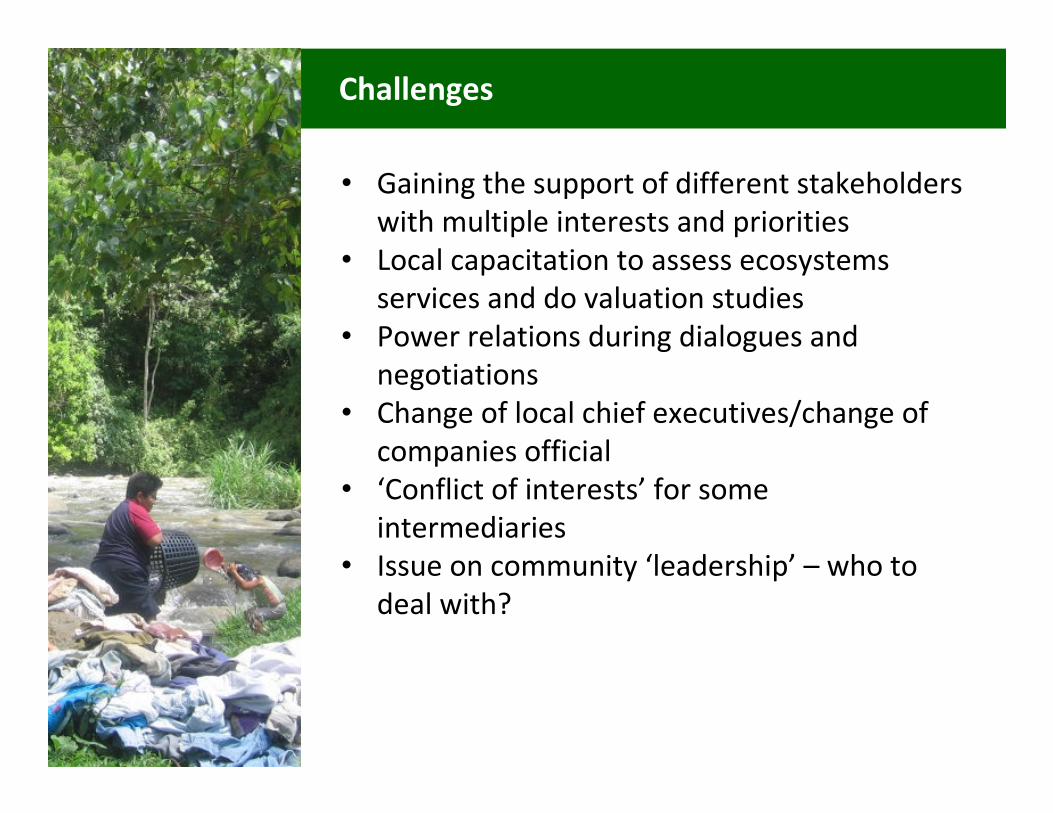
• Gaining the support of different stakeholders
with multiple interests and priorities
• Local capacitation to assess ecosystems
services and do valuation studies
• Power relations during dialogues and
negotiations
• Change of local chief executives/change of
companies official
• ‘Conflict of interests’ for some
intermediaries
• Issue on community ‘leadership’ – who to
deal with?
Challenges
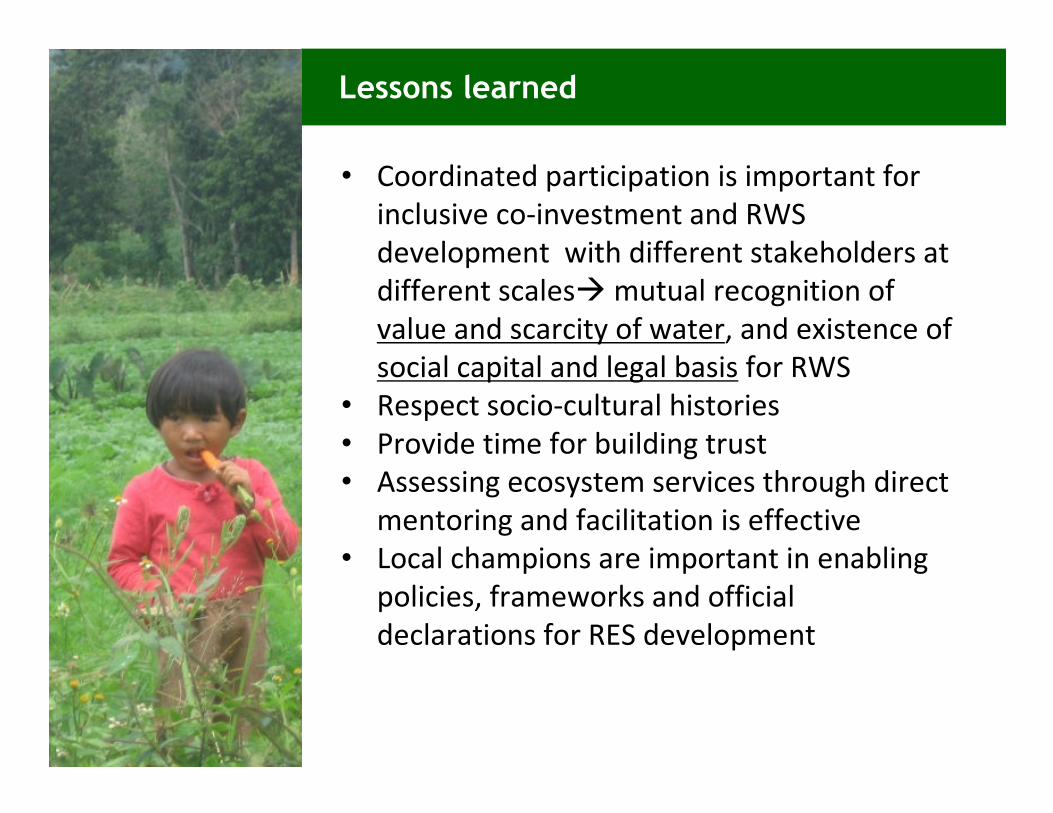
• Coordinated participation is important for
inclusive co-investment and RWS
development with different stakeholders at
different scales� mutual recognition of
value and scarcity of water, and existence of
social capital and legal basis for RWS
• Respect socio-cultural histories
• Provide time for building trust
• Assessing ecosystem services through direct
mentoring and facilitation is effective
• Local champions are important in enabling
policies, frameworks and official
declarations for RES development
Lessons learned
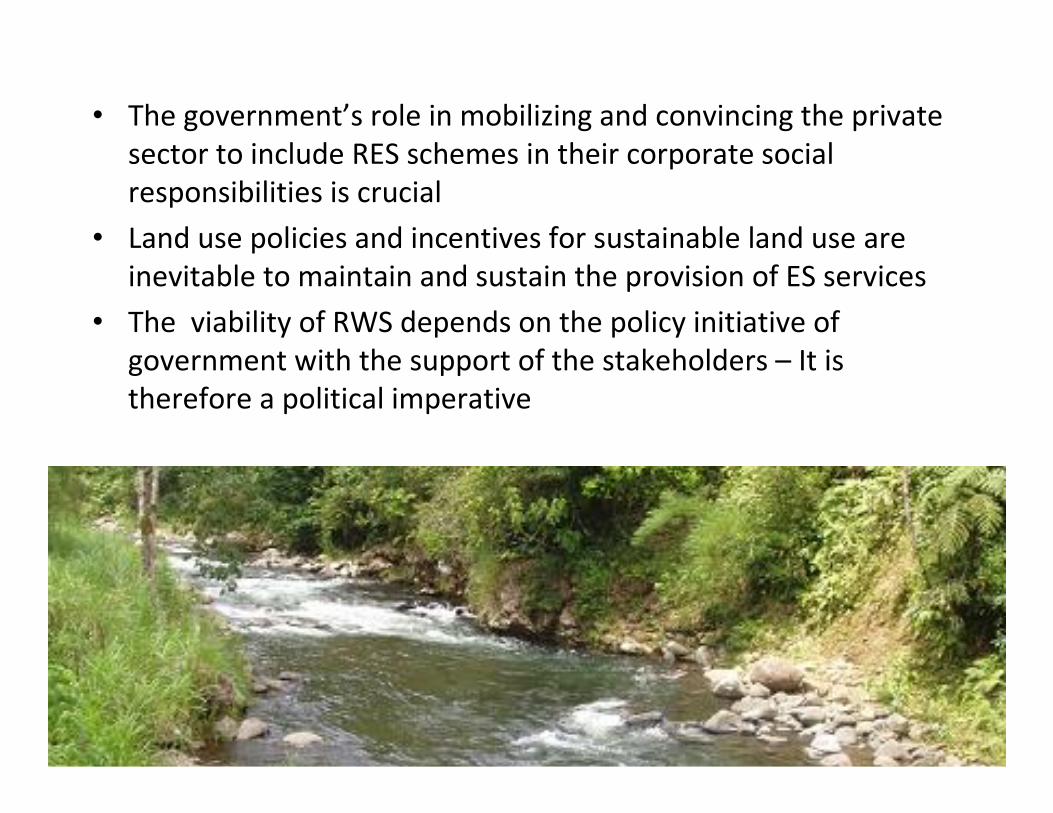
• The government’s role in mobilizing and convincing the private
sector to include RES schemes in their corporate social
responsibilities is crucial
• Land use policies and incentives for sustainable land use are
inevitable to maintain and sustain the provision of ES services
• The viability of RWS depends on the policy initiative of
government with the support of the stakeholders – It is
therefore a political imperative
Thank You
More information about RUPES
RUPES Program Beria Leimona ([email protected])
ICRAF RUPES-Philippines2/F Khush Hall, IRRI, College,
Los Banos, Laguna, PHILIPPINESTel: +63
FAX: +63 495362925Email: [email protected]
http://www.worldagroforestrycentre.org/sea/Networks/RUPES
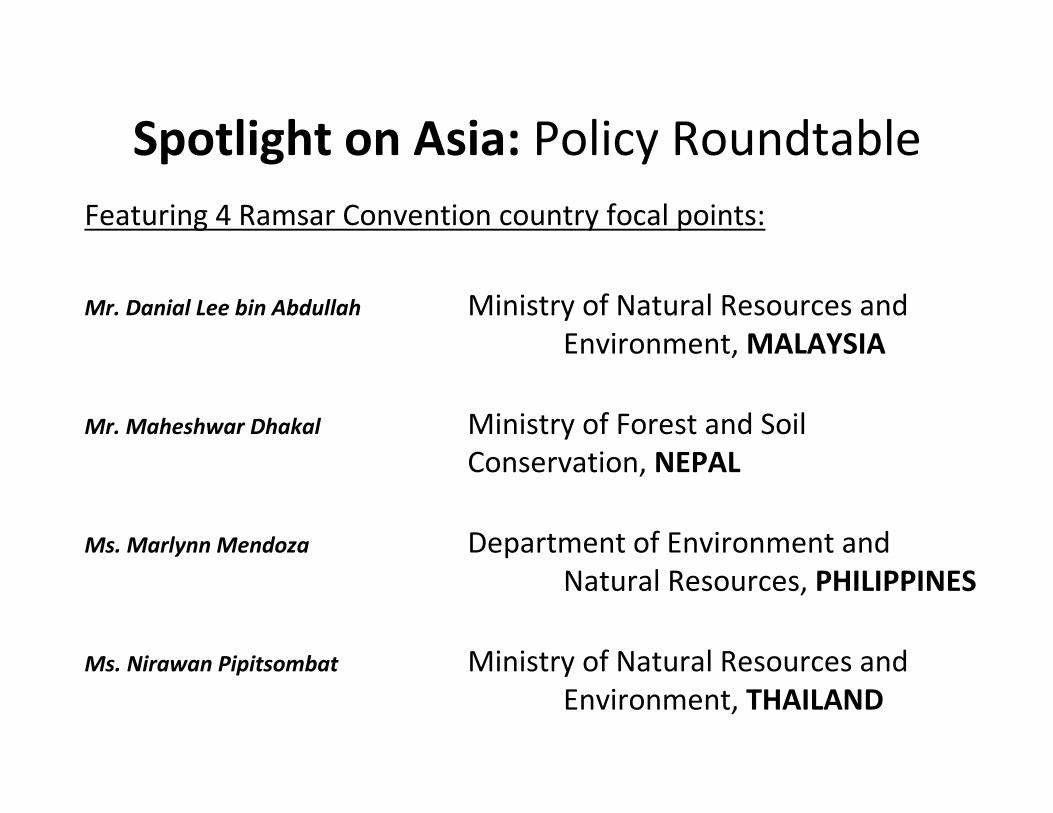
Spotlight on Asia: Policy Roundtable
Featuring 4 Ramsar Convention country focal points:
Mr. Danial Lee bin Abdullah Ministry of Natural Resources and
Environment, MALAYSIA
Mr. Maheshwar Dhakal Ministry of Forest and Soil
Conservation, NEPAL
Ms. Marlynn Mendoza Department of Environment and
Natural Resources, PHILIPPINES
Ms. Nirawan Pipitsombat Ministry of Natural Resources and
Environment, THAILAND
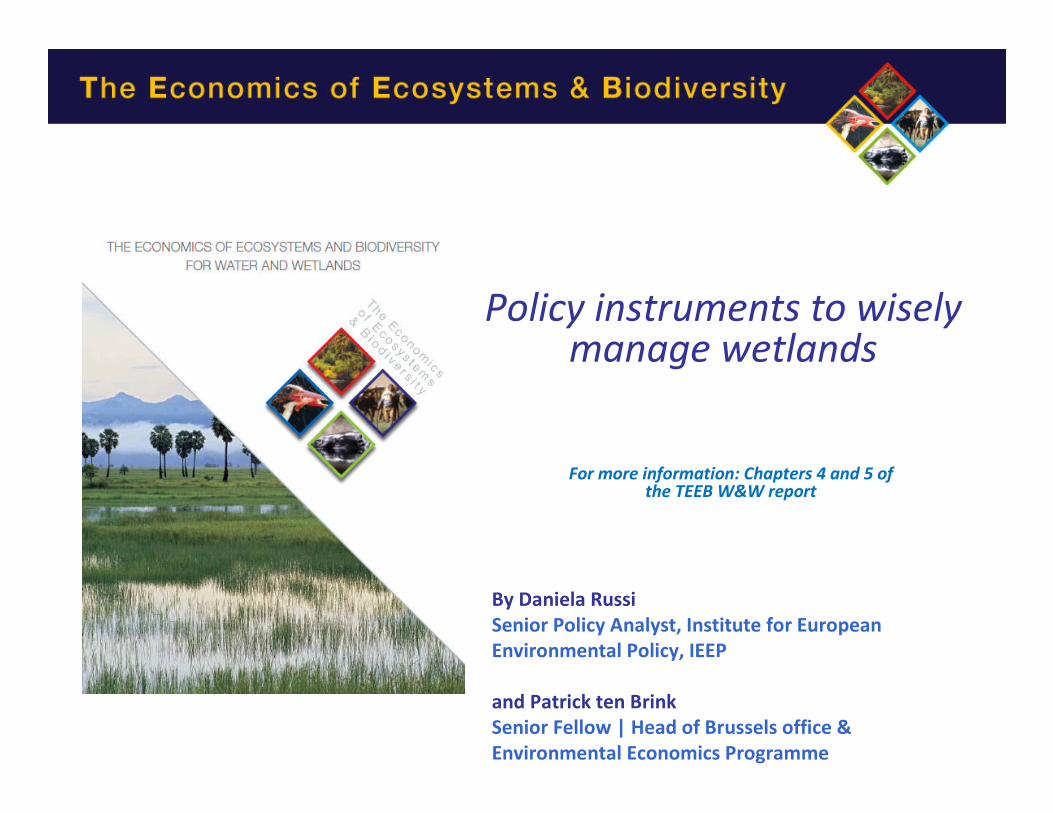
Policy instruments to wisely manage wetlands
For more information: Chapters 4 and 5 of the TEEB W&W report
By Daniela Russi
Senior Policy Analyst, Institute for European
Environmental Policy, IEEP
and Patrick ten Brink
Senior Fellow | Head of Brussels office &
Environmental Economics Programme
Policy instruments – Regulations
� Regulations that reduce pressures on wetlands (e.g. regulation of
water discharges, emissions standards)
� Regulation of products – restrictions on product use (e.g. re:
endangered species) or on production standards (BATs)
� Land-use planning, including the establishment of Protected Areas
and
o Integrated Water Resource Management (IWRM)
o Integrated Coastal Zone Management (ICZM)
o Marine Spatial Planning (MSP)
slide by Patrick ten Brink and Daniela Russi
IWRM, ICZM, MSP
� focused on landscape scale (e.g. river basin, coastal area, marine
region)
� multi disciplinary
� engaging various stakeholders
� they allow policy makers to discuss and formulate multiple
objectives, identify synergies among them, discuss trade-offs
slide by Patrick ten Brink and Daniela Russi
The Pangani River Basin IWRM (East Africa)
� The Pangani River Basin provides livelihoods to over three million
people, mainly from agriculture and fisheries
� The IUCN Water and Nature Initiative (WANI) carried out a IWRM:
o participatory governance
o increased institutional capacity at basin level
o increased knowledge about water resources
o empowerment of water users
o conflict resolution and platforms for stakeholder dialogue
� Water users have been empowered to participate in IWRM and
climate change adaptation -> better understanding of the water
sector’s vulnerability to climate change, pilot actions aimed at
adaptationSource: TEEBcase by Cross and Förster, mainly based
on PBWO/IUCN (2009) and Turpie et al. (2005)slide by Patrick ten Brink
Restoration
�Restoration and rehabilitation of degraded ecosystems can bring
considerable benefits to people, also economic:
o Climate change mitigation and adaptation
o Flood risk prevention
o Reduction of damage of storms
o Livelihood for local communities
o And many more…
� “Passive restoration” or active interventions
� If thresholds of irreversibility have been passed, the level of
biodiversity won’t be restored completely, but it is still
possible to restore/rehabilitate some ecosystem functions and
ESslide by Patrick ten Brink and Daniela Russi
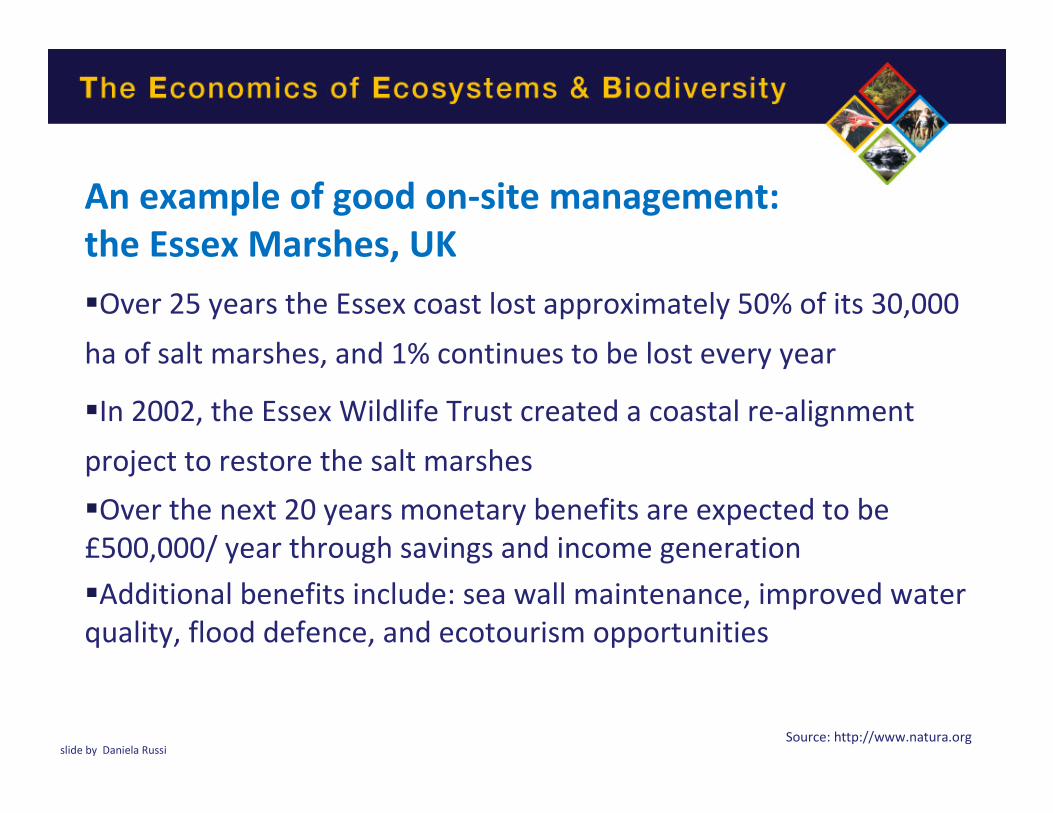
An example of good on-site management:
the Essex Marshes, UK
�Over 25 years the Essex coast lost approximately 50% of its 30,000
ha of salt marshes, and 1% continues to be lost every year
�In 2002, the Essex Wildlife Trust created a coastal re-alignment
project to restore the salt marshes
�Over the next 20 years monetary benefits are expected to be
£500,000/ year through savings and income generation
�Additional benefits include: sea wall maintenance, improved water
quality, flood defence, and ecotourism opportunities
Source: http://www.natura.org slide by Daniela Russi
Policy instruments – Market–Based Instruments
� Taxes, fees, charges, including Environmental Harmful
Subsidies (EHS) reform
� Tradable permit schemes, water banks/water funds
� Voluntary schemes,
including offsets
� Payment for Ecosystem
Services (PES)
© Daniela Russislide by Patrick ten Brink and Daniela Russi
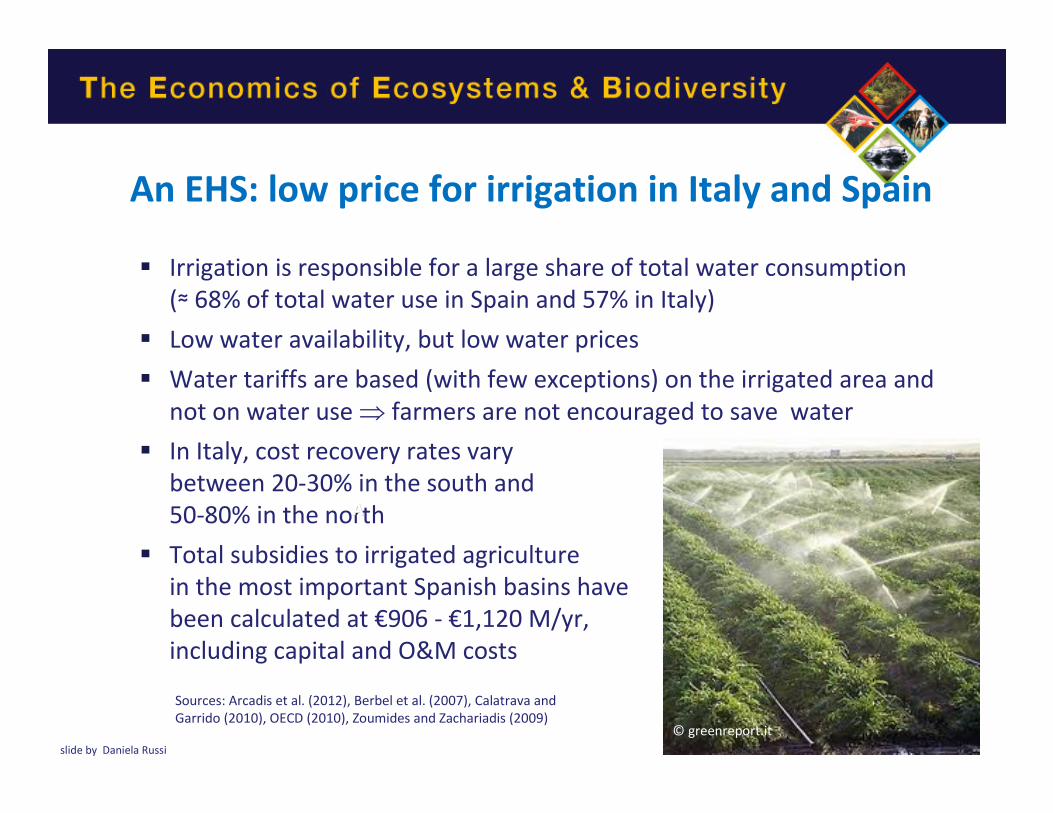
� Irrigation is responsible for a large share of total water consumption
(≈ 68% of total water use in Spain and 57% in Italy)
� Low water availability, but low water prices
� Water tariffs are based (with few exceptions) on the irrigated area and
not on water use ⇒ farmers are not encouraged to save water
� In Italy, cost recovery rates vary
between 20-30% in the south and
50-80% in the north
� Total subsidies to irrigated agriculture
in the most important Spanish basins have
been calculated at €906 - €1,120 M/yr,
including capital and O&M costs
AA
© greenreport.it
Sources: Arcadis et al. (2012), Berbel et al. (2007), Calatrava and
Garrido (2010), OECD (2010), Zoumides and Zachariadis (2009)
An EHS: low price for irrigation in Italy and Spain
slide by Daniela Russi

� Salinization threatens agriculture in the area, damages infrastructure
and has a negative impact on the river ecosystems
� It is caused by the reduction in aquifer recharge produced by a reduction
in permanent vegetation with deep roots
� The Bet Bet tradable salinity credits auction: farmers could offer their
commitment to undertake actions to reduce salinity in exchange for a
certain payment
� The farmers who won the auction could fulfil the obligations by reducing
salinity in their fields or by buying salinity
credits from other farmers
who had achieved higher
reductions than those
established in their contracts
© www.surfline.comSource: Connor et al. (2008)
The salinity credits in Bet Bet, Australia
slide by Daniela Russi
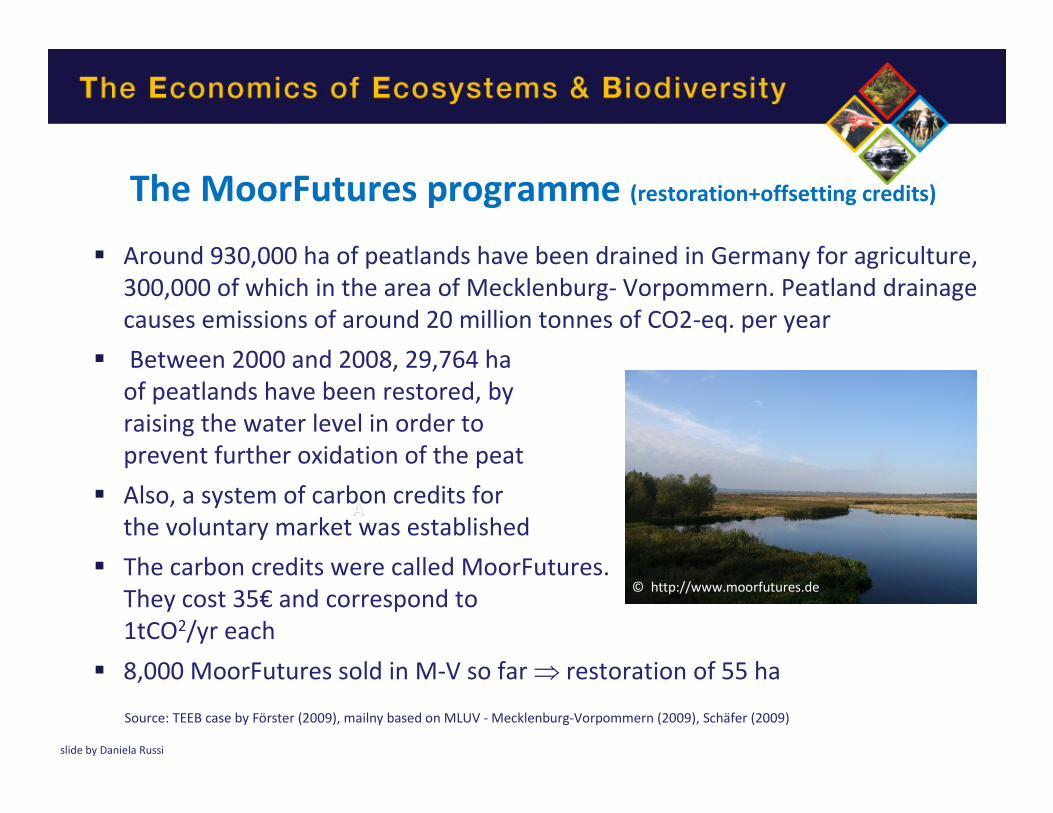
� Around 930,000 ha of peatlands have been drained in Germany for agriculture,
300,000 of which in the area of Mecklenburg- Vorpommern. Peatland drainage
causes emissions of around 20 million tonnes of CO2-eq. per year
� Between 2000 and 2008, 29,764 ha
of peatlands have been restored, by
raising the water level in order to
prevent further oxidation of the peat
� Also, a system of carbon credits for
the voluntary market was established
� The carbon credits were called MoorFutures.
They cost 35€ and correspond to
1tCO2/yr each
� 8,000 MoorFutures sold in M-V so far ⇒ restoration of 55 ha
AA
© http://www.moorfutures.de
Source: TEEB case by Förster (2009), mailny based on MLUV - Mecklenburg-Vorpommern (2009), Schäfer (2009)
The MoorFutures programme (restoration+offsetting credits)
slide by Daniela Russi
Wunder’s definition (Wunder, 2005):
� (a) a voluntary transaction where
� (b) a well-defined ES or a land use likely to secure that service
� (c) is being ‘bought’ by a (minimum one) service buyer
� (d) from a (minimum one) service provider
� (e) if and only if the service provider secures service provision (conditionality)
Payment for Ecosystem Services
AA
slide by Daniela Russi
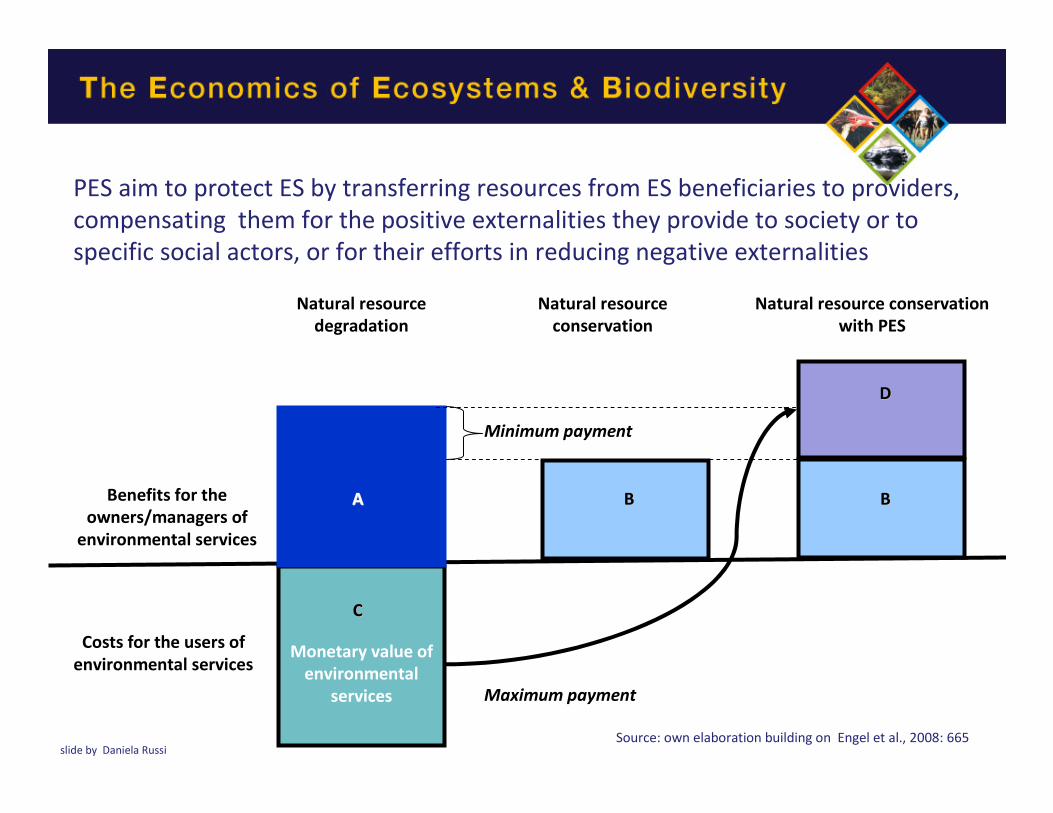
Monetary value of
environmental
services
Benefits for the
owners/managers of
environmental services
Costs for the users of
environmental services
Natural resource
degradation
Natural resource
conservation
Natural resource conservation
with PES
Minimum payment
Maximum payment
AA BB BB
CC
DD
PES aim to protect ES by transferring resources from ES beneficiaries to providers,
compensating them for the positive externalities they provide to society or to
specific social actors, or for their efforts in reducing negative externalities
Source: own elaboration building on Engel et al., 2008: 665slide by Daniela Russi
� Many PES experiences do not comply with all conditions
(i.e. voluntariness, clarity in defining ES, conditionality)
� A broader definition: “transfer of resources between social actors,
which aims to create incentives to align individual and/or collective
land use decisions with the social interest in the management of
natural resources“ (Muradian et al., 2010)
� Payment usually based on the opportunity costs of conservation
and not on monetary evaluation ⇒ long process of negotiation
Payment for Ecosystem Services
slide by Daniela Russi
� The barrier to conservation is mainly economic in nature
� A small fee may change the individual decisions of the
owners or managers of natural resources
� Property rights are well defined and the environmental
services are definable
� Buyers and suppliers can be identified, and a transaction
between these two categories of actors is possible
� It should not be regarded as a panacea or blueprint for
environmental conservation (commodification of nature
as a risk for conservation, McCauley, 2006)
It works when:
slide by Daniela Russi
Vittel, France
�PES programme to preserve the quality of Vittel’s bottled water,
threatened by the presence of nitrates and pesticides due to the
intensification of agricultural and livestock raising practices
upstream
� 10 years of negotiations
� Package of incentives available to farmers:
o 18 and 30 year-contracts to ensure continuity
o abolition of the debt associated with the purchase of land by farmers
o an average of €1000/ha to cover the costs related to the transition
o a lump sum of up to €150,000 per farm to meet the initial costs
o Technical assistance
� Success: protection of 92% of the water catchment area
slide by Daniela Russi
Limitations of MBI
� Are complementary – not substitutes – of environmental regulation
� Not advisable to protect high-value ecosystem or ecosystem
services or where failures can lead to severe/irreversible impacts
� Only effective when the cause for environmental degradation is
mainly economic (e.g. not useful in case of corruption, or to prevent
illegal water abstraction)
� Crowding-out of moral motivations?
slide by Daniela Russi
Scope of MBI – they are useful to
� Internalise part of environmental externalities
� Engage new stakeholders
� Improve funding opportunities
� Allow more flexibility to private actors
� Act as an educational tool
slide by Daniela Russi
� Wetlands protection/improvement should be integrated in water
management at all levels in order to progress towards their wise use
� In order to do that, the ES provided by wetlands need to be assessed
– using qualitative, quantitative and monetary methodologies,
depending on the objectives, the available information, time and
resources
� A variety of policy tools can contribute to wise use, including
regulation, establishment of PAs, integrated management and MBIs
Transforming our approach to water and wetlands
slide by Patrick ten Brink and Daniela Russi
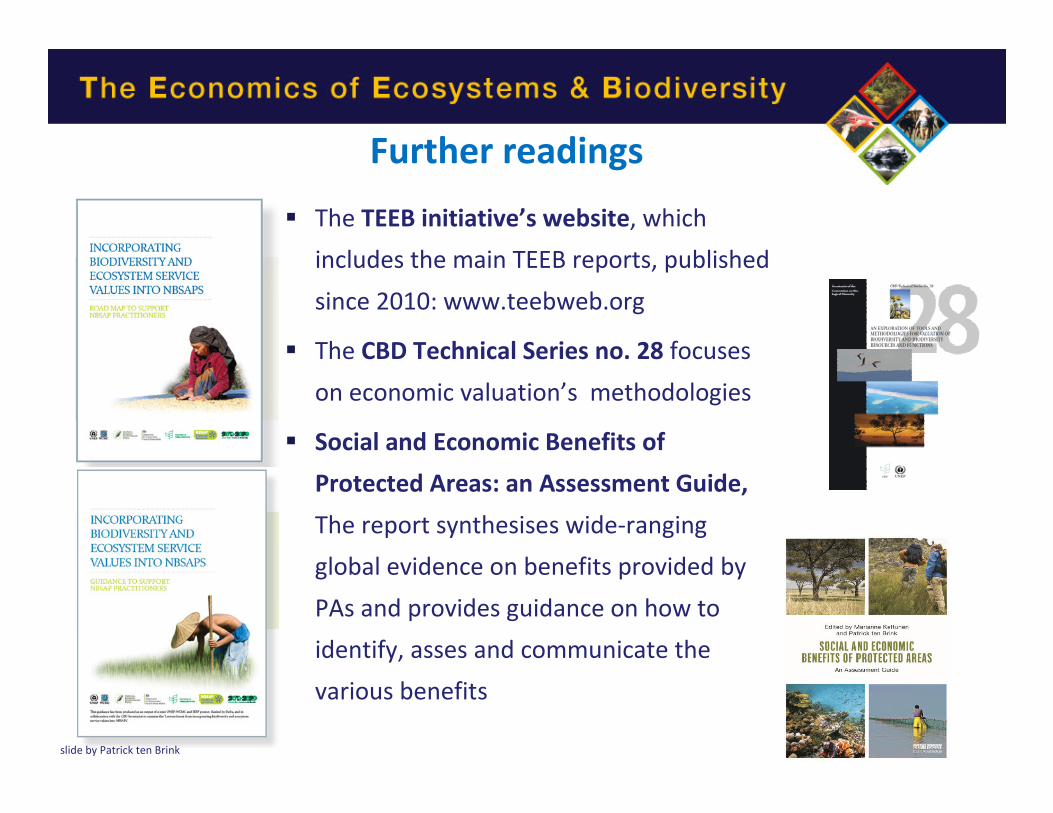
� The TEEB initiative’s website, which
includes the main TEEB reports, published
since 2010: www.teebweb.org
� The CBD Technical Series no. 28 focuses
on economic valuation’s methodologies
� Social and Economic Benefits of
Protected Areas: an Assessment Guide,
The report synthesises wide-ranging
global evidence on benefits provided by
PAs and provides guidance on how to
identify, asses and communicate the
various benefits
Further readings
slide by Patrick ten Brink
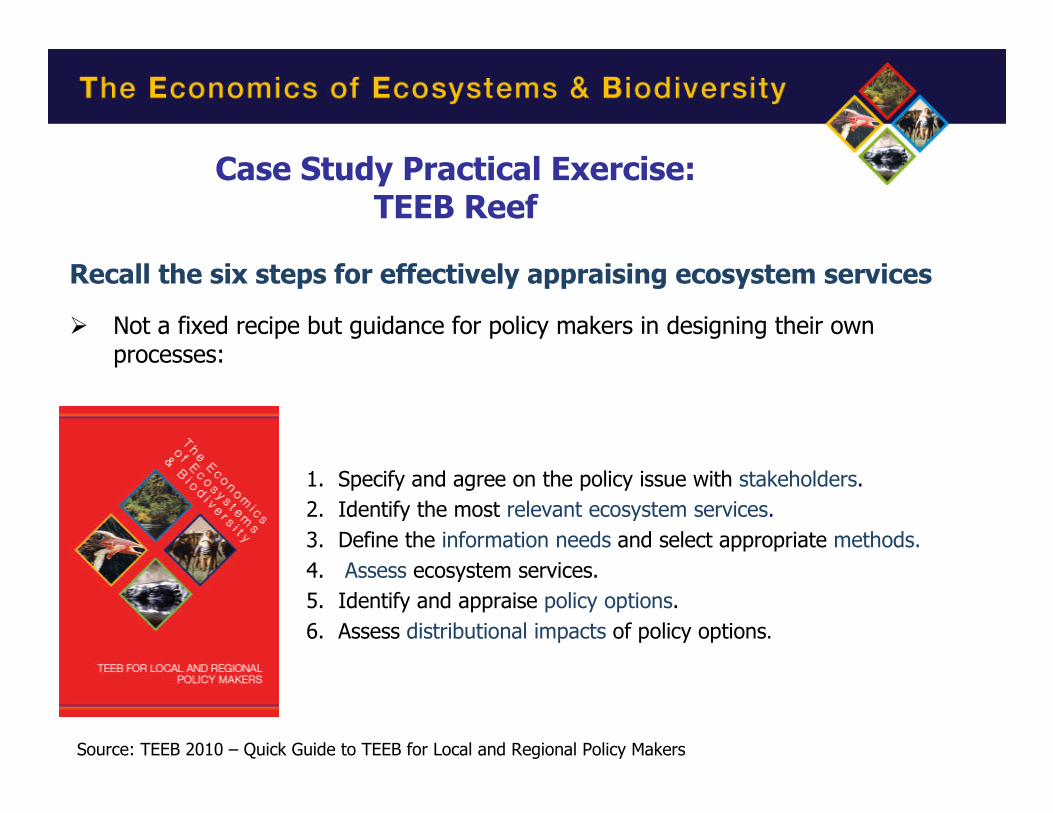
Recall the six steps for effectively appraising ecosystem services
� Not a fixed recipe but guidance for policy makers in designing their own processes:
1. Specify and agree on the policy issue with stakeholders.
2. Identify the most relevant ecosystem services.
3. Define the information needs and select appropriate methods.
4. Assess ecosystem services.
5. Identify and appraise policy options.
6. Assess distributional impacts of policy options.
Source: TEEB 2010 – Quick Guide to TEEB for Local and Regional Policy Makers
Case Study Practical Exercise:TEEB Reef
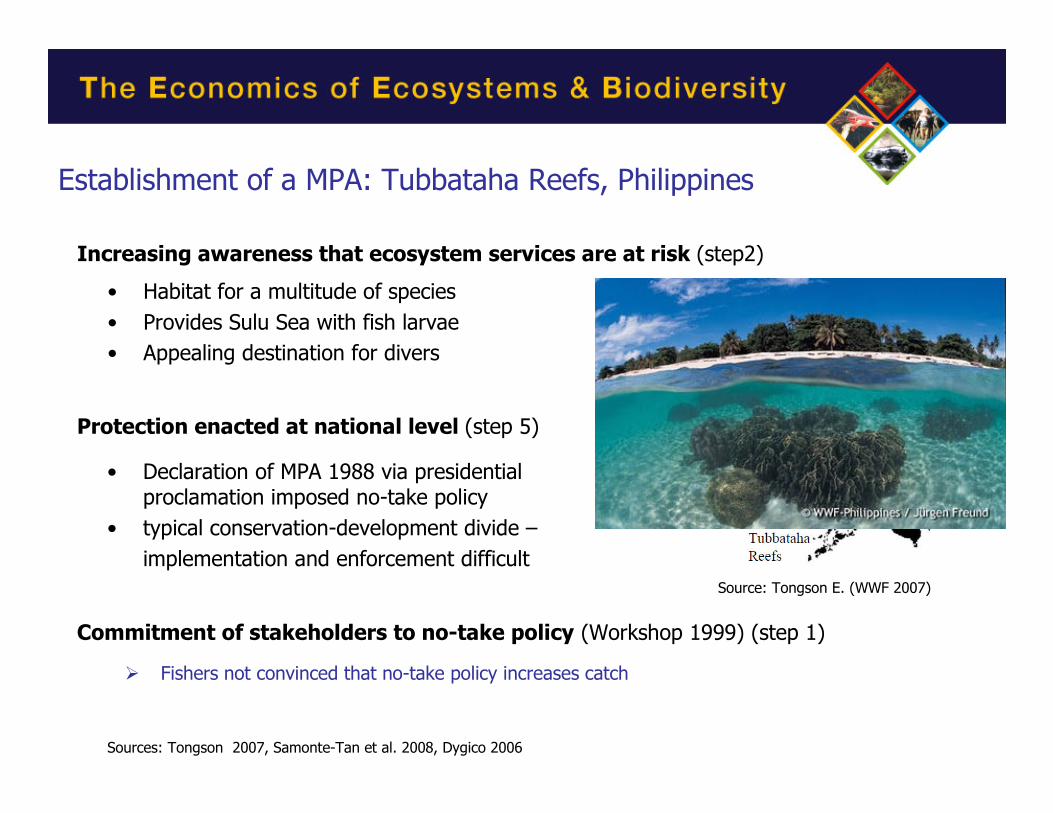
Establishment of a MPA: Tubbataha Reefs, Philippines
Source: Tongson E. (WWF 2007)
Commitment of stakeholders to no-take policy (Workshop 1999) (step 1)
� Fishers not convinced that no-take policy increases catch
Protection enacted at national level (step 5)
• Declaration of MPA 1988 via presidential proclamation imposed no-take policy
• typical conservation-development divide –
implementation and enforcement difficult
Increasing awareness that ecosystem services are at risk (step2)
• Habitat for a multitude of species
• Provides Sulu Sea with fish larvae
• Appealing destination for divers
Sources: Tongson 2007, Samonte-Tan et al. 2008, Dygico 2006
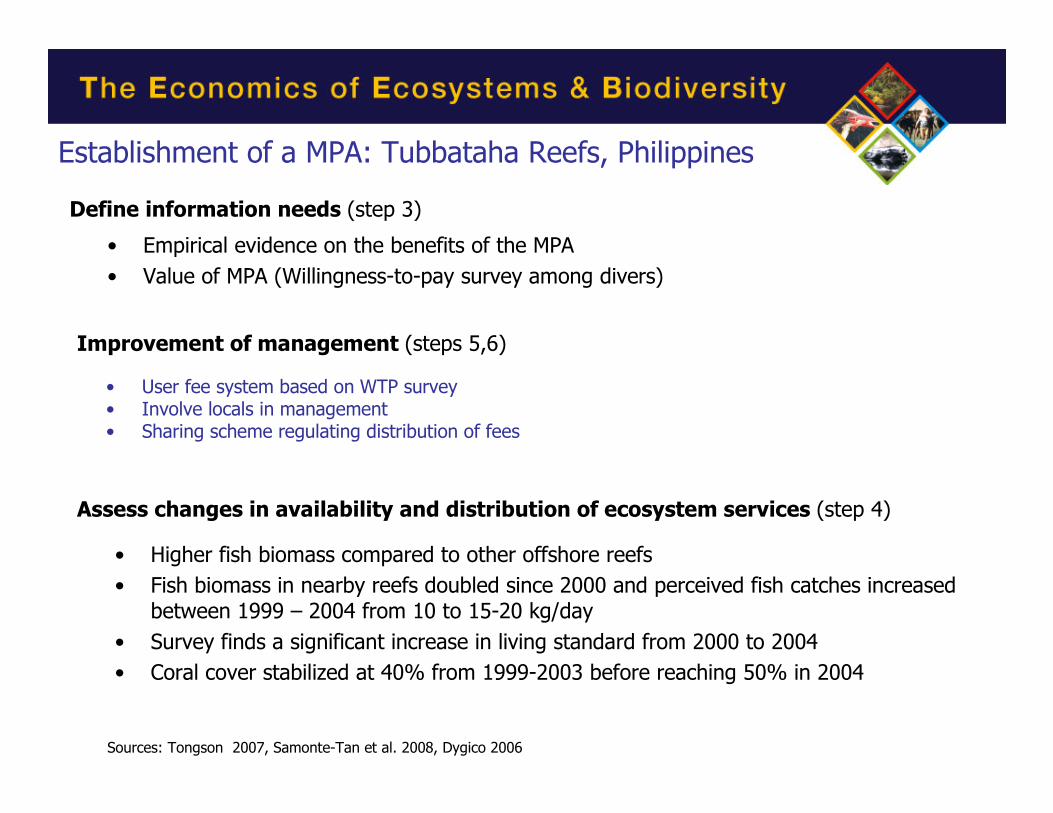
Improvement of management (steps 5,6)
• Higher fish biomass compared to other offshore reefs
• Fish biomass in nearby reefs doubled since 2000 and perceived fish catches increased between 1999 – 2004 from 10 to 15-20 kg/day
• Survey finds a significant increase in living standard from 2000 to 2004
• Coral cover stabilized at 40% from 1999-2003 before reaching 50% in 2004
• User fee system based on WTP survey• Involve locals in management• Sharing scheme regulating distribution of fees
Sources: Tongson 2007, Samonte-Tan et al. 2008, Dygico 2006
Establishment of a MPA: Tubbataha Reefs, Philippines
Define information needs (step 3)
• Empirical evidence on the benefits of the MPA
• Value of MPA (Willingness-to-pay survey among divers)
Assess changes in availability and distribution of ecosystem services (step 4)
Practical Exercise Questions – Module 3
• What category of stakeholder can promote which policy tool to address the threats you have identified before?
Stakeholders Policy tool
• What results could be achieved using the policy tools that you have identified? What are the challenges?
Policy tool Results Challenges