Embed Size (px)
Citation preview
1
Integrating the Army Geospatial Enterprise: Synchronizing Geospatial-Intelligence to the Dismounted
Soldier
by
James E. Richards
Bachelors of Science in Mechanical Engineering, United States Military Academy, 2001
Master of Science, Engineering Management, University of Missouri-Rolla, Rolla, Missouri, 2005
SUBMITTED TO THE SYSTEM DESIGN AND MANAGEMENT PROGRAM
IN PARTIAL FULFILLMENT OF THE REQUIREMENTS OF THE DEGREE OF
MASTER OF SCIENCE IN ENGINEERING AND MANAGEMENT
at the
MASSACHUSETTS INSTITUTE OF TECHNOLOGY
June 2010
The author hereby grants to MIT permission to reproduce and to distribute publicly paper and electronic
copies of this thesis document in whole or in part in any medium now known or hereafter created.

2
[This Page Intentionally Left Blank]
3
Army‘s Geospatial Architecture: delivering Geospatial-Intelligence of complex and urban terrain to the
dismounted Soldier
by
James E. Richards
ABSTRACT
The Army‘s Geospatial Enterprise (AGE) has an emerging identity and value proposition arising
from the need to synchronize geospatial information activities across the Army in order to deliver value to
military decision makers. Recently, there have been significant efforts towards increasing the capability
of the enterprise to create value for its diverse stakeholder base, ranging from the warfighter, to early
stage research and development. The AGE has many architectural alternatives to consider as it embarks
upon geospatial transformation within the Army, each of these alternatives must deliver value through an
increasingly wide range of operating environments characterized by the uncertainty of both future
technology and the evolution of future operations.
This research focuses on understanding how the Army‘s geospatial foundation data layers
propagate through the battlefield and enable well informed tactical decisions. The goal of this
investigation is to develop heuristics to guide the transformation efforts currently underway within the
Army‘s Geospatial Enterprise. A set of surveys and informal interviews with individuals in the Army
geospatial community inform the ―as-is‖ enterprise architecture. A system dynamics (SD) model is
developed to simulate the current state enterprise at the enterprise boundary, where the AGE delivers
value to the warfighters at the tactical level. Potential future state architectures are developed, simulated
in the SD model, and evaluated against a changing environment using Epoch-Era analysis.
The results do not attempt to optimize a desired future architecture for the AGE, but rather inform
decision making early in enterprise development to assist the Army geospatial leadership to understand
possible transformation trajectories. Several candidate architectures are developed and evaluated within
the context of dynamic environmental conditions. Given lower resource availability, the best
architectural choice is to focus on capturing the geospatial information obtained by Soldiers as they travel
around the area of operations, learning about the terrain from experiences and interactions with local
populations. As the level of funding increases, there is a significant jump in geospatial information if a
geospatial sensor is deployed while at the same time synchronizing information dissemination and use.
Aligning resources appropriately to a coordinated geospatial architectural approach is important to future
military operations as new technologies continue to require increased geospatial information quality.
Thesis Advisor: Donna H. Rhodes
Title: Senior Lecturer, Engineering Systems Division, Director Systems Engineering Advancement
Research Initiative
Technical Supervisor: Laura M. Major
Title: Senior Member of Technical Staff, HSC Group Leader, Charles Stark Draper Laboratory
4
Acknowledgments
There are many people to which I owe immeasurable gratitude for all that they have done over
the past year and a half. As an Army Officer, I could not have pursued this effort without the sponsorship
of COL Trainer and the Systems Engineering Department. Also, the Omar Nelson Bradley Officer
Research Fellowship was a fantastic help to my data collection efforts.
I am extremely thankful to the Charles Stark Draper Laboratory for supporting my research and
providing mentorship throughout my time at MIT. Brent Appleby and Linda Fuhrman graciously brought
me in as a Draper Lab Fellow, and I have gained so much from interactions with so many experts. I owe
a particular debt of gratitude to my thesis supervisor Laura Major. Her keen insight and unwavering
encouragement always kept me moving forward.
I am deeply thankful to Dr. Donna Rhodes, my thesis advisor, for her outstanding academic
mentorship. She patiently pulled me through research inexperience, guiding my work and providing me
focus. In at least some small way, I humbly seek to apply, and perhaps contribute to, the work that she
and colleagues in SEARI have developed over the course of several years.
In a broad sense, this work is the culmination of the past five years of my professional career. As
a newly pinned captain, I arrived at the Topographic Engineering Center, at Fort Belvoir, VA, unknowing
of the ―geospatial‖ pathway that lay before me. My two years at TEC, now the Army Geospatial Center,
were extremely rewarding, as I worked on the Buckeye Project, a mapping sensor system. Following this
assignment, I requested to command the Topographic training company, continuing to work with many of
the same individuals as I had at TEC.
Through these assignments I became well acquainted with the Army geospatial community, an
informally connected, tightly knit group of professionals from the military, government and commercial
sectors. So many of them kindly spent numerous hours answering my countless questions, while
patiently putting up with my ignorance. Though there are so many that have contributed to my work, I
am particularly grateful to Mike Powers, Mike Harper and Jason Feser for their thoughts on this topic.
I would thank my parents for their many years of support and encouragement. My wife, Cy, and
three boys, Josh, Coby and Mitch have been an unending source of inspiration over the past 18 months, it
is to them that I owe the biggest debt of thanks. They have put up with late nights and my absent
mindedness, enabling me to finish my studies and this research. They have been an amazing source of
unending love and support.
Finally, I write these words of reflection from my son‘s bedside in the Intensive Care Unit of
Boston‘s Children‘s Hospital. He is a wonderful little boy with big brown eyes and a deep soul, even
while his special needs make him susceptible to troubling ailments. His courage and determination far
outstrip my own and he has persevered through much. He has shown me that, through Christ, it is in our
weakness that we can be made strong.
As an active duty Army officer, I affirm that the views, analyses, and conclusions expressed in
this document are mine and do not reflect the official policy or position of the United States Army, the
Department of Defense, or the United States Government.
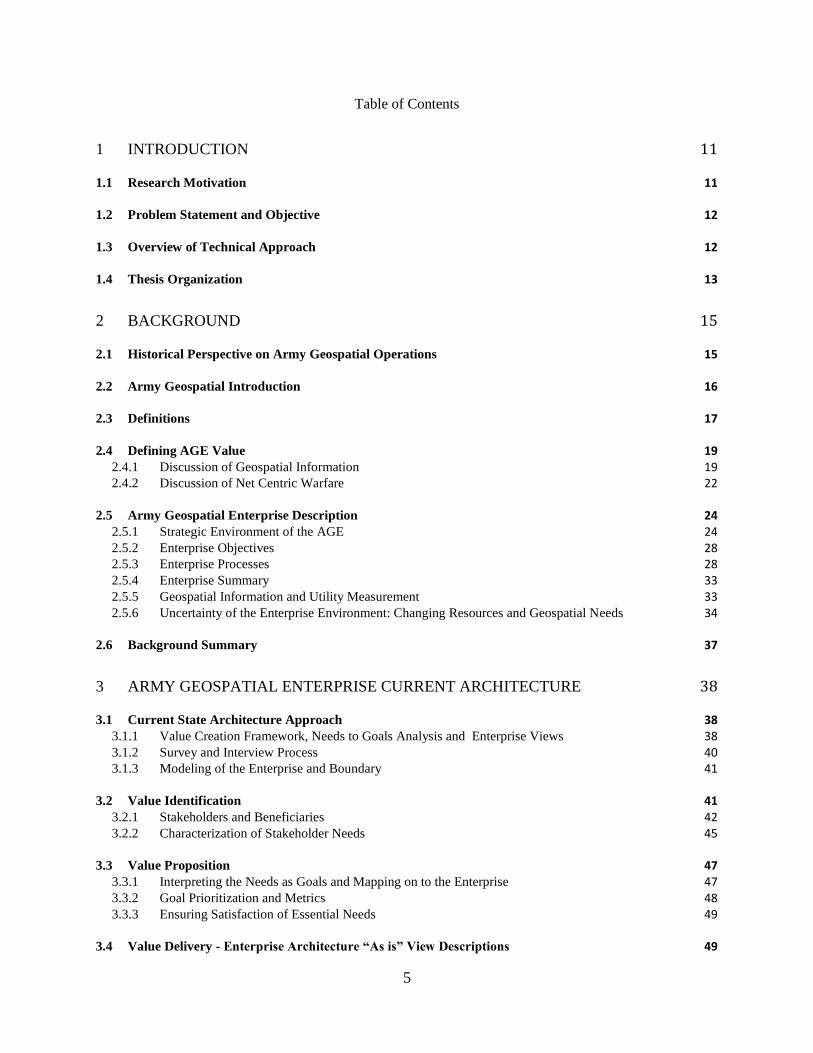
5
Table of Contents
1 INTRODUCTION 11
1.1 Research Motivation 11
1.2 Problem Statement and Objective 12
1.3 Overview of Technical Approach 12
1.4 Thesis Organization 13
2 BACKGROUND 15
2.1 Historical Perspective on Army Geospatial Operations 15
2.2 Army Geospatial Introduction 16
2.3 Definitions 17
2.4 Defining AGE Value 19 2.4.1 Discussion of Geospatial Information 19 2.4.2 Discussion of Net Centric Warfare 22
2.5 Army Geospatial Enterprise Description 24 2.5.1 Strategic Environment of the AGE 24 2.5.2 Enterprise Objectives 28 2.5.3 Enterprise Processes 28 2.5.4 Enterprise Summary 33 2.5.5 Geospatial Information and Utility Measurement 33 2.5.6 Uncertainty of the Enterprise Environment: Changing Resources and Geospatial Needs 34
2.6 Background Summary 37
3 ARMY GEOSPATIAL ENTERPRISE CURRENT ARCHITECTURE 38
3.1 Current State Architecture Approach 38 3.1.1 Value Creation Framework, Needs to Goals Analysis and Enterprise Views 38 3.1.2 Survey and Interview Process 40 3.1.3 Modeling of the Enterprise and Boundary 41
3.2 Value Identification 41 3.2.1 Stakeholders and Beneficiaries 42 3.2.2 Characterization of Stakeholder Needs 45
3.3 Value Proposition 47 3.3.1 Interpreting the Needs as Goals and Mapping on to the Enterprise 47 3.3.2 Goal Prioritization and Metrics 48 3.3.3 Ensuring Satisfaction of Essential Needs 49
3.4 Value Delivery - Enterprise Architecture “As is” View Descriptions 49
6
3.4.1 Strategy View 50 3.4.2 Policy / External Factors View 50 3.4.3 Organization View 50 3.4.4 Process View 53 3.4.5 Product and Service View 53 3.4.6 Knowledge 57 3.4.7 Information and Information Technology 58
3.5 View Interactions 58
3.6 Modeling the AGE Dynamics at the Enterprise Boundary 59 3.6.1 Description of the model 59 3.6.2 Feedback structure of the base model 60 3.6.3 Other Structural Elements of interest 62 3.6.4 Learned Terrain Data from Operations 65 3.6.5 Change of Mission – Relief in Place, Transfer of Authority (RIP TOA) 67 3.6.6 Current AGE Experimentation with Geospatial Sensors 68
3.7 Current State Summary 71
4 ANALYSIS OF ARMY GEOSPATIAL FUTURE ARCHITECTURE 72
4.1 Value Driven Design 72
4.2 Identification of Future States of Interest 73 4.2.1 Utility Function 74 4.2.2 Cost Model 74
4.3 Defining the Design Vector 75
4.4 Modeling Select Future State Alternatives 77 4.4.1 Every Soldier as Sensor: Modeling the Bottom Up Data Flow 78 4.4.2 Synch Geo - Senior Geospatial Officer, Synchronization at Each Echelon 82 4.4.3 Geospatial Sensor - Addition of sensor system at the Brigade Level 86
4.5 Hybrid Future State Alternatives 88
4.6 Epoch-Era Analysis: Dynamic Value within the Army Geospatial Enterprise 89 4.6.1 Baseline Epoch Analysis 89 4.6.2 Epoch A Analysis: Faster Change of Mission 91 4.6.3 Epoch B Analysis: More Dynamic Terrain 91 4.6.4 Epoch C Analysis: Less Dynamic Terrain 92 4.6.5 Era Analysis 93
4.7 Recommended Future State Army Geospatial Enterprise Architecture 93
4.8 Considerations for Enterprise Transformation 94
4.9 Observations from the Future State Analysis 94 4.9.1 A Portfolio Approach to the Geospatial Portion of the Information Domain 95 4.9.2 The Sensor to Shooter Link and Its Impact on Geospatial Operations 97 4.9.3 Information ―Pruning‖ 97
7
4.10 Future State Summary 98
5 CONCLUSIONS AND RECOMMENDATIONS 99
5.1 Findings and Heuristics 99 5.1.1 Considerations for Harnessing Soldier Input to the Geospatial Foundation Layer 99 5.1.2 The Potential Benefit of a Brigade Level Geospatial Sensor 99 5.1.3 The Negative Effect of Narrow Focus 100 5.1.4 Balancing Standards with User Innovation 100 5.1.5 The Architecting Effort for the AGE Will Never Be Complete 101
5.2 Future work 101 5.2.1 Additional Survey Work 101 5.2.2 Process for Evolving the Model 102
5.3 Conclusion 102
APPENDIX A: ABBREVIATIONS AND ACRONYMS 103
APPENDIX B: SURVEY QUESTIONS AND FULL RESULTS 105
APPENDIX C: ENTERPRISE BOUNDARY SYSTEM DYNAMICS MODEL 117
BIBLIOGRAPHY 124
8
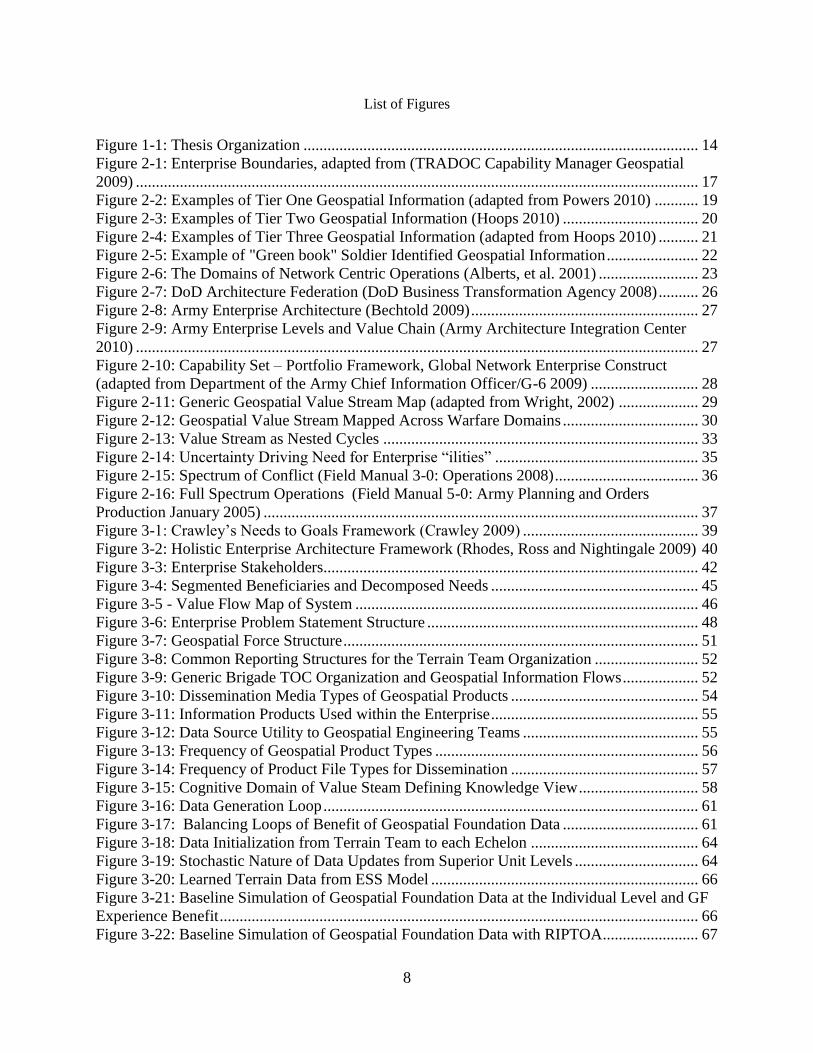
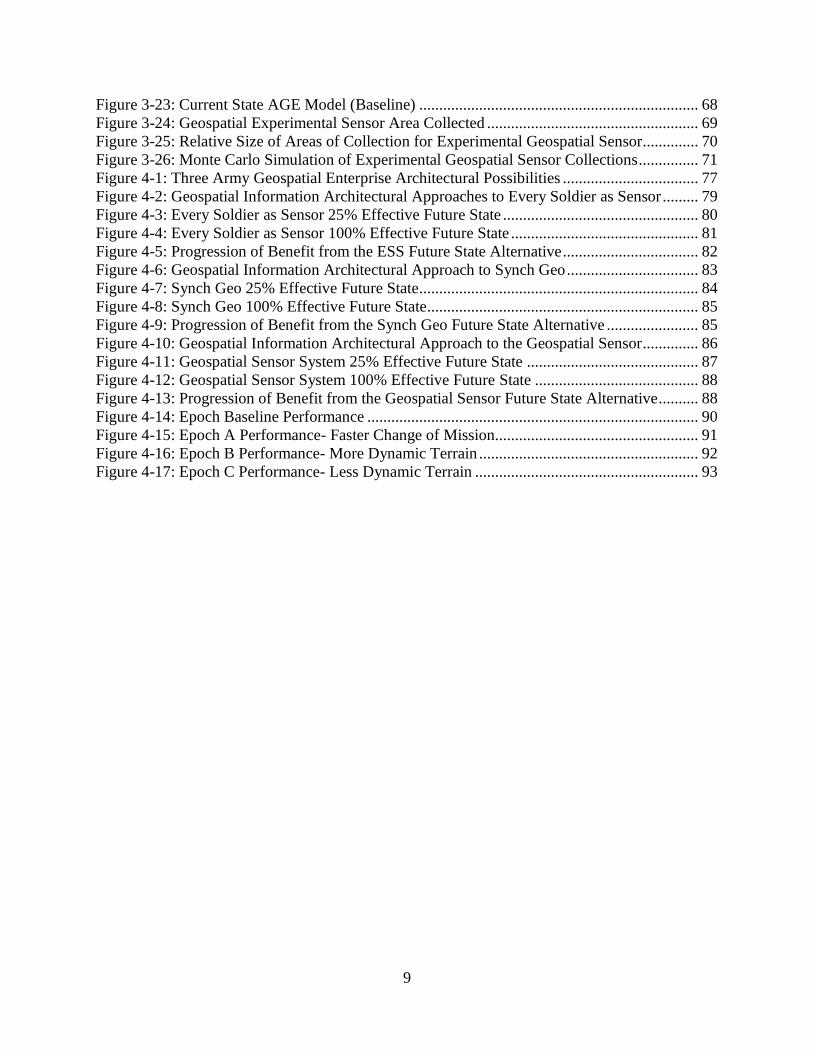
List of Figures
Figure 1-1: Thesis Organization ................................................................................................... 14 Figure 2-1: Enterprise Boundaries, adapted from (TRADOC Capability Manager Geospatial
2009) ............................................................................................................................................. 17
Figure 2-2: Examples of Tier One Geospatial Information (adapted from Powers 2010) ........... 19 Figure 2-3: Examples of Tier Two Geospatial Information (Hoops 2010) .................................. 20 Figure 2-4: Examples of Tier Three Geospatial Information (adapted from Hoops 2010) .......... 21 Figure 2-5: Example of "Green book" Soldier Identified Geospatial Information ....................... 22 Figure 2-6: The Domains of Network Centric Operations (Alberts, et al. 2001) ......................... 23
Figure 2-7: DoD Architecture Federation (DoD Business Transformation Agency 2008) .......... 26 Figure 2-8: Army Enterprise Architecture (Bechtold 2009) ......................................................... 27 Figure 2-9: Army Enterprise Levels and Value Chain (Army Architecture Integration Center
2010) ............................................................................................................................................. 27 Figure 2-10: Capability Set – Portfolio Framework, Global Network Enterprise Construct
(adapted from Department of the Army Chief Information Officer/G-6 2009) ........................... 28
Figure 2-11: Generic Geospatial Value Stream Map (adapted from Wright, 2002) .................... 29 Figure 2-12: Geospatial Value Stream Mapped Across Warfare Domains .................................. 30
Figure 2-13: Value Stream as Nested Cycles ............................................................................... 33 Figure 2-14: Uncertainty Driving Need for Enterprise ―ilities‖ ................................................... 35 Figure 2-15: Spectrum of Conflict (Field Manual 3-0: Operations 2008) .................................... 36
Figure 2-16: Full Spectrum Operations (Field Manual 5-0: Army Planning and Orders
Production January 2005) ............................................................................................................. 37
Figure 3-1: Crawley‘s Needs to Goals Framework (Crawley 2009) ............................................ 39 Figure 3-2: Holistic Enterprise Architecture Framework (Rhodes, Ross and Nightingale 2009) 40 Figure 3-3: Enterprise Stakeholders.............................................................................................. 42
Figure 3-4: Segmented Beneficiaries and Decomposed Needs .................................................... 45 Figure 3-5 - Value Flow Map of System ...................................................................................... 46
Figure 3-6: Enterprise Problem Statement Structure .................................................................... 48 Figure 3-7: Geospatial Force Structure ......................................................................................... 51
Figure 3-8: Common Reporting Structures for the Terrain Team Organization .......................... 52 Figure 3-9: Generic Brigade TOC Organization and Geospatial Information Flows ................... 52 Figure 3-10: Dissemination Media Types of Geospatial Products ............................................... 54
Figure 3-11: Information Products Used within the Enterprise .................................................... 55 Figure 3-12: Data Source Utility to Geospatial Engineering Teams ............................................ 55 Figure 3-13: Frequency of Geospatial Product Types .................................................................. 56 Figure 3-14: Frequency of Product File Types for Dissemination ............................................... 57 Figure 3-15: Cognitive Domain of Value Steam Defining Knowledge View .............................. 58
Figure 3-16: Data Generation Loop .............................................................................................. 61 Figure 3-17: Balancing Loops of Benefit of Geospatial Foundation Data .................................. 61 Figure 3-18: Data Initialization from Terrain Team to each Echelon .......................................... 64 Figure 3-19: Stochastic Nature of Data Updates from Superior Unit Levels ............................... 64
Figure 3-20: Learned Terrain Data from ESS Model ................................................................... 66 Figure 3-21: Baseline Simulation of Geospatial Foundation Data at the Individual Level and GF
Experience Benefit ........................................................................................................................ 66 Figure 3-22: Baseline Simulation of Geospatial Foundation Data with RIPTOA........................ 67
9
Figure 3-23: Current State AGE Model (Baseline) ...................................................................... 68
Figure 3-24: Geospatial Experimental Sensor Area Collected ..................................................... 69 Figure 3-25: Relative Size of Areas of Collection for Experimental Geospatial Sensor .............. 70 Figure 3-26: Monte Carlo Simulation of Experimental Geospatial Sensor Collections ............... 71
Figure 4-1: Three Army Geospatial Enterprise Architectural Possibilities .................................. 77 Figure 4-2: Geospatial Information Architectural Approaches to Every Soldier as Sensor ......... 79 Figure 4-3: Every Soldier as Sensor 25% Effective Future State ................................................. 80 Figure 4-4: Every Soldier as Sensor 100% Effective Future State ............................................... 81 Figure 4-5: Progression of Benefit from the ESS Future State Alternative .................................. 82
Figure 4-6: Geospatial Information Architectural Approach to Synch Geo ................................. 83 Figure 4-7: Synch Geo 25% Effective Future State ...................................................................... 84 Figure 4-8: Synch Geo 100% Effective Future State.................................................................... 85 Figure 4-9: Progression of Benefit from the Synch Geo Future State Alternative ....................... 85
Figure 4-10: Geospatial Information Architectural Approach to the Geospatial Sensor .............. 86 Figure 4-11: Geospatial Sensor System 25% Effective Future State ........................................... 87
Figure 4-12: Geospatial Sensor System 100% Effective Future State ......................................... 88 Figure 4-13: Progression of Benefit from the Geospatial Sensor Future State Alternative .......... 88 Figure 4-14: Epoch Baseline Performance ................................................................................... 90
Figure 4-15: Epoch A Performance- Faster Change of Mission................................................... 91 Figure 4-16: Epoch B Performance- More Dynamic Terrain ....................................................... 92
Figure 4-17: Epoch C Performance- Less Dynamic Terrain ........................................................ 93
10
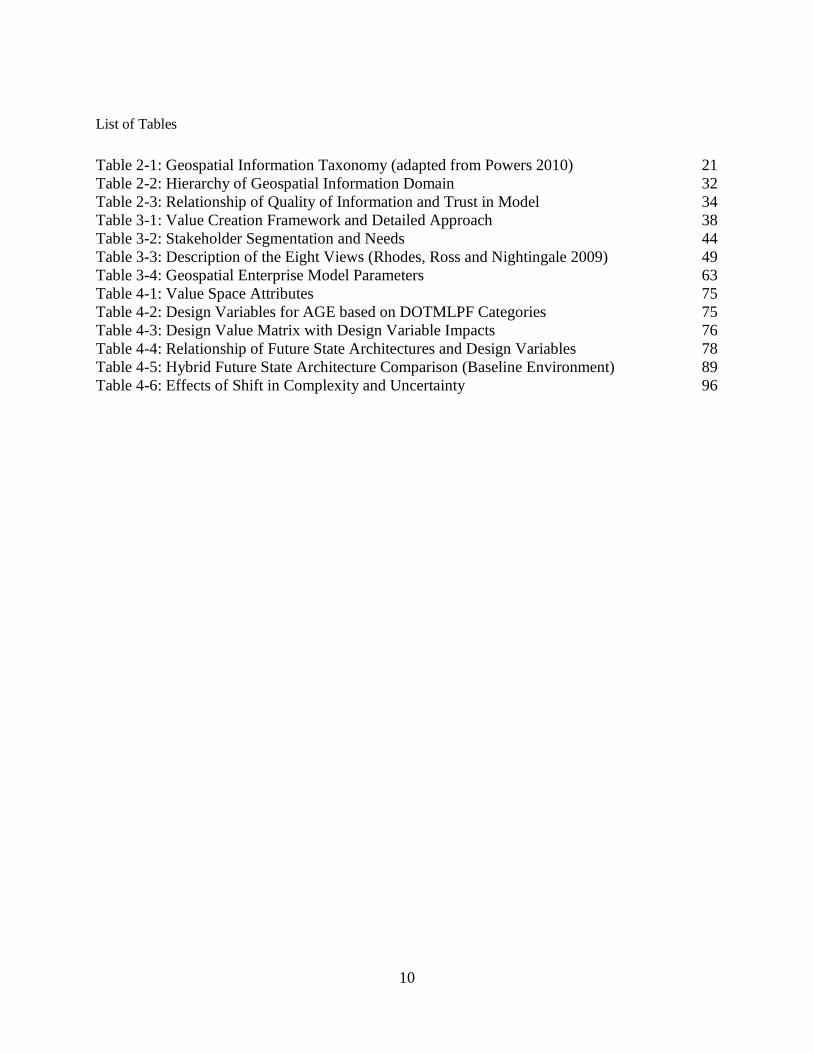
List of Tables
Table 2-1: Geospatial Information Taxonomy (adapted from Powers 2010) 21 Table 2-2: Hierarchy of Geospatial Information Domain 32
Table 2-3: Relationship of Quality of Information and Trust in Model 34 Table 3-1: Value Creation Framework and Detailed Approach 38 Table 3-2: Stakeholder Segmentation and Needs 44 Table 3-3: Description of the Eight Views (Rhodes, Ross and Nightingale 2009) 49 Table 3-4: Geospatial Enterprise Model Parameters 63
Table 4-1: Value Space Attributes 75 Table 4-2: Design Variables for AGE based on DOTMLPF Categories 75 Table 4-3: Design Value Matrix with Design Variable Impacts 76
Table 4-4: Relationship of Future State Architectures and Design Variables 78 Table 4-5: Hybrid Future State Architecture Comparison (Baseline Environment) 89 Table 4-6: Effects of Shift in Complexity and Uncertainty 96
11
1 Introduction
In this thesis, a general framework for the United States Army Geospatial Enterprise (AGE) is
developed and applied to inform the design of the geospatial system. The focus is on value delivery by
the Geospatial Foundation (GF) layer at the edge of the enterprise, at the Brigade level and below. This
chapter describes the research motivation, gives the problem statement, and provides an overview of the
technical approach and methods employed.
1.1 Research Motivation
One mission of the Army Corps of Engineers is to provide topographic support to maneuver
operations. Typically, this data is used for two purposes, either as a part of the deliberate planning cycle
of a commander and his staff, or as a reference for situational awareness of a Soldier operating in the
battlespace during mission execution. The sources of geospatial data vary widely, from spaced based
satellite systems, to contextual data obtained from a dismounted foot patrol. The system that unites these
data producers and data consumers (some of whom are the same individuals, separated in time) has been
evolving quickly since the start of the Global War on Terrorism. In many of the current operations, the
size of the enemy has decreased from kilometers of linear frontage to a single individual moving quickly
in complex and urban terrain. Enemy tactics in the Contemporary Operating Environment (COE) have
taken on asymmetric characteristics, where the weaker actor moves in and out of the civilian population
making them more difficult to identify and attack. With these changes, the spatial and temporal
resolution needs of mission planners and operating Soldiers has increased as well. These demands
continue to stress the geospatial information system in manpower, equipment, technology and
information quality requirements.
The Army has started to adapt to the new environment by changing access to topographic support
through modular transformation. Within the legacy Army structure, topographic support would flow
from Corps level topographic battalions, down through a hierarchical structure to the users at the battalion
level and below. In the newly established modular Army structure, the topographic battalions are
disbanded and the topographic assets are attached to brigade headquarters in order to better equip these
smaller, ―modular‖ units to operate independently. With this new structure, there arises a difficulty to
synchronize geospatial operations, and to leverage economies of scale for data production and storage.
Also, the new structure presents many opportunities for increased dissemination of data to lower levels of
the force structure, as well as leveraging the collection activities of the Soldiers themselves at those lower
levels and back up each echelon, similar in concept to the Army Deputy Chief of Staff for Intelligence
program ―Every Soldier a Sensor‖ (ESS or ES2.) But the current enterprise leaves much of this valuable
information out of the geospatial foundation layer. Routinely, information is lost within the enterprise,
Soldiers are left saying, ―someone knew that the terrain had changed, but my map did not show the
update, so I had no idea.‖
12
1.2 Problem Statement and Objective
It is the goal of this research to illuminate the effects of design decisions of the Army geospatial
enterprise upon the lowest echelons of the force. The goal has three parts: 1) to determine the impact of
the geospatial system on ―tactical decisions makers‖ at the brigade level and below 2) to determine the
most efficient Army Geospatial Enterprise design for, collection, storage, analysis, and dissemination, and
3) to determine the future state architecture that the enterprise should pursue.
The objective of this research is to investigate how Enterprise Architecting (EA) and Epoch-Era
thinking may better inform Army Geospatial Enterprise development. This thesis seeks to provide a
structured approach to holistic thinking for AGE decision makers to understand the current state of the
enterprise, as well as the impact a series of architectural changes might have on enterprise performance.
These candidate future state architectures can then be compared using Epoch-Era analysis to determine
value delivery over several possible future sets of environmental conditions.
1.3 Overview of Technical Approach
Two methods of data collection will be used to determine the requirements and the utility of
geospatial data. A survey of MOS 21U and 215D (geospatial engineer Soldiers) conducted in conjunction
with interviews of community leaders located at the Army Geospatial Center (Fort Belvoir, VA). Also,
literature reviews of the Army Engineer School, Army Maneuver Center, Army Intelligence Center,
National Geospatial Intelligence Agency (NGA) and Joint Staff publications will provide insight into the
needs of each of these stakeholders.
System Dynamics (SD) and Enterprise Architecture (EA) methods are used to formulate several
―future state‖ architectural alternatives for the enterprise which maximize the utility of geospatial
information to the users. Then, these options are evaluated within a value creation framework over a
changing set of environmental conditions. The future state alternatives seek to achieve a value robust
enterprise which ―will continue to perform well in the face of changing operational environments and a
dynamic context‖ (Ross and Rhodes 2008). The value will be defined by the preference attributes of the
enterprise stakeholders, and the environment will include both ―upstream‖ factors such as technology and
resources, as well as ―downstream‖ factors such as the tactical operating environment of deployed
military forces.
The choice of low fidelity models aimed at a holistic picture of the Army‘s Geospatial Enterprise is
intentional, though not without drawbacks. Several aggregations of stakeholder preferences and detail
simplification were necessary, although the high level view decreases the chances of sub- optimization of
components of the enterprise. It encompasses both ―doing the right things‖ and ―doing those things
right.‖ The focus of this research is to determine what the right things are, enlightening the design efforts
of the architecture currently ongoing within the Army Geospatial Center (AGC) and at other locations.
The most leverage that management has within the system design process is at the beginning of the
process, within concept development. As high level decisions are made, typically in the absence of
detailed knowledge of the impact of the decisions, lifecycle costs are quickly committed sometimes
toward a faulty concept. These relatively uninformed decisions determine much of the utility of the
system to include system performance within an evolving environment, changing both tactical
applications, as well as the technological environment the system operates within. Therefore, the need to
13
provide as much knowledge about the effects of design decisions as early as possible in the architecting
effort is critical.
Research Approach:
1) Identify the current geospatial information needs of battalion level commanders and their staff
2) Identify the current geospatial information needs of dismounted Soldiers operating in complex
and urban terrain
3) Assess the information sources and interactions within the Army geospatial system needed to
meet the data requirements of the battalion level Tactical Operations Center (TOC) and
subordinate units
4) Analyze current approaches and determine the costs and relative value delivered by each method
5) Determine the impact of the above approaches on the Army DOTLMPF (Doctrine, Organizations,
Training, Leader Development, Materiel, Personnel and Facilities)
6) Evaluate potential future state AGE architecture performance against changing environmental
conditions
1.4 Thesis Organization
Chapter 2 provides a background discussion of the history of Army geospatial operations and an
introduction to the Army Geospatial Enterprise delineating enterprise boundaries. This is followed by the
methods and foundation of the approach for this research. Chapter 2 also briefly defines the key terms
used throughout the rest of the thesis.
Chapter 3 describes the current state of the Army Geospatial Enterprise. A value-creation
framework is combined with eight views into the enterprise architecture to enable a complete view of the
AGE. The chapter begins with value identification and an extensive stakeholder analysis for the AGE.
This analysis is the foundation for the ―needs to goals‖ framework, which takes the outcome of the
stakeholder analysis and produces goals that the enterprise must achieve to be successful across the entire
set of stakeholders. The value proposition is defined in its current state. And finally the eight views of
enterprise architectures are used to define the current state value delivery. The results from an extensive
survey of the Army Geospatial Community are applied to create and validate the value creation
framework. Finally a system dynamics model of the AGE boundary is introduced and evaluated to
provide a current state baseline. The model provides the basis for future state analysis in chapter four.
Chapter 4 develops a value driven design for potential future states of the Army Geospatial
Enterprise. Value driven design evaluates the possible design variables for the enterprise, the ―knobs‖
that enterprise leadership can control with the attributes of the stakeholders. This allows further analysis
and study to focus alternatives on the areas that have the greatest chance of creating value. This approach
increases the creativity within the future state architecture alternatives. Three future state alternatives are
then modeled in more detail using the system dynamics AGE boundary model developed in chapter three.
The results of this analysis are used to draw conclusions for enterprise transformation efforts.
Chapter 5 concludes the discussion with a set of heuristics for transforming the Army Geospatial
Enterprise based on the current state and future state alternatives investigated and modeled in chapters
14
three and four. The heuristics help to focus the architecture efforts of AGE organizations and help
prioritize the limited resources within the Army Geospatial community. The chapter ends with a
discussion of future work within the research area of the AGE.
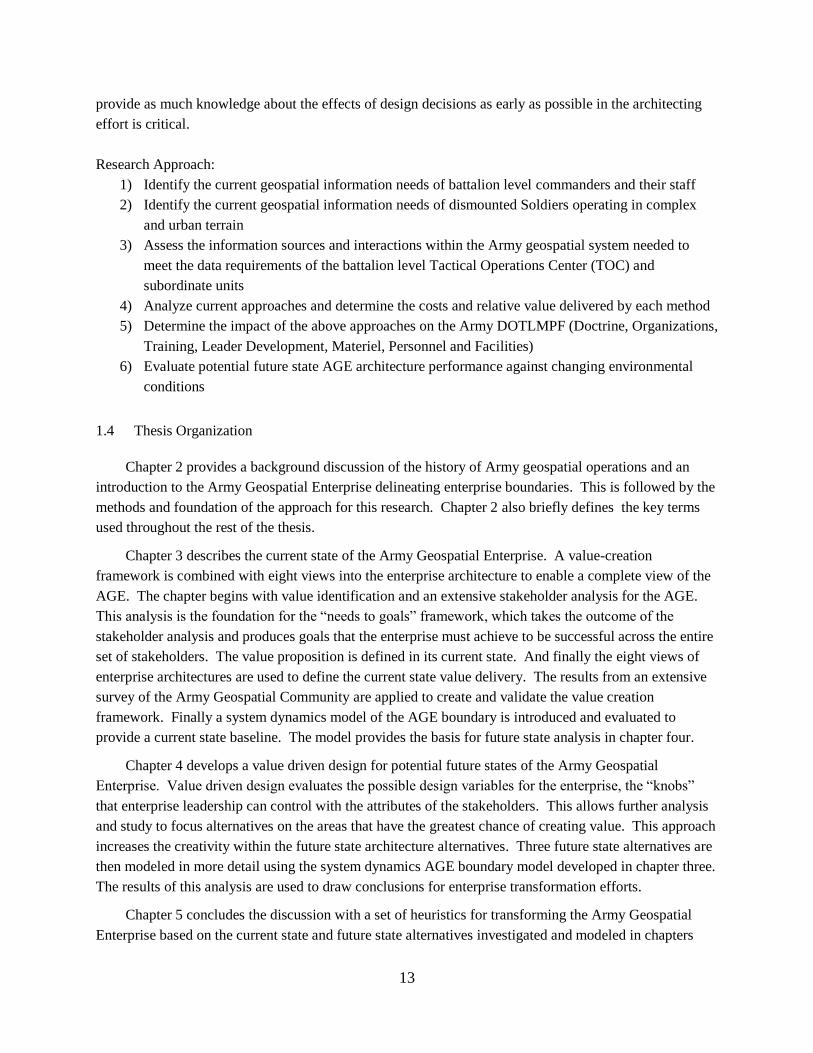
The figure below summarizes the general approach of the research and how the approach fits into the
organization of the thesis. As the figure demonstrates, there are several points which lend themselves to
iterations of the approach in order to yield better fidelity of the model as well as a more complete picture
of the values of the stakeholders.
Figure 1-1: Thesis Organization
15
2 Background
This chapter provides a background discussion of the history of Army geospatial operations. It
provides an introduction to the Army Geospatial Enterprise delineating enterprise boundaries. This is
followed by the methods and foundation of the approach for this research. Chapter 2 also provides a brief
overview of the key terms used throughout the rest of the thesis.
2.1 Historical Perspective on Army Geospatial Operations
Throughout history terrain has played a defining role in the outcome of armed conflict. Clever
exploitation of the terrain allows an inferior force to defeat a more powerful enemy, while ignorance of
the battlefield effects of terrain quickly nullify combat power. Sun Tzu states in the Art of War, "If you
know the enemy and know yourself, your victory will not stand in doubt; if you know Heaven [weather]
and know Earth [terrain], you may make your victory complete" (Sun Tzu 1910)
Clausewitz, another famous military thinker, observes ―Finally, the general unreliability of all
information presents a special problem in war: all action takes place, so to speak, in a kind of twilight,
which, like fog or moonlight, often tends to make things seem grotesque and larger than they really are.
Whatever is hidden from full view in this feeble light has to be guessed at by talent, or simply left to
chance. So once again for lack of objective knowledge one has to trust to talent or to luck‖ (Clausewitz
1976). The Army Geospatial Enterprise seeks to increase understanding surrounding the uncertainty of
the terrain so often hidden from view.
The origin of the topographic field within the Army Corps of Engineers began with Gen. Robert
Erskin, the first topographer of the Army during the Revolutionary War. Following the Revolution,
Army topographers conducted exploration and mapping missions of the newly added western territory of
the United States. The Army Map Service (AMS) continued the mapping tradition, providing maps for
operations around the world, including hundreds of millions of map sheets in support of World War II
(Escape Maps 2010). In 1972, a major reorganization of many Department of Defense cartographic
agencies combined them into the Defense Mapping Agency. Again, reorganization transformed the DMA
into the National Imagery and Mapping Agency (NIMA), combining imagery work with traditional
cartographic mapping to gain efficiencies between the two efforts. The current organization is the
National Geospatial-Intelligence Agency (NGA.) Throughout these reorganizations the Army retained
geospatial capability, both in the Corps of Engineers and the Intelligence branches.
Since the early 1990s, digital information systems have revolutionized map production, storage
and dissemination industries. Geographic Information Systems (GIS) proliferate the daily lives of
millions of people though handheld devices and the Internet. The Army continues to incorporate
emerging technologies into geospatial operations. Some of these technologies include sensors, automated
extraction and terrain reasoning algorithms, and interaction with modeling simulation and training. One
of the latest efforts is the way in which geospatial information support network centric operations.
16
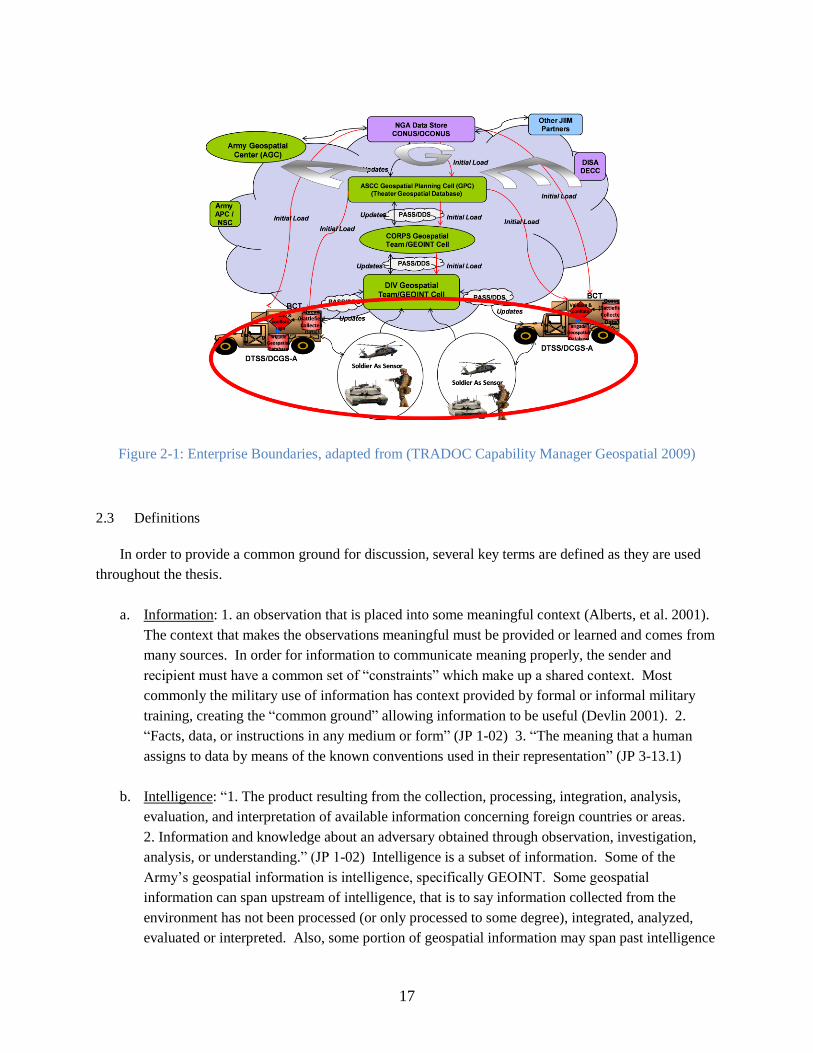
2.2 Army Geospatial Introduction
The Army Geospatial Enterprise delivers information about the environment (battlespace) to
decision makers on the battlefield. The enterprise consists of ―the personnel, units, systems, platforms,
and processes that use, produce, store or manage geospatial data which can potentially be shared for
operational purposes‖ (TRADOC Capability Manager Geospatial 2009). The enterprise resides inside the
Army Battle Command (BC) enterprise, but interacts with all of the warfighting functions. The enterprise
uses ground based and airborne sensors, including technical and human methods to understand the terrain.
The enterprise analyzes the terrain through human analysts as well as by means of some use of automated
terrain reasoning algorithms. Much of the enterprise resides in an information technology infrastructure
of networks and databases at many echelons and locations around the world. The enterprise boundaries
are critical to establish the scope of the enterprise and thereby the identity of the stakeholders. For the
purpose of this analysis the enterprise boundary is defined by the entities that the Army Geospatial
Governance Board (GGB) has direct control over. The enterprise is directly responsible for the ―mental
models‖ of terrain that enable informed tactical decision making. This innovative definition allows a
slightly broader enterprise definition than previously utilized by others within the geospatial community.
The problem with drawing the boundary before the cognitive domain of the tactical decision maker is that
it risks the mentality that the purpose of the AGE is to produce ―cool‖ products, independent of whether
those products truly impact the understanding of the Soldiers operating in the battlespace.
The question of who should have access to what information is not trivial. It is a significant
architectural design issue. The logical conclusion of a network centric warfare purist might entail all
information being available to all nodes of the network instantaneously. But this may not be the most
beneficial architecture operationally. The type and quantity of geospatial information made available is
tempered by the cognitive limitations of the human battlefield decision makers.
17
Figure 2-1: Enterprise Boundaries, adapted from (TRADOC Capability Manager Geospatial 2009)
2.3 Definitions
In order to provide a common ground for discussion, several key terms are defined as they are used
throughout the thesis.
a. Information: 1. an observation that is placed into some meaningful context (Alberts, et al. 2001).
The context that makes the observations meaningful must be provided or learned and comes from
many sources. In order for information to communicate meaning properly, the sender and
recipient must have a common set of ―constraints‖ which make up a shared context. Most
commonly the military use of information has context provided by formal or informal military
training, creating the ―common ground‖ allowing information to be useful (Devlin 2001). 2.
―Facts, data, or instructions in any medium or form‖ (JP 1-02) 3. ―The meaning that a human
assigns to data by means of the known conventions used in their representation‖ (JP 3-13.1)
b. Intelligence: ―1. The product resulting from the collection, processing, integration, analysis,
evaluation, and interpretation of available information concerning foreign countries or areas.
2. Information and knowledge about an adversary obtained through observation, investigation,
analysis, or understanding.‖ (JP 1-02) Intelligence is a subset of information. Some of the
Army‘s geospatial information is intelligence, specifically GEOINT. Some geospatial
information can span upstream of intelligence, that is to say information collected from the
environment has not been processed (or only processed to some degree), integrated, analyzed,
evaluated or interpreted. Also, some portion of geospatial information may span past intelligence
18
into information for operations, such as operational graphics including key terrain or some other
terrain information, such as friendly obstacle emplacement or avenues of approach.
c. Geospatial intelligence (GEOINT): ―Geospatial intelligence (GEOINT) supports joint forces in
their ability to rapidly respond to threats around the world by providing geo-referenced visual and
data products that serve as a foundation and common frame of reference for any joint operation.
GEOINT is the exploitation and analysis of imagery and geospatial information to describe,
assess, and visually depict physical features and geographically referenced activities on the Earth.
GEOINT consists of imagery, imagery intelligence (IMINT), and geospatial information.‖ (JP 1-
02)
d. Geospatial information: is information (as defined above) ―that identifies the geographic location
and characteristics of natural or constructed features and boundaries on the Earth, including:
statistical data and information derived from, among other things, remote sensing, mapping, and
surveying technologies; and mapping, charting, geodetic data and related products.‖ (TRADOC
Capability Manager Geospatial 2009) Army geospatial information can be classified into two
primary groups, the geospatial foundation data (GF) and the layers of information that reside on
top of the foundation layer.
Geospatial information can also be classified into two categories based on who is generating or
using the information. If the information is generated or used at the strategic level of war, this is
termed ―national‖ information. If the information is generated or used at the tactical level of war,
this is ―tactical‖ information. Geospatial data is used synonymously with geospatial information
(within this thesis), though there may be an implication that ―data‖ refer to digitally stored
information which has not be processed or analyzed.
e. Geospatial Foundation Data (GF): ―results from storing, managing, and collecting all
operationally relevant spatial and temporal data in standardized, distributed geospatial databases
which then enable sharing, correlation, and fusing of data across the Army, from all six War
Fighting Functions (WFF.) GF data is collected from NGA, JIIM partners and commercial
sources. The GF data will be replicated from Army GPCs to the Corps, Division, and BCTs to
support the building of the COP. WFF geo-enabled applications will build data layers upon the
GF.‖ (TRADOC Capability Manager Geospatial 2009) The geospatial foundation data layer is a
subset of the geospatial information available to the brigade.
f. Enterprise Architecture (EA): ―applying holistic thinking to conceptually design, evaluate and
select a preferred structure for a future state enterprise to realize its value proposition and desired
behaviors‖ (Rhodes, Ross and Nightingale 2009). EA seeks to understand the complex
interactions of the various perspectives of the enterprise and leverage these interactions to deliver
greater value for the stakeholders of the enterprise.
g. Information quality: in essence, the usefulness of the information. Alberts et al. (2002) identify
five dimensions of information quality: completeness, correctness, currency, accuracy or level of
19
precision, and consistency. Another term for quality is the ―richness‖ of the information. The
value of information is a function of quality and frequency of use (or equivalently, richness and
reach). Together quality and frequency of use determine the value of the information to the
enterprise.
2.4 Defining AGE Value
Information that creates sound tactical knowledge in the mind of the planning staff and operators is
the overall goal of the enterprise. The knowledge of the terrain that enables the most effective tactical
decisions is conveyed through the geospatial foundation layer and additional layers (or overlays)
contributed from across the Warfighting Functions (WFFs.) In order to properly deal with the concepts of
data, information and knowledge, each of these will be defined and applied to the Army Geospatial
example.
2.4.1 Discussion of Geospatial Information
A brief discussion of a theoretical foundation of information is necessary in order to understand how
geospatial information flows within the enterprise. Some of the foundational terms are defined above in
Section 2.3, but a short description here, in order to build common perspective, is helpful. Within the
geospatial context, the information domain is an abstraction layer between the physical world and the
cognitive world. It consists of data at its lowest level through natural language at the highest level.
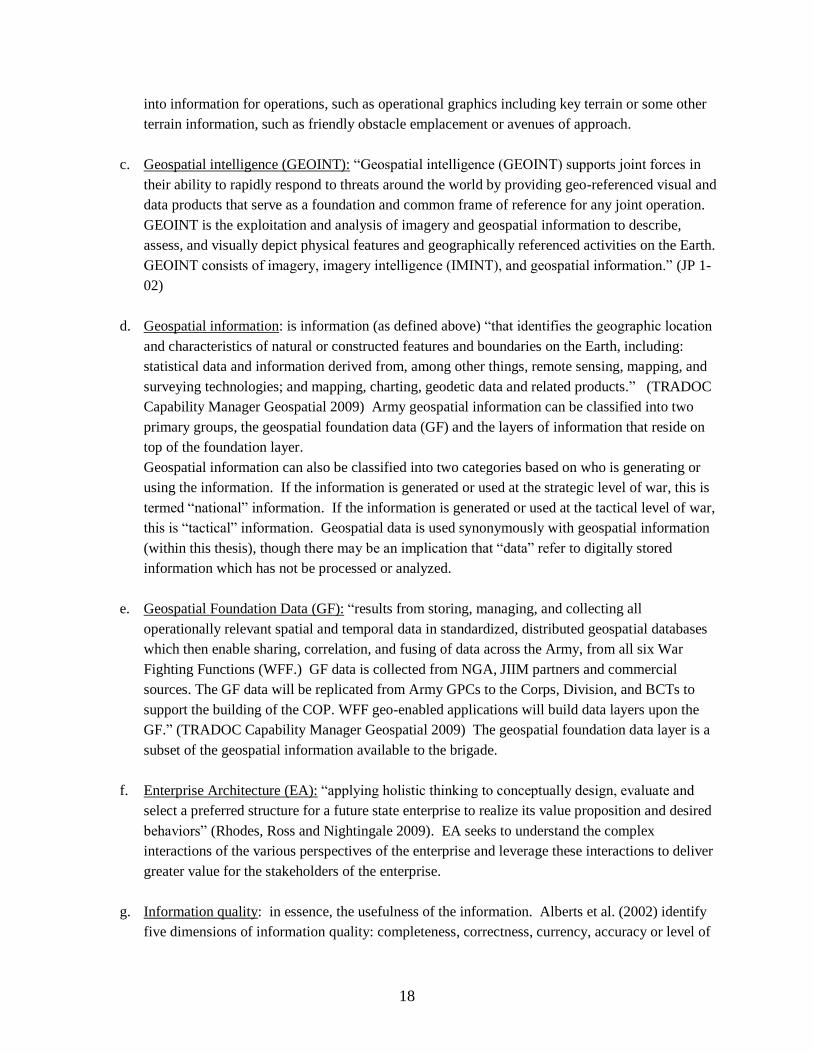
The lowest level of the foundation data is the elevation data. This data set provides the geometry of
the battlefield, a fundamental characteristic of the terrain. Once the geometry of the terrain is known, at
least with some degree of fidelity, the characteristics of that surface may be of interest., for example, the
color and surface properties, or image of the terrain. Traditional topographic maps capture both of these
characteristics as elevation contours and features, such as forests, roads, water, etc. This type of
information usually lasts for months, given that the environment does not change drastically during that
time, for example, kinetic operations in urban terrain might quickly and significantly change the
landscape making even Tier One data obsolete.
Figure 2-2: Examples of Tier One Geospatial Information (adapted from Powers 2010)
20
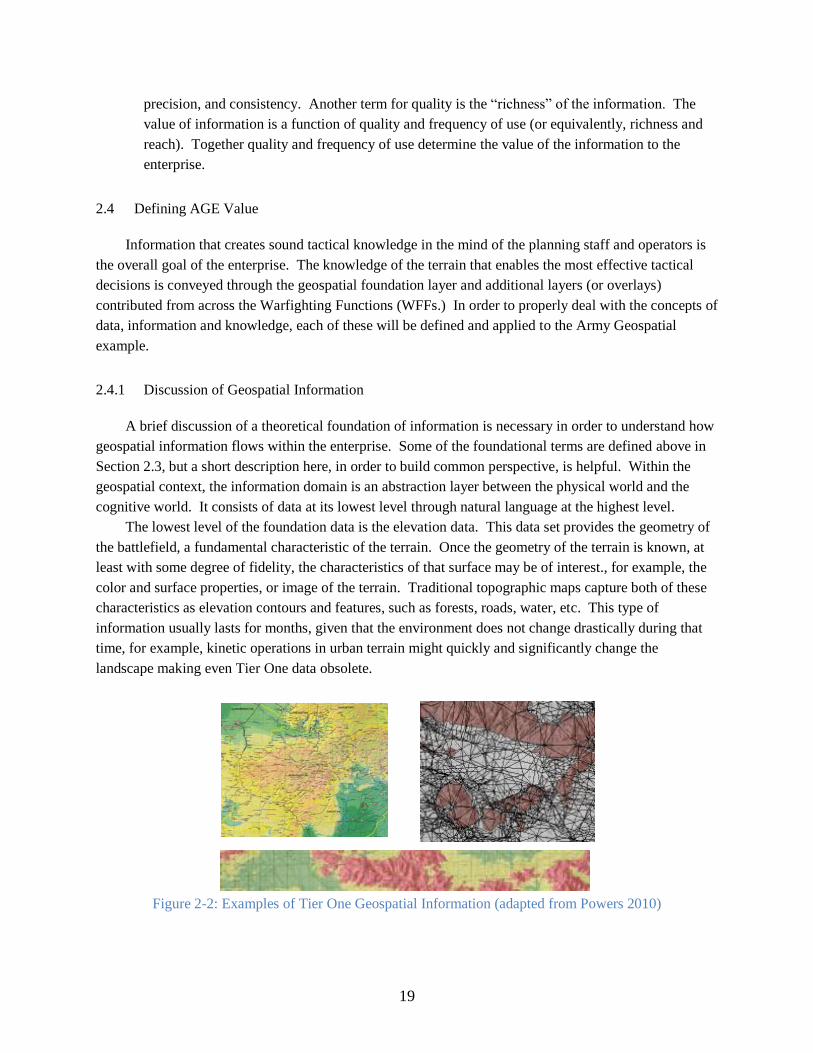
The mission focused information, Tier Two, is information that has been tailored to the type of
missions being conducted. These consist of typical terrain products such as line of sight products, view
sheds, and route studies. Their usefulness extends over a set of tactical needs on a given set of terrain, but
would change as the mission type changes, such as a transition from counter insurgency operations, to
peace keeping operations for example.
Figure 2-3: Examples of Tier Two Geospatial Information (Hoops 2010)
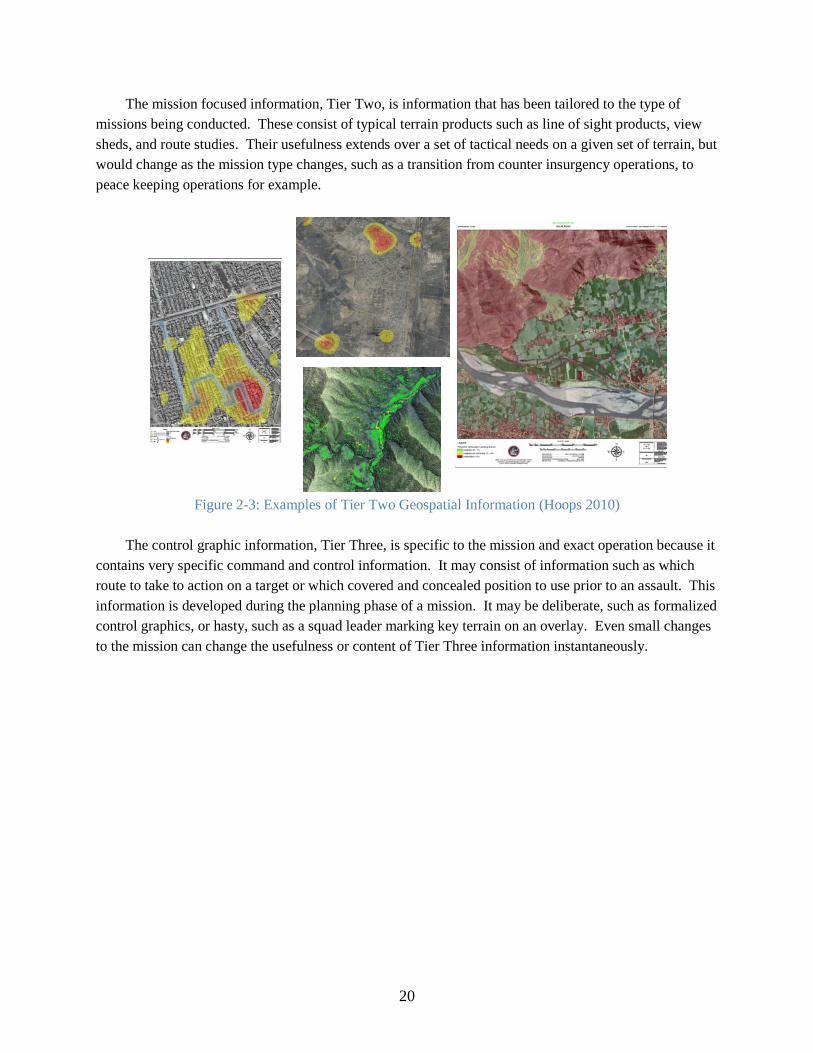
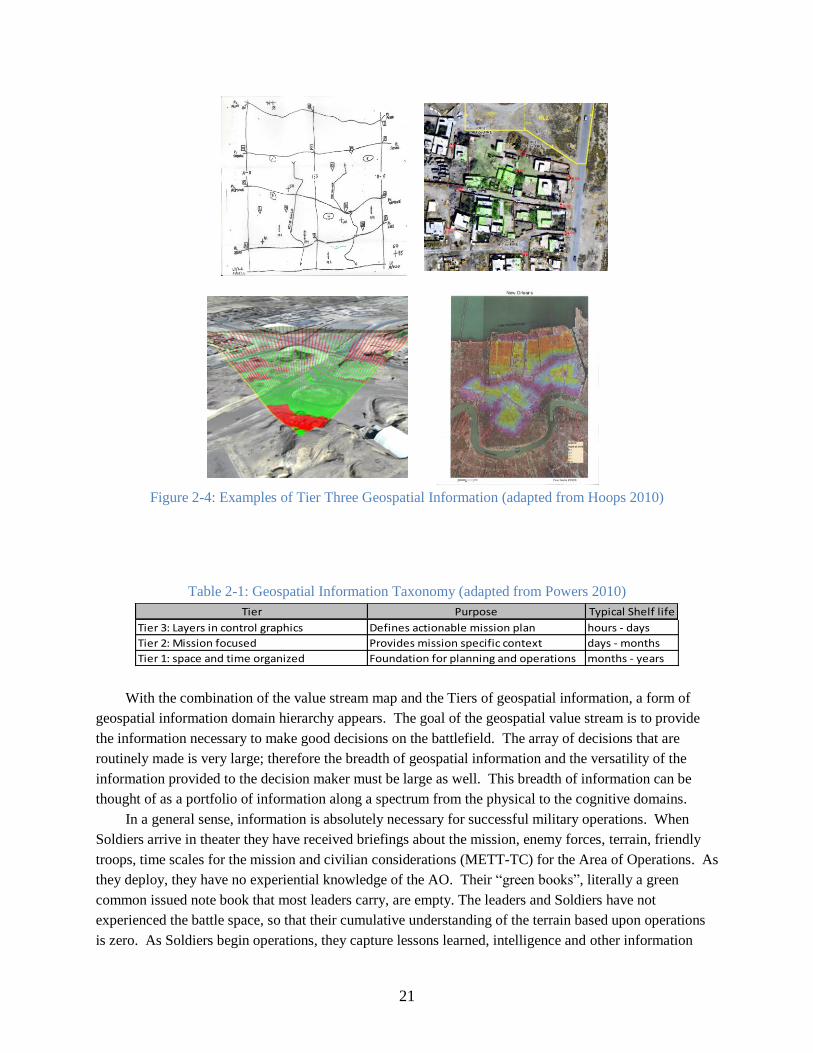
The control graphic information, Tier Three, is specific to the mission and exact operation because it
contains very specific command and control information. It may consist of information such as which
route to take to action on a target or which covered and concealed position to use prior to an assault. This
information is developed during the planning phase of a mission. It may be deliberate, such as formalized
control graphics, or hasty, such as a squad leader marking key terrain on an overlay. Even small changes
to the mission can change the usefulness or content of Tier Three information instantaneously.
21
Figure 2-4: Examples of Tier Three Geospatial Information (adapted from Hoops 2010)
Table 2-1: Geospatial Information Taxonomy (adapted from Powers 2010)
Tier Purpose Typical Shelf life
Tier 3: Layers in control graphics Defines actionable mission plan hours - days
Tier 2: Mission focused Provides mission specific context days - months
Tier 1: space and time organized Foundation for planning and operations months - years
With the combination of the value stream map and the Tiers of geospatial information, a form of
geospatial information domain hierarchy appears. The goal of the geospatial value stream is to provide
the information necessary to make good decisions on the battlefield. The array of decisions that are
routinely made is very large; therefore the breadth of geospatial information and the versatility of the
information provided to the decision maker must be large as well. This breadth of information can be
thought of as a portfolio of information along a spectrum from the physical to the cognitive domains.
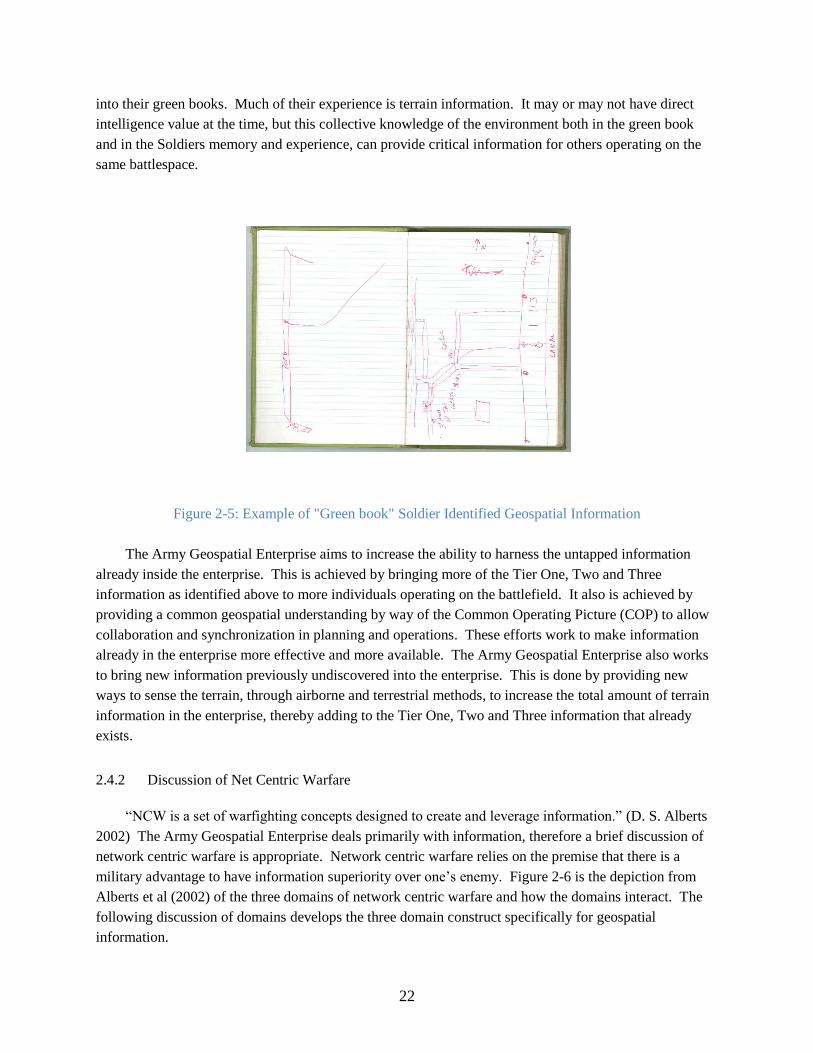
In a general sense, information is absolutely necessary for successful military operations. When
Soldiers arrive in theater they have received briefings about the mission, enemy forces, terrain, friendly
troops, time scales for the mission and civilian considerations (METT-TC) for the Area of Operations. As
they deploy, they have no experiential knowledge of the AO. Their ―green books‖, literally a green
common issued note book that most leaders carry, are empty. The leaders and Soldiers have not
experienced the battle space, so that their cumulative understanding of the terrain based upon operations
is zero. As Soldiers begin operations, they capture lessons learned, intelligence and other information
22
into their green books. Much of their experience is terrain information. It may or may not have direct
intelligence value at the time, but this collective knowledge of the environment both in the green book
and in the Soldiers memory and experience, can provide critical information for others operating on the
same battlespace.
Figure 2-5: Example of "Green book" Soldier Identified Geospatial Information
The Army Geospatial Enterprise aims to increase the ability to harness the untapped information
already inside the enterprise. This is achieved by bringing more of the Tier One, Two and Three
information as identified above to more individuals operating on the battlefield. It also is achieved by
providing a common geospatial understanding by way of the Common Operating Picture (COP) to allow
collaboration and synchronization in planning and operations. These efforts work to make information
already in the enterprise more effective and more available. The Army Geospatial Enterprise also works
to bring new information previously undiscovered into the enterprise. This is done by providing new
ways to sense the terrain, through airborne and terrestrial methods, to increase the total amount of terrain
information in the enterprise, thereby adding to the Tier One, Two and Three information that already
exists.
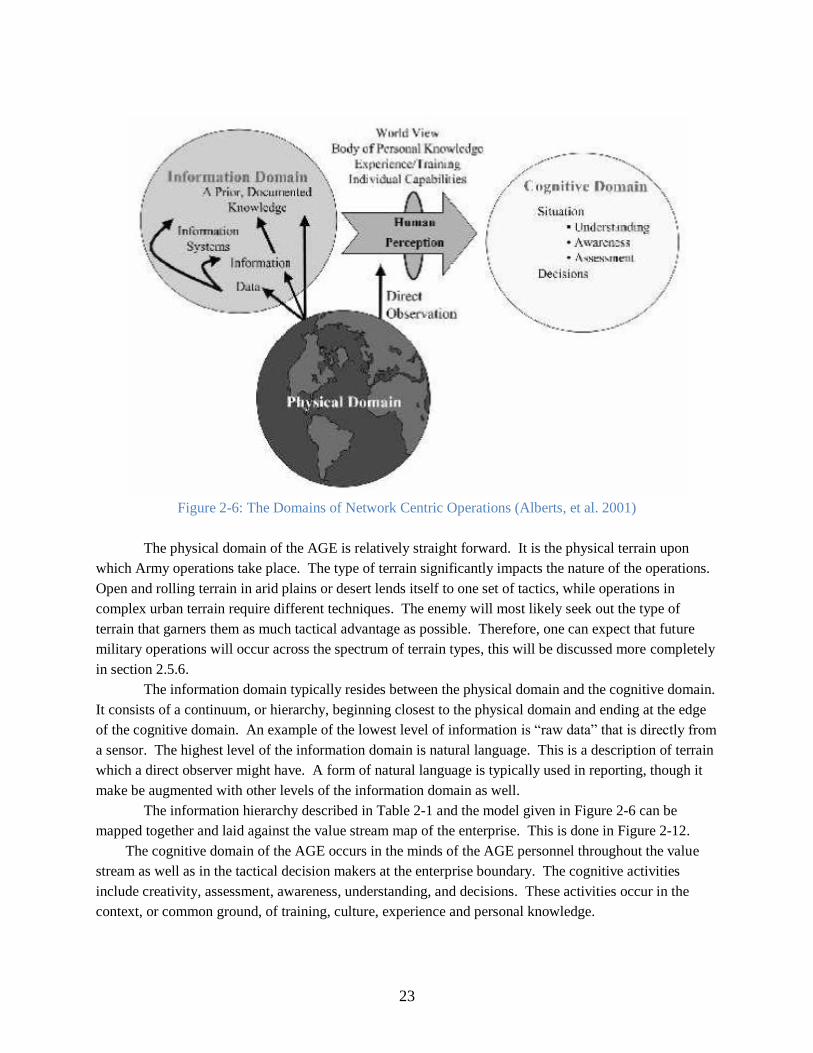
2.4.2 Discussion of Net Centric Warfare
―NCW is a set of warfighting concepts designed to create and leverage information.‖ (D. S. Alberts
2002) The Army Geospatial Enterprise deals primarily with information, therefore a brief discussion of
network centric warfare is appropriate. Network centric warfare relies on the premise that there is a
military advantage to have information superiority over one‘s enemy. Figure 2-6 is the depiction from
Alberts et al (2002) of the three domains of network centric warfare and how the domains interact. The
following discussion of domains develops the three domain construct specifically for geospatial
information.
23
Figure 2-6: The Domains of Network Centric Operations (Alberts, et al. 2001)
The physical domain of the AGE is relatively straight forward. It is the physical terrain upon
which Army operations take place. The type of terrain significantly impacts the nature of the operations.
Open and rolling terrain in arid plains or desert lends itself to one set of tactics, while operations in
complex urban terrain require different techniques. The enemy will most likely seek out the type of
terrain that garners them as much tactical advantage as possible. Therefore, one can expect that future
military operations will occur across the spectrum of terrain types, this will be discussed more completely
in section 2.5.6.
The information domain typically resides between the physical domain and the cognitive domain.
It consists of a continuum, or hierarchy, beginning closest to the physical domain and ending at the edge
of the cognitive domain. An example of the lowest level of information is ―raw data‖ that is directly from
a sensor. The highest level of the information domain is natural language. This is a description of terrain
which a direct observer might have. A form of natural language is typically used in reporting, though it
make be augmented with other levels of the information domain as well.
The information hierarchy described in Table 2-1 and the model given in Figure 2-6 can be
mapped together and laid against the value stream map of the enterprise. This is done in Figure 2-12.
The cognitive domain of the AGE occurs in the minds of the AGE personnel throughout the value
stream as well as in the tactical decision makers at the enterprise boundary. The cognitive activities
include creativity, assessment, awareness, understanding, and decisions. These activities occur in the
context, or common ground, of training, culture, experience and personal knowledge.
24
2.5 Army Geospatial Enterprise Description
The enterprise that this research seeks to analyze is the US Army‘s geospatial enterprise. This can
be thought of as how the Army understands the environment of the battlespace. The environment would
typically include terrain and weather effects, though terrain will be the primary focus of this analysis.
―Organizing Principle: A comprehensive framework for systematically exploiting and sharing
geospatial information and services to enable Army Full Spectrum Operations to be conducted with
maximum situational awareness and understanding. Specifically, it is comprised of the people,
organizations, technologies, policies, doctrine, and materiel solutions involved in the acquisition of
geospatial data, the production of geospatial information, and related discovery, integration, and
distribution services. At its core, the AGE is a set of databases within a supporting infrastructure
based upon a common suite of interoperable software, open standards, data formats, and data models
that allows geospatial data and information to be efficiently collected, generated, managed, analyzed,
used, visualized, and disseminated, from peer to peer, echelon to echelon, Army to Joint, Army to
Coalition and Army to Intelligence Community. The AGE is a key supporting component of the
LandWarNet/Battle Command Strategy.‖ (TRADOC Capability Manager Geospatial 2009)
Two key points emerge from the Organizing Principle. First, the definition of value is based on the
service of increasing the understanding and situational awareness of decisions makers within the spectrum
of Army Operations. This is different than if the AGE were producing map products as the definition of
value. The enterprise boundary continues out to the cogitative domain of the maneuver elements.
Second, the AGE cuts across all aspects of the Army Enterprise, ―organizations, technologies, policies,
doctrine, and materiel solutions‖ within the area of the geospatial information. Therefore, the
transformation of the AGE should take a holistic approach to all ―levers‖ of change within the enterprise.
2.5.1 Strategic Environment of the AGE
The Army Geospatial Enterprise seeks to address the needs of battle command. The ―enterprise
identity‖ is relatively new and grew from experimentation, analysis and programmatic efforts primarily at
the Army Geospatial Center and the TRADOC Capability Manager for Geospatial. The architectural
effort occurs within a movement within the Army, and more generally the Federal government, to attempt
to gain efficiencies through architectural efforts focused on enterprise with information technology
components. The next sections broadly describe Enterprise Architecting efforts within the DoD and how
these efforts are nested within the Federal Government‘s efforts as well as how the DoD EA philosophy
organizes the subordinate military enterprises. The motivation of the discussion is to place ―where‖ the
Army‘s Geospatial Enterprise resides in the larger context of DoD Enterprise Architecture in order to
provide insight into how proper AGE decision making increases value creation within the DoD.
2.5.1.1 Brief History of Federal Government Enterprise Architectural Efforts
The use of Enterprise Architecture techniques within the Federal Government began with the
need to reduce the costs of information technology across all federal agencies, based upon the vast
25
amount of government spending in the area of information technology, including hardware, software, and
service contracts. Given that the ―burning platform‖ for EA usage originated in IT costs, it is
understandable why EA solutions tend to focus narrowly within the IT perspective. But this narrow focus
flagrantly misses the potential value of a holistic perspective on Enterprise Architecting and subsequent
transformation efforts.
The Federal Government, through Congressional legislation and Executive action, determined
that Enterprise Architecture has the potential to make the government more resource efficient and
functionally effective. The Clinger Cohen Act of 1996 initiated the requirement for Federal Departments
to use Enterprise Architecture. The motivation for the legislation was to save money on IT while making
government business operations more productive. This would be achieved through better resource
sharing and smarter IT purchase decisions due to better understanding of the federal enterprise. Much of
the power of EA was obscured from the beginning due to the continual focus on IT system acquisition.
Section 5123 of the act, Performance and Results-based Management, is buried deep in the bill, and
perhaps the most powerful capability of EA is listed toward the bottom of the purposes of the legislation.
―5) analyze the missions of the executive agency and, based on the analysis, revise the executive agency's
mission-related processes and administrative processes as appropriate before making significant
investments in information technology that is to be used in support of the performance of those missions;‖
(Clinger Cohen Act 1996) In this case the inclusion of the Information Technology Acquisition decision
is approximately at the end of the EA effort, which has focused on other views first.
2.5.1.2 The Federal Government Architecture
Broadly, the Federal Enterprise Architecture Framework (FEAF) is ―a business-based framework
for cross-agency, government-wide improvement‖ (Bellman and Rausch 2004). The framework consists
of a collection of five different reference models that act as categories of models allowing OMB to
compare the efforts of all of the departments using the same terminology and metrics. The reference
models are the Business Reference Model (BRM), the Performance Reference Model (PRM) the Data and
Information Reference Model (DRM), the Service Component Reference Model (SRM) and the
Technical Reference Model (TRM.) The goal of common EA (albeit IT centric EA) vocabulary is
beneficial, and the ability to program funding and provide IT eGov cost savings is helpful, but given the
broader EA possibilities outlined in the CCA above, this seems quite underachieving.
In summary, the FEAF seems like a good idea given that the departments realize that ―E-
Government entails enterprise and cross-agency perspectives, and in doing so take a long view or holistic
perspective.‖ (Bellman and Rausch 2004) A holistic perspective aimed to reduce redundancy and
duplication can improve the efficiency of the Federal Government significantly. The DoD attempts to
nest the Federated Department of Defense Architecture within the broader Federal Enterprise
Architecture.
2.5.1.3 Department of Defense Architecture
In order to enable the development of architectures within the Department of Defense, the
Department of Defense Architecture Framework evolved. The most recent version of the DODAF is 2.0
26
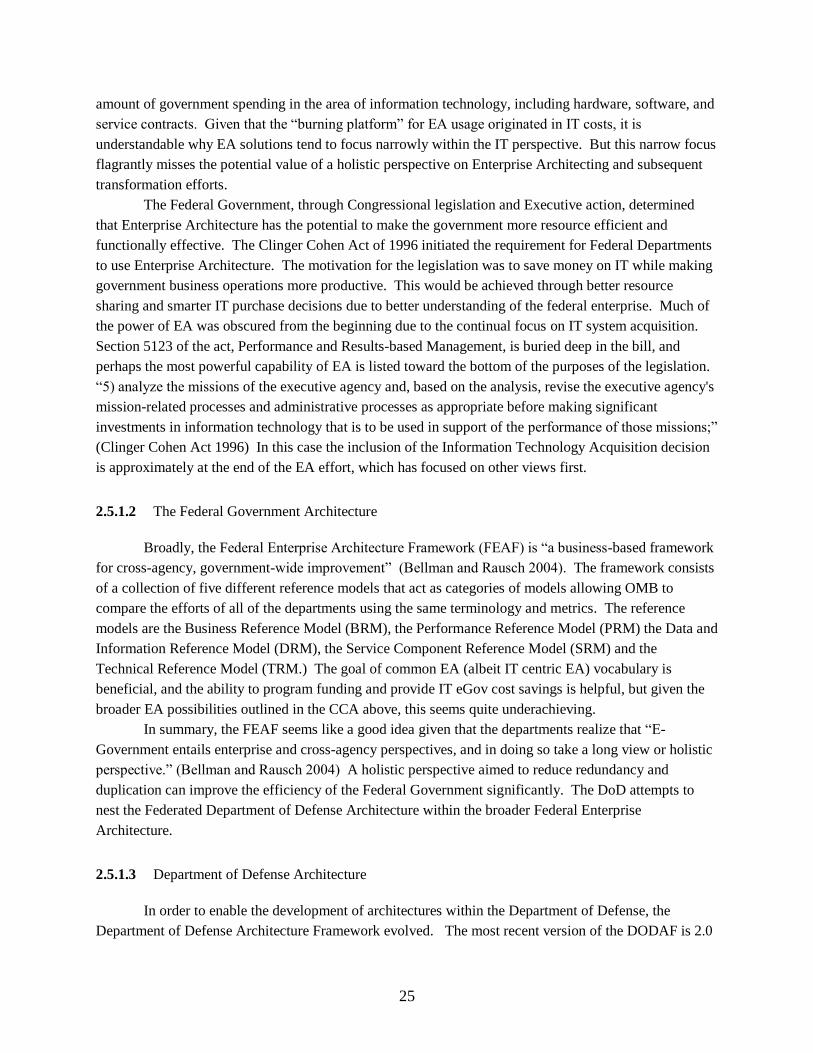
which was published in 2007. This is the second generation of the framework following its migration
from the C4ISR Architecture Framework. The
Figure 2-7: DoD Architecture Federation (DoD Business Transformation Agency 2008)
In summary, the DoDAF is an evolving framework that seeks to organize and manage
information about an architecture which in turn can increase the value delivery of complex enterprises
operating as socio-technical systems (DiMario, Cloutier and Verma 2008).
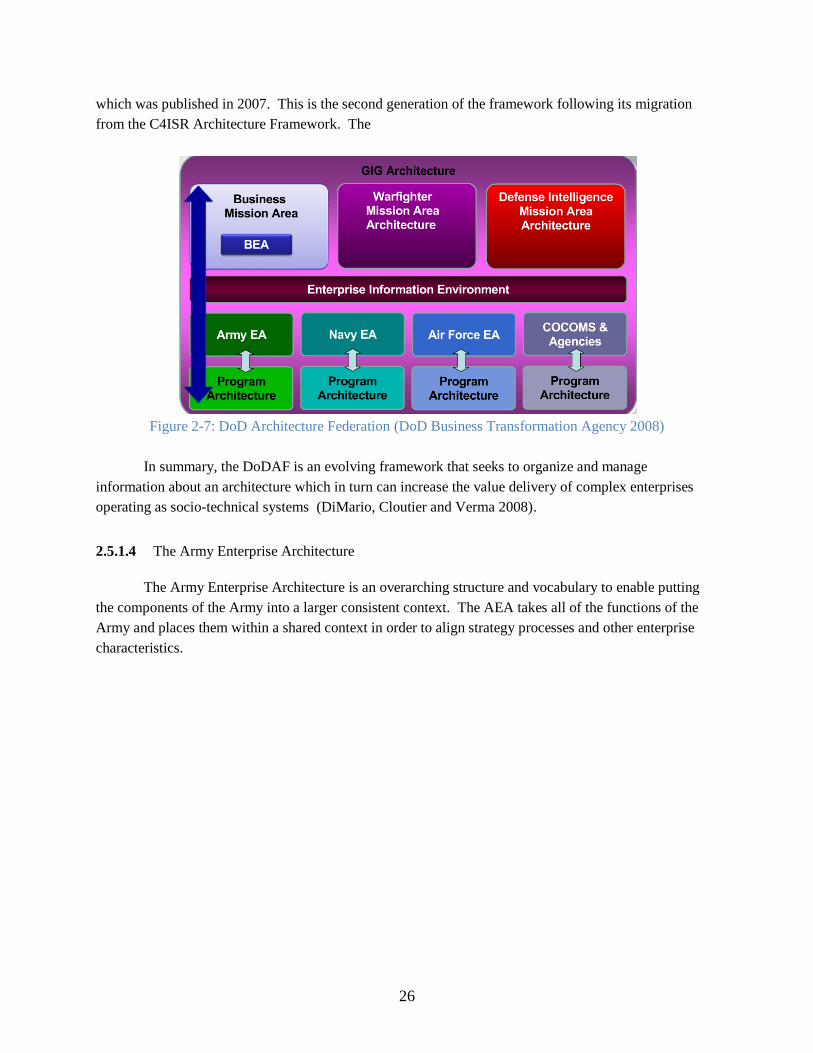
2.5.1.4 The Army Enterprise Architecture
The Army Enterprise Architecture is an overarching structure and vocabulary to enable putting
the components of the Army into a larger consistent context. The AEA takes all of the functions of the
Army and places them within a shared context in order to align strategy processes and other enterprise
characteristics.
27
Figure 2-8: Army Enterprise Architecture (Bechtold 2009)
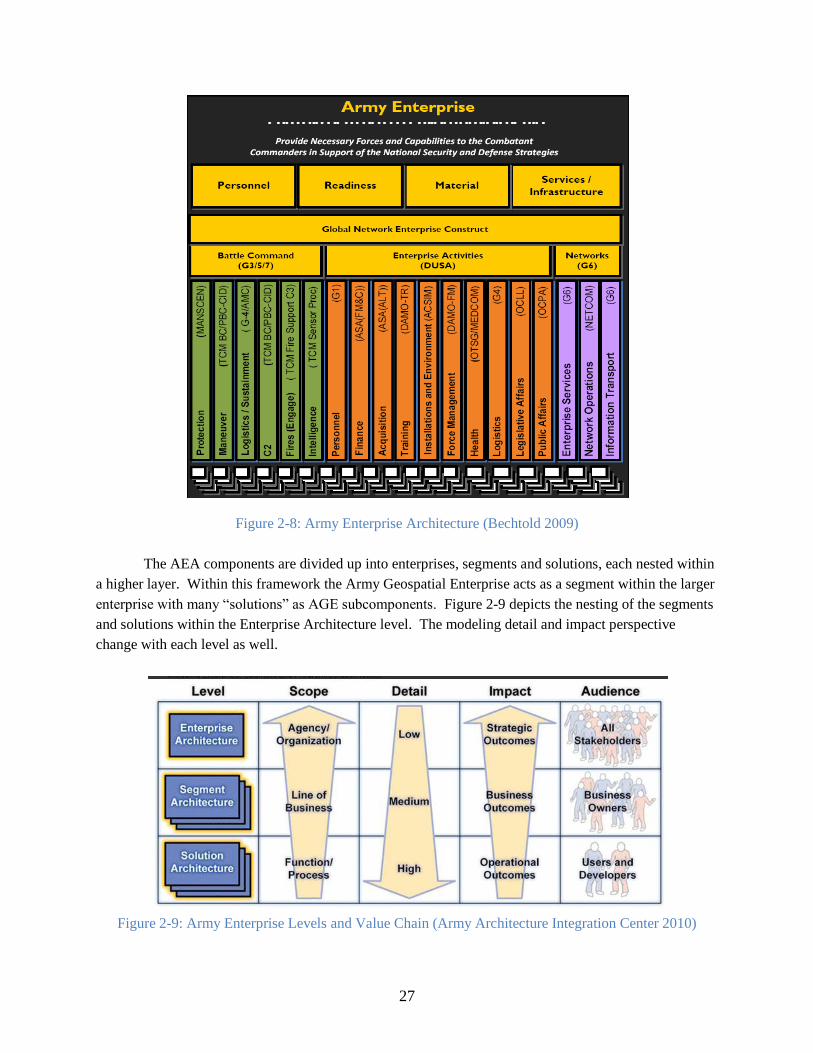
The AEA components are divided up into enterprises, segments and solutions, each nested within
a higher layer. Within this framework the Army Geospatial Enterprise acts as a segment within the larger
enterprise with many ―solutions‖ as AGE subcomponents. Figure 2-9 depicts the nesting of the segments
and solutions within the Enterprise Architecture level. The modeling detail and impact perspective
change with each level as well.
Figure 2-9: Army Enterprise Levels and Value Chain (Army Architecture Integration Center 2010)
28
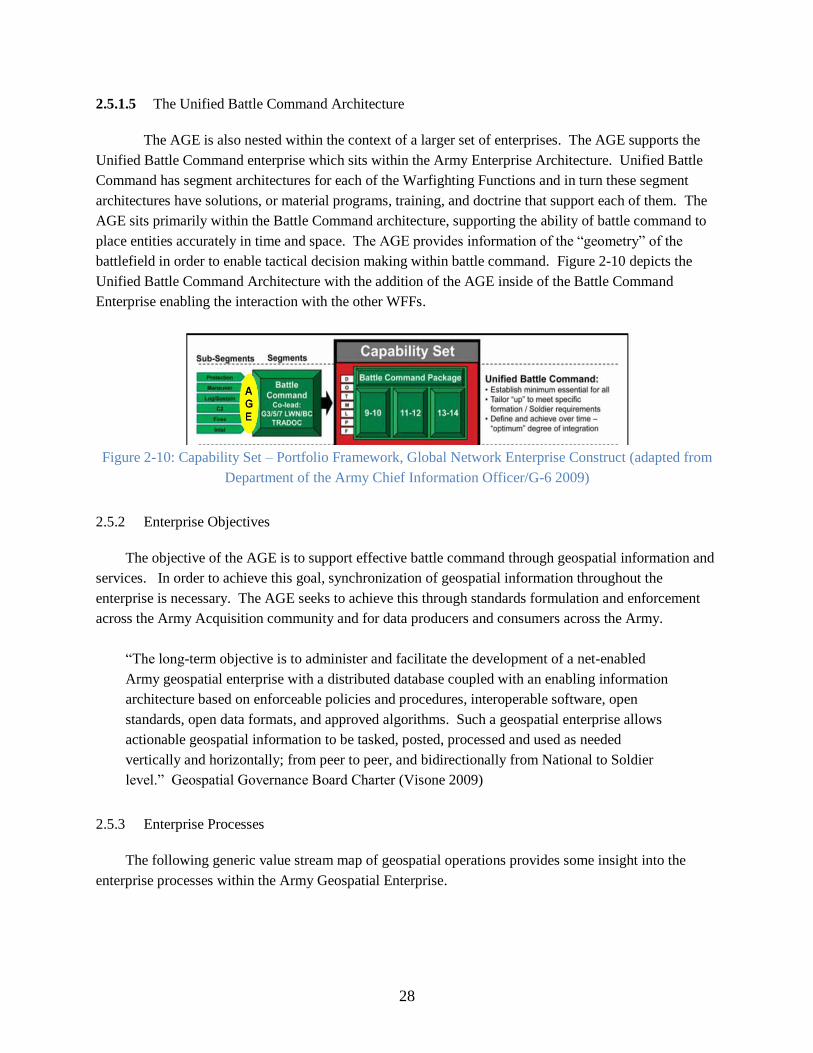
2.5.1.5 The Unified Battle Command Architecture
The AGE is also nested within the context of a larger set of enterprises. The AGE supports the
Unified Battle Command enterprise which sits within the Army Enterprise Architecture. Unified Battle
Command has segment architectures for each of the Warfighting Functions and in turn these segment
architectures have solutions, or material programs, training, and doctrine that support each of them. The
AGE sits primarily within the Battle Command architecture, supporting the ability of battle command to
place entities accurately in time and space. The AGE provides information of the ―geometry‖ of the
battlefield in order to enable tactical decision making within battle command. Figure 2-10 depicts the
Unified Battle Command Architecture with the addition of the AGE inside of the Battle Command
Enterprise enabling the interaction with the other WFFs.
Figure 2-10: Capability Set – Portfolio Framework, Global Network Enterprise Construct (adapted from
Department of the Army Chief Information Officer/G-6 2009)
2.5.2 Enterprise Objectives
The objective of the AGE is to support effective battle command through geospatial information and
services. In order to achieve this goal, synchronization of geospatial information throughout the
enterprise is necessary. The AGE seeks to achieve this through standards formulation and enforcement
across the Army Acquisition community and for data producers and consumers across the Army.
―The long-term objective is to administer and facilitate the development of a net-enabled
Army geospatial enterprise with a distributed database coupled with an enabling information
architecture based on enforceable policies and procedures, interoperable software, open
standards, open data formats, and approved algorithms. Such a geospatial enterprise allows
actionable geospatial information to be tasked, posted, processed and used as needed
vertically and horizontally; from peer to peer, and bidirectionally from National to Soldier
level.‖ Geospatial Governance Board Charter (Visone 2009)
2.5.3 Enterprise Processes
The following generic value stream map of geospatial operations provides some insight into the
enterprise processes within the Army Geospatial Enterprise.
29
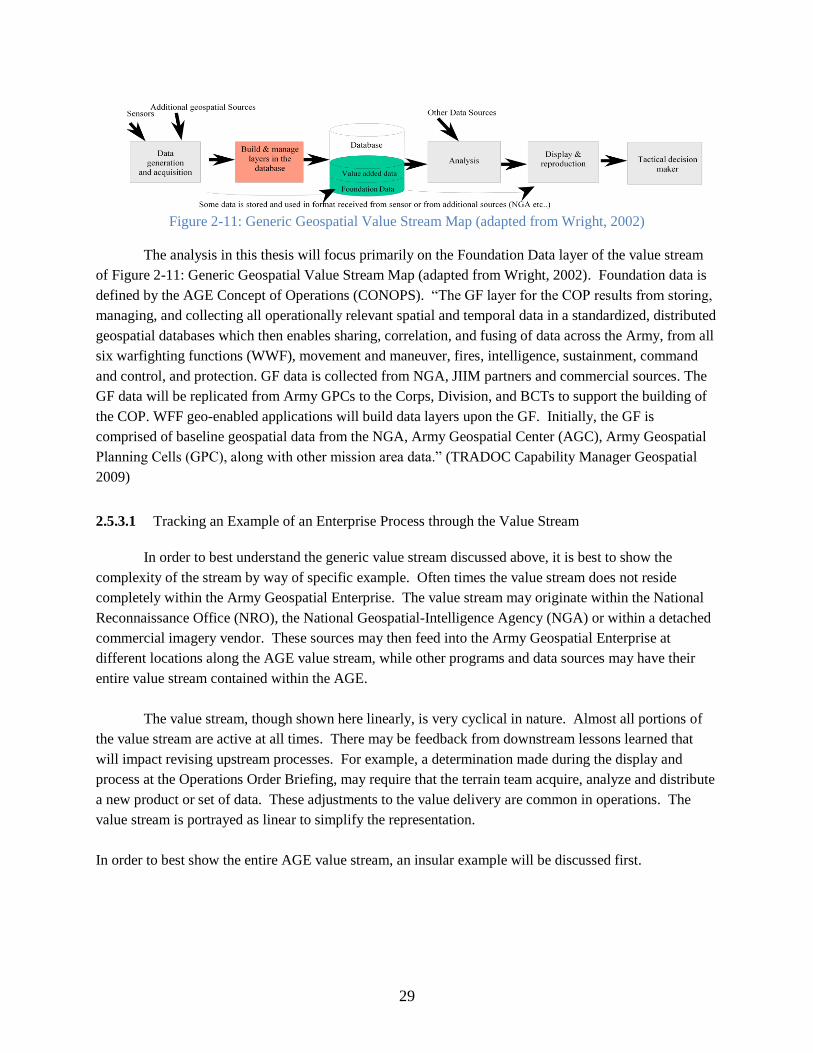
Figure 2-11: Generic Geospatial Value Stream Map (adapted from Wright, 2002)
The analysis in this thesis will focus primarily on the Foundation Data layer of the value stream
of Figure 2-11: Generic Geospatial Value Stream Map (adapted from Wright, 2002). Foundation data is
defined by the AGE Concept of Operations (CONOPS). ―The GF layer for the COP results from storing,
managing, and collecting all operationally relevant spatial and temporal data in a standardized, distributed
geospatial databases which then enables sharing, correlation, and fusing of data across the Army, from all
six warfighting functions (WWF), movement and maneuver, fires, intelligence, sustainment, command
and control, and protection. GF data is collected from NGA, JIIM partners and commercial sources. The
GF data will be replicated from Army GPCs to the Corps, Division, and BCTs to support the building of
the COP. WFF geo-enabled applications will build data layers upon the GF. Initially, the GF is
comprised of baseline geospatial data from the NGA, Army Geospatial Center (AGC), Army Geospatial
Planning Cells (GPC), along with other mission area data.‖ (TRADOC Capability Manager Geospatial
2009)
2.5.3.1 Tracking an Example of an Enterprise Process through the Value Stream
In order to best understand the generic value stream discussed above, it is best to show the
complexity of the stream by way of specific example. Often times the value stream does not reside
completely within the Army Geospatial Enterprise. The value stream may originate within the National
Reconnaissance Office (NRO), the National Geospatial-Intelligence Agency (NGA) or within a detached
commercial imagery vendor. These sources may then feed into the Army Geospatial Enterprise at
different locations along the AGE value stream, while other programs and data sources may have their
entire value stream contained within the AGE.
The value stream, though shown here linearly, is very cyclical in nature. Almost all portions of
the value stream are active at all times. There may be feedback from downstream lessons learned that
will impact revising upstream processes. For example, a determination made during the display and
process at the Operations Order Briefing, may require that the terrain team acquire, analyze and distribute
a new product or set of data. These adjustments to the value delivery are common in operations. The
value stream is portrayed as linear to simplify the representation.
In order to best show the entire AGE value stream, an insular example will be discussed first.
30
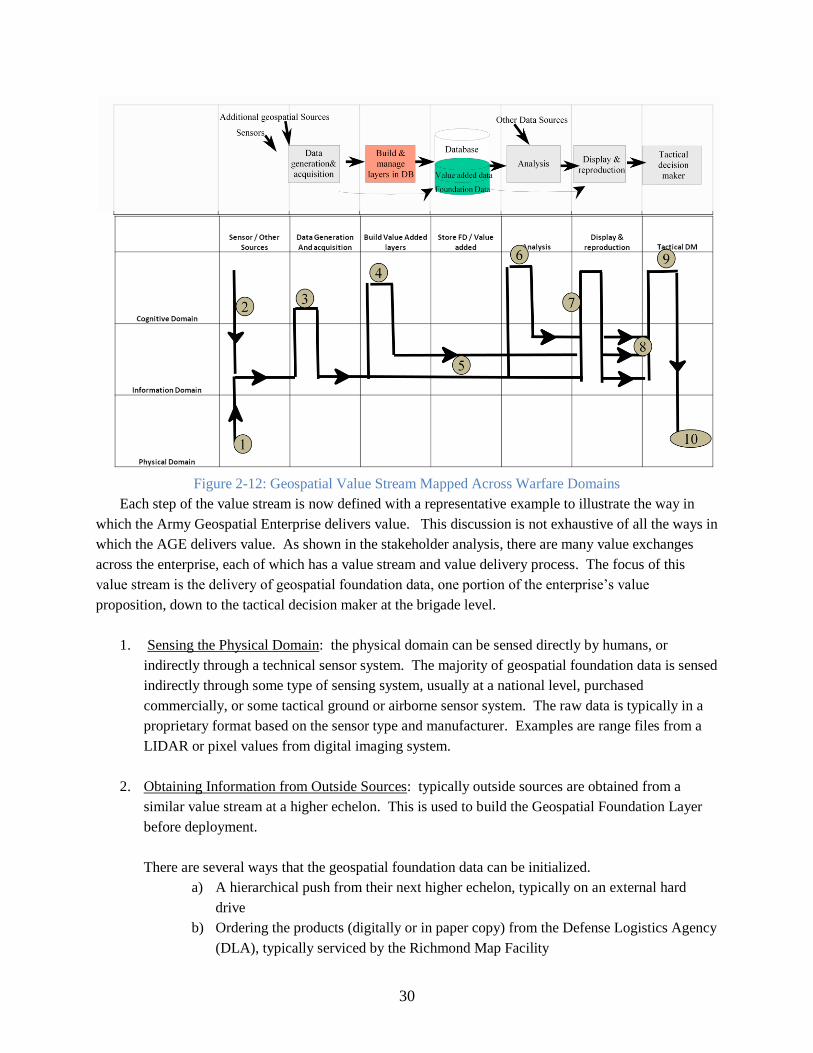
Figure 2-12: Geospatial Value Stream Mapped Across Warfare Domains
Each step of the value stream is now defined with a representative example to illustrate the way in
which the Army Geospatial Enterprise delivers value. This discussion is not exhaustive of all the ways in
which the AGE delivers value. As shown in the stakeholder analysis, there are many value exchanges
across the enterprise, each of which has a value stream and value delivery process. The focus of this
value stream is the delivery of geospatial foundation data, one portion of the enterprise‘s value
proposition, down to the tactical decision maker at the brigade level.
1. Sensing the Physical Domain: the physical domain can be sensed directly by humans, or
indirectly through a technical sensor system. The majority of geospatial foundation data is sensed
indirectly through some type of sensing system, usually at a national level, purchased
commercially, or some tactical ground or airborne sensor system. The raw data is typically in a
proprietary format based on the sensor type and manufacturer. Examples are range files from a
LIDAR or pixel values from digital imaging system.
2. Obtaining Information from Outside Sources: typically outside sources are obtained from a
similar value stream at a higher echelon. This is used to build the Geospatial Foundation Layer
before deployment.
There are several ways that the geospatial foundation data can be initialized.
a) A hierarchical push from their next higher echelon, typically on an external hard
drive
b) Ordering the products (digitally or in paper copy) from the Defense Logistics Agency
(DLA), typically serviced by the Richmond Map Facility
31
c) Retrieve the products from NGA Gateway
d) Receiving a push of data from the Central Technical Support Facility (CTSF) at Fort
Hood, typically filling FBCB2 systems with standard map data
e) A combination of the above methods to populate a complete Geospatial Foundation
3. Evaluating the Data: the terrain team inspects the information as they bring it into the geospatial
database. They determine the quality of the data and who else in the brigade would need this
information. If there are discrepancies in the information the team will work to purge the
database of conflicting references.
4. Building new data, extracting features: The terrain team is trained to generate geospatial
information from multiple sources in order to meet the information needs of the brigade.
5. Database management: the physical storage and connectivity of the geospatial information
servers to the TOC network is facilitated by the terrain team and the geospatial information
system software and hardware provided by the geospatial portion of the Distributed Common
Ground Station – Army (DCGS-A).
6. Analyzing Geospatial Foundation layer with other sources and in context: conducting terrain
analysis and creating specialized terrain products is a key task for the brigade terrain team. They
seek out a diverse set of data sources, from operation reports to intelligence information in order
to understand all aspects of the terrain. Geospatial products are usually a synthesis of other
information sources, which places the final terrain product at a higher level along the information
domain producing information that is actionable.
7. Determining what information should be included and shared: as the mission planning process
proceeds, there are many geospatial information requests from across the warfighting functions.
For example, the reconnaissance element may request line of sight analysis to determine the best
place to insert an observation post. Each request requires individual attention as to what
information would best serve the mission. In this way, the information flow is a combination of
data ―push‖ based upon a core set of needs to provide the foundation of the common operating
picture, as well as a ―pull‖ from Requests for Information (RFIs).
8. Information exchange: The information exchange to the tactical decision makers occurs at
several points along a mission time line. The Mission Analysis Briefing is usually the first
opportunity for the commander and staff to receive a set of geospatial products from the terrain
team, and for the terrain team to synchronize the COP that will be used for the operation. The
Operations Order Briefing occurs at the end of the planning cycle and before mission execution.
This is another opportunity for the geospatial foundation layer to enter the decision-making
process of the planners and Soldier conducting operations.
32
9. Understanding and decision making across the battle command functions: commanders and
leaders at every level in the brigade must constantly make tactical decisions based upon their
understanding of terrain. They have built mental models of the terrain based on geospatial
information as well as their experience from operating over the terrain. From these mental
models they determine the military impact of the terrain upon operations, including the effects on
friendly, enemy and civilian elements.
10. Taking Action: During the operation, the geospatial foundation layer will be referenced to aid in
navigation, target location and other basic mission execution requirements.
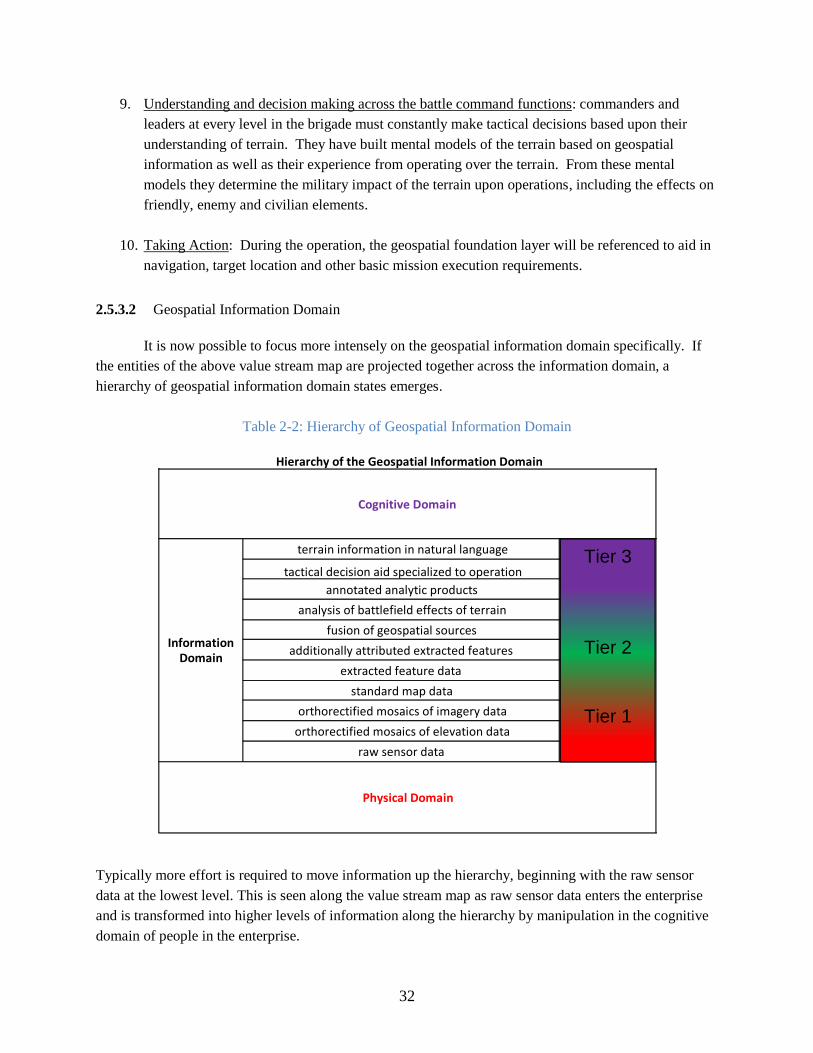
2.5.3.2 Geospatial Information Domain
It is now possible to focus more intensely on the geospatial information domain specifically. If
the entities of the above value stream map are projected together across the information domain, a
hierarchy of geospatial information domain states emerges.
Table 2-2: Hierarchy of Geospatial Information Domain
Typically more effort is required to move information up the hierarchy, beginning with the raw sensor
data at the lowest level. This is seen along the value stream map as raw sensor data enters the enterprise
and is transformed into higher levels of information along the hierarchy by manipulation in the cognitive
domain of people in the enterprise.
Hierarchy of the Geospatial Information Domain
Cognitive Domain
Information Domain
terrain information in natural language
tactical decision aid specialized to operation annotated analytic products
analysis of battlefield effects of terrain
fusion of geospatial sources
additionally attributed extracted features
extracted feature data
standard map data
orthorectified mosaics of imagery data
orthorectified mosaics of elevation data
raw sensor data
Physical Domain
Tier 3
Tier 2
Tier 1
33
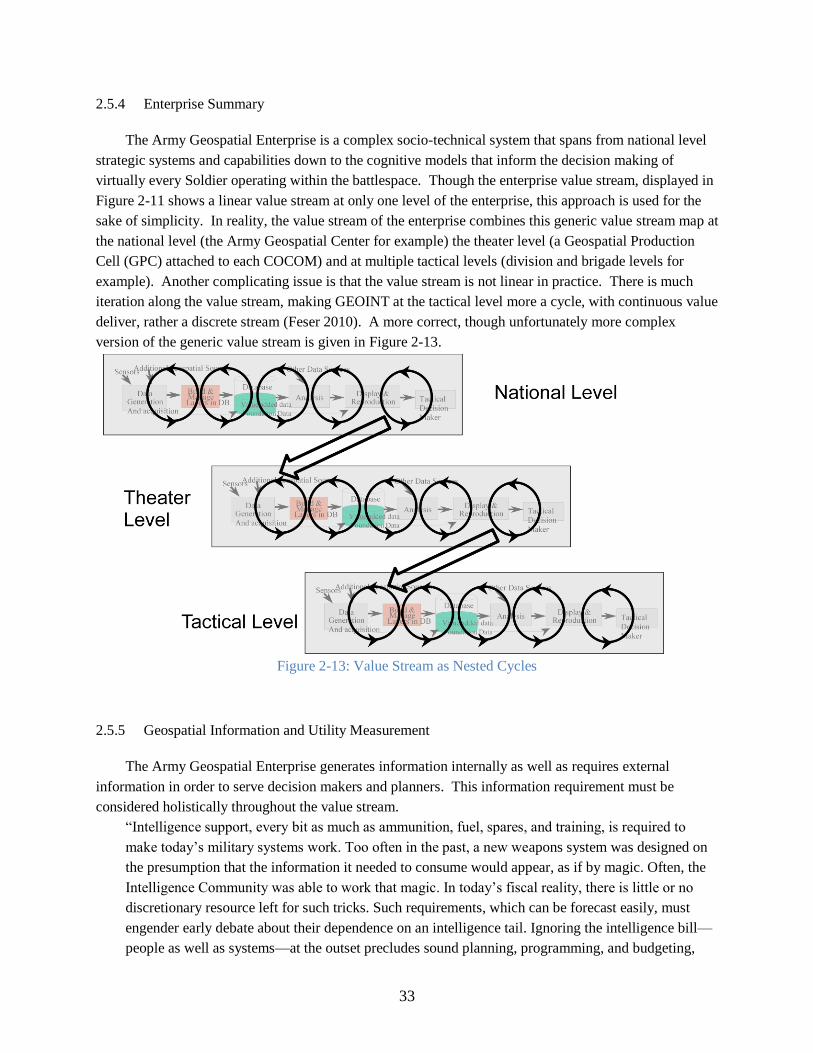
2.5.4 Enterprise Summary
The Army Geospatial Enterprise is a complex socio-technical system that spans from national level
strategic systems and capabilities down to the cognitive models that inform the decision making of
virtually every Soldier operating within the battlespace. Though the enterprise value stream, displayed in
Figure 2-11 shows a linear value stream at only one level of the enterprise, this approach is used for the
sake of simplicity. In reality, the value stream of the enterprise combines this generic value stream map at
the national level (the Army Geospatial Center for example) the theater level (a Geospatial Production
Cell (GPC) attached to each COCOM) and at multiple tactical levels (division and brigade levels for
example). Another complicating issue is that the value stream is not linear in practice. There is much
iteration along the value stream, making GEOINT at the tactical level more a cycle, with continuous value
deliver, rather a discrete stream (Feser 2010). A more correct, though unfortunately more complex
version of the generic value stream is given in Figure 2-13.
Figure 2-13: Value Stream as Nested Cycles
2.5.5 Geospatial Information and Utility Measurement
The Army Geospatial Enterprise generates information internally as well as requires external
information in order to serve decision makers and planners. This information requirement must be
considered holistically throughout the value stream.
―Intelligence support, every bit as much as ammunition, fuel, spares, and training, is required to
make today‘s military systems work. Too often in the past, a new weapons system was designed on
the presumption that the information it needed to consume would appear, as if by magic. Often, the
Intelligence Community was able to work that magic. In today‘s fiscal reality, there is little or no
discretionary resource left for such tricks. Such requirements, which can be forecast easily, must
engender early debate about their dependence on an intelligence tail. Ignoring the intelligence bill—
people as well as systems—at the outset precludes sound planning, programming, and budgeting,
34
and forces invidious choices later on.‖ (Independent Commission on the National Imagery and
Mapping Agency 2000)
The Army Geospatial Enterprise enables the Geospatial Foundation (GF) information as well as the
sharing and fusion of ―layers‖ of information from all warfighting functions (WFFs) on ―top‖ of the
geospatial foundation. The focus of this thesis is upon the geospatial foundation data. This is a subset of
geospatial information, which in turn is a subset of GEOINT.
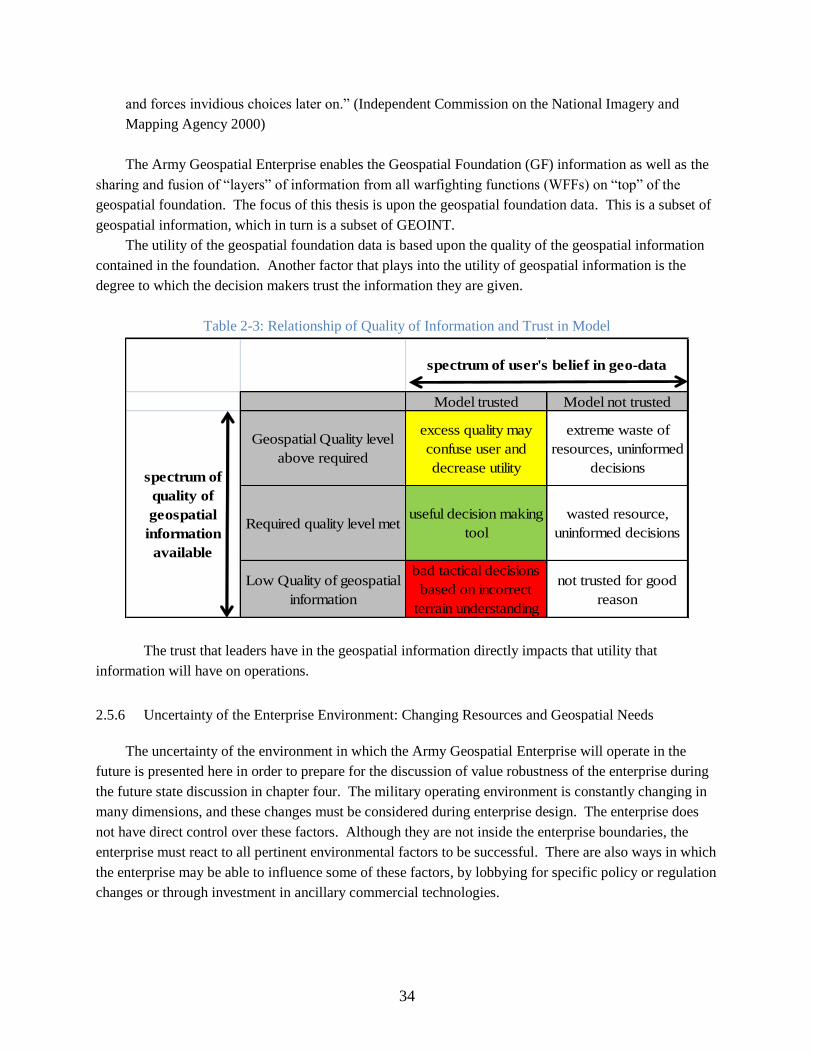
The utility of the geospatial foundation data is based upon the quality of the geospatial information
contained in the foundation. Another factor that plays into the utility of geospatial information is the
degree to which the decision makers trust the information they are given.
Table 2-3: Relationship of Quality of Information and Trust in Model
Model trusted Model not trusted
Geospatial Quality level
above required
excess quality may
confuse user and
decrease utility
extreme waste of
resources, uninformed
decisions
Required quality level metuseful decision making
tool
wasted resource,
uninformed decisions
Low Quality of geospatial
information
bad tactical decisions
based on incorrect
terrain understanding
not trusted for good
reason
spectrum of user's belief in geo-data
spectrum of
quality of
geospatial
information
available
The trust that leaders have in the geospatial information directly impacts that utility that
information will have on operations.
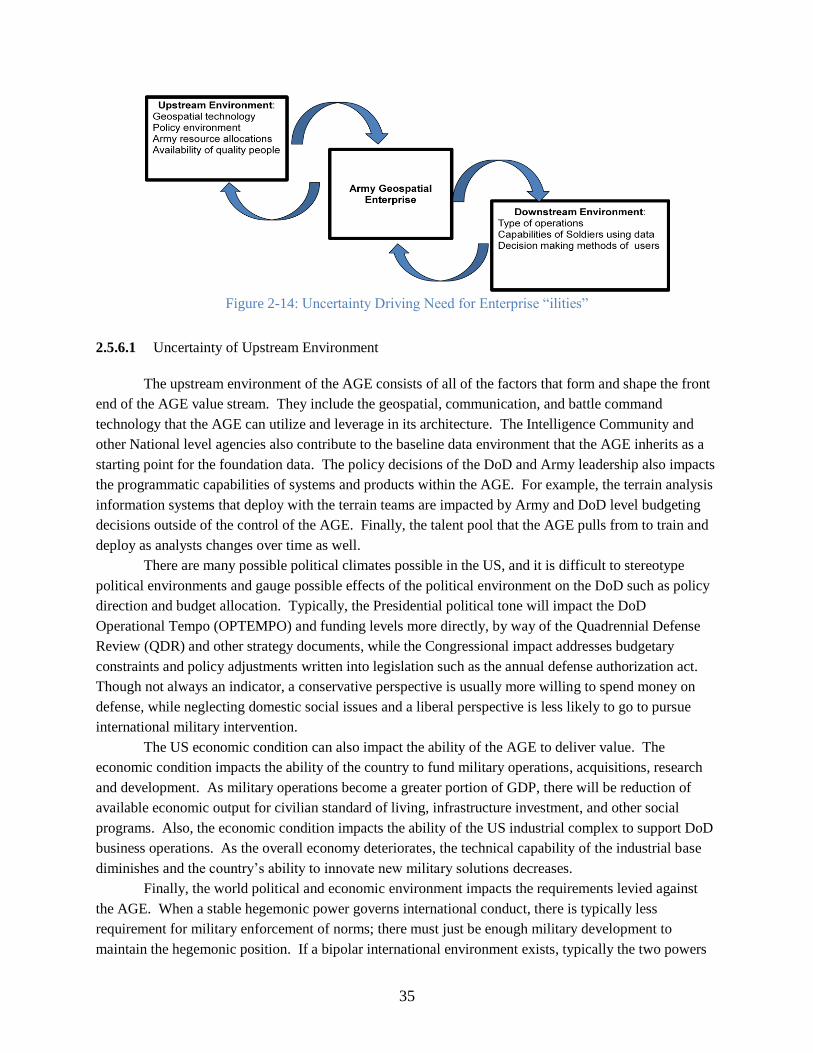
2.5.6 Uncertainty of the Enterprise Environment: Changing Resources and Geospatial Needs
The uncertainty of the environment in which the Army Geospatial Enterprise will operate in the
future is presented here in order to prepare for the discussion of value robustness of the enterprise during
the future state discussion in chapter four. The military operating environment is constantly changing in
many dimensions, and these changes must be considered during enterprise design. The enterprise does
not have direct control over these factors. Although they are not inside the enterprise boundaries, the
enterprise must react to all pertinent environmental factors to be successful. There are also ways in which
the enterprise may be able to influence some of these factors, by lobbying for specific policy or regulation
changes or through investment in ancillary commercial technologies.
35
Figure 2-14: Uncertainty Driving Need for Enterprise ―ilities‖
2.5.6.1 Uncertainty of Upstream Environment
The upstream environment of the AGE consists of all of the factors that form and shape the front
end of the AGE value stream. They include the geospatial, communication, and battle command
technology that the AGE can utilize and leverage in its architecture. The Intelligence Community and
other National level agencies also contribute to the baseline data environment that the AGE inherits as a
starting point for the foundation data. The policy decisions of the DoD and Army leadership also impacts
the programmatic capabilities of systems and products within the AGE. For example, the terrain analysis
information systems that deploy with the terrain teams are impacted by Army and DoD level budgeting
decisions outside of the control of the AGE. Finally, the talent pool that the AGE pulls from to train and
deploy as analysts changes over time as well.
There are many possible political climates possible in the US, and it is difficult to stereotype
political environments and gauge possible effects of the political environment on the DoD such as policy
direction and budget allocation. Typically, the Presidential political tone will impact the DoD
Operational Tempo (OPTEMPO) and funding levels more directly, by way of the Quadrennial Defense
Review (QDR) and other strategy documents, while the Congressional impact addresses budgetary
constraints and policy adjustments written into legislation such as the annual defense authorization act.
Though not always an indicator, a conservative perspective is usually more willing to spend money on
defense, while neglecting domestic social issues and a liberal perspective is less likely to go to pursue
international military intervention.
The US economic condition can also impact the ability of the AGE to deliver value. The
economic condition impacts the ability of the country to fund military operations, acquisitions, research
and development. As military operations become a greater portion of GDP, there will be reduction of
available economic output for civilian standard of living, infrastructure investment, and other social
programs. Also, the economic condition impacts the ability of the US industrial complex to support DoD
business operations. As the overall economy deteriorates, the technical capability of the industrial base
diminishes and the country‘s ability to innovate new military solutions decreases.
Finally, the world political and economic environment impacts the requirements levied against
the AGE. When a stable hegemonic power governs international conduct, there is typically less
requirement for military enforcement of norms; there must just be enough military development to
maintain the hegemonic position. If a bipolar international environment exists, typically the two powers
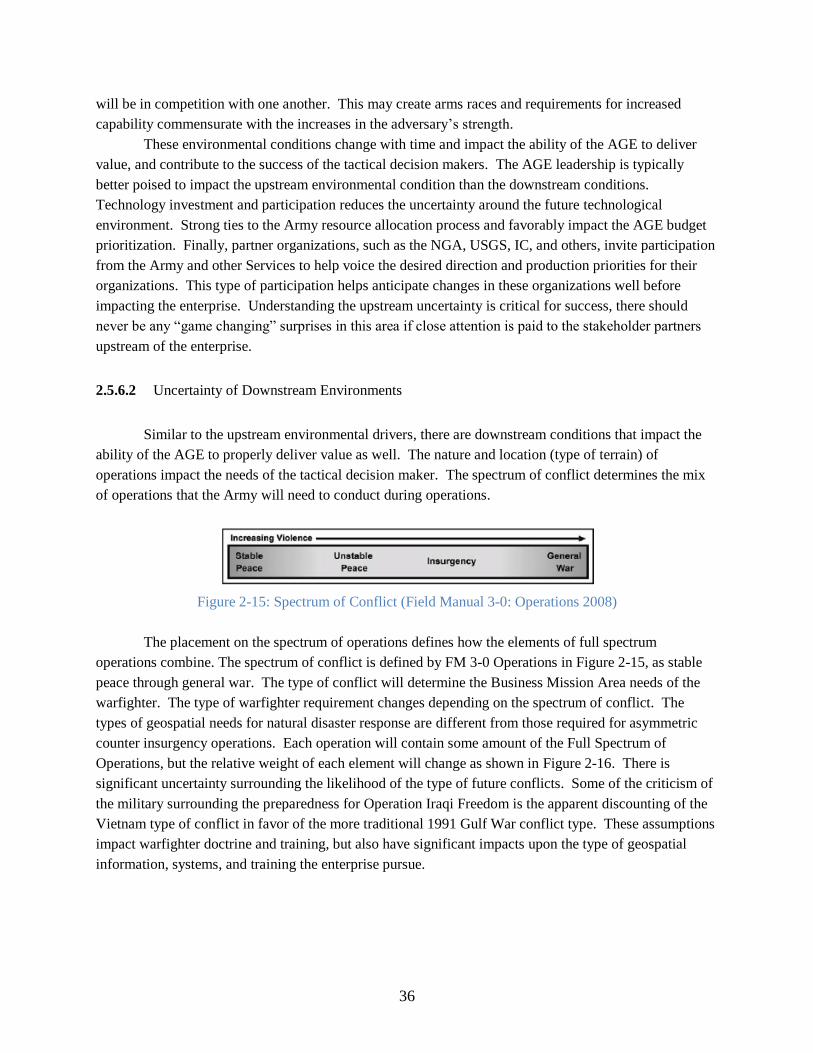
36
will be in competition with one another. This may create arms races and requirements for increased
capability commensurate with the increases in the adversary‘s strength.
These environmental conditions change with time and impact the ability of the AGE to deliver
value, and contribute to the success of the tactical decision makers. The AGE leadership is typically
better poised to impact the upstream environmental condition than the downstream conditions.
Technology investment and participation reduces the uncertainty around the future technological
environment. Strong ties to the Army resource allocation process and favorably impact the AGE budget
prioritization. Finally, partner organizations, such as the NGA, USGS, IC, and others, invite participation
from the Army and other Services to help voice the desired direction and production priorities for their
organizations. This type of participation helps anticipate changes in these organizations well before
impacting the enterprise. Understanding the upstream uncertainty is critical for success, there should
never be any ―game changing‖ surprises in this area if close attention is paid to the stakeholder partners
upstream of the enterprise.
2.5.6.2 Uncertainty of Downstream Environments
Similar to the upstream environmental drivers, there are downstream conditions that impact the
ability of the AGE to properly deliver value as well. The nature and location (type of terrain) of
operations impact the needs of the tactical decision maker. The spectrum of conflict determines the mix
of operations that the Army will need to conduct during operations.
Figure 2-15: Spectrum of Conflict (Field Manual 3-0: Operations 2008)
The placement on the spectrum of operations defines how the elements of full spectrum
operations combine. The spectrum of conflict is defined by FM 3-0 Operations in Figure 2-15, as stable
peace through general war. The type of conflict will determine the Business Mission Area needs of the
warfighter. The type of warfighter requirement changes depending on the spectrum of conflict. The
types of geospatial needs for natural disaster response are different from those required for asymmetric
counter insurgency operations. Each operation will contain some amount of the Full Spectrum of
Operations, but the relative weight of each element will change as shown in Figure 2-16. There is
significant uncertainty surrounding the likelihood of the type of future conflicts. Some of the criticism of
the military surrounding the preparedness for Operation Iraqi Freedom is the apparent discounting of the
Vietnam type of conflict in favor of the more traditional 1991 Gulf War conflict type. These assumptions
impact warfighter doctrine and training, but also have significant impacts upon the type of geospatial
information, systems, and training the enterprise pursue.
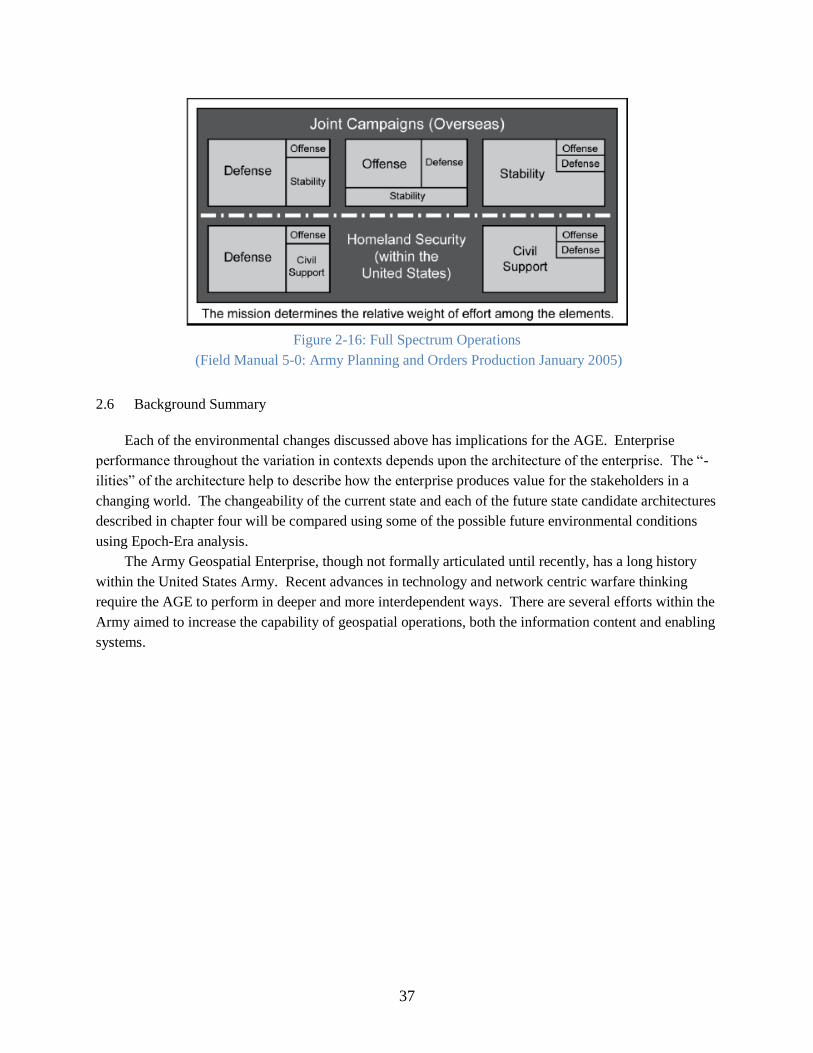
37
Figure 2-16: Full Spectrum Operations
(Field Manual 5-0: Army Planning and Orders Production January 2005)
2.6 Background Summary
Each of the environmental changes discussed above has implications for the AGE. Enterprise
performance throughout the variation in contexts depends upon the architecture of the enterprise. The ―-
ilities‖ of the architecture help to describe how the enterprise produces value for the stakeholders in a
changing world. The changeability of the current state and each of the future state candidate architectures
described in chapter four will be compared using some of the possible future environmental conditions
using Epoch-Era analysis.
The Army Geospatial Enterprise, though not formally articulated until recently, has a long history
within the United States Army. Recent advances in technology and network centric warfare thinking
require the AGE to perform in deeper and more interdependent ways. There are several efforts within the
Army aimed to increase the capability of geospatial operations, both the information content and enabling
systems.
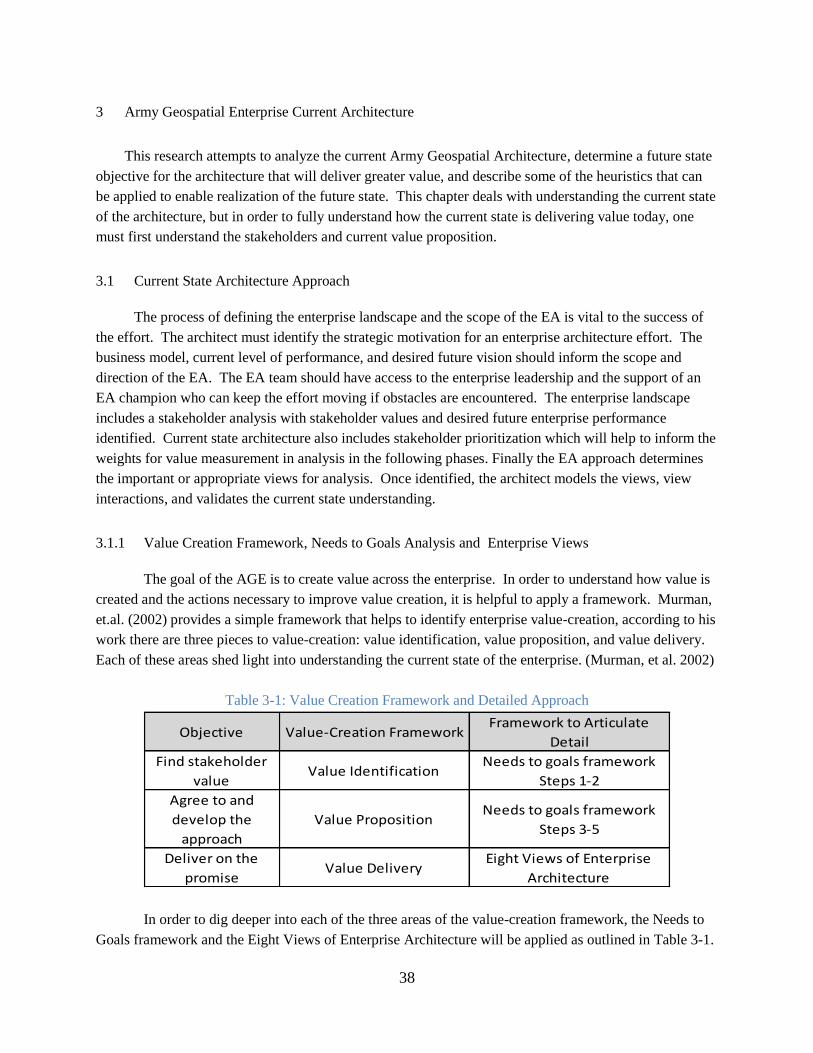
38
3 Army Geospatial Enterprise Current Architecture
This research attempts to analyze the current Army Geospatial Architecture, determine a future state
objective for the architecture that will deliver greater value, and describe some of the heuristics that can
be applied to enable realization of the future state. This chapter deals with understanding the current state
of the architecture, but in order to fully understand how the current state is delivering value today, one
must first understand the stakeholders and current value proposition.
3.1 Current State Architecture Approach
The process of defining the enterprise landscape and the scope of the EA is vital to the success of
the effort. The architect must identify the strategic motivation for an enterprise architecture effort. The
business model, current level of performance, and desired future vision should inform the scope and
direction of the EA. The EA team should have access to the enterprise leadership and the support of an
EA champion who can keep the effort moving if obstacles are encountered. The enterprise landscape
includes a stakeholder analysis with stakeholder values and desired future enterprise performance
identified. Current state architecture also includes stakeholder prioritization which will help to inform the
weights for value measurement in analysis in the following phases. Finally the EA approach determines
the important or appropriate views for analysis. Once identified, the architect models the views, view
interactions, and validates the current state understanding.
3.1.1 Value Creation Framework, Needs to Goals Analysis and Enterprise Views
The goal of the AGE is to create value across the enterprise. In order to understand how value is
created and the actions necessary to improve value creation, it is helpful to apply a framework. Murman,
et.al. (2002) provides a simple framework that helps to identify enterprise value-creation, according to his
work there are three pieces to value-creation: value identification, value proposition, and value delivery.
Each of these areas shed light into understanding the current state of the enterprise. (Murman, et al. 2002)
Table 3-1: Value Creation Framework and Detailed Approach
Objective Value-Creation FrameworkFramework to Articulate
Detail
Find stakeholder
valueValue Identification
Needs to goals framework
Steps 1-2
Agree to and
develop the
approach
Value PropositionNeeds to goals framework
Steps 3-5
Deliver on the
promiseValue Delivery
Eight Views of Enterprise
Architecture
In order to dig deeper into each of the three areas of the value-creation framework, the Needs to
Goals framework and the Eight Views of Enterprise Architecture will be applied as outlined in Table 3-1.
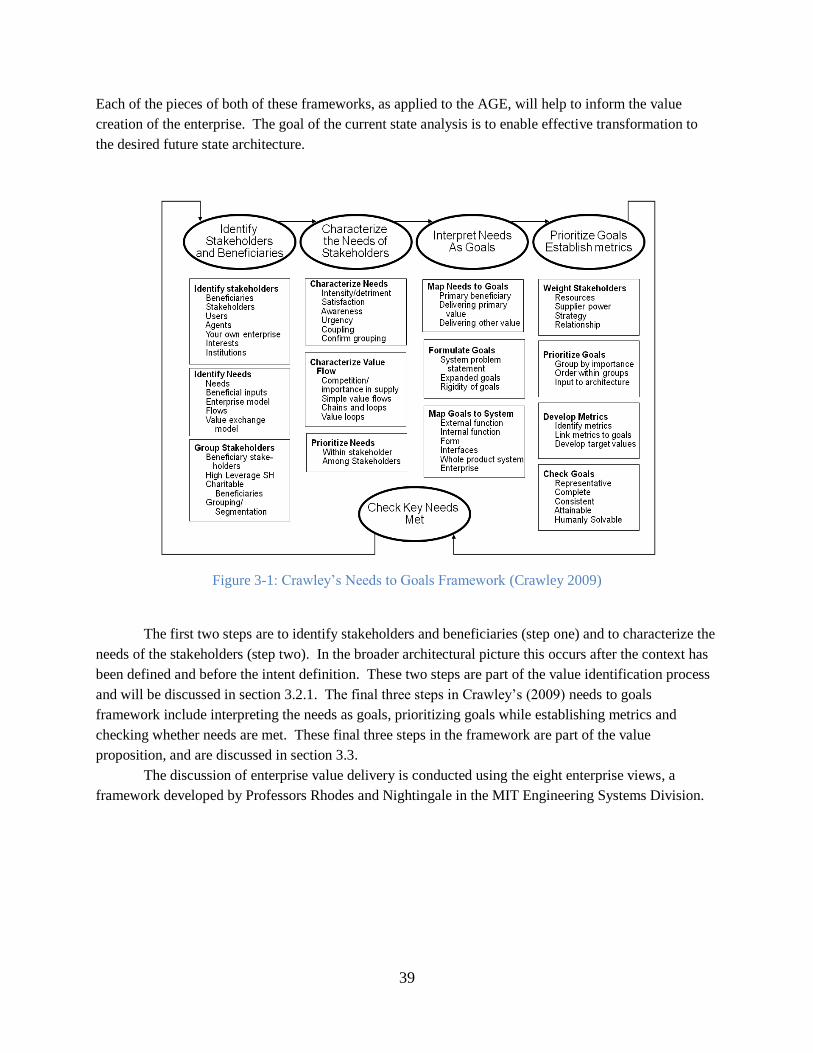
39
Each of the pieces of both of these frameworks, as applied to the AGE, will help to inform the value
creation of the enterprise. The goal of the current state analysis is to enable effective transformation to
the desired future state architecture.
Figure 3-1: Crawley‘s Needs to Goals Framework (Crawley 2009)
The first two steps are to identify stakeholders and beneficiaries (step one) and to characterize the
needs of the stakeholders (step two). In the broader architectural picture this occurs after the context has
been defined and before the intent definition. These two steps are part of the value identification process
and will be discussed in section 3.2.1. The final three steps in Crawley‘s (2009) needs to goals
framework include interpreting the needs as goals, prioritizing goals while establishing metrics and
checking whether needs are met. These final three steps in the framework are part of the value
proposition, and are discussed in section 3.3.
The discussion of enterprise value delivery is conducted using the eight enterprise views, a
framework developed by Professors Rhodes and Nightingale in the MIT Engineering Systems Division.
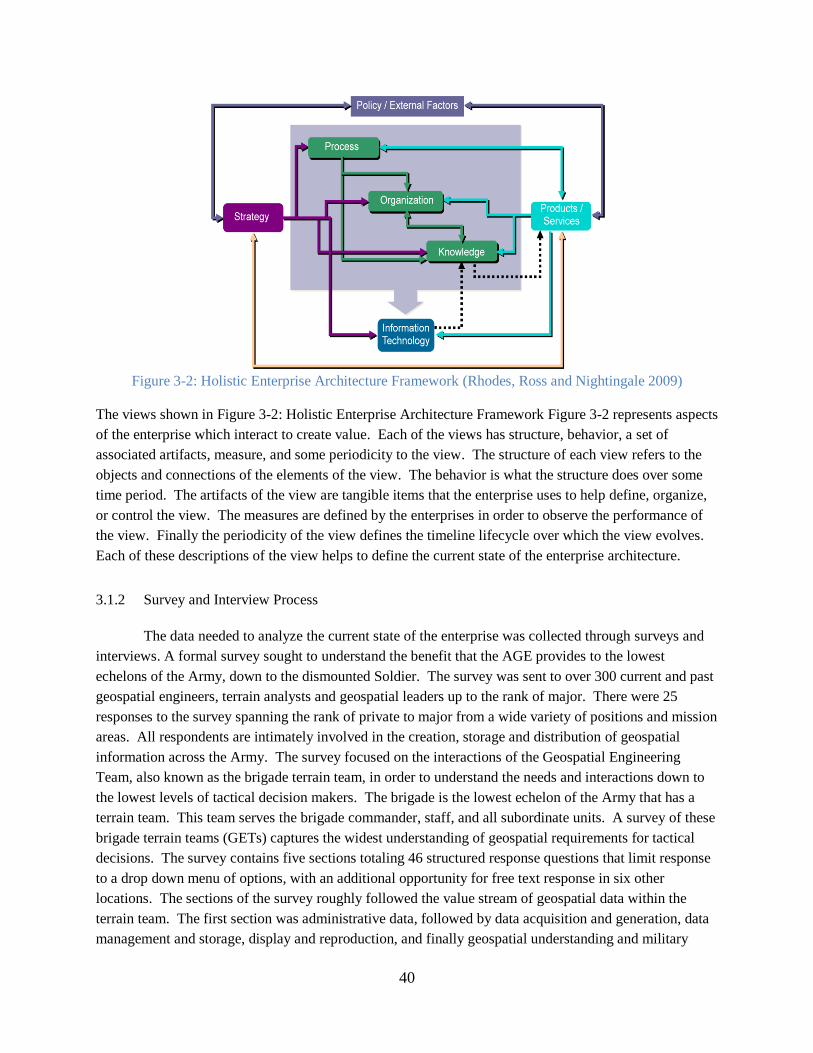
40
Figure 3-2: Holistic Enterprise Architecture Framework (Rhodes, Ross and Nightingale 2009)
The views shown in Figure 3-2: Holistic Enterprise Architecture Framework Figure 3-2 represents aspects
of the enterprise which interact to create value. Each of the views has structure, behavior, a set of
associated artifacts, measure, and some periodicity to the view. The structure of each view refers to the
objects and connections of the elements of the view. The behavior is what the structure does over some
time period. The artifacts of the view are tangible items that the enterprise uses to help define, organize,
or control the view. The measures are defined by the enterprises in order to observe the performance of
the view. Finally the periodicity of the view defines the timeline lifecycle over which the view evolves.
Each of these descriptions of the view helps to define the current state of the enterprise architecture.
3.1.2 Survey and Interview Process
The data needed to analyze the current state of the enterprise was collected through surveys and
interviews. A formal survey sought to understand the benefit that the AGE provides to the lowest
echelons of the Army, down to the dismounted Soldier. The survey was sent to over 300 current and past
geospatial engineers, terrain analysts and geospatial leaders up to the rank of major. There were 25
responses to the survey spanning the rank of private to major from a wide variety of positions and mission
areas. All respondents are intimately involved in the creation, storage and distribution of geospatial
information across the Army. The survey focused on the interactions of the Geospatial Engineering
Team, also known as the brigade terrain team, in order to understand the needs and interactions down to
the lowest levels of tactical decision makers. The brigade is the lowest echelon of the Army that has a
terrain team. This team serves the brigade commander, staff, and all subordinate units. A survey of these
brigade terrain teams (GETs) captures the widest understanding of geospatial requirements for tactical
decisions. The survey contains five sections totaling 46 structured response questions that limit response
to a drop down menu of options, with an additional opportunity for free text response in six other
locations. The sections of the survey roughly followed the value stream of geospatial data within the
terrain team. The first section was administrative data, followed by data acquisition and generation, data
management and storage, display and reproduction, and finally geospatial understanding and military
41
decision making. The results of the survey, discussed in 3.4 as well as Appendix B, help to define the
current state of the enterprise, as well as inform the effects of changes in the design of the enterprise into
the future state.
The author conducted an informal interview process of many personnel within the Army
Geospatial Enterprise. Some of these were conducted face to face at the Army Geospatial Center, Fort
Belvoir Virginia, during a series of two multiday discussions, one in December 2009 and the second in
March 2010. Other interviews consisted of phone and email correspondences with Army Geospatial
Leaders from TRADOC Capability Manager- Geospatial, Fort Leonard Wood, and MO; as well as
throughout the Army force structure.
From both of these efforts, the two primary areas of the enterprise addressed are the leadership of
the Army Geospatial Community and the terrain team from the brigade level. This is only a subset of the
entire AGE, but the interview process also attempted to reveal the needs and preferences of adjacent
individuals within the geospatial value stream. This includes the individuals who directly interact with
the Army leadership (Battle Command for example) and the tactical decision makers down at the brigade
level and below.
3.1.3 Modeling of the Enterprise and Boundary
In the current state of the enterprise, the boundary of the enterprise exists at the brigade level, as
geospatial information leaves the AGE and enters the cognitive domain of the tactical decision maker at
the deliberate planning cycle or during mission execution.
The decision process employs both geospatial information and all other warfighting functions in
order to make a tactical decision. The decision makers on the battlefield are the primary beneficiaries of
the geospatial enterprise (discussed in the next section) so that understanding how benefit is transferred
across this boundary is critical to value delivery. A model is built in order to best understand the
interaction of information at this low level of the enterprise and simulations based on this model will help
to inform the relationship between design variables and desired attributes. The goal is to gain
understanding about the higher level enterprise decisions, and how these design changes impact value
deliver across all stakeholders of the enterprise. The model will be discussed in section 3.6.
3.2 Value Identification
The value identification for the enterprise begins with a detailed stakeholder analysis. The benefit,
worth or utility of the functioning of the enterprise must be defined by considering the total effect upon all
of the stakeholders. A sustainable enterprise typically has relatively balanced value changes among the
stakeholders. In a commercial enterprise many of the value exchanges are bilateral, with a direct value
exchange, similar to an arms-length transaction within a market environment. But within many
government enterprises, value is oftentimes not directly exchanged. There may be a chain of several
stakeholders that must all pass on value before the benefit returns back to the originating entity. This
extra degree of complexity has the potential to create dysfunctional value exchanges or to over or under
realize production, activity or value in part of the enterprise, creating waste in the system.
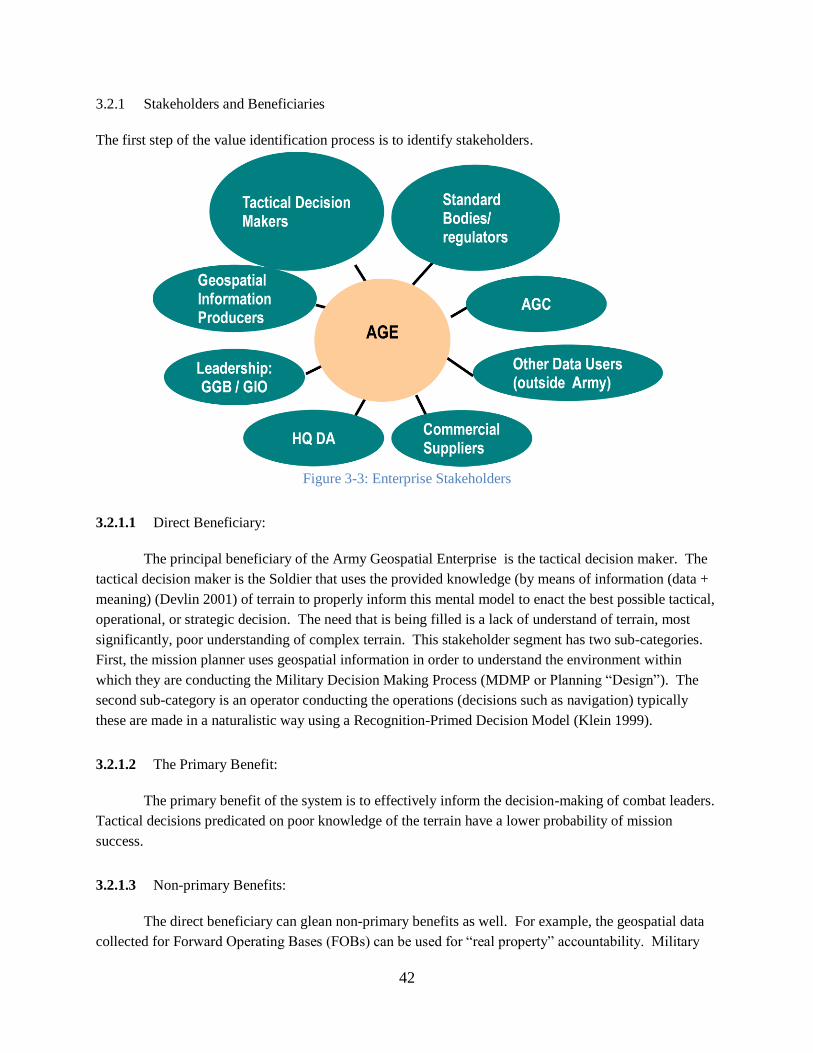
42
3.2.1 Stakeholders and Beneficiaries
The first step of the value identification process is to identify stakeholders.
Figure 3-3: Enterprise Stakeholders
3.2.1.1 Direct Beneficiary:
The principal beneficiary of the Army Geospatial Enterprise is the tactical decision maker. The
tactical decision maker is the Soldier that uses the provided knowledge (by means of information (data +
meaning) (Devlin 2001) of terrain to properly inform this mental model to enact the best possible tactical,
operational, or strategic decision. The need that is being filled is a lack of understand of terrain, most
significantly, poor understanding of complex terrain. This stakeholder segment has two sub-categories.
First, the mission planner uses geospatial information in order to understand the environment within
which they are conducting the Military Decision Making Process (MDMP or Planning ―Design‖). The
second sub-category is an operator conducting the operations (decisions such as navigation) typically
these are made in a naturalistic way using a Recognition-Primed Decision Model (Klein 1999).
3.2.1.2 The Primary Benefit:
The primary benefit of the system is to effectively inform the decision-making of combat leaders.
Tactical decisions predicated on poor knowledge of the terrain have a lower probability of mission
success.
3.2.1.3 Non-primary Benefits:
The direct beneficiary can glean non-primary benefits as well. For example, the geospatial data
collected for Forward Operating Bases (FOBs) can be used for ―real property‖ accountability. Military
43
Business Mission Area needs can be fulfilled even though the primary benefit is for Warfighting Mission
Area purposes. For example, base infrastructure can be inventoried and evaluated using the geospatial
data available. This benefits the direct beneficiary in addition to the primary benefit
3.2.1.4 Indirect Beneficiaries:
There are several indirect beneficiaries, such as the host nation civil authorities who may benefit
by having access to improved geospatial information. They have been able to use the data in several
ways. For example, civil engineers in Kirkuk (a city in Iraq) were able to conduct a survey of a gravity
fed sewer system that they were designing and building using the LIDAR elevation data. The high
resolution data sets of geospatial data in the urban areas of Iraq and Afghanistan have helped other local
users similarly.
3.2.1.5 How Benefit Flows to Indirect Beneficiaries:
In order for the benefit to flow to indirect beneficiaries, there must be a military release of the
data for civilian use. This typically occurs through a foreign disclosure officer (FDO) who must make an
assessment that the information would not harm the security of the forces and would benefit the military
mission in some way.
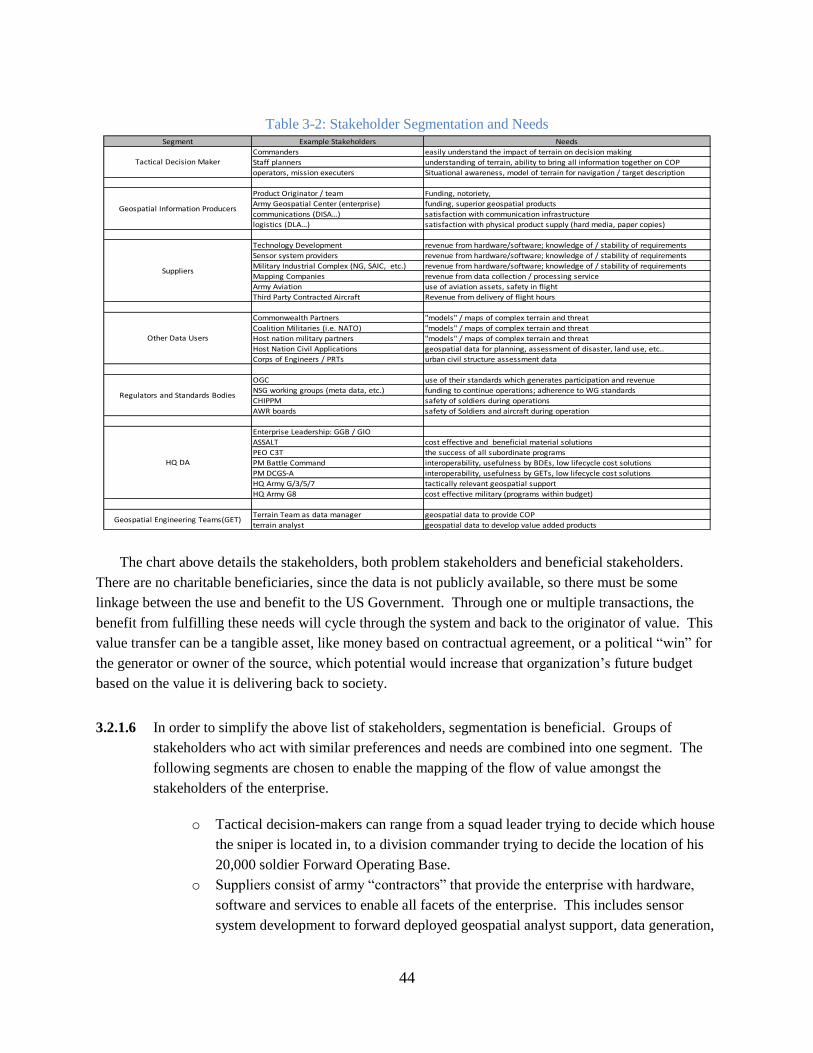
44
Table 3-2: Stakeholder Segmentation and Needs Segment Example Stakeholders Needs
Commanders easily understand the impact of terrain on decision making
Staff planners understanding of terrain, ability to bring all information together on COP
operators, mission executers Situational awareness, model of terrain for navigation / target description
Product Originator / team Funding, notoriety,
Army Geospatial Center (enterprise) funding, superior geospatial products
communications (DISA…) satisfaction with communication infrastructure
logistics (DLA…) satisfaction with physical product supply (hard media, paper copies)
Technology Development revenue from hardware/software; knowledge of / stability of requirements
Sensor system providers revenue from hardware/software; knowledge of / stability of requirements
Military Industrial Complex (NG, SAIC, etc.) revenue from hardware/software; knowledge of / stability of requirements
Mapping Companies revenue from data collection / processing service
Army Aviation use of aviation assets, safety in flight
Third Party Contracted Aircraft Revenue from delivery of flight hours
Commonwealth Partners "models" / maps of complex terrain and threat
Coalition Militaries (i.e. NATO) "models" / maps of complex terrain and threat
Host nation military partners "models" / maps of complex terrain and threat
Host Nation Civil Applications geospatial data for planning, assessment of disaster, land use, etc..
Corps of Engineers / PRTs urban civil structure assessment data
OGC use of their standards which generates participation and revenue
NSG working groups (meta data, etc.) funding to continue operations; adherence to WG standards
CHIPPM safety of soldiers during operations
AWR boards safety of Soldiers and aircraft during operation
Enterprise Leadership: GGB / GIO
ASSALT cost effective and beneficial material solutions
PEO C3T the success of all subordinate programs
PM Battle Command interoperability, usefulness by BDEs, low lifecycle cost solutions
PM DCGS-A interoperability, usefulness by GETs, low lifecycle cost solutions
HQ Army G/3/5/7 tactically relevant geospatial support
HQ Army G8 cost effective military (programs within budget)
Terrain Team as data manager geospatial data to provide COP
terrain analyst geospatial data to develop value added productsGeospatial Engineering Teams(GET)
Tactical Decision Maker
Geospatial Information Producers
Suppliers
Other Data Users
Regulators and Standards Bodies
HQ DA
The chart above details the stakeholders, both problem stakeholders and beneficial stakeholders.
There are no charitable beneficiaries, since the data is not publicly available, so there must be some
linkage between the use and benefit to the US Government. Through one or multiple transactions, the
benefit from fulfilling these needs will cycle through the system and back to the originator of value. This
value transfer can be a tangible asset, like money based on contractual agreement, or a political ―win‖ for
the generator or owner of the source, which potential would increase that organization‘s future budget
based on the value it is delivering back to society.
3.2.1.6 In order to simplify the above list of stakeholders, segmentation is beneficial. Groups of
stakeholders who act with similar preferences and needs are combined into one segment. The
following segments are chosen to enable the mapping of the flow of value amongst the
stakeholders of the enterprise.
o Tactical decision-makers can range from a squad leader trying to decide which house
the sniper is located in, to a division commander trying to decide the location of his
20,000 soldier Forward Operating Base.
o Suppliers consist of army ―contractors‖ that provide the enterprise with hardware,
software and services to enable all facets of the enterprise. This includes sensor
system development to forward deployed geospatial analyst support, data generation,
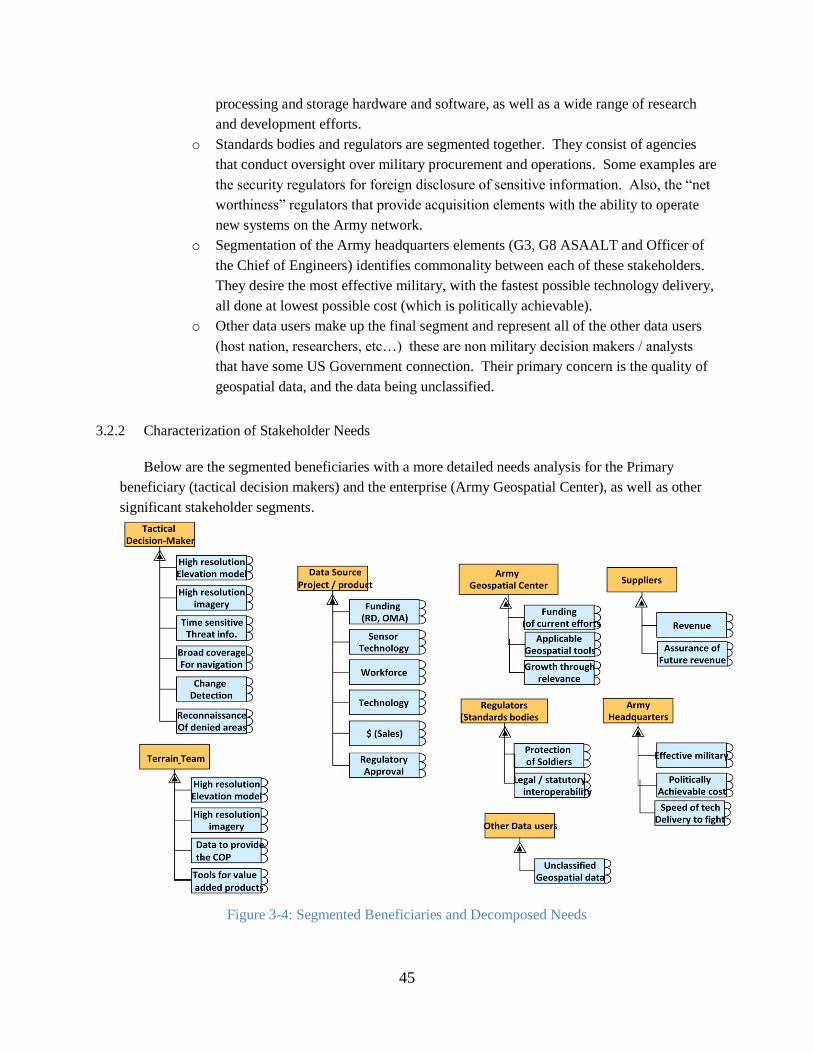
45
processing and storage hardware and software, as well as a wide range of research
and development efforts.
o Standards bodies and regulators are segmented together. They consist of agencies
that conduct oversight over military procurement and operations. Some examples are
the security regulators for foreign disclosure of sensitive information. Also, the ―net
worthiness‖ regulators that provide acquisition elements with the ability to operate
new systems on the Army network.
o Segmentation of the Army headquarters elements (G3, G8 ASAALT and Officer of
the Chief of Engineers) identifies commonality between each of these stakeholders.
They desire the most effective military, with the fastest possible technology delivery,
all done at lowest possible cost (which is politically achievable).
o Other data users make up the final segment and represent all of the other data users
(host nation, researchers, etc…) these are non military decision makers / analysts
that have some US Government connection. Their primary concern is the quality of
geospatial data, and the data being unclassified.
3.2.2 Characterization of Stakeholder Needs
Below are the segmented beneficiaries with a more detailed needs analysis for the Primary
beneficiary (tactical decision makers) and the enterprise (Army Geospatial Center), as well as other
significant stakeholder segments.
Figure 3-4: Segmented Beneficiaries and Decomposed Needs
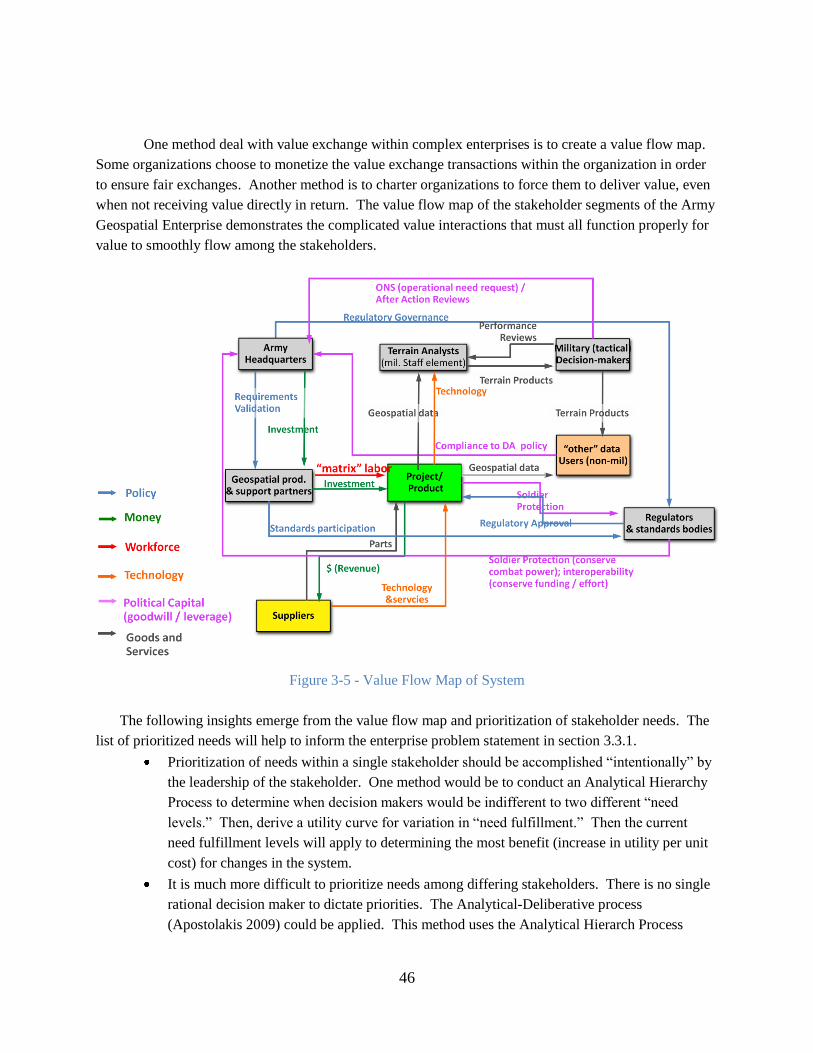
46
One method deal with value exchange within complex enterprises is to create a value flow map.
Some organizations choose to monetize the value exchange transactions within the organization in order
to ensure fair exchanges. Another method is to charter organizations to force them to deliver value, even
when not receiving value directly in return. The value flow map of the stakeholder segments of the Army
Geospatial Enterprise demonstrates the complicated value interactions that must all function properly for
value to smoothly flow among the stakeholders.
Figure 3-5 - Value Flow Map of System
The following insights emerge from the value flow map and prioritization of stakeholder needs. The
list of prioritized needs will help to inform the enterprise problem statement in section 3.3.1.
Prioritization of needs within a single stakeholder should be accomplished ―intentionally‖ by
the leadership of the stakeholder. One method would be to conduct an Analytical Hierarchy
Process to determine when decision makers would be indifferent to two different ―need
levels.‖ Then, derive a utility curve for variation in ―need fulfillment.‖ Then the current
need fulfillment levels will apply to determining the most benefit (increase in utility per unit
cost) for changes in the system.
It is much more difficult to prioritize needs among differing stakeholders. There is no single
rational decision maker to dictate priorities. The Analytical-Deliberative process
(Apostolakis 2009) could be applied. This method uses the Analytical Hierarch Process
47
(AHP) to set preferences and then uses some type of physical model (economic NPV
calculation for example) to set the stage for discussion by representative decision makers
from the stakeholders. These individuals are brought together to discuss the outcome of
comparison of their needs and how that might affect resource allocation (and therefore
fulfillment of their needs.) This research does not explicitly address the problem of
aggregating the utilities across the stakeholder segments, but rather focuses on the utility of
the primary beneficiary as a proxy for the utility of the enterprise.
The articulation of needs within the value flow map occurs at a higher level of the enterprise
than where the needs are experienced. For example, the modeling of the needs of
Intelligence, Surveillance and Reconnaissance (ISR) on the battlefield are conducted within
the US Army Training and Doctrine Command, not by Soldiers that collect or use ISR on the
battlefield. These studies yield requirements documents (owned by the TRADOC leads for
individual capabilities) which flow to the acquisition community for engineering,
development and procurement, stakeholders often well removed from the users.
3.3 Value Proposition
The enterprise value proposition defines the agreement between the stakeholders of the enterprise
and the enterprise leadership. Sometimes this relationship is codified into a formal document such as a
contract or charter. In other cases this relationship is built on tacit trust and historical adherence to norms
and practices for beneficial gain. The communication of the value proposition must include an
understanding by all parties as to the needs and goals of the enterprise, and how these needs will be met
through the value deliver processes. Inclusion of prioritization within the value proposition will help to
reduce future conflict among stakeholders by avoiding instances of unmet expectations.
3.3.1 Interpreting the Needs as Goals and Mapping on to the Enterprise
The enterprise problem statement defines that goals of the system based upon the needs of the
stakeholders as analyzed above. The reason that the enterprise exists is to meet the needs of the primary
beneficiary by filling the information needs of the tactical decision maker on the battlefield. If the needs
of the primary beneficiary are not met, the enterprise is bound to fail.
It is helpful to condense the needs and goals of the stakeholders into a single purpose, or problem
statement for the enterprise. One possible condensed form of the enterprise problem statement for the
AGE is: To increase the situational awareness and mental models of the terrain, By producing geospatial
information Using the Army Geospatial Enterprise.
The more complete version includes modifiers to the basic structure listed above, which captures
the values of the stakeholders. The structure of the statement is ―to, by using‖ as outlined by Crawley
(2009).
- To increase, through intuitive and efficient models, efficiently and at reasonable cost to the
government, the situational awareness of tactical decision-makers acting on mental models of the
terrain
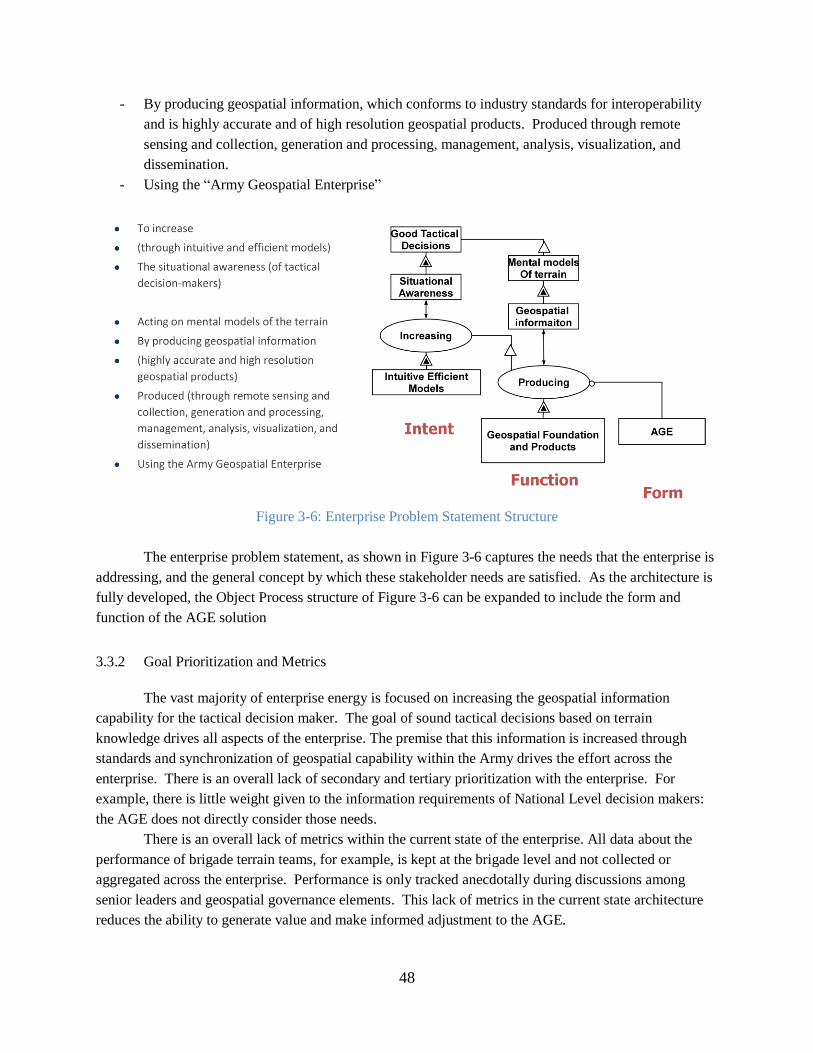
48
- By producing geospatial information, which conforms to industry standards for interoperability
and is highly accurate and of high resolution geospatial products. Produced through remote
sensing and collection, generation and processing, management, analysis, visualization, and
dissemination.
- Using the ―Army Geospatial Enterprise‖
Figure 3-6: Enterprise Problem Statement Structure
The enterprise problem statement, as shown in Figure 3-6 captures the needs that the enterprise is
addressing, and the general concept by which these stakeholder needs are satisfied. As the architecture is
fully developed, the Object Process structure of Figure 3-6 can be expanded to include the form and
function of the AGE solution
3.3.2 Goal Prioritization and Metrics
The vast majority of enterprise energy is focused on increasing the geospatial information
capability for the tactical decision maker. The goal of sound tactical decisions based on terrain
knowledge drives all aspects of the enterprise. The premise that this information is increased through
standards and synchronization of geospatial capability within the Army drives the effort across the
enterprise. There is an overall lack of secondary and tertiary prioritization with the enterprise. For
example, there is little weight given to the information requirements of National Level decision makers:
the AGE does not directly consider those needs.
There is an overall lack of metrics within the current state of the enterprise. All data about the
performance of brigade terrain teams, for example, is kept at the brigade level and not collected or
aggregated across the enterprise. Performance is only tracked anecdotally during discussions among
senior leaders and geospatial governance elements. This lack of metrics in the current state architecture
reduces the ability to generate value and make informed adjustment to the AGE.
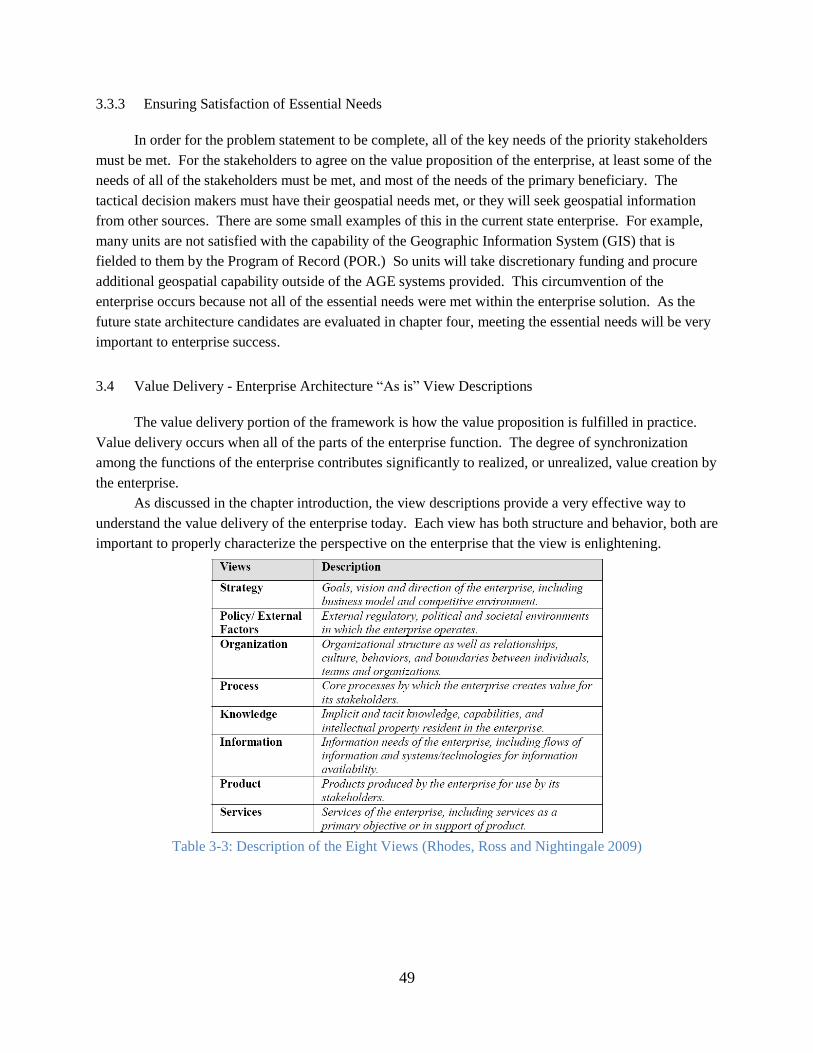
49
3.3.3 Ensuring Satisfaction of Essential Needs
In order for the problem statement to be complete, all of the key needs of the priority stakeholders
must be met. For the stakeholders to agree on the value proposition of the enterprise, at least some of the
needs of all of the stakeholders must be met, and most of the needs of the primary beneficiary. The
tactical decision makers must have their geospatial needs met, or they will seek geospatial information
from other sources. There are some small examples of this in the current state enterprise. For example,
many units are not satisfied with the capability of the Geographic Information System (GIS) that is
fielded to them by the Program of Record (POR.) So units will take discretionary funding and procure
additional geospatial capability outside of the AGE systems provided. This circumvention of the
enterprise occurs because not all of the essential needs were met within the enterprise solution. As the
future state architecture candidates are evaluated in chapter four, meeting the essential needs will be very
important to enterprise success.
3.4 Value Delivery - Enterprise Architecture ―As is‖ View Descriptions
The value delivery portion of the framework is how the value proposition is fulfilled in practice.
Value delivery occurs when all of the parts of the enterprise function. The degree of synchronization
among the functions of the enterprise contributes significantly to realized, or unrealized, value creation by
the enterprise.
As discussed in the chapter introduction, the view descriptions provide a very effective way to
understand the value delivery of the enterprise today. Each view has both structure and behavior, both are
important to properly characterize the perspective on the enterprise that the view is enlightening.
Table 3-3: Description of the Eight Views (Rhodes, Ross and Nightingale 2009)
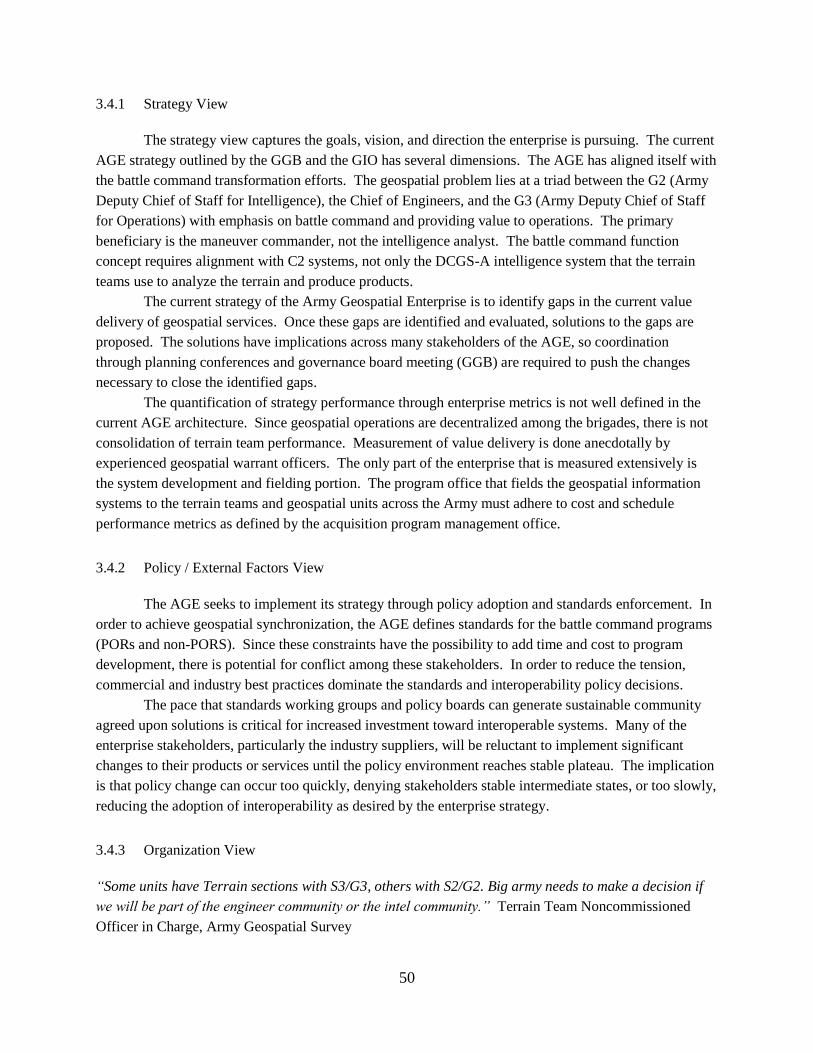
50
3.4.1 Strategy View
The strategy view captures the goals, vision, and direction the enterprise is pursuing. The current
AGE strategy outlined by the GGB and the GIO has several dimensions. The AGE has aligned itself with
the battle command transformation efforts. The geospatial problem lies at a triad between the G2 (Army
Deputy Chief of Staff for Intelligence), the Chief of Engineers, and the G3 (Army Deputy Chief of Staff
for Operations) with emphasis on battle command and providing value to operations. The primary
beneficiary is the maneuver commander, not the intelligence analyst. The battle command function
concept requires alignment with C2 systems, not only the DCGS-A intelligence system that the terrain
teams use to analyze the terrain and produce products.
The current strategy of the Army Geospatial Enterprise is to identify gaps in the current value
delivery of geospatial services. Once these gaps are identified and evaluated, solutions to the gaps are
proposed. The solutions have implications across many stakeholders of the AGE, so coordination
through planning conferences and governance board meeting (GGB) are required to push the changes
necessary to close the identified gaps.
The quantification of strategy performance through enterprise metrics is not well defined in the
current AGE architecture. Since geospatial operations are decentralized among the brigades, there is not
consolidation of terrain team performance. Measurement of value delivery is done anecdotally by
experienced geospatial warrant officers. The only part of the enterprise that is measured extensively is
the system development and fielding portion. The program office that fields the geospatial information
systems to the terrain teams and geospatial units across the Army must adhere to cost and schedule
performance metrics as defined by the acquisition program management office.
3.4.2 Policy / External Factors View
The AGE seeks to implement its strategy through policy adoption and standards enforcement. In
order to achieve geospatial synchronization, the AGE defines standards for the battle command programs
(PORs and non-PORS). Since these constraints have the possibility to add time and cost to program
development, there is potential for conflict among these stakeholders. In order to reduce the tension,
commercial and industry best practices dominate the standards and interoperability policy decisions.
The pace that standards working groups and policy boards can generate sustainable community
agreed upon solutions is critical for increased investment toward interoperable systems. Many of the
enterprise stakeholders, particularly the industry suppliers, will be reluctant to implement significant
changes to their products or services until the policy environment reaches stable plateau. The implication
is that policy change can occur too quickly, denying stakeholders stable intermediate states, or too slowly,
reducing the adoption of interoperability as desired by the enterprise strategy.
3.4.3 Organization View
“Some units have Terrain sections with S3/G3, others with S2/G2. Big army needs to make a decision if
we will be part of the engineer community or the intel community.” Terrain Team Noncommissioned
Officer in Charge, Army Geospatial Survey
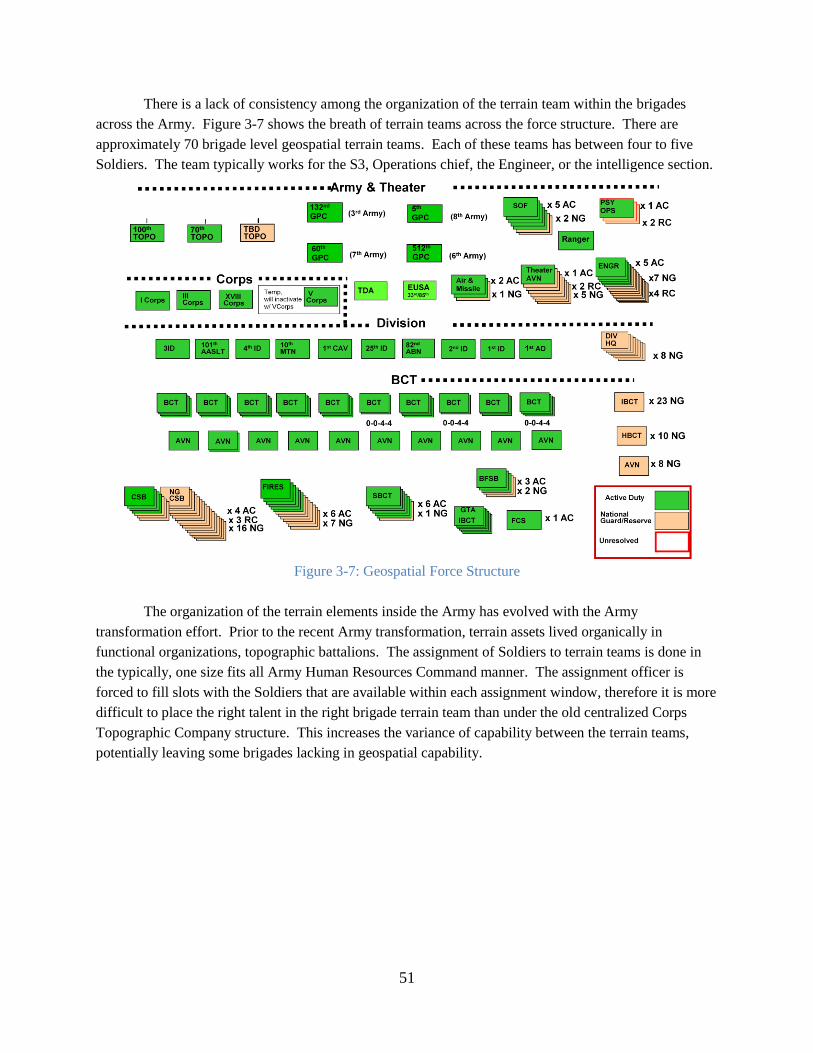
51
There is a lack of consistency among the organization of the terrain team within the brigades
across the Army. Figure 3-7 shows the breath of terrain teams across the force structure. There are
approximately 70 brigade level geospatial terrain teams. Each of these teams has between four to five
Soldiers. The team typically works for the S3, Operations chief, the Engineer, or the intelligence section.
Figure 3-7: Geospatial Force Structure
The organization of the terrain elements inside the Army has evolved with the Army
transformation effort. Prior to the recent Army transformation, terrain assets lived organically in
functional organizations, topographic battalions. The assignment of Soldiers to terrain teams is done in
the typically, one size fits all Army Human Resources Command manner. The assignment officer is
forced to fill slots with the Soldiers that are available within each assignment window, therefore it is more
difficult to place the right talent in the right brigade terrain team than under the old centralized Corps
Topographic Company structure. This increases the variance of capability between the terrain teams,
potentially leaving some brigades lacking in geospatial capability.
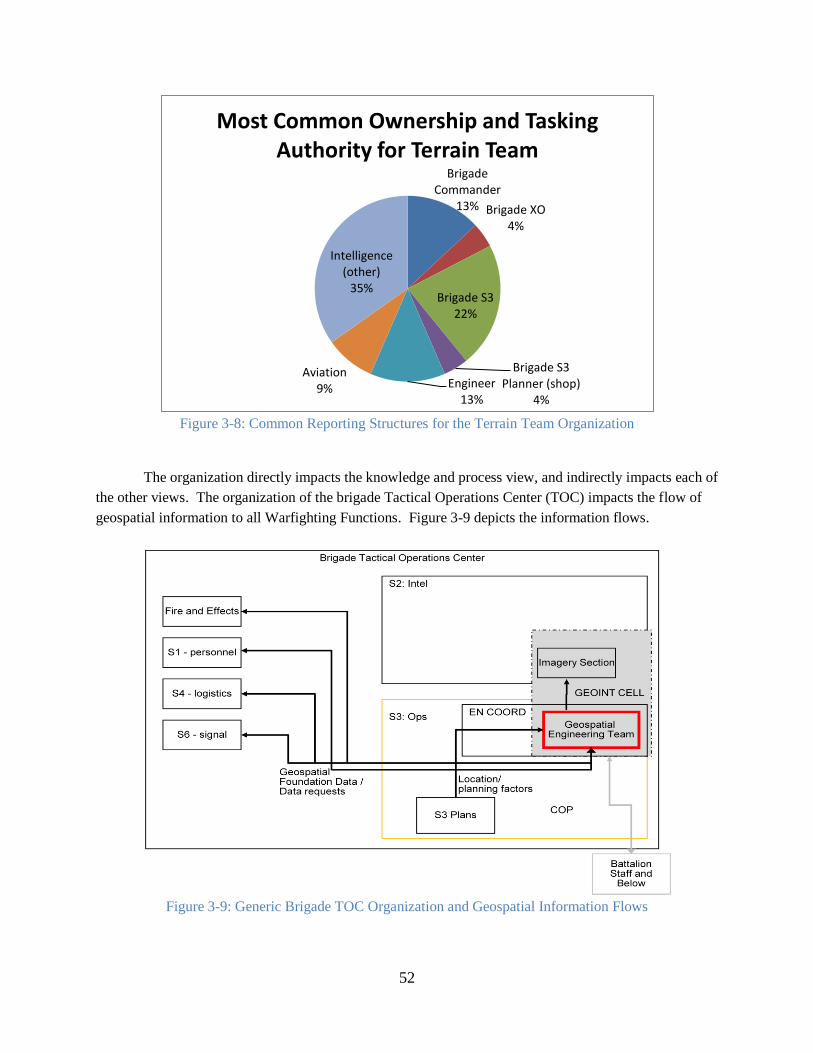
52
Figure 3-8: Common Reporting Structures for the Terrain Team Organization
The organization directly impacts the knowledge and process view, and indirectly impacts each of
the other views. The organization of the brigade Tactical Operations Center (TOC) impacts the flow of
geospatial information to all Warfighting Functions. Figure 3-9 depicts the information flows.
Figure 3-9: Generic Brigade TOC Organization and Geospatial Information Flows
Brigade Commander
13% Brigade XO4%
Brigade S322%
Brigade S3 Planner (shop)
4%
Engineer13%
Aviation9%
Intelligence (other)
35%
Most Common Ownership and Tasking Authority for Terrain Team
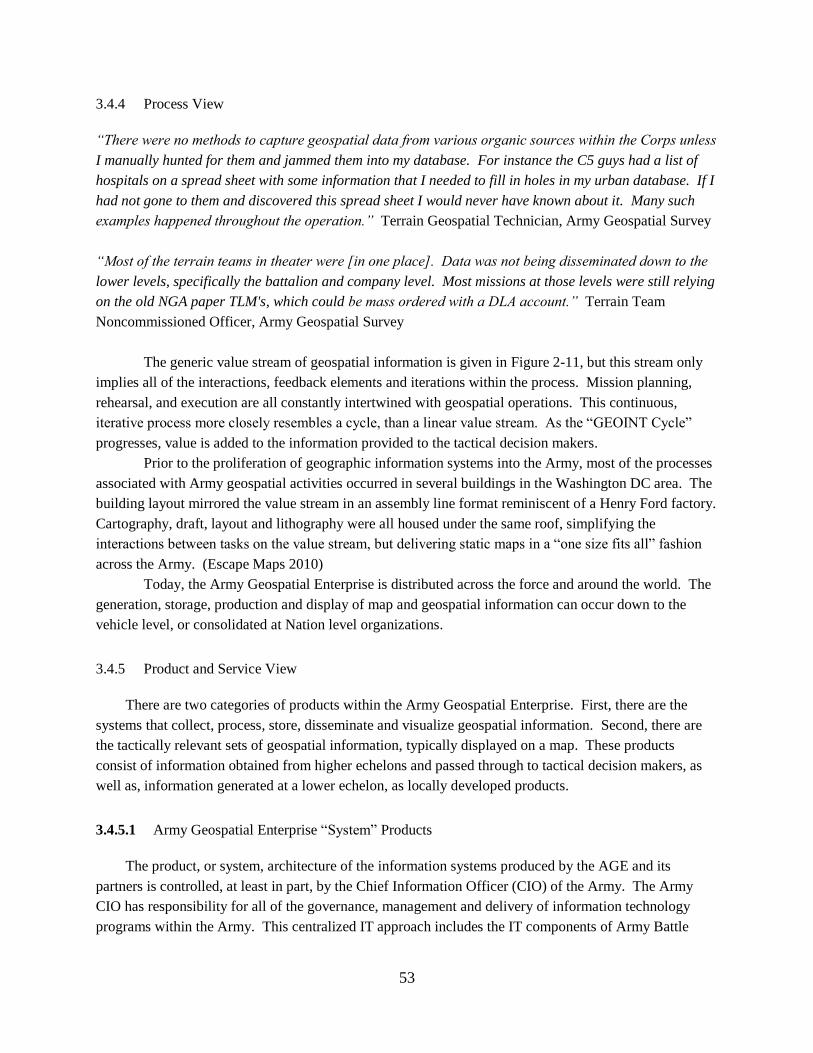
53
3.4.4 Process View
“There were no methods to capture geospatial data from various organic sources within the Corps unless
I manually hunted for them and jammed them into my database. For instance the C5 guys had a list of
hospitals on a spread sheet with some information that I needed to fill in holes in my urban database. If I
had not gone to them and discovered this spread sheet I would never have known about it. Many such
examples happened throughout the operation.” Terrain Geospatial Technician, Army Geospatial Survey
“Most of the terrain teams in theater were [in one place]. Data was not being disseminated down to the
lower levels, specifically the battalion and company level. Most missions at those levels were still relying
on the old NGA paper TLM's, which could be mass ordered with a DLA account.” Terrain Team
Noncommissioned Officer, Army Geospatial Survey
The generic value stream of geospatial information is given in Figure 2-11, but this stream only
implies all of the interactions, feedback elements and iterations within the process. Mission planning,
rehearsal, and execution are all constantly intertwined with geospatial operations. This continuous,
iterative process more closely resembles a cycle, than a linear value stream. As the ―GEOINT Cycle‖
progresses, value is added to the information provided to the tactical decision makers.
Prior to the proliferation of geographic information systems into the Army, most of the processes
associated with Army geospatial activities occurred in several buildings in the Washington DC area. The
building layout mirrored the value stream in an assembly line format reminiscent of a Henry Ford factory.
Cartography, draft, layout and lithography were all housed under the same roof, simplifying the
interactions between tasks on the value stream, but delivering static maps in a ―one size fits all‖ fashion
across the Army. (Escape Maps 2010)
Today, the Army Geospatial Enterprise is distributed across the force and around the world. The
generation, storage, production and display of map and geospatial information can occur down to the
vehicle level, or consolidated at Nation level organizations.
3.4.5 Product and Service View
There are two categories of products within the Army Geospatial Enterprise. First, there are the
systems that collect, process, store, disseminate and visualize geospatial information. Second, there are
the tactically relevant sets of geospatial information, typically displayed on a map. These products
consist of information obtained from higher echelons and passed through to tactical decision makers, as
well as, information generated at a lower echelon, as locally developed products.
3.4.5.1 Army Geospatial Enterprise ―System‖ Products
The product, or system, architecture of the information systems produced by the AGE and its
partners is controlled, at least in part, by the Chief Information Officer (CIO) of the Army. The Army
CIO has responsibility for all of the governance, management and delivery of information technology
programs within the Army. This centralized IT approach includes the IT components of Army Battle
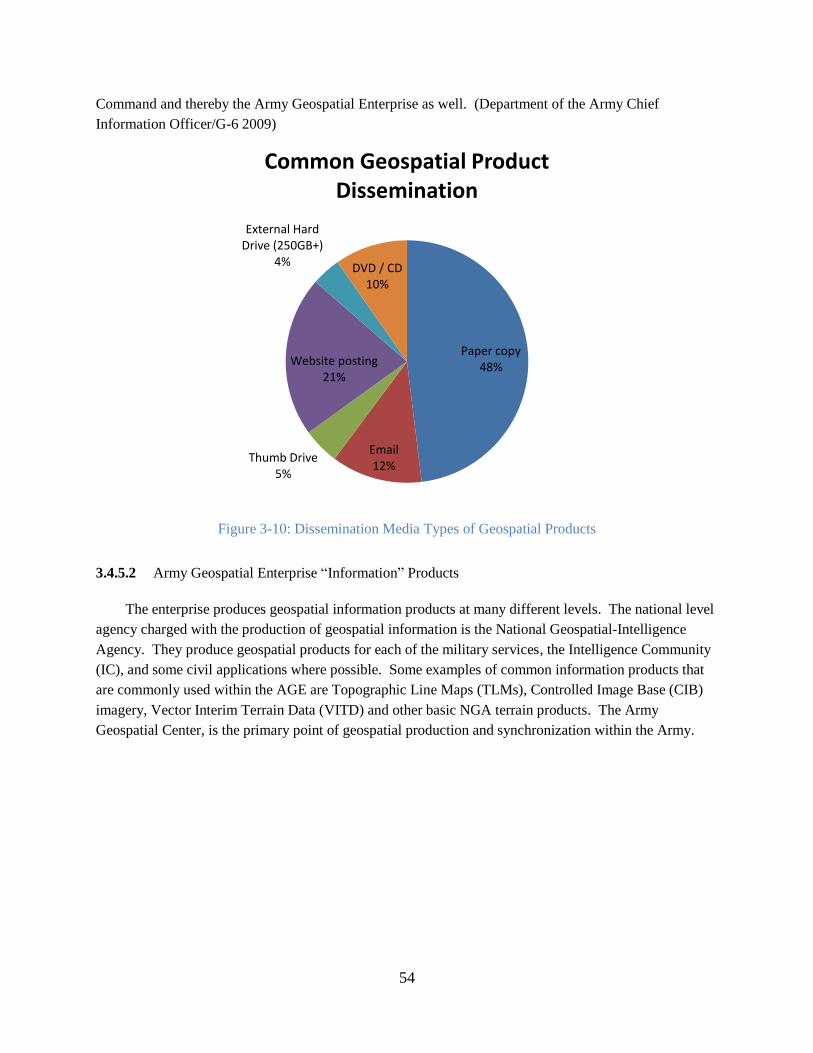
54
Command and thereby the Army Geospatial Enterprise as well. (Department of the Army Chief
Information Officer/G-6 2009)
Figure 3-10: Dissemination Media Types of Geospatial Products
3.4.5.2 Army Geospatial Enterprise ―Information‖ Products
The enterprise produces geospatial information products at many different levels. The national level
agency charged with the production of geospatial information is the National Geospatial-Intelligence
Agency. They produce geospatial products for each of the military services, the Intelligence Community
(IC), and some civil applications where possible. Some examples of common information products that
are commonly used within the AGE are Topographic Line Maps (TLMs), Controlled Image Base (CIB)
imagery, Vector Interim Terrain Data (VITD) and other basic NGA terrain products. The Army
Geospatial Center, is the primary point of geospatial production and synchronization within the Army.
Paper copy48%
Email12%
Thumb Drive5%
Website posting21%
External Hard Drive (250GB+)
4% DVD / CD10%
Common Geospatial Product Dissemination
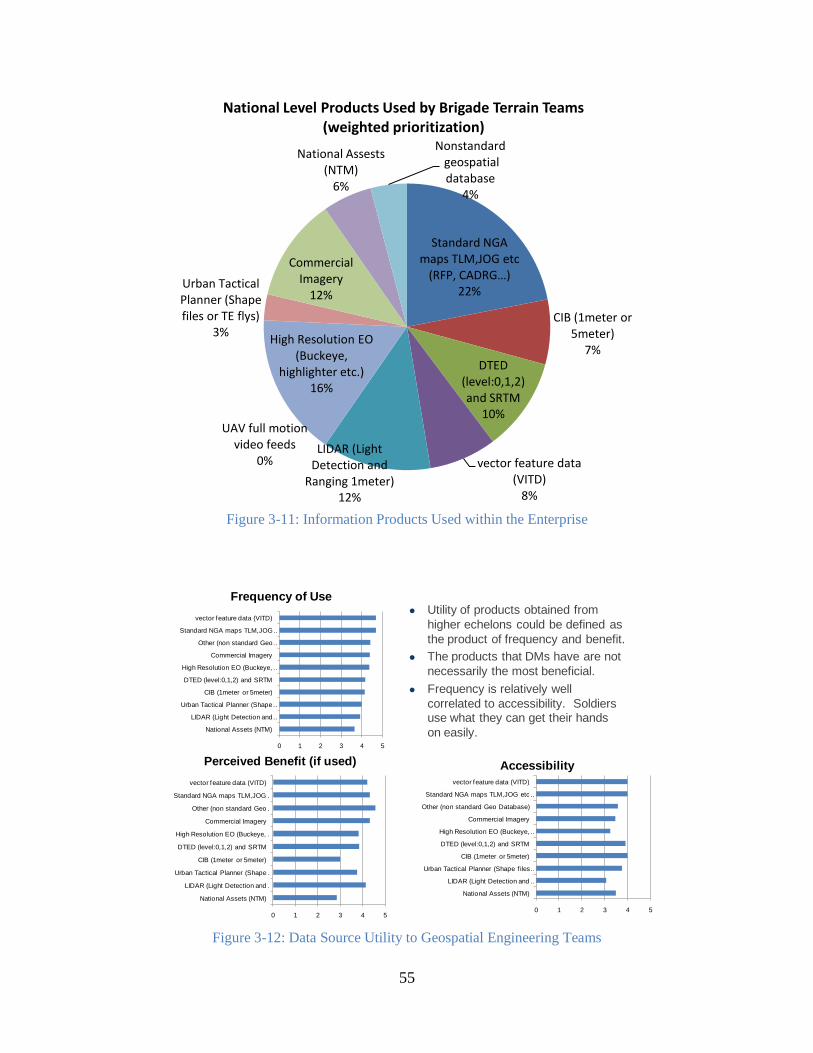
55
Figure 3-11: Information Products Used within the Enterprise
Figure 3-12: Data Source Utility to Geospatial Engineering Teams
Standard NGA maps TLM,JOG etc
(RFP, CADRG…)22%
CIB (1meter or 5meter)
7%DTED
(level:0,1,2) and SRTM
10%
vector feature data (VITD)
8%
LIDAR (Light Detection and
Ranging 1meter)12%
UAV full motion video feeds
0%
High Resolution EO (Buckeye,
highlighter etc.)16%
Urban Tactical Planner (Shape files or TE flys)
3%
Commercial Imagery
12%
National Assests (NTM)
6%
Nonstandardgeospatial database
4%
National Level Products Used by Brigade Terrain Teams(weighted prioritization)
Utility of products obtained from
higher echelons could be defined as
the product of frequency and benefit.
The products that DMs have are not
necessarily the most beneficial.
Frequency is relatively well
correlated to accessibility. Soldiers use what they can get their hands
on easily.0 1 2 3 4 5
National Assets (NTM)
LIDAR (Light Detection and …
Urban Tactical Planner (Shape …
CIB (1meter or 5meter)
DTED (level:0,1,2) and SRTM
High Resolution EO (Buckeye, …
Commercial Imagery
Other (non standard Geo …
Standard NGA maps TLM,JOG …
vector feature data (VITD)
Frequency of Use
0 1 2 3 4 5
National Assets (NTM)
LIDAR (Light Detection and …
Urban Tactical Planner (Shape …
CIB (1meter or 5meter)
DTED (level:0,1,2) and SRTM
High Resolution EO (Buckeye, …
Commercial Imagery
Other (non standard Geo …
Standard NGA maps TLM,JOG …
vector feature data (VITD)
Perceived Benefit (if used)
0 1 2 3 4 5
National Assets (NTM)
LIDAR (Light Detection and …
Urban Tactical Planner (Shape f iles …
CIB (1meter or 5meter)
DTED (level:0,1,2) and SRTM
High Resolution EO (Buckeye, …
Commercial Imagery
Other (non standard Geo Database)
Standard NGA maps TLM,JOG etc …
vector feature data (VITD)
Accessibility
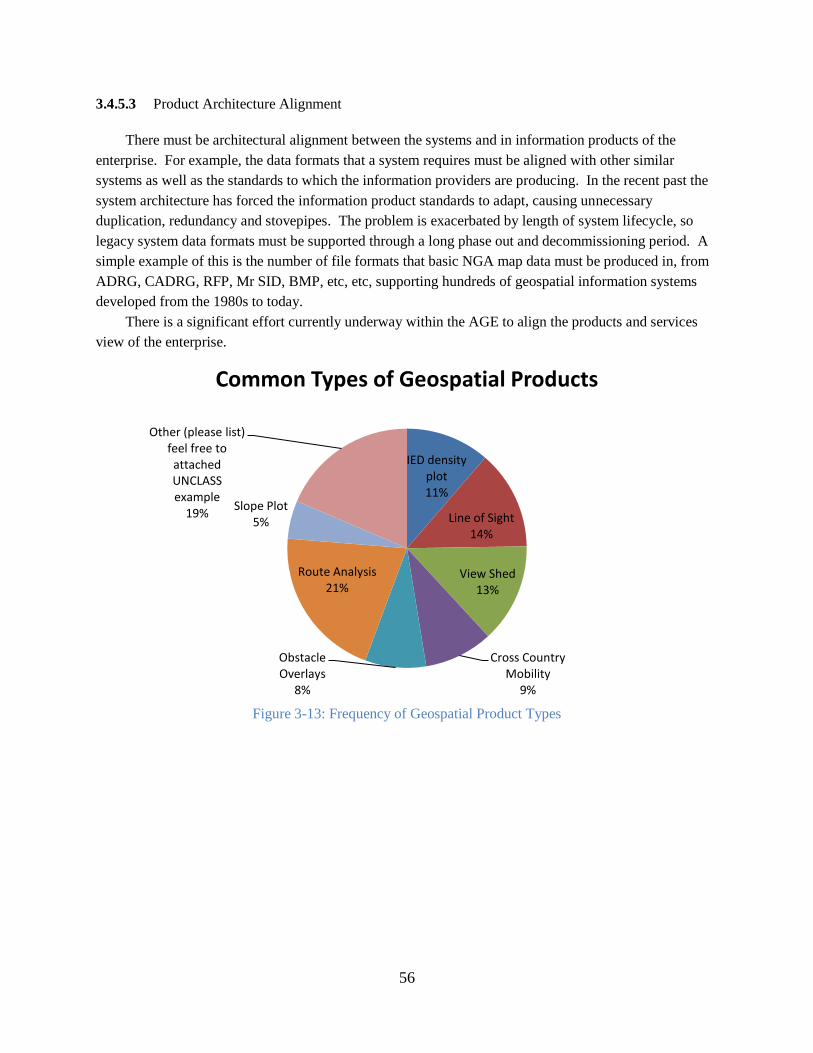
56
3.4.5.3 Product Architecture Alignment
There must be architectural alignment between the systems and in information products of the
enterprise. For example, the data formats that a system requires must be aligned with other similar
systems as well as the standards to which the information providers are producing. In the recent past the
system architecture has forced the information product standards to adapt, causing unnecessary
duplication, redundancy and stovepipes. The problem is exacerbated by length of system lifecycle, so
legacy system data formats must be supported through a long phase out and decommissioning period. A
simple example of this is the number of file formats that basic NGA map data must be produced in, from
ADRG, CADRG, RFP, Mr SID, BMP, etc, etc, supporting hundreds of geospatial information systems
developed from the 1980s to today.
There is a significant effort currently underway within the AGE to align the products and services
view of the enterprise.
Figure 3-13: Frequency of Geospatial Product Types
IED density plot11%
Line of Sight14%
View Shed13%
Cross Country Mobility
9%
Obstacle Overlays
8%
Route Analysis21%
Slope Plot5%
Other (please list) feel free to attached UNCLASS example
19%
Common Types of Geospatial Products
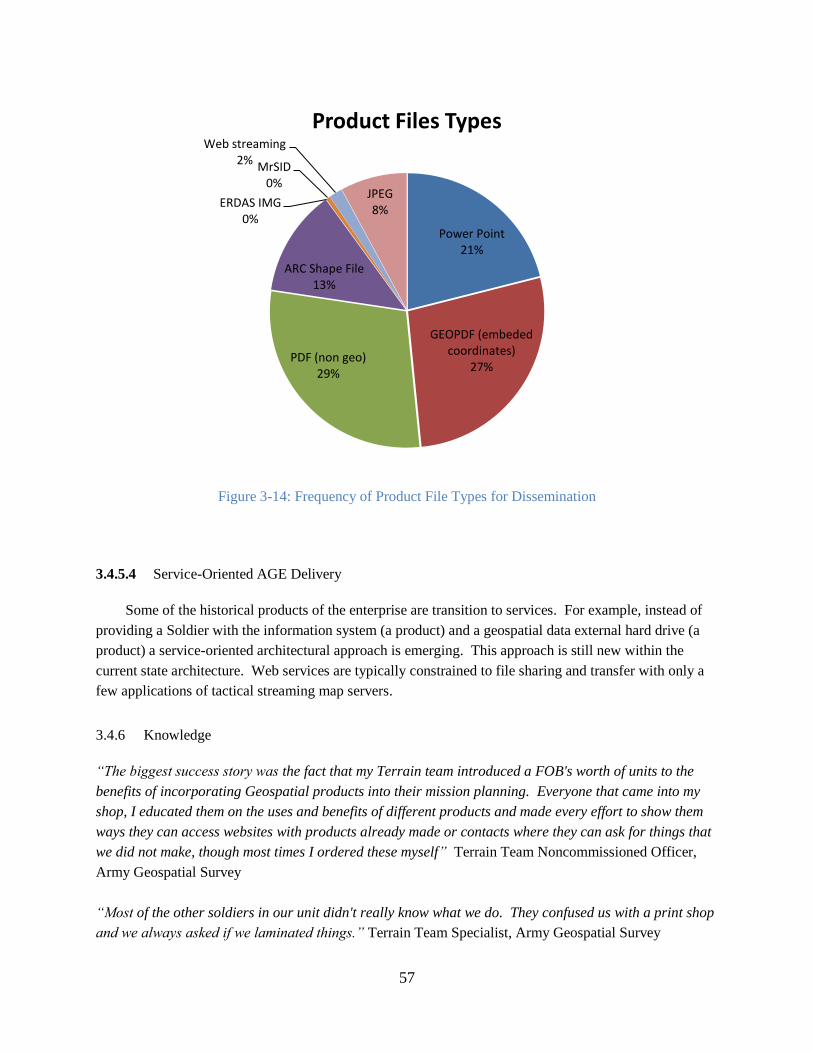
57
Figure 3-14: Frequency of Product File Types for Dissemination
3.4.5.4 Service-Oriented AGE Delivery
Some of the historical products of the enterprise are transition to services. For example, instead of
providing a Soldier with the information system (a product) and a geospatial data external hard drive (a
product) a service-oriented architectural approach is emerging. This approach is still new within the
current state architecture. Web services are typically constrained to file sharing and transfer with only a
few applications of tactical streaming map servers.
3.4.6 Knowledge
“The biggest success story was the fact that my Terrain team introduced a FOB's worth of units to the
benefits of incorporating Geospatial products into their mission planning. Everyone that came into my
shop, I educated them on the uses and benefits of different products and made every effort to show them
ways they can access websites with products already made or contacts where they can ask for things that
we did not make, though most times I ordered these myself” Terrain Team Noncommissioned Officer,
Army Geospatial Survey
“Most of the other soldiers in our unit didn't really know what we do. They confused us with a print shop
and we always asked if we laminated things.” Terrain Team Specialist, Army Geospatial Survey
Power Point21%
GEOPDF (embeded coordinates)
27%PDF (non geo)
29%
ARC Shape File13%
ERDAS IMG0%
MrSID0%
Web streaming2%
JPEG8%
Product Files Types
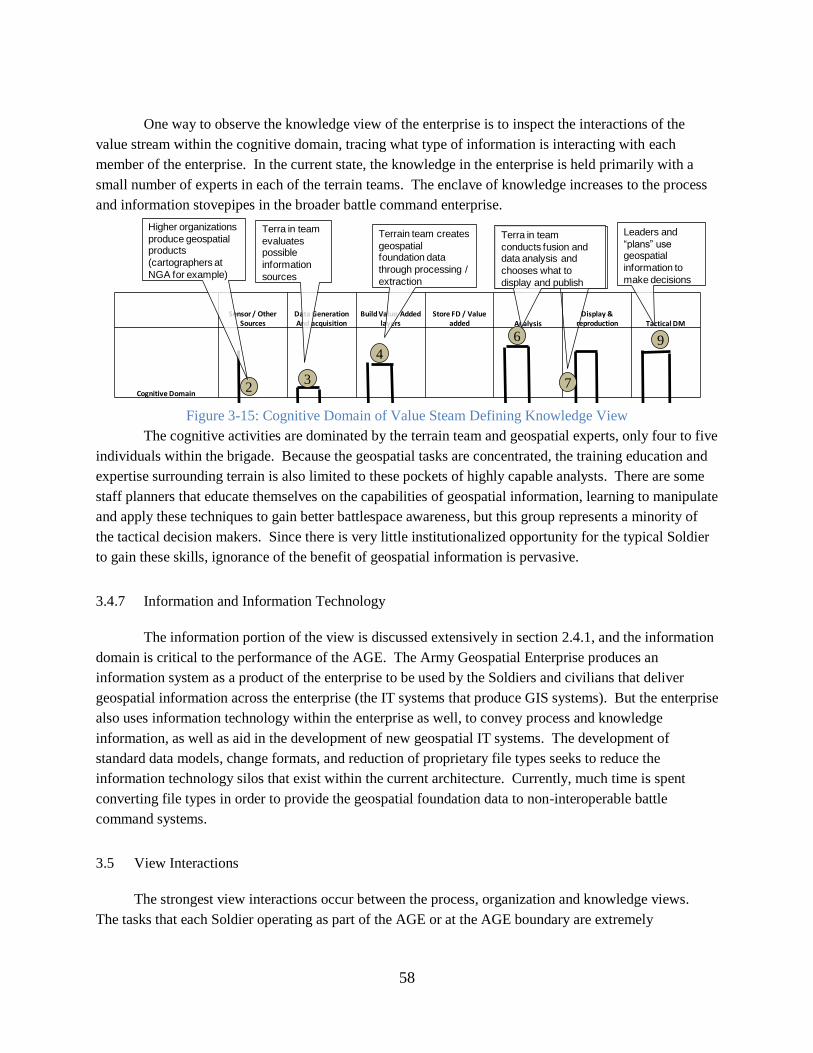
58
One way to observe the knowledge view of the enterprise is to inspect the interactions of the
value stream within the cognitive domain, tracing what type of information is interacting with each
member of the enterprise. In the current state, the knowledge in the enterprise is held primarily with a
small number of experts in each of the terrain teams. The enclave of knowledge increases to the process
and information stovepipes in the broader battle command enterprise.
Figure 3-15: Cognitive Domain of Value Steam Defining Knowledge View
The cognitive activities are dominated by the terrain team and geospatial experts, only four to five
individuals within the brigade. Because the geospatial tasks are concentrated, the training education and
expertise surrounding terrain is also limited to these pockets of highly capable analysts. There are some
staff planners that educate themselves on the capabilities of geospatial information, learning to manipulate
and apply these techniques to gain better battlespace awareness, but this group represents a minority of
the tactical decision makers. Since there is very little institutionalized opportunity for the typical Soldier
to gain these skills, ignorance of the benefit of geospatial information is pervasive.
3.4.7 Information and Information Technology
The information portion of the view is discussed extensively in section 2.4.1, and the information
domain is critical to the performance of the AGE. The Army Geospatial Enterprise produces an
information system as a product of the enterprise to be used by the Soldiers and civilians that deliver
geospatial information across the enterprise (the IT systems that produce GIS systems). But the enterprise
also uses information technology within the enterprise as well, to convey process and knowledge
information, as well as aid in the development of new geospatial IT systems. The development of
standard data models, change formats, and reduction of proprietary file types seeks to reduce the
information technology silos that exist within the current architecture. Currently, much time is spent
converting file types in order to provide the geospatial foundation data to non-interoperable battle
command systems.
3.5 View Interactions
The strongest view interactions occur between the process, organization and knowledge views.
The tasks that each Soldier operating as part of the AGE or at the AGE boundary are extremely
Sensor / Other Sources
Data GenerationAnd acquisition
Build Value Added layers
Store FD / Value added Analysis
Display & reproduction Tactical DM
Cognitive Domain7
6
4
32
9
Higher organizations
produce geospatial products
(cartographers at
NGA for example)
Terrain team creates
geospatial foundation data
through processing /
extraction
Terra in team
evaluates possible
information
sources
Terra in team
conducts fusion and data analysis and
chooses what to
display and publish
Leaders and
“plans” use geospatial
information to
make decisions
59
significant to the force structure of those units as well as the knowledge required by those individuals for
successful task completion.
Another interesting view interaction is between the policy and strategy views. In the AGE, many
of the strategic goals of the enterprise are achieved through policy. ―The AGE described in this CONOPS
is not a new program or system. It is a set of Army policies, directions, and standards that will be
implemented by existing and future BC Programs, and BC non-Programs, to ensure migration to and
establishment of a standard and sharable GF‖ (TRADOC Capability Manager Geospatial 2009). In turn,
the ability of policy intervention to achieve the strategic goals will shape future strategy. For example, if
the standardization of data models through acquisition policy did not achieve information
synchronization, a new strategic approach would be sought to align the battle command system
development efforts across the Army. In this way iteration between policy and strategy is essential to
success
3.6 Modeling the AGE Dynamics at the Enterprise Boundary
A model, capable of simulation, is one method to understand how the design variables of the
enterprise yield the desired attributes of the stakeholders. A model encompassing all of the stakeholders
(internal and external) of the AGE could be developed in order to show all of the dynamics within the
enterprise, but this model would be quite complex. Another approach is to model only the necessary
elements that provide insight into the areas of the enterprise that are of most interest. The work of this
thesis is focused on how the AGE interacts with the lowest echelons of the Army force structure, how
geospatial information moves about the brigade level and below, and how this information informs
tactical decision making at the dismounted Soldier level.
3.6.1 Description of the model
In order to model the current state architecture and the future state in chapter four, System Dynamics
(SD) modeling will be employed to understand the information dynamics of the AGE. The goal is to gain
insight into the system level effects of changing the ―knobs‖ discussed above within each view of the
enterprise, as well as the complex behavior that results due to the interactions of the views as stated in
enterprise architecture framework discussion in section 3.1.1. System dynamics is an appropriate choice
of modeling tool due to its versatility to a wide set of applications.
System Dynamics is a model method developed by Jay Forrester at MIT in the 1950s. The method
divides the world up into stocks and flows. A stock is anything that accumulates past events, an integral
or state variable. A flow is a change to a stock, a rate or derivative. System Dynamics models changes to
stocks by flows over some time period. A typical analogy for describing stocks and flows is to equate
them to a bathtub. The water in the bathtub at any given moment in time is a stock. The water flowing
from the facet and the water running out of the drain or the flows that define the amount of water in the
tub, given some initial condition. For the model of the Army Geospatial Enterprise, an aggregate of
Soldier perception of the benefit of the geospatial information is the stock, and the flow is the addition of
utility from new information, or the decrease in utility as the information deteriorates over time.
60
In order to best understand the effects of changes in the Army Geospatial Enterprise, a simple model
of the benefit and flow of geospatial foundation data throughout the brigade and below is developed and
simulated. The model has three primary feedback structures and four other flow structures of interest.
The key stocks within the model all attempt to measure the utility of the geospatial database at each
level of the brigade. This aggregate measurement makes several simplifying assumptions:
- The geospatial databases are the same at each echelon. For example, each battalion in the brigade
has the same geospatial foundation data. This can be different from the foundation layer at the
brigade or company level, but each of the three to eight battalions in the brigade are equivalent.
- The geospatial foundation data utility is only loosely related to the physical storage size of the
database. For example, the utility of database with zero bytes of information is also zero, but two
databases of equal physical size, 100GB for example, may not have the same utility. The utility
is based on the quality of the information in the database, and the mission information
requirements levied against the information.
- The utility of the geospatial foundation layer is inversely proportional to the age of the
information; this represents a decrease in quality of the information over time. The constant of
proportionality is dependent on the nature of the mission and the dynamics of the terrain that the
mission operates upon.
The remaining structure of the model attempts to capture the dynamics of the enterprise effects on
geospatial foundation data utility over the course of a notional 450 day mission. There are several key
points of time within the model representing activities of the mission cycle.
- Day 0: The brigade is located at home station. A mission is received from division level.
Mission planning begins with no prior knowledge of the terrain.
- Day 15: The unit deploys to the theater of operations. The geospatial data foundation layer
initialization process is complete (at whatever state the initialization has progressed to) and
operations begin.
- Day 330: In the base case and Epoch B and C discussed below, this is the only instance of a
change of mission issued to the brigade. For the intervening 315 days, the unit had been
operating continually over the same terrain with roughly the same mission set.
- Day 331: A new unit begins operations on the terrain. It has received information briefings and
data sets from the unit relieved, but there has been significant loss of the total understanding of
the terrain due to the change in personnel, misplacement of information, and lack of experience
with the mission.
- Day 450: The simulation concludes and measures the utility of the geospatial foundation layers
averaged throughout the simulation. The five layers measured are each stock of the utility of the
foundation layer at each level of the brigade: the terrain team, the brigade staff, the battalion, the
company, and the individual or platform, which includes the gained experiences of the
individuals from operations.
3.6.2 Feedback structure of the base model
The dynamics of the Army Geospatial Enterprise at the brigade level are modeled with causal
loop diagrams. Three causal loops described below are the three primary drivers of the model behavior
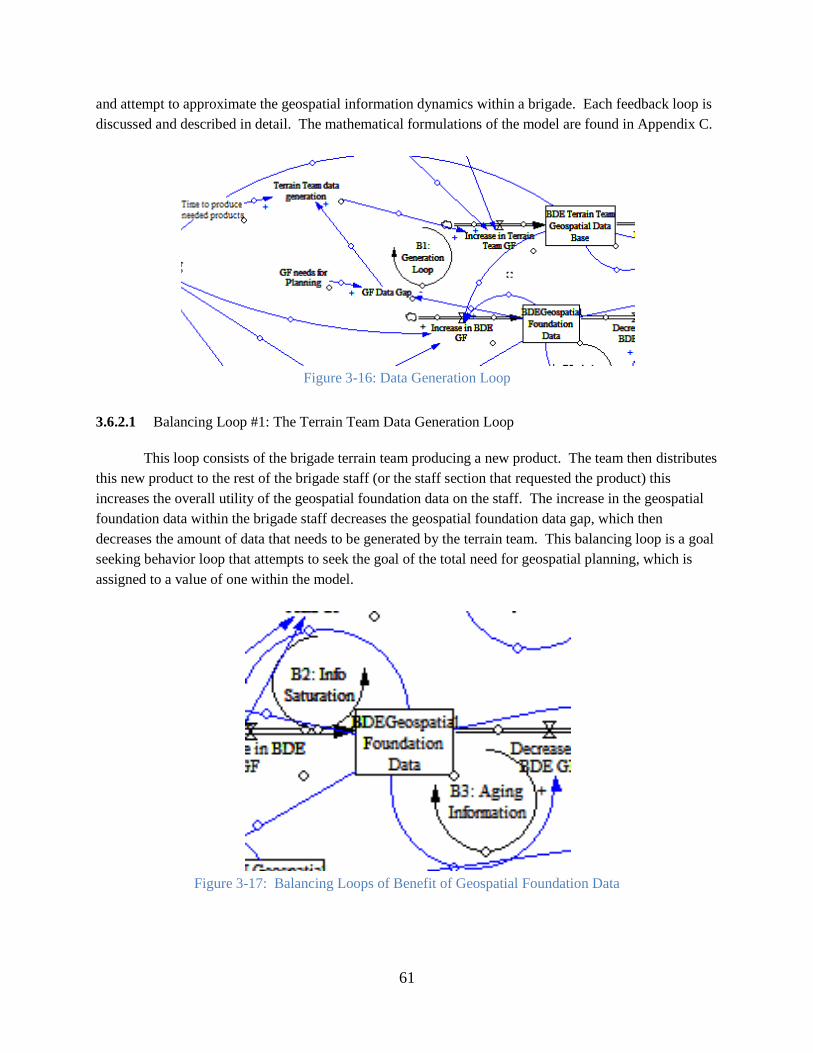
61
and attempt to approximate the geospatial information dynamics within a brigade. Each feedback loop is
discussed and described in detail. The mathematical formulations of the model are found in Appendix C.
Figure 3-16: Data Generation Loop
3.6.2.1 Balancing Loop #1: The Terrain Team Data Generation Loop
This loop consists of the brigade terrain team producing a new product. The team then distributes
this new product to the rest of the brigade staff (or the staff section that requested the product) this
increases the overall utility of the geospatial foundation data on the staff. The increase in the geospatial
foundation data within the brigade staff decreases the geospatial foundation data gap, which then
decreases the amount of data that needs to be generated by the terrain team. This balancing loop is a goal
seeking behavior loop that attempts to seek the goal of the total need for geospatial planning, which is
assigned to a value of one within the model.
Figure 3-17: Balancing Loops of Benefit of Geospatial Foundation Data
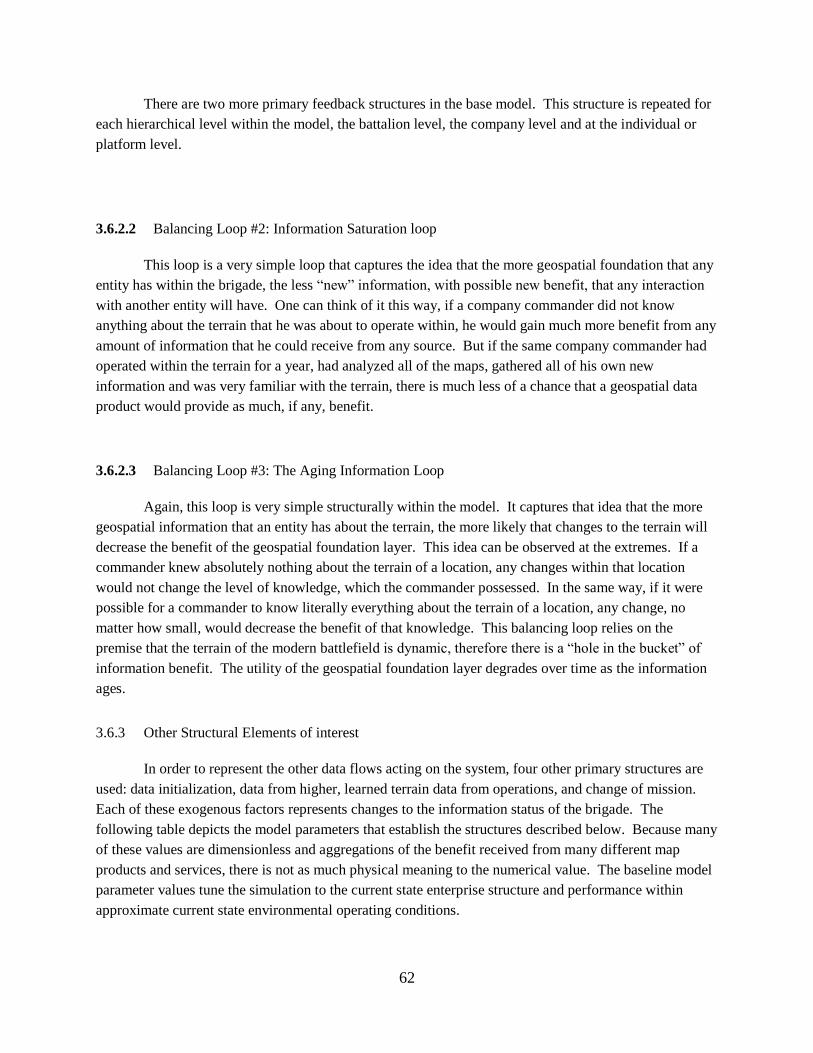
62
There are two more primary feedback structures in the base model. This structure is repeated for
each hierarchical level within the model, the battalion level, the company level and at the individual or
platform level.
3.6.2.2 Balancing Loop #2: Information Saturation loop
This loop is a very simple loop that captures the idea that the more geospatial foundation that any
entity has within the brigade, the less ―new‖ information, with possible new benefit, that any interaction
with another entity will have. One can think of it this way, if a company commander did not know
anything about the terrain that he was about to operate within, he would gain much more benefit from any
amount of information that he could receive from any source. But if the same company commander had
operated within the terrain for a year, had analyzed all of the maps, gathered all of his own new
information and was very familiar with the terrain, there is much less of a chance that a geospatial data
product would provide as much, if any, benefit.
3.6.2.3 Balancing Loop #3: The Aging Information Loop
Again, this loop is very simple structurally within the model. It captures that idea that the more
geospatial information that an entity has about the terrain, the more likely that changes to the terrain will
decrease the benefit of the geospatial foundation layer. This idea can be observed at the extremes. If a
commander knew absolutely nothing about the terrain of a location, any changes within that location
would not change the level of knowledge, which the commander possessed. In the same way, if it were
possible for a commander to know literally everything about the terrain of a location, any change, no
matter how small, would decrease the benefit of that knowledge. This balancing loop relies on the
premise that the terrain of the modern battlefield is dynamic, therefore there is a ―hole in the bucket‖ of
information benefit. The utility of the geospatial foundation layer degrades over time as the information
ages.
3.6.3 Other Structural Elements of interest
In order to represent the other data flows acting on the system, four other primary structures are
used: data initialization, data from higher, learned terrain data from operations, and change of mission.
Each of these exogenous factors represents changes to the information status of the brigade. The
following table depicts the model parameters that establish the structures described below. Because many
of these values are dimensionless and aggregations of the benefit received from many different map
products and services, there is not as much physical meaning to the numerical value. The baseline model
parameter values tune the simulation to the current state enterprise structure and performance within
approximate current state environmental operating conditions.
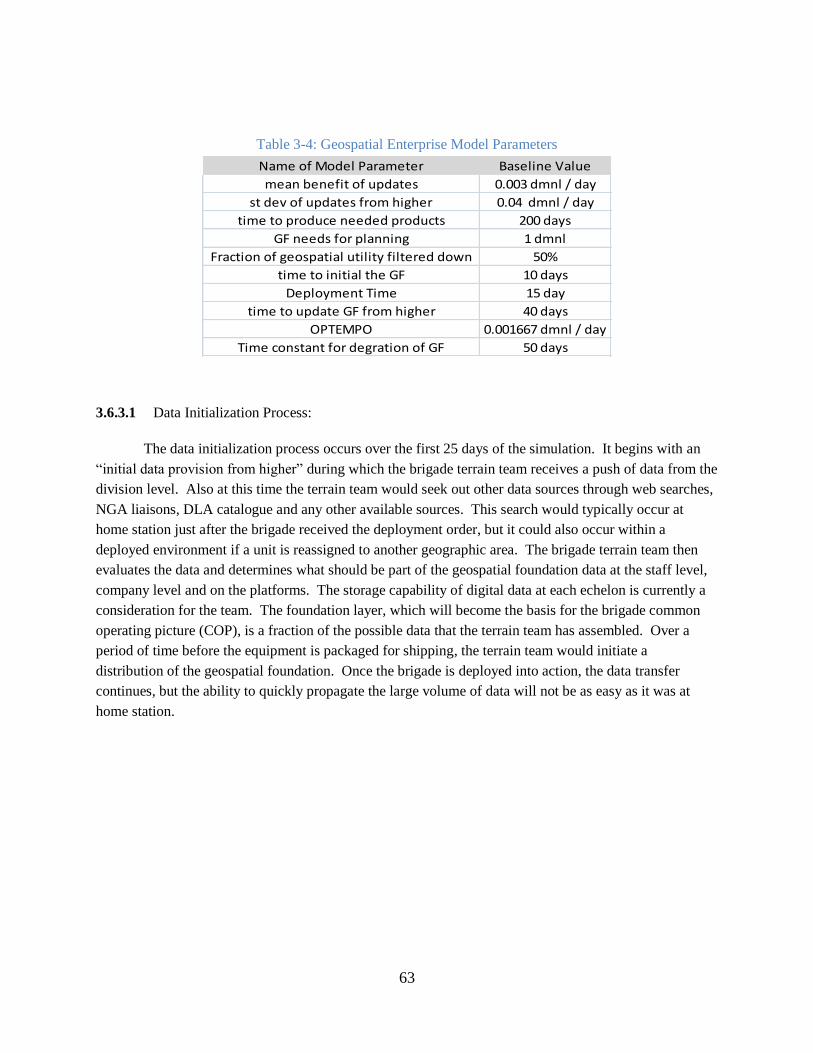
63
Table 3-4: Geospatial Enterprise Model Parameters
Name of Model Parameter Baseline Value
mean benefit of updates 0.003 dmnl / day
st dev of updates from higher 0.04 dmnl / day
time to produce needed products 200 days
GF needs for planning 1 dmnl
Fraction of geospatial utility filtered down 50%
time to initial the GF 10 days
Deployment Time 15 day
time to update GF from higher 40 days
OPTEMPO 0.001667 dmnl / day
Time constant for degration of GF 50 days
3.6.3.1 Data Initialization Process:
The data initialization process occurs over the first 25 days of the simulation. It begins with an
―initial data provision from higher‖ during which the brigade terrain team receives a push of data from the
division level. Also at this time the terrain team would seek out other data sources through web searches,
NGA liaisons, DLA catalogue and any other available sources. This search would typically occur at
home station just after the brigade received the deployment order, but it could also occur within a
deployed environment if a unit is reassigned to another geographic area. The brigade terrain team then
evaluates the data and determines what should be part of the geospatial foundation data at the staff level,
company level and on the platforms. The storage capability of digital data at each echelon is currently a
consideration for the team. The foundation layer, which will become the basis for the brigade common
operating picture (COP), is a fraction of the possible data that the terrain team has assembled. Over a
period of time before the equipment is packaged for shipping, the terrain team would initiate a
distribution of the geospatial foundation. Once the brigade is deployed into action, the data transfer
continues, but the ability to quickly propagate the large volume of data will not be as easy as it was at
home station.
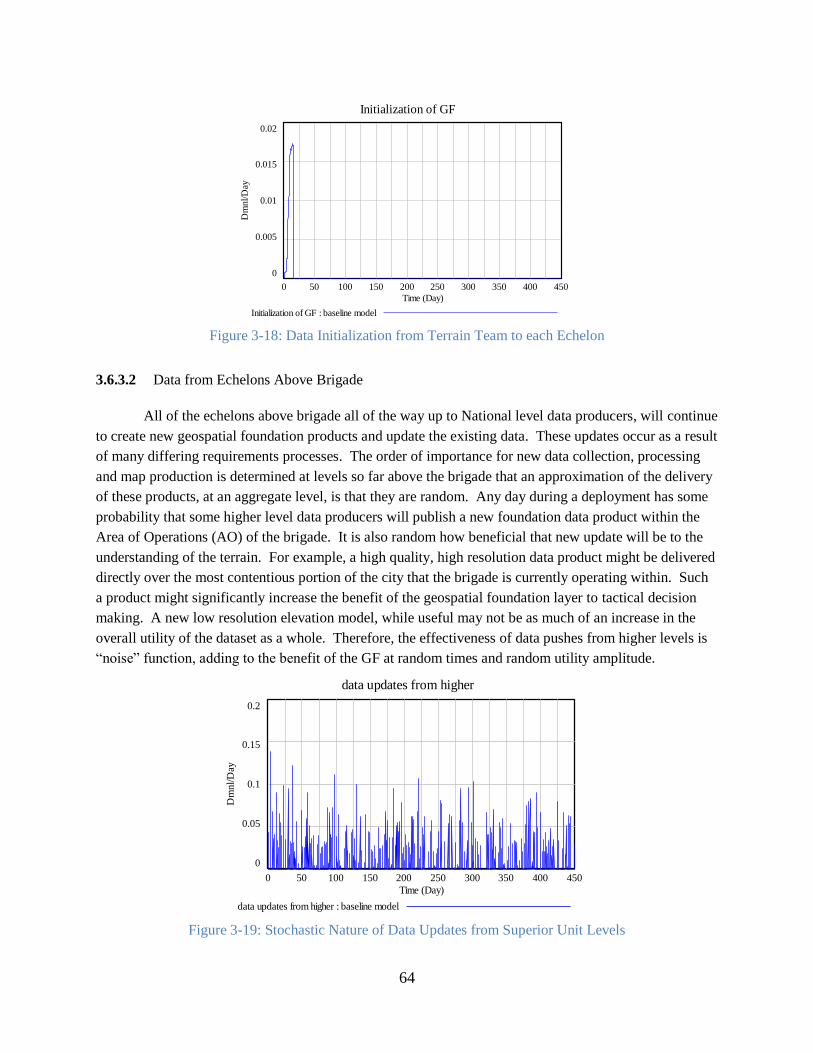
64
Figure 3-18: Data Initialization from Terrain Team to each Echelon
3.6.3.2 Data from Echelons Above Brigade
All of the echelons above brigade all of the way up to National level data producers, will continue
to create new geospatial foundation products and update the existing data. These updates occur as a result
of many differing requirements processes. The order of importance for new data collection, processing
and map production is determined at levels so far above the brigade that an approximation of the delivery
of these products, at an aggregate level, is that they are random. Any day during a deployment has some
probability that some higher level data producers will publish a new foundation data product within the
Area of Operations (AO) of the brigade. It is also random how beneficial that new update will be to the
understanding of the terrain. For example, a high quality, high resolution data product might be delivered
directly over the most contentious portion of the city that the brigade is currently operating within. Such
a product might significantly increase the benefit of the geospatial foundation layer to tactical decision
making. A new low resolution elevation model, while useful may not be as much of an increase in the
overall utility of the dataset as a whole. Therefore, the effectiveness of data pushes from higher levels is
―noise‖ function, adding to the benefit of the GF at random times and random utility amplitude.
Figure 3-19: Stochastic Nature of Data Updates from Superior Unit Levels
Initialization of GF
0.02
0.015
0.01
0.005
0
0 50 100 150 200 250 300 350 400 450
Time (Day)
Dm
nl/D
ay
Initialization of GF : baseline model
data updates from higher
0.2
0.15
0.1
0.05
0
0 50 100 150 200 250 300 350 400 450
Time (Day)
Dm
nl/D
ay
data updates from higher : baseline model
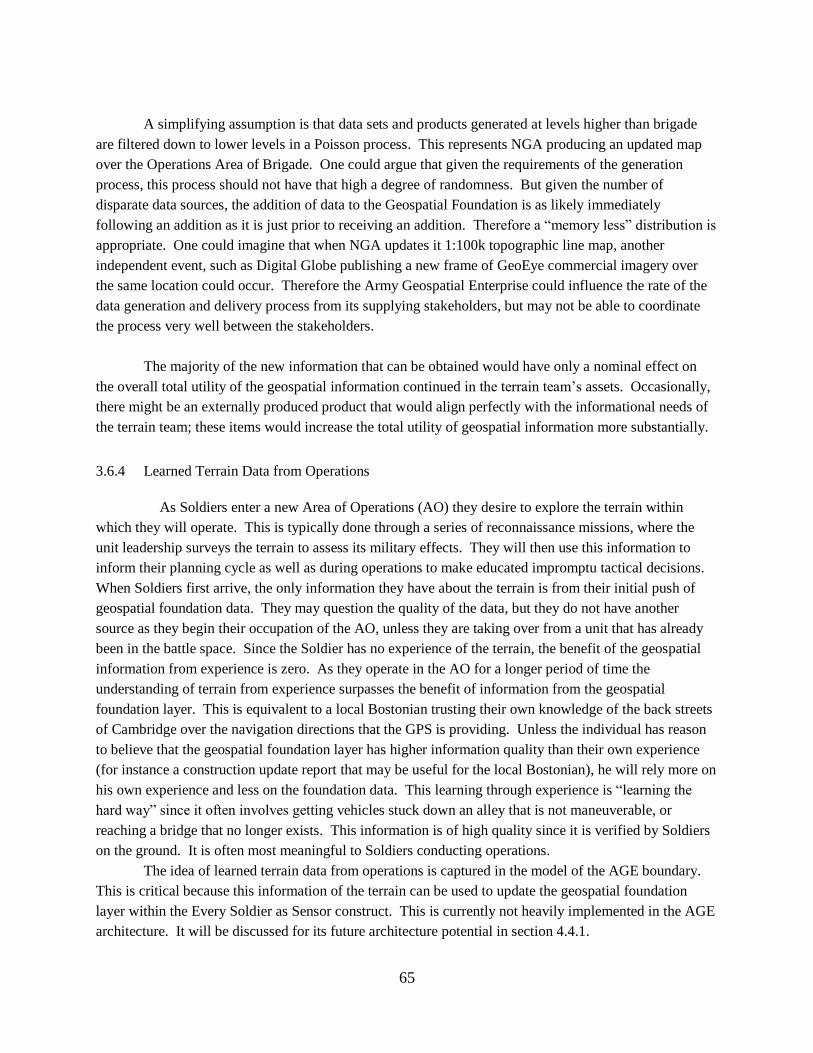
65
A simplifying assumption is that data sets and products generated at levels higher than brigade
are filtered down to lower levels in a Poisson process. This represents NGA producing an updated map
over the Operations Area of Brigade. One could argue that given the requirements of the generation
process, this process should not have that high a degree of randomness. But given the number of
disparate data sources, the addition of data to the Geospatial Foundation is as likely immediately
following an addition as it is just prior to receiving an addition. Therefore a ―memory less‖ distribution is
appropriate. One could imagine that when NGA updates it 1:100k topographic line map, another
independent event, such as Digital Globe publishing a new frame of GeoEye commercial imagery over
the same location could occur. Therefore the Army Geospatial Enterprise could influence the rate of the
data generation and delivery process from its supplying stakeholders, but may not be able to coordinate
the process very well between the stakeholders.
The majority of the new information that can be obtained would have only a nominal effect on
the overall total utility of the geospatial information continued in the terrain team‘s assets. Occasionally,
there might be an externally produced product that would align perfectly with the informational needs of
the terrain team; these items would increase the total utility of geospatial information more substantially.
3.6.4 Learned Terrain Data from Operations
As Soldiers enter a new Area of Operations (AO) they desire to explore the terrain within
which they will operate. This is typically done through a series of reconnaissance missions, where the
unit leadership surveys the terrain to assess its military effects. They will then use this information to
inform their planning cycle as well as during operations to make educated impromptu tactical decisions.
When Soldiers first arrive, the only information they have about the terrain is from their initial push of
geospatial foundation data. They may question the quality of the data, but they do not have another
source as they begin their occupation of the AO, unless they are taking over from a unit that has already
been in the battle space. Since the Soldier has no experience of the terrain, the benefit of the geospatial
information from experience is zero. As they operate in the AO for a longer period of time the
understanding of terrain from experience surpasses the benefit of information from the geospatial
foundation layer. This is equivalent to a local Bostonian trusting their own knowledge of the back streets
of Cambridge over the navigation directions that the GPS is providing. Unless the individual has reason
to believe that the geospatial foundation layer has higher information quality than their own experience
(for instance a construction update report that may be useful for the local Bostonian), he will rely more on
his own experience and less on the foundation data. This learning through experience is ―learning the
hard way‖ since it often involves getting vehicles stuck down an alley that is not maneuverable, or
reaching a bridge that no longer exists. This information is of high quality since it is verified by Soldiers
on the ground. It is often most meaningful to Soldiers conducting operations.
The idea of learned terrain data from operations is captured in the model of the AGE boundary.
This is critical because this information of the terrain can be used to update the geospatial foundation
layer within the Every Soldier as Sensor construct. This is currently not heavily implemented in the AGE
architecture. It will be discussed for its future architecture potential in section 4.4.1.
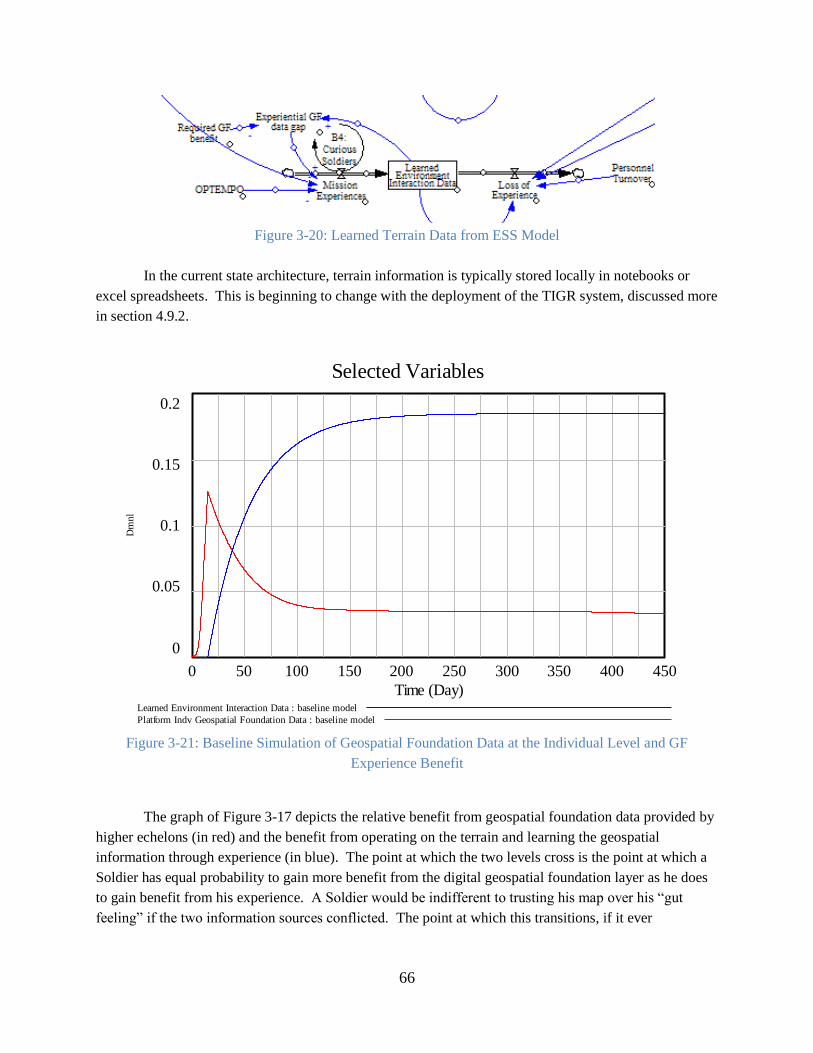
66
Figure 3-20: Learned Terrain Data from ESS Model
In the current state architecture, terrain information is typically stored locally in notebooks or
excel spreadsheets. This is beginning to change with the deployment of the TIGR system, discussed more
in section 4.9.2.
Figure 3-21: Baseline Simulation of Geospatial Foundation Data at the Individual Level and GF
Experience Benefit
The graph of Figure 3-17 depicts the relative benefit from geospatial foundation data provided by
higher echelons (in red) and the benefit from operating on the terrain and learning the geospatial
information through experience (in blue). The point at which the two levels cross is the point at which a
Soldier has equal probability to gain more benefit from the digital geospatial foundation layer as he does
to gain benefit from his experience. A Soldier would be indifferent to trusting his map over his ―gut
feeling‖ if the two information sources conflicted. The point at which this transitions, if it ever
Selected Variables
0.2
0.15
0.1
0.05
0
0 50 100 150 200 250 300 350 400 450
Time (Day)
Dm
nl
Learned Environment Interaction Data : baseline model
Platform Indv Geospatial Foundation Data : baseline model
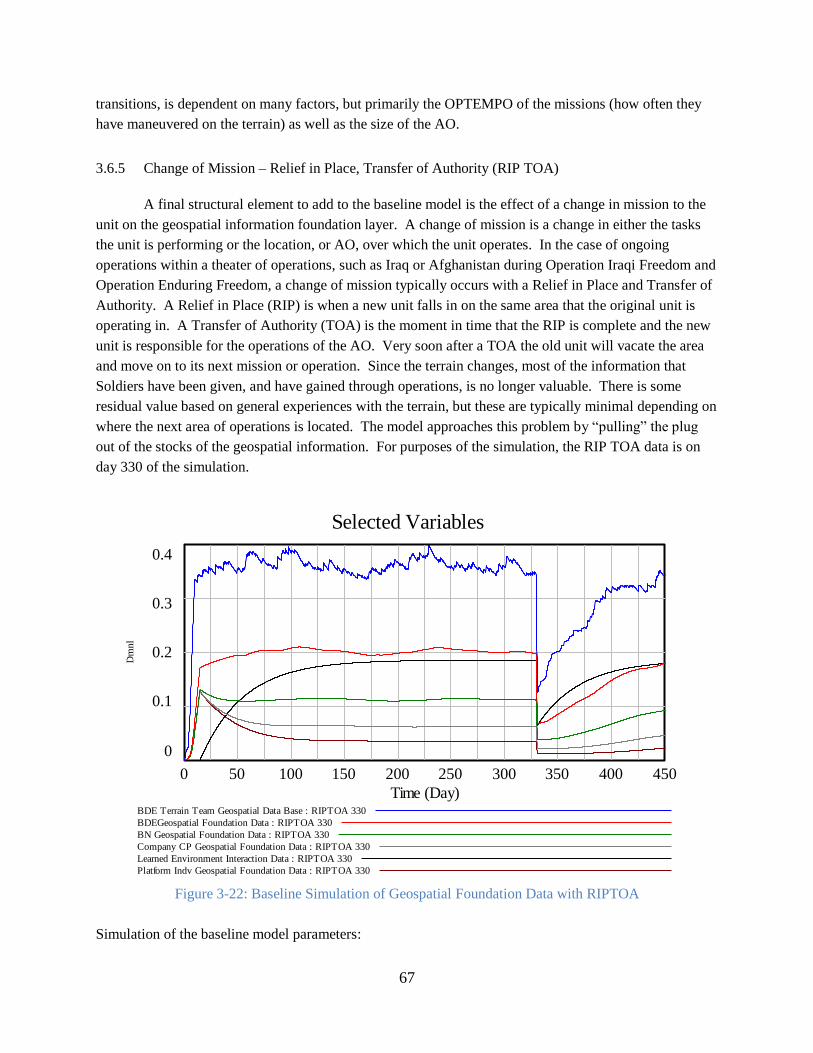
67
transitions, is dependent on many factors, but primarily the OPTEMPO of the missions (how often they
have maneuvered on the terrain) as well as the size of the AO.
3.6.5 Change of Mission – Relief in Place, Transfer of Authority (RIP TOA)
A final structural element to add to the baseline model is the effect of a change in mission to the
unit on the geospatial information foundation layer. A change of mission is a change in either the tasks
the unit is performing or the location, or AO, over which the unit operates. In the case of ongoing
operations within a theater of operations, such as Iraq or Afghanistan during Operation Iraqi Freedom and
Operation Enduring Freedom, a change of mission typically occurs with a Relief in Place and Transfer of
Authority. A Relief in Place (RIP) is when a new unit falls in on the same area that the original unit is
operating in. A Transfer of Authority (TOA) is the moment in time that the RIP is complete and the new
unit is responsible for the operations of the AO. Very soon after a TOA the old unit will vacate the area
and move on to its next mission or operation. Since the terrain changes, most of the information that
Soldiers have been given, and have gained through operations, is no longer valuable. There is some
residual value based on general experiences with the terrain, but these are typically minimal depending on
where the next area of operations is located. The model approaches this problem by ―pulling‖ the plug
out of the stocks of the geospatial information. For purposes of the simulation, the RIP TOA data is on
day 330 of the simulation.
Figure 3-22: Baseline Simulation of Geospatial Foundation Data with RIPTOA
Simulation of the baseline model parameters:
Selected Variables
0.4
0.3
0.2
0.1
0
0 50 100 150 200 250 300 350 400 450
Time (Day)
Dm
nl
BDE Terrain Team Geospatial Data Base : RIPTOA 330
BDEGeospatial Foundation Data : RIPTOA 330
BN Geospatial Foundation Data : RIPTOA 330
Company CP Geospatial Foundation Data : RIPTOA 330
Learned Environment Interaction Data : RIPTOA 330
Platform Indv Geospatial Foundation Data : RIPTOA 330
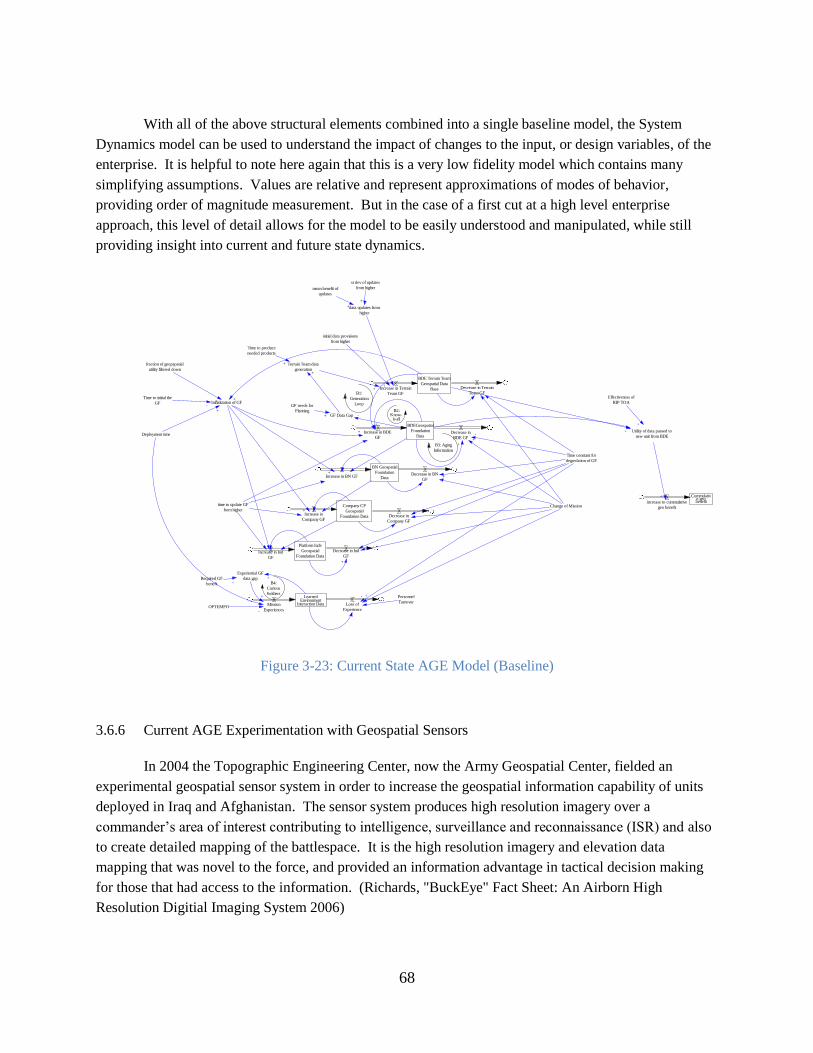
68
With all of the above structural elements combined into a single baseline model, the System
Dynamics model can be used to understand the impact of changes to the input, or design variables, of the
enterprise. It is helpful to note here again that this is a very low fidelity model which contains many
simplifying assumptions. Values are relative and represent approximations of modes of behavior,
providing order of magnitude measurement. But in the case of a first cut at a high level enterprise
approach, this level of detail allows for the model to be easily understood and manipulated, while still
providing insight into current and future state dynamics.
Figure 3-23: Current State AGE Model (Baseline)
3.6.6 Current AGE Experimentation with Geospatial Sensors
In 2004 the Topographic Engineering Center, now the Army Geospatial Center, fielded an
experimental geospatial sensor system in order to increase the geospatial information capability of units
deployed in Iraq and Afghanistan. The sensor system produces high resolution imagery over a
commander‘s area of interest contributing to intelligence, surveillance and reconnaissance (ISR) and also
to create detailed mapping of the battlespace. It is the high resolution imagery and elevation data
mapping that was novel to the force, and provided an information advantage in tactical decision making
for those that had access to the information. (Richards, "BuckEye" Fact Sheet: An Airborn High
Resolution Digitial Imaging System 2006)
Platform Indv
Geospatial
Foundation DataIncrease in Ind
GF
Decrease in Ind
GF
+
Company CP
Geospatial
Foundation Data
BN Geospatial
Foundation
Data
BDE Terrain Team
Geospatial Data
Base
LearnedEnvironment
Interaction Data
Increase in
Company GFDecrease in
Company GF
Increase in BN GFDecrease in BN
GF
Increase in Terrain
Team GF
Decrease in Terrain
Team GF
BDEGeospatial
Foundation
DataIncrease in BDE
GFDecrease in
BDE GF
+
Initialization of GF+
+
+
+
+
Mission
Experiences
+
Loss of
Experience
Change of Mission
Personnel
Turnover+
OPTEMPO-
+
+
Terrain Team data
generation
+
Utility of data passed to
new unit from BDE+
GF needs for
PlanningGF Data Gap+ -
+
+
fraction of geopspatial
utility filtered down
+
initial data provisions
from higher
+
Time to produce
needed products
+
Time to initial the
GF-
Time constant for
degredation of GF
-
Effectiveness of
RIP TOA
+
time to update GF
from higher
-
Deployment time
+
data updates from
higher
+
mean benefit of
updates
st dev of updates
from higher
+
+
Cummulative geobenefitincrease to cummulative
geo benefit
+
B1:
Generation
Loop
B3: Aging
Information
B2:Know-
it-all
Required GF
benefit
-
Experiential GF
data gap-
+
+-
B4:
Curious
Soldiers
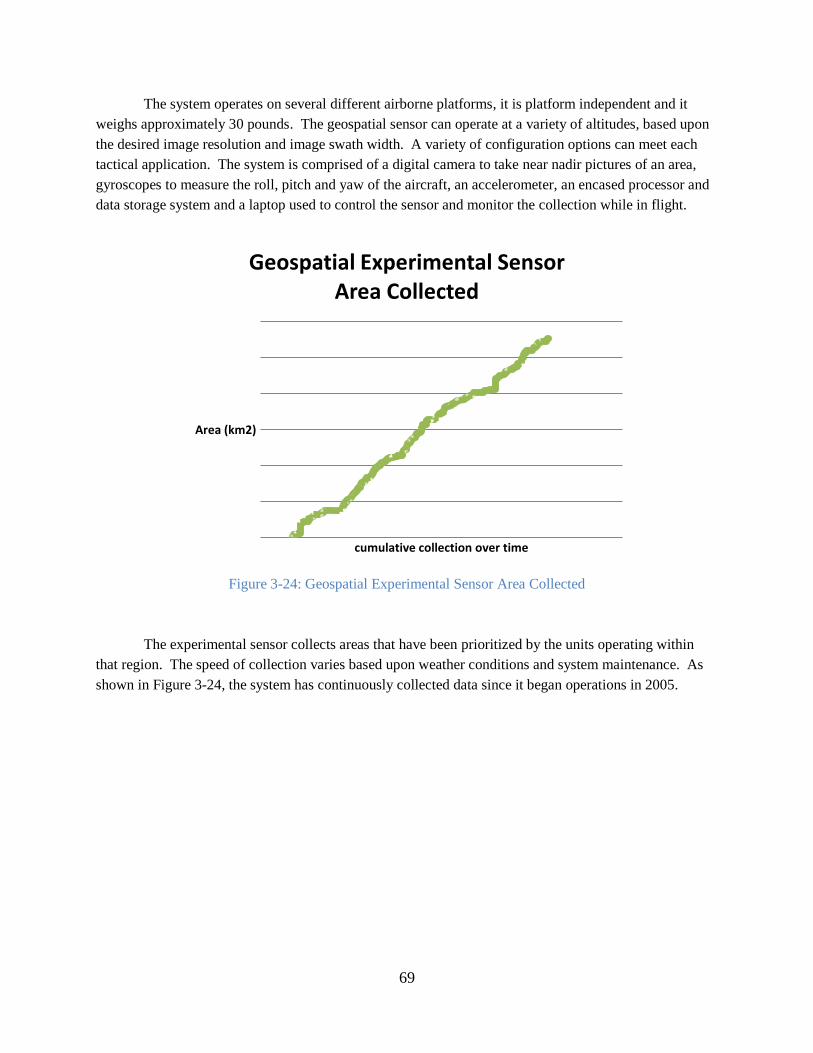
69
The system operates on several different airborne platforms, it is platform independent and it
weighs approximately 30 pounds. The geospatial sensor can operate at a variety of altitudes, based upon
the desired image resolution and image swath width. A variety of configuration options can meet each
tactical application. The system is comprised of a digital camera to take near nadir pictures of an area,
gyroscopes to measure the roll, pitch and yaw of the aircraft, an accelerometer, an encased processor and
data storage system and a laptop used to control the sensor and monitor the collection while in flight.
Figure 3-24: Geospatial Experimental Sensor Area Collected
The experimental sensor collects areas that have been prioritized by the units operating within
that region. The speed of collection varies based upon weather conditions and system maintenance. As
shown in Figure 3-24, the system has continuously collected data since it began operations in 2005.
Area (km2)
cumulative collection over time
Geospatial Experimental Sensor Area Collected
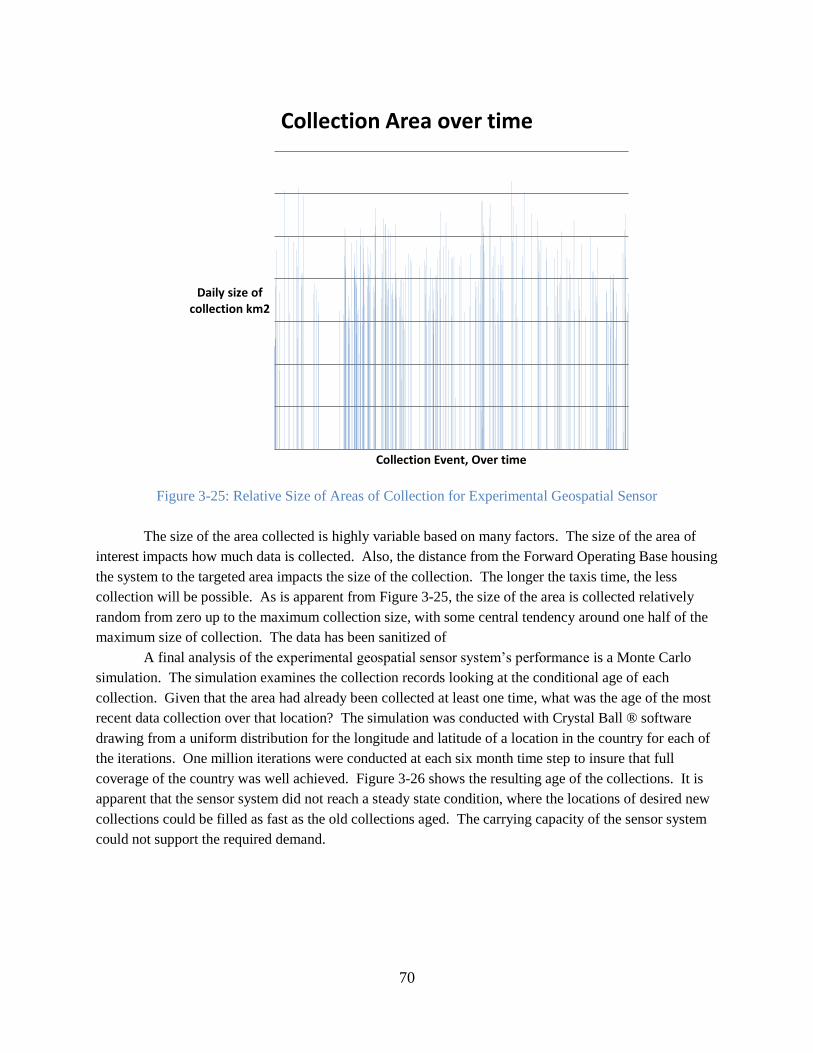
70
Figure 3-25: Relative Size of Areas of Collection for Experimental Geospatial Sensor
The size of the area collected is highly variable based on many factors. The size of the area of
interest impacts how much data is collected. Also, the distance from the Forward Operating Base housing
the system to the targeted area impacts the size of the collection. The longer the taxis time, the less
collection will be possible. As is apparent from Figure 3-25, the size of the area is collected relatively
random from zero up to the maximum collection size, with some central tendency around one half of the
maximum size of collection. The data has been sanitized of
A final analysis of the experimental geospatial sensor system‘s performance is a Monte Carlo
simulation. The simulation examines the collection records looking at the conditional age of each
collection. Given that the area had already been collected at least one time, what was the age of the most
recent data collection over that location? The simulation was conducted with Crystal Ball ® software
drawing from a uniform distribution for the longitude and latitude of a location in the country for each of
the iterations. One million iterations were conducted at each six month time step to insure that full
coverage of the country was well achieved. Figure 3-26 shows the resulting age of the collections. It is
apparent that the sensor system did not reach a steady state condition, where the locations of desired new
collections could be filled as fast as the old collections aged. The carrying capacity of the sensor system
could not support the required demand.
Daily size of collection km2
Collection Event, Over time
Collection Area over time
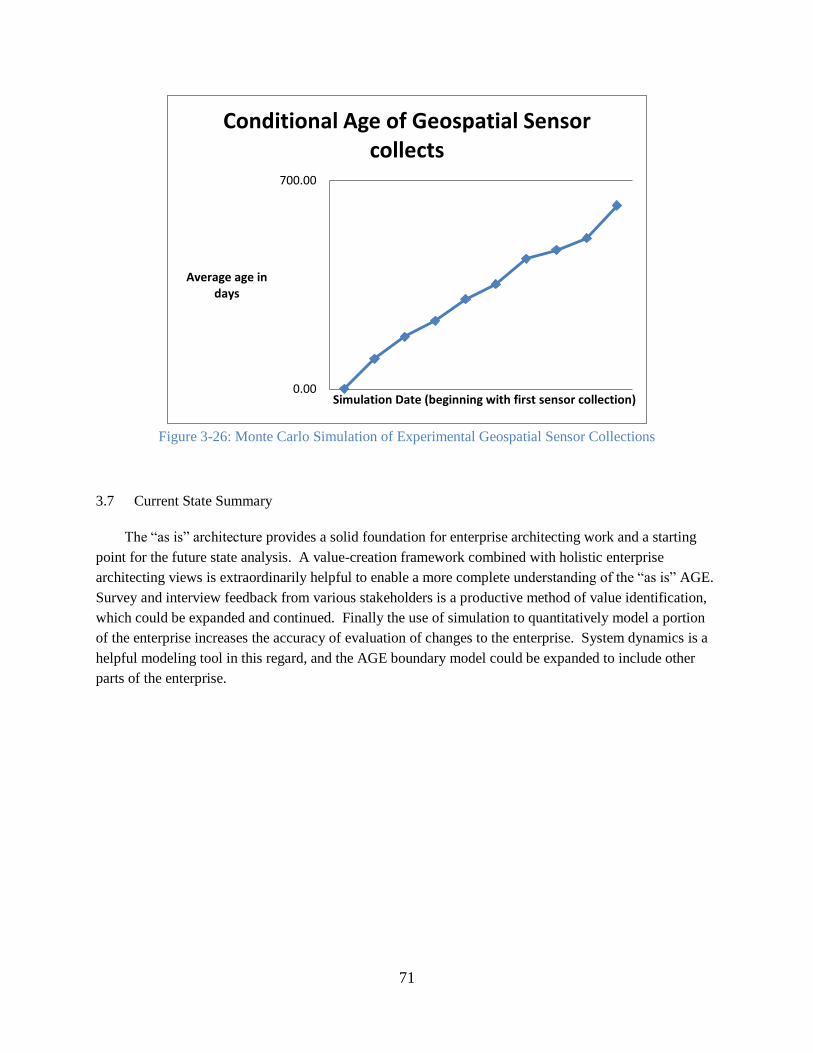
71
Figure 3-26: Monte Carlo Simulation of Experimental Geospatial Sensor Collections
3.7 Current State Summary
The ―as is‖ architecture provides a solid foundation for enterprise architecting work and a starting
point for the future state analysis. A value-creation framework combined with holistic enterprise
architecting views is extraordinarily helpful to enable a more complete understanding of the ―as is‖ AGE.
Survey and interview feedback from various stakeholders is a productive method of value identification,
which could be expanded and continued. Finally the use of simulation to quantitatively model a portion
of the enterprise increases the accuracy of evaluation of changes to the enterprise. System dynamics is a
helpful modeling tool in this regard, and the AGE boundary model could be expanded to include other
parts of the enterprise.
0.00
700.00
Average age in days
Simulation Date (beginning with first sensor collection)
Conditional Age of Geospatial Sensor collects
72
4 Analysis of Army Geospatial Future Architecture
In order to define candidate future state architectures, the enterprise architect must establish a
future state vision with associated behaviors, structures and performance metrics. Each of the views of
the enterprise must be considered, as well as view interactions. The candidate architectures should be
conveyed with clear models and description to allow for discussion, elaboration, and evaluation. The
stakeholder value attributes meet the enterprise design variables determining the greatest opportunity for
improvement. A value driven design approach drives the candidate generation from attribute to design
variable, not the other way around.
There are many possible selection criteria such as cost benefit analysis, ―-ilities‖ and options.
However, for this analysis a very simple linear weighted sum of five attributes are used to derive utility.
There are also many ways to evaluate each of the candidate future architectures against each other, such
as Pugh matrices, trade off analysis, executable models (deterministic and probabilistic) which can help to
inform the decision maker. The selection criteria are based upon the values of the enterprise leadership.
Similarly, the method of comparison, and the visualization of that comparison outcome should take the
decision makers into consideration. The best analysis is meaningless unless it can be effectively
conveyed to the architectural decision makers and leadership at multiple levels of the enterprise. ―Buy
in‖ to the proposed new architecture for the enterprise must be achieved at all levels of the enterprise, and
the selection process should support this persuasion effort. Selection criteria are chosen with as broad a
time horizon as the enterprise requires or which is possible with given information. Also the possible
extreme environmental and internal conditions of the enterprise are considered.
Finally, the future state vision and architecture must be approved by enterprise leadership so the
architect should define a clear transformation plan. The planning of the transformation effort should
place initiative and activities in a timeline which synchronizes the interfaces of the views of the enterprise
within the most likely future environmental conditions.
4.1 Value Driven Design
―Value-focused thinking involves starting at the best and working to make it a reality. Alternative-
focused thinking is starting with what is readily available and taking the best of the lot.‖ (Keeney 1992)
How does one develop enterprise future state alternatives? Historically, decision making endeavors have
sought to identify alternatives for comparison and then selection. Given a complex system, the outcomes
from implementing a transition plan to achieve some future state are difficult to predict. Sophisticated
modeling may shed some light in the area of which design variables or ―knobs‖ might work to achieve the
desired future state of the enterprise, which would then achieve the desired value for the decision maker.
But in many cases there is more than one ―decision maker‖ stakeholder within a complex enterprise
which may have multiple and differing attributes and value definitions. Within such an enterprise, a value
driven design approach for the enterprise architecture may prove helpful. A value centric approach
focuses on the attributes of the stakeholders, and how design variables support these attributes before
beginning to consider decision alternatives. Keeney states it this way ―focusing on the values that should
be guiding the decision situation makes the search for new alternatives a creative and productive exercise.
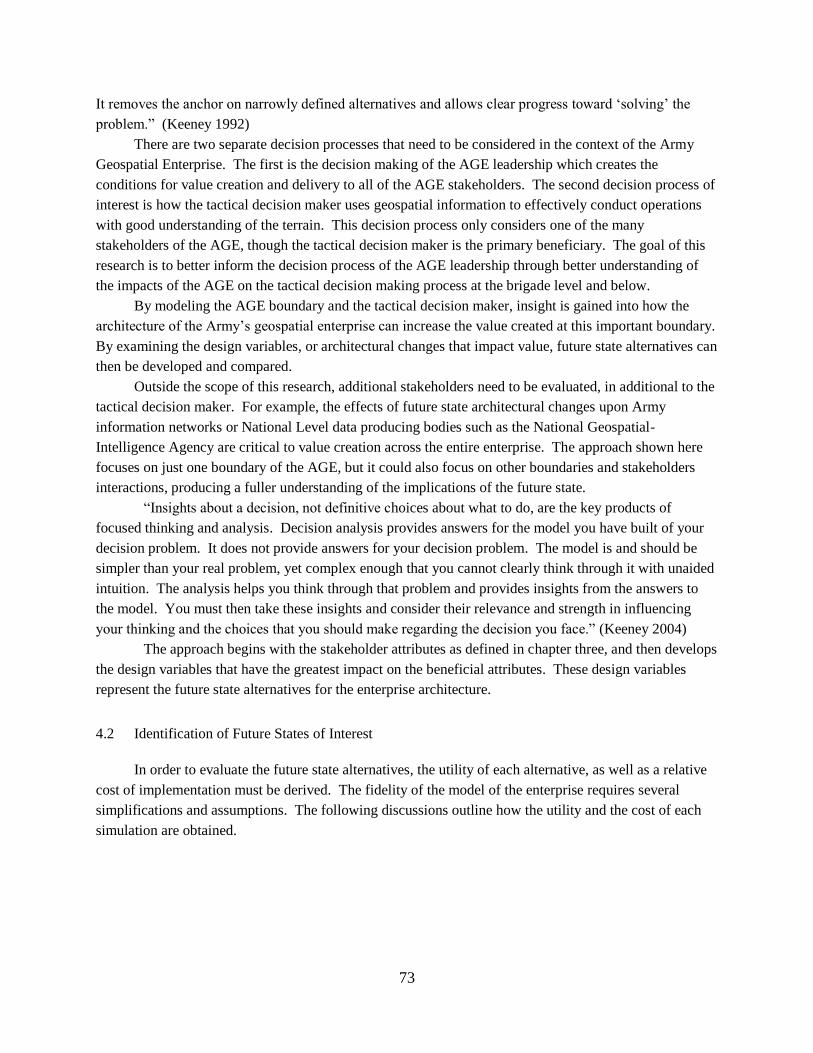
73
It removes the anchor on narrowly defined alternatives and allows clear progress toward ‗solving‘ the
problem.‖ (Keeney 1992)
There are two separate decision processes that need to be considered in the context of the Army
Geospatial Enterprise. The first is the decision making of the AGE leadership which creates the
conditions for value creation and delivery to all of the AGE stakeholders. The second decision process of
interest is how the tactical decision maker uses geospatial information to effectively conduct operations
with good understanding of the terrain. This decision process only considers one of the many
stakeholders of the AGE, though the tactical decision maker is the primary beneficiary. The goal of this
research is to better inform the decision process of the AGE leadership through better understanding of
the impacts of the AGE on the tactical decision making process at the brigade level and below.
By modeling the AGE boundary and the tactical decision maker, insight is gained into how the
architecture of the Army‘s geospatial enterprise can increase the value created at this important boundary.
By examining the design variables, or architectural changes that impact value, future state alternatives can
then be developed and compared.
Outside the scope of this research, additional stakeholders need to be evaluated, in additional to the
tactical decision maker. For example, the effects of future state architectural changes upon Army
information networks or National Level data producing bodies such as the National Geospatial-
Intelligence Agency are critical to value creation across the entire enterprise. The approach shown here
focuses on just one boundary of the AGE, but it could also focus on other boundaries and stakeholders
interactions, producing a fuller understanding of the implications of the future state.
―Insights about a decision, not definitive choices about what to do, are the key products of
focused thinking and analysis. Decision analysis provides answers for the model you have built of your
decision problem. It does not provide answers for your decision problem. The model is and should be
simpler than your real problem, yet complex enough that you cannot clearly think through it with unaided
intuition. The analysis helps you think through that problem and provides insights from the answers to
the model. You must then take these insights and consider their relevance and strength in influencing
your thinking and the choices that you should make regarding the decision you face.‖ (Keeney 2004)
The approach begins with the stakeholder attributes as defined in chapter three, and then develops
the design variables that have the greatest impact on the beneficial attributes. These design variables
represent the future state alternatives for the enterprise architecture.
4.2 Identification of Future States of Interest
In order to evaluate the future state alternatives, the utility of each alternative, as well as a relative
cost of implementation must be derived. The fidelity of the model of the enterprise requires several
simplifications and assumptions. The following discussions outline how the utility and the cost of each
simulation are obtained.
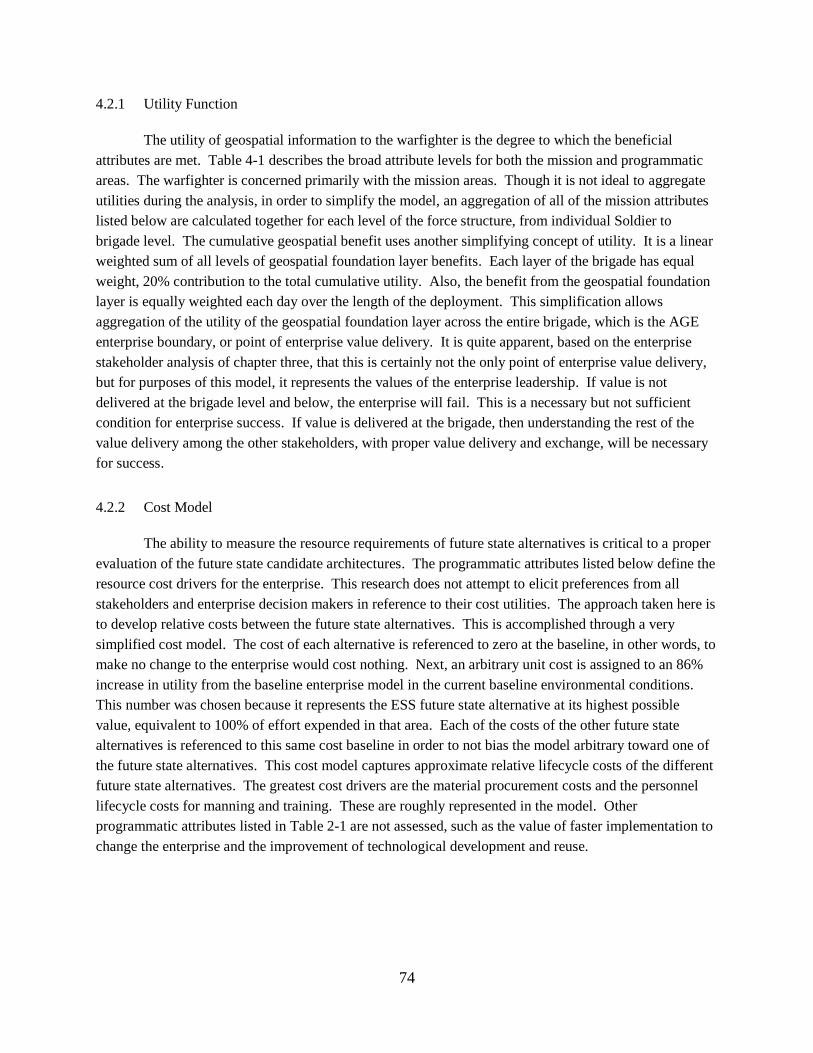
74
4.2.1 Utility Function
The utility of geospatial information to the warfighter is the degree to which the beneficial
attributes are met. Table 4-1 describes the broad attribute levels for both the mission and programmatic
areas. The warfighter is concerned primarily with the mission areas. Though it is not ideal to aggregate
utilities during the analysis, in order to simplify the model, an aggregation of all of the mission attributes
listed below are calculated together for each level of the force structure, from individual Soldier to
brigade level. The cumulative geospatial benefit uses another simplifying concept of utility. It is a linear
weighted sum of all levels of geospatial foundation layer benefits. Each layer of the brigade has equal
weight, 20% contribution to the total cumulative utility. Also, the benefit from the geospatial foundation
layer is equally weighted each day over the length of the deployment. This simplification allows
aggregation of the utility of the geospatial foundation layer across the entire brigade, which is the AGE
enterprise boundary, or point of enterprise value delivery. It is quite apparent, based on the enterprise
stakeholder analysis of chapter three, that this is certainly not the only point of enterprise value delivery,
but for purposes of this model, it represents the values of the enterprise leadership. If value is not
delivered at the brigade level and below, the enterprise will fail. This is a necessary but not sufficient
condition for enterprise success. If value is delivered at the brigade, then understanding the rest of the
value delivery among the other stakeholders, with proper value delivery and exchange, will be necessary
for success.
4.2.2 Cost Model
The ability to measure the resource requirements of future state alternatives is critical to a proper
evaluation of the future state candidate architectures. The programmatic attributes listed below define the
resource cost drivers for the enterprise. This research does not attempt to elicit preferences from all
stakeholders and enterprise decision makers in reference to their cost utilities. The approach taken here is
to develop relative costs between the future state alternatives. This is accomplished through a very
simplified cost model. The cost of each alternative is referenced to zero at the baseline, in other words, to
make no change to the enterprise would cost nothing. Next, an arbitrary unit cost is assigned to an 86%
increase in utility from the baseline enterprise model in the current baseline environmental conditions.
This number was chosen because it represents the ESS future state alternative at its highest possible
value, equivalent to 100% of effort expended in that area. Each of the costs of the other future state
alternatives is referenced to this same cost baseline in order to not bias the model arbitrary toward one of
the future state alternatives. This cost model captures approximate relative lifecycle costs of the different
future state alternatives. The greatest cost drivers are the material procurement costs and the personnel
lifecycle costs for manning and training. These are roughly represented in the model. Other
programmatic attributes listed in Table 2-1 are not assessed, such as the value of faster implementation to
change the enterprise and the improvement of technological development and reuse.
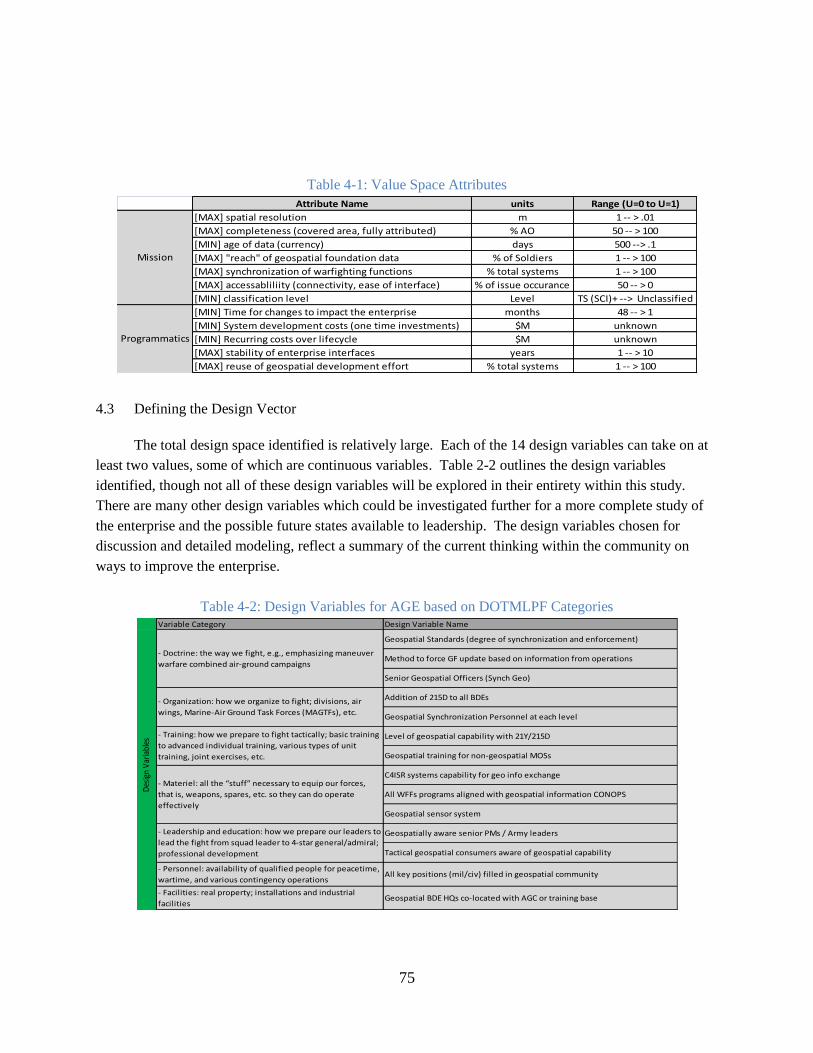
75
Table 4-1: Value Space Attributes
Attribute Name units Range (U=0 to U=1)
[MAX] spatial resolution m 1 -- > .01
[MAX] completeness (covered area, fully attributed) % AO 50 -- > 100
[MIN] age of data (currency) days 500 --> .1
[MAX] "reach" of geospatial foundation data % of Soldiers 1 -- > 100
[MAX] synchronization of warfighting functions % total systems 1 -- > 100
[MAX] accessabliliity (connectivity, ease of interface) % of issue occurance 50 -- > 0
[MIN] classification level Level TS (SCI)+ --> Unclassified
[MIN] Time for changes to impact the enterprise months 48 -- > 1
[MIN] System development costs (one time investments) $M unknown
[MIN] Recurring costs over lifecycle $M unknown
[MAX] stability of enterprise interfaces years 1 -- > 10
[MAX] reuse of geospatial development effort % total systems 1 -- > 100
Mission
Programmatics
4.3 Defining the Design Vector
The total design space identified is relatively large. Each of the 14 design variables can take on at
least two values, some of which are continuous variables. Table 2-2 outlines the design variables
identified, though not all of these design variables will be explored in their entirety within this study.
There are many other design variables which could be investigated further for a more complete study of
the enterprise and the possible future states available to leadership. The design variables chosen for
discussion and detailed modeling, reflect a summary of the current thinking within the community on
ways to improve the enterprise.
Table 4-2: Design Variables for AGE based on DOTMLPF Categories Variable Category Design Variable Name
Geospatial Standards (degree of synchronization and enforcement)
Method to force GF update based on information from operations
Senior Geospatial Officers (Synch Geo)
Addition of 215D to all BDEs
Geospatial Synchronization Personnel at each level
Level of geospatial capability with 21Y/215D
Geospatial training for non-geospatial MOSs
C4ISR systems capability for geo info exchange
All WFFs programs aligned with geospatial information CONOPS
Geospatial sensor system
Geospatially aware senior PMs / Army leaders
Tactical geospatial consumers aware of geospatial capability
- Personnel: availability of qualified people for peacetime,
wartime, and various contingency operationsAll key positions (mil/civ) filled in geospatial community
- Facilities: real property; installations and industrial
facilitiesGeospatial BDE HQs co-located with AGC or training base
Des
ign
Var
iabl
es
- Doctrine: the way we fight, e.g., emphasizing maneuver
warfare combined air-ground campaigns
- Organization: how we organize to fight; divisions, air
wings, Marine-Air Ground Task Forces (MAGTFs), etc.
- Training: how we prepare to fight tactically; basic training
to advanced individual training, various types of unit
training, joint exercises, etc.
- Materiel: all the “stuff” necessary to equip our forces,
that is, weapons, spares, etc. so they can do operate
effectively
- Leadership and education: how we prepare our leaders to
lead the fight from squad leader to 4-star general/admiral;
professional development
76
The design variables are the ―knobs‖ that system architects possess to impact the desired
attributes of the enterprise stakeholders. Again, the list is not exhaustive, but is representative of the types
of adjustments that can be made within the enterprise. The DOTMLPF categorization organizes the
possible design variables into groups of similar enterprise architecture adjustments.
Table 4-3: Design Value Matrix with Design Variable Impacts
Design Variable Name Definition Range
Geospatial Standards (degree of synchronization and enforcement) No standard compliance -> Uses commercial stds 0 3 0 3 9 3 0 1 3 1 9 335
Method to force GF update based on information from operations Degree of ESS implementation in doctrine 0 -> 100 1 3 9 9 9 3 3 9 3 3 3 358
Senior Geospatial Officers (Synch Geo) No Change; ID Sen Geos ->Fully implemented 1 1 3 9 9 9 1 9 3 3 9 360
Addition of 215D to all BDEs No 215D at BDEs -> 215D at all BDEs 0 1 0 1 1 1 0 3 1 1 3 012
Geospatial Synchronization Personnel at each level No Synch Geo -> Synch Geo each level to CO level 1 1 3 9 9 9 1 3 1 1 3 142
Level of geospatial capability with 21Y/215D No change to trng. -> masters cert. program 1 1 0 1 1 1 0 3 1 1 3 013
Geospatial training for non-geospatial MOSs No geospatial training -> all MOS detailed trng prg 3 1 3 3 3 3 0 3 1 3 3 329
C4ISR systems capability for geo info exchange No geo exchange device -> fielded to each Soldier 3 3 1 9 9 9 0 3 9 3 3 355
All WFFs programs aligned with geospatial information CONOPS No WWF alignment -> all systems geo enabled 1 3 0 3 9 3 0 3 1 1 3 330
Geospatial sensor system No geospatial sensor -> Geo Sensor at BDE level 9 9 9 0 1 0 3 3 9 9 3 964
Geospatially aware senior PMs / Army leaders No additional training -> geo trng at all PME levels 0 0 0 3 3 1 3 3 1 1 9 327
Tactical geospatial consumers aware of geospatial capability No geo ldr update -> integrated digital geo trng 1 3 1 9 3 3 0 1 1 1 3 329
All key positions (mil/civ) filled in geospatial community 75% positions filled -> 100% positions filled 0 1 0 1 0 1 0 1 1 1 1 18
Geospatial BDE HQs co-located with AGC or training base No Geo BDE -> co-located geo BDE, AGC 0 0 3 3 1 3 1 0 3 9 932
[MA
X] a
cces
sibi
lity
(con
nect
ivity
, eas
e of
inte
rfac
e)
[MIN
] cla
ssifi
catio
n le
vel
[MA
X] re
use
of g
eosp
atia
l dev
elop
men
t eff
ort
[MIN
] Tim
e fo
r cha
nges
to im
pact
the
ente
rpris
e
[MIN
] Sys
tem
dev
elop
men
t cos
ts (o
ne ti
me
inve
stm
ents
)
[MIN
] Rec
urrin
g co
sts
over
life
cycl
e
[MA
X] s
tabi
lity
of e
nter
pris
e in
terf
aces
Design Value Matrix
Tota
l Im
pact
Des
ign
Var
iabl
es
Attributes
Mission Programmatics
[MA
X] s
patia
l res
olut
ion
[MA
X] c
ompl
eten
ess
(cov
ered
are
a, fu
lly a
ttrib
uted
)
[MIN
] age
of d
ata
(cur
renc
y)
[MA
X] "
reac
h" o
f geo
spat
ial f
ound
atio
n da
ta
[MA
X] s
ynch
roni
zatio
n of
war
fight
ing
func
tions
A qualitative analysis of the contribution each of the above design variables to the stakeholders‘
attributes reveals the areas that the architect should focus on first. The highest impact design variables
have the potential to yield the highest returns to the enterprise; therefore these areas deserve the most
consideration and most initial analysis. Each of the design variables is rated on a scale of zero to nine to
have the greatest beneficial impact on the attributives, Table 4-3. The highlighted items are the three
highest scoring impact variables; these are the variables chosen for modeling as the basis for architectural
futures state candidates.
In order to properly compare each of the above design variables, the cost of each variable must be
known. Since the costs of changes to the architecture were difficult to obtain rigorously from the survey
data and interviews, relative costs tied to a baseline cost to benefit point is used. The baseline simulation
of the Every Soldier as Sensor architecture yielded a benefit increase of 83%. This increase is assigned a
cost of one, or 100% relative cost. Each of the other architectural approaches are then scaled to this cost
increase of 100% at 83% increase in benefit.
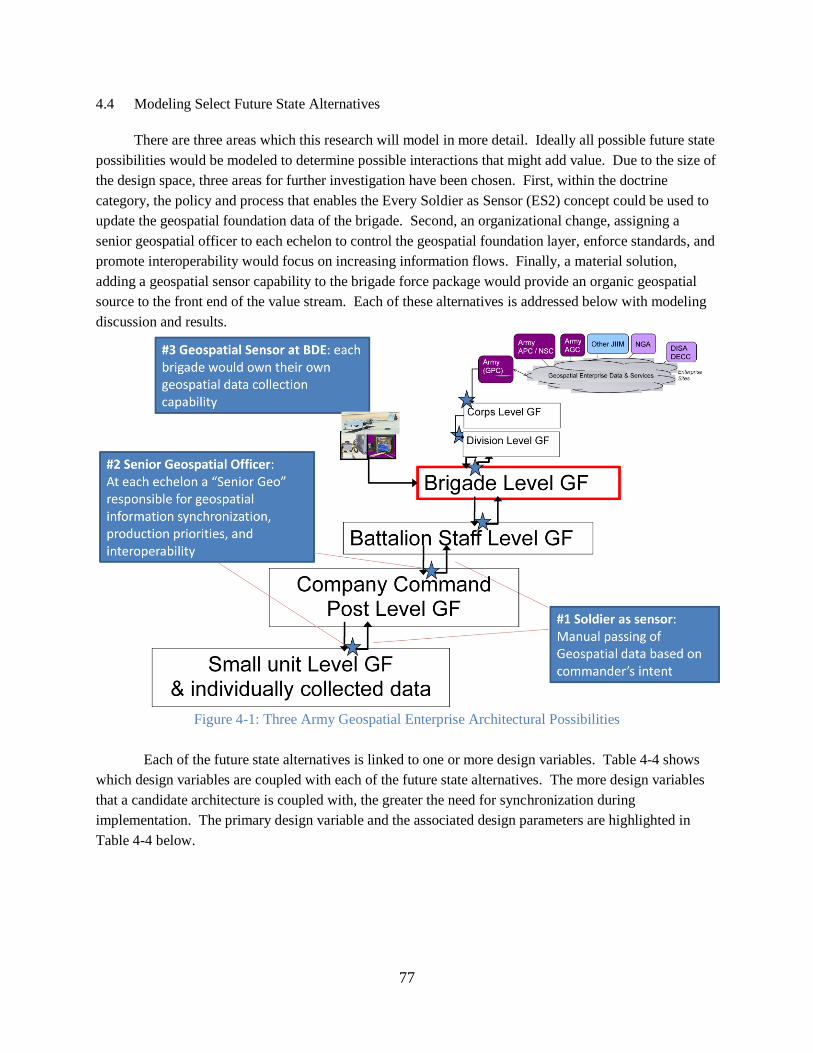
77
4.4 Modeling Select Future State Alternatives
There are three areas which this research will model in more detail. Ideally all possible future state
possibilities would be modeled to determine possible interactions that might add value. Due to the size of
the design space, three areas for further investigation have been chosen. First, within the doctrine
category, the policy and process that enables the Every Soldier as Sensor (ES2) concept could be used to
update the geospatial foundation data of the brigade. Second, an organizational change, assigning a
senior geospatial officer to each echelon to control the geospatial foundation layer, enforce standards, and
promote interoperability would focus on increasing information flows. Finally, a material solution,
adding a geospatial sensor capability to the brigade force package would provide an organic geospatial
source to the front end of the value stream. Each of these alternatives is addressed below with modeling
discussion and results.
Figure 4-1: Three Army Geospatial Enterprise Architectural Possibilities
Each of the future state alternatives is linked to one or more design variables. Table 4-4 shows
which design variables are coupled with each of the future state alternatives. The more design variables
that a candidate architecture is coupled with, the greater the need for synchronization during
implementation. The primary design variable and the associated design parameters are highlighted in
Table 4-4 below.
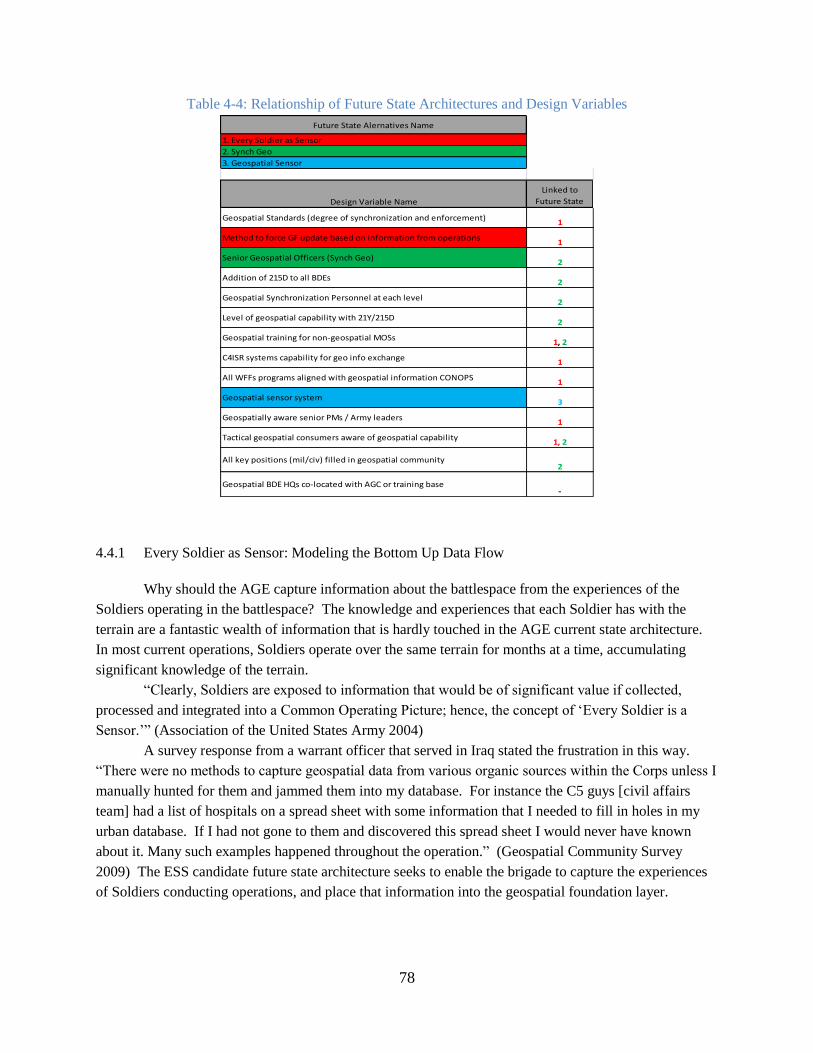
78
Table 4-4: Relationship of Future State Architectures and Design Variables
Future State Alernatives Name
1. Every Soldier as Sensor
2. Synch Geo
3. Geospatial Sensor
Design Variable Name
Linked to
Future State
Geospatial Standards (degree of synchronization and enforcement)1
Method to force GF update based on information from operations1
Senior Geospatial Officers (Synch Geo)2
Addition of 215D to all BDEs2
Geospatial Synchronization Personnel at each level2
Level of geospatial capability with 21Y/215D2
Geospatial training for non-geospatial MOSs1, 2
C4ISR systems capability for geo info exchange1
All WFFs programs aligned with geospatial information CONOPS1
Geospatial sensor system3
Geospatially aware senior PMs / Army leaders1
Tactical geospatial consumers aware of geospatial capability1, 2
All key positions (mil/civ) filled in geospatial community2
Geospatial BDE HQs co-located with AGC or training base-
4.4.1 Every Soldier as Sensor: Modeling the Bottom Up Data Flow
Why should the AGE capture information about the battlespace from the experiences of the
Soldiers operating in the battlespace? The knowledge and experiences that each Soldier has with the
terrain are a fantastic wealth of information that is hardly touched in the AGE current state architecture.
In most current operations, Soldiers operate over the same terrain for months at a time, accumulating
significant knowledge of the terrain.
―Clearly, Soldiers are exposed to information that would be of significant value if collected,
processed and integrated into a Common Operating Picture; hence, the concept of ‗Every Soldier is a
Sensor.‘‖ (Association of the United States Army 2004)
A survey response from a warrant officer that served in Iraq stated the frustration in this way.
―There were no methods to capture geospatial data from various organic sources within the Corps unless I
manually hunted for them and jammed them into my database. For instance the C5 guys [civil affairs
team] had a list of hospitals on a spread sheet with some information that I needed to fill in holes in my
urban database. If I had not gone to them and discovered this spread sheet I would never have known
about it. Many such examples happened throughout the operation.‖ (Geospatial Community Survey
2009) The ESS candidate future state architecture seeks to enable the brigade to capture the experiences
of Soldiers conducting operations, and place that information into the geospatial foundation layer.
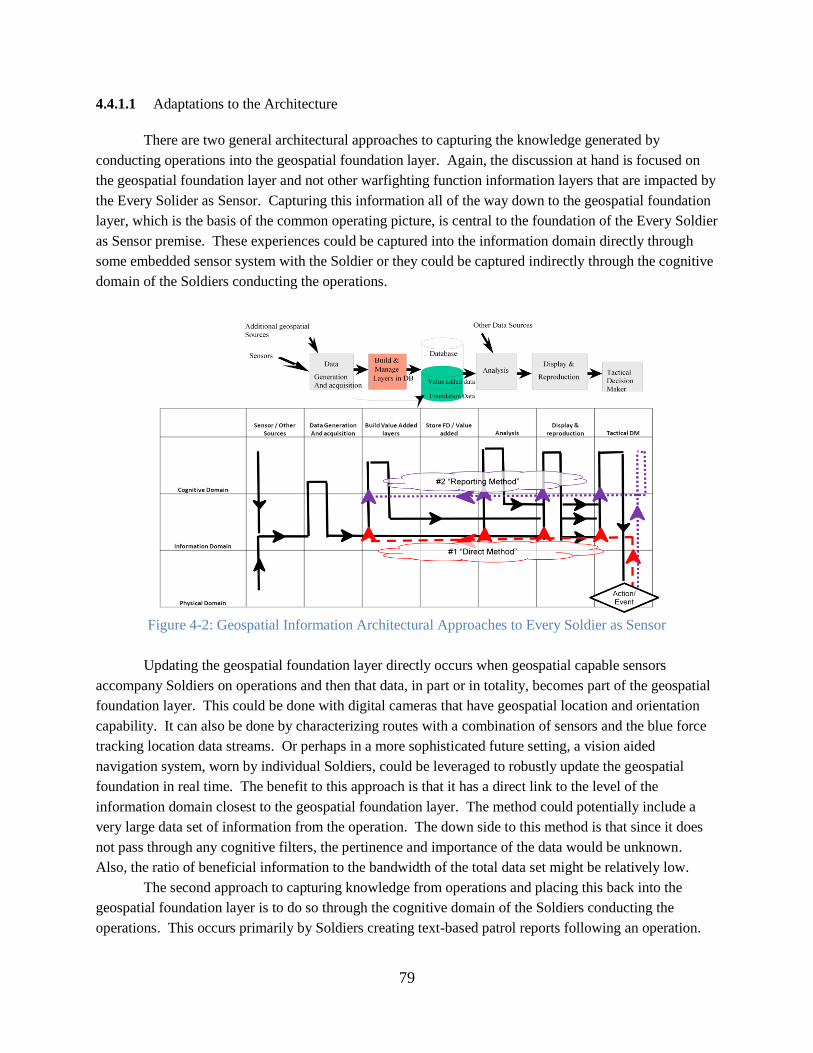
79
4.4.1.1 Adaptations to the Architecture
There are two general architectural approaches to capturing the knowledge generated by
conducting operations into the geospatial foundation layer. Again, the discussion at hand is focused on
the geospatial foundation layer and not other warfighting function information layers that are impacted by
the Every Solider as Sensor. Capturing this information all of the way down to the geospatial foundation
layer, which is the basis of the common operating picture, is central to the foundation of the Every Soldier
as Sensor premise. These experiences could be captured into the information domain directly through
some embedded sensor system with the Soldier or they could be captured indirectly through the cognitive
domain of the Soldiers conducting the operations.
Figure 4-2: Geospatial Information Architectural Approaches to Every Soldier as Sensor
Updating the geospatial foundation layer directly occurs when geospatial capable sensors
accompany Soldiers on operations and then that data, in part or in totality, becomes part of the geospatial
foundation layer. This could be done with digital cameras that have geospatial location and orientation
capability. It can also be done by characterizing routes with a combination of sensors and the blue force
tracking location data streams. Or perhaps in a more sophisticated future setting, a vision aided
navigation system, worn by individual Soldiers, could be leveraged to robustly update the geospatial
foundation in real time. The benefit to this approach is that it has a direct link to the level of the
information domain closest to the geospatial foundation layer. The method could potentially include a
very large data set of information from the operation. The down side to this method is that since it does
not pass through any cognitive filters, the pertinence and importance of the data would be unknown.
Also, the ratio of beneficial information to the bandwidth of the total data set might be relatively low.
The second approach to capturing knowledge from operations and placing this back into the
geospatial foundation layer is to do so through the cognitive domain of the Soldiers conducting the
operations. This occurs primarily by Soldiers creating text-based patrol reports following an operation.
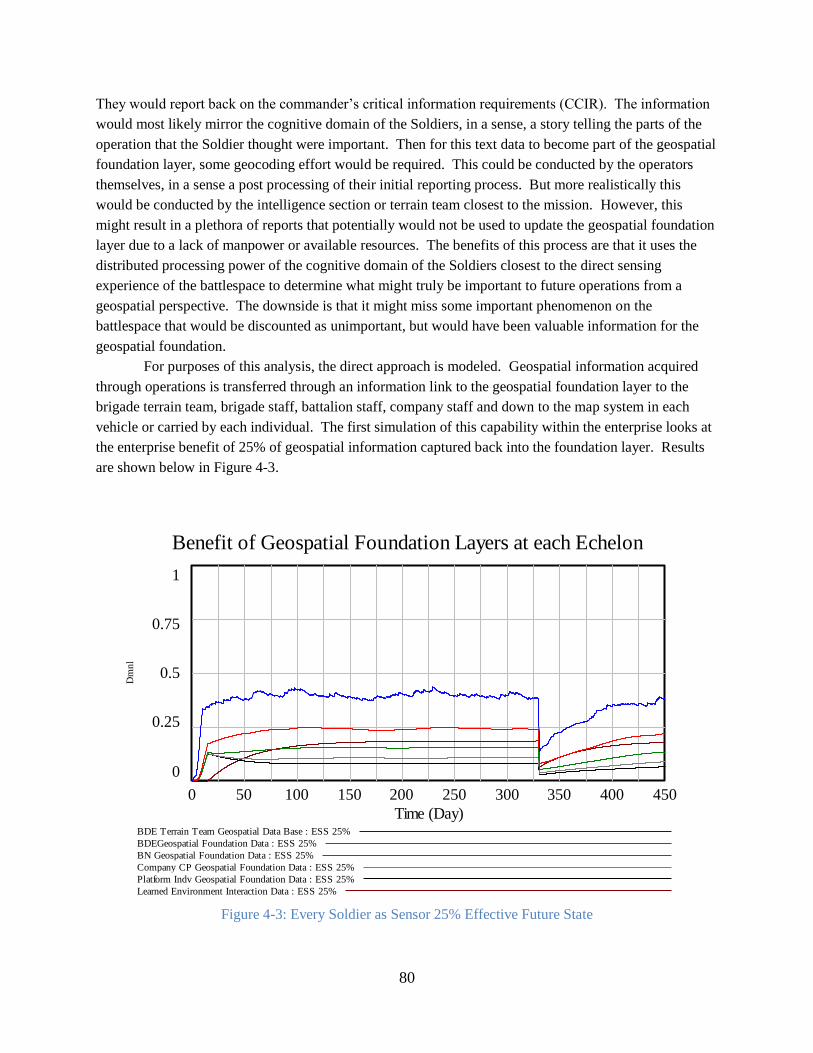
80
They would report back on the commander‘s critical information requirements (CCIR). The information
would most likely mirror the cognitive domain of the Soldiers, in a sense, a story telling the parts of the
operation that the Soldier thought were important. Then for this text data to become part of the geospatial
foundation layer, some geocoding effort would be required. This could be conducted by the operators
themselves, in a sense a post processing of their initial reporting process. But more realistically this
would be conducted by the intelligence section or terrain team closest to the mission. However, this
might result in a plethora of reports that potentially would not be used to update the geospatial foundation
layer due to a lack of manpower or available resources. The benefits of this process are that it uses the
distributed processing power of the cognitive domain of the Soldiers closest to the direct sensing
experience of the battlespace to determine what might truly be important to future operations from a
geospatial perspective. The downside is that it might miss some important phenomenon on the
battlespace that would be discounted as unimportant, but would have been valuable information for the
geospatial foundation.
For purposes of this analysis, the direct approach is modeled. Geospatial information acquired
through operations is transferred through an information link to the geospatial foundation layer to the
brigade terrain team, brigade staff, battalion staff, company staff and down to the map system in each
vehicle or carried by each individual. The first simulation of this capability within the enterprise looks at
the enterprise benefit of 25% of geospatial information captured back into the foundation layer. Results
are shown below in Figure 4-3.
Figure 4-3: Every Soldier as Sensor 25% Effective Future State
Benefit of Geospatial Foundation Layers at each Echelon
1
0.75
0.5
0.25
0
0 50 100 150 200 250 300 350 400 450
Time (Day)
Dm
nl
BDE Terrain Team Geospatial Data Base : ESS 25%
BDEGeospatial Foundation Data : ESS 25%
BN Geospatial Foundation Data : ESS 25%
Company CP Geospatial Foundation Data : ESS 25%
Platform Indv Geospatial Foundation Data : ESS 25%
Learned Environment Interaction Data : ESS 25%
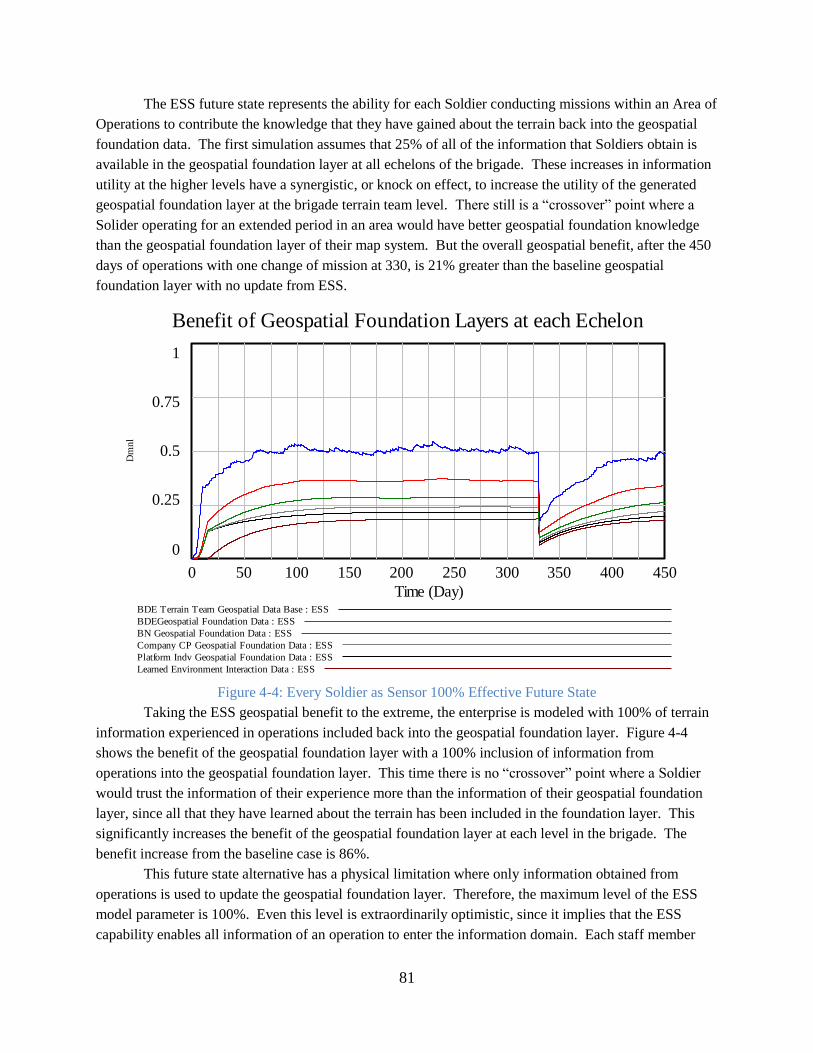
81
The ESS future state represents the ability for each Soldier conducting missions within an Area of
Operations to contribute the knowledge that they have gained about the terrain back into the geospatial
foundation data. The first simulation assumes that 25% of all of the information that Soldiers obtain is
available in the geospatial foundation layer at all echelons of the brigade. These increases in information
utility at the higher levels have a synergistic, or knock on effect, to increase the utility of the generated
geospatial foundation layer at the brigade terrain team level. There still is a ―crossover‖ point where a
Solider operating for an extended period in an area would have better geospatial foundation knowledge
than the geospatial foundation layer of their map system. But the overall geospatial benefit, after the 450
days of operations with one change of mission at 330, is 21% greater than the baseline geospatial
foundation layer with no update from ESS.
Figure 4-4: Every Soldier as Sensor 100% Effective Future State
Taking the ESS geospatial benefit to the extreme, the enterprise is modeled with 100% of terrain
information experienced in operations included back into the geospatial foundation layer. Figure 4-4
shows the benefit of the geospatial foundation layer with a 100% inclusion of information from
operations into the geospatial foundation layer. This time there is no ―crossover‖ point where a Soldier
would trust the information of their experience more than the information of their geospatial foundation
layer, since all that they have learned about the terrain has been included in the foundation layer. This
significantly increases the benefit of the geospatial foundation layer at each level in the brigade. The
benefit increase from the baseline case is 86%.
This future state alternative has a physical limitation where only information obtained from
operations is used to update the geospatial foundation layer. Therefore, the maximum level of the ESS
model parameter is 100%. Even this level is extraordinarily optimistic, since it implies that the ESS
capability enables all information of an operation to enter the information domain. Each staff member
Benefit of Geospatial Foundation Layers at each Echelon
1
0.75
0.5
0.25
0
0 50 100 150 200 250 300 350 400 450
Time (Day)
Dm
nl
BDE Terrain Team Geospatial Data Base : ESS
BDEGeospatial Foundation Data : ESS
BN Geospatial Foundation Data : ESS
Company CP Geospatial Foundation Data : ESS
Platform Indv Geospatial Foundation Data : ESS
Learned Environment Interaction Data : ESS
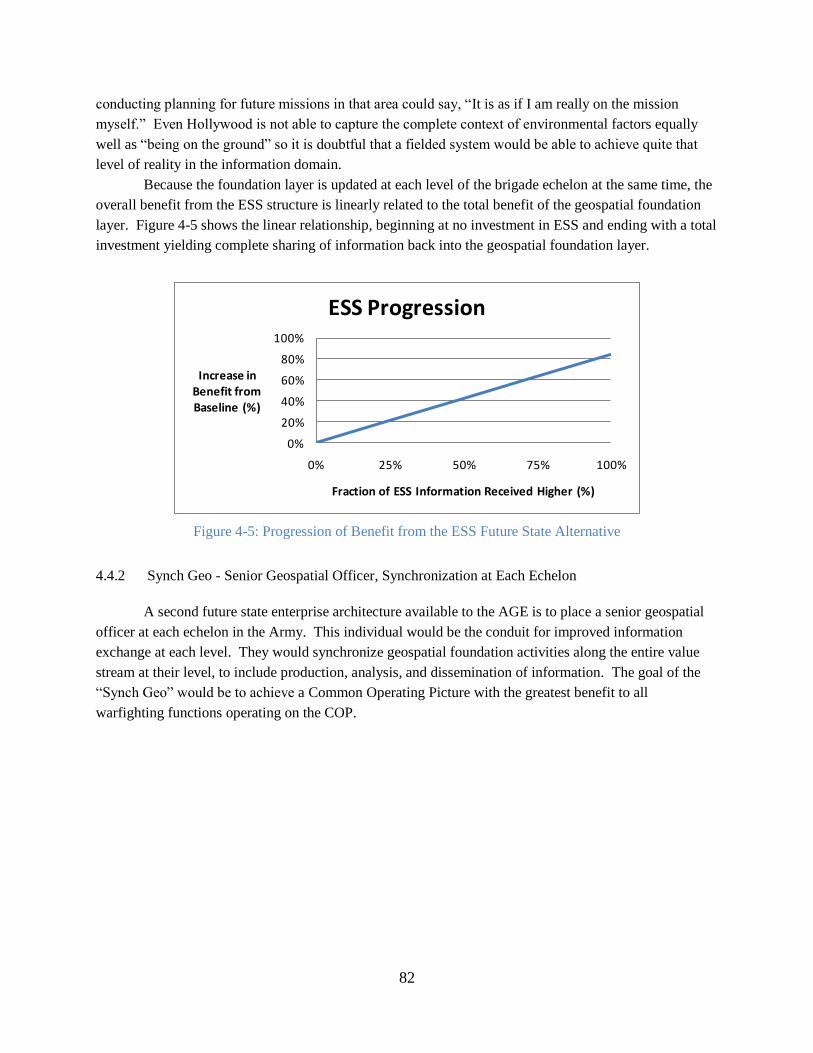
82
conducting planning for future missions in that area could say, ―It is as if I am really on the mission
myself.‖ Even Hollywood is not able to capture the complete context of environmental factors equally
well as ―being on the ground‖ so it is doubtful that a fielded system would be able to achieve quite that
level of reality in the information domain.
Because the foundation layer is updated at each level of the brigade echelon at the same time, the
overall benefit from the ESS structure is linearly related to the total benefit of the geospatial foundation
layer. Figure 4-5 shows the linear relationship, beginning at no investment in ESS and ending with a total
investment yielding complete sharing of information back into the geospatial foundation layer.
0%
20%
40%
60%
80%
100%
0% 25% 50% 75% 100%
Increase in Benefit from Baseline (%)
Fraction of ESS Information Received Higher (%)
ESS Progression
Figure 4-5: Progression of Benefit from the ESS Future State Alternative
4.4.2 Synch Geo - Senior Geospatial Officer, Synchronization at Each Echelon
A second future state enterprise architecture available to the AGE is to place a senior geospatial
officer at each echelon in the Army. This individual would be the conduit for improved information
exchange at each level. They would synchronize geospatial foundation activities along the entire value
stream at their level, to include production, analysis, and dissemination of information. The goal of the
―Synch Geo‖ would be to achieve a Common Operating Picture with the greatest benefit to all
warfighting functions operating on the COP.
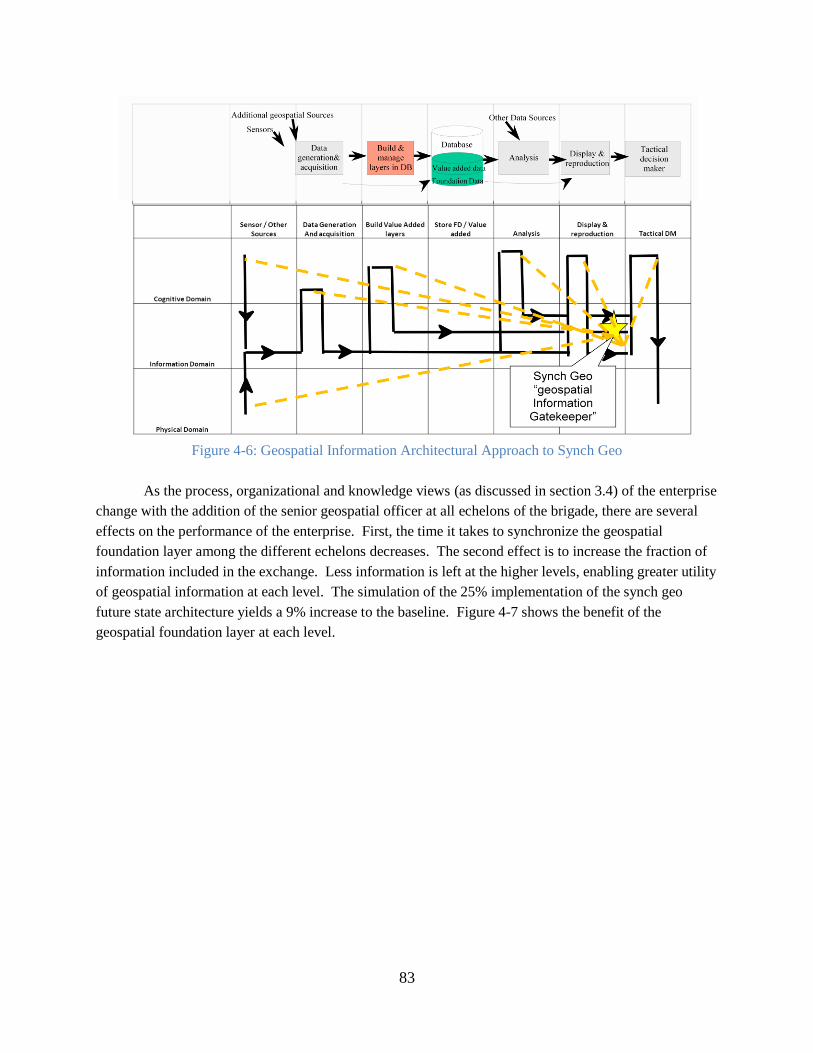
83
Figure 4-6: Geospatial Information Architectural Approach to Synch Geo
As the process, organizational and knowledge views (as discussed in section 3.4) of the enterprise
change with the addition of the senior geospatial officer at all echelons of the brigade, there are several
effects on the performance of the enterprise. First, the time it takes to synchronize the geospatial
foundation layer among the different echelons decreases. The second effect is to increase the fraction of
information included in the exchange. Less information is left at the higher levels, enabling greater utility
of geospatial information at each level. The simulation of the 25% implementation of the synch geo
future state architecture yields a 9% increase to the baseline. Figure 4-7 shows the benefit of the
geospatial foundation layer at each level.
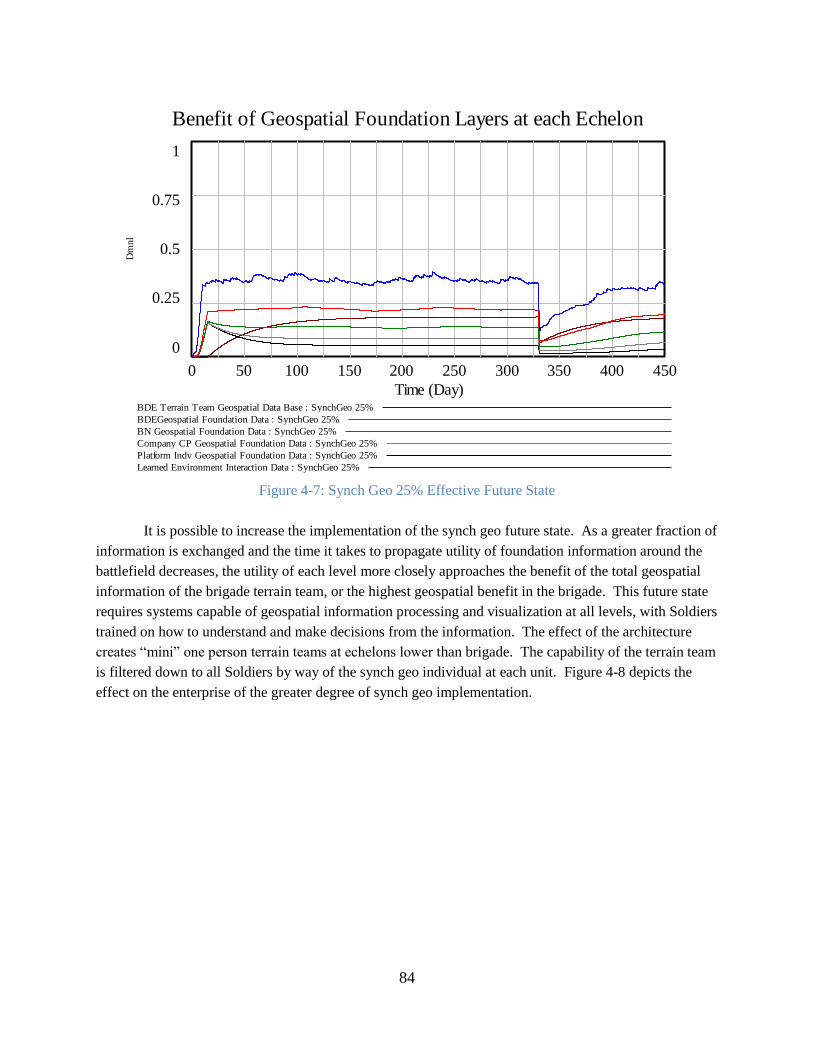
84
Figure 4-7: Synch Geo 25% Effective Future State
It is possible to increase the implementation of the synch geo future state. As a greater fraction of
information is exchanged and the time it takes to propagate utility of foundation information around the
battlefield decreases, the utility of each level more closely approaches the benefit of the total geospatial
information of the brigade terrain team, or the highest geospatial benefit in the brigade. This future state
requires systems capable of geospatial information processing and visualization at all levels, with Soldiers
trained on how to understand and make decisions from the information. The effect of the architecture
creates ―mini‖ one person terrain teams at echelons lower than brigade. The capability of the terrain team
is filtered down to all Soldiers by way of the synch geo individual at each unit. Figure 4-8 depicts the
effect on the enterprise of the greater degree of synch geo implementation.
Benefit of Geospatial Foundation Layers at each Echelon
1
0.75
0.5
0.25
0
0 50 100 150 200 250 300 350 400 450
Time (Day)
Dm
nl
BDE Terrain Team Geospatial Data Base : SynchGeo 25%
BDEGeospatial Foundation Data : SynchGeo 25%
BN Geospatial Foundation Data : SynchGeo 25%
Company CP Geospatial Foundation Data : SynchGeo 25%
Platform Indv Geospatial Foundation Data : SynchGeo 25%
Learned Environment Interaction Data : SynchGeo 25%
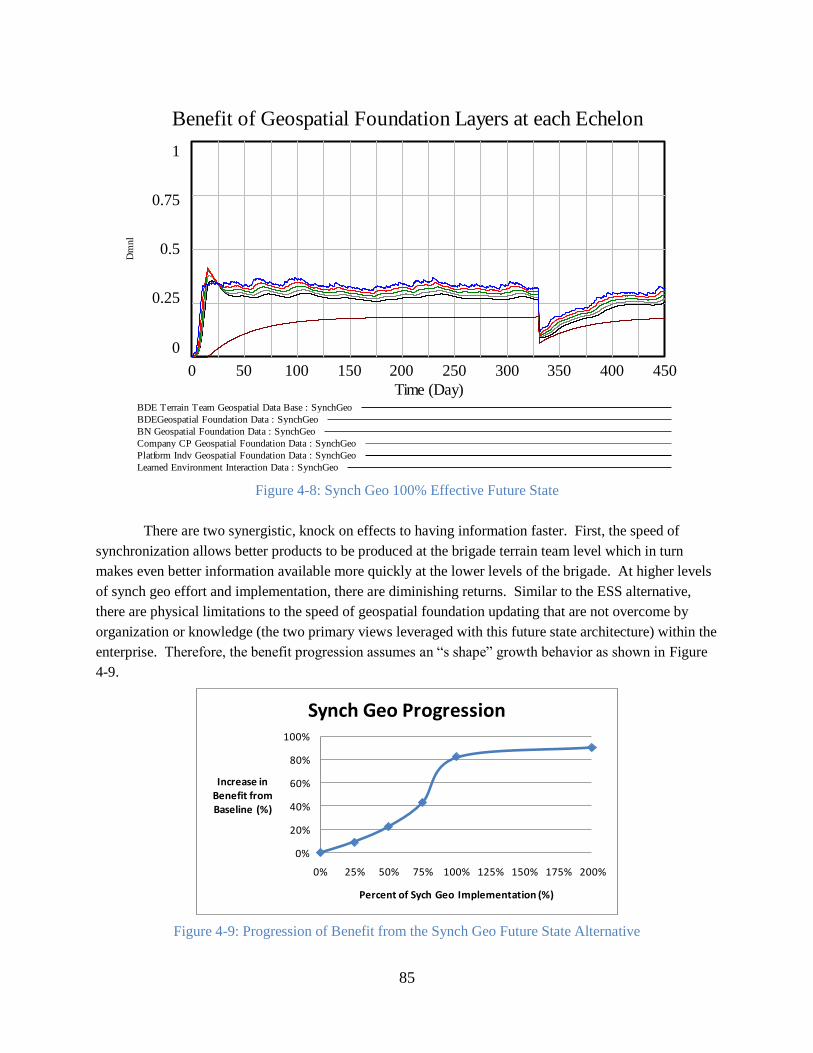
85
Figure 4-8: Synch Geo 100% Effective Future State
There are two synergistic, knock on effects to having information faster. First, the speed of
synchronization allows better products to be produced at the brigade terrain team level which in turn
makes even better information available more quickly at the lower levels of the brigade. At higher levels
of synch geo effort and implementation, there are diminishing returns. Similar to the ESS alternative,
there are physical limitations to the speed of geospatial foundation updating that are not overcome by
organization or knowledge (the two primary views leveraged with this future state architecture) within the
enterprise. Therefore, the benefit progression assumes an ―s shape‖ growth behavior as shown in Figure
4-9.
0%
20%
40%
60%
80%
100%
0% 25% 50% 75% 100% 125% 150% 175% 200%
Increase in Benefit from Baseline (%)
Percent of Sych Geo Implementation (%)
Synch Geo Progression
Figure 4-9: Progression of Benefit from the Synch Geo Future State Alternative
Benefit of Geospatial Foundation Layers at each Echelon
1
0.75
0.5
0.25
0
0 50 100 150 200 250 300 350 400 450
Time (Day)
Dm
nl
BDE Terrain Team Geospatial Data Base : SynchGeo
BDEGeospatial Foundation Data : SynchGeo
BN Geospatial Foundation Data : SynchGeo
Company CP Geospatial Foundation Data : SynchGeo
Platform Indv Geospatial Foundation Data : SynchGeo
Learned Environment Interaction Data : SynchGeo
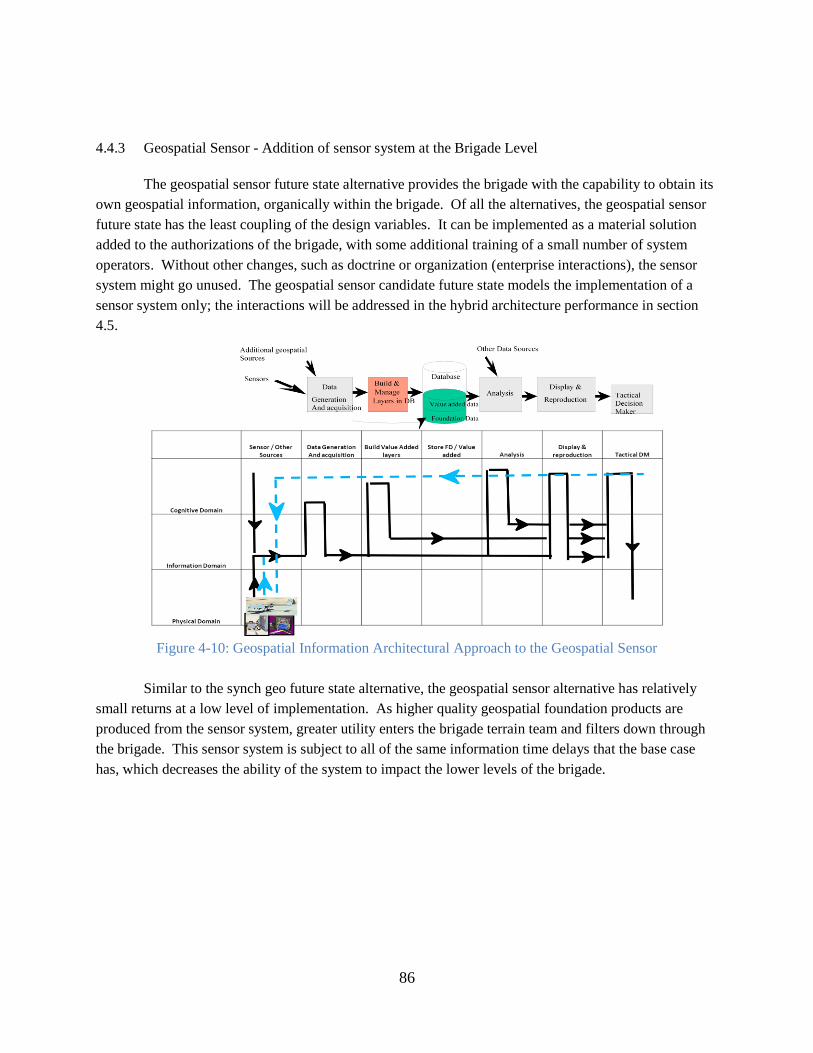
86
4.4.3 Geospatial Sensor - Addition of sensor system at the Brigade Level
The geospatial sensor future state alternative provides the brigade with the capability to obtain its
own geospatial information, organically within the brigade. Of all the alternatives, the geospatial sensor
future state has the least coupling of the design variables. It can be implemented as a material solution
added to the authorizations of the brigade, with some additional training of a small number of system
operators. Without other changes, such as doctrine or organization (enterprise interactions), the sensor
system might go unused. The geospatial sensor candidate future state models the implementation of a
sensor system only; the interactions will be addressed in the hybrid architecture performance in section
4.5.
Figure 4-10: Geospatial Information Architectural Approach to the Geospatial Sensor
Similar to the synch geo future state alternative, the geospatial sensor alternative has relatively
small returns at a low level of implementation. As higher quality geospatial foundation products are
produced from the sensor system, greater utility enters the brigade terrain team and filters down through
the brigade. This sensor system is subject to all of the same information time delays that the base case
has, which decreases the ability of the system to impact the lower levels of the brigade.
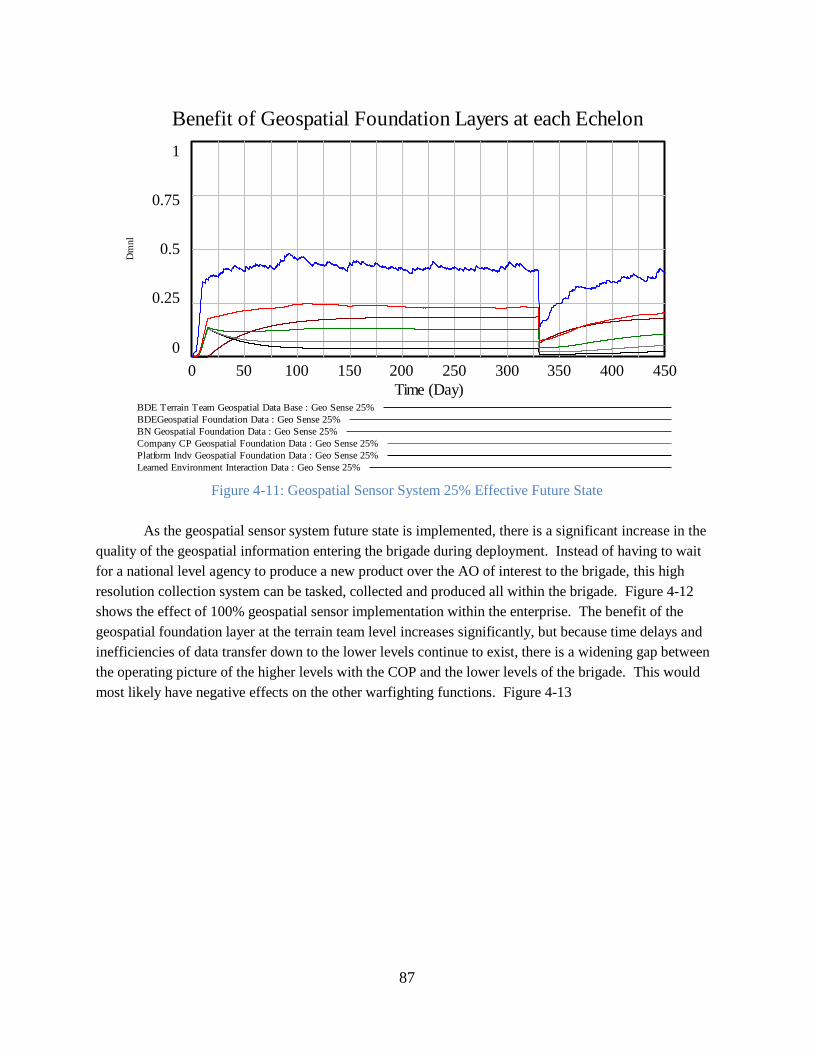
87
Figure 4-11: Geospatial Sensor System 25% Effective Future State
As the geospatial sensor system future state is implemented, there is a significant increase in the
quality of the geospatial information entering the brigade during deployment. Instead of having to wait
for a national level agency to produce a new product over the AO of interest to the brigade, this high
resolution collection system can be tasked, collected and produced all within the brigade. Figure 4-12
shows the effect of 100% geospatial sensor implementation within the enterprise. The benefit of the
geospatial foundation layer at the terrain team level increases significantly, but because time delays and
inefficiencies of data transfer down to the lower levels continue to exist, there is a widening gap between
the operating picture of the higher levels with the COP and the lower levels of the brigade. This would
most likely have negative effects on the other warfighting functions. Figure 4-13
Benefit of Geospatial Foundation Layers at each Echelon
1
0.75
0.5
0.25
0
0 50 100 150 200 250 300 350 400 450
Time (Day)
Dm
nl
BDE Terrain Team Geospatial Data Base : Geo Sense 25%
BDEGeospatial Foundation Data : Geo Sense 25%
BN Geospatial Foundation Data : Geo Sense 25%
Company CP Geospatial Foundation Data : Geo Sense 25%
Platform Indv Geospatial Foundation Data : Geo Sense 25%
Learned Environment Interaction Data : Geo Sense 25%
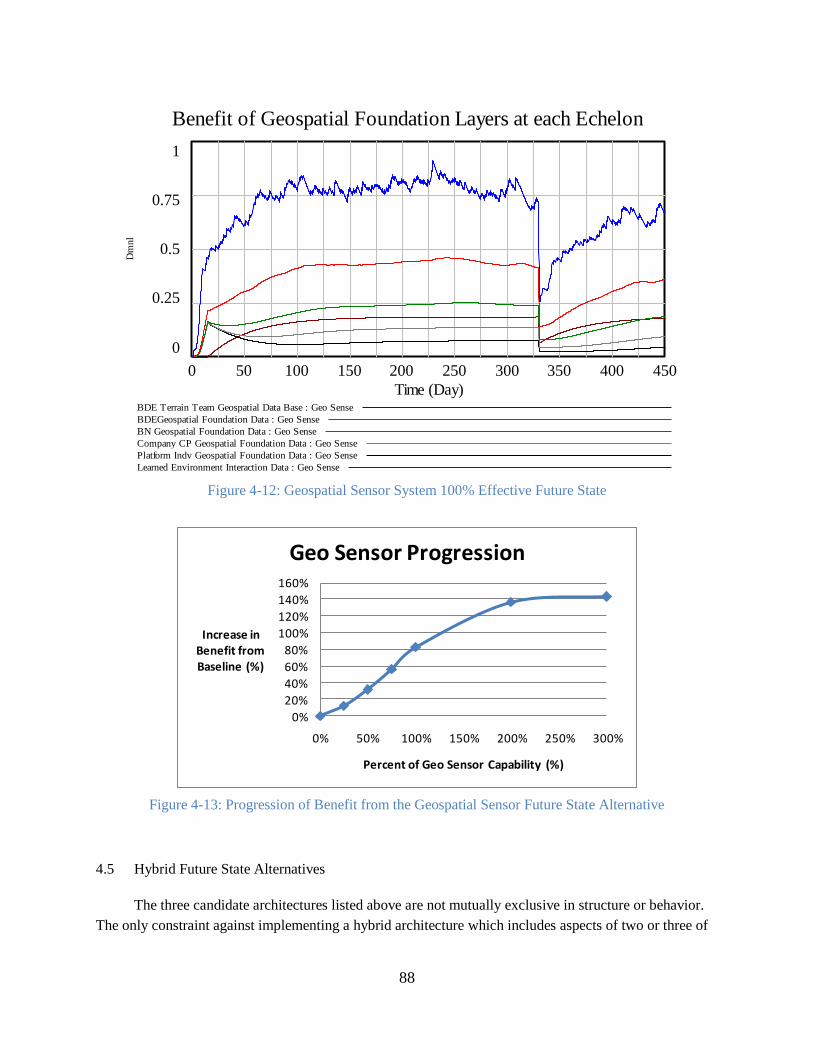
88
Figure 4-12: Geospatial Sensor System 100% Effective Future State
0%
20%
40%
60%
80%
100%
120%
140%
160%
0% 50% 100% 150% 200% 250% 300%
Increase in Benefit from Baseline (%)
Percent of Geo Sensor Capability (%)
Geo Sensor Progression
Figure 4-13: Progression of Benefit from the Geospatial Sensor Future State Alternative
4.5 Hybrid Future State Alternatives
The three candidate architectures listed above are not mutually exclusive in structure or behavior.
The only constraint against implementing a hybrid architecture which includes aspects of two or three of
Benefit of Geospatial Foundation Layers at each Echelon
1
0.75
0.5
0.25
0
0 50 100 150 200 250 300 350 400 450
Time (Day)
Dm
nl
BDE Terrain Team Geospatial Data Base : Geo Sense
BDEGeospatial Foundation Data : Geo Sense
BN Geospatial Foundation Data : Geo Sense
Company CP Geospatial Foundation Data : Geo Sense
Platform Indv Geospatial Foundation Data : Geo Sense
Learned Environment Interaction Data : Geo Sense
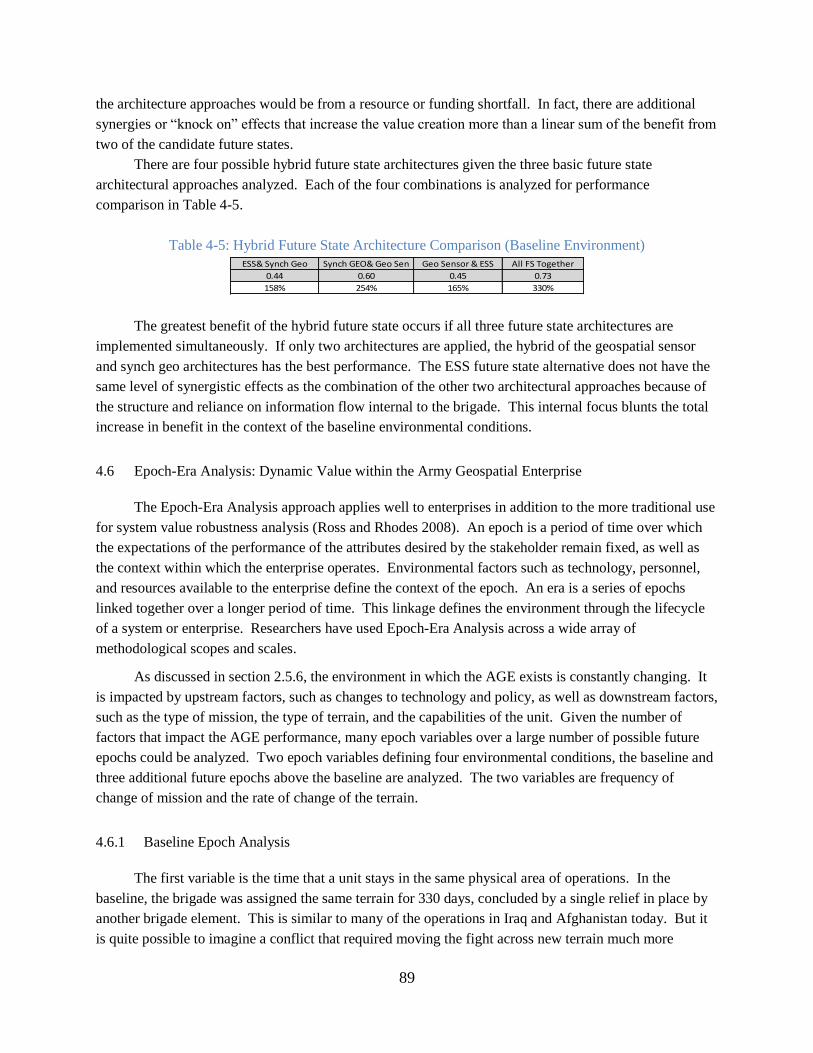
89
the architecture approaches would be from a resource or funding shortfall. In fact, there are additional
synergies or ―knock on‖ effects that increase the value creation more than a linear sum of the benefit from
two of the candidate future states.
There are four possible hybrid future state architectures given the three basic future state
architectural approaches analyzed. Each of the four combinations is analyzed for performance
comparison in Table 4-5.
Table 4-5: Hybrid Future State Architecture Comparison (Baseline Environment)
ESS& Synch Geo Synch GEO& Geo Sen Geo Sensor & ESS All FS Together
0.44 0.60 0.45 0.73
158% 254% 165% 330%
The greatest benefit of the hybrid future state occurs if all three future state architectures are
implemented simultaneously. If only two architectures are applied, the hybrid of the geospatial sensor
and synch geo architectures has the best performance. The ESS future state alternative does not have the
same level of synergistic effects as the combination of the other two architectural approaches because of
the structure and reliance on information flow internal to the brigade. This internal focus blunts the total
increase in benefit in the context of the baseline environmental conditions.
4.6 Epoch-Era Analysis: Dynamic Value within the Army Geospatial Enterprise
The Epoch-Era Analysis approach applies well to enterprises in addition to the more traditional use
for system value robustness analysis (Ross and Rhodes 2008). An epoch is a period of time over which
the expectations of the performance of the attributes desired by the stakeholder remain fixed, as well as
the context within which the enterprise operates. Environmental factors such as technology, personnel,
and resources available to the enterprise define the context of the epoch. An era is a series of epochs
linked together over a longer period of time. This linkage defines the environment through the lifecycle
of a system or enterprise. Researchers have used Epoch-Era Analysis across a wide array of
methodological scopes and scales.
As discussed in section 2.5.6, the environment in which the AGE exists is constantly changing. It
is impacted by upstream factors, such as changes to technology and policy, as well as downstream factors,
such as the type of mission, the type of terrain, and the capabilities of the unit. Given the number of
factors that impact the AGE performance, many epoch variables over a large number of possible future
epochs could be analyzed. Two epoch variables defining four environmental conditions, the baseline and
three additional future epochs above the baseline are analyzed. The two variables are frequency of
change of mission and the rate of change of the terrain.
4.6.1 Baseline Epoch Analysis
The first variable is the time that a unit stays in the same physical area of operations. In the
baseline, the brigade was assigned the same terrain for 330 days, concluded by a single relief in place by
another brigade element. This is similar to many of the operations in Iraq and Afghanistan today. But it
is quite possible to imagine a conflict that required moving the fight across new terrain much more
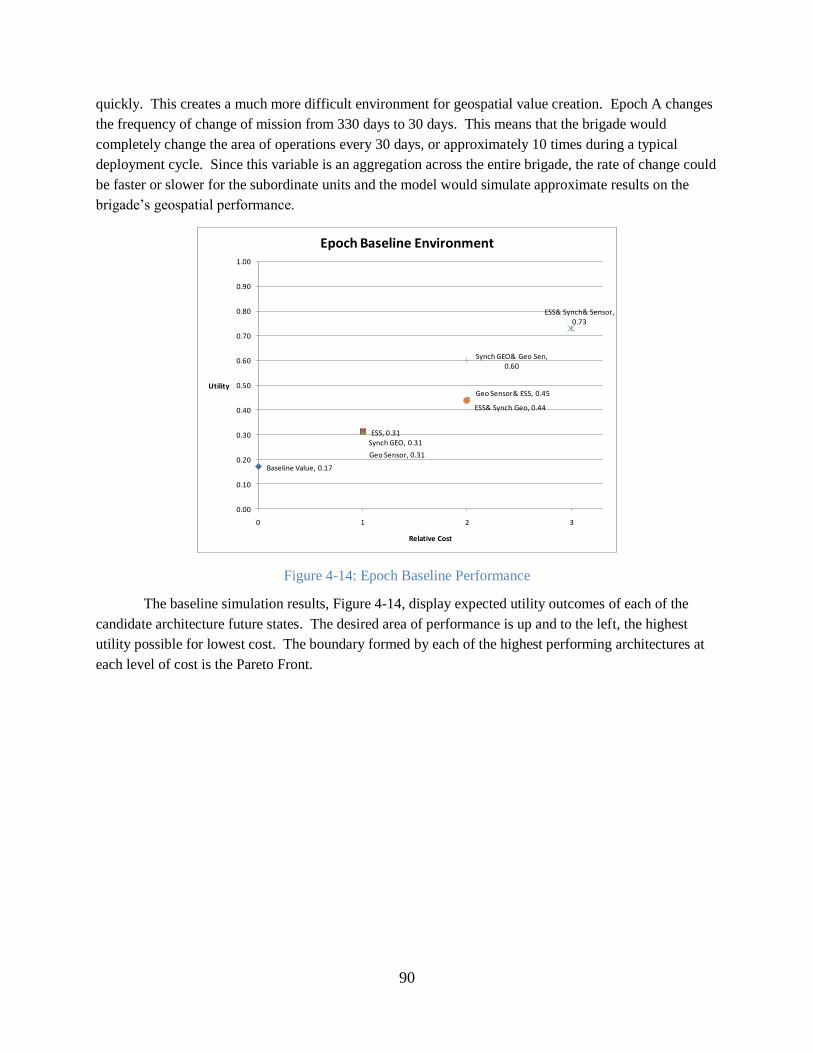
90
quickly. This creates a much more difficult environment for geospatial value creation. Epoch A changes
the frequency of change of mission from 330 days to 30 days. This means that the brigade would
completely change the area of operations every 30 days, or approximately 10 times during a typical
deployment cycle. Since this variable is an aggregation across the entire brigade, the rate of change could
be faster or slower for the subordinate units and the model would simulate approximate results on the
brigade‘s geospatial performance.
Baseline Value, 0.17
ESS, 0.31Synch GEO, 0.31
Geo Sensor, 0.31
ESS& Synch& Sensor, 0.73
ESS& Synch Geo, 0.44
Synch GEO& Geo Sen, 0.60
Geo Sensor& ESS, 0.45
0.00
0.10
0.20
0.30
0.40
0.50
0.60
0.70
0.80
0.90
1.00
0 1 2 3
Utility
Relative Cost
Epoch Baseline Environment
Figure 4-14: Epoch Baseline Performance
The baseline simulation results, Figure 4-14, display expected utility outcomes of each of the
candidate architecture future states. The desired area of performance is up and to the left, the highest
utility possible for lowest cost. The boundary formed by each of the highest performing architectures at
each level of cost is the Pareto Front.
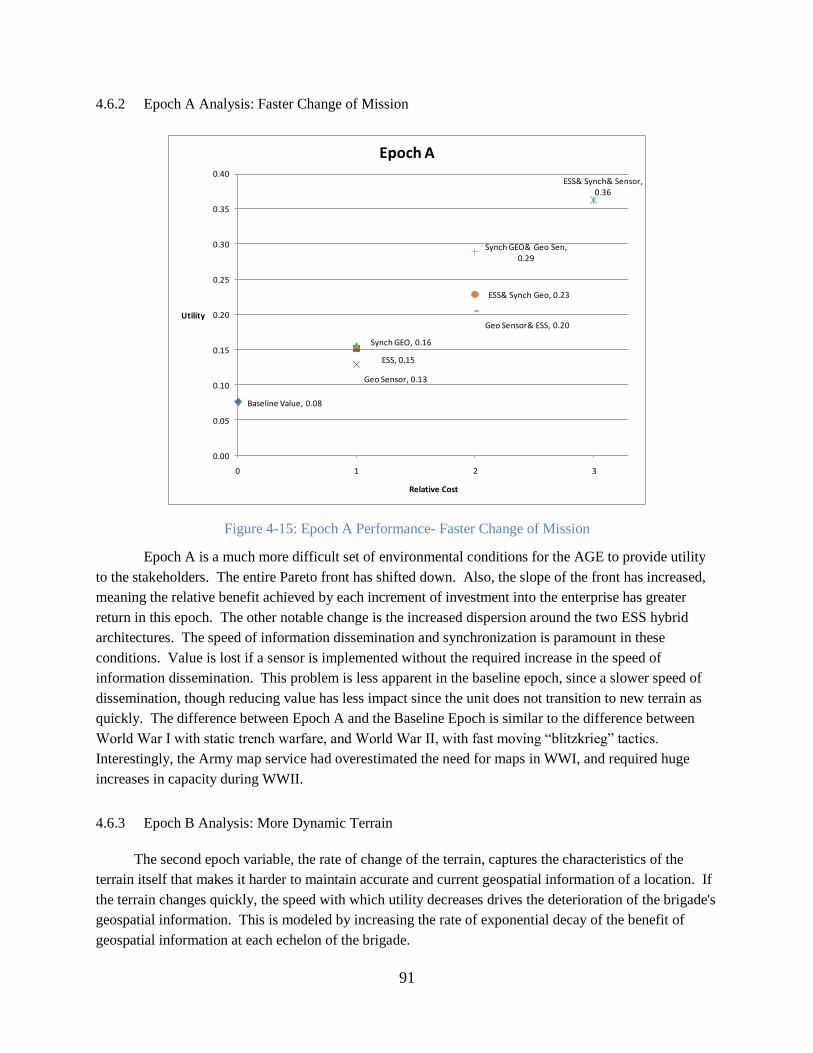
91
4.6.2 Epoch A Analysis: Faster Change of Mission
Baseline Value, 0.08
ESS, 0.15
Synch GEO, 0.16
Geo Sensor, 0.13
ESS& Synch& Sensor, 0.36
ESS& Synch Geo, 0.23
Synch GEO& Geo Sen, 0.29
Geo Sensor& ESS, 0.20
0.00
0.05
0.10
0.15
0.20
0.25
0.30
0.35
0.40
0 1 2 3
Utility
Relative Cost
Epoch A
Figure 4-15: Epoch A Performance- Faster Change of Mission
Epoch A is a much more difficult set of environmental conditions for the AGE to provide utility
to the stakeholders. The entire Pareto front has shifted down. Also, the slope of the front has increased,
meaning the relative benefit achieved by each increment of investment into the enterprise has greater
return in this epoch. The other notable change is the increased dispersion around the two ESS hybrid
architectures. The speed of information dissemination and synchronization is paramount in these
conditions. Value is lost if a sensor is implemented without the required increase in the speed of
information dissemination. This problem is less apparent in the baseline epoch, since a slower speed of
dissemination, though reducing value has less impact since the unit does not transition to new terrain as
quickly. The difference between Epoch A and the Baseline Epoch is similar to the difference between
World War I with static trench warfare, and World War II, with fast moving ―blitzkrieg‖ tactics.
Interestingly, the Army map service had overestimated the need for maps in WWI, and required huge
increases in capacity during WWII.
4.6.3 Epoch B Analysis: More Dynamic Terrain
The second epoch variable, the rate of change of the terrain, captures the characteristics of the
terrain itself that makes it harder to maintain accurate and current geospatial information of a location. If
the terrain changes quickly, the speed with which utility decreases drives the deterioration of the brigade's
geospatial information. This is modeled by increasing the rate of exponential decay of the benefit of
geospatial information at each echelon of the brigade.
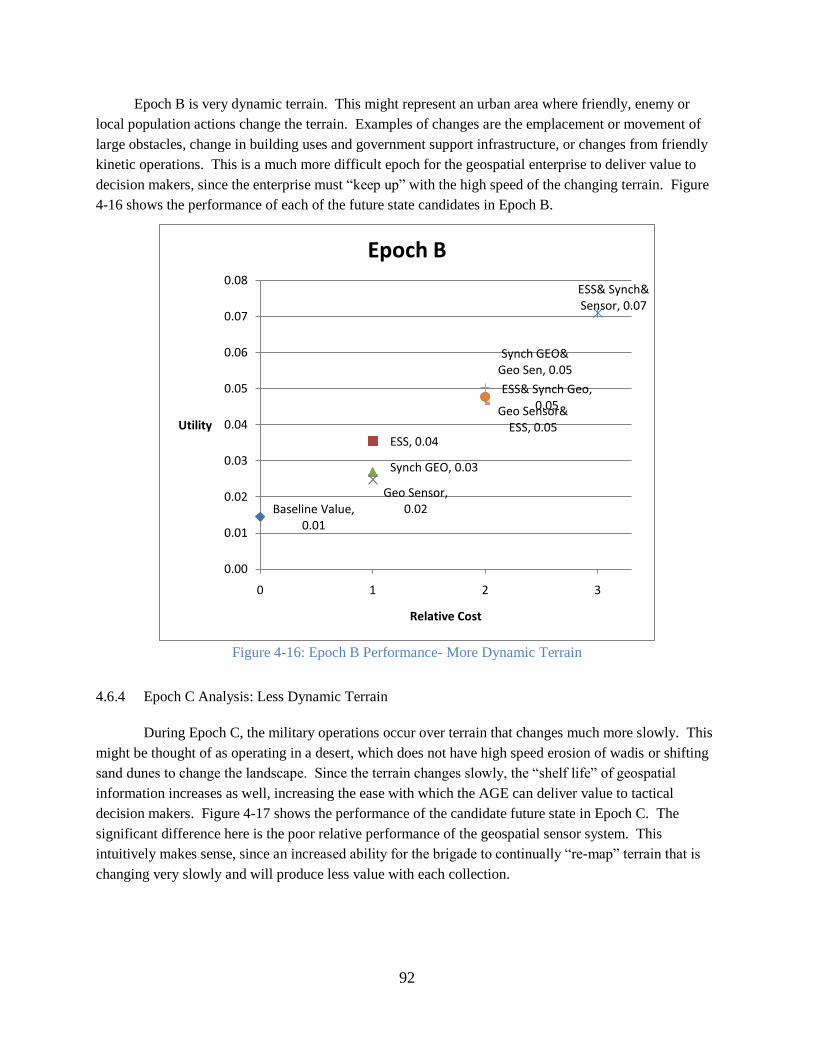
92
Epoch B is very dynamic terrain. This might represent an urban area where friendly, enemy or
local population actions change the terrain. Examples of changes are the emplacement or movement of
large obstacles, change in building uses and government support infrastructure, or changes from friendly
kinetic operations. This is a much more difficult epoch for the geospatial enterprise to deliver value to
decision makers, since the enterprise must ―keep up‖ with the high speed of the changing terrain. Figure
4-16 shows the performance of each of the future state candidates in Epoch B.
Figure 4-16: Epoch B Performance- More Dynamic Terrain
4.6.4 Epoch C Analysis: Less Dynamic Terrain
During Epoch C, the military operations occur over terrain that changes much more slowly. This
might be thought of as operating in a desert, which does not have high speed erosion of wadis or shifting
sand dunes to change the landscape. Since the terrain changes slowly, the ―shelf life‖ of geospatial
information increases as well, increasing the ease with which the AGE can deliver value to tactical
decision makers. Figure 4-17 shows the performance of the candidate future state in Epoch C. The
significant difference here is the poor relative performance of the geospatial sensor system. This
intuitively makes sense, since an increased ability for the brigade to continually ―re-map‖ terrain that is
changing very slowly and will produce less value with each collection.
Baseline Value, 0.01
ESS, 0.04
Synch GEO, 0.03
Geo Sensor, 0.02
ESS& Synch& Sensor, 0.07
ESS& Synch Geo, 0.05
Synch GEO& Geo Sen, 0.05
Geo Sensor& ESS, 0.05
0.00
0.01
0.02
0.03
0.04
0.05
0.06
0.07
0.08
0 1 2 3
Utility
Relative Cost
Epoch B
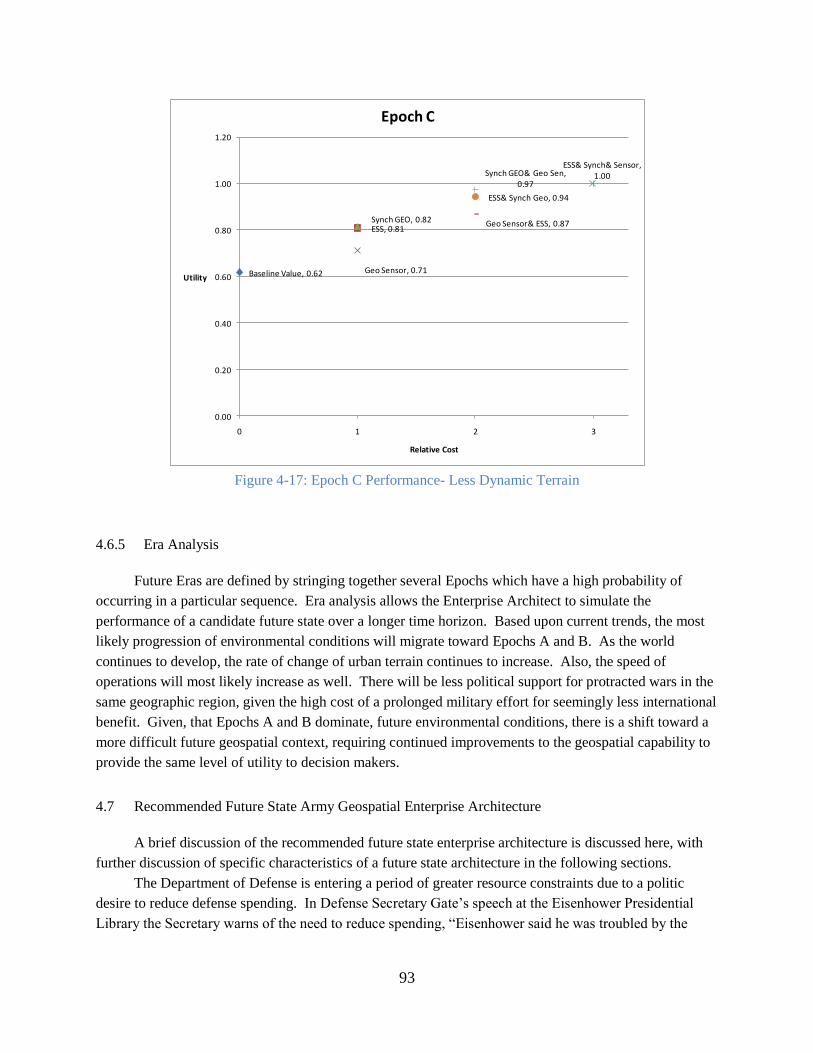
93
Baseline Value, 0.62
ESS, 0.81Synch GEO, 0.82
Geo Sensor, 0.71
ESS& Synch& Sensor, 1.00
ESS& Synch Geo, 0.94
Synch GEO& Geo Sen, 0.97
Geo Sensor& ESS, 0.87
0.00
0.20
0.40
0.60
0.80
1.00
1.20
0 1 2 3
Utility
Relative Cost
Epoch C
Figure 4-17: Epoch C Performance- Less Dynamic Terrain
4.6.5 Era Analysis
Future Eras are defined by stringing together several Epochs which have a high probability of
occurring in a particular sequence. Era analysis allows the Enterprise Architect to simulate the
performance of a candidate future state over a longer time horizon. Based upon current trends, the most
likely progression of environmental conditions will migrate toward Epochs A and B. As the world
continues to develop, the rate of change of urban terrain continues to increase. Also, the speed of
operations will most likely increase as well. There will be less political support for protracted wars in the
same geographic region, given the high cost of a prolonged military effort for seemingly less international
benefit. Given, that Epochs A and B dominate, future environmental conditions, there is a shift toward a
more difficult future geospatial context, requiring continued improvements to the geospatial capability to
provide the same level of utility to decision makers.
4.7 Recommended Future State Army Geospatial Enterprise Architecture
A brief discussion of the recommended future state enterprise architecture is discussed here, with
further discussion of specific characteristics of a future state architecture in the following sections.
The Department of Defense is entering a period of greater resource constraints due to a politic
desire to reduce defense spending. In Defense Secretary Gate‘s speech at the Eisenhower Presidential
Library the Secretary warns of the need to reduce spending, ―Eisenhower said he was troubled by the
94
tendency to ―pile program on program‖ to meet every possible contingency.‖ (Gates 2010) He indicates
that the current priorities, metrics and initiatives must be synchronized and well architected to achieve
better value for the Country. The Secretary continued, ―The Defense Department must take a hard look at
every aspect of how it is organized, staffed, and operated – indeed, every aspect of how it does business.‖
(Gates 2010)
Though the ―upstream‖ resource constraints were not modeled explicitly in the System Dynamics
simulation, the cost of transformation is still considered. Given these ensuing fiscal constraints, a longer,
less aggressive AGE architectural deployment is warranted. The transformation should begin by
implementing the Every Soldier a Geospatial Sensor architectural future state. Modest effort aimed at
capturing the geospatial information during military operations will enable the benefit of geospatial
information already inside the enterprise, but which is currently left at the patrol level. Very quickly the
implementation of the senior geospatial officer and synch geo future state architecture becomes
paramount. As more data is available through additional ESS capture techniques, the lack of
synchronization will continue to increase, leaving more of the value of the geospatial information
unleveraged. Finally, the geospatial sensor at brigade level should not be pursued in the near term. Such
a large sensor program might raise the limits of geospatial capability, but could also cause negative
reaction to the high cost of the sensors and stress already limited aircraft resources for flight hours of
collection.
4.8 Considerations for Enterprise Transformation
The Army Geospatial Enterprise must consider several factors as it determines a possible enterprise
transformation endeavor: first to be considered should be the way in which the decisions surrounding the
architecture are presented to Army leadership. A method of simplistic decision parameterization has
proven effective in other similar decisions. A beneficial outcome of the value driven design method is
that much of the design work can be done ―behind the scenes‖ of the higher level enterprise decision
makers that actually set the budgeting priorities. Even though the design approach was not alternative
based, the architectural decision making could now be designed around a discrete set of design variables
that create alternative future architectures at differing resource levels. The simulated results of the desired
attributes of the enterprise based on the possible future states can help upper level management make
difficult resource decisions and achieve the best possible future state within a fiscally constrained
environment.
4.9 Observations from the Future State Analysis
In light of the candidate architecture analysis, several observations about the nature of Army
geospatial operations emerge. The following sections detail some generalizations for geospatial
information within the AGE.
95
4.9.1 A Portfolio Approach to the Geospatial Portion of the Information Domain
Up to this point the analysis has been focused on the geospatial foundation layer, a specific
portion of the geospatial information within the brigade. The geospatial foundation layer defines the
COP, but there is other geospatial information within the brigade. There is a spectrum of geospatial
information across the information domain from sensor data to reports in natural language. Is one level of
information more beneficial than another? An emerging theme from the research indicates that a
balanced approach to the geospatial information domain is necessary. The degree to which effective
mental models are created in the cognitive domain of the tactical decision maker requires a varied array of
geospatial information. This depends on the context and the preferences of the decision maker.
The goal should be to achieve freedom of movement within the information domain which can
support cognitive flexibility, allowing adaptation to the wide variations of an open system battlefield.
Technology should not force tactical decision makers into a predetermined box within the information
domain, but should enable increased speed of movement within the information domain subject to
appropriate behavior shaping constraints (Vicente 1999).
Recent operations in Iraq and Afghanistan have prompted a shift in military planning doctrine
away from the highly structured task oriented Military Decision Making Process, toward a more flexible
creative problem solving method, simply named ―design.‖ The geospatial community should mirror this
approach with a flexible geospatial foundation layer that spans the information domain in such a way as
to support the open system concept. Why is this necessary? Flexibility of geospatial information allows
for the enterprise to be flexible to the ―geospatial tastes‖ of a wider range of tactical decision makers. It
also allows the enterprise to be adaptable to a greater range of operational information requirements.
A huge prerequisite to enable the effective use of geospatial information across the information
domain is the training of all tactical decision makers on the breadth and applications of geospatial
information. This type of training impacts the knowledge domain of the enterprise by increasing the
capability of the Soldiers, leaders and planners to transform geospatial information into mental models of
the terrain thus producing good situational understanding.
There is a push within the Army‘s geospatial community to overvalue the tier three, high level
products, which are closest to the cognitive domain. It is true that this information has the greatest value
for the decision maker, since these contain ―pre-processing‖ of the lower level information by either
human analysts or computer algorithms. The problem is that built into this processing are the risk
tolerances of the decision maker, based on the context of the larger decision environment. This level of
information increases the speed with which commanders can make decisions, but it removes the benefit of
experienced decision making, where the commander brings together context and constraints in a way that
less experienced analysts or algorithm developers cannot. This is why the context provided by the lower,
tier one products have applicability to command decisions, and a balanced portfolio perspective is needed.
The full geospatial context is critical for commanders at every echelon to demonstrate creativity, evaluate
risk tolerance in tactical decision making, and allow the commander to leverage their expert experiential
decision making advantage.
The goal of geospatial research should not be to drive all information that commanders and staff
interact with into tier three, but rather provide the commanders and staff freedom of movement within the
geospatial information domain. There is great value in the ability of a commander to explore large,
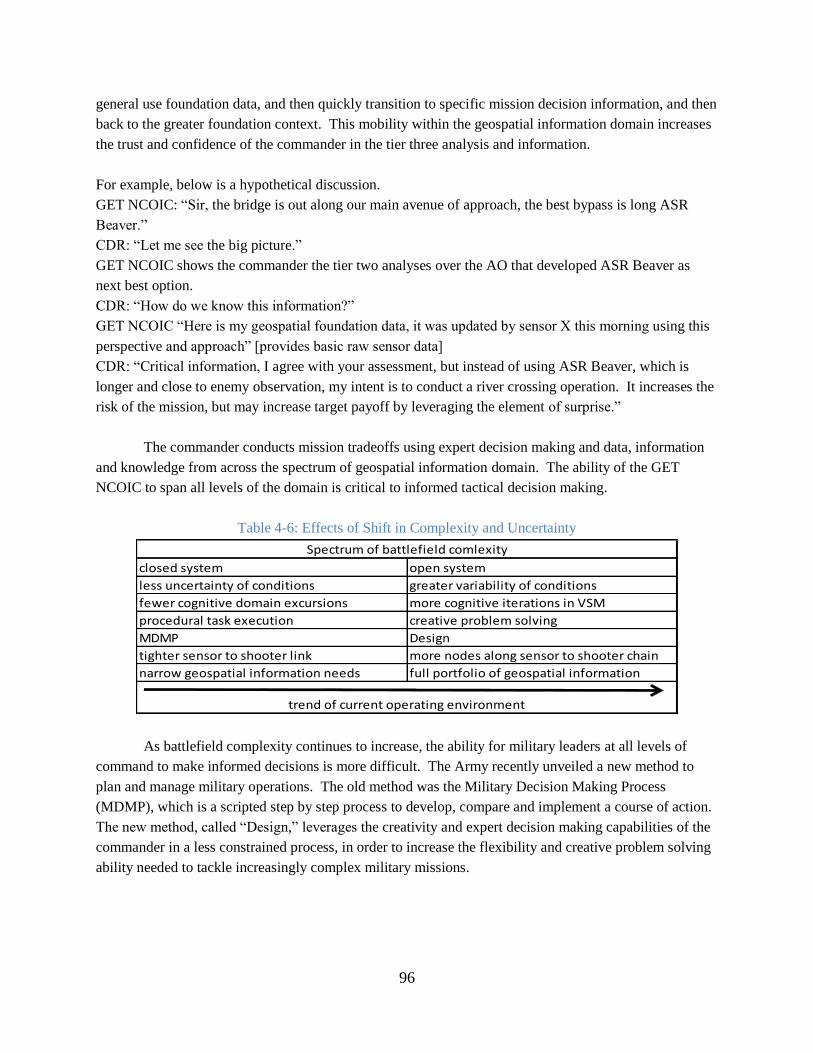
96
general use foundation data, and then quickly transition to specific mission decision information, and then
back to the greater foundation context. This mobility within the geospatial information domain increases
the trust and confidence of the commander in the tier three analysis and information.
For example, below is a hypothetical discussion.
GET NCOIC: ―Sir, the bridge is out along our main avenue of approach, the best bypass is long ASR
Beaver.‖
CDR: ―Let me see the big picture.‖
GET NCOIC shows the commander the tier two analyses over the AO that developed ASR Beaver as
next best option.
CDR: ―How do we know this information?‖
GET NCOIC ―Here is my geospatial foundation data, it was updated by sensor X this morning using this
perspective and approach‖ [provides basic raw sensor data]
CDR: ―Critical information, I agree with your assessment, but instead of using ASR Beaver, which is
longer and close to enemy observation, my intent is to conduct a river crossing operation. It increases the
risk of the mission, but may increase target payoff by leveraging the element of surprise.‖
The commander conducts mission tradeoffs using expert decision making and data, information
and knowledge from across the spectrum of geospatial information domain. The ability of the GET
NCOIC to span all levels of the domain is critical to informed tactical decision making.
Table 4-6: Effects of Shift in Complexity and Uncertainty
closed system open system
less uncertainty of conditions greater variability of conditions
fewer cognitive domain excursions more cognitive iterations in VSM
procedural task execution creative problem solving
MDMP Design
tighter sensor to shooter link more nodes along sensor to shooter chain
narrow geospatial information needs full portfolio of geospatial information
Spectrum of battlefield comlexity
trend of current operating environment
As battlefield complexity continues to increase, the ability for military leaders at all levels of
command to make informed decisions is more difficult. The Army recently unveiled a new method to
plan and manage military operations. The old method was the Military Decision Making Process
(MDMP), which is a scripted step by step process to develop, compare and implement a course of action.
The new method, called ―Design,‖ leverages the creativity and expert decision making capabilities of the
commander in a less constrained process, in order to increase the flexibility and creative problem solving
ability needed to tackle increasingly complex military missions.
97
4.9.2 The Sensor to Shooter Link and Its Impact on Geospatial Operations
The sensor to shooter link is the time it takes to understand the situation to the time it takes to act.
The length of the value stream from sensor to shooter is measured in both time and number of activities
that take place along the pathway. The less time that information takes to get through the value stream,
typically the greater probability of success of the tactical action. The value adding activities are
automated processes acting on the information or an excursion into the cognitive domain of an analyst as
described above. The increase in information quality from the activities along the value stream will
increase the probability of success of the mission. Therefore, the speed and coordination of these
activities will increase the quality, and therefore utility and value of the geospatial information.
A way to approach the analysis of these two methods is to ask the question ―what is the optimal
length of the value stream?‖ The fielding and implementation of Tactical Ground Reporting (TIGR)
addresses a similar need currently, so comparison to that system is appropriate. TIGR is an information
system that allows patrol leaders to input information about the mission and patrol events directly into a
computer system. This allows them to query information later about missions conducted in the past over
the same area of operations. The information can be shared with other units, commanders and planners to
allow them to better understand the terrain, enemy activities, and local population.
―The sea change created by TIGR is that the junior officers and infantrymen have eliminated the
middleman — the intelligence officer — and they can put the information they, and others, have gathered
to immediate use, Maeda [Mari Maeda, project manager for TIGR] said. Patrol leaders now feel that they
are getting something out of the reports they are submitting. ‗We have closed the [intelligence gathering]
circle,‘ she said. ‗The soldier is going to generate the report, [and] all that information is now available to
him at his fingertips.‘‖ (Magnuson 2007)
Is this reduction of ―middlemen‖ from intelligence officers to geospatial analysts the goal of
network centric warfare and Army modernization? This approach does reduce the time from sensing the
battlespace to acting in the battlespace. Within the area of geospatial information, the time reduction may
come at a cost. This change in the value stream of geospatial foundation data compresses the cognitive
requirements as outlined in Figure 2-11.
4.9.3 Information ―Pruning‖
Removing geospatial information from the information domain that is of least utility increases the
opportunity for decision makers to utilize the best information to most quickly positively impact their
cognitive domain, and therefore make the best tactical decisions possible.
If it is true that commanders want to have access to all tiers of geospatial information, then the
―information logistics‖ required to support geospatial operations will continue to grow. To continue the
logistics analogy, the Army uses two sets of information to drive what spare parts are carried with a unit
into battle. The Prescribed Load List (PLL) has demand driven and command drive components. The
demand driven portion of the spare parts list is generated by the number of demands occurring within the
unit over a set period of time. The command driven portion allows the commander to arbitrary add a
percentage of items to the list, usually low density items that may not meet the demand driven
requirements, but which the commander has identified are critical to the mission he is conducting. This
98
dual system allows for command preference and tailored mission perspective while at the same time
imposing some level of logistical restraint and fiscal responsibility. Perhaps there is a need for this dual
approach within the geospatial information arena. The personality of the commander impacts the
information needs that will enable their personal military decision making, thought processes, and mental
models. Catering to these information needs is absolutely important. While at the same time is important
to drive standardization of geospatial information products and databases to improve interoperability and
constrain costs.
Well informed commanders may voluntarily reduce their geospatial information footprint by
pruning the unnecessary data sources and product types in order to their information footprint.
4.10 Future State Summary
The geospatial information has the potential to be the key unifying commodity within command and
control and across all Warfighting Functions. Given the dynamic conditions surrounding the AGE, a
value driven design approach has great potential for increasing the enterprises value delivery over time.
A holistic perspective of the ―knobs‖ available to enterprise leadership in conjunction with deep
understanding of the attributes of the stakeholders enables effective transformation. The three future state
alternatives investigated here are only a small portion of the design space, continued analysis and
technology adoption will continue to increase the performance of the enterprise.
99
5 Conclusions and Recommendations
The purpose of this chapter is to provide a summary of the analysis and recommendations for the
Army‘s Geospatial Enterprise. The findings from the future state analysis conducted in chapter four yield
a set of heuristics for transforming the Army Geospatial Enterprise. The heuristics help to focus the
architecture efforts of AGE organizations and help prioritize the limited resources within the Army
Geospatial community. The chapter ends with a discussion of future work within the research area of the
AGE.
5.1 Findings and Heuristics
Heuristics provide the Enterprise Architect with a set of guiding principles which help to provide
clarity and direction while ambiguity and uncertainty shroud the enterprise. The following basic
heuristics help to inform the architects of the AGE.
5.1.1 Considerations for Harnessing Soldier Input to the Geospatial Foundation Layer
The most cost effective method to increase the geospatial foundation layer at the brigade level is to
employ the Every Soldier as a Geospatial Sensor concept to directly update the geospatial foundation
layer. This change to the AGE will quickly increase the amount of beneficial geospatial information at
each layer in the brigade with access to the information obtained by operations in the battlespace. There
are significant limitations to this approach. First, there is the issue of how the information is propagated
back through the enterprise. The approach modeled in this research assumes a direct linkage from the
mission back to the AGE, meaning the information does not pass back through the cognitive domain of
the operator requiring synthesis and reporting, or of the terrain team for authentication. The information
is directly sensed through some automated means and available across the enterprise instantaneously.
The solution for direct ESS enabled geospatial foundation update could be achieved through many
technical means. The method of technical implementation will impact the amount of information that
flows back into the enterprise. For example, each Soldier could carry a networked GPS enabled camera
system, use structure from motion from vision aided navigation that updates GF, or simply vehicle
statistics to show route and speed. Better harnessing of the geospatial collection capacity during
operations is a relatively low cost architectural adjustment with potentially large benefits.
5.1.2 The Potential Benefit of a Brigade Level Geospatial Sensor
The addition of geospatial sensing capability within the brigade has a great potential for increasing
the utility of the geospatial foundation layer, the utility of the COP, within all warfighting function areas
of the brigade. Of the three alternatives types analyzed in the research, this approach has the greatest
―upper bound‖ since the approach actually brings ―new‖ information into the system, rather than just
increasing the utility of the information that is already within the enterprise. There are several points of
caution for this approach.
100
First, in order to harness the full value of a geospatial sensor capability, the enterprise must first
develop the capability to synchronize the new information more quickly and efficiently. The
implementation of the hybrid senior geospatial officer ―synch geo‖ future state alternative is one method
to improve the process and knowledge areas of the enterprise to enable more efficient utilization of the
geospatial sensor capability. Second, as the level of effort and capability of the geospatial sensor
increases there are increasing returns on that investment, until a break point, after which the benefit of the
new geospatial information quickly hits a point of diminishing returns as the utility of the tactical decision
maker is saturated. This saturation point varies significantly with the type of tactical mission and the type
of terrain the mission operates over. Though in the current state the fear of over production of quality
within the geospatial foundation data seems far off, one can easily imagine a new sensor technology that
could surpass the quality needs of the tactical decision maker for some types of conflicts and relatively
static and simplistic terrain. The final point of caution for consideration when implementing a new
geospatial sensor system is of the three future state architecture alternatives, the geospatial sensor is the
most sensitive to environmental changes in possible future epoch conditions. By itself, the geospatial
sensor is not very ―value robust.‖ One can imagine an expensive sensor system sitting on the shelf
collecting dust if the terrain was not dynamic enough to warrant the effort and risk to conduct continuous
collection operations (Epoch D). Also, a geospatial sensor capability at the brigade level would be
obsolete if operations were moving at such a rapid pace that the information delays within the enterprise
overcame the benefit of the geospatial sensor (Epoch A). Overall, an increased geospatial sensing
capability has great potential in increase the utility of the foundation layer, but this capability must be
implemented within changes to the larger enterprise structure, as well as with a close understanding of the
probability of the nature and location of future operations.
5.1.3 The Negative Effect of Narrow Focus
If enterprise development and improvement efforts focus too heavily on sensor technology and
implementation, greater effort will be expended in the long run, with much of the benefit unrealized.
While, solely focusing on improving the geospatial information flow internal to the brigade structure will
meet utility limits quickly and leave tactical decision makers lacking required knowledge of the terrain.
A balanced approach should be pursued, beginning with improving the internal geospatial information
flows. This improvement must also begin with the process, organization and knowledge enterprise views,
rather than the information technology perspective. Though synchronization and increased speed in
information flow can be influenced by information technology improvement, data standards and proper
geospatial system evolution, initiatives such as senior geospatial personnel and geospatial knowledge
provisioning for all Soldiers is a necessary initial condition to drive information technology development
and adoption.
5.1.4 Balancing Standards with User Innovation
The future state AGE must not stifle the innovation of the geospatial practitioners across the Army. There
is a huge need for standardization, authoritative data structures and products, synchronization, and
compliance within the geospatial portion of battle command. But the innovation of new products, data
101
fusion, and collaboration on the battlefield today continues to push forward the great impact that
geospatial operations has to good military decision making. There should be some care taken to enable
continued ―user innovation‖ in the future state architecture.
There are two considerations for maintaining innovation within an increasingly standardized
enterprise. First, the enterprise should allow for nonstandard processes, products and systems to exist in
defined areas of the enterprise. Testbeds, experimentation efforts and new technology development must
occur across the enterprise, not only deep within research labs under lock and key. The field users, both
producers and consumers of geospatial information, should have the opportunity to operate outside the
typical standard cookie cutter configuration for give periods of time without a prohibitive waiver
processes. Capturing these experiences back within the enterprise as a whole will spread new user needs
and new solution ideas. Second, the enterprise should keep a tight pulse on the cycle time of the
standards evolution within the enterprise. Stagnant policies will unnecessarily stifle technology adoption
and innovation within the enterprise.
5.1.5 The Architecting Effort for the AGE Will Never Be Complete
The AGE is not static. There are components entering and leaving the enterprise. There must be a
continuous flow of informed design decisions, and the architecture must evolve. Informed architecting
requires reflection and continual effort. The job of the enterprise architect and the EA effort is not
complete with execution of a transformation plan. Iteration must continue based on thoughtful reflection
and analysis. The predicted future Epochs and Eras will evolve and change, impacting value
identification and delivery. Architects tend to be consumed by the process of architecting the deliverables
so that they miss the bigger picture. The architect must consider how the enterprise changes over time.
When the architect reflects (as almost an outsider) on the architecture, the longest broadest time horizon
should be used to understand the full context (over time.) Enterprise architecting is never ―done.‖ There
must be continual reflection up on the enterprise, architecture, and value creation within changing needs
and environmental contexts.
5.2 Future work
The values and attributes of the stakeholders need to be refined with further study and utility
elicitation. The system dynamics model could be expanded to insure that the model represents all of the
complexity and interactions with the enterprise, not just at the enterprise boundary at the brigade level.
Also the model requires extensive validation beyond the scope of the present study, most likely requiring
extensive interviews, surveys, and experimental data reaching a broader set of the stakeholders.
5.2.1 Additional Survey Work
The focus of the survey was on the Army Geospatial Enterprise boundary at the BDE level and
below. There are many individuals that reside along that boundary and interact with the enterprise in
many ways. The survey engaged a well positioned subset of all the individuals impacted by the
enterprise. The AGC leadership and terrain team Soldiers were chosen to act as a proxy for several of the
102
other stakeholder segments along the boundary. A larger more comprehensive survey could be conducted
to leverage more perspectives along this boundary. Also, similar investigation could be conducted across
the value stream of the enterprise.
5.2.2 Process for Evolving the Model
Some informal iteration were performed, such as the refining of future state alternatives based on
intermediate results of the initial model, but much more iteration is required in order to capture the full
breadth of stakeholder needs within the final transformation effort. The model requires validation of both
structure and the values of exogenous variables. In order to validate the system dynamics model, the
Another consideration is the significant amount of abstraction contained in the model of the AGE
boundary. Individual geospatial products, databases, and sources are all treated equally, aggregated into a
single geospatial utility. But the benefit derived from each of the available products might evolve during
the operation. Understanding this evolution could help geospatial information producers more accurately
target the most needed products over the duration of the deployment or mission.
Finally, the model does not explicitly determine the cost of implementing the candidate future
state architectures. A refined cost model based upon lifecycle system, manning, and training costs is
needed to more accurately compare the costs associated with each future state architectural approach.
5.3 Conclusion
The results do not attempt to optimize a desired future architecture for the AGE, but rather inform
decision making early in enterprise development to assist the Army geospatial leadership to understand
possible transformation trajectories. Several candidate architectures are developed and evaluated within
the context of dynamic environmental conditions. Given lower resource availability, the best
architectural choice is to focus on capturing the geospatial information obtained by Soldiers as they travel
around the area of operations, learning about the terrain from experiences and interactions with local
populations. As the level of funding increases, there is a significant jump in the benefit of geospatial
information if a geospatial sensor is deployed, while at the same time synchronizing information
dissemination and use within the brigade. Aligning resources appropriately to a coordinated geospatial
architectural approach is important to future military operations as new technologies continue to require
increased geospatial information quality.
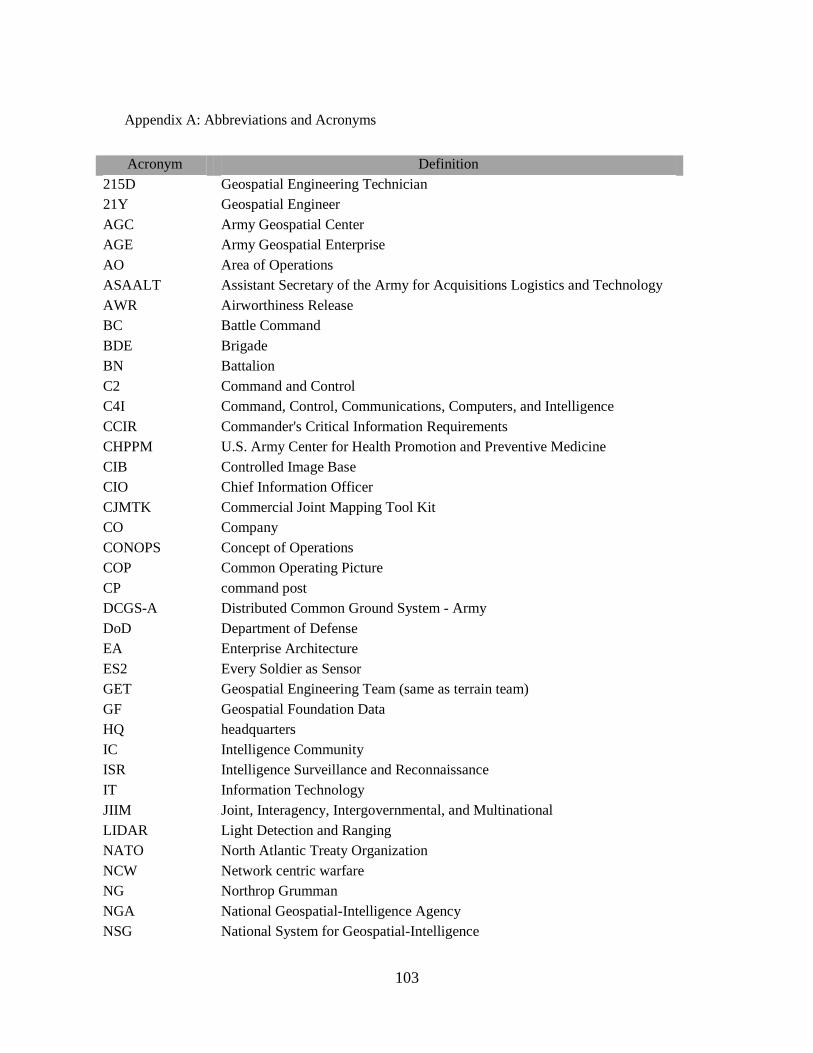
103
Appendix A: Abbreviations and Acronyms
Acronym Definition
215D Geospatial Engineering Technician
21Y Geospatial Engineer
AGC Army Geospatial Center
AGE Army Geospatial Enterprise
AO Area of Operations
ASAALT Assistant Secretary of the Army for Acquisitions Logistics and Technology
AWR Airworthiness Release
BC Battle Command
BDE Brigade
BN Battalion
C2 Command and Control
C4I Command, Control, Communications, Computers, and Intelligence
CCIR Commander's Critical Information Requirements
CHPPM U.S. Army Center for Health Promotion and Preventive Medicine
CIB Controlled Image Base
CIO Chief Information Officer
CJMTK Commercial Joint Mapping Tool Kit
CO Company
CONOPS Concept of Operations
COP Common Operating Picture
CP command post
DCGS-A Distributed Common Ground System - Army
DoD Department of Defense
EA Enterprise Architecture
ES2 Every Soldier as Sensor
GET Geospatial Engineering Team (same as terrain team)
GF Geospatial Foundation Data
HQ headquarters
IC Intelligence Community
ISR Intelligence Surveillance and Reconnaissance
IT Information Technology
JIIM Joint, Interagency, Intergovernmental, and Multinational
LIDAR Light Detection and Ranging
NATO North Atlantic Treaty Organization
NCW Network centric warfare
NG Northrop Grumman
NGA National Geospatial-Intelligence Agency
NSG National System for Geospatial-Intelligence
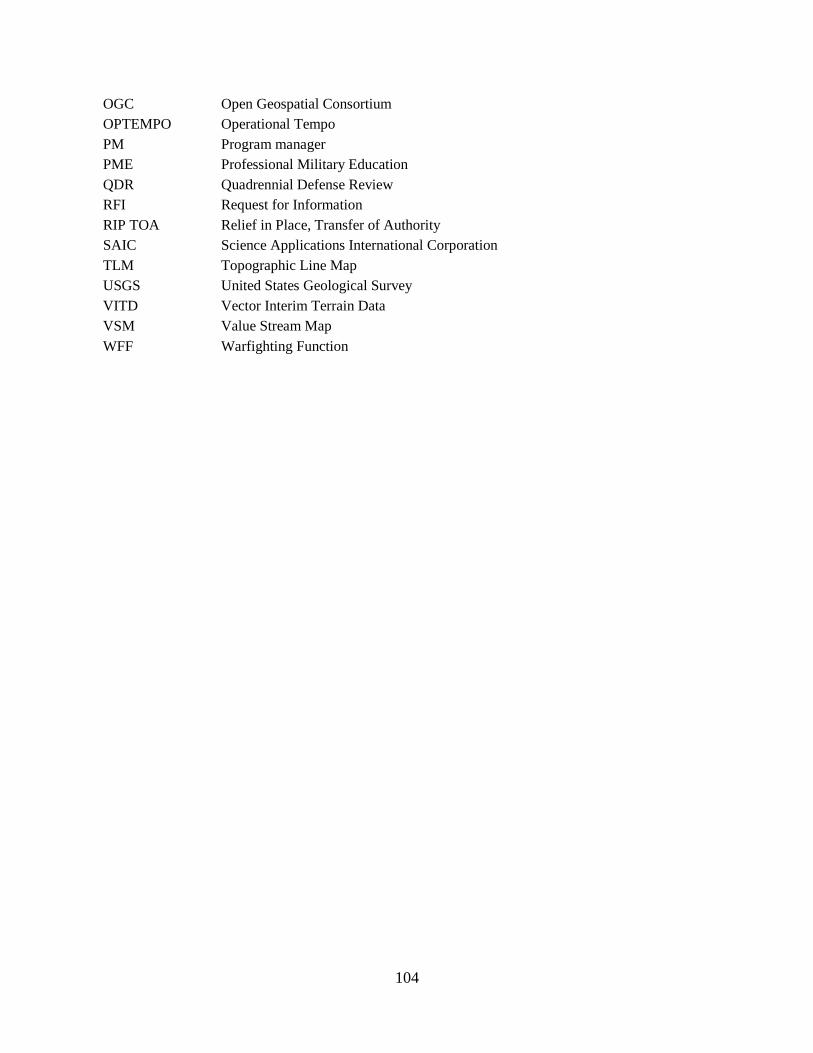
104
OGC Open Geospatial Consortium
OPTEMPO Operational Tempo
PM Program manager
PME Professional Military Education
QDR Quadrennial Defense Review
RFI Request for Information
RIP TOA Relief in Place, Transfer of Authority
SAIC Science Applications International Corporation
TLM Topographic Line Map
USGS United States Geological Survey
VITD Vector Interim Terrain Data
VSM Value Stream Map
WFF Warfighting Function
105
Appendix B: Survey Questions and Full Results
The survey was sent to 300 Soldiers within the Army Geospatial military occupational specialties. The
goal of the survey was to better understand the current state of the Army Geospatial Enterprise.
Some continuing questions:
How should the geospatial foundation layer be considered? When should information be part of the
foundation layer when should updated information be part of a layer on top of the foundation layer.
When the information contradicts information in the foundation layer, that information should update the
geospatial foundation, rather than reside in a layer which contradicts the foundation. Therefore, if
building is on the map, but does not exist, the foundation layer should be updated.

106
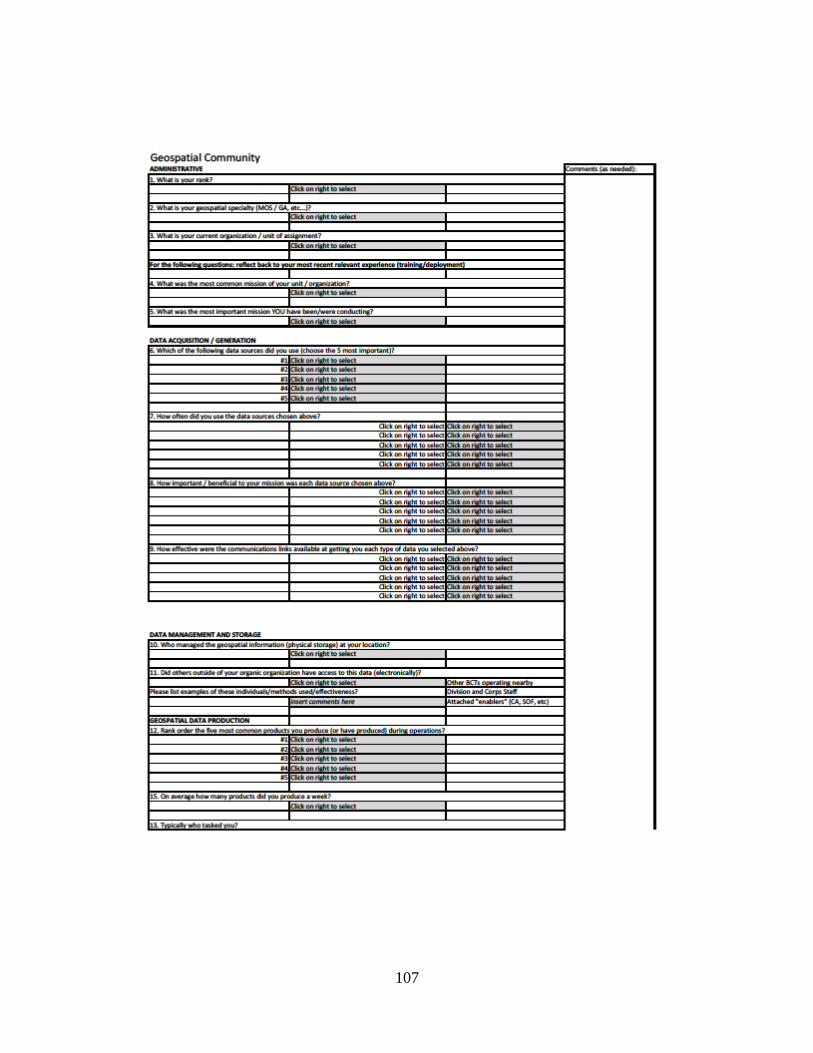
107
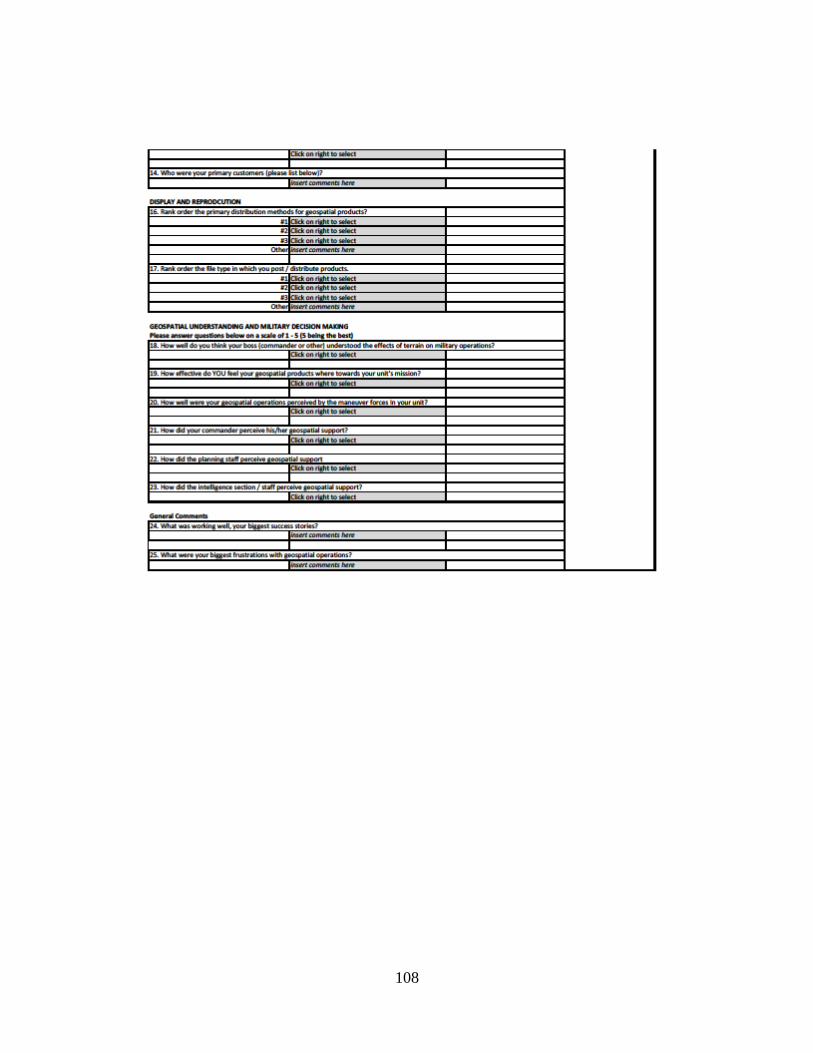
108
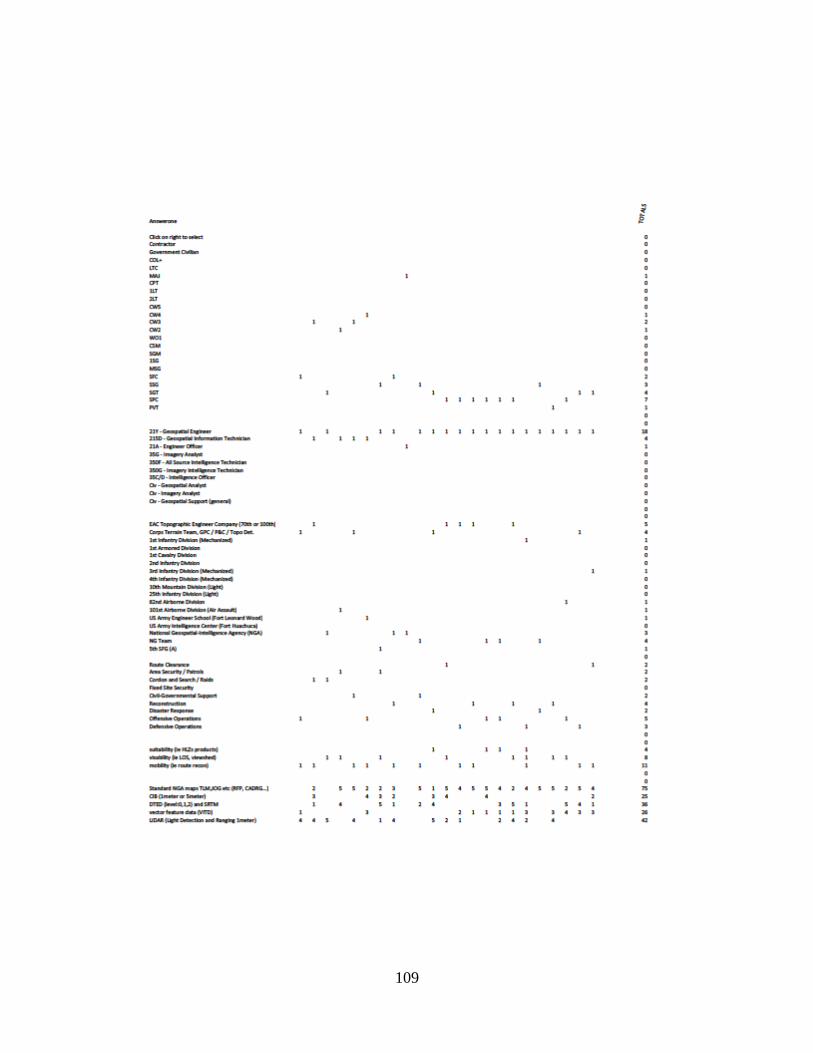
109
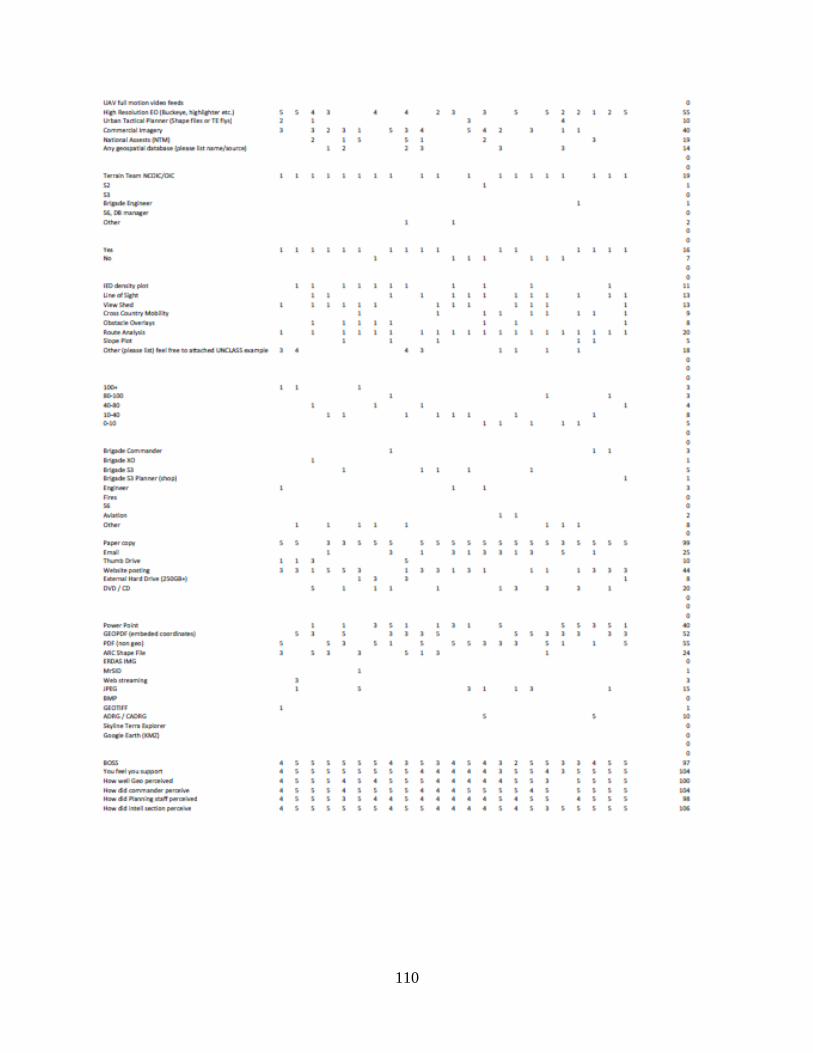
110
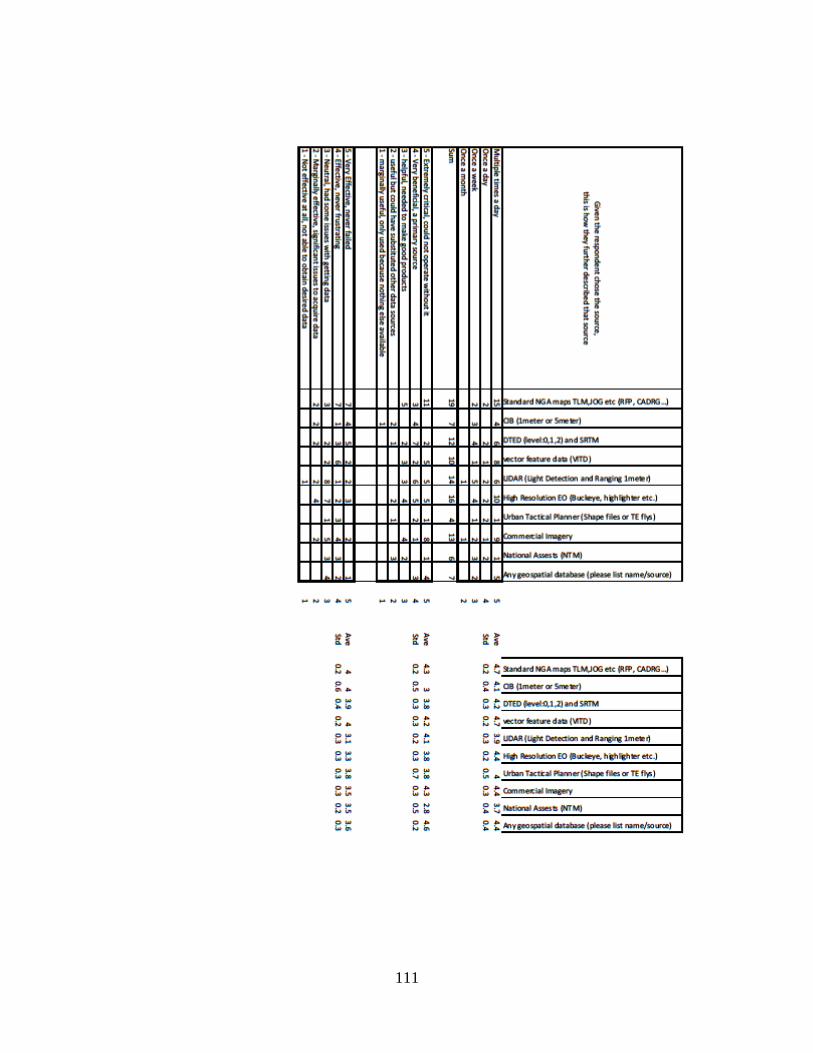
111
112
The following section contains the free text responses from the survey as well as informal interview
responses conducted during the research that contributed to the knowledge of the AGE current state
architecture.
A. Survey Results from Officers (21A, 215D)
General Comments:
- My team served mostly as a planning tool, assisting in isolated events, and provided the Common
Operational Picture (COP).
- I‘m not surprised by the number of Hardcopy/ PPT/ PDF products. I would submit that we need
to consider the staff process outside the Ft Leavenworth class room. Staff processes are driven by
the XO‘s preferences up front and the CDR‘s requirements as a course correction. The XO‘s
stamp on the staff‘s products is very specific to the organization, the personalities that cycle into
the staff and the operational constraints and/or requirements (call it the operational flavor) that
orbits the battle captain‘s desk. Hard copy and static PPT/PDF products are not just tangible
documents that feed some fundamental tactile need of every staff officer. Hard copy products are
also the lowest common denominator in terms of getting inside the cognitive process of an
individual staff section in the upstream or collaborative process, as well as delivering a suitable
product for organizational output (downstream) as defined by the XO first and nuanced by the
CDR second. Hard copy and static PPT/PDF products snap shot a knowledge base in what can be
an extremely dynamic environment.
- I usually measured my team by all three criterion you listed. # of products / saturation across
brigade / the number of references I received from trigger pullers (―Chief, my buddy had this
really cool….. He said I should come see you to get one of my own‖) It is extremely difficult to
gauge the relevance of your production. A team can chew through a whole lot of trees and still
deliver crap. Talking to trigger pullers is the easiest way to get a feel for your production.
- I would lay out recommendations and production times to them individually. As an example,
when we jumped from [location] X to Y the XO mandated that each vehicle would have a route
product in the vehicle. The S3 would determine additional information requirements to go on the
product. I would return with an example product and a timeline to produce the requisite number
of products. As time went on, (experience grew) those production times became noticeably
shorter and shorter.
- Typical population of ABCS systems involved the ―golden brick‖ solution. One master set of
coverages were cut by my team and given to the ABCS contractors. They would populate the
maps into a ―golden brick‖ test the brick and then replicate all the other bricks from the golden
bricks.
- Prior to publishing the master coverage to the contractors, the XO and S3 would receive a spread
sheet from that detailed coverage size, file size, brick constraints, recommended scales by system
age of each raster layer, and a graphic that showed the OE and graphic coverage. Once blessed, I
did all the haggling with the contractors to ensure that the maps were delivered on time and
worked as advertised. It took a few weeks to burn all the bricks.
- Average age of the tiles weren‘t always available. For the most part CIB1 was the most critical
layer. If the Staff wasn‘t happy with the CIB1 coverage I would convert a newer commercial
113
image in to CIB1. I checked for errata by pulling tiles from the old CIB and comparing them to
the new CIB. Keep in mind all of this was accomplished before the data went to the contractors.
Updates were a major decision point for the staff. Any updates were accomplished via the golden
brick method. (only for an extreme shift in the OE)
- 95% of the vector foundation was produced in house or QC‘d from other teams and incorporated
within our data set. For the most part all raster data originated from NGA. There were only a
few occasions where a non standard map would be scanned and converted to RPF format as it
was a high risk production that carried numerous caveats beyond the standard (do not use for
targeting +). Those non-standard raster requirements were usually originated from the
BN/SQDRN level.
What were the biggest AGE success stories:
- HLZ analysis, Sensor Placement LOS analysis, COP distribution, Route Studies
- IED plots in combination of using other 'INT' sections. This created GEOINT products for the
command. It painted a clear and complete tactical picture with layers capable of turning on or off
through Geo-PDF.
- The En BDE CDR and G2 worked together and placed the Geospatial Team under the G2and
placed the NGA team under the operational control of me to synchronize Geospatial operations in
the Corps. H also placed us in the SCIF next to the Imagery Analysts and we in effect had a
GEOINT Cell. This gave me access to all of the information and expertise I needed to most
effectively provide Geospatial Support to the Corps Commander and staff
What were the biggest frustrations:
- Lack of sufficient, standardized data (vector and raster); LIDAR files too large to do anything
with; too many organizations distributing geospatial data/products/analysis
- Requesting stateside support for critical data from NGA, i.e. Soils.
- The proliferation of multiple contractor supplied battle command systems and the lack of a
common foundation for information exchange and data standards. This caused me to convert
products into various formats so that I could ensure all systems would be able to use my data and
products. Also there were no methods to capture geospatial data from various organic sources
within the Corps unless I manually hunted for them and jammed them into my database. For
instance the C5 guys had a list of hospitals on a spread sheet with some information that I needed
to fill in holes in my urban database. If I had not gone to them and discovered this spread sheet I
would never have known about it. Many such examples happened throughout the operation.
-
B. Survey Results from noncommissioned officers (NCOs) (21Y)
General Comments:
- I just can't bring myself to say it, but PPT was a norm, but it was always a PPT of a JPEG map
analysis to scale
114
What were the biggest AGE success stories:
- Updating our standard products an posting to a non-DTSS/GIS enabled web portal regularly
- The DTSS.
- The biggest success story was the fact that my Terrain team introduced a FOB's worth of units to
the benefits of incorporating Geospatial products into their mission planning. We even had
numerous units from other bases call or e-mail requests for products, which is how it should be.
Geospatial data should be shared, not horded, by Terrain teams. Too many times we had
someone come in to the shop and be extremely surprised that we would make a product for them,
no matter where they were located or what unit they belonged to. Everyone that came into my
shop, I educated them on the uses and benefits of different products and made every effort to
show them ways they can access websites with products already made or contacts where they can
ask for things that we did not make, though most times I ordered these myself. My shop
consisted of 3 instead of the normal 4 people, one of which had no experience in this field. I was
extremely proud of their efforts to produce products to my high standards. We had numerous
comments and praise for the way our shop treated customers and for the high quality products we
produced.
- The Ability to Post PDF products for any element outside our area to download for their mission
support
- Arabic maps for ISF, Unit location maps for Staff sections
- Assisting a broad array units has allowed us to create products beyond the scope of our supported
unit's tasking.
- Tracking and finding medivacs and down aircraft.
What were the biggest frustrations:
- 60% of our work is still pretty maps that people want because the customer saw it on someones's
wall and they think they need it too. No matter how hard we tried to sell/educate the customer on
our capabilities, they don't utilize us to full (technical) potential, though they will tax us with busy
work. Skyline TerraSuite software is so powerful and enabling for the guys on the ground.
Everybody thinks its cool, but nobody wants it. Wish that would change.
- Bandwidth/network. It seems that the military has data and technology that far exceeds its needs
and is perfect because it allows us to be mobile, adaptive and agile for the fight. The issue always
comes in moving all this great data.. So we find ourselves sitting on GB's if not TB's worth of
data and are forced to try and get it threw a coffee straw to someone on the other end. Most of the
time causing huge delays in passing information or failure to pass it because the network times
out. With the new push for bans on external devices it has made it even more frustrating because
you fight the S6 shops trying to drop a system from the network to plug up your TB drives of data
that someone flies in to you or ships to you. The reality of the times is everything needs to be
moving towards WMS services. The future of the geospatial community lies in its ability to create
these products and have them posted to a web site/service so they can be quickly viewed, edited,
downloaded, or printed by the end user. The other thing we noticed lacking is a central repository.
When we got into Iraq in '07 the military on a whole had been doing planning/operations in
115
theatre for call it 5+ years. We found 7 different versions of the country border alone and not 1
person anywhere could be an authoritative decision maker on which boundary was accurate and
should be used for all products, period. There was an attempt by the 100th topo under CW2
Stratton to stand up the IGD(Iraqi Geospatial Database). The intent was to ingest everything in
theatre from corps, division and brigade levels with appropriate metadata and then force a
standardization of the data and serve it back up to all in theatre via the IGD. Last I had heard that
project fell apart somewhere around the end of 2008. I did recently learn that the NGA came
along with their new CASI servers as a way to do something similiar but their focus is on
ingesting non-standard data and making it available to everyone. So although somewhat effective
at least for data sharing I have no direct experience with how easy/fast downloading data from
those servers is. It also is lacking in that they have not yet determined anyway to force
standardized metadata attributions of the incoming data or a way to help QA/QC data collected to
turn back over and distribute as standardized data under a VITD/UTP style format or something
similar in nature.
- The DTSS when it crashed.
- The fact that none of the geospatial servers in theater were operational except Divisions. What
good was a server if no one but division had access to it? Division ended up posting things on
their website so BDE teams could pull some data off but due to the file restrictions, these had to
be pretty small. The biggest frustration was the USB ban. Another pet peeve of mine was the
fact that most of the terrain teams in theater were on [in one place]. Data was not being
disseminated down to the lower levels, specifically the battalion and company level. Most
missions at those levels were still relying on the old NGA paper TLM's, which could be mass
ordered with a DLA account, though we did re-print many of those for a quick fix if the mission
was leaving that day. One last pet peeve was using the terrain teams as mass printers since we
had a 42" and 36" plotter. Those not lucky enough to have a strong NCO in charge we used as
printers. I had requests for things like printing targets for the range, printing family pictures and
lastly CHARTS. I was constantly being asked, and then told at the end, to make charts and
graphs for the Brigade Commander and XO. This is a waste and in my opinion, abuse of
resources!
- The Ease of ordering supplies, Paper, Ink(Until Thumb Drives got banned then that impeded
movement greatly)
- Some units have Terrain sections with s3/G3, others with S2/G2. Big army needs to make a
decision if we will be part of the engineer community or the intel community. If we are going to
be part of intel, (as is the trend for more units) 21Y needs to require a TS/SCI clearance.
- There is only one slot for a 21Y not equipment when I arrived had to order and collect all thing
need to run a shop, maintain it all and try to convince the command that they need a geospatial
analyst. Justify cost.
- Being seen by supported unit primarily as a S3/engineering asset; this seemed to limit the number
of more analysis driven products.
- lack of research and product availability within CONUS.
C. Survey Results from enlisted Soldiers (21Y)
116
What were the biggest AGE success stories:
- COMMUNICTAION THROUGHOUT THE ENTIRE TERRAIN TEAM
- BEING ABLE TO PRODUCE VISUAL AIDS TO IMPORTANT MISSIONS AND BE THANK
BY THE CUSTOMERS.
- providing analysis and infrastructure support to the corps of engineers for base improvement and
development
- Created a "mapbook" of our entire AO. Gave to the Commanders of each company in digital
format before deployment.
What were the biggest frustrations:
- ARC map crashing and malfunctions, not being able to print, not being able to get information off
of DTSS to disseminate information, not having a server.
- TIME
- OLD SYSTEMS OPERATIONS
- Getting imagery needed for mission.
- lack of knowledge of geospatial capabilities by non geospatial MOS's.
- Lack of updated Useful Imagery/CADRG (TLM,JOG). Need more Buckeye!! More LIDAR!!
Need maps that werent made 15 years ago. Update the VITD.
- Data Management after we took over.
- Most of the other soldiers in our unit didn't really know what we do. They confused us with a
print shop and we always asked if we laminated things.
117
Appendix C: Enterprise Boundary System Dynamics Model
The following list contains the specifics of the system dynamics model that defines the AGE interface.
Each variable is explained in detail. The name of the variable is give, with the formulated equation for
how the variable is calculated in the simulation. The units of the variable and the brief description are
then provided. For more information about the structure of the model and how the model was developed,
see the current state discussion of the model development.
(##) Name of model variable = equation for how variable derived in simulation
Units of the variable
A brief description of the variable with discussion as needed
AGE Model:
(01) BDE Terrain Team Geospatial Data Base= INTEG (Increase in Terrain Team GF-Decrease in
Terrain Team GF,0)
Units: Dmnl
This is the utility of geospatial data contained in the Brigade terrain team.
(02) BDEGeospatial Foundation Data= INTEG (Increase in BDE GF-Decrease in BDE GF,0)
Units: Dmnl
This is the utility of geospatial foundation data for mission planning execution at the brigade level
(used by the brigade commander and staff elements)
(03) BN Geospatial Foundation Data= INTEG (Increase in BN GF-Decrease in BN GF,0)
Units: Dmnl
This is the utility of geospatial foundation data for mission planning execution at the battalion
level (used by the battalion commander and staff elements)
(04) Change of Mission=PULSE(330, 1 )
Units: Dmnl/(Day/Dmnl)
The loss of utility of the geospatial foundation due to the operation changing locations or focus to
the degree that the current data set does not build useful mental models
(05) Company CP Geospatial Foundation Data= INTEG (Increase in Company GF-Decrease in
Company GF,0)
Units: Dmnl
This is the utility of geospatial foundation data for mission planning execution at the company
level (used by the company commander and company headquarters and CP)
118
(06) Cumulative geo benefit= INTEG (increase to cumulative geo benefit,0)
Units: Dmnl*Day
This is the integral of the daily benefit from the geospatial foundation lay over time.
(07) data updates from higher=IF THEN ELSE( ((RANDOM UNIFORM (0 , 1 , 500))>0.9) ,
RANDOM NORMAL( 0 , 0.3 , mean benefit of updates,st dev of updates from higher, 1000 ) , 0)
Units: Dmnl/Day
The benefit of data received from a higher echelon during a deployment is approximated by a
random value drawn from a normal distribution
(08) Decrease in BDE GF=BDEGeospatial Foundation Data/Time constant for degradation of
GF+Change of Mission*BDEGeospatial Foundation Data
Units: Dmnl/Day
This is the loss of utility of geospatial information from the Brigade staff due to loss of latency
(aging of the information) as well as change of mission (change in location or type of missions
conducted)
(09) Decrease in BN GF=BN Geospatial Foundation Data/Time constant for degradation of
GF+Change of Mission*BN Geospatial Foundation Data
Units: Dmnl/Day
This is the loss of utility of geospatial information from the BN staff due to loss of latency (aging
of the information) as well as change of mission (change in location or type of missions conducted)
(10) Decrease in Company GF=Company CP Geospatial Foundation Data/Time constant for
degradation of GF+Change of Mission*Company CP Geospatial Foundation Data
Units: Dmnl/Day
This is the loss of utility of geospatial information from the Company CP due to loss of latency
(aging of the information) as well as change of mission (change in location or type of missions
conducted)
(11) Decrease in Ind GF=Platform Indv Geospatial Foundation Data/Time constant for degradation of
GF+Change of Mission*Platform Indv Geospatial Foundation Data
Units: Dmnl/Day
This is the loss of utility of geospatial information from the platform or individual level due to
loss of latency (aging of the information) as well as change of mission (change in location or type
of missions conducted)
(12) Decrease in Terrain Team GF=BDE Terrain Team Geospatial Data Base/Time constant for
degradation of GF+Change of Mission*BDE Terrain Team Geospatial Data Base
Units: Dmnl/Day
119
This is the loss of utility of geospatial information from the Brigade terrain team due to loss of
latency (aging of the information) as well as change of mission (change in location or type of missions
conducted)
(13) Deployment time=15
Units: Day
This is the number of days from the deployment order until the information are packed and
shipped. Therefore this is the number of days that the initialization of geospatial foundation can occur.
(14) Effectiveness of RIP TOA=1
Units: Dmnl
This is the percentage of geospatial foundation data that is passed to the new unit.
(15) Experiential GF data gap=Required GF benefit-Learned Environment Interaction Data
Units: Dmnl
The GF experience data gap is the difference of the information desired (assumed here to be
complete knowledge initially) minus the information already learned threw experience
(16) FINAL TIME = 450
Units: Day
The final time for the simulation.
(17) fraction of ESS benefit filtered up=1
Units: Dmnl
This is the percentage of the information that is collected by Solider conducting operations that is
available and implemented into the geospatial foundation layer. It is a value from 0 to 1.
(18) fraction of geospatial utility filtered down=0.5
Units: Dmnl
This is the percentage of data that is passed to the lower echelons. Data may not be passed based
on bandwidth constraints, doctrinal reasons or other.
(19) GF Data Gap=
MAX(GF needs for Planning-BDEGeospatial Foundation Data,0)
Units: Dmnl
The Geospatial Foundation data gap is the difference of the GF needs for planning and the
available GF. The GF needs for navigation are typically not felt by the GET due to the distance from the
operators on the battlefield (they are not located at BDE staff level)
(20) GF needs for Planning= 1
Units: Dmnl
120
this is the perceived geospatial foundation needs that are articulated to the GET. If all needs are
perfectly articulated than the value is 1. If no need is articulated than the value is 0.
(21) Increase in BDE GF=Initialization of GF+MAX(BDE Terrain Team Geospatial Data Base-
BDEGeospatial Foundation Data, 0 )/time to update GF from higher+Mission Experiences*fraction of
ESS benefit filtered up
Units: Dmnl/Day
(22) Increase in BN GF=MAX( BDEGeospatial Foundation Data-BN Geospatial Foundation Data , 0
)/time to update GF from higher+Initialization of GF+Mission Experiences*fraction of ESS benefit
filtered up
Units: Dmnl/Day
The increase to the geospatial foundation data occurs as the sum of the initialization of the GF
plus the incremental updates that come from the next higher echelon
(23) Increase in Company GF=MAX(BN Geospatial Foundation Data-Company CP Geospatial
Foundation Data, 0 )/time to update GF from higher+Initialization of GF+Mission Experiences*fraction
of ESS benefit filtered up
Units: Dmnl/Day
The increase to the geospatial foundation data occurs as the sum of the initialization of the GF
plus the incremental updates that come from the next higher echelon
(24) Increase in Ind GF=MAX(Company CP Geospatial Foundation Data-Platform Indv Geospatial
Foundation Data , 0 )/time to update GF from higher+Initialization of GF+Mission Experiences*fraction
of ESS benefit filtered up
Units: Dmnl/Day
The increase to the geospatial foundation data occurs as the sum of the initialization of the GF
plus the incremental updates that come from the next higher echelon
(25) Increase in Terrain Team GF=initial data provisions from higher+Terrain Team data
generation+data updates from higher+Mission Experiences*fraction of ESS benefit filtered up
Units: Dmnl/Day
the utility of stored data is generated by the utility of data gained from above, below and
generated internally.
(26) increase to cumulative geo benefit=Utility of data passed to new unit from BDE
Units: Dmnl
This is the total benefit each day from the geospatial foundation.
(27) initial data provisions from higher=PULSE( 5 , 5 )*0.05
Units: Dmnl/Day
This is a pulse function as data provisioning and synchronization is pushed from higher.
121
(28) INITIAL TIME = 0
Units: Day
The initial time for the simulation.
(29) Initialization of GF=IF THEN ELSE( PULSE(0, Deployment time ) , (BDE Terrain Team
Geospatial Data Base*fraction of geospatial utility filtered down)/Time to initial the GF , 0 )
Units: Dmnl/Day
This is the GF data that is pushed down from BDE down the lower echelons in the initial data
push following a deployment order or change of mission.
(30) Learned Environment Interaction Data= INTEG (Mission Experiences-Loss of Experience,
0)
Units: Dmnl
This is the captured experience from operations. It includes things like "this is the dangerous part
of town, increase convoy force protection" and it is contained in data bases, notebooks and shared unit
memory.
(31) Loss of Experience= Learned Environment Interaction Data*(Personnel Turnover+Change of
Mission)+Learned Environment Interaction Data/Time constant for degradation of GF
Units: Dmnl/Day
This is the loss of experience in terrain either by the unit being reassigned to a different
geographic location, or the personnel changing jobs and taking some (or all) of the experiential
information with them (memory, notebooks, spreadsheets etc...)
(32) mean benefit of updates=0.003
Units: Dmnl/Day
This is the mean of benefit of new data received from higher echelons to the brigade terrain team
(33) Mission Experiences=IF THEN ELSE(PULSE( 0 , Deployment time)<0.5 , Experiential GF data
gap/OPTEMPO , 0 )
Units: Dmnl/Day
The increase to understanding of terrain from the Soldier operating in a battlespace over time.
This information is captured in several locations, "green books" spread sheets and just remembered
experiences.
(34) OPTEMPO=220
Units: Day
This is the time it takes to acquire knowledge of terrain that develops by operating in a
battlespace. The longer faster the OPTEMPO the shorter the time.
(35) Personnel Turnover=0
122
Units: Dmnl/Day/Dmnl
This is the rate at which personnel change over in their assigned duties
(36) Platform Indv Geospatial Foundation Data= INTEG (Increase in Ind GF-Decrease in Ind GF,0)
Units: Dmnl
(37) Required GF benefit=1
Units: Dmnl
Soldiers desire to know everything possible about their Area of Operations. For example, when
arrive to a new area, the Soldiers typically will recon all areas within the AO, and then systematically
learn as much as possible about the cities, towns, people and key terrain elements.
(38) SAVEPER = TIME STEP
Units: Day [0,?]
The frequency with which output is stored.
(39) st dev of updates from higher=0.04
Units: Dmnl/Day
This is the standard deviation of benefit achieved from products delivered from higher down to
the BDE terrain team
(40) Terrain Team data generation=GF Data Gap/Time to produce needed products
Units: Dmnl/Day
The geospatial foundation data production is determined by the data gap over the time that it
takes to fill the data gap. Measured in utility / day.
(41) Time constant for degradation of GF=50
Units: Day
The time it takes for the utility of information to degrade due to latency.
(42) TIME STEP = 0.125
Units: Day [0,?]
The time step for the simulation.
(43) Time to initial the GF=10
Units: Day
The time it takes to build and replicate the geo foundation throughout the BDE
(44) Time to produce needed products=200
Units: Day
This is the average time it takes for the terrain team to bridge the Geospatial Foundation data gap.
Measured in days.
123
(45) time to update GF from higher= 40
Units: Day
This is the average time for utility at the higher echelon to deliver that benefit to the subordinate
organization.
(46) Utility of data passed to new unit from BDE=(BDEGeospatial Foundation Data+BDE Terrain
Team Geospatial Data Base+BN Geospatial Foundation Data+Company CP Geospatial Foundation
Data+Platform Indv Geospatial Foundation Data +Learned Environment Interaction Data)*Effectiveness
of RIP TOA
Units: Dmnl
At any point in time the total utility of geospatial foundation data that is passed during a relief in
place / transfer of authority (RIP TOA) is the sum of the utility of geospatial foundation data within the
terrain team and the brigade staff times a fraction based on the effectiveness of the RIP TOA process
124
Bibliography
Alberts, David S, John J Garstka, Richard E Hayes, and David A Signori. Understanding Information Age
Warfare. Washington, DC: CCRP Publication Series, 2001.
Alberts, David S. Information Age Transformation: Getting to a 21st Century Military. Vienna: CCRP
Publications Series, 2002.
Apostolakis, George. "DA 7. Decision Analysis in Practice." MIT ESD.72 Engineering Risk-Benefit
Analysis. April 5, 2009. https://stellar.mit.edu/S/course/ESD/sp09/ESD.72/ (accessed May 16, 2010).
Army Architecture Integration Center. AEA Foundation. April 6, 2010.
http://architecture.army.mil/enterprise.html (accessed April 6, 2010).
Association of the United States Army. ES2: Every Soldier is a Sensor. Washington DC, August 2004.
Bechtold, Ron. "National Defense Industrial Association." June 3, 2009.
http://www.ndia.org/DoDEntArchitecture/Documents/Ron%20Bechtold%20-%20Final.pdf (accessed
May 13, 2010).
Clausewitz, Carl von. On War. Edited by Michael Howard and Peter Paret. Princeton University Press,
1976.
Crawley, Edward. "Identifying Value - Reducing Ambiguity in the System." MIT ESD.34 System
Architecture, Massachusetts Institute of Technology. http://stellar.mit.edu/S/course/ESD/fa09/ESD.34/,
October 2, 2009.
Department of the Army Chief Information Officer/G-6. Global Network Enterprise Construct (GNEC):
The Army‟s Strategic Vision for the Transformation of LandWarNet. Washington DC, July 22, 2009.
Devlin, Keith. Infosense: Turning Information into Knowledge. New York: W.H. Freeman and Company,
2001.
DiMario, Michael, Robert Cloutier, and Dinesh Verma. "Applying Frameworks to Manage SoS
Architecture." Engineering Management Journal, 2008: 18-23.
DoD Business Transformation Agency. Business Enterprise Architecture (BEA) 101. March 2008.
http://www.bta.mil/products/training/BEA/index.htm (accessed May 1, 2010).
Escape Maps. History Army Map Service WWII. January 16, 2010. http://www.escape-
maps.com/history_army_map_service_wwii.htm (accessed April 27, 2010).
125
Feser, Jason. "Geospatial Intelligence as a Cycle." Working Paper, 2010.
Field Manual 3-0: Operations. Washington, DC: Headquarters, Department of the Army, 2008.
Field Manual 5-0: Army Planning and Orders Production. Washington, D.C.: Headquarters,
Department of the Army, January 2005.
Gates, Robert. US Department of Defense. May 8, 2010.
http://www.defense.gov/speeches/speech.aspx?speechid=1467 (accessed May 11, 2010).
Interview by James Richards. Geospatial Community Survey (October 2009).
Hoops, Hatteras A. "Geospatial Product Examples." Alexandria: Army Geospatial Center, February 2010.
Howell, David C. Statistical Methods for Psychology. Pacific Grove: Duxbury Thomson Learning, 2002.
Independent Commission on the National Imagery and Mapping Agency. "The Information Edge:
Imagery Intelligence and Geospatial Information in an Evolving National Security Environment."
December 2000. https://www1.nga.mil/About/Documents/nima_commission.pdf (accessed February 25,
2010).
Joint Chiefs of Staff. "Joint Publication 1-02:Department of Defense Dictionary of Military and
Associated Terms." Washington DC, June 13, 2007.
—. "Joint Publication 2-03:Geospatial Intelligence Support to Joint Operations." Washington DC, March
22, 2007.
—. "Joint Publication 3-13.1:Electronic Warfare." Washington DC, January 25, 2007.
Keeney, Ralph L. "Making Better Decision Makers." Decision Analysis, December Vol. 1, No. 4, 2004:
193–204.
—. Value-Focused Thinking: A Path to Creative Decisionmaking. Cambridge: Harvard University Press,
1992.
Klein, Gary. Sources of Power: How People Make Decisions. Cambridge: Massachusetts Institute of
Technology Press, 1999.
Magnuson, Stew. Army wants to make „every soldier a sensor‟ . May 2007.
http://www.nationaldefensemagazine.org/ARCHIVE/2007/MAY/Pages/ArmyWantSensor2650.aspx
(accessed April 6, 2010).
126
Murman, Earll, et al. Lean Enterprise Value: Insights from MIT's Lean Aerospace Initiative. New York:
Palgrave Publishers Ltd, 2002.
Powers, Michael, interview by James Richards. Technical Director, Army Geospatial Center (March 11,
2010).
Rhodes, Donna, Adam Ross, and Deborah Nightingale. "Architecting the System of Systems Enterprise:
Enabling Constructs and Methods from the Field of Engineering Systems." 3rd Annual IEEE
International Systems Conference. Vancouver, 2009.
Richards, James. ""BuckEye" Fact Sheet: An Airborne High Resolution Digital Imaging System."
Alexandria: Topographic Engineering Center, May 2006.
Ross, Adam, and Donna Rhodes. "Using Natural Value-Centric Time Scales for Conceptualizing System
Timelines through Epoch-Era Analysis." INCOSE International Symposium, Utrecht, the Netherlands.,
June 2008.
Ross, Adam, and Donna Rhodes. "Using Natural Value-Centric Time Scales for Conceptualizing System
Timelines through Epoch-Era Analysis." INCOSE, 2008.
Sterman, John D. Business Dynamics. Boston: McGraw-Hill, 2000.
Sun Tzu. On the Art of War. Edited by Lionel Giles. 1910.
TRADOC Capability Manager Geospatial. "Army Geospatial Enterprise (AGE) Concept of Operations
(CONOPS) for Battle Command - Operational Use." 3rd Coordinating Draft, Fort Leonard Wood, 2009.
Vicente, Kim J. Cognitive Work Analysis: Toward a Safe, Productive, and Healthy Computer-Based
Work. Mahwah: Lawrence Erlbaum Associates Inc., 1999.
Visone, Daniel. Geospatial Acquisition Support Directorate Update. Alexandria, November 3, 2009.
Wright, Edward. Understanding and Managing Uncertainty in Geospatial Data for Tactical Decision
Aids. PhD Thesis, Fairfax: George Mason University, 2002.