Embed Size (px)
Citation preview
E L S E V I E R P I I : S 0 9 5 1 - 8 3 2 0 ( 9 7 ) 0 0 1 3 6 - 1
Reliabili O' Engineering and System Sa[~,ty 59 (1998) 151-159 © 1998 Elsevier Science Limited
All rights reserved. Printed in Northern Ireland 0951-8320/98/$19.00
Integrating technical analysis and public values in risk-based decision making
H a n s B o h n e n b l u s t a & P a u l S lov ic b
aErnst Basler Partners Ltd, Zollikon, Switzerland bDecision Research, Eugene, Oregon, USA
Simple technical analysis cannot capture the complex scope of preferences or values of society and individuals. However, decision making needs to be sustained by formal analysis. The paper describes a policy framework which incorporates both technical analysis and aspects of public values. The framework can be used as a decision supporting tool and helps decision makers to make more informed and more transparent decisions about safety issues. © 1998 Elsevier Science Limited.
1 INTRODUCTION
Dangers are a fact of life. Most human activities involve some kind of risk to man and environment. In their daily decisions people implicitly consider the risks they face. The same holds for many decisions made by private companies, public institutions and government. Many of these decisions affect safety issues which are only considered implicitly. In an increasingly complex world the resulting decisions are not always appropriate because the limits of the human mind do not allow for an implicit consideration of a large number of different factors. In the past many lessons had to be learned by trial and error. Formal analysis is needed to aid decision making in complex situations.
However, the application of formal analysis to safety issues raises new questions. The risks perceived by society and by individuals cannot be captured by simple technical analysis. There are many reasons for this which will be discussed in the following sections. However, it is clear that decision making needs to account for both technical analysis and public values.
Tools to analyze risk have been in existence for many years 1-3. Also, the basic phenomena of risk perception have been the topic of many investigations 4"5. What has been lacking to a large extent, however, is a framework on how to bring technical information and public percep- tions together in order to be useful in a normative sense in decision making.
2 CONTENTIOUS ISSUES
The formal analysis of safety issues to aid decision making leads to many controversies which seem to be unresolvable.
151
The actual point of discrepancy may not necessarily be related to safety. Often it turns out that controversies go back to basic disagreements between the different parties involved. Even the best safety analysis cannot resolve such issues.
While applying formal analysis, it is important to realize that the following contentious issues do exist:
• Pragmatism versus understanding. A typical contro- versy exists between those who strive for pragmatic and fast solutions and those who prefer to have a clear understanding of the complex problem under discussion before deciding about possible solutions.
• Objectivity. Many people insist on objective inves- tigations. They do not realize the restricted scope of objectivity. Even in the area of scientific and tech- nical data, objectivity can be strived for but is not achievable in most cases. The interpretation of facts and data always asks for many assumptions which are characterized by subjectivity and the values of the person making the assumptions. Moreover, many people demand objectivity with respect to value judgments, though values are by their very nature subjective.
• Rationality. Fear of certain risks is sometimes called irrational. However, there is more than one way to be rational. Rationality can be defined by a set of axioms. As long as these axioms differ among the parties involved a mutual understanding will hardly be possible.
• Probabilistic versus deterministic view. It is unwise to neglect the probabilistic character of many events. Many processes obey probabilistic laws. Furthermore, it is necessary to consider events
152 H. Bohnenblust, P. Slovic
happening far in the future in a probabilistic way. Deterministic tools are not able to capture the prob- abilistic nature of such events. On the other hand, taking actions such as adding an extra safety valve is a deterministic matter. Engineers who are sup- posed to design such safety measures need to take on a deterministic view: Should they add one or two safety valves? Again, the problem is not to tell whether one or the other is true. The issue is to combine the probabilistic and the deterministic view in a reasonable way. Uncertainty. The different facets of uncertainty are a central issue in the field of safety. The tools of probability and decision analysis help to handle the uncertainty of events happening in the future in a consistent way. However, these tools are based on a set of axioms. Of course, one can agree or disagree with these axioms. Values. Many questions referring to value judg- ments are not recognized. People often feel uneasy addressing value judgments explicitly. Hence, they are tempted to avoid them. Whether implicit value judgments result in better solutions i s - - a t least--questionable. Definition of risk. There is no unique definition of risk. For example, the number of fatalities and the reduction of life expectancy may both be proxy indicators of risk. Choosing one indicator in a spe- cific analysis involves value judgments. Different parties may prefer different indicators; thus, they will have a hard time to discuss the results of a risk analysis in a constructive way. Role of technical experts. In the past most safety decisions have been made by technical experts, i.e. by scientists and engineers. This may be legitimate as far as questions of the behavior of technical sys- tems are concerned. However, safety decisions involve technical as well as value judgements. In this respect, technical experts may contribute their own opinion as thoughtful citizens of our society. But, values of laymen, politicians, in short of the public at large, need to be considered as well. Social scientists can help in formalizing the opinions of the public at large.
Objectivity and a common definition of risk may not be achievable in many situations. Disagreements among the different parties involved about many fundamental issues may remain. However, it may still be possible to reach a consensus on how ~o resolve the specific problem under discussion. In many specific problems there is a strong need to prioritize risk~and actions and to demonstrate that public (or private) money is spent effectively 6. In the course of the discussion it should be clear whether one strives for resolving the fundamental issues or for finding a consensus for a specific problem. The former may be impossible; the latter may be achievable.
3 A FRAMEWORK FOR QUANTITATIVE SAFETY ANALYSIS
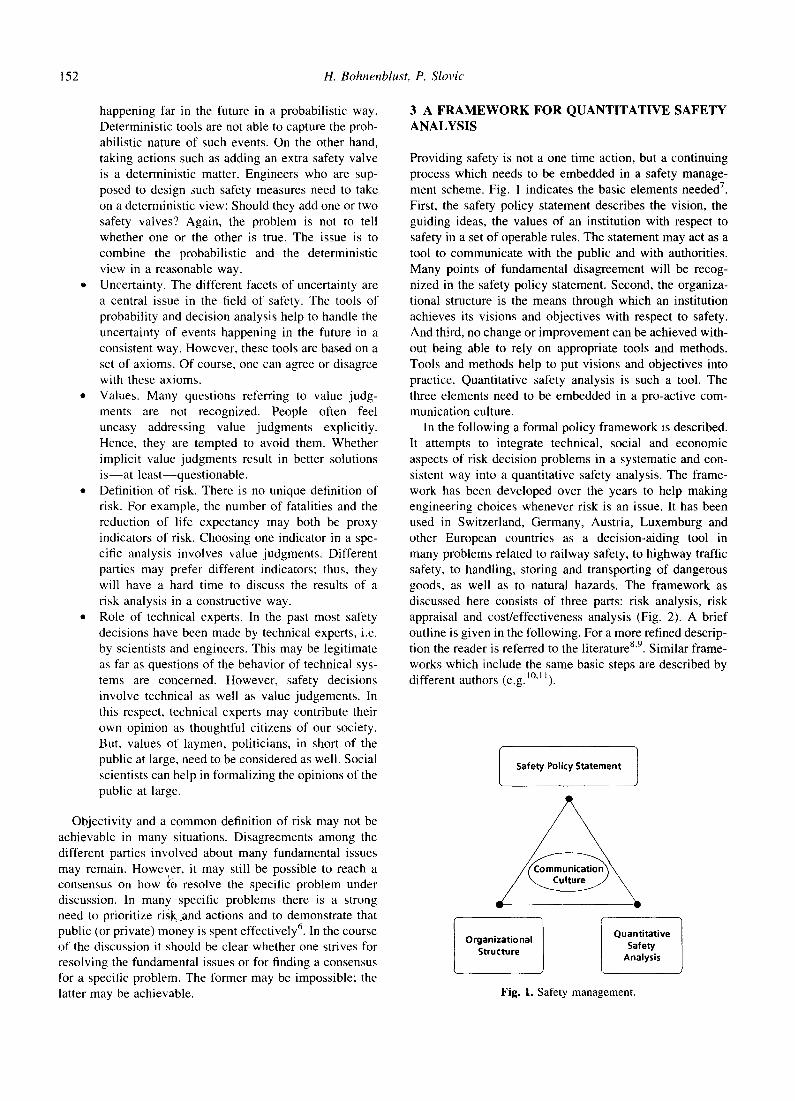
Providing safety is not a one time action, but a continuing process which needs to be embedded in a safety manage- ment scheme. Fig. 1 indicates the basic elements needed 7. First, the safety policy statement describes the vision, the guiding ideas, the values of an institution with respect to safety in a set of operable rules. The statement may act as a tool to communicate with the public and with authorities. Many points of fundamental disagreement will be recog- nized in the safety policy statement. Second, the organiza- tional structure is the means through which an institution achieves its visions and objectives with respect to safety. And third, no change or improvement can be achieved with- out being able to rely on appropriate tools and methods. Tools and methods help to put visions and objectives into practice. Quantitative safety analysis is such a tool. The three elements need to be embedded in a pro-active com- munication culture.
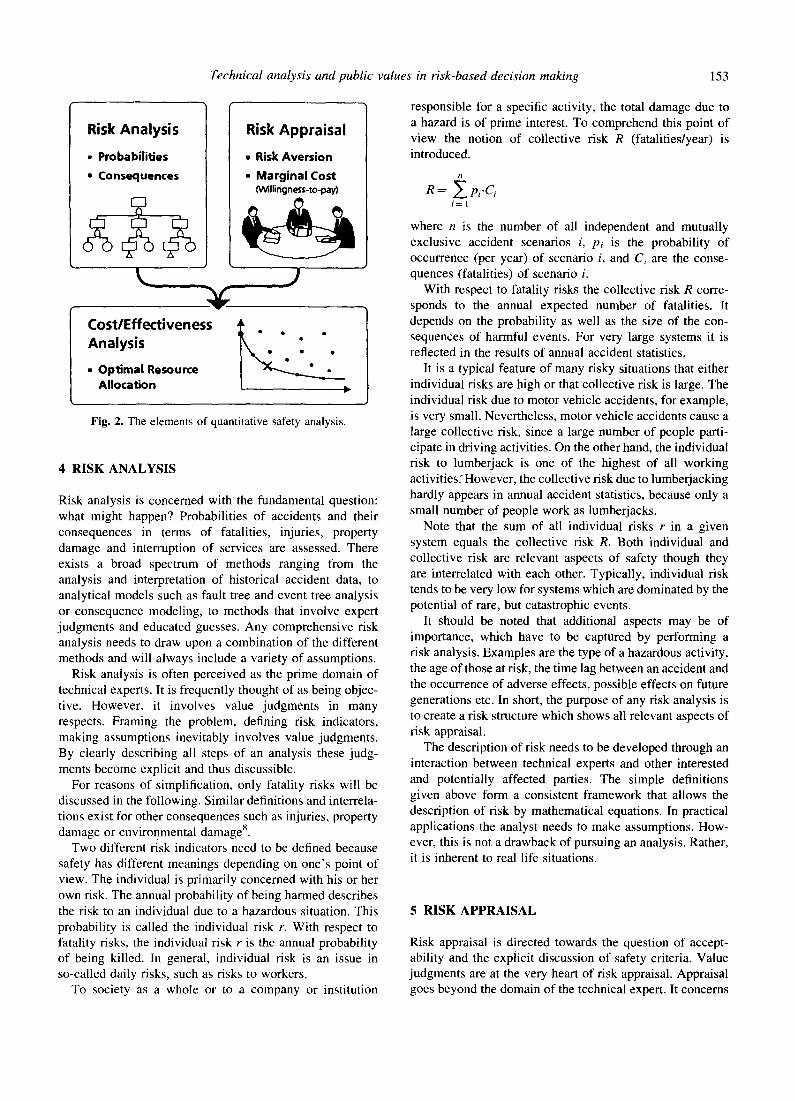
In the following a formal policy framework is described. It attempts to integrate technical, social and economic aspects of risk decision problems in a systematic and con- sistent way into a quantitative safety analysis. The frame- work has been developed over the years to help making engineering choices whenever risk is an issue. It has been used in Switzerland, Germany, Austria, Luxemburg and other European countries as a decision-aiding tool in many problems related to railway safety, to highway traffic safety, to handling, storing and transporting of dangerous goods, as well as to natural hazards. The framework as discussed here consists of three parts: risk analysis, risk appraisal and cost/effectiveness analysis (Fig. 2). A brief outline is given in the following. For a more refined descrip- tion the reader is referred to the literature 8'9. Similar frame- works which include the same basic steps are described by different authors (e.g.l°'ll).
I Safety Policy Statement 1
Organizational Structure Quantitative Safety
Analysis
Fig. 1. Safety management.
Technical analysis and public values in risk-based decision making 153
Risk Ana lys is
• Probabilities
• Consequences
L
Risk A p p r a i s a l
• Risk Aversion
• Marginal Cost (Willingness-to-pay)
cJ
Cost /Ef fect iveness
Analysis
• Optimal Resource Allocation •
Fig. 2. The elements of quantitative safety analysis.
4 RISK ANALYSIS
Risk analysis is concerned with the fundamental question: what might happen? Probabilities of accidents and their consequences in terms of fatalities, injuries, property damage and interruption of services are assessed. There exists a broad spectrum of methods ranging from the analysis and interpretation of historical accident data, to analytical models such as fault tree and event tree analysis or consequence modeling, to methods that involve expert judgments and educated guesses. Any comprehensive risk analysis needs to draw upon a combination of the different methods and will always include a variety of assumptions.
Risk analysis is often perceived as the prime domain of technical experts. It is frequently thought of as being objec- tive. However, it involves value judgments in many respects. Framing the problem, defining risk indicators, making assumptions inevitably involves value judgments. By clearly describing all steps of an analysis these judg- ments become explicit and thus discussible.
For reasons of simplification, only fatality risks will be discussed in the following. Similar definitions and interrela- tions exist for other consequences such as injuries, property damage or environmental damage 8.
Two different risk indicators need to be defined because safety has different meanings depending on one's point of view. The individual is primarily concerned with his or her own risk. The annual probability of being harmed describes the risk to an individual due to a hazardous situation. This probability is called the individual risk r. With respect to fatality risks, the individual risk r is the annual probability of being killed. In general, individual risk is an issue in so-called daily risks, such as risks to workers.
To society as a whole or to a company or institution
responsible for a specific activity, the total damage due to a hazard is of prime interest. To comprehend this point of view the notion of collective risk R (fatalities/year) is introduced.
R = ~ pi.Ci i = l
where n is the number of all independent and mutually exclusive accident scenarios i, Pi is the probability of occurrence (per year) of scenario i, and Ci are the conse- quences (fatalities) of scenario i.
With respect to fatality risks the collective risk R corre- sponds to the annual expected number of fatalities. It depends on the probability as well as the size of the con- sequences of harmful events. For very large systems it is reflected in the results of annual accident statistics.
It is a typical feature of many risky situations that either individual risks are high or that collective risk is large. The individual risk due to motor vehicle accidents, for example, is very small. Nevertheless, motor vehicle accidents cause a large collective risk, since a large number of people parti- cipate in driving activities. On the other hand, the individual risk to lumberjack is one of the highest of all working activities: However, the collective risk due to lumberjacking hardly appears in annual accident statistics, because only a small number of people work as lumberjacks.
Note that the sum of all individual risks r in a given system equals the collective risk R. Both individual and collective risk are relevant aspects of safety though they are interrelated with each other. Typically, individual risk tends to be very low for systems which are dominated by the potential of rare, but catastrophic events.
It should be noted that additional aspects may be of importance, which have to be captured by performing a risk analysis. Examples are the type of a hazardous activity, the age of those at risk, the time lag between an accident and the occurrence of adverse effects, possible effects on future generations etc. In short, the purpose of any risk analysis is to create a risk structure which shows all relevant aspects of risk appraisal.
The description of risk needs to be developed through an interaction between teChnical experts and other interested and potentially affected parties. The simple definitions given above form a consistent framework that allows the description of risk by mathematical equations. In practical applications the analyst needs to make assumptions. How- ever, this is not a drawback of pursuing an analysis. Rather, it is inherent to real life situations.
5 RISK APPRAISAL
Risk appraisal is directed towards the question of accept- ability and the explicit discussion of safety criteria. Value judgments are at the very heart of risk appraisal. Appraisal goes beyond the domain of the technical expert. It concerns
154 H. Bohnenblust, P. Slovic
decision makers responsible for a system, but also politi- cians, lay people, or even society as a whole.
For a systematic and operable risk appraisal process one has to define quantitative safety criteria to determine whether a given risk level is acceptable or unacceptable. Many different aspects need to be taken into account, and it is important to incorporate them into a consistent framework.
Acceptable safety levels cannot be defined in an absolute sense. They need to be related to society's means and ends. The optimal allocation of one 's resources seems to be the appropriate starting point. To understand this idea it is essential to consider the basic relationship between cost and risk. It is always possible to reduce the risk of a hazar- dous facility. But the incremental costs needed for reducing risk by an additional unit increases as the risk becomes smaller. With resources always being limited, the money spent at one place will be lacking at another. Hence, the limited funds for safety measures must be used in such a way that a maximum level of safety is achieved.
The optimal allocation of funds is a classical optimization problem. In principle, it can be solved by the so-called marginal-cost-criterion. This criterion allocates resources in such a way that the marginal cost for risk reduction is equal for all sub-systems. Marginal costs have quite a con- crete meaning. They are the price one is willing to pay for a marginal increase in safety or, in the context of fatality risk, it is the willingness-to-pay for saving a statistical life.
Applying the marginal-cost-criterion in its pure sense would mean minimizing the expected number of fatalities as measured by the collective risk R. However, risks are generally perceived in a manner which is not consistent with the statistical expectation. To account for this, two subjective elements are defined which allow the introduc- tion of subjective value judgments. First, in calculating the collective risk, a risk aversion factor is taken into account. And second, in setting quantitative values for the marginal cost a number of subjective aspects are considered which basically allow voluntary risks to be distinguished from involuntary risks 12.
Some readers may argue that introducing such factors into the calculation is an example of technical experts car- tying their mission too far. However, we claim that the explicit discussion of such factors is more transparent than their implicit integration in discussions of company boards or politicians.
Risk aversion refers to the fact that some accidents are perceived to be much worse than their direct consequences would indicate. For example, an accident with a hundred fatalities may be judged much worse than a hundred acci- dents each with one fatality, allthough the individual risks to those involved may be the same in both cases. This response strongly affects the company or institution responsible for a system. A number of examples are known where the indirect effects of such large accidents have directly led to the col- lapse of companies. In some cases large accidents have led to more stringent and costly regulations. In others they have
damaged the image of the company or industry and this has adversely affected future business. Indirect effects may affect not only the company which had an accident but an industrial branch on the national or even international level. Well known examples are the Seveso accident in Italy, the accident in the nuclear plant at Three-Mile Island (even though no fatalities occurred) and the calamity at Chernobyl.
Such accidents can be thought of as creating a signal. In traditional technologies, catastrophic accidents with large consequences in terms of the number of fatalities are most likely to cause large signals. An example of such a catastrophe is the sinking of the ferryboat Estonia in the Baltic Sea in 1994.
To define a risk measure which accounts for this effect is a complex issue. For traditional technologies a simplified definition is proposed by introducing a simple risk aversion function which depends on the magnitude of the conse- quences of an accidental event. It can be interpreted as a penalty function which gives an overproportional weight to events with large consequences. The resulting risk measure is called the perceived collective risk Rp (perceived fatalities/year):
Rp = ~. pi.Ci.cp(Ci) i = 1
where ~p(Ci) is the risk aversion factor as a function of the consequences Ci.
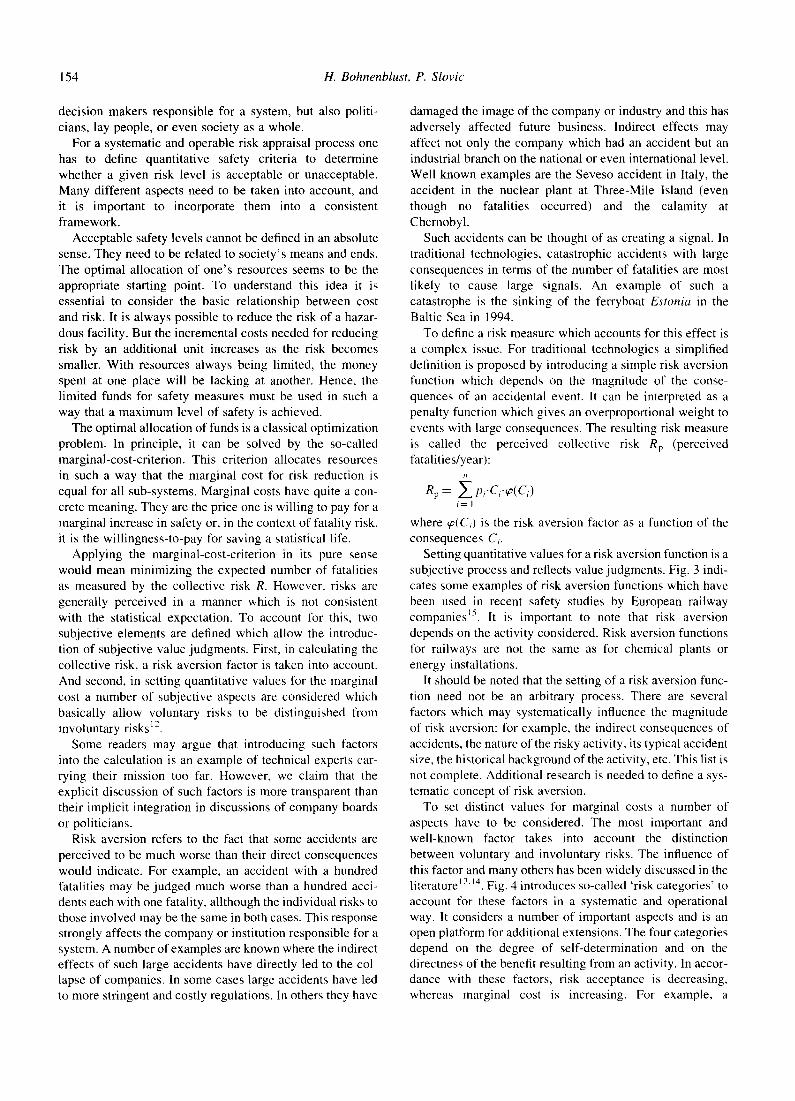
Setting quantitative values for a risk aversion function is a subjective process and reflects value judgments. Fig. 3 indi- cates some examples of risk aversion functions which have been used in recent safety studies by European railway companies ~5. It is important to note that risk aversion depends on the activity considered. Risk aversion functions for railways are not the same as for chemical plants or energy installations.
It should be noted that the setting of a risk aversion func- tion need not be an arbitrary process. There are several factors which may systematically influence the magnitude of risk aversion: for example, the indirect consequences of accidents, the nature of the risky activity, its typical accident size, the historical background of the activity, etc. This list is not complete. Additional research is needed to define a sys- tematic concept of risk aversion.
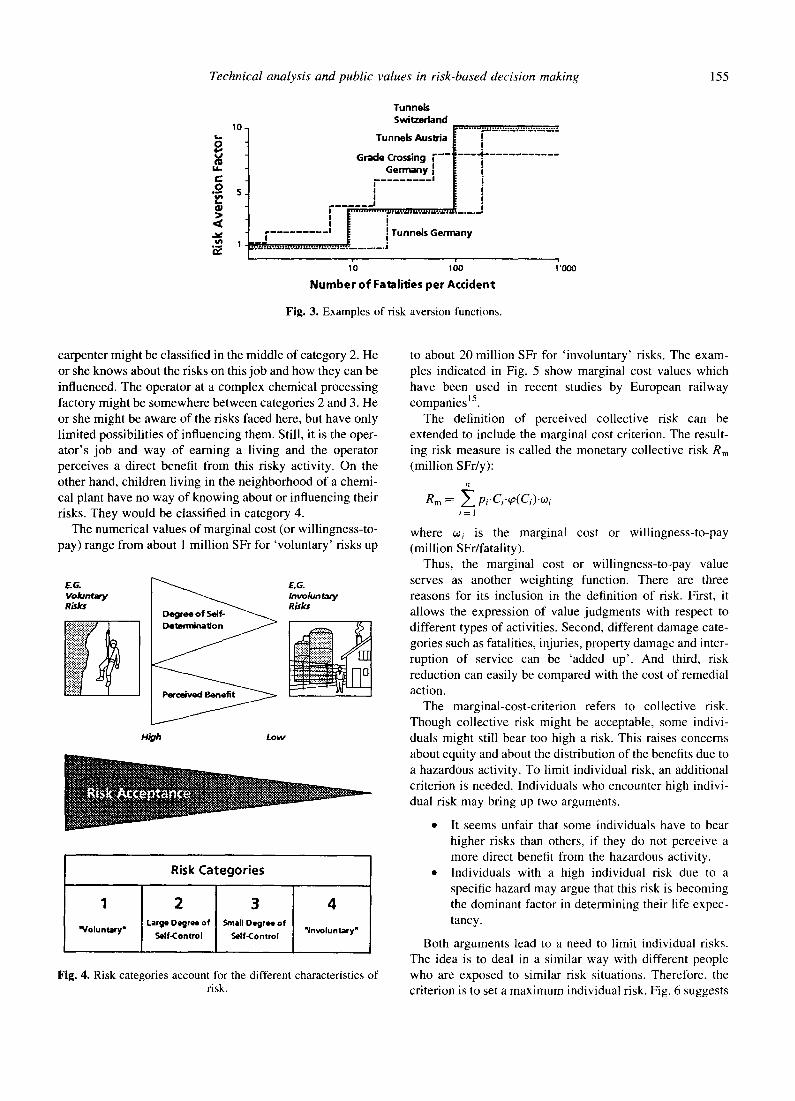
To set distinct values for marginal costs a number of aspects have to be considered. The most important and well-known factor takes into account the distinction between voluntary and involuntary risks. The influence of this factor and many others has been widely discussed in the literatureS3. H. Fig. 4 introduces so~called 'risk categories' to account for these factors in a systematic and operational way. It considers a number of important aspects and is an open platform for additional extensions. The four categories depend on the degree of self-determination and on the directness of the benefit resulting from an activity. In accor- dance with these factors, risk acceptance is decreasing, whereas marginal cost is increasing. For example, a
Technical analysis and public values in risk-based decision making 155
L L r" .o
>
o ~ C~
10-
Tunnels Switzedand
. . . . . . . . o . . . . . . . . . . . . . . . . . . . . . . . . . . . . . .
Tunnels AusUia I f . . . . . . . . . . . . . . . .
Grade Crossing ~ ' - - | - - - ' ~ " . . . . . . . . . . . Gem~y I | i
. . . . . . . . . I ~ i I I ] I ' i
. . . . . . "d i Z ~ ............... e . . . . . . . . . ~ . . . . . . . . . . . I !
~. . . . . . . . . . I E I Tunnels Germany ~".~T~:.~ ,,~-..~, ;~.~, ,,..-~ ,:~_ . . . . . . . ;
1'0 ,~0 ;'ooo N u m b e r o f F a l a l i d e s p e r A c c i d e n t
Fig. 3. Examples of risk aversion functions.
carpenter might be classified in the middle of category 2. He or she knows about the risks on this job and how they can be influenced. The operator at a complex chemical processing factory might be somewhere between categories 2 and 3. He or she might be aware of the risks faced here, but have only limited possibilities of influencing them. Still, it is the oper- ator's job and way of earning a living and the operator perceives a direct benefit from this risky activity. On the other hand, children living in the neighborhood of a chemi- cal plant have no way of knowing about or influencing their risks. They would be classified in category 4.
The numerical values of marginal cost (or willingness-to- pay) range from about 1 million SFr for 'voluntary' risks up
E.G. ~ E.G. ~iuk;t~Y /Rn,~°d until
High Low
R i s k C a t e g o r i e s
1
"Voluntary"
2 Large Degree of
Self-Control
3 Small Degree of
Self-Control
4
"Involuntary"
Fig. 4. Risk categories account for the different characteristics of risk.
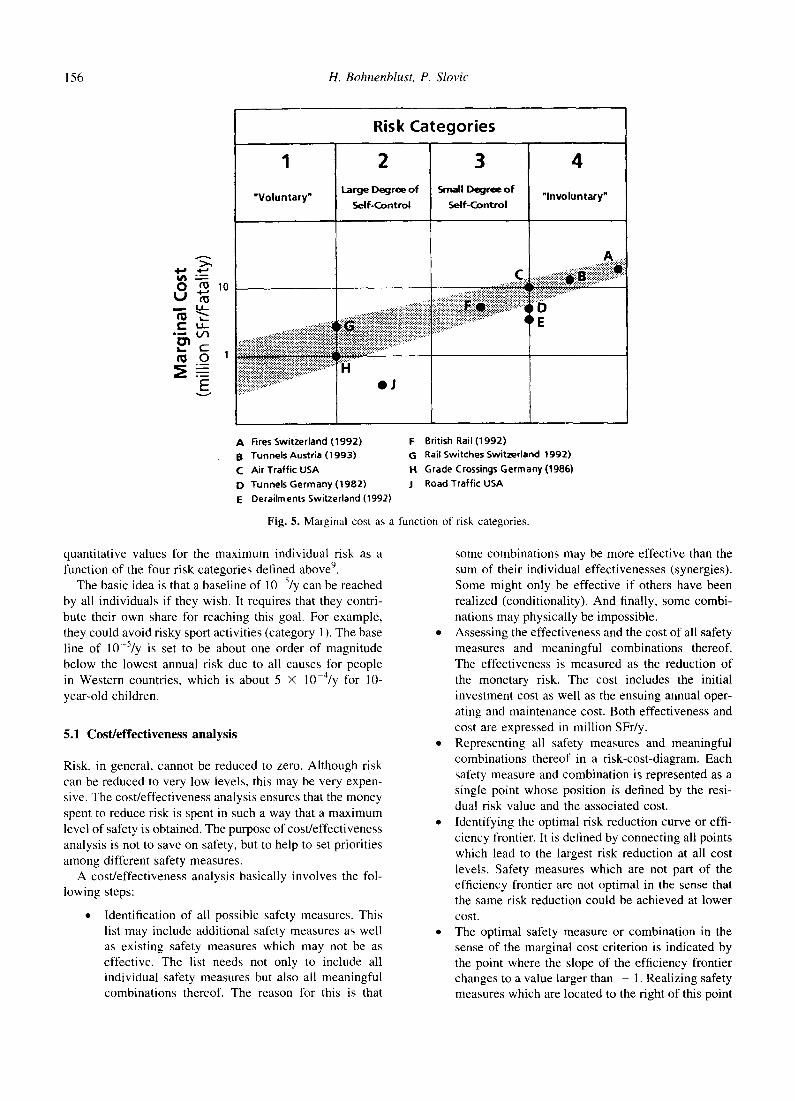
to about 20 million SFr for 'involuntary' risks. The exam- ples indicated in Fig. 5 show marginal cost values which have been used in recent studies by European railway companies 15.
The definition of perceived collective risk can be extended to include the marginal cost criterion. The result- ing risk measure is called the monetary collective risk R m
(million SFr/y):
R m • ~ pi'Ci%°(Ci)'°~i i = 1
where co i is the marginal cost or willingness-to-pay (million SFr/fatality).
Thus, the marginal cost or willingness-to-pay value serves as another weighting function. There are three reasons for its inclusion in the definition of risk. First, it allows the expression of value judgments with respect to different types of activities. Second, different damage cate- gories such as fatalities, injuries, property damage and inter- ruption of service can be 'added up'. And third, risk reduction can easily be compared with the cost of remedial action.
The marginal-cost-criterion refers to collective risk. Though collective risk might be acceptable, some indivi- duals might still bear too high a risk. This raises concerns about equity and about the distribution of the benefits due to a hazardous activity. To limit individual risk, an additional criterion is needed. Individuals who encounter high indivi- dual risk may bring up two arguments.
• It seems unfair that some individuals have to bear higher risks than others, if they do not perceive a more direct benefit from the hazardous activity.
• Individuals with a high individual risk due to a specific hazard may argue that this risk is becoming the dominant factor in determining their life expec- tancy.
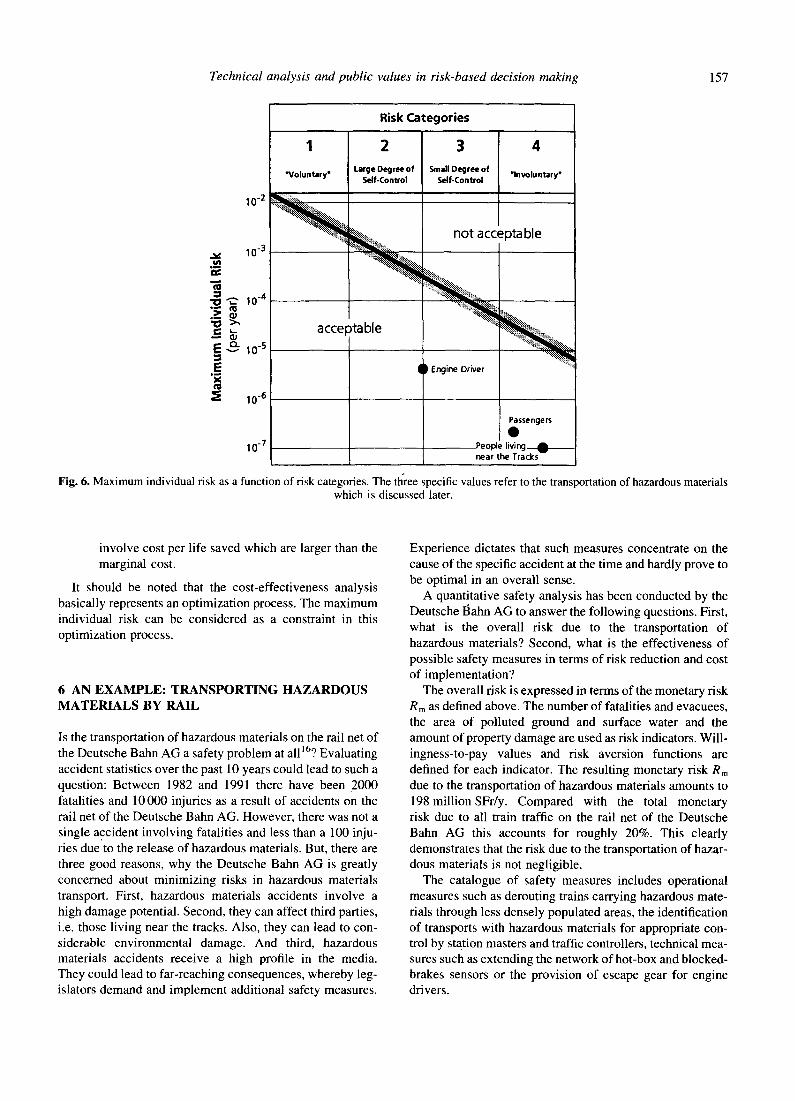
Both arguments lead to a need to limit individual risks. The idea is to deal in a similar way with different people who are exposed to similar risk situations. Therefore, the criterion is to set a maximum individual risk. Fig. 6 suggests
156 H. Bohnenblust, P. Slovic
U U--
c -
E v
10
Risk Categories
1
"Voluntary"
2 Large Degree of
Self-Control
• ...-.-..5::"
!ii iiiii ::i!i il i::i il
):!;:.: .i.i:-~:~::~.~.~.~.~U.'g.'.i.~-i.~.~-':.~-~-~--.--~ .. ~ .F . : : ""
ili~:iiii::iiiiiii!i~iiii~iiiiiiiiii~iiiiiiiiiiiii::-~::~i~':~::::: H ilili!i!!!iiiiiiii!iliiii ': ........... •
3 Small Degree of
Self-Control
C~ ....-,:.:.::::::i:i:i ....
..======================================
;ii~i;iiiiii':;::;iiii::i::::i~i~::~s*:: ...... 4
4
"Involuntary"
A . . . . . .
~i~ii~iiiii!~i!~i:::-iiii~i~i~~:~ ...........
O E
A Fires Switzerland (1992) B Tunnels Austria (1993) C Air Traffic USA D Tunnels Germany (1982) E Derailments Switzerland (1992)
F British Rail (1992) G Rail Switches Switzerland 1992) H Grade Crossings Germany (1986) J Road Traffic USA
Fig. 5. Marginal cost as a function of risk categories.
quantitative values for the maximum individual risk as a function of the four risk categories defined above 9.
The basic idea is that a baseline of 10 5/y can be reached by all individuals if they wish. It requires that they contri- bute their own share for reaching this goal. For example, they could avoid risky sport activities (category 1 ). The base line of 10-5/y is set to be about one order of magnitude below the lowest annual risk due to all causes for people in Western countries, which is about 5 × 10⁻⁴/y for 10- year-old children.
5.1 Cost/effectiveness analysis
Risk, in general, cannot be reduced to zero. Although risk can be reduced to very low levels, this may be very expen- sive. The cost/effectiveness analysis ensures that the money spent to reduce risk is spent in such a way that a maximum level of safety is obtained. The purpose of cost/effectiveness analysis is not to save on safety, but to help to set priorities among different safety measures.
A cost/effectiveness analysis basically involves the fol- lowing steps:
• Identification of all possible safety measures. This list may include additional safety measures as well as existing safety measures which may not be as effective. The list needs not only to include all individual safety measures but also all meaningful combinations thereof. The reason for this is that
some combinations may be more effective than the sum of their individual effectivenesses (synergies). Some might only be effective if others have been realized (conditionality). And finally, some combi- nations may physically be impossible.
• Assessing the effectiveness and the cost of all safety measures and meaningful combinations thereof. The effectiveness is measured as the reduction of the monetary risk. The cost includes the initial investment cost as well as the ensuing annual oper- ating and maintenance cost. Both effectiveness and cost are expressed in million SFr/y.
• Representing all safety measures and meaningful combinations thereof in a risk-cost-diagram. Each safety measure and combination is represented as a single point whose position is defined by the resi- dual risk value and the associated cost.
• Identifying the optimal risk reduction curve or effi- ciency frontier. It is defined by connecting all points which lead to the largest risk reduction at all cost levels. Safety measures which are not part of the efficiency frontier are not optimal in the sense that the same risk reduction could be achieved at lower cost.
• The optimal safety measure or combination in the sense of the marginal cost criterion is indicated by the point where the slope of the efficiency frontier changes to a value larger than - 1. Realizing safety measures which are located to the right of this point
Technical analysis and public values in risk-based decision making 157
=_ I=
E X ¢g
1 0 - 2
10-3
" ~ 10-4
lO -s
10 .6
10 -7
Risk Categories
1 2 3 4
"Voluntary" Large Degree of Small Degree of "Involuntary" Self-Control Self-Control
~ , . , .... ~ . ~ , ~ . g ~ ~..~
~ not acceptable
acce ~table " ~ - - ~,!~,... " ~,~... * ~ ~ ~ .
| ) Engine Driver
Passengers
People living m, near the Tracks I '
Fig. 6. Maximum individual risk as a function of risk categories. The three specific values refer to the transportation of hazardous materials which is discussed later.
involve cost per life saved which are larger than the marginal cost.
It should be noted that the cost-effectiveness analysis basically represents an optimization process. The maximum individual risk can be considered as a constraint in this optimization process.
6 AN EXAMPLE: TRANSPORTING HAZARDOUS MATERIALS BY RAIL
Is the transportation of hazardous materials on the rail net of the Deutsche Bahn AG a safety problem at all]6? Evaluating accident statistics over the past 10 years could lead to such a question: Between 1982 and 1991 there have been 2000 fatalities and 10000 injuries as a result of accidents on the rail net of the Deutsche Bahn AG. However, there was not a single accident involving fatalities and less than a 100 inju- ries due to the release of hazardous materials. But, there are three good reasons, why the Deutsche Bahn AG is greatly concerned about minimizing risks in hazardous materials transport. First, hazardous materials accidents involve a high damage potential. Second, they can affect third parties, i.e. those living near the tracks. Also, they can lead to con- siderable environmental damage. And third, hazardous materials accidents receive a high profile in the media. They could lead to far-reaching consequences, whereby leg- islators demand and implement additional safety measures.
Experience dictates that such measures concentrate on the cause of the specific accident at the time and hardly prove to be optimal in an overall sense.
A quantitative safety analysis has been conducted by the Deutsche 13ahn AG to answer the following questions. First, what is the overall risk due to the transportation of hazardous materials? Second, what is the effectiveness of possible safety measures in terms of risk reduction and cost of implementation?
The overall risk is expressed in terms of the monetary risk R m as defined above. The number of fatalities and evacuees, the area of polluted ground and surface water and the amount of property damage are used as risk indicators. Will- ingness-to-pay values and risk aversion functions are defined for each indicator. The resulting monetary risk Rm
due to the transportation of hazardous materials amounts to 198 million SFr/y. Compared with the total monetary risk due to all train traffic on the rail net of the Deutsche Bahn AG this accounts for roughly 20%. This clearly demonstrates that the risk due to the transportation of hazar- dous materials is not negligible.
The catalogue of safety measures includes operational measures such as derouting trains carrying hazardous mate- rials through less densely populated areas, the identification of transports with hazardous materials for appropriate con- trol by station masters and traffic controllers, technical mea- sures such as extending the network of hot-box and blocked- brakes sensors or the provision of escape gear for engine drivers.
158 H. Bohnenblust, P. Slovic
ol
oI
0 U c-
o
E v
c- o
200
150
100
50
Present Risk r ~ , R m = 198 million SFr/year
. . . . . . . . . . . . . . . . . . . . . . . . . . . . . . . . . . . . . . . . . . . . . . . . . . . .
• • • Optimal Risk X'X,I ° • Strategy • Reduction
• . Reduction Curve
] [ I I I
25 50 75 100 125
Cost of Safety Measures (million SFr/year)
v
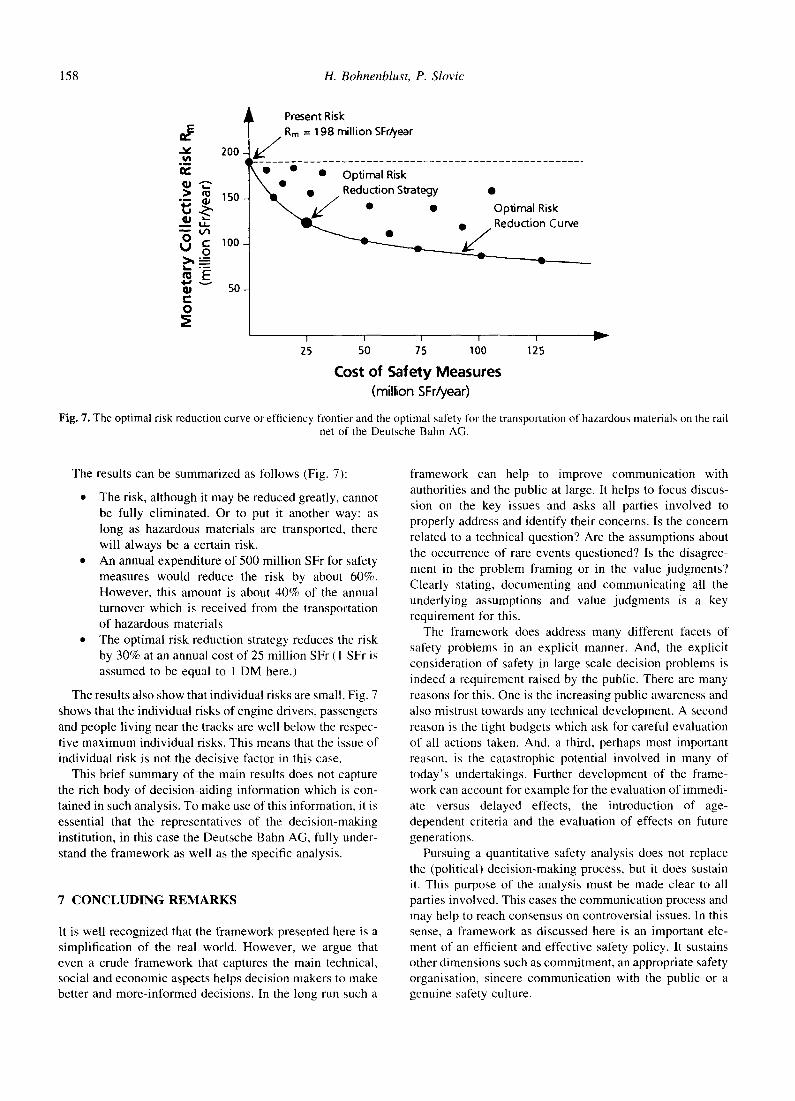
Fig. 7. The optimal risk reduction curve or efficiency frontier and the optimal safety for the transportation of hazardous materials on the rail net of the Deutsche Bahn AG.
The results can be summarized as follows (Fig. 7):
• The risk, although it may be reduced greatly, cannot be fully eliminated. Or to put it another way: as long as hazardous materials are transported, there will always be a certain risk.
• An annual expenditure of 500 million SFr for safety measures would reduce the risk by about 60%. However, this amount is about 40% of the annual turnover which is received from the transportation of hazardous materials
• The optimal risk reduction strategy reduces the risk by 30% at an annual cost of 25 million SFr (1 SFr is assumed to be equal to 1 DM here.)
The results also show that individual risks are small. Fig. 7 shows that the individual risks of engine drivers, passengers and people living near the tracks are well below the respec- tive maximum individual risks. This means that the issue of individual risk is not the decisive factor in this case.
This brief summary of the main results does not capture the rich body of decision-aiding information which is con- tained in such analysis. To make use of this information, it is essential that the representatives of the decision-making institution, in this case the Deutsche Bahn AG, fully under- stand the framework as well as the specific analysis.
7 C O N C L U D I N G R E M A R K S
It is well recognized that the framework presented here is a simplification of the real world. However, we argue that even a crude framework that captures the main technical, social and economic aspects helps decision makers to make better and more-informed decisions. In the long run such a
framework can help to improve communication with authorities and the public at large. It helps to focus discus- sion on the key issues and asks all parties involved to properly address and identify their concerns. Is the concern related to a technical question? Are the assumptions about the occurrence of rare events questioned? Is the disagree- ment in the problem framing or in the value judgments? Clearly stating, documenting and communicating all the underlying assumptions and value judgments is a key requirement for this.
The framework does address many different facets of safety problems in an explicit manner. And, the explicit consideration of safety in large scale decision problems is indeed a requirement raised by the public. There are many reasons for this. One is the increasing public awareness and also mistrust towards any technical development. A second reason is the tight budgets which ask for careful evaluation of all actions taken. And, a third, perhaps most important reason, is the catastrophic potential involved in many of today 's undertakings. Further development of the f lame- work can account for example for the evaluation of immedi- ate versus delayed effects, the introduction of age- dependent criteria and the evaluation of effects on future generations.
Pursuing a quantitative safety analysis does not replace the (political) decision-making process, but it does sustain it, This purpose of the analysis must be made clear to all parties involved. This eases the communication process and may help to reach consensus on controversial issues. In this sense, a framework as discussed here is an important ele- ment of an efficient and effective safety policy. It sustains other dimensions such as commitment, an appropriate safety organisation, sincere communication with the public or a genuine safety culture.
Technical analysis and public values in risk-based decision making 159
REFERENCES
1. The Royal Society, Risk: Analysis, Perception and Manage- ment. London, 1992.
2. US Department of Transportation/US Environmental Protec- tion Agency, Handbook of Chemical Hazard Analysis Pro- cedures. Washington, 1989.
3. World Bank, Major hazard control--a practical manual. In World Bank Technical Paper, No. 55, 1990.
4. Slovic, P. Perception of risk. Science, 1987, 236. 5. Stallen, P. J. & Thomas, A. Public concern about industrial
hazards. Risk Analysis, 1988, 8(2). 6. Rimington, J. D. Risk and the regulator: puzzles and predict-
ments. Trans I Chem, Part B, 1995, 73. 7. Senge, P., Kleiner, A., Roberts, Ch., Ross, R. & Smith, B.,
The Fifth Discipline. Fieldbook, Doubleday, New York, 1994. 8. Merz, H. & Bohnenblust, H., Cost/effectiveness-analysis and
evaluation of risk reduction measures. In Proceedings of the 2nd World Congress on Safety Sciences, Meeting Budapest Organiser Ltd, 1993, pp. 371-397.
9. Merz, H., Schneider, Th. & Bohnenblust, H., The Appraisal of Technological Risk. vdf Verlag der Fachvereine Ziirich, 1995 (in German).
10. US Presidential/Congressional Commission of Risk Assess- ment and Risk Management, Framework for environmental health risk management. Final Report, 1997, Vol. 1.
11. Health and Safety Executive (HSE), Use of risk assessment within government departments. Report prepared by the Interdepartmental Liaison Group on Risk Assessment (UK), 1996.
12. Slovic, P., Fischoff, B. & Lichtenstein, S., Facts and fears: understanding perceived risk. In Societal Risk Assessment. How Safe is Safe Enough? eds R.C. Schwing & W.A. Albers. Plenum Press, New York, 1980.
13. Star, Ch. Social benefits versus technological risk. Science, 1969, 165.
14. Kraus, N. & Slovic, P. Taxonomic analysis of perceived risk. Risk Analysis, 1988, 8(3).
15. Bohnenblust, H. & Fermaud, Ch., The appraisal of risks in the rail industry. Paper presented to the Annual Meeting of the German Association of Rail Engineers, Dresden, November 1993 (in German).
16. Deutsche Bahn AG, Risk Minimization in the Transportation of Hazardous Materials. Ernst Basler & Partners Ltd, Zollikon, 1994 (in German).