Embed Size (px)
DESCRIPTION
Experiences in integration of control systems with business application software
Citation preview

13 February 2014
Integrating Plant Control Systems
with Business Applications

Confidential Slide
Index
2
About Reliance Power
Centralized Monitoring – the journey
Applications
Data Sources and IT systems
Integrated Visualization
Generation management and optimization
Predictive Diagnostics
Management Dashboards
Confidential Slide
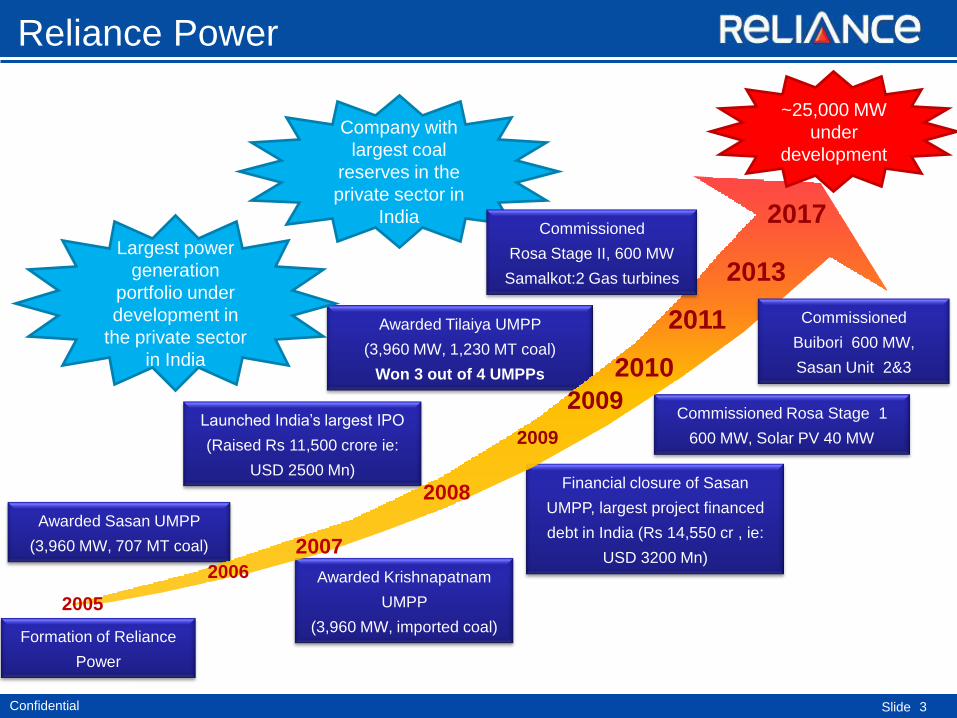
Awarded Krishnapatnam
UMPP
(3,960 MW, imported coal)
Commissioned Rosa Stage 1
600 MW, Solar PV 40 MW
Formation of Reliance
Power
Launched India’s largest IPO
(Raised Rs 11,500 crore ie:
USD 2500 Mn)
Awarded Sasan UMPP
(3,960 MW, 707 MT coal)
Financial closure of Sasan
UMPP, largest project financed
debt in India (Rs 14,550 cr , ie:
USD 3200 Mn)
Awarded Tilaiya UMPP
(3,960 MW, 1,230 MT coal)
Won 3 out of 4 UMPPs
2006
2007
2008
2009
2005
2009
2010
2017
Reliance Power
Company with
largest coal
reserves in the
private sector in
India
Largest power
generation
portfolio under
development in
the private sector
in India
~25,000 MW
under
development
2011
2013
Commissioned
Rosa Stage II, 600 MW
Samalkot:2 Gas turbines
Commissioned
Buibori 600 MW,
Sasan Unit 2&3
3
Confidential Slide
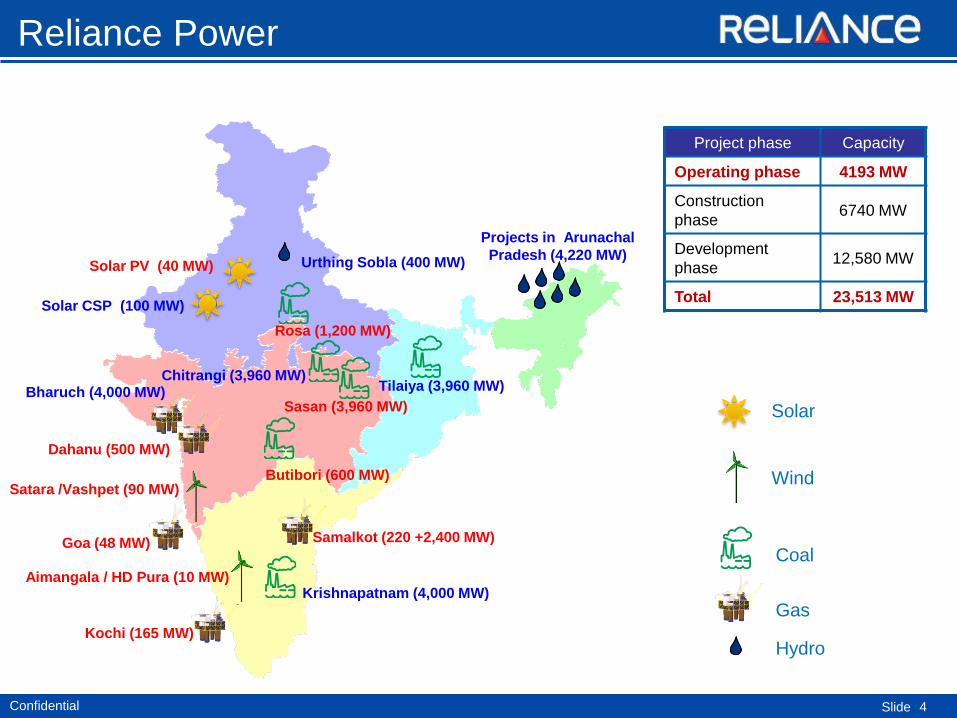
Coal
Gas
Hydro
Butibori (600 MW)
Rosa (1,200 MW)
Tilaiya (3,960 MW)
Krishnapatnam (4,000 MW)
Chitrangi (3,960 MW)
Sasan (3,960 MW)
Goa (48 MW)
Kochi (165 MW)
Samalkot (220 +2,400 MW)
Urthing Sobla (400 MW)
Projects in Arunachal
Pradesh (4,220 MW)
Bharuch (4,000 MW)
Project phase Capacity
Operating phase 4193 MW
Construction
phase 6740 MW
Development
phase 12,580 MW
Total 23,513 MW
Reliance Power
Dahanu (500 MW)
4
Solar PV (40 MW)
Solar CSP (100 MW)
Satara /Vashpet (90 MW)
Aimangala / HD Pura (10 MW)
Solar
Wind

Confidential Slide 5
Centralized M&D – Why?
• Four plants at different locations
• 13 units getting operational in short span of time.
• Greenfield Projects
• New O&M team
Challenge was achieving sustained stable plant operations.

Confidential Slide 6
Centralized M&D – the Journey
To Monitor critical equipment to detect operational and
equipment problems early enough to mitigate damage
and manage the risk.
Objective of Fleet-wide Monitoring
Establish
Monitoring
Centre
Install
Historian
Condition
Monitoring
software
Remote
Vibration
Monitoring
Perf.
analyser &
optimizer
Business
analytics
Started in
2009
Headquarter OSI-PI / GE
Proficy
Smart signal FM / GE
Confidential Slide 7
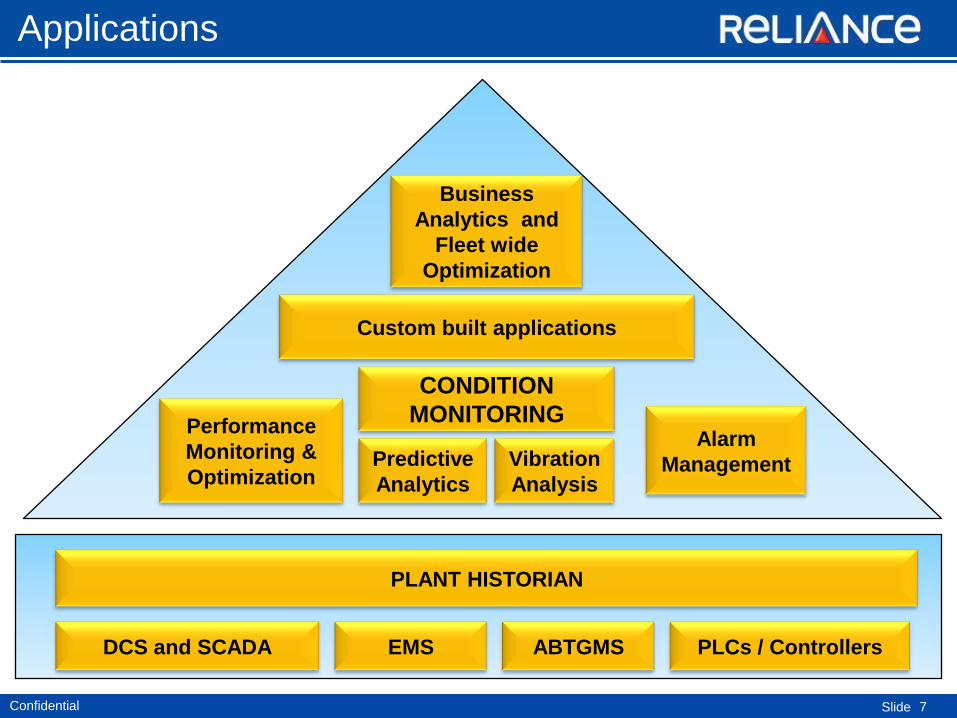
PLANT HISTORIAN
DCS and SCADA
Performance
Monitoring &
Optimization
CONDITION
MONITORING Alarm
Management
Custom built applications
Business
Analytics and
Fleet wide
Optimization
Predictive
Analytics
Vibration
Analysis
Applications
EMS ABTGMS PLCs / Controllers

Confidential Slide 8
Site
Historian Interface
Historian server
LAN network
DCS Servers ABT GMS server Switchyard SAS
Historian Server
Clients
LAN network
Webserver
Firewall
Firewall
Clients Corporate
Switch
Typical Network
Business Application servers

Confidential Slide
9
SAP
FICO PM MM /QM SD HCM
WCM PS SRM
Website
KM Portal Mobile Accessibility
Dashboard
BI / BO
IT Systems - Enterprise
Operational
In - Process
BPC
Financial Performance Management Procurement & Inventory Management Project Management Maintenance (Preventive, predictive & breakdown) Sales & Accounting Business Planning & Consolidation Human Capital Management
Payroll E-Recruitment & Joining Performance Management E-Learning Employee Self service
Corporate Website
Knowledge Management & Internal Communications
Purchase Request Tracker
Role Based Dashboard
Performance Dashboard
Project Dashboard
Mobility for employee productivity
Mobility for operation & maintenance
Contract Management
PR Tracker Contract Management

Confidential Slide
PrAn – Smart Signal
Predictive Analytics
10
IVGI - Integrated Visualization
of Generation Information PADO
NPOC – National Power Operations Centre
Historian Application
GE Proficy & OSI PI
DCS
ABT GMS
Schneider
iMMS for Coal Mine
Modular
Alarm Management System
Honeywell
RVMS
FM,GE System1
EMS
Envision
Minex
IT Systems - Plant Optimization
Operational
In - Process
Future Plan
Distributed Control System Historian for plant monitoring Grid Frequency Management (ABT) Condition Monitoring , Alarm & Event Processing Integrated Mine Management Mine Planning (Minex)
Performance dashboard (IVGI) Energy Management System (EMS) Predictive Analysis – Smart Signal
Performance Analysis , Diagnostics &Optimization

Confidential Slide
11
EDMS
Enovia CMS- Legatrix
Primavera 3D AutoCAD, StaadPro CCTV Surveillance Systems
Mail &
Mobility
IT Systems – Back Office
Information Security
Operational
Electronic Document Management System Compliance Management System (Legal &
Statutory) Project Management Surveillance Email & Collaboration Design & Engineering Information Security Management
Data Leakage Prevention Antivirus

Confidential Slide 12
IVGI - Integrated Visualisation of Generation Information
GE RTIP with GE Proficy & OSI PI
IVGI – Integrated Visualization

Confidential Slide 13
IVGI Dashboards
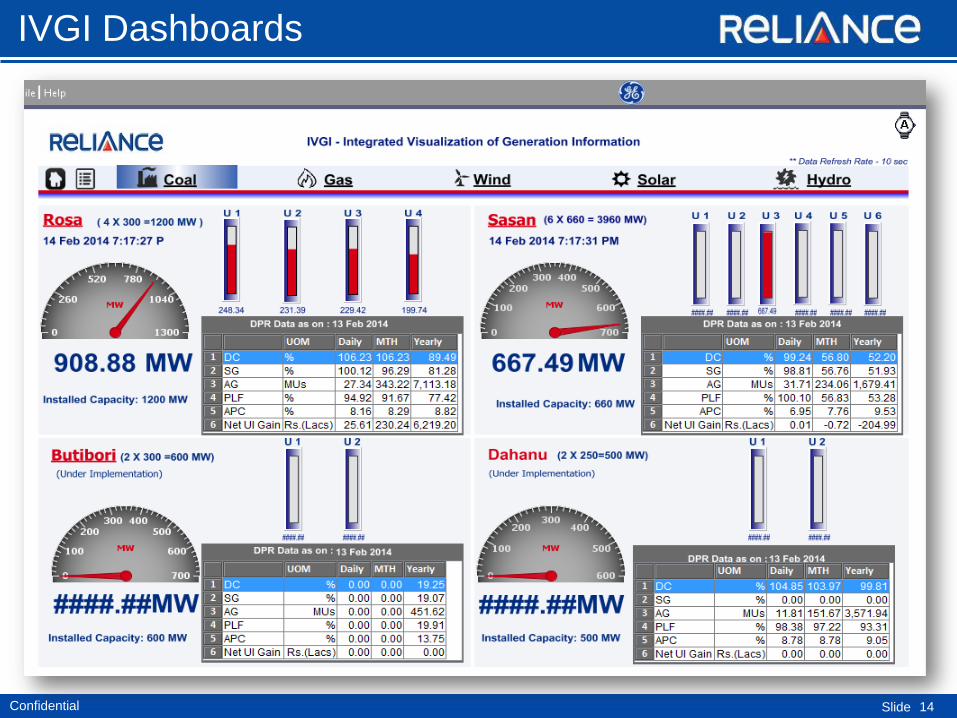
Confidential Slide 14
IVGI Dashboards

Confidential Slide 15
IVGI Dashboards

Confidential Slide 16
Real time Generation Management

Confidential Slide 17
Predictive Analytics
• Equipment and process models are built based upon historical data (SBM - empirical correlation)
• The online data is continuously compared with model predicted values
• Deviation between model predicted and actual value indicates equipment health.
• Gradual equipment degradation is identified before the value reaching set alarm threshold
• Rule based diagnostic
It’s like having your best operator on 24/7, looking at every piece
of equipment in the fleet every five minutes

Confidential Slide
Predictive Analytics Catches LP Heaters extraction Pressure connected
wrongly
18
•
Predictive Analytics
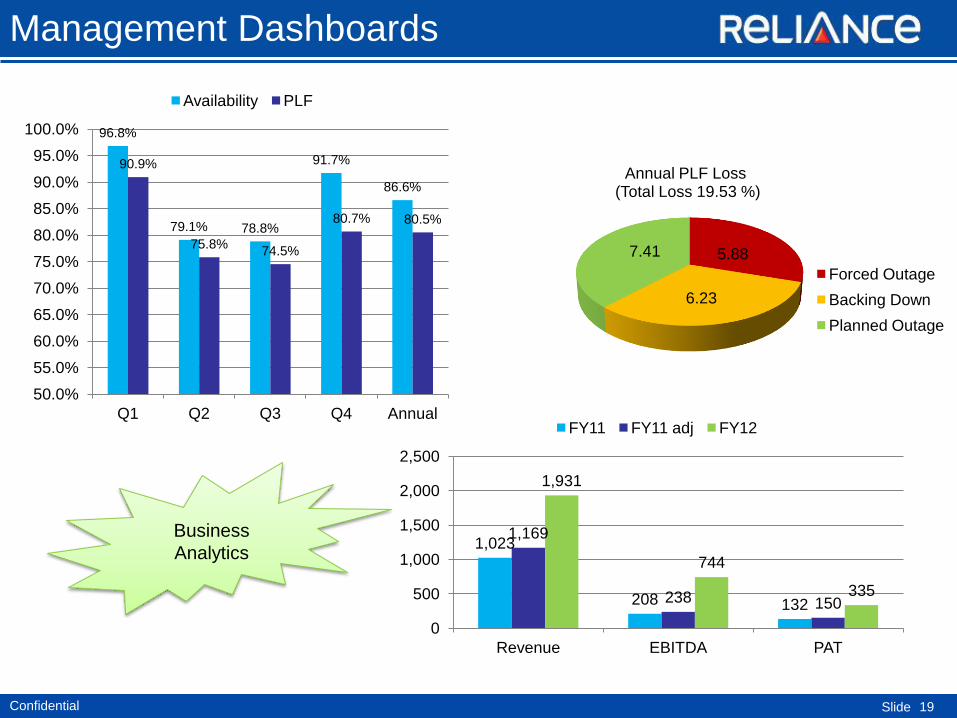
Confidential Slide 19
96.8%
79.1% 78.8%
91.7%
86.6%
90.9%
75.8% 74.5%
80.7% 80.5%
50.0%
55.0%
60.0%
65.0%
70.0%
75.0%
80.0%
85.0%
90.0%
95.0%
100.0%
Q1 Q2 Q3 Q4 Annual
Availability PLF
5.88
6.23
7.41
Annual PLF Loss (Total Loss 19.53 %)
Forced Outage
Backing Down
Planned Outage
1,023
208 132
1,169
238 150
1,931
744
335
0
500
1,000
1,500
2,000
2,500
Revenue EBITDA PAT
FY11 FY11 adj FY12
Management Dashboards
Business
Analytics

Confidential Slide 20
Parameters
May- 12 – Station YTD -12-13 Station
Budgeted Actual Budgeted Actual
DC (%)
PLF (%)
Gross Gen. (MU)
Gross Heat Rate
(Kcal/KWh)
Aux Power (%)
Sp. Oil cons.(ml/KWH)
Sl
No Description
Annual
Budget May-12 YTD 2012-13
Budgeted Actual Budgeted Actual
1 Spares and Materials
2 Services and
Contracts
3 Employee Cost
4 Station Overheads
5 Insurance
6 Water
7 Chemical
8 Security
TOTALS Parameters Annual Bud
May 2012-13 YTD 12-13
Bud Act Bud Act
Fixed Charges
Energy Charges
Incentive
Other Income
Revenue
Fuel Cost
O&M Expenses
EBIDTA
Depreciation
Interest
PBT
Management Dashboards
Plant
Performance
Cost sheets
P & L
Improved
Decision
Making

Confidential Slide 21
Vibration
Diagnostics
Performance
monitoring &
Optimization
Expert Services
DSS for
Merchant sale
and Fleet wide
optimization
Condition
monitoring and
Early warning
The Cutting edge for Business Excellence
National Power
Operations
Centre
13 February 2014
Thank You