Embed Size (px)
Citation preview
JOURNAL OF DISPLAY TECHNOLOGY, VOL. 6, NO. 12, DECEMBER 2010 625
Integrating Photometric Calibration With AdaptiveImage Halftoning for Electrophoretic Displays
Wen-Chung Kao, Senior Member, IEEE, Jen-Jui Liu, and Ming-I Chu
Abstract—The electrophoretic display (EPD) has become themain solution to electronic papers, but there are several limitationswhen it is being driven. First of all, the optical response curve ofthe EPD is nonlinear and temperature sensitive. In addition, thenumber of gray levels that can be displayed is also quite limited.The image quality is unsatisfactory if the images shown on thepanel are not preprocessed to increase the number of visual graylevels and compensate the characteristics of the EPD. In this paper,we present an integrated image tool to automatically estimate thereflectance function curves under different ambient temperatures,perform adaptive image halftoning to improve visual quality, andcalibrate the image to compensate the nonlinear response of EPD.The proposed approach has been verified on practical EPD panelsand promising results have been achieved.
Index Terms—Electrophoretic display (EPD), electronicpaper, image enhancement, display calibration, temperaturecompensation.
I. INTRODUCTION
T HE electrophoretic display (EPD) has become the mainsolution to electronic readers because of its bistable,
lightweight, wide viewing angle, and easy to read in all lightingconditions [1]–[3]. However, EPD has some imperfectionissues that should be well-addressed: nonlinear electro-opticalresponse, complex driving waveform design, limited gray tones,and its temperature sensitive characteristics [4], [5]. Many hard-ware/software approaches to the correction of display nonlinearresponses have been proposed for cathode ray tubes, liquidcrystal displays, and plasma display panels [6]–[10]. However,these methods can not be applied on the driving systems ofEPDs. The main root cause is that the nonlinear characteristicsof EPDs can not be modeled as a gamma curve or other simplenonlinear functions. Furthermore, the response of the EPD isquite temperature sensitive and also dependent on the framescanning rate as well as the driving waveform [11].
Up to now, the EPD still lacks a robust electro-opticalresponse model as well as the design of driving waveform fordisplaying multiple gray levels. An electrical as well as opticalsimulation model is proposed in [12], but some practical issuesare not considered. One of the problems is that the EPD hasa weak and inconsistent threshold voltage, which causes the
Manuscript received May 25, 2010; revised July 25, 2010; accepted July29, 2010. Date of current version November 12, 2010. This work was sup-ported in part by the National Science Council of Republic of China under NSC98-2622-E-003-003-CC1, NSC 99-2221-E-003-028, and by SiPix TechnologyInc., Taiwan.
The authors are with Department of Applied Electronics Technology,National Taiwan Normal University, Taipei 106, Taiwan (e-mail:[email protected]).
Digital Object Identifier 10.1109/JDT.2010.2068035
voltage to optical response curve to be quite nonlinear andunpredictable. The problem becomes more serious in applyinga lower voltage on the EPD [13]. Hence a general approachto designing EPD driving waveform is based on pulse widthmodification (PWM). By laminating the EPD with a thin-filmtransistor (TFT) array as voltage switches, the driving wave-form based on PWM can be sent by scanning the TFT array andproviding different voltage states in different scanning frames[14]–[17]. This design scheme has been popularly applied tomany commercial EPDs. Unfortunately, the maximum numberof gray levels displaying on the EPD is limited by the framescanning rate [11]. In addition, the optical response curve isnonlinear and quite temperature sensitive. Without compen-sating for these imperfection factors, it is impossible to achievegood display quality on EPDs.
In this paper, we present an integrated image tool thatsolves the problems mentioned above. The tool automaticallycalibrates the EPD response and performs adaptive halftoning[18]–[20] according to nonlinear optical reflectance functionunder a given temperature. The optical reflectance function in agiven temperature is first synthesized as the form of Lagrangepolynomials. Then the number of quantization levels as well asthe corresponding threshold values used in the image halftoningis determined by linear regression. By performing adaptiveimage halftoning, the displayed image will look similar tothe original continuous toned image. The advantage of theproposed solution is that the EPD maintains good image qualitywithout designers having to fine tune the driving waveformsunder different temperature conditions.
II. PROBLEM STATEMENT OF EPD ELECTRO-OPTICAL
CALIBRATION
The driving scheme based on PWM can only show severalgray levels and the relationship between the driving time andoptical reflectance is nonlinear. Although a few studies attemptto apply more different voltage states to display more graylevels, the accuracy of gray level control is generally not good.This is due to the fact that the particles in EPDs move slowerthan the prediction at lower supply voltage based on the simplylinear model.
Currently, displaying gray tones on EPDs is generally done bychanging pulse width with a fixed voltage level. The commonelectrode of the panel is fixed at 0 V and the pixel electrodes areswitched to 15 V or 15 V for providing the electrical fieldsbetween the top and bottom of EPD. Hence the gray level canonly be controlled by giving different pulse widths. For an ac-tive matrix EPD, the PWM driving scheme is realized by fastscanning the frame of the entire matrix and providing suitable
1551-319X/$26.00 © 2010 IEEE
626 JOURNAL OF DISPLAY TECHNOLOGY, VOL. 6, NO. 12, DECEMBER 2010
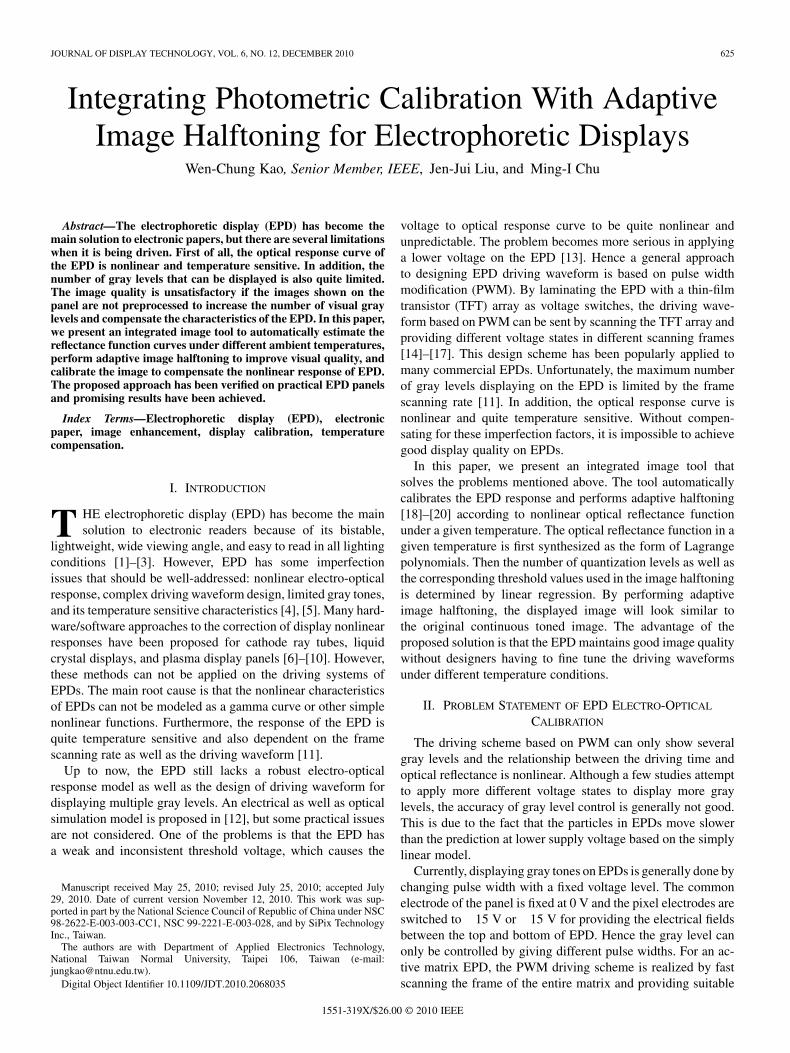
Fig. 1. The proposed signal processing pipeline for EPD image calibration.
voltage states according to the pixel values. Thus the timing res-olution of a driving waveform is dominated by the frame rate.A typical frame scanning rate is set as 50 frames/s. That is, thetiming resolution of a driving waveform is 20 ms. Boosting upthe frame rate may help to increase the timing resolution of thedriving waveform. But designs of driver chips and the TFT aswell as the storage capacitor for each pixel becomes more diffi-cult than with lower scanning frame rates.
With advances in the development of EPD film, the responsetime, which is defined as the time duration of changing the op-tical state from black to white or white to black, has been short-ened to less than 200 ms at room temperature (25 C). The re-sponse time can be further reduced at a higher temperature orby supplying a higher voltage. If the period of a frame scan is20 ms, the EPD can change the optical state from black to whitein 10 frames at room temperature. It is not pos-sible to display more than 10 gray levels under such a condition.Furthermore, the EPD response time will be less than 100 msunder higher temperatures. The number of gray levels is furtherreduced to 4 or less when taking the nonlinear electro-opticalresponse into consideration.
III. PROPOSED AUTOMATIC IMAGE CALIBRATION TOOL
In this paper, we present an integrated signal processingpipeline to pre-process the input image such that the EPDcan display better visual quality for the processed image. Theimage tool aims to optimize the visual quality based on theEPD characteristics at a given temperature. More visual graylevels can be produced by displaying the image on the EPDthrough the proposed adaptive halftoning technique.
The proposed image processing pipeline is shown in Fig. 1.The electrical-optical response under a temperature conditionis first synthesized based on two functional curves: 1) theoptical reflectance function at room temperature and 2) theEPD response time under different temperatures. The opticalreflectance function at room temperature is measured theoptical reflectance values by giving different pulse widths.This function curve shows the detailed optical transition states
while applying a driving voltage on the EPDs. The responseof the EPD under high temperature is much faster than atlower temperature. Hence, it is necessary to synthesize theoptical reflectance curve at a given temperature. The image isthen calibrated to accommodate the characteristics of the EPDaccording to the synthesized response curve.
The synthesized response function is first represented as La-grange polynomials. The function curve is then approximatedby linear regression for estimating the effective timing rangein the driving period. The effective timing range is estimatedby examining the intersect points of the synthesized responsefunction curve and the approximated line. Based on the esti-mated timing range and the frame scan rate of the active matrixbackplane, the maximum number of available gray levels is thendetermined.
The original image data are quantized into a few gray levelsin the adaptive image halftoning stage. The quantized thresh-olds are first calculated according to the estimated number ofgray levels. Then the pipeline runs Floyd-Steinberg halftoningalgorithm [19] to quantize the input image. The halftoned imagehas similar visual quality as the original one, but it is representedby fewer gray levels.
Finally, the halftoned image is further calibrated for com-pensating the nonlinear characteristics of the EPD. Note that inthe previous stage, the quantized thresholds used in halftoningare simply determined by assigning an equal step between twosuccessive quantization levels. With this setting, the halftonedimage shown on the EPD may suffer from poor quality due tothe nonlinear response of the EPD. In the final step, the pro-posed signal processing pipeline remaps the image data into thenew values to compensate for the nonlinear electrical-optical re-sponse of the EPD. Hence the final image shown on the EPD haslinear response to their original content.
A. Synthesis of Optical Reflectance Function Curve
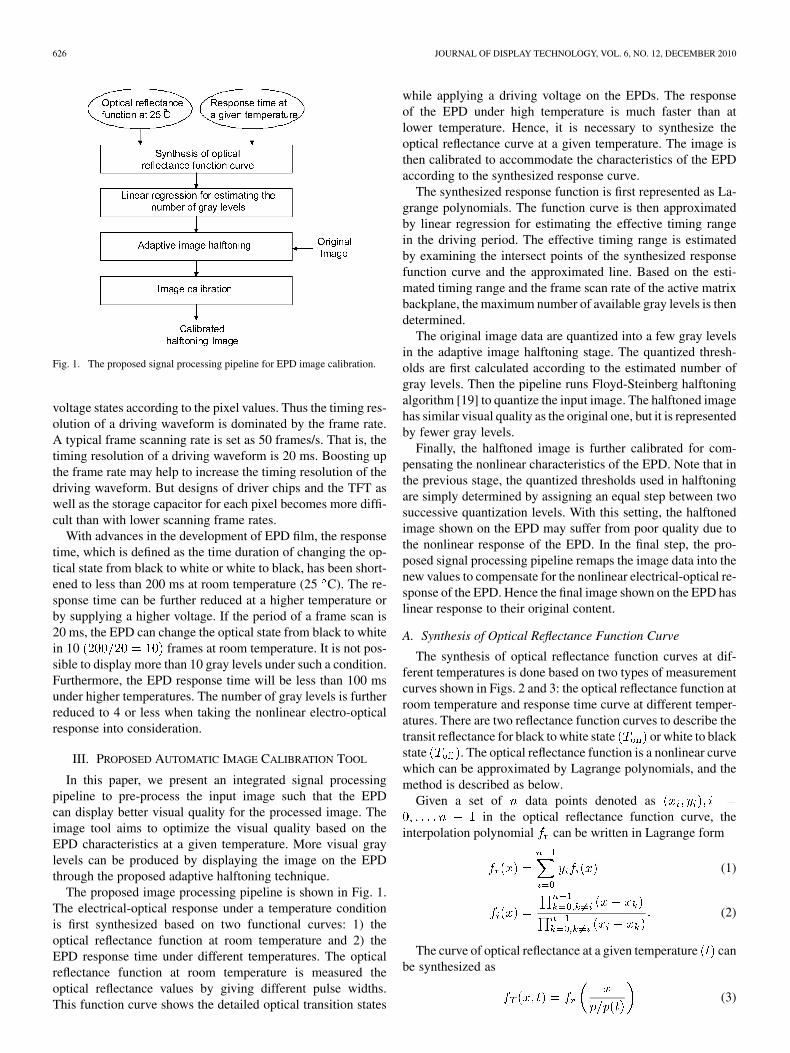
The synthesis of optical reflectance function curves at dif-ferent temperatures is done based on two types of measurementcurves shown in Figs. 2 and 3: the optical reflectance function atroom temperature and response time curve at different temper-atures. There are two reflectance function curves to describe thetransit reflectance for black to white state or white to blackstate . The optical reflectance function is a nonlinear curvewhich can be approximated by Lagrange polynomials, and themethod is described as below.
Given a set of data points denoted asin the optical reflectance function curve, the
interpolation polynomial can be written in Lagrange form
(1)
(2)
The curve of optical reflectance at a given temperature canbe synthesized as
(3)
KAO et al.: INTEGRATING PHOTOMETRIC CALIBRATION WITH ADAPTIVE IMAGE HALFTONING FOR EPDs 627
Fig. 2. Optical reflection function at room temperature of an EPD sample.
Fig. 3. Response time of an EPD sample at different temperatures.
where and denotes the response time of the EPD at roomtemperature and a given temperature , respectively.
B. Linear Regression for Estimating the Number of GrayLevels
The number of gray levels that can be displayed is limited bythe reflectance function of the EPD as well as the scanning framerate. As shown in Fig. 2, the response time is about 220 ms. If theframe scanning rate is 50 frames/s, the EPD can switch its statefrom black to white state in 11 frames. The number of selectablegray levels is limited by the number of scanning frames insidethe time durations of switching the states from black to white orwhite to black. Hence, the numbers of quantization levels underdifferent temperature conditions should be adaptive based onboth frame scanning rates and the reflectance functions .
A systematic approach to estimating the number of graylevels is by performing linear regression. Given a set of datapoints denoted as in the opticalreflectance function curve under a given temperature , theapproximated line can be written as
(4)
(5)
(6)
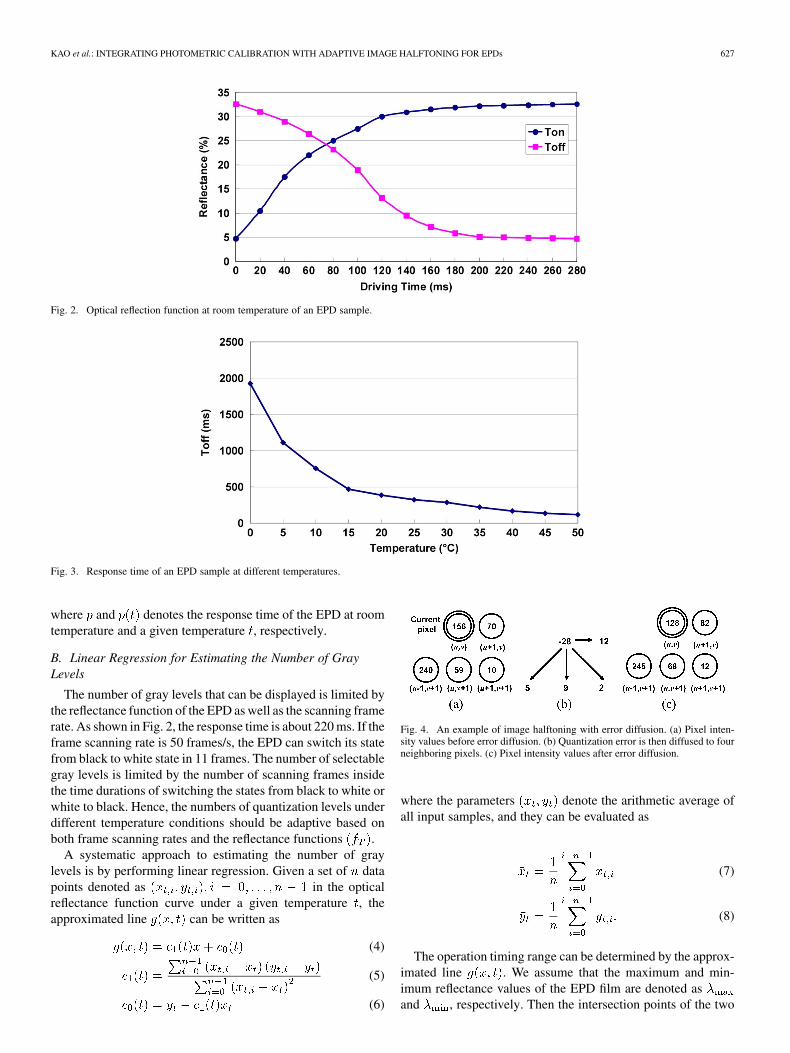
Fig. 4. An example of image halftoning with error diffusion. (a) Pixel inten-sity values before error diffusion. (b) Quantization error is then diffused to fourneighboring pixels. (c) Pixel intensity values after error diffusion.
where the parameters denote the arithmetic average ofall input samples, and they can be evaluated as
(7)
(8)
The operation timing range can be determined by the approx-imated line . We assume that the maximum and min-imum reflectance values of the EPD film are denoted asand , respectively. Then the intersection points of the two
628 JOURNAL OF DISPLAY TECHNOLOGY, VOL. 6, NO. 12, DECEMBER 2010
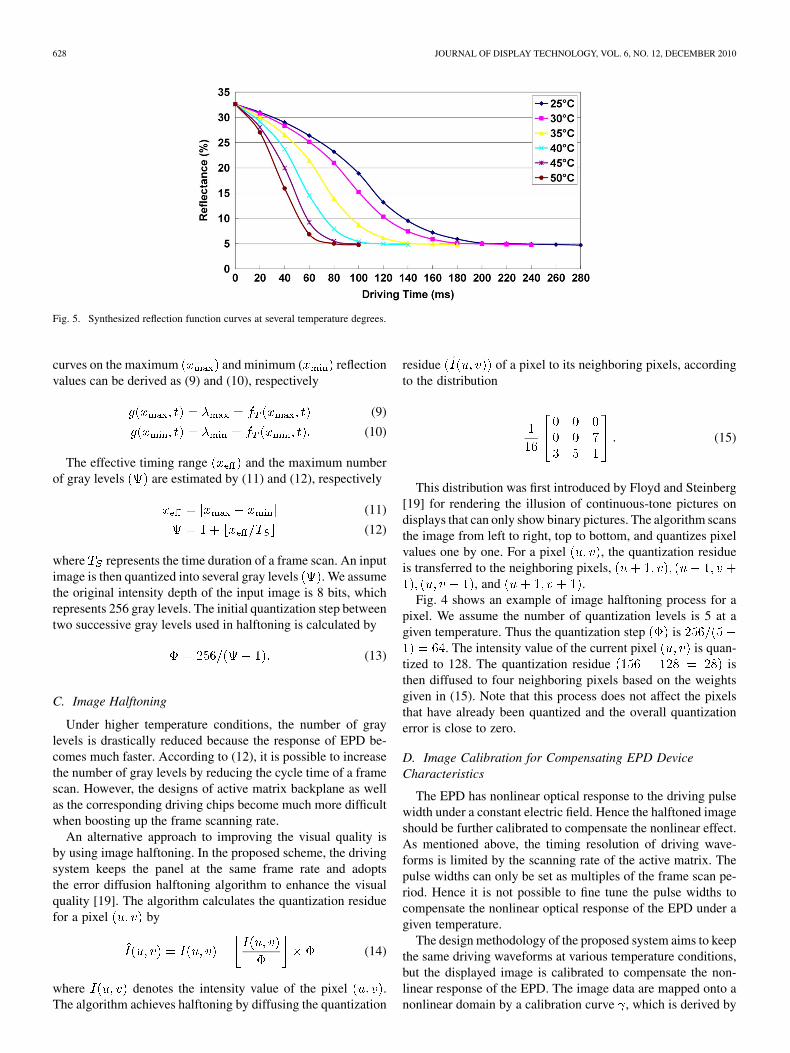
Fig. 5. Synthesized reflection function curves at several temperature degrees.
curves on the maximum and minimum ( reflectionvalues can be derived as (9) and (10), respectively
(9)
(10)
The effective timing range and the maximum numberof gray levels are estimated by (11) and (12), respectively
(11)
(12)
where represents the time duration of a frame scan. An inputimage is then quantized into several gray levels . We assumethe original intensity depth of the input image is 8 bits, whichrepresents 256 gray levels. The initial quantization step betweentwo successive gray levels used in halftoning is calculated by
(13)
C. Image Halftoning
Under higher temperature conditions, the number of graylevels is drastically reduced because the response of EPD be-comes much faster. According to (12), it is possible to increasethe number of gray levels by reducing the cycle time of a framescan. However, the designs of active matrix backplane as wellas the corresponding driving chips become much more difficultwhen boosting up the frame scanning rate.
An alternative approach to improving the visual quality isby using image halftoning. In the proposed scheme, the drivingsystem keeps the panel at the same frame rate and adoptsthe error diffusion halftoning algorithm to enhance the visualquality [19]. The algorithm calculates the quantization residuefor a pixel by
(14)
where denotes the intensity value of the pixel .The algorithm achieves halftoning by diffusing the quantization
residue of a pixel to its neighboring pixels, accordingto the distribution
(15)
This distribution was first introduced by Floyd and Steinberg[19] for rendering the illusion of continuous-tone pictures ondisplays that can only show binary pictures. The algorithm scansthe image from left to right, top to bottom, and quantizes pixelvalues one by one. For a pixel , the quantization residueis transferred to the neighboring pixels,
, and .Fig. 4 shows an example of image halftoning process for a
pixel. We assume the number of quantization levels is 5 at agiven temperature. Thus the quantization step is
. The intensity value of the current pixel is quan-tized to 128. The quantization residue isthen diffused to four neighboring pixels based on the weightsgiven in (15). Note that this process does not affect the pixelsthat have already been quantized and the overall quantizationerror is close to zero.
D. Image Calibration for Compensating EPD DeviceCharacteristics
The EPD has nonlinear optical response to the driving pulsewidth under a constant electric field. Hence the halftoned imageshould be further calibrated to compensate the nonlinear effect.As mentioned above, the timing resolution of driving wave-forms is limited by the scanning rate of the active matrix. Thepulse widths can only be set as multiples of the frame scan pe-riod. Hence it is not possible to fine tune the pulse widths tocompensate the nonlinear optical response of the EPD under agiven temperature.
The design methodology of the proposed system aims to keepthe same driving waveforms at various temperature conditions,but the displayed image is calibrated to compensate the non-linear response of the EPD. The image data are mapped onto anonlinear domain by a calibration curve , which is derived by
KAO et al.: INTEGRATING PHOTOMETRIC CALIBRATION WITH ADAPTIVE IMAGE HALFTONING FOR EPDs 629
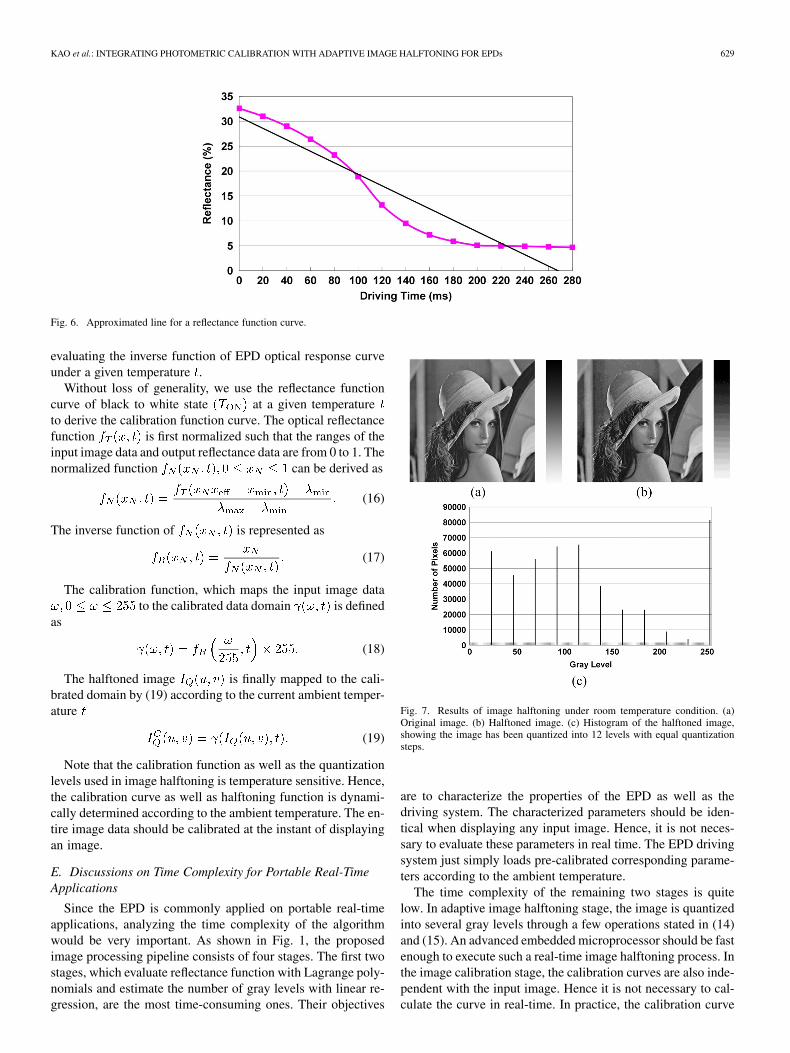
Fig. 6. Approximated line for a reflectance function curve.
evaluating the inverse function of EPD optical response curveunder a given temperature .
Without loss of generality, we use the reflectance functioncurve of black to white state at a given temperatureto derive the calibration function curve. The optical reflectancefunction is first normalized such that the ranges of theinput image data and output reflectance data are from 0 to 1. Thenormalized function can be derived as
(16)
The inverse function of is represented as
(17)
The calibration function, which maps the input image datato the calibrated data domain is defined
as
(18)
The halftoned image is finally mapped to the cali-brated domain by (19) according to the current ambient temper-ature
(19)
Note that the calibration function as well as the quantizationlevels used in image halftoning is temperature sensitive. Hence,the calibration curve as well as halftoning function is dynami-cally determined according to the ambient temperature. The en-tire image data should be calibrated at the instant of displayingan image.
E. Discussions on Time Complexity for Portable Real-TimeApplications
Since the EPD is commonly applied on portable real-timeapplications, analyzing the time complexity of the algorithmwould be very important. As shown in Fig. 1, the proposedimage processing pipeline consists of four stages. The first twostages, which evaluate reflectance function with Lagrange poly-nomials and estimate the number of gray levels with linear re-gression, are the most time-consuming ones. Their objectives
Fig. 7. Results of image halftoning under room temperature condition. (a)Original image. (b) Halftoned image. (c) Histogram of the halftoned image,showing the image has been quantized into 12 levels with equal quantizationsteps.
are to characterize the properties of the EPD as well as thedriving system. The characterized parameters should be iden-tical when displaying any input image. Hence, it is not neces-sary to evaluate these parameters in real time. The EPD drivingsystem just simply loads pre-calibrated corresponding parame-ters according to the ambient temperature.
The time complexity of the remaining two stages is quitelow. In adaptive image halftoning stage, the image is quantizedinto several gray levels through a few operations stated in (14)and (15). An advanced embedded microprocessor should be fastenough to execute such a real-time image halftoning process. Inthe image calibration stage, the calibration curves are also inde-pendent with the input image. Hence it is not necessary to cal-culate the curve in real-time. In practice, the calibration curve
630 JOURNAL OF DISPLAY TECHNOLOGY, VOL. 6, NO. 12, DECEMBER 2010
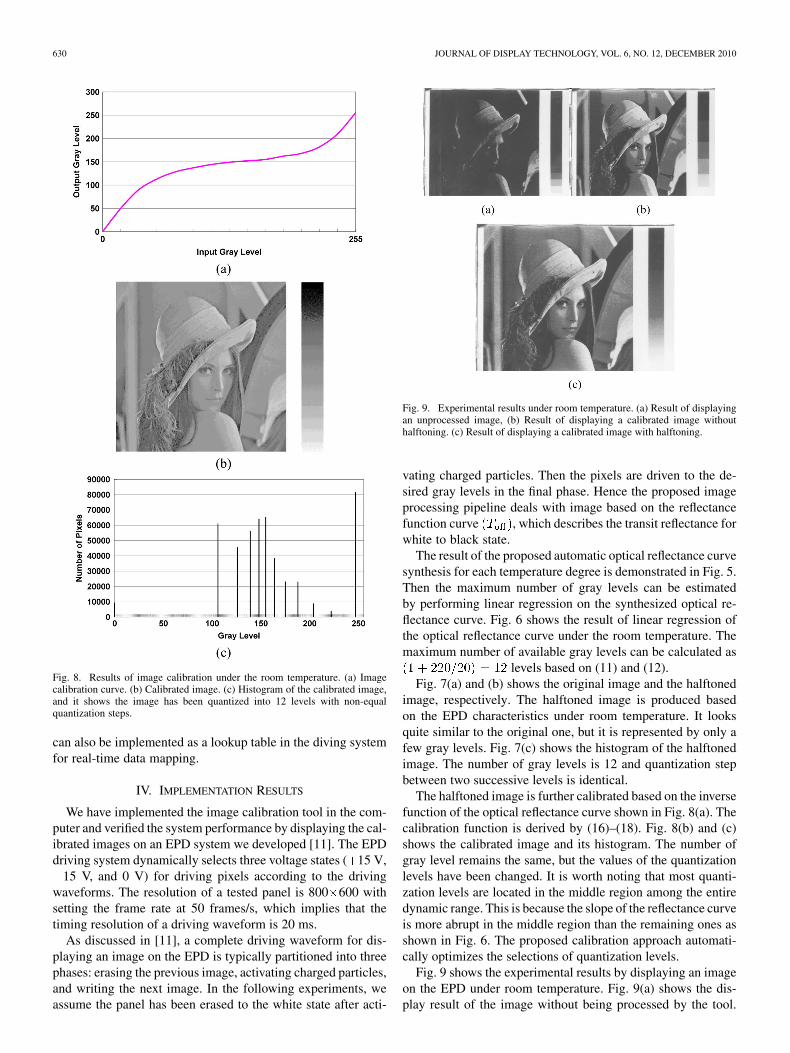
Fig. 8. Results of image calibration under the room temperature. (a) Imagecalibration curve. (b) Calibrated image. (c) Histogram of the calibrated image,and it shows the image has been quantized into 12 levels with non-equalquantization steps.
can also be implemented as a lookup table in the diving systemfor real-time data mapping.
IV. IMPLEMENTATION RESULTS
We have implemented the image calibration tool in the com-puter and verified the system performance by displaying the cal-ibrated images on an EPD system we developed [11]. The EPDdriving system dynamically selects three voltage states ( 15 V,
15 V, and 0 V) for driving pixels according to the drivingwaveforms. The resolution of a tested panel is 800 600 withsetting the frame rate at 50 frames/s, which implies that thetiming resolution of a driving waveform is 20 ms.
As discussed in [11], a complete driving waveform for dis-playing an image on the EPD is typically partitioned into threephases: erasing the previous image, activating charged particles,and writing the next image. In the following experiments, weassume the panel has been erased to the white state after acti-
Fig. 9. Experimental results under room temperature. (a) Result of displayingan unprocessed image, (b) Result of displaying a calibrated image withouthalftoning. (c) Result of displaying a calibrated image with halftoning.
vating charged particles. Then the pixels are driven to the de-sired gray levels in the final phase. Hence the proposed imageprocessing pipeline deals with image based on the reflectancefunction curve , which describes the transit reflectance forwhite to black state.
The result of the proposed automatic optical reflectance curvesynthesis for each temperature degree is demonstrated in Fig. 5.Then the maximum number of gray levels can be estimatedby performing linear regression on the synthesized optical re-flectance curve. Fig. 6 shows the result of linear regression ofthe optical reflectance curve under the room temperature. Themaximum number of available gray levels can be calculated as
levels based on (11) and (12).Fig. 7(a) and (b) shows the original image and the halftoned
image, respectively. The halftoned image is produced basedon the EPD characteristics under room temperature. It looksquite similar to the original one, but it is represented by only afew gray levels. Fig. 7(c) shows the histogram of the halftonedimage. The number of gray levels is 12 and quantization stepbetween two successive levels is identical.
The halftoned image is further calibrated based on the inversefunction of the optical reflectance curve shown in Fig. 8(a). Thecalibration function is derived by (16)–(18). Fig. 8(b) and (c)shows the calibrated image and its histogram. The number ofgray level remains the same, but the values of the quantizationlevels have been changed. It is worth noting that most quanti-zation levels are located in the middle region among the entiredynamic range. This is because the slope of the reflectance curveis more abrupt in the middle region than the remaining ones asshown in Fig. 6. The proposed calibration approach automati-cally optimizes the selections of quantization levels.
Fig. 9 shows the experimental results by displaying an imageon the EPD under room temperature. Fig. 9(a) shows the dis-play result of the image without being processed by the tool.
KAO et al.: INTEGRATING PHOTOMETRIC CALIBRATION WITH ADAPTIVE IMAGE HALFTONING FOR EPDs 631
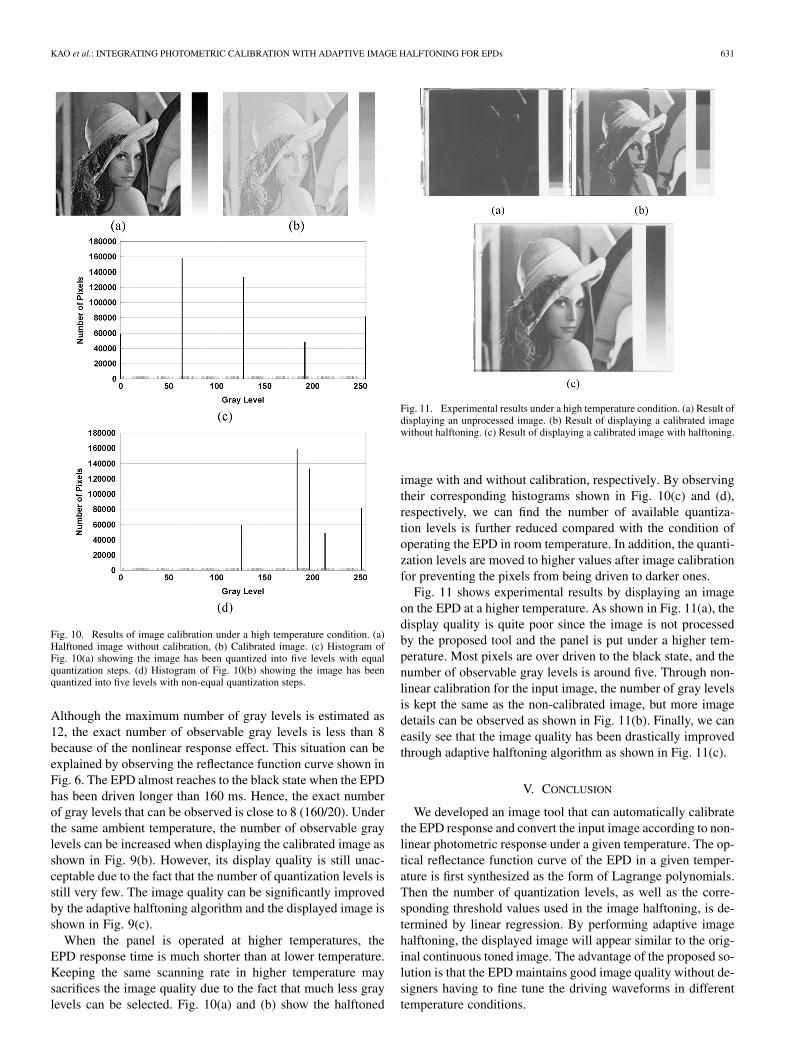
Fig. 10. Results of image calibration under a high temperature condition. (a)Halftoned image without calibration, (b) Calibrated image. (c) Histogram ofFig. 10(a) showing the image has been quantized into five levels with equalquantization steps. (d) Histogram of Fig. 10(b) showing the image has beenquantized into five levels with non-equal quantization steps.
Although the maximum number of gray levels is estimated as12, the exact number of observable gray levels is less than 8because of the nonlinear response effect. This situation can beexplained by observing the reflectance function curve shown inFig. 6. The EPD almost reaches to the black state when the EPDhas been driven longer than 160 ms. Hence, the exact numberof gray levels that can be observed is close to 8 (160/20). Underthe same ambient temperature, the number of observable graylevels can be increased when displaying the calibrated image asshown in Fig. 9(b). However, its display quality is still unac-ceptable due to the fact that the number of quantization levels isstill very few. The image quality can be significantly improvedby the adaptive halftoning algorithm and the displayed image isshown in Fig. 9(c).
When the panel is operated at higher temperatures, theEPD response time is much shorter than at lower temperature.Keeping the same scanning rate in higher temperature maysacrifices the image quality due to the fact that much less graylevels can be selected. Fig. 10(a) and (b) show the halftoned
Fig. 11. Experimental results under a high temperature condition. (a) Result ofdisplaying an unprocessed image. (b) Result of displaying a calibrated imagewithout halftoning. (c) Result of displaying a calibrated image with halftoning.
image with and without calibration, respectively. By observingtheir corresponding histograms shown in Fig. 10(c) and (d),respectively, we can find the number of available quantiza-tion levels is further reduced compared with the condition ofoperating the EPD in room temperature. In addition, the quanti-zation levels are moved to higher values after image calibrationfor preventing the pixels from being driven to darker ones.
Fig. 11 shows experimental results by displaying an imageon the EPD at a higher temperature. As shown in Fig. 11(a), thedisplay quality is quite poor since the image is not processedby the proposed tool and the panel is put under a higher tem-perature. Most pixels are over driven to the black state, and thenumber of observable gray levels is around five. Through non-linear calibration for the input image, the number of gray levelsis kept the same as the non-calibrated image, but more imagedetails can be observed as shown in Fig. 11(b). Finally, we caneasily see that the image quality has been drastically improvedthrough adaptive halftoning algorithm as shown in Fig. 11(c).
V. CONCLUSION
We developed an image tool that can automatically calibratethe EPD response and convert the input image according to non-linear photometric response under a given temperature. The op-tical reflectance function curve of the EPD in a given temper-ature is first synthesized as the form of Lagrange polynomials.Then the number of quantization levels, as well as the corre-sponding threshold values used in the image halftoning, is de-termined by linear regression. By performing adaptive imagehalftoning, the displayed image will appear similar to the orig-inal continuous toned image. The advantage of the proposed so-lution is that the EPD maintains good image quality without de-signers having to fine tune the driving waveforms in differenttemperature conditions.
632 JOURNAL OF DISPLAY TECHNOLOGY, VOL. 6, NO. 12, DECEMBER 2010
REFERENCES
[1] I. Ota, J. Ohnishi, and M. Yoshiyama, “Electrophoretic image display(EPID) panel,” Proc. IEEE, vol. 61, no. 7, pp. 832–836, Jul. 1973.
[2] B. Comiskey, J. D. Albert, H. Yoshizawa, and J. Jacobson, “An elec-trophoretic ink for all-printed reflective electronic display,” Nature, vol.394, no. 6690, pp. 253–255, Jul. 1998.
[3] Y. Chen, J. Au, P. Kazlas, A. Ritenour, H. Gates, and M. McCreary,“Flexible active-matrix electronic ink display,” Nature, vol. 423, no.6936, p. 136, May 2003.
[4] M. A. Hopper and V. Novotny, “An electrophoretic display, its prop-erties, model, and addressing,” IEEE Trans. Electron Devices, vol. 26,no. 8, pp. 1148–1152, Aug. 1979.
[5] B. Fitzhenry-Ritz, “Optical properties of electrophoretic image dis-plays,” IEEE Trans. Electron Devices, vol. 28, no. 6, pp. 726–735, Jun.1981.
[6] R. S. Berns, “Methods for characterizing CRT displays,” Displays, vol.16, no. 4, pp. 173–182, May 1996.
[7] D. U. Lee, R. C. C. Cheung, and J. D. Villasenor, “A flexible archi-tecture for precise gamma correction,” IEEE Trans. Very Large ScaleIntegr. (VLSI) Syst., vol. 15, no. 4, pp. 474–478, Apr. 2007.
[8] X. F. Feng, H. Pan, and D. Daly, “Dynamic gamma: Applications to im-prove LCD temporal response using overdrive,” in Proc. SID’05 Dig.,2005, pp. 462–465.
[9] L. F. Weber, “The promise of plasma displays for HDTV,” in Proc. SID00 Digest, 2000, pp. 402–405.
[10] Z. G. Wang, Z. H. Liang, and C. L. Liu, “A real-time image processorwith combining dynamic contrast ratio enhancement and inversegamma correction for PDP,” Displays, vol. 30, no. 3, pp. 133–139, Jul.2009.
[11] W. C. Kao, “Electrophoretic display controller integrated with real-time halftoning and partial region update,” J. Display Technol., vol. 6,no. 1, pp. 36–44, Jan. 2010.
[12] T. Bert, H. D. Smet, F. Beunis, and K. Neyts, “Complete electrical andoptical simulation of electronic paper,” Displays, vol. 27, no. 2, pp.50–55, Mar. 2006.
[13] R. Zehner, K. Amundson, A. Knaian, B. Zion, M. Johnson, and G.Zhou, “Drive waveforms for active matrix electrophoretic displays,”in Proc. SID’03 Dig., 2003, pp. 842–845.
[14] M. T. Johnson, G. Zhou, R. Zehner, K. Amundson, A. Henzen, and J.Kamer, “High-quality images on electrophoretic displays,” J. SID, vol.14, no. 2, pp. 175–180, Feb. 2006.
[15] H. Kawai, M. Miyasaka, A. Miyazaki, T. Kodaira, S. Inoue, T. Shi-moda, K. Amundson, R. J. Paolini Jr., M. McCreary, and T. Shimoda,“A flexible 2-in. QVGA LTPS-TFT electrophoretic display,” in Proc.SID’05 Dig., 2005, pp. 1638–1641.
[16] K. Amundson and T. Sjodin, “Achieving graytone images in a microen-capsulated electrophoretic display,” in Proc. SID’06 Dig., 2006, pp.1918–1921.
[17] S. Inoue, H. Kawai, S. Kanbe, T. Saeki, and T. Shimoda, “High-resolu-tion microencapsulated electrohoretic display (EPD) driven by poly-SiTFTs with four-level grayscale,” IEEE Trans. Electron Devices, vol.49, no. 8, pp. 1532–1539, Aug. 2002.
[18] R. A. Ulichney, Digital Halftoning. Cambridge, MA: MIT Press,1987.
[19] R. Floyd and L. Steinberg, “An adaptive algorithm for spatial grayscale,” in Proc. SID’75 Dig., 1975, pp. 36–37.
[20] W. C. Kao, J. A. Ye, M. I. Chu, and C. Y. Su, “Image quality improve-ment for electrophoretic displays by combining contrast enhancementand halftoning techniques,” IEEE Trans. Consum. Electron., vol. 55,no. 1, pp. 15–19, Feb. 2009.
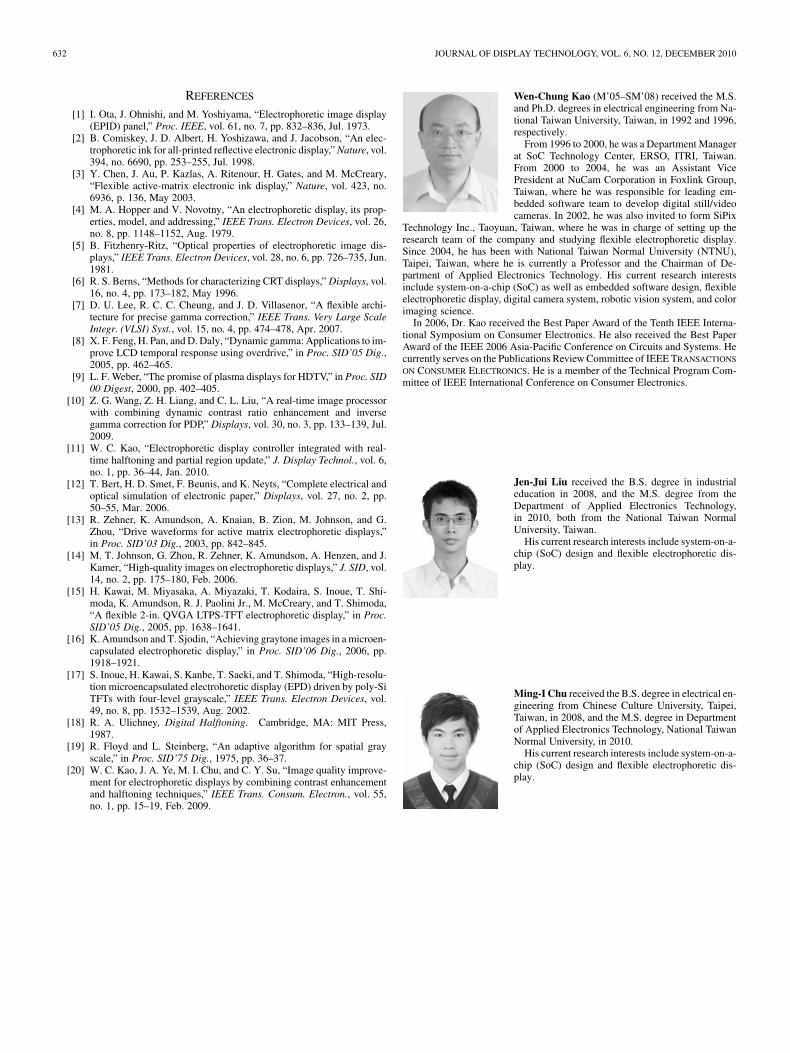
Wen-Chung Kao (M’05–SM’08) received the M.S.and Ph.D. degrees in electrical engineering from Na-tional Taiwan University, Taiwan, in 1992 and 1996,respectively.
From 1996 to 2000, he was a Department Managerat SoC Technology Center, ERSO, ITRI, Taiwan.From 2000 to 2004, he was an Assistant VicePresident at NuCam Corporation in Foxlink Group,Taiwan, where he was responsible for leading em-bedded software team to develop digital still/videocameras. In 2002, he was also invited to form SiPix
Technology Inc., Taoyuan, Taiwan, where he was in charge of setting up theresearch team of the company and studying flexible electrophoretic display.Since 2004, he has been with National Taiwan Normal University (NTNU),Taipei, Taiwan, where he is currently a Professor and the Chairman of De-partment of Applied Electronics Technology. His current research interestsinclude system-on-a-chip (SoC) as well as embedded software design, flexibleelectrophoretic display, digital camera system, robotic vision system, and colorimaging science.
In 2006, Dr. Kao received the Best Paper Award of the Tenth IEEE Interna-tional Symposium on Consumer Electronics. He also received the Best PaperAward of the IEEE 2006 Asia-Pacific Conference on Circuits and Systems. Hecurrently serves on the Publications Review Committee of IEEE TRANSACTIONS
ON CONSUMER ELECTRONICS. He is a member of the Technical Program Com-mittee of IEEE International Conference on Consumer Electronics.
Jen-Jui Liu received the B.S. degree in industrialeducation in 2008, and the M.S. degree from theDepartment of Applied Electronics Technology,in 2010, both from the National Taiwan NormalUniversity, Taiwan.
His current research interests include system-on-a-chip (SoC) design and flexible electrophoretic dis-play.
Ming-I Chu received the B.S. degree in electrical en-gineering from Chinese Culture University, Taipei,Taiwan, in 2008, and the M.S. degree in Departmentof Applied Electronics Technology, National TaiwanNormal University, in 2010.
His current research interests include system-on-a-chip (SoC) design and flexible electrophoretic dis-play.


![A method for determining electrophoretic and …...[4,5]. Current techniques for measuring electrophoretic mo-bility include an electroacoustic method [6], electrophoretic light scattering](https://img.pdfslide.us/doc/110x75/5f08e22b7e708231d4242f99/a-method-for-determining-electrophoretic-and-45-current-techniques-for-measuring.jpg)