Embed Size (px)
Citation preview
Integrating -Omics
Brent D. Foy, Ph.D.
Associate Professor
Department of Physics
Wright State University
Dayton, OH
2
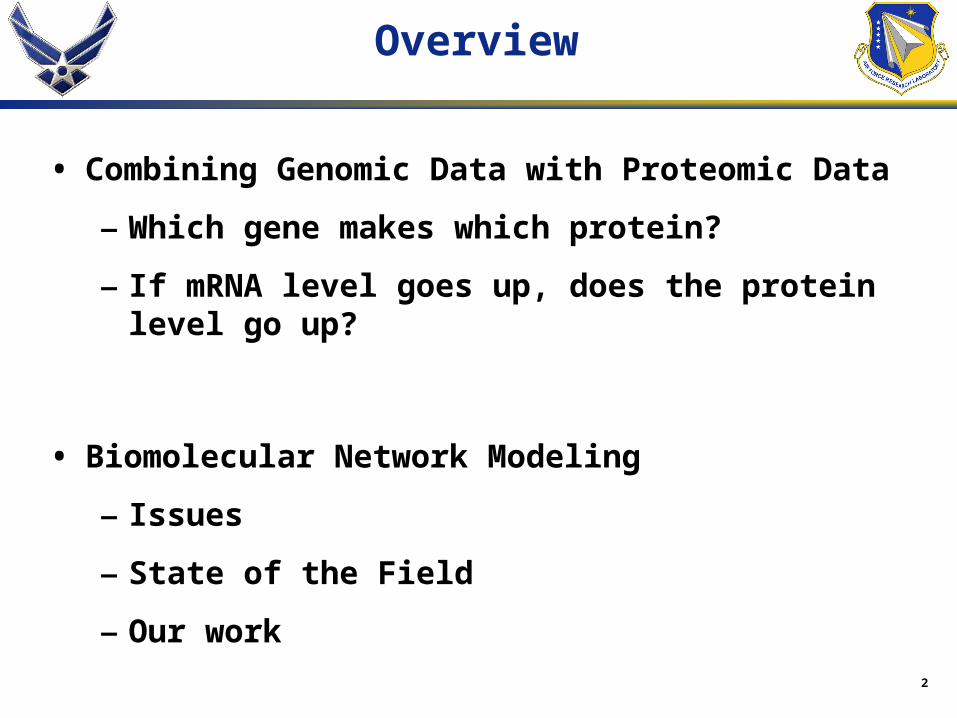
Overview
• Combining Genomic Data with Proteomic Data
– Which gene makes which protein?
– If mRNA level goes up, does the protein level go up?
• Biomolecular Network Modeling
– Issues
– State of the Field
– Our work

3
Gene to Protein Identification
Partial table from Affymetrix rat gene tox chip
The ‘J02722’ is the GenBank nucleotide ID for this gene.
4
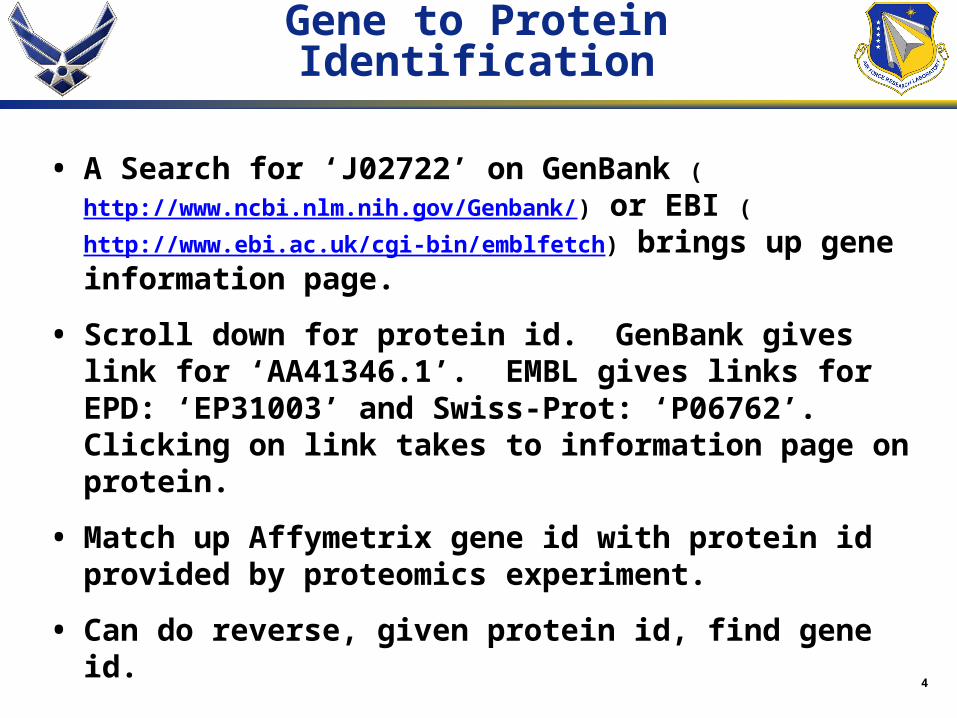
Gene to Protein Identification
• A Search for ‘J02722’ on GenBank (http://www.ncbi.nlm.nih.gov/Genbank/) or EBI (http://www.ebi.ac.uk/cgi-bin/emblfetch) brings up gene information page.
• Scroll down for protein id. GenBank gives link for ‘AA41346.1’. EMBL gives links for EPD: ‘EP31003’ and Swiss-Prot: ‘P06762’. Clicking on link takes to information page on protein.
• Match up Affymetrix gene id with protein id provided by proteomics experiment.
• Can do reverse, given protein id, find gene id.
5
Gene to Protein Identification
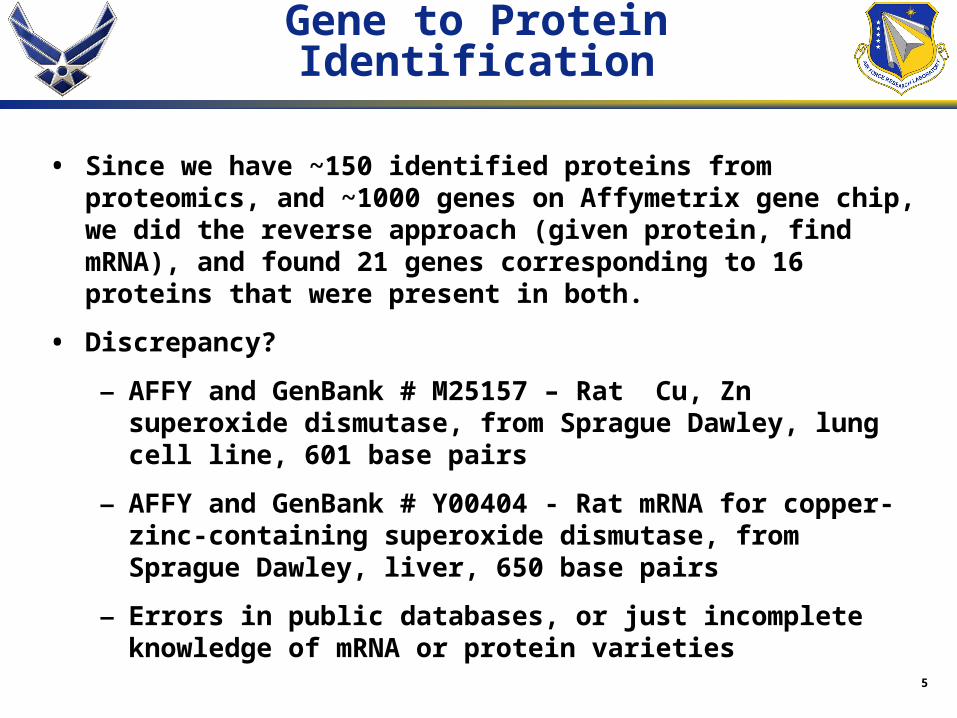
• Since we have ~150 identified proteins from proteomics, and ~1000 genes on Affymetrix gene chip, we did the reverse approach (given protein, find mRNA), and found 21 genes corresponding to 16 proteins that were present in both.
• Discrepancy?
– AFFY and GenBank # M25157 – Rat Cu, Zn superoxide dismutase, from Sprague Dawley, lung cell line, 601 base pairs
– AFFY and GenBank # Y00404 - Rat mRNA for copper-zinc-containing superoxide dismutase, from Sprague Dawley, liver, 650 base pairs
– Errors in public databases, or just incomplete knowledge of mRNA or protein varieties
6
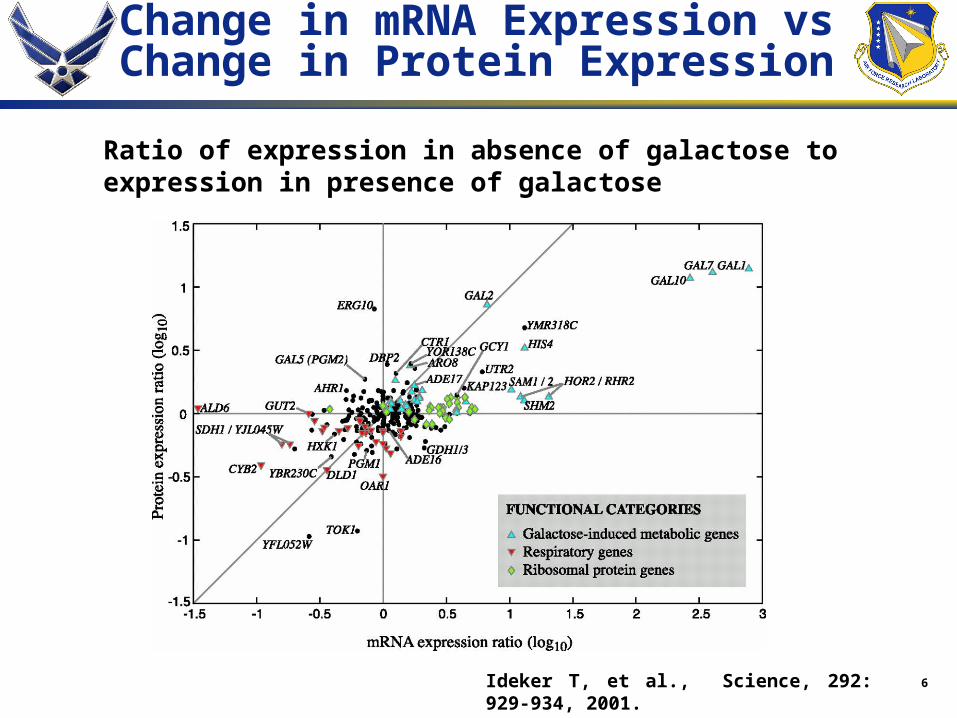
Change in mRNA Expression vs Change in Protein Expression
Ratio of expression in absence of galactose to expression in presence of galactose
Ideker T, et al., Science, 292: 929-934, 2001.
7
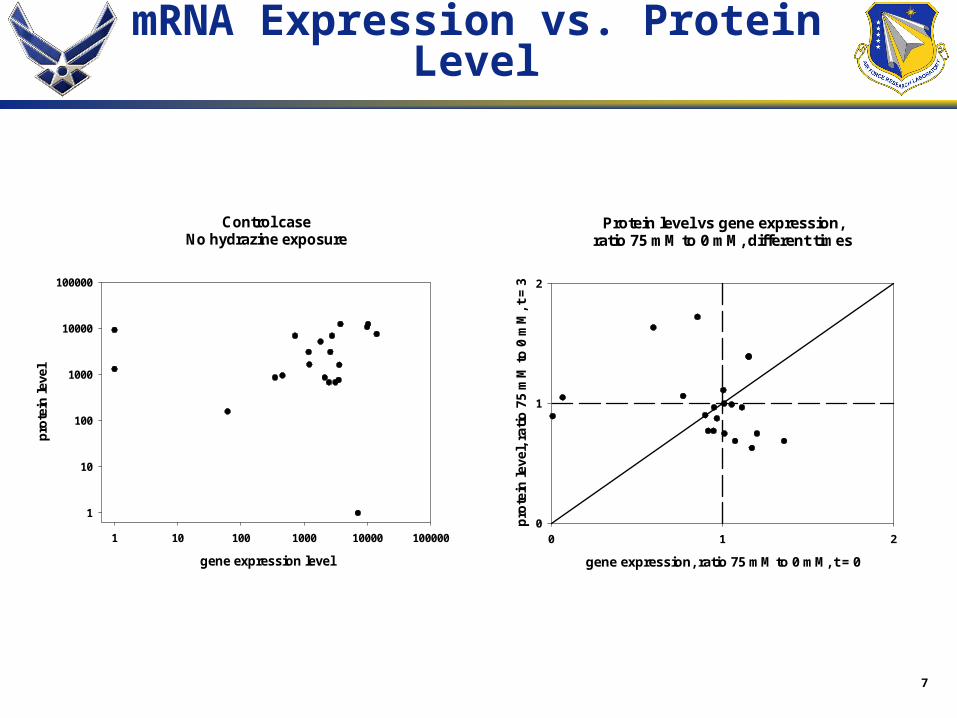
mRNA Expression vs. Protein Level
Protein level vs gene expression,ratio 75 mM to 0 mM, different times
gene expression, ratio 75 mM to 0 mM, t = 0
0 1 2
pro
tein
leve
l, ra
tio
75
mM
to
0 m
M, t
= 3
0
1
2
Control caseNo hydrazine exposure
gene expression level
1 10 100 1000 10000 100000
pro
tein
leve
l
1
10
100
1000
10000
100000

8
Time Course – mRNA and Protein Levels
50 mM Hydrazine-exposed Hepatocytes
Immunoglobulin Heavy Chain Binding Protein
0
5000
10000
15000
20000
25000
-5 0 5 10 15 20 25 30
Protein
mRNA
N-hydroxy-2-acetylaminofluorene; sulfotransferase
0
500
1000
1500
2000
2500
-5 0 5 10 15 20 25 30
Protein
mRNA
Heme Oxygenase (HSP32)
0
2000
4000
6000
8000
10000
12000
-5 0 5 10 15 20 25 30
Protein
mRNA
Soluble Cytochrome b5
01000200030004000500060007000
-5 0 5 10 15 20 25 30
Protein
mRNA
9
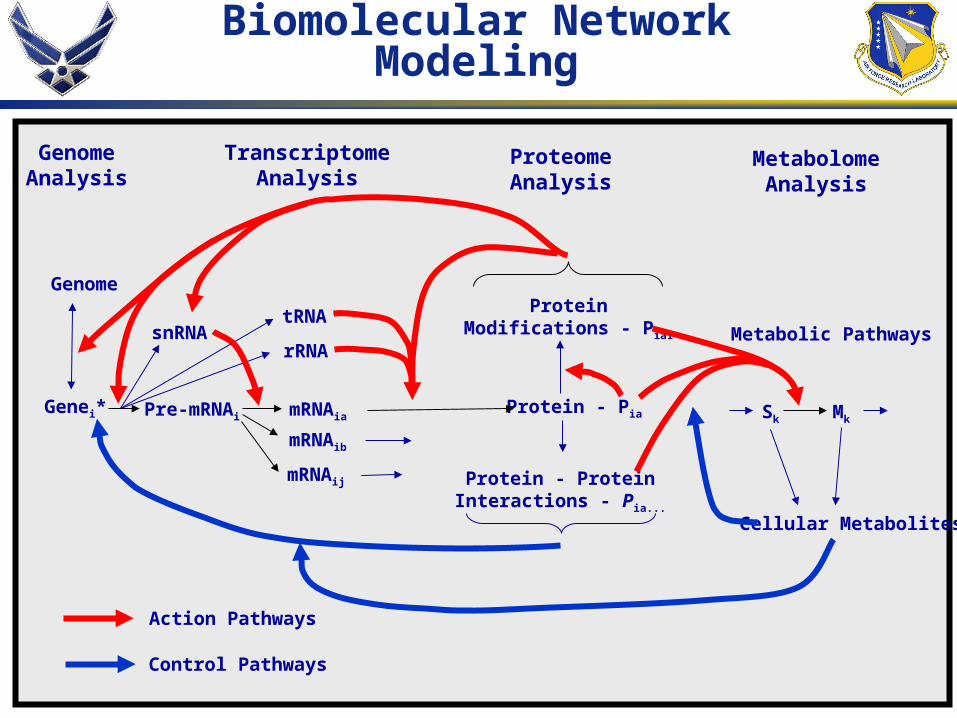
Biomolecular Network Modeling
TranscriptomeAnalysis
ProteomeAnalysis
MetabolomeAnalysis
Protein - Pia
Protein - ProteinInteractions - Pia...
Metabolic Pathways
mRNAia
ProteinModifications - Pia1
Cellular Metabolites
Genei*
rRNA
tRNA
GenomeAnalysis
Pre-mRNAi
Genome
mRNAib
snRNA
mRNAij
Sk Mk
Action Pathways
Control Pathways
10
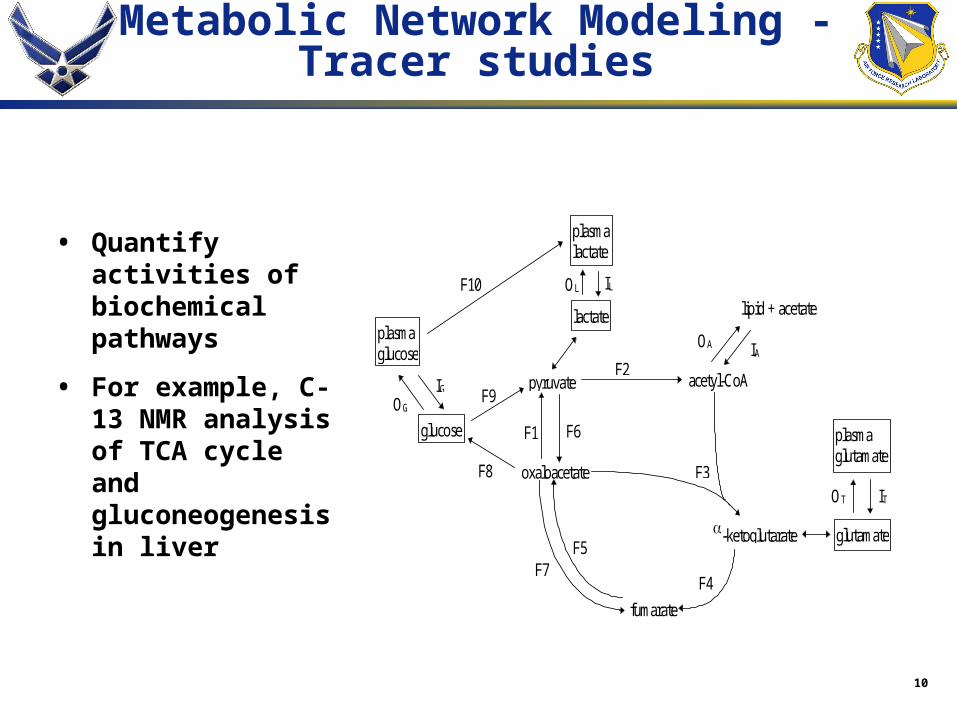
Metabolic Network Modeling -Tracer studies
• Quantify activities of biochemical pathways
• For example, C-13 NMR analysis of TCA cycle and gluconeogenesis in liver
lactate
pyruvate acetyl-CoA
oxaloacetate
F1 F6
F2
F3
a-ketoglutarate glutamate
fumarate
F4
F5F7
glucose
F8
F9
plasmalactate
ILOL
plasmaglucose
OG
IG
plasmaglutamate
ITOT
lipid + acetate
IAOA
F10
11
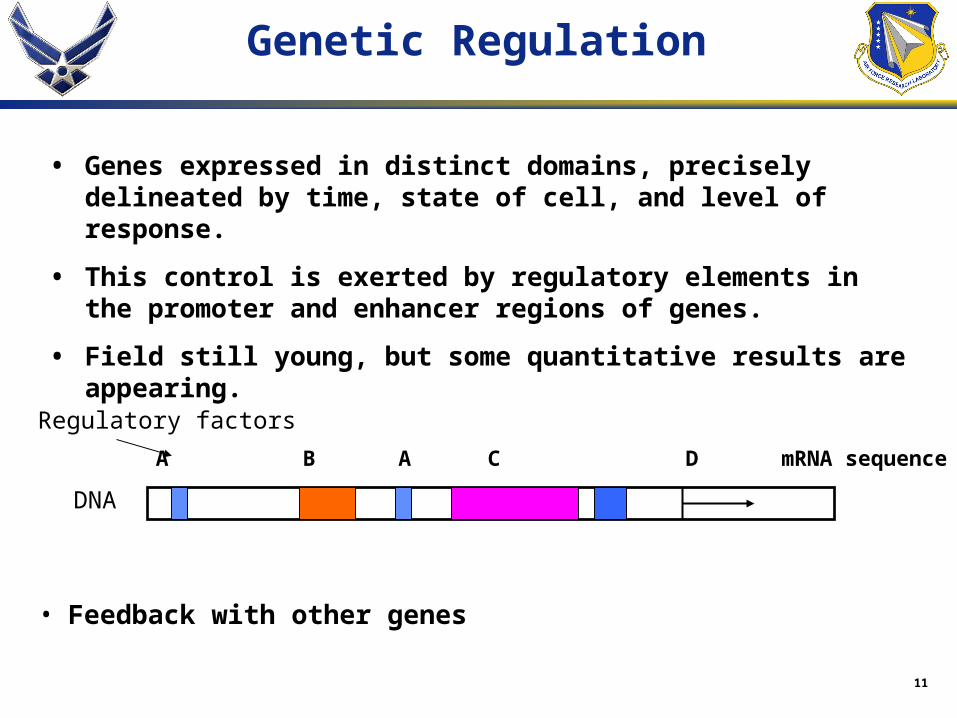
Genetic Regulation
• Genes expressed in distinct domains, precisely delineated by time, state of cell, and level of response.
• This control is exerted by regulatory elements in the promoter and enhancer regions of genes.
• Field still young, but some quantitative results are appearing.
A B A C D mRNA sequence
DNA
Regulatory factors
• Feedback with other genes
12
Biomolecular Network Modeling – Issues
• Compared to standard modeling of kinetic processes, challenges include:
– Stochastic reaction behavior due to random diffusion processes and small numbers of molecules
– Multiple protein-protein, protein-mRNA, etc. interactions
– computational efficiency, parallelized code for operation on multiple CPUs
– Can you separate out the model for a pathway from the whole cell?

13
Biomolecular Network Modeling – Task
gene A mRNA A prot A rxn A1 A2
gene B mRNA B prot B rxn B1 B2
gene C mRNA C prot C
gene D mRNA D prot D
•Compounds other than genes are mobile
•Some of these mobile compounds affect many reactions (e.g. ATP, ions)
14
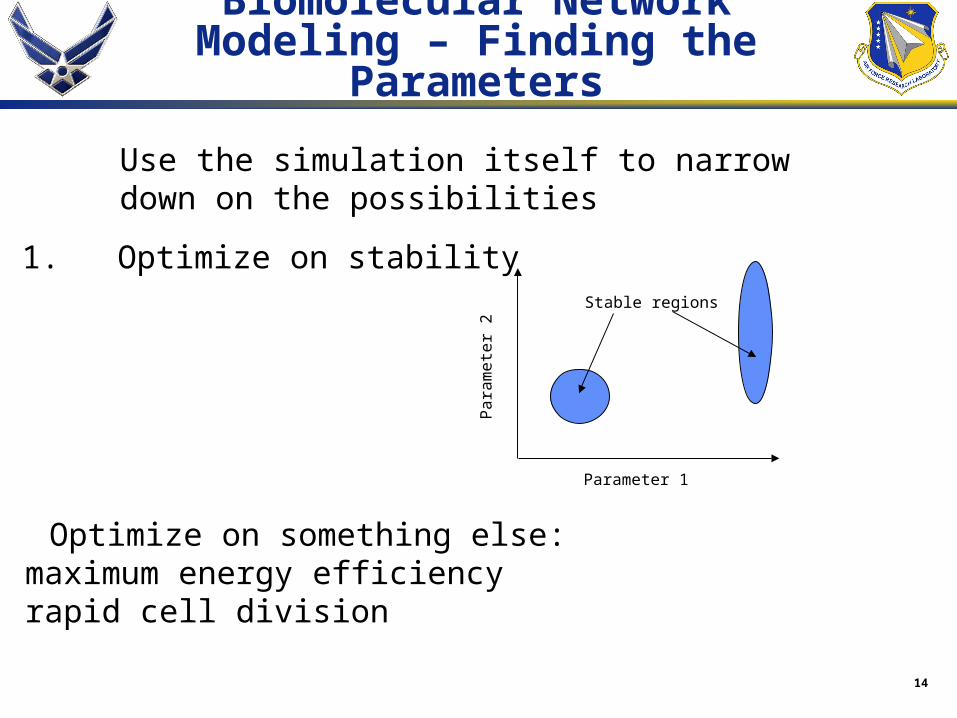
Biomolecular Network Modeling – Finding the Parameters
Use the simulation itself to narrow down on the possibilities
1. Optimize on stability
Parameter 1P
aram
eter
2
Stable regions
2. Optimize on something else:maximum energy efficiencyrapid cell division
15
Biomolecular Network Modeling - State of the Field
• E-Cell
• Virtual Cell
• Bio-Spice/Arkin
• Specific Laboratories – Institute for Systems Biology/Leroy Hood’s group
• Useful links page: http://www.cds.caltech.edu/erato/links.html
16
E-Cell
• From Laboratory for Bioinformatics, Keio University, Japan
• Attempt to integrate genes, RNA, proteins, and metabolites of entire cell in one simulation
• Freely available, http://www.e-cell.org/
17
E-Cell
• Used to simulate a “minimal cell” based on Mycoplasma genitalium
• 127 genes
• Integrate with online databases
• Many parameters estimated
• Substances modeled include small molecules, macromolecules, multi-protein complexes, protein-DNA complexes
• Multiple reaction types
18
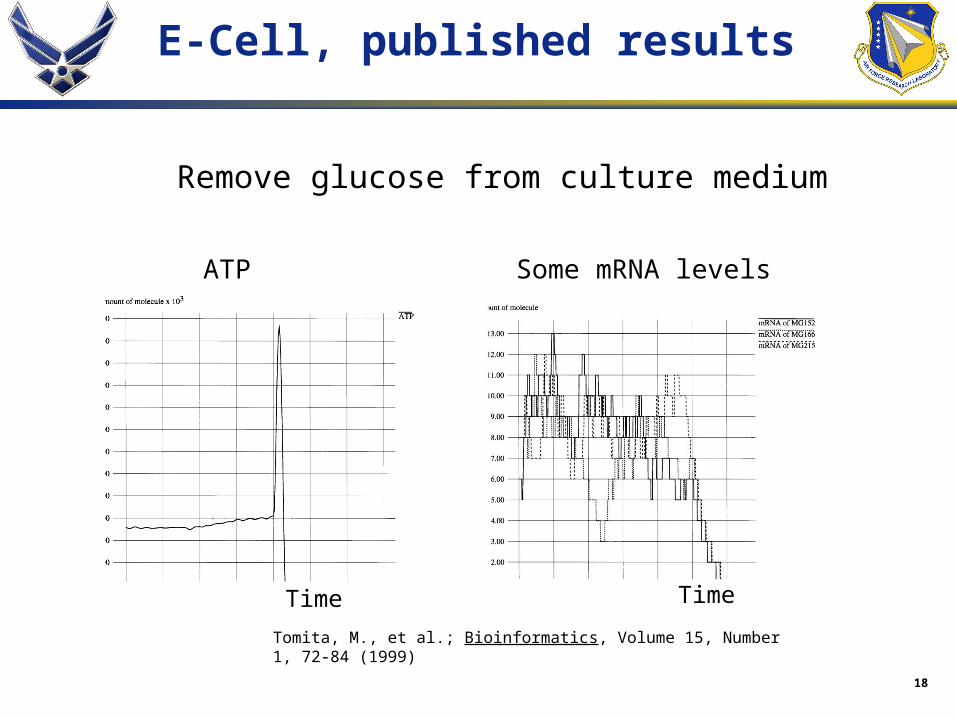
Time Time
ATP Some mRNA levels
Remove glucose from culture medium
Tomita, M., et al.; Bioinformatics, Volume 15, Number 1, 72-84 (1999)
E-Cell, published results
19
Virtual Cell
• National Resource for Cell Analysis and Modeling (NRCAM), located at University of Connecticut Health Center
• Access via internet, http://www.nrcam.uchc.edu/
• Has a graphical, “biological users” interface
• Compared to E-Cell
– Includes 3-d spatial information within cell
– Has not been applied to gene->mRNA->protein->metabolites
20
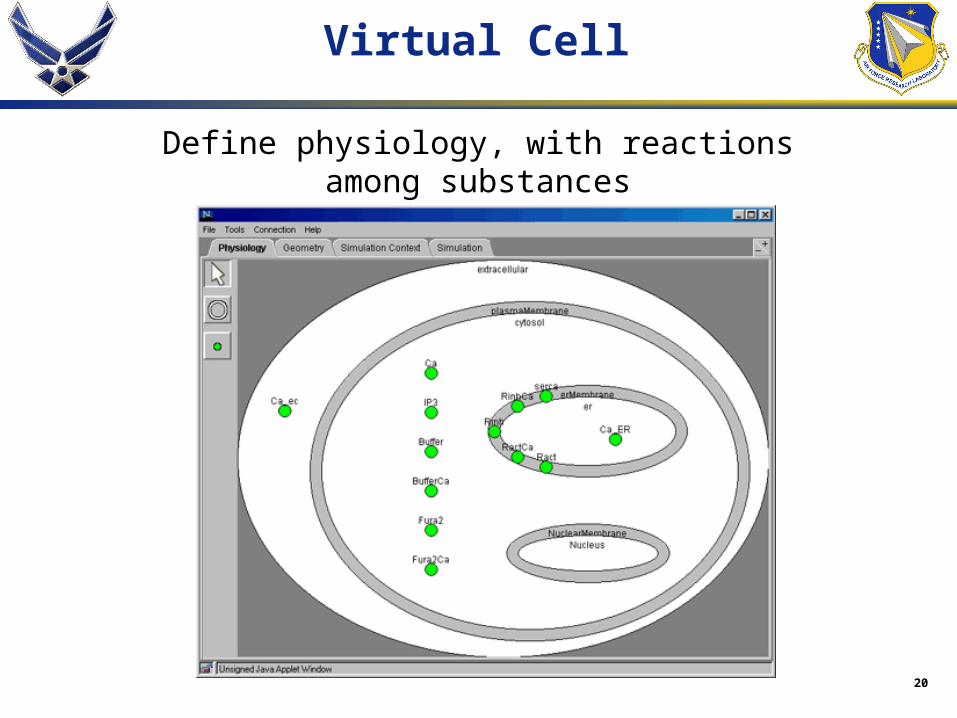
Define physiology, with reactionsamong substances
Virtual Cell
21
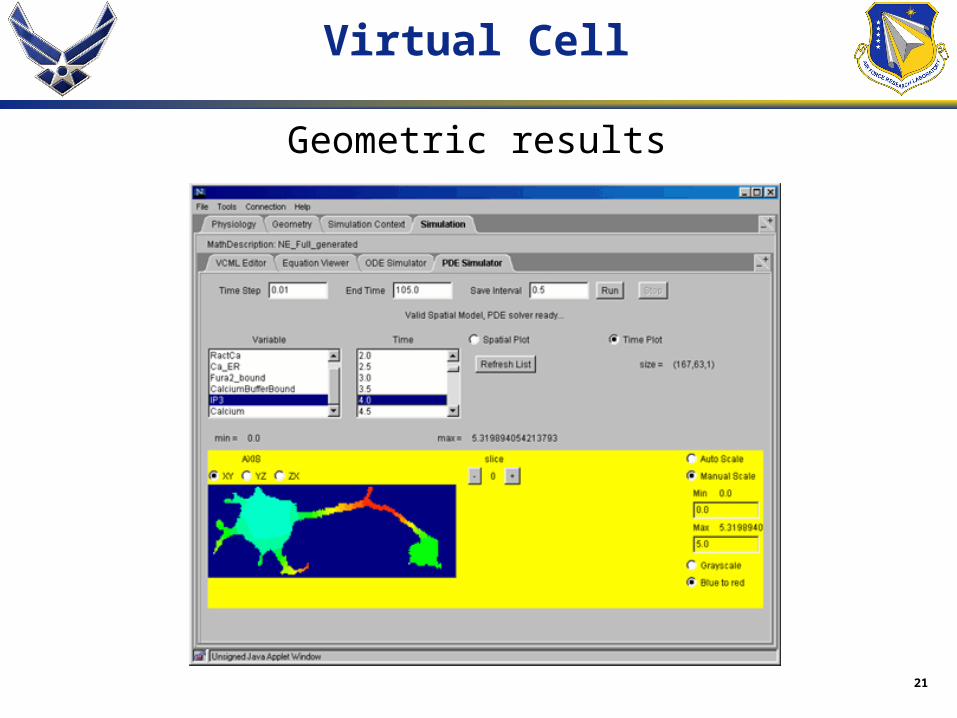
Geometric results
Virtual Cell
22
Bio-Spice
• Initiated at Berkeley National Laboratory, http://gobi.lbl.gov/~aparkin/index.html
• Development of Bio-Spice is currently the subject of a DARPA project
• It will be a Simulation Program for Intra-Cell Evaluation, like SPICE for circuit design
• Intended to be a “user-friendly simulation tool that captures the network of molecular interactions including gene-gene, gene-protein, and protein-protein interactions.”

23
Institute for Systems Biology - Galactose in Yeast
Ideker T, et al., Science, 292: 929-934, 2001.

24
Circles are genes, yellow means product affects another gene’s transcription, blue means proteins interact. Grayscale of circles is mRNA change with galactose in medium.
ISB - physical interaction network
Ideker T, et al., Science, 292: 929-934, 2001.

25
Development of Quantitative Tools - Transcription
B A TATA mRNA sequence
DNA
Regulatory factors
RNAPolymerase
TFIIITF_ATF_BActivated
Nucleotides
26
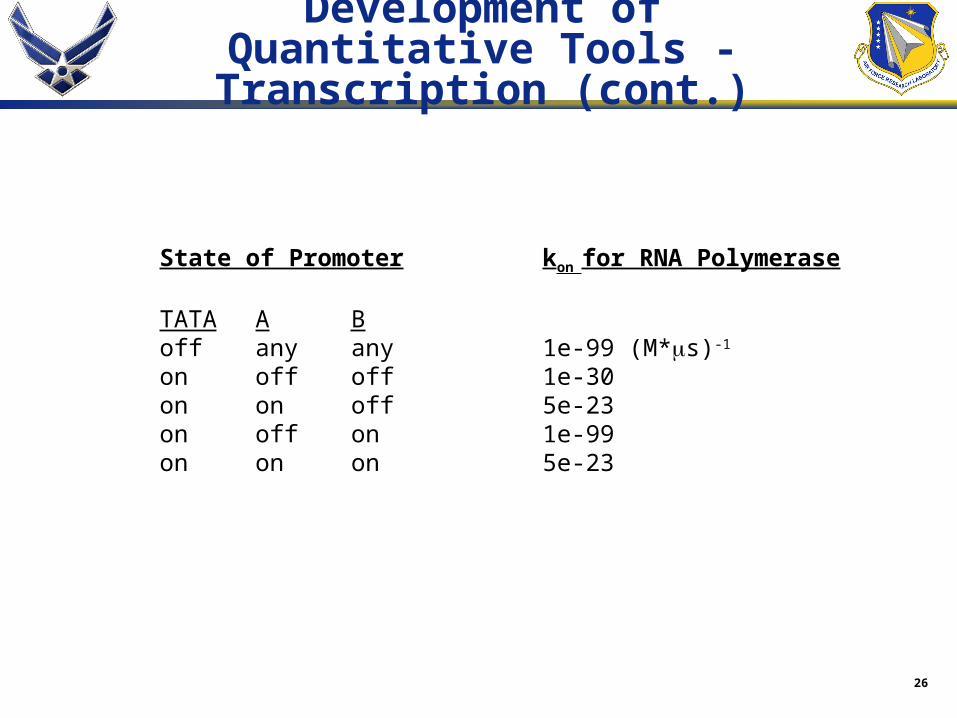
Development of Quantitative Tools - Transcription (cont.)
State of Promoter kon for RNA Polymerase
TATA A Boff any any 1e-99 (M*s)-1
on off off 1e-30on on off 5e-23on off on 1e-99on on on 5e-23

27
Development of Quantitative Tools - Transcription (cont.)
B A TATA product = TF_A
Gene A
A TATA product = TF_B
Gene B
Plus a first-order process for degradation of TF_A and TF_B
28
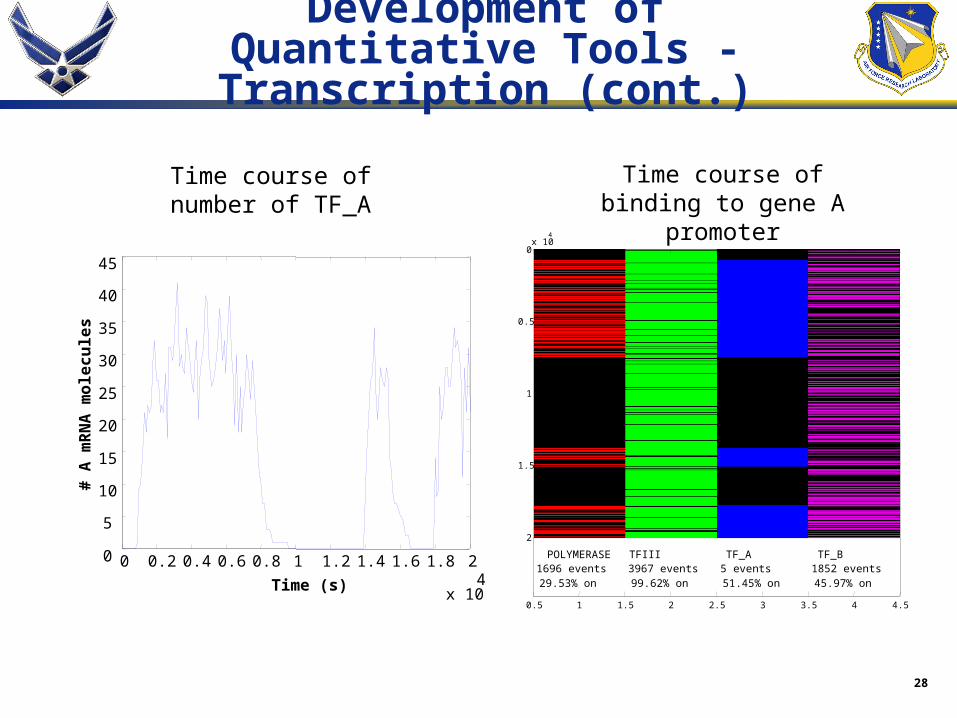
Development of Quantitative Tools - Transcription (cont.)
0 0.2 0.4 0.6 0.8 1 1.2 1.4 1.6 1.8 2
x 104
0
5
10
15
20
25
30
35
40
45
Time (s)
# A
mR
NA
mo
lec
ule
s
Time course of number of TF_A
POLYMERASE1696 events29.53% on
TFIII3967 events99.62% on
TF_A5 events51.45% on
TF_B1852 events45.97% on
0.5 1 1.5 2 2.5 3 3.5 4 4.5
0
0.5
1
1.5
2
x 104
Time course of binding to gene A promoter
29
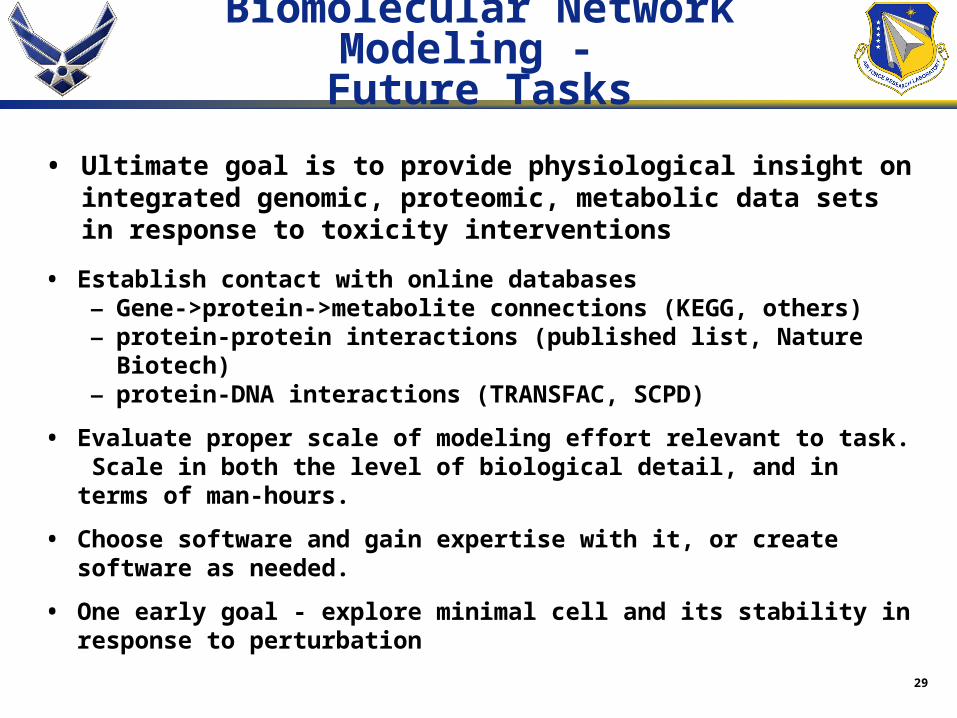
Biomolecular Network Modeling - Future Tasks
• Ultimate goal is to provide physiological insight on integrated genomic, proteomic, metabolic data sets in response to toxicity interventions
• Establish contact with online databases– Gene->protein->metabolite connections (KEGG, others)– protein-protein interactions (published list, Nature Biotech)– protein-DNA interactions (TRANSFAC, SCPD)
• Evaluate proper scale of modeling effort relevant to task. Scale in both the level of biological detail, and in terms of man-hours.
• Choose software and gain expertise with it, or create software as needed.
• One early goal - explore minimal cell and its stability in response to perturbation
30
Collaborators
AFRL
Dr. John Frazier
Dr. Charles Wang
Dr. Victor Chan
AFOSR
Dr. Walt Kozumbo
AFIT
Dr. Dennis Quinn
2Lt Matt Campbell
WSU
Dr. Tatiana Karpinets
31
Integrating -omics
Questions?