Embed Size (px)
Citation preview

Integrating Human Factors in Risk Analysis
1

Outlook • Integration of human factors into risk analysis:
• Means acknowledging the “human” contribution to industrial safety
• Accident models • Determine what hazards to consider and how to do it
• Human Reliability • The most systematic discipline for HF integration • Limitations and new perspectives
2
Why incorporate HF in risk analysis? • Standard arguments
1. Accidents history speaks for itself 2. Human contribution to risk is the major proportion 3. Not including HF will result in major problems
3

Causes of accidents
4

The search for causes • The identification of causes of accidents is
dependent on: • The objective: physical, psychological,
responsibilities • The practical constraints: stop at factors that can
be economically modified • The accident model: it will direct at where to look
and what categories to use • Classifications: e.g. taxonomies of errors
5

The role of accident models 1. Incident Analysis:
• To identify and explain the factors involved in accidents • To extract trends over time • To generalize through classifications of the factors: the failures and
their causes
2. Prediction and prevention • To analyse existing or new human-technology systems: what fails
will occur?
3. Quantification • Calculation of probabilities for different failure types
• Prediction of failures that may happen must be based on analyses of failures that have happened. • This defines a need for a common set of concepts and a common
approach for accident analysis and accident prevention
6
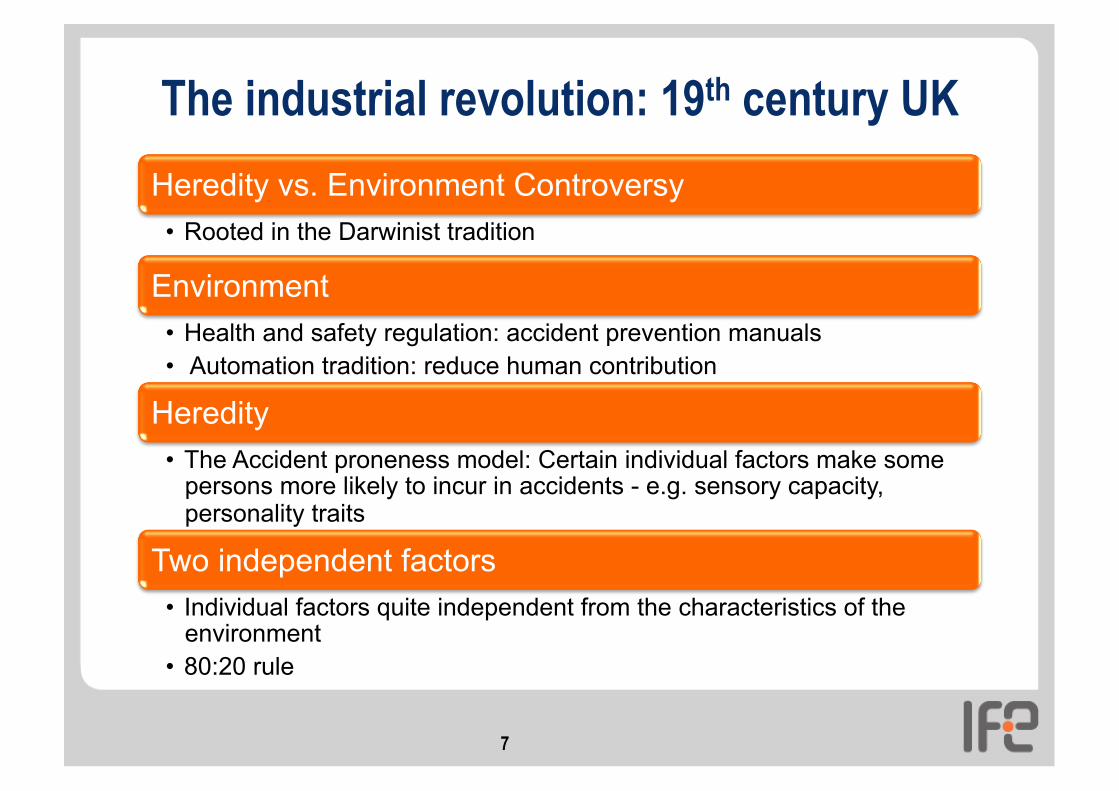
The industrial revolution: 19th century UK Heredity vs. Environment Controversy
• Rooted in the Darwinist tradition
Environment • Health and safety regulation: accident prevention manuals • Automation tradition: reduce human contribution
Heredity • The Accident proneness model: Certain individual factors make some
persons more likely to incur in accidents - e.g. sensory capacity, personality traits
Two independent factors • Individual factors quite independent from the characteristics of the
environment • 80:20 rule
7

Domino Model (Heinrich 1931) • “The occurrence of a preventable injury is the natural culmination of a
series of events or circumstances, which invariably occur in a fixed and logical order. … [The] sequence may be compared with a row of dominoes placed on and in such alignment in relation to one another that the fall of the first domino precipitates the fall of the entire row”
8

Reason’s Anatomy of an Organizational Accident
9

Perrow’s Normal Accident Theory (1984) Considers the complex interactions between automated systems and people. • Accidents are inevitable in complex, tightly coupled systems • Defenses-in-depth (redundancy and diversity) make the system opaque to people who manage and operate it • Centralization and procedures are essential for the control of tightly coupled systems; yet emergencies tend to become novel events for which these measures are not always adequate • The role of the human operator is to recover off-normal conditions for which automatic safety features are not provided because the designers cannot anticipate all the scenarios of failure in such complex systems • However, people cannot train for unimaginable and wholly novel emergencies
10

Constitutive elements of accident models
1. The causal units: • Technical: equipment, systems (barriers) • Human: operators, teams • Organization: management, safety culture • Software programs
2. The logic of failure • Sequential causes • Complex relationships • Dynamic dependencies
• 1 and 2 are not independent
11

Why do we need risk assessment (RA)? • Accidents continue to occur • Good design practice alone does not work
• Ergonomic assumption: good design improves performance and hence safety
• But the relation between workers’ well being/satisfaction and safety is weak
• Presumed low risk is vague • The public (regulator, authority) wants a
demonstration of acceptable safety
12

The Risk Assessment Process 1. What can go wrong?
Initiating events (scenario definition, e.g. small-break LOCA)
Event sequence logic 2. How frequently does it
happen? Quantification
3. What are the consequences?
Consequence modeling
13

Why to integrate HF and RA? • Without integration:
• HF people waste time and resources on issues that are not risk-significant
• HF people oversee issues that are risk-significant
• Design corrections cannot be prioritised without a ’risk picture’
• Integration of RA and HF gives economy and focus • Provided RA and HF are integrated
14
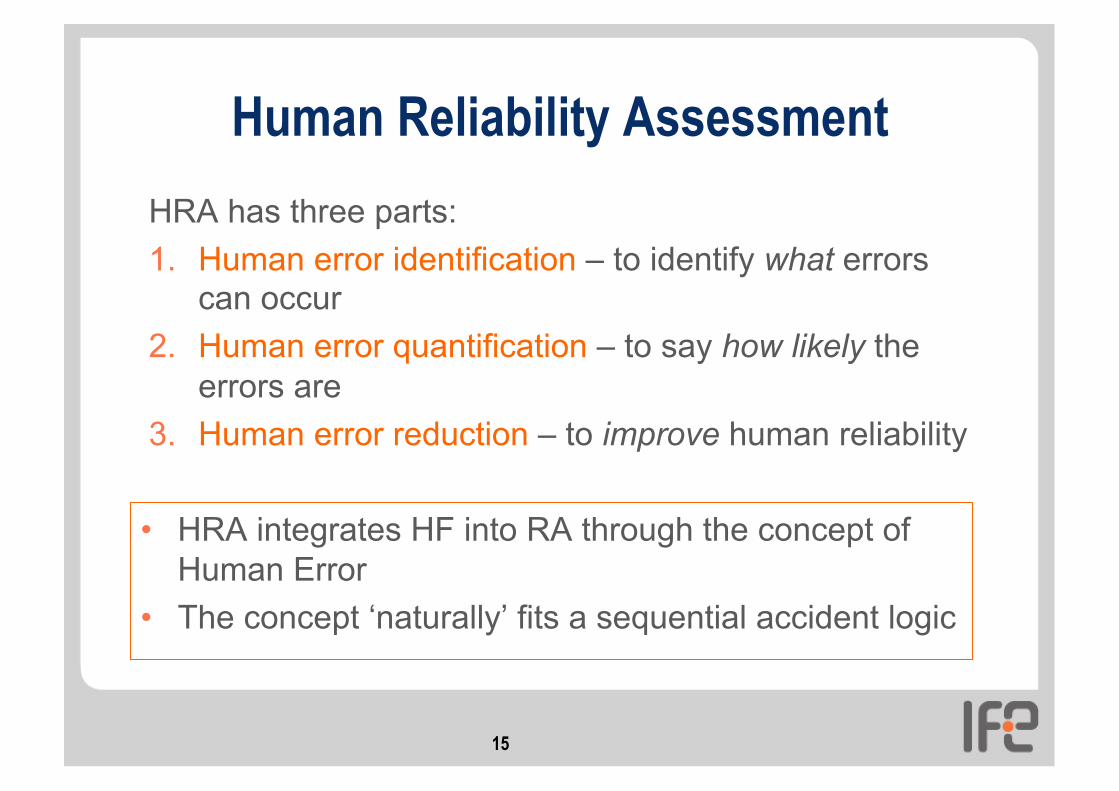
Human Reliability Assessment HRA has three parts: 1. Human error identification – to identify what errors
can occur 2. Human error quantification – to say how likely the
errors are 3. Human error reduction – to improve human reliability
15
• HRA integrates HF into RA through the concept of Human Error
• The concept ‘naturally’ fits a sequential accident logic

1983
THERP (1983) Pre-IE Post-IE Recovery Dependency
CD’s First Released
Existence of Black Holes Proven
Return of Halley’s Comet
Hubble Telescope Launched
Olympic Games Atlanta
1986 1990 1994 1999 1996 2009
First Balloon Trip Around the World
SHARP (1984) HRA Framework
HCR (1984) First HCR ORE (1989)
Operator Reliability Experiments
SHARP1 (1991) Revised Framework
CBDTM (1992) Cause-Based Decision Trees
SLIM-MAUD (1984)
ASEP (1987) Simplified THERP
HEART (1986)
ATHEANA (1996)
SPAR-H (2005)
NARA (2004)
EPRI (2000) HRA Users Group
CREAM (1998)
MERMOS (1998)
CAHR (1999)
ATHEANA (Rev.1 2000)
ASP/SPAR (1994)
Today
Halden Benchmarking (2006)
HRA methods timeline
(c) 2009 Jeff Julius / Electric Power Research Institute. All rights reserved.
16

HRA in Probabilistic Risk Assessment
17

Mapping HF to RA
HF RA Task analysis System analysis Human error identification Hazard identification Error representation Risk modeling Human error quantification Risk assessment Human error reduction Risk reduction
18

Event tree notation
Cause (IE) Consequences (S)
End state
Pivotal events
Pivotal Events: Technical or human operated (HE) safety functions
19

HRA process (Kirwan, 1992)
20

Problem definition • Decide scope – this will influence which human
actions you will assess, e.g.: • Emergency situations • ’Design-basis’ accidents • Maintenance failures
• This is usually decided by the PSA team, e.g., ’level 1, ’level 2’, ’level 3’, ”initiating events”, and their grouping
21

Task analysis Collect information on what happens in these events • The exact actions that should occur, equipment and
people • The equipment and interfaces used • The training, skills and procedures used ...
22

Human error identification • Decide what can go wrong • Traditional error categories
• Error of omission • Error of commission • Extraneous act • Error recovery
What shall I do now?
23

24
J. Reason. Human Error. Cambridge University Press, New York 1990.

Representation
• Model the errors: embed the human errors and recoveries in a logical framework with other system risks, such as hardware and software failures, environmental events, e.g: • Fault trees • Event trees
25

Fault tree notation
Consequence (TE)
Causes (A,B,C,D)
Gate
Intermediate event Gate
Basic events
Top Event
Cut Sets: (A,C,D) (B,C,D)
26

Fault tree for Zeebrugge ferry (1987)
27

28

Human error quantification Quantify the errors: • Several HRA techniques available • Provide a ’human error probability’ (HEP)
• Decide a nominal HEP based on task analysis
• Apply performance shaping factors (task analysis) • Model dependencies and recoveries
• Determine the overall effect on system safety or reliability
29

Human error probability • Human error probability (HEP) = Number of times an
error has occurred / Number of opportunities for an error to occur
• Nominal human error probability: the probability of failing a task before the effect of some context factors (PSFs) are taken into account • Basic task (THERP), e.g. reading an analogue meter: atomic
level of decomposition • “Generic” tasks (HEART). Match the task at issue with the
predefined categories: “Shift a system to new state without procedures”
• “Universal” HEP (SPAR-H): one for diagnosis (any) and one for action (any)
30

Impact assessment • Determine whether the overall level of risk is
unacceptable • The PSA as a whole has targets for overall risk
• Determine which ’human failure events’ (HFEs) contribute most to the level of risk • Look at the cut sets and the calculations of importance
• Choose targets for error reduction
31

Error reduction analysis
• Change the root cause • Change the ’performance-shaping factors’ (PSFs) • Assess the task again in context, use ergonomics/
engineering judgement and redesign
Recalculate the the system risk level and iterate until the risk is acceptable
32

Problems with HRA: data • Questionable numbers: where do they come from? • Human failures are considered ‘events’ (HFE) to be
observed and counted • Errors are not events to be observed: errors are divergences
of events from (expected) standards • For the equipment the standard is given by its design • Standards are different before and after the events
• The concept of failure is not central to HF research: • Focus on positive behavior - what is done and why - rather
than on not achieving some external goals - what is not done:
• Human-machine interfaces • Staffing • Fatigue and workload • Situation awareness
33

Problems with HRA: models • HRA techniques incorporate “reliability models”, i.e.
models of human performance 1. Mostly based on individual/micro cognition: e.g. skill, rule
and knowledge paradigm; the slips, lapses, and mistakes paradigm • Simulator studies point to macro-cognition
2. The context is treated in terms of independent factors (PSFs) • Simulator studies point to interrelated factors
3. Limited treatment of “crew- factors” i.e. factors explaining crew behavior • Simulator studies point to strong crew effects (variability)
34

Problems with HRA: process • HRA as part of PSA
• Often only a number generator
• HRA/PSA reports are made to comply regulatory requirements
• A lot of qualitative HF information from the analysis is not conveyed in the report
• HF departments cannot find the information they need in quantitative HRA reports
• HF information in methods is minimal • Human error is little informative • PSFs are generic • But rich task analysis
35

2nd generation HRA: MERMOS • Dynamic modeling • Joint-system perspective
• Failure is mismatch not information overload
• Focus on team not individual, attention/memory errors
• Close integration with HF • Rich inputs for error
identification and reduction • Qualitative insights
conveyed in the application • More than numbers in
PRA
36

HRA beyond PSA: MERMOS Safe Regulation Model
37

End of presentation
Animal Failure Event 156: Horse fails to be heavy enough
38