Embed Size (px)
Citation preview

Integrating direct and indirect load control for congestionmanagement in LV networksCitation for published version (APA):Haque, A. N. M. M., Nijhuis, M., Ye, G., Nguyen, H. P., Bliek, F. W., & Slootweg, J. G. (2019). Integrating directand indirect load control for congestion management in LV networks. IEEE Transactions on Smart Grid, 10(1),741-751. [8036218]. https://doi.org/10.1109/TSG.2017.2751743
DOI:10.1109/TSG.2017.2751743
Document status and date:Published: 01/01/2019
Document Version:Accepted manuscript including changes made at the peer-review stage
Please check the document version of this publication:
• A submitted manuscript is the version of the article upon submission and before peer-review. There can beimportant differences between the submitted version and the official published version of record. Peopleinterested in the research are advised to contact the author for the final version of the publication, or visit theDOI to the publisher's website.• The final author version and the galley proof are versions of the publication after peer review.• The final published version features the final layout of the paper including the volume, issue and pagenumbers.Link to publication
General rightsCopyright and moral rights for the publications made accessible in the public portal are retained by the authors and/or other copyright ownersand it is a condition of accessing publications that users recognise and abide by the legal requirements associated with these rights.
• Users may download and print one copy of any publication from the public portal for the purpose of private study or research. • You may not further distribute the material or use it for any profit-making activity or commercial gain • You may freely distribute the URL identifying the publication in the public portal.
If the publication is distributed under the terms of Article 25fa of the Dutch Copyright Act, indicated by the “Taverne” license above, pleasefollow below link for the End User Agreement:www.tue.nl/taverne
Take down policyIf you believe that this document breaches copyright please contact us at:[email protected] details and we will investigate your claim.
Download date: 28. Jan. 2022
1
Integrating Direct and Indirect Load Control forCongestion Management in LV Networks
A.N.M.M. Haque∗§, Student Member, IEEE, M. Nijhuis∗, Member, IEEE, G.Ye∗, Student Member, IEEE,P.H. Nguyen∗, Member, IEEE, F.W. Bliek‡, J.G. Slootweg∗†, Member, IEEE
Abstract—With the energy transition, capacity challenges areexpected to occur more frequently in low-voltage (LV) distribu-tion networks. In the literature, several direct and indirect loadcontrol methods have been suggested as solutions to alleviatenetwork congestion. Direct methods involve the network operatordirectly controlling appliances at the households, while indirectmethods aim to motivate end-users to shift their consumptionthrough price changes. In this research, the direct and indirectmethods are combined into an integrated approach, making useof the advantages of both methods. An agent-based architectureis adopted so that distributed and computational intelligence canbe combined to ensure a smooth coordination among the actors.A sensitivity-based curtailment scheme is used to incorporate theunbalanced loading condition of the LV networks. The efficiencyof the proposed integrated approach is investigated throughsimulations in the unbalanced IEEE European LV test feeder.Simulation results reveal up to 94% reduction in congestion bythe integrated approach, while maintaining the required levelsof supply in the network.
Index Terms—Congestion management, Demand response,Graceful degradation, Integrated approach
I. INTRODUCTION
CONGESTION or thermal overloading of network assets(e.g. lines, cables, transformers) is caused by power flows
exceeding its rated power. Frequent overloading affects thelifetime of network assets and necessitates a replacement ofthese assets involving a substantial cost. However, thermaloverloading can be mitigated by incorporating the flexibility inthe loads of the end-users through different direct and indirectcontrol methods [1]. The direct control methods involve theDSO directly controlling appliances of an individual end-user[2], [3], [4]. A graceful degradation method is proposed in [5],that enables the DSO to limit the power flows at connectionpoints based on predefined contractual agreements. However,concerns exist regarding the privacy and fairness of the use ofdirect control, since curtailment decisions need to distinguishamong the connected end-users. Since the residential end-usersare mostly equipped with a single phase connection, activepower curtailment may lead to a higher voltage unbalancefactor towards to the end of the feeder [6]. Moreover, from theperspective of a liberalized energy market, flexibility ideallyneeds to be procured through the market [1].
∗Department of Electrical Engineering, Eindhoven University of Technol-ogy, 5600 MB Eindhoven, The Netherlands†Enexis B.V., 5201 AW s-Hertogenbosch, The Netherlands‡DNV GL Energy, 9704 CA Groningen, The Netherlands§Corresponding author: [email protected] work is supported by the Netherlands Enterprise Agency (RvO), under
the project ’Universal Smart Grids Energy Framework.’
Contrary to the direct control, the indirect control mo-tivates end-users with market-controlled Demand Response(DR) mechanisms through different price-based schemes in-cluding day-ahead dynamic tariffs, time-of-use (ToU) pricing,critical peak pricing (CPP), real-time pricing (RTP) etc [7],[8]. Different types of locational marginal price (LMP) ordistribution congestion price (DCP) have been investigated inorder to address the problem of thermal constraint violationsin distribution networks [9], [10]. However, market-basedmethods essentially depend on the willingness and availabilityof demand flexibility and are therefore may not be ableto resolve the congestions completely. To this end, a directcontrol approach can complement market-based schemes toenhance the overall flexibility in the network significantly[5]. Application of both direct and indirect control for real-time congestion management has been investigated in [8].The dynamic thermal model of the transformer has beenused quantify the cost incurred due to overloading. ThePowerMatcher scheme is used to coordinate the entities andprocure flexibility to alleviate the overloading cost. A uniformcurtailment scheme has been adopted to limit connectioncapacity when congestion cannot be resolved through themarket. A local market framework incorporating day-aheadand real-time operations is proposed in [11] that aims tominimize the cost for network support through voluntaryand compulsory participation of the prosumers. A spatiallydistributed hierarchical control architecture is discussed in[12], that incorporates the network reconfiguration possibilitiesalong with market-based flexibility. An incentive-based DRprogram is used in [13] in order to determine optimal dispatchof a grid-connected microgrid providing flexibility services tothe network.
In this research, an integrated solution for day-ahead con-gestion management is defined by incorporating an advancedmarket-based mechanism with a graceful degradation methodbased on flexibility contracts. Specifically, a sensitivity-basedapproach is adopted to consider the impact of curtailment onthe voltage unbalance factor at the end of the feeder. Theintegrated approach combines the advantages of the direct andindirect control methods and ensures a more reliable operationof the network. The approach makes use of the distributedintelligence within an agent-based environment. A detailedcase study is performed on a modified IEEE European LV testnetwork in order to investigate the efficiency of the proposedapproach. The main contributions of the paper are as follows:
• an integrated approach of congestion management com-
2
bining market-based demand response and direct loadcontrol methods is defined;
• a sensitivity-based scheme is proposed to incorporate theeffects of unbalanced loading in the LV networks;
• a smooth coordination is enabled through agent-baseddistributed architecture;
• flexible capacity arrangements are applied in order toidentify suitable curtailment locations.
The paper is organized as follows: Section II presents anoverview of the integrated approach along with the coordi-nation of the related entities followed by, Section III whichdescribes the mathematical formulation of the proposed ap-proach. Section IV provides the description of the test scenarioand the adopted assumptions. The simulation results are pre-sented and analyzed in Section V. Finally, the conclusions onthe application of the integrated approach are drawn in SectionVI.
II. INTEGRATED SCHEDULING APPROACH
A. Overview
With the growing implementation of advanced ICT in-frastructure and the increasing share of distributed energyresources (DERs) and flexible appliances in residential distri-bution networks, market-controlled operation involving small-scale prosumers has been drawing a significant research inter-est in recent years. Attempts have been made to incorporatethe flexibility of residential loads through transactive energyframeworks with varied scopes and aims [14]. Local flexibilityoriented market-based mechanisms have been shown to beone of the most promising alternatives for ancillary serviceslike overall system balancing [15], [16], [17] and networkcongestion management [18], [19]. However, in a market-controlled distribution network with a dominant share of price-responsive loads, the load of individual households tends tocoincide with each other. While the coincidence among thehouseholds is generally 0.2 [20], with price-responsive loadsthis can easily increase up to 0.6. This results in a higherpeak load of the network, and consequently in overloading ofnetwork assets [21].
In this work, we aim to incorporate an active power curtail-ment based graceful degradation mechanism with a market-based control scheme. This integrated approach allows thenetwork operator to address congestions, even when flexibilitycannot be procured from the market. The market controlmethod is designed by incorporating a dynamic day-aheadprice and is coordinated by a commercial market party suchas - an aggregator. Aggregators are responsible for managingthe local flexibility in their cluster of contracted end-users andsupplying the DSO with a schedule of the loading for thefollowing day. In case congestion is expected, the dynamicprice levels are adjusted by the aggregator to shift flexibleloads in order to reduce the peak and in turn, alleviate thecongestion. In case the aggregators are not able to influencethe end-users with a suitable price signal, the DSO invokesthe graceful degradation mechanism to limit network access ofcertain users in terms of their contracted connection capacity.
As highlighted in [22], two distinct types of connectioncapacities can be identified, namely:• Firm-capacity: The non-curtailable part of the total con-
nection capacity. The firm-capacity cannot be curtailedby the DSO, and needs to be constantly maintained;
• Non-firm capacity: The curtailable share of the connec-tion capacity. The non-firm capacity is subject to curtail-ment upon availability based on contractual agreementsinvolving a maximum allowable duration and frequencyof curtailment per point of connection (POC). Throughthe inclusion of the maximum duration and frequency ofcurtailment some level of fairness is introduced and userscan voluntarily opt for being curtailed less or more often.
The application of the integrated approach hinges on a ro-bust and reliable communication among different actors inthe energy value chain. An agent-based distributed systemarchitecture is adopted in this research that provides for anefficient platform for smooth and reliable coordination amongthe related actors. An overview of the distributed architectureand associated interactions are presented in Section II-B.
B. Distributed coordination
1) System architecture: A hierarchical agent-based archi-tecture is adopted in this research, comprising of deviceagents, household agents, an aggregator agent and a networkagent. All of the loads and DG units connected in the LVnetwork are represented by device agents (DAs). The DAsare responsible for the optimization of related appliancesbased on the price signals and internal constraints. DAs arecoordinated by a household agent (HA) that interacts with theexternal market and network agents through an aggregator.The aggregator coordinates the contracted prosumers throughdynamic prices and supports the network operator with theflexibility of the end-users in its portfolio. In addition, thetransformer agent (TA) is implemented as a network agent tomonitor and control the MV/LV transformer. The agent-basedenvironment allows the system to be highly scalable, sincemore end-users and more appliances can be easily integratedin terms of new agents. At the same time, the environmentcan be expanded to wider network segments by includingmore MV/LV transformers in terms of additional TAs. A moredetailed description of the system architecture can be foundin [21].
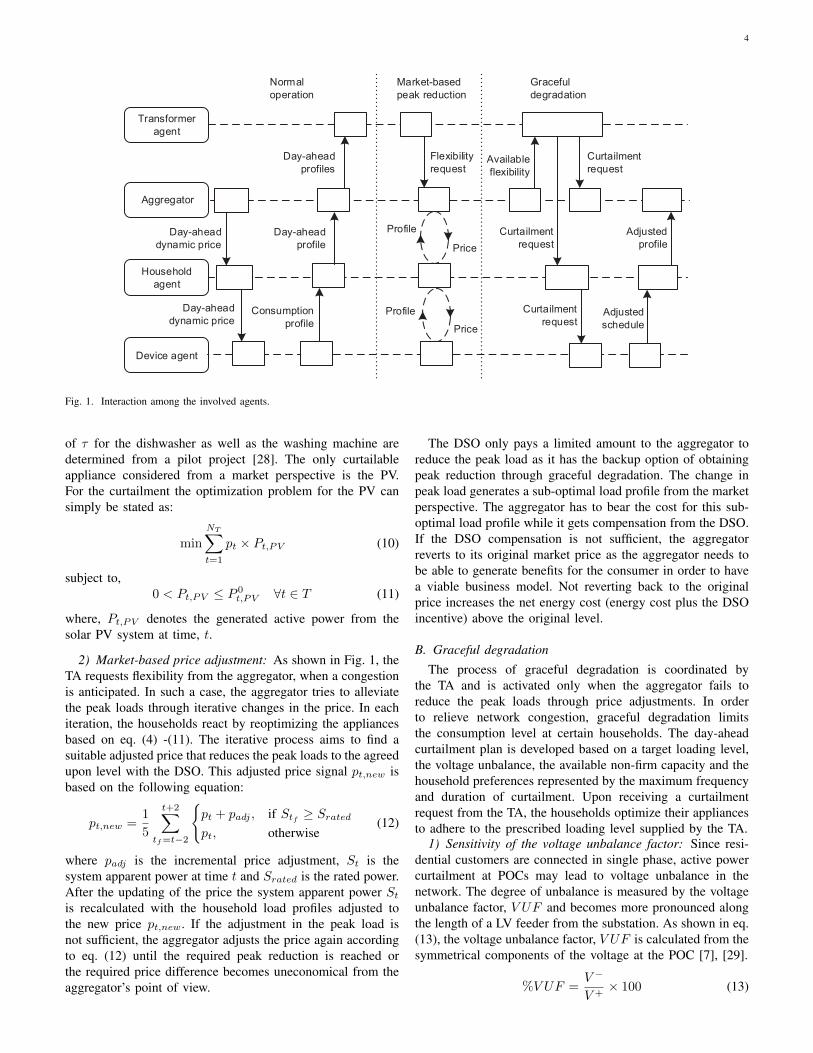
2) Interaction: The interaction among the agents is graph-ically presented by means of a UML sequence diagram inFig. 1. The process of the integrated approach starts with theDAs preparing the projected consumption based on the day-ahead price supplied by the aggregator. The HA combines thedevice profiles into the day-ahead household profile and sendsit to the aggregator. The day-ahead load profile of house, icomprises of the flexible load, P iflex and uncontrollable baseload, P ibase. Since the flexible load comprises of buffered andtime shifting appliances, P iflex is given by,
P iflex =
n(Abf )∑a=1,a∈Abf
P it,a +
n(Ats)∑a=1,a∈Ats
P it,a ∀t ∈ T, i ∈ H (1)
3
where, P it,a indicates the consumed power at time, t by thea-th appliance, while H , T , Abf and Ats denote the sets of allhouseholds, time steps, buffered and time shifting appliancesrespectively.
The load profiles are subsequently forwarded to the TAfor a network congestion analysis. In case congestion isexpected, the TA requests the aggregator for flexibility duringthe time when the congestion occurs. Following the request,the aggregator runs an iterative process to try and procurethe desired flexibility from the HAs by adjusting the dynamicprice. An adjusted price is communicated to the HAs, whoin turn send back an adjusted load profile. In case the priceadjustment fails to reduce the network load to the associatedlimits, the TA overrules the market and runs the process ofgraceful degradation to determine curtailment plan for thenext day. The curtailment plan includes the information ofthe time, location and amount of active power curtailment inthe network. Based on the developed plan, the TA sends thecurtailment signal to the HAs directly. Finally, related HAsreoptimize their appliances based on the imposed curtailmentconstraints.
III. MODELING
The modeling of the integrated approach of day-aheadcongestion management consists of two parts, the market-based demand response modeling and the modeling of thegraceful degradation. Both of the options require the useof household load data on the appliance level, as the levelof flexibility differs depending on the type of appliance. Inorder to generate the load curves of the appliances in ahousehold, a bottom-up Markov Chain Monte Carlo approachto the household load modeling is applied [23]. Based onthis approach the preferential household load curve can bedetermined comprising of different devices. Subsequently thehousehold load is subjected to the dynamic price from theaggregator. How the appliances in the household react to adynamic price is discussed in the next section.
A. Market-based demand response
As discussed in Section II, the market-based control in-volves interactions between the aggregator and the household,where the households respond to the dynamic price sent bythe aggregator by adjusting the initial load profile. The priceis later altered, if a congestion is expected. First, the responseof the devices to the price signals is elaborated, followed byan explanation of the adjustment of price levels.
1) Appliance response modeling: Each household has mul-tiple types of appliances which will react differently to achange in price. Four different types of appliances can bedistinguished: non-controllable appliances, time shifting ap-pliances, buffer appliances and curtailable appliances [24].The main flexible appliances (EV, PV, heat pump, washingmachine, fridge, and dishwasher) in the household are char-acterized as one of these types of loads. The other appliancesare considered to be non-controllable and will not be affectedby the dynamic price. The household tries to limit the costof energy by changing the scheduled operation based on
the dynamic price. This can be expressed by the followingoptimization problem:
min
|A|∑a=1
NT∑t=1
pt × Pt,a (2)
where A is the set of all appliances within a single household,NT the number of time steps in a day and pt the price at timet and Pt,a the power of appliance a at time t. The appliancescheduling which needs to be optimized covers two groupsof appliances: time shifting and buffered appliances [25]. Forthe different groups of appliances it can be assumed that thereenergy use is independent of one another, allowing eq. (2) tobe rewritten as:
|A|∑a=1
min
NT∑t=1
pt × Pt,a (3)
The optimization of the appliances can now be defined forthe two main groups of appliances. The buffered appliancesfollow the following optimization:
min
NT∑t
pt × Pt,a ∀a ∈ Abf (4)
subject to,t=k∑k+xa
Pt,a =
t=k∑k+xa
P 0t,a ∀a ∈ Abf , k ∈ T (5)
minTP 0t,a < Pt,a < max
TP 0t,a ∀a ∈ Abf , t ∈ T (6)
where xa is the maximum buffer time for appliance a, P 0t,a
the original load of appliance a at time t, T the set of thetime steps in a day and Abf the set of buffer appliances. Withthis optimization, the energy usage of the appliance is keptconstant. Through the constraint in eq. (5), only the energyuse within a predetermined amount of time xa can be alteredfrom the original energy usage Pt,a. The value of xa shouldbe determined for the different appliances. For the freezer andthe refrigerator the value of xa is estimated based on [26], forthe heat pump the value of xa is taken from [27] and for theEV the value of xa is determined by the leaving time of theEV. For the time shifting appliances the optimization can bewritten as:
min
NT∑t=1
pt × Pt+τ,a ∀a ∈ Ats (7)
subject to,NT∑t=1
Pt,a =
NT∑t=1
Pt+τ,a ∀a ∈ Ats (8)
τmin,a < τ < τmax,a ∀a ∈ Ats (9)
where τ is the time shift of the appliance, τmina and τmaxa
the limits of the maximum allowable time shift and Ats theset of all time shifting appliances. For the optimization ofthe time shifting appliances the time shift τ is the decisionvariable rather than the power at each time instant. The limits
4
Aggregator
Device agent
Household agent
Transformer agent
Day-ahead dynamic price
Day-ahead dynamic price
Day-ahead profile
Day-ahead profiles
Consumption profile
Flexibility request
Price
Profile
Price
Profile
Available flexibility
Curtailment request
Curtailment request
Curtailment request
Adjusted profile
Adjusted schedule
Normal operation
Market-basedpeak reduction
Graceful degradation
Fig. 1. Interaction among the involved agents.
of τ for the dishwasher as well as the washing machine aredetermined from a pilot project [28]. The only curtailableappliance considered from a market perspective is the PV.For the curtailment the optimization problem for the PV cansimply be stated as:
min
NT∑t=1
pt × Pt,PV (10)
subject to,0 < Pt,PV ≤ P 0
t,PV ∀t ∈ T (11)
where, Pt,PV denotes the generated active power from thesolar PV system at time, t.
2) Market-based price adjustment: As shown in Fig. 1, theTA requests flexibility from the aggregator, when a congestionis anticipated. In such a case, the aggregator tries to alleviatethe peak loads through iterative changes in the price. In eachiteration, the households react by reoptimizing the appliancesbased on eq. (4) -(11). The iterative process aims to find asuitable adjusted price that reduces the peak loads to the agreedupon level with the DSO. This adjusted price signal pt,new isbased on the following equation:
pt,new =1
5
t+2∑tf=t−2
{pt + padj , if Stf ≥ Sratedpt, otherwise
(12)
where padj is the incremental price adjustment, St is thesystem apparent power at time t and Srated is the rated power.After the updating of the price the system apparent power Stis recalculated with the household load profiles adjusted tothe new price pt,new. If the adjustment in the peak load isnot sufficient, the aggregator adjusts the price again accordingto eq. (12) until the required peak reduction is reached orthe required price difference becomes uneconomical from theaggregator’s point of view.
The DSO only pays a limited amount to the aggregator toreduce the peak load as it has the backup option of obtainingpeak reduction through graceful degradation. The change inpeak load generates a sub-optimal load profile from the marketperspective. The aggregator has to bear the cost for this sub-optimal load profile while it gets compensation from the DSO.If the DSO compensation is not sufficient, the aggregatorreverts to its original market price as the aggregator needs tobe able to generate benefits for the consumer in order to havea viable business model. Not reverting back to the originalprice increases the net energy cost (energy cost plus the DSOincentive) above the original level.
B. Graceful degradationThe process of graceful degradation is coordinated by
the TA and is activated only when the aggregator fails toreduce the peak loads through price adjustments. In orderto relieve network congestion, graceful degradation limitsthe consumption level at certain households. The day-aheadcurtailment plan is developed based on a target loading level,the voltage unbalance, the available non-firm capacity and thehousehold preferences represented by the maximum frequencyand duration of curtailment. Upon receiving a curtailmentrequest from the TA, the households optimize their appliancesto adhere to the prescribed loading level supplied by the TA.
1) Sensitivity of the voltage unbalance factor: Since resi-dential customers are connected in single phase, active powercurtailment at POCs may lead to voltage unbalance in thenetwork. The degree of unbalance is measured by the voltageunbalance factor, V UF and becomes more pronounced alongthe length of a LV feeder from the substation. As shown in eq.(13), the voltage unbalance factor, V UF is calculated from thesymmetrical components of the voltage at the POC [7], [29].
%V UF =V −
V +× 100 (13)
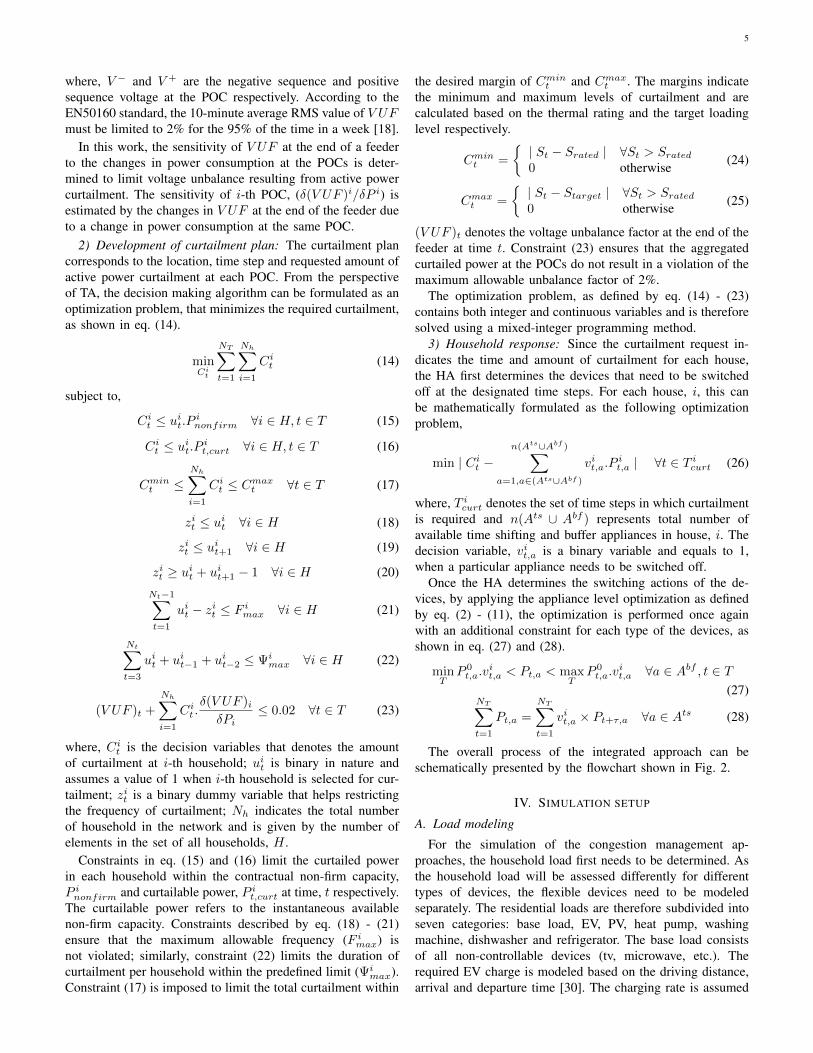
5
where, V − and V + are the negative sequence and positivesequence voltage at the POC respectively. According to theEN50160 standard, the 10-minute average RMS value of V UFmust be limited to 2% for the 95% of the time in a week [18].
In this work, the sensitivity of V UF at the end of a feederto the changes in power consumption at the POCs is deter-mined to limit voltage unbalance resulting from active powercurtailment. The sensitivity of i-th POC, (δ(V UF )i/δP i) isestimated by the changes in V UF at the end of the feeder dueto a change in power consumption at the same POC.
2) Development of curtailment plan: The curtailment plancorresponds to the location, time step and requested amount ofactive power curtailment at each POC. From the perspectiveof TA, the decision making algorithm can be formulated as anoptimization problem, that minimizes the required curtailment,as shown in eq. (14).
minCi
t
NT∑t=1
Nh∑i=1
Cit (14)
subject to,
Cit ≤ uit.P inonfirm ∀i ∈ H, t ∈ T (15)
Cit ≤ uit.P it,curt ∀i ∈ H, t ∈ T (16)
Cmint ≤Nh∑i=1
Cit ≤ Cmaxt ∀t ∈ T (17)
zit ≤ uit ∀i ∈ H (18)
zit ≤ uit+1 ∀i ∈ H (19)
zit ≥ uit + uit+1 − 1 ∀i ∈ H (20)
Nt−1∑t=1
uit − zit ≤ F imax ∀i ∈ H (21)
Nt∑t=3
uit + uit−1 + uit−2 ≤ Ψimax ∀i ∈ H (22)
(V UF )t +
Nh∑i=1
Cit .δ(V UF )iδPi
≤ 0.02 ∀t ∈ T (23)
where, Cit is the decision variables that denotes the amountof curtailment at i-th household; uit is binary in nature andassumes a value of 1 when i-th household is selected for cur-tailment; zit is a binary dummy variable that helps restrictingthe frequency of curtailment; Nh indicates the total numberof household in the network and is given by the number ofelements in the set of all households, H .
Constraints in eq. (15) and (16) limit the curtailed powerin each household within the contractual non-firm capacity,P inonfirm and curtailable power, P it,curt at time, t respectively.The curtailable power refers to the instantaneous availablenon-firm capacity. Constraints described by eq. (18) - (21)ensure that the maximum allowable frequency (F imax) isnot violated; similarly, constraint (22) limits the duration ofcurtailment per household within the predefined limit (Ψi
max).Constraint (17) is imposed to limit the total curtailment within
the desired margin of Cmint and Cmaxt . The margins indicatethe minimum and maximum levels of curtailment and arecalculated based on the thermal rating and the target loadinglevel respectively.
Cmint =
{| St − Srated | ∀St > Srated0 otherwise (24)
Cmaxt =
{| St − Starget | ∀St > Srated0 otherwise (25)
(V UF )t denotes the voltage unbalance factor at the end of thefeeder at time t. Constraint (23) ensures that the aggregatedcurtailed power at the POCs do not result in a violation of themaximum allowable unbalance factor of 2%.
The optimization problem, as defined by eq. (14) - (23)contains both integer and continuous variables and is thereforesolved using a mixed-integer programming method.
3) Household response: Since the curtailment request in-dicates the time and amount of curtailment for each house,the HA first determines the devices that need to be switchedoff at the designated time steps. For each house, i, this canbe mathematically formulated as the following optimizationproblem,
min | Cit −n(Ats∪Abf )∑
a=1,a∈(Ats∪Abf )
vit,a.Pit,a | ∀t ∈ T icurt (26)
where, T icurt denotes the set of time steps in which curtailmentis required and n(Ats ∪ Abf ) represents total number ofavailable time shifting and buffer appliances in house, i. Thedecision variable, vit,a is a binary variable and equals to 1,when a particular appliance needs to be switched off.
Once the HA determines the switching actions of the de-vices, by applying the appliance level optimization as definedby eq. (2) - (11), the optimization is performed once againwith an additional constraint for each type of the devices, asshown in eq. (27) and (28).
minTP 0t,a.v
it,a < Pt,a < max
TP 0t,a.v
it,a ∀a ∈ Abf , t ∈ T
(27)NT∑t=1
Pt,a =
NT∑t=1
vit,a × Pt+τ,a ∀a ∈ Ats (28)
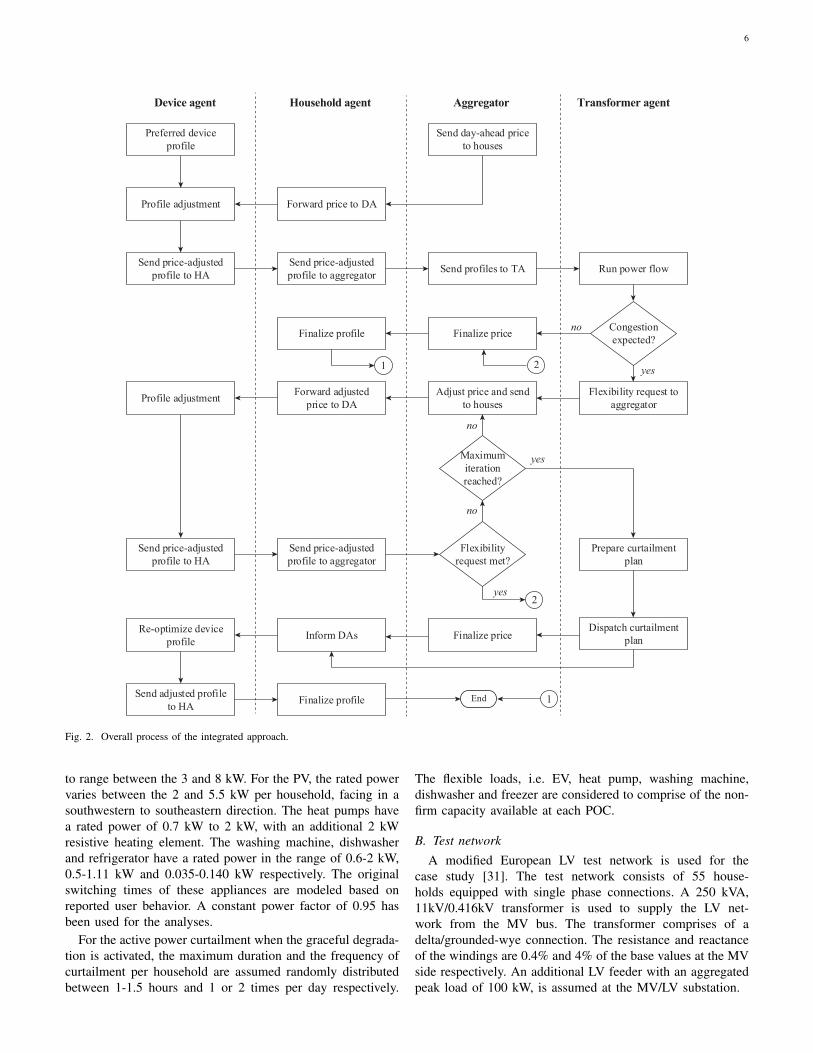
The overall process of the integrated approach can beschematically presented by the flowchart shown in Fig. 2.
IV. SIMULATION SETUP
A. Load modeling
For the simulation of the congestion management ap-proaches, the household load first needs to be determined. Asthe household load will be assessed differently for differenttypes of devices, the flexible devices need to be modeledseparately. The residential loads are therefore subdivided intoseven categories: base load, EV, PV, heat pump, washingmachine, dishwasher and refrigerator. The base load consistsof all non-controllable devices (tv, microwave, etc.). Therequired EV charge is modeled based on the driving distance,arrival and departure time [30]. The charging rate is assumed
6
Preferred device profile
Send day-ahead price to houses
Run power flow
Congestion expected?
Forward price to DAProfile adjustment
Send price-adjusted profile to aggregator Send profiles to TA
Flexibility request to aggregator
Adjust price and send to houses
Forward adjusted price to DAProfile adjustment
Send price-adjusted profile to aggregator
Flexibility request met?
Maximum iteration reached?
Prepare curtailment plan
Dispatch curtailment planInform DAsRe-optimize device
profile
Send adjusted profile to HA
Send price-adjusted profile to HA
Send price-adjusted profile to HA
Finalize priceFinalize profile
Finalize price
Finalize profile End
Device agent Household agent Aggregator Transformer agent
1
1
yes
yes
yes
no
no
no
2
2
Fig. 2. Overall process of the integrated approach.
to range between the 3 and 8 kW. For the PV, the rated powervaries between the 2 and 5.5 kW per household, facing in asouthwestern to southeastern direction. The heat pumps havea rated power of 0.7 kW to 2 kW, with an additional 2 kWresistive heating element. The washing machine, dishwasherand refrigerator have a rated power in the range of 0.6-2 kW,0.5-1.11 kW and 0.035-0.140 kW respectively. The originalswitching times of these appliances are modeled based onreported user behavior. A constant power factor of 0.95 hasbeen used for the analyses.
For the active power curtailment when the graceful degrada-tion is activated, the maximum duration and the frequency ofcurtailment per household are assumed randomly distributedbetween 1-1.5 hours and 1 or 2 times per day respectively.
The flexible loads, i.e. EV, heat pump, washing machine,dishwasher and freezer are considered to comprise of the non-firm capacity available at each POC.
B. Test networkA modified European LV test network is used for the
case study [31]. The test network consists of 55 house-holds equipped with single phase connections. A 250 kVA,11kV/0.416kV transformer is used to supply the LV net-work from the MV bus. The transformer comprises of adelta/grounded-wye connection. The resistance and reactanceof the windings are 0.4% and 4% of the base values at the MVside respectively. An additional LV feeder with an aggregatedpeak load of 100 kW, is assumed at the MV/LV substation.
7
C. Simulation platform
The simulation is performed with a time step of 15minutes. The agent-based simulation platform is developedand coordinated in MATLAB environment. The applianceresponse optimization problems in eq. (2)-(11) are solvedusing MATLAB Optimization Toolbox [32]. Based on theload profiles, the power flow calculation is performed usingthe EPRI distribution system simulator, OpenDSS [33]. Theoptimization problem associated with graceful degradationin eq. (14) - (23) is modeled using open-source MATLABtoolbox, YALMIP [34]. YALMIP supports rapid prototypingof optimization problems and uses an external optimizationsolver. In this research, the Gurobi Optimization solver is usedfor solving the mixed-integer problem discussed in SectionIII-B [35].
D. Determining the sensitivity of V UF
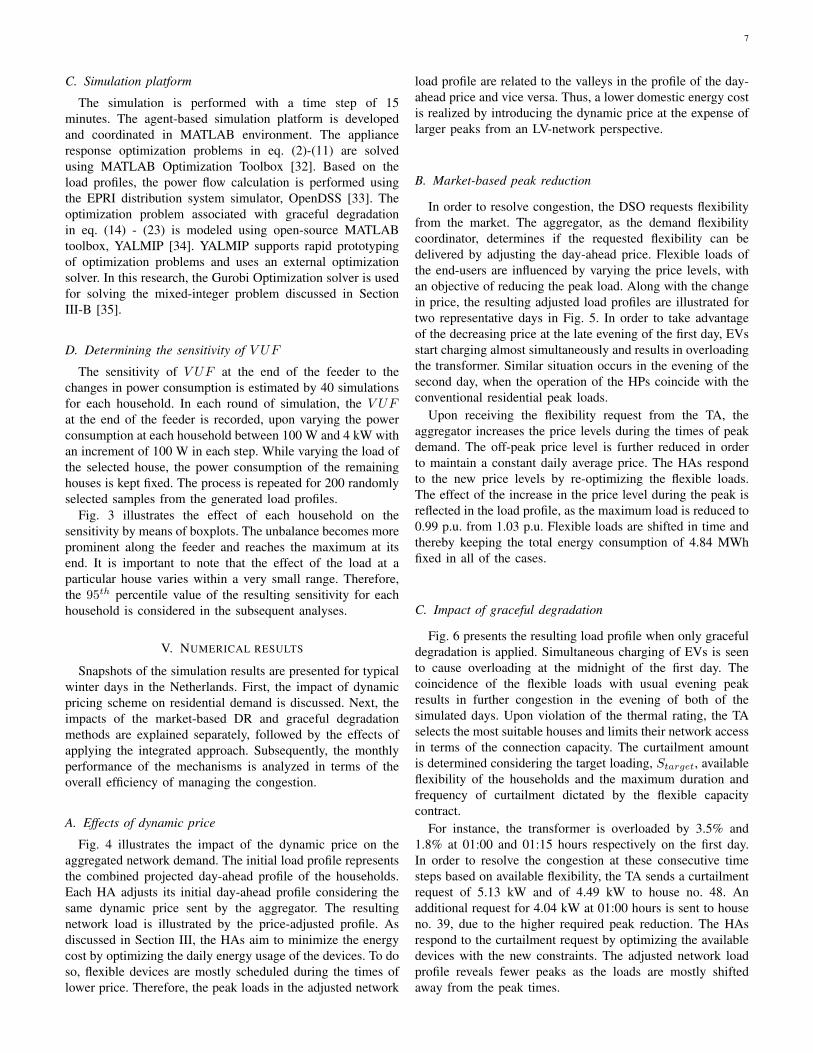
The sensitivity of V UF at the end of the feeder to thechanges in power consumption is estimated by 40 simulationsfor each household. In each round of simulation, the V UFat the end of the feeder is recorded, upon varying the powerconsumption at each household between 100 W and 4 kW withan increment of 100 W in each step. While varying the load ofthe selected house, the power consumption of the remaininghouses is kept fixed. The process is repeated for 200 randomlyselected samples from the generated load profiles.
Fig. 3 illustrates the effect of each household on thesensitivity by means of boxplots. The unbalance becomes moreprominent along the feeder and reaches the maximum at itsend. It is important to note that the effect of the load at aparticular house varies within a very small range. Therefore,the 95th percentile value of the resulting sensitivity for eachhousehold is considered in the subsequent analyses.
V. NUMERICAL RESULTS
Snapshots of the simulation results are presented for typicalwinter days in the Netherlands. First, the impact of dynamicpricing scheme on residential demand is discussed. Next, theimpacts of the market-based DR and graceful degradationmethods are explained separately, followed by the effects ofapplying the integrated approach. Subsequently, the monthlyperformance of the mechanisms is analyzed in terms of theoverall efficiency of managing the congestion.
A. Effects of dynamic price
Fig. 4 illustrates the impact of the dynamic price on theaggregated network demand. The initial load profile representsthe combined projected day-ahead profile of the households.Each HA adjusts its initial day-ahead profile considering thesame dynamic price sent by the aggregator. The resultingnetwork load is illustrated by the price-adjusted profile. Asdiscussed in Section III, the HAs aim to minimize the energycost by optimizing the daily energy usage of the devices. To doso, flexible devices are mostly scheduled during the times oflower price. Therefore, the peak loads in the adjusted network
load profile are related to the valleys in the profile of the day-ahead price and vice versa. Thus, a lower domestic energy costis realized by introducing the dynamic price at the expense oflarger peaks from an LV-network perspective.
B. Market-based peak reduction
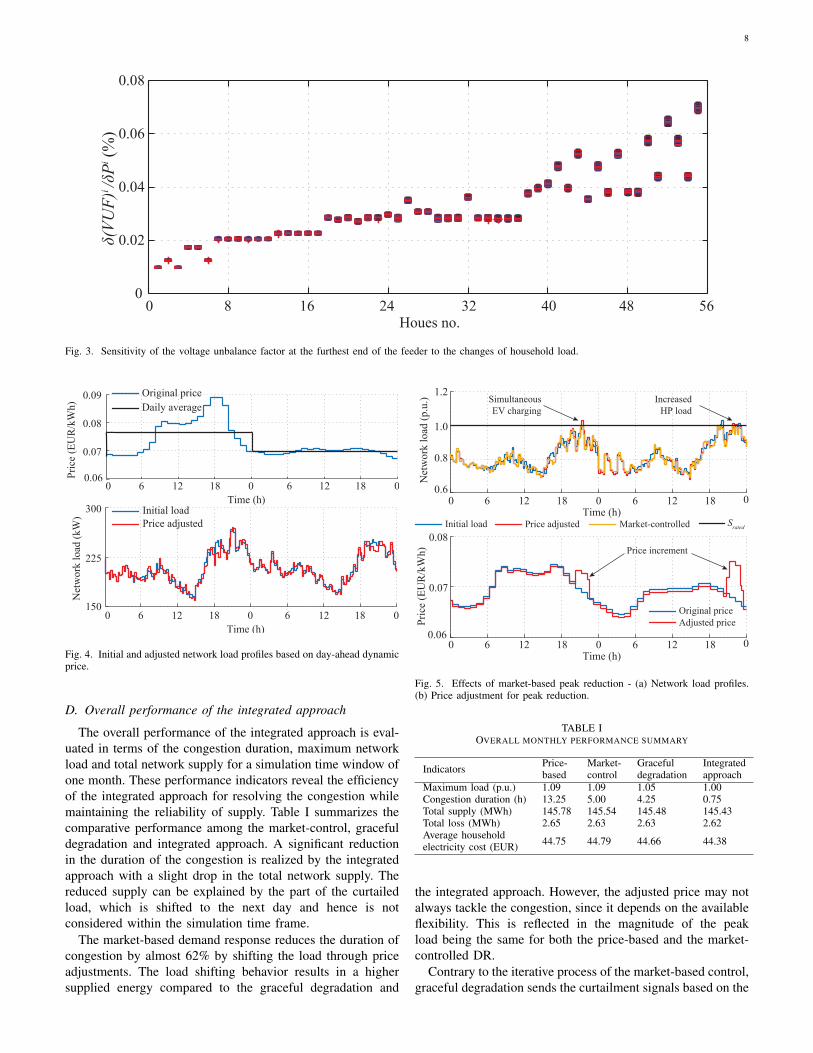
In order to resolve congestion, the DSO requests flexibilityfrom the market. The aggregator, as the demand flexibilitycoordinator, determines if the requested flexibility can bedelivered by adjusting the day-ahead price. Flexible loads ofthe end-users are influenced by varying the price levels, withan objective of reducing the peak load. Along with the changein price, the resulting adjusted load profiles are illustrated fortwo representative days in Fig. 5. In order to take advantageof the decreasing price at the late evening of the first day, EVsstart charging almost simultaneously and results in overloadingthe transformer. Similar situation occurs in the evening of thesecond day, when the operation of the HPs coincide with theconventional residential peak loads.
Upon receiving the flexibility request from the TA, theaggregator increases the price levels during the times of peakdemand. The off-peak price level is further reduced in orderto maintain a constant daily average price. The HAs respondto the new price levels by re-optimizing the flexible loads.The effect of the increase in the price level during the peak isreflected in the load profile, as the maximum load is reduced to0.99 p.u. from 1.03 p.u. Flexible loads are shifted in time andthereby keeping the total energy consumption of 4.84 MWhfixed in all of the cases.
C. Impact of graceful degradation
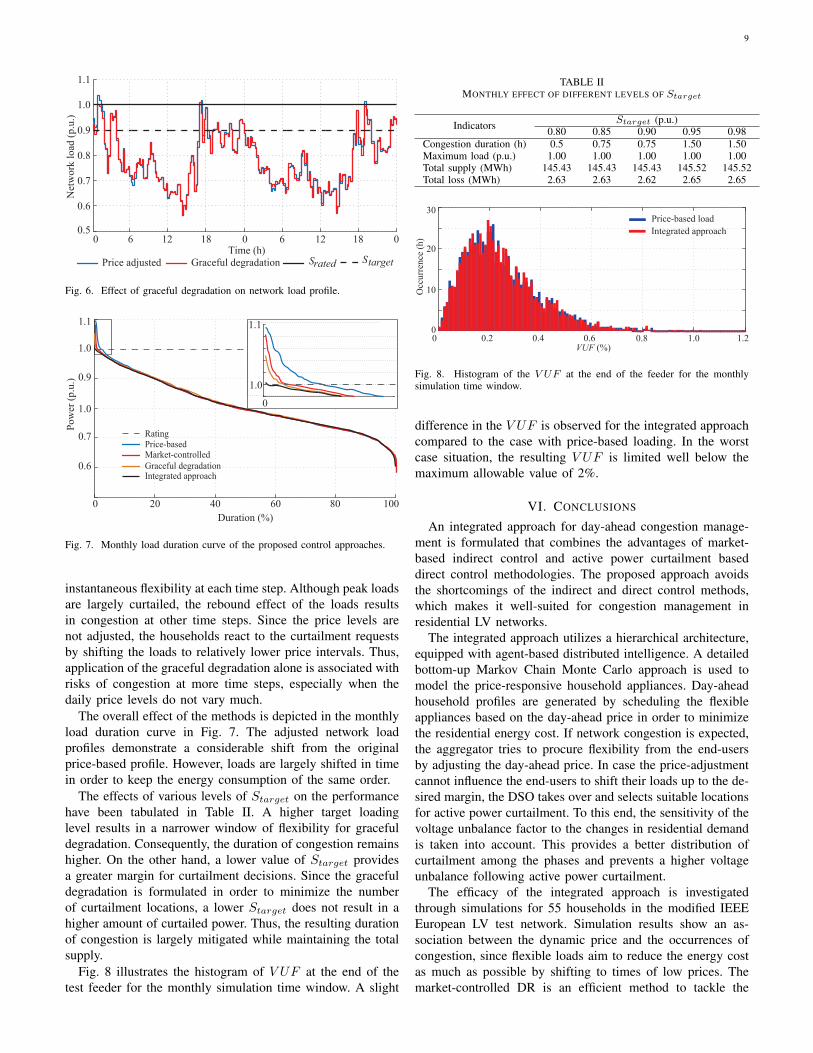
Fig. 6 presents the resulting load profile when only gracefuldegradation is applied. Simultaneous charging of EVs is seento cause overloading at the midnight of the first day. Thecoincidence of the flexible loads with usual evening peakresults in further congestion in the evening of both of thesimulated days. Upon violation of the thermal rating, the TAselects the most suitable houses and limits their network accessin terms of the connection capacity. The curtailment amountis determined considering the target loading, Starget, availableflexibility of the households and the maximum duration andfrequency of curtailment dictated by the flexible capacitycontract.
For instance, the transformer is overloaded by 3.5% and1.8% at 01:00 and 01:15 hours respectively on the first day.In order to resolve the congestion at these consecutive timesteps based on available flexibility, the TA sends a curtailmentrequest of 5.13 kW and of 4.49 kW to house no. 48. Anadditional request for 4.04 kW at 01:00 hours is sent to houseno. 39, due to the higher required peak reduction. The HAsrespond to the curtailment request by optimizing the availabledevices with the new constraints. The adjusted network loadprofile reveals fewer peaks as the loads are mostly shiftedaway from the peak times.
8
Houes no.16 24 32 40 48 56
0
0.02
0.04
0.06
0.08
δ(VUF)
i /δPi
(%)
0 8
Fig. 3. Sensitivity of the voltage unbalance factor at the furthest end of the feeder to the changes of household load.
Net
wor
k lo
ad (k
W)
150
225
300
12 18 12 18 00 06 6Time (h)
Initial loadPrice adjusted
Pric
e (E
UR
/kW
h)
0.06
0.07
0.08
0.09
12 18 12 18 00 06 6Time (h)
Original priceDaily average
Fig. 4. Initial and adjusted network load profiles based on day-ahead dynamicprice.
D. Overall performance of the integrated approach
The overall performance of the integrated approach is eval-uated in terms of the congestion duration, maximum networkload and total network supply for a simulation time window ofone month. These performance indicators reveal the efficiencyof the integrated approach for resolving the congestion whilemaintaining the reliability of supply. Table I summarizes thecomparative performance among the market-control, gracefuldegradation and integrated approach. A significant reductionin the duration of the congestion is realized by the integratedapproach with a slight drop in the total network supply. Thereduced supply can be explained by the part of the curtailedload, which is shifted to the next day and hence is notconsidered within the simulation time frame.
The market-based demand response reduces the duration ofcongestion by almost 62% by shifting the load through priceadjustments. The load shifting behavior results in a highersupplied energy compared to the graceful degradation and
Net
wor
k lo
ad (p
.u.)
0.6
0.8
1.0
1.2
Pric
e (E
UR
/kW
h)
0.06
0.07
0.08
12 18 12 18 00 06 6Time (h)
12 18 12 18 00 06 6Time (h)
Initial load Price adjusted Market-controlled Srated
Original priceAdjusted price
Price increment
SimultaneousEV charging
IncreasedHP load
Fig. 5. Effects of market-based peak reduction - (a) Network load profiles.(b) Price adjustment for peak reduction.
TABLE IOVERALL MONTHLY PERFORMANCE SUMMARY
Indicators Price-based
Market-control
Gracefuldegradation
Integratedapproach
Maximum load (p.u.) 1.09 1.09 1.05 1.00Congestion duration (h) 13.25 5.00 4.25 0.75Total supply (MWh) 145.78 145.54 145.48 145.43Total loss (MWh) 2.65 2.63 2.63 2.62Average householdelectricity cost (EUR) 44.75 44.79 44.66 44.38
the integrated approach. However, the adjusted price may notalways tackle the congestion, since it depends on the availableflexibility. This is reflected in the magnitude of the peakload being the same for both the price-based and the market-controlled DR.
Contrary to the iterative process of the market-based control,graceful degradation sends the curtailment signals based on the
9
Net
wor
k lo
ad (p
.u.)
0.5
0.6
0.7
0.8
0.9
1.0
1.1
Price adjusted Graceful degradation Srated Starget
12 18 12 18 00 06 6Time (h)
Fig. 6. Effect of graceful degradation on network load profile.
Duration (%)
Pow
er (p
.u.)
0
0.6
0.7
0.9
1.0
1.1
20 40 60 80 100
RatingPrice-basedMarket-controlled
Integrated approachGraceful degradation
1.1
1.0
01.0
Fig. 7. Monthly load duration curve of the proposed control approaches.
instantaneous flexibility at each time step. Although peak loadsare largely curtailed, the rebound effect of the loads resultsin congestion at other time steps. Since the price levels arenot adjusted, the households react to the curtailment requestsby shifting the loads to relatively lower price intervals. Thus,application of the graceful degradation alone is associated withrisks of congestion at more time steps, especially when thedaily price levels do not vary much.
The overall effect of the methods is depicted in the monthlyload duration curve in Fig. 7. The adjusted network loadprofiles demonstrate a considerable shift from the originalprice-based profile. However, loads are largely shifted in timein order to keep the energy consumption of the same order.
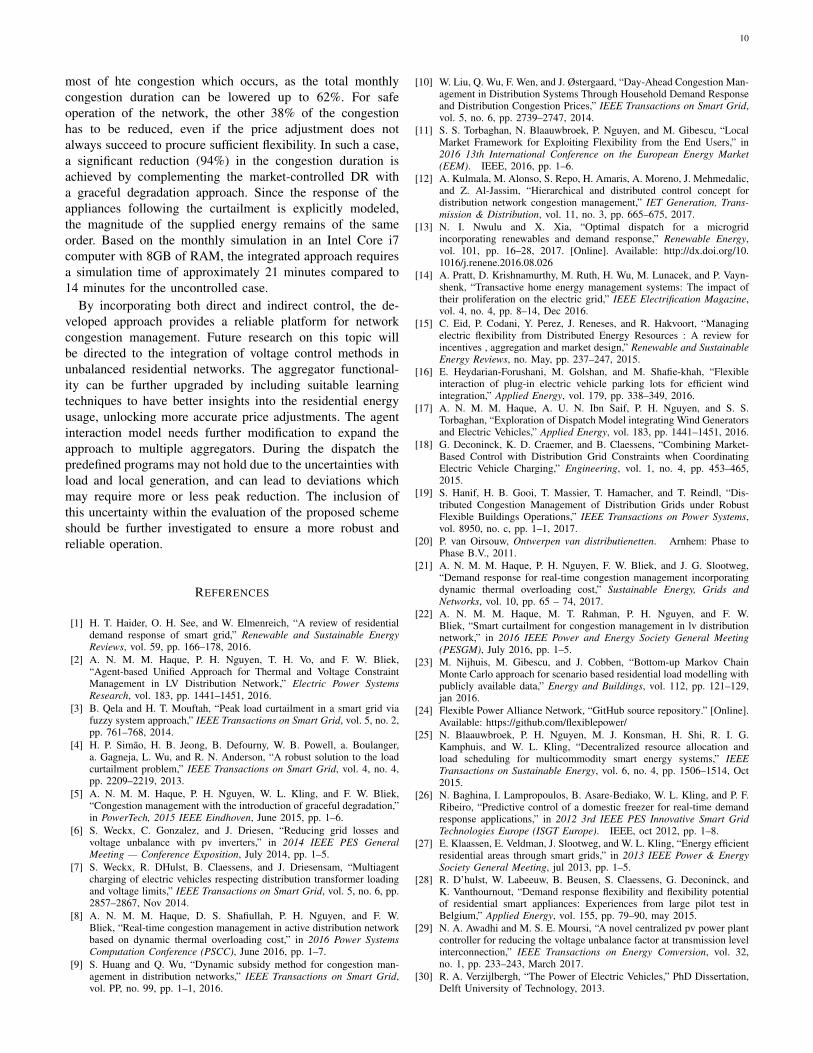
The effects of various levels of Starget on the performancehave been tabulated in Table II. A higher target loadinglevel results in a narrower window of flexibility for gracefuldegradation. Consequently, the duration of congestion remainshigher. On the other hand, a lower value of Starget providesa greater margin for curtailment decisions. Since the gracefuldegradation is formulated in order to minimize the numberof curtailment locations, a lower Starget does not result in ahigher amount of curtailed power. Thus, the resulting durationof congestion is largely mitigated while maintaining the totalsupply.
Fig. 8 illustrates the histogram of V UF at the end of thetest feeder for the monthly simulation time window. A slight
TABLE IIMONTHLY EFFECT OF DIFFERENT LEVELS OF Starget
Indicators Starget (p.u.)0.80 0.85 0.90 0.95 0.98
Congestion duration (h) 0.5 0.75 0.75 1.50 1.50Maximum load (p.u.) 1.00 1.00 1.00 1.00 1.00Total supply (MWh) 145.43 145.43 145.43 145.52 145.52Total loss (MWh) 2.63 2.63 2.62 2.65 2.65
VUF (%)0 0.2 0.4 0.6 0.8 1.0 1.2
Occ
urre
nce
(h)
0
10
20
30
Integrated approachPrice-based load
Fig. 8. Histogram of the V UF at the end of the feeder for the monthlysimulation time window.
difference in the V UF is observed for the integrated approachcompared to the case with price-based loading. In the worstcase situation, the resulting V UF is limited well below themaximum allowable value of 2%.
VI. CONCLUSIONS
An integrated approach for day-ahead congestion manage-ment is formulated that combines the advantages of market-based indirect control and active power curtailment baseddirect control methodologies. The proposed approach avoidsthe shortcomings of the indirect and direct control methods,which makes it well-suited for congestion management inresidential LV networks.
The integrated approach utilizes a hierarchical architecture,equipped with agent-based distributed intelligence. A detailedbottom-up Markov Chain Monte Carlo approach is used tomodel the price-responsive household appliances. Day-aheadhousehold profiles are generated by scheduling the flexibleappliances based on the day-ahead price in order to minimizethe residential energy cost. If network congestion is expected,the aggregator tries to procure flexibility from the end-usersby adjusting the day-ahead price. In case the price-adjustmentcannot influence the end-users to shift their loads up to the de-sired margin, the DSO takes over and selects suitable locationsfor active power curtailment. To this end, the sensitivity of thevoltage unbalance factor to the changes in residential demandis taken into account. This provides a better distribution ofcurtailment among the phases and prevents a higher voltageunbalance following active power curtailment.
The efficacy of the integrated approach is investigatedthrough simulations for 55 households in the modified IEEEEuropean LV test network. Simulation results show an as-sociation between the dynamic price and the occurrences ofcongestion, since flexible loads aim to reduce the energy costas much as possible by shifting to times of low prices. Themarket-controlled DR is an efficient method to tackle the
10
most of hte congestion which occurs, as the total monthlycongestion duration can be lowered up to 62%. For safeoperation of the network, the other 38% of the congestionhas to be reduced, even if the price adjustment does notalways succeed to procure sufficient flexibility. In such a case,a significant reduction (94%) in the congestion duration isachieved by complementing the market-controlled DR witha graceful degradation approach. Since the response of theappliances following the curtailment is explicitly modeled,the magnitude of the supplied energy remains of the sameorder. Based on the monthly simulation in an Intel Core i7computer with 8GB of RAM, the integrated approach requiresa simulation time of approximately 21 minutes compared to14 minutes for the uncontrolled case.
By incorporating both direct and indirect control, the de-veloped approach provides a reliable platform for networkcongestion management. Future research on this topic willbe directed to the integration of voltage control methods inunbalanced residential networks. The aggregator functional-ity can be further upgraded by including suitable learningtechniques to have better insights into the residential energyusage, unlocking more accurate price adjustments. The agentinteraction model needs further modification to expand theapproach to multiple aggregators. During the dispatch thepredefined programs may not hold due to the uncertainties withload and local generation, and can lead to deviations whichmay require more or less peak reduction. The inclusion ofthis uncertainty within the evaluation of the proposed schemeshould be further investigated to ensure a more robust andreliable operation.
REFERENCES
[1] H. T. Haider, O. H. See, and W. Elmenreich, “A review of residentialdemand response of smart grid,” Renewable and Sustainable EnergyReviews, vol. 59, pp. 166–178, 2016.
[2] A. N. M. M. Haque, P. H. Nguyen, T. H. Vo, and F. W. Bliek,“Agent-based Unified Approach for Thermal and Voltage ConstraintManagement in LV Distribution Network,” Electric Power SystemsResearch, vol. 183, pp. 1441–1451, 2016.
[3] B. Qela and H. T. Mouftah, “Peak load curtailment in a smart grid viafuzzy system approach,” IEEE Transactions on Smart Grid, vol. 5, no. 2,pp. 761–768, 2014.
[4] H. P. Simao, H. B. Jeong, B. Defourny, W. B. Powell, a. Boulanger,a. Gagneja, L. Wu, and R. N. Anderson, “A robust solution to the loadcurtailment problem,” IEEE Transactions on Smart Grid, vol. 4, no. 4,pp. 2209–2219, 2013.
[5] A. N. M. M. Haque, P. H. Nguyen, W. L. Kling, and F. W. Bliek,“Congestion management with the introduction of graceful degradation,”in PowerTech, 2015 IEEE Eindhoven, June 2015, pp. 1–6.
[6] S. Weckx, C. Gonzalez, and J. Driesen, “Reducing grid losses andvoltage unbalance with pv inverters,” in 2014 IEEE PES GeneralMeeting — Conference Exposition, July 2014, pp. 1–5.
[7] S. Weckx, R. DHulst, B. Claessens, and J. Driesensam, “Multiagentcharging of electric vehicles respecting distribution transformer loadingand voltage limits,” IEEE Transactions on Smart Grid, vol. 5, no. 6, pp.2857–2867, Nov 2014.
[8] A. N. M. M. Haque, D. S. Shafiullah, P. H. Nguyen, and F. W.Bliek, “Real-time congestion management in active distribution networkbased on dynamic thermal overloading cost,” in 2016 Power SystemsComputation Conference (PSCC), June 2016, pp. 1–7.
[9] S. Huang and Q. Wu, “Dynamic subsidy method for congestion man-agement in distribution networks,” IEEE Transactions on Smart Grid,vol. PP, no. 99, pp. 1–1, 2016.
[10] W. Liu, Q. Wu, F. Wen, and J. Østergaard, “Day-Ahead Congestion Man-agement in Distribution Systems Through Household Demand Responseand Distribution Congestion Prices,” IEEE Transactions on Smart Grid,vol. 5, no. 6, pp. 2739–2747, 2014.
[11] S. S. Torbaghan, N. Blaauwbroek, P. Nguyen, and M. Gibescu, “LocalMarket Framework for Exploiting Flexibility from the End Users,” in2016 13th International Conference on the European Energy Market(EEM). IEEE, 2016, pp. 1–6.
[12] A. Kulmala, M. Alonso, S. Repo, H. Amaris, A. Moreno, J. Mehmedalic,and Z. Al-Jassim, “Hierarchical and distributed control concept fordistribution network congestion management,” IET Generation, Trans-mission & Distribution, vol. 11, no. 3, pp. 665–675, 2017.
[13] N. I. Nwulu and X. Xia, “Optimal dispatch for a microgridincorporating renewables and demand response,” Renewable Energy,vol. 101, pp. 16–28, 2017. [Online]. Available: http://dx.doi.org/10.1016/j.renene.2016.08.026
[14] A. Pratt, D. Krishnamurthy, M. Ruth, H. Wu, M. Lunacek, and P. Vayn-shenk, “Transactive home energy management systems: The impact oftheir proliferation on the electric grid,” IEEE Electrification Magazine,vol. 4, no. 4, pp. 8–14, Dec 2016.
[15] C. Eid, P. Codani, Y. Perez, J. Reneses, and R. Hakvoort, “Managingelectric flexibility from Distributed Energy Resources : A review forincentives , aggregation and market design,” Renewable and SustainableEnergy Reviews, no. May, pp. 237–247, 2015.
[16] E. Heydarian-Forushani, M. Golshan, and M. Shafie-khah, “Flexibleinteraction of plug-in electric vehicle parking lots for efficient windintegration,” Applied Energy, vol. 179, pp. 338–349, 2016.
[17] A. N. M. M. Haque, A. U. N. Ibn Saif, P. H. Nguyen, and S. S.Torbaghan, “Exploration of Dispatch Model integrating Wind Generatorsand Electric Vehicles,” Applied Energy, vol. 183, pp. 1441–1451, 2016.
[18] G. Deconinck, K. D. Craemer, and B. Claessens, “Combining Market-Based Control with Distribution Grid Constraints when CoordinatingElectric Vehicle Charging,” Engineering, vol. 1, no. 4, pp. 453–465,2015.
[19] S. Hanif, H. B. Gooi, T. Massier, T. Hamacher, and T. Reindl, “Dis-tributed Congestion Management of Distribution Grids under RobustFlexible Buildings Operations,” IEEE Transactions on Power Systems,vol. 8950, no. c, pp. 1–1, 2017.
[20] P. van Oirsouw, Ontwerpen van distributienetten. Arnhem: Phase toPhase B.V., 2011.
[21] A. N. M. M. Haque, P. H. Nguyen, F. W. Bliek, and J. G. Slootweg,“Demand response for real-time congestion management incorporatingdynamic thermal overloading cost,” Sustainable Energy, Grids andNetworks, vol. 10, pp. 65 – 74, 2017.
[22] A. N. M. M. Haque, M. T. Rahman, P. H. Nguyen, and F. W.Bliek, “Smart curtailment for congestion management in lv distributionnetwork,” in 2016 IEEE Power and Energy Society General Meeting(PESGM), July 2016, pp. 1–5.
[23] M. Nijhuis, M. Gibescu, and J. Cobben, “Bottom-up Markov ChainMonte Carlo approach for scenario based residential load modelling withpublicly available data,” Energy and Buildings, vol. 112, pp. 121–129,jan 2016.
[24] Flexible Power Alliance Network, “GitHub source repository.” [Online].Available: https://github.com/flexiblepower/
[25] N. Blaauwbroek, P. H. Nguyen, M. J. Konsman, H. Shi, R. I. G.Kamphuis, and W. L. Kling, “Decentralized resource allocation andload scheduling for multicommodity smart energy systems,” IEEETransactions on Sustainable Energy, vol. 6, no. 4, pp. 1506–1514, Oct2015.
[26] N. Baghina, I. Lampropoulos, B. Asare-Bediako, W. L. Kling, and P. F.Ribeiro, “Predictive control of a domestic freezer for real-time demandresponse applications,” in 2012 3rd IEEE PES Innovative Smart GridTechnologies Europe (ISGT Europe). IEEE, oct 2012, pp. 1–8.
[27] E. Klaassen, E. Veldman, J. Slootweg, and W. L. Kling, “Energy efficientresidential areas through smart grids,” in 2013 IEEE Power & EnergySociety General Meeting, jul 2013, pp. 1–5.
[28] R. D’hulst, W. Labeeuw, B. Beusen, S. Claessens, G. Deconinck, andK. Vanthournout, “Demand response flexibility and flexibility potentialof residential smart appliances: Experiences from large pilot test inBelgium,” Applied Energy, vol. 155, pp. 79–90, may 2015.
[29] N. A. Awadhi and M. S. E. Moursi, “A novel centralized pv power plantcontroller for reducing the voltage unbalance factor at transmission levelinterconnection,” IEEE Transactions on Energy Conversion, vol. 32,no. 1, pp. 233–243, March 2017.
[30] R. A. Verzijlbergh, “The Power of Electric Vehicles,” PhD Dissertation,Delft University of Technology, 2013.

11
[31] IEEE PES Distribution Test Feeder Working Group, “Distributiontest feeders.” [Online]. Available: https://ewh.ieee.org/soc/pes/dsacom/testfeeders/
[32] “MATLAB Optimization Toolbox.” [Online]. Available: https://www.mathworks.com/products/optimization.html
[33] EPRI, “Opendss epri distribution system simulator.” [Online]. Available:https://sourceforge.net/projects/electricdss/
[34] J. Lofberg, “YALMIP : a toolbox for modeling and optimization inMATLAB,” 2004 IEEE International Conference on Robotics andAutomation (IEEE Cat. No.04CH37508), pp. 284–289, 2004.
[35] Gurobi, “Gurobi optimizer quick start guide,” 2016. [Online]. Available:http://www.gurobi.com