Embed Size (px)
Citation preview
Integrating Controlled Content with Weave
Visualizations
David PercyGeospatial Data Manager
PSU Institute for Metropolitan Studies
NNIP 2011 Spring- Detroit
I would have written a shorter letter, but I did not have the time. - Blaise Pascal
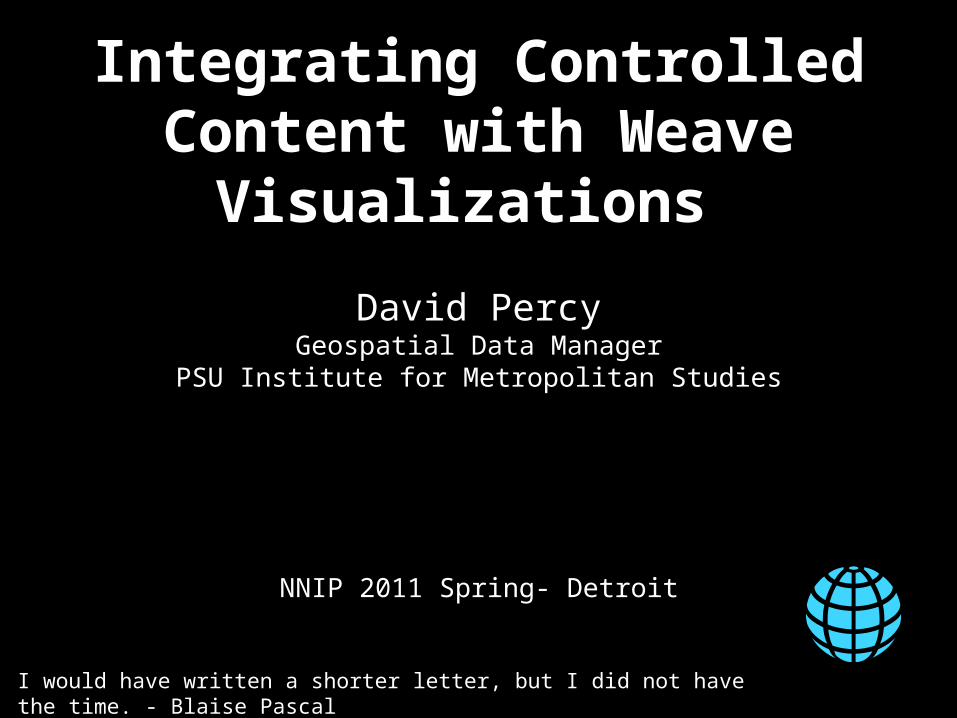
Greater Portland Vancouver Indicators
Regional Equity Atlas
Ecodistricts Assessment
Tools
Other, including Teaching and
Research
PSU Data Commons
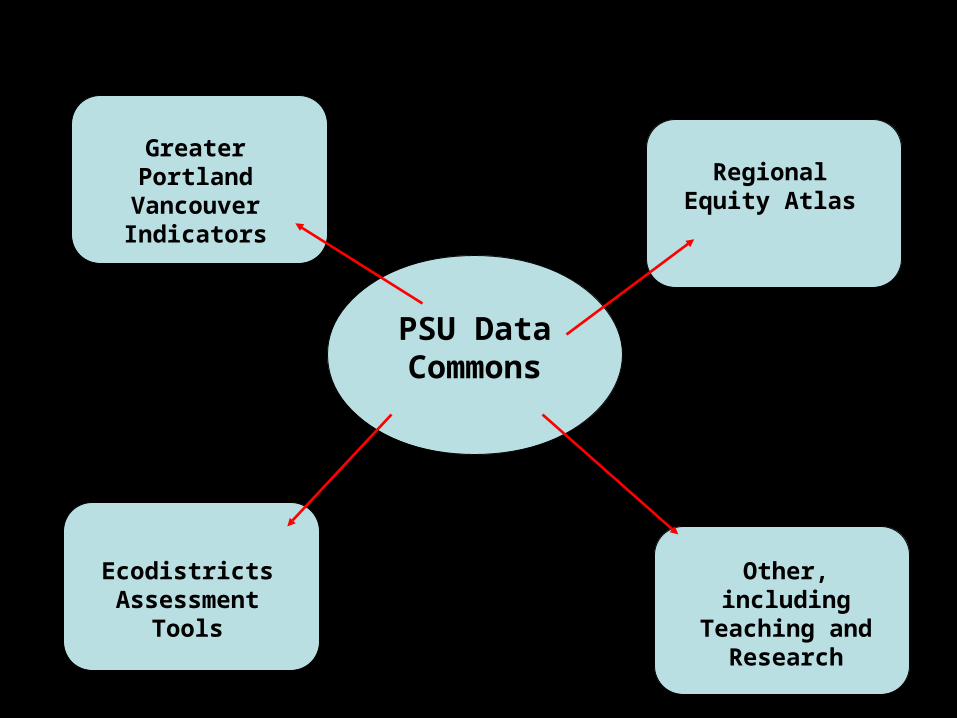
Geometries:
Census Tract
Zip code
Neighborhood,
Etc…
Each with a unique geometry id
Attribute data:
Geom_ID
Attribute_1
Attribute_2
Attribute_N
Examples: poverty, education, etc
Data Architecture
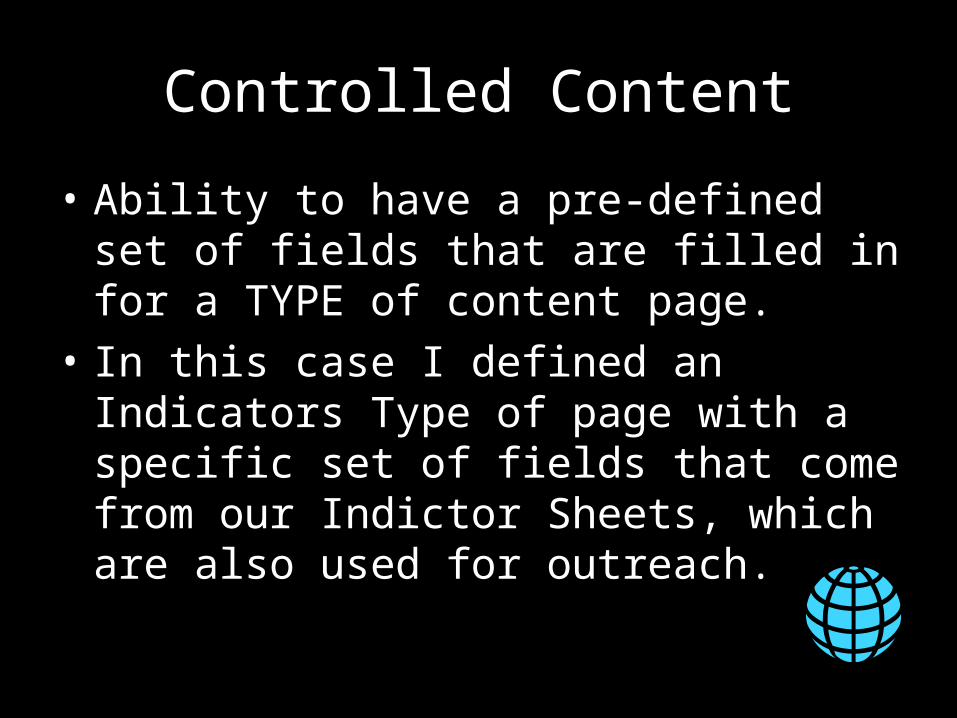
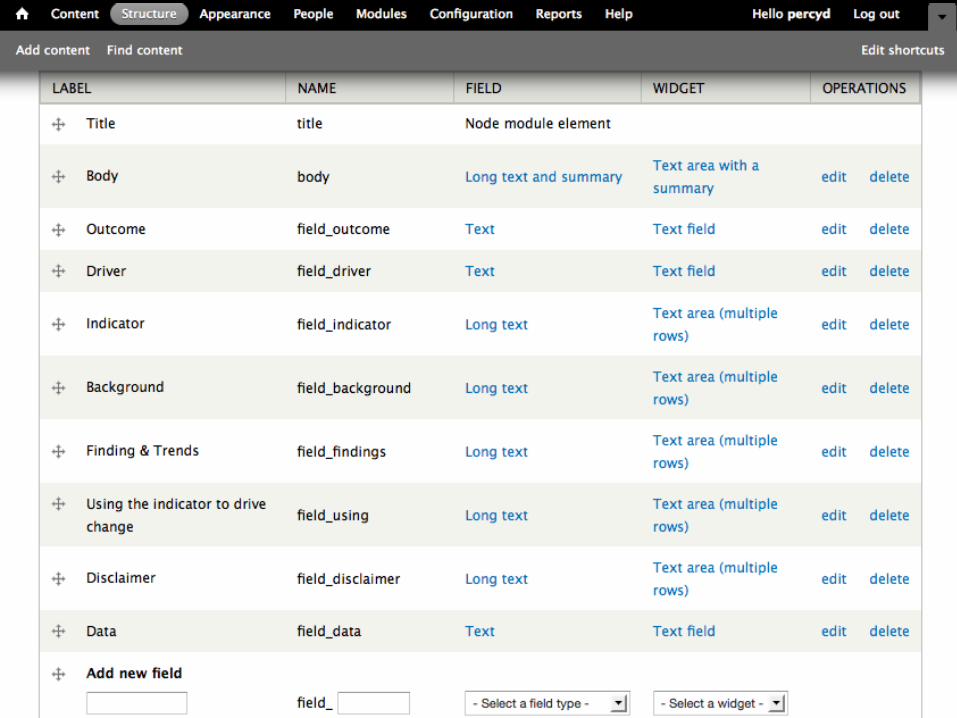
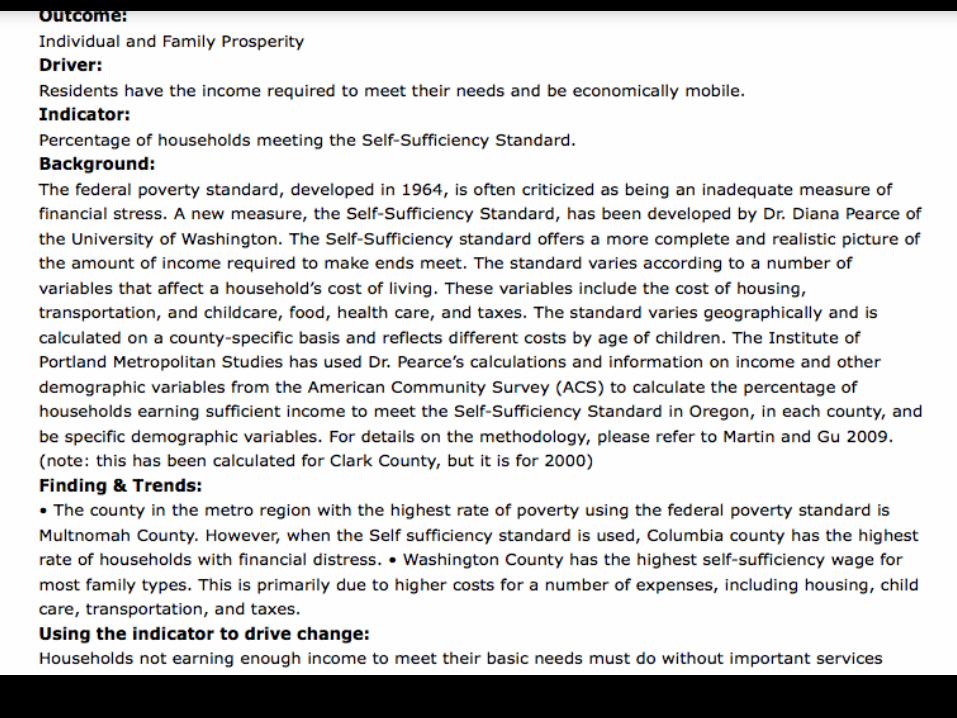
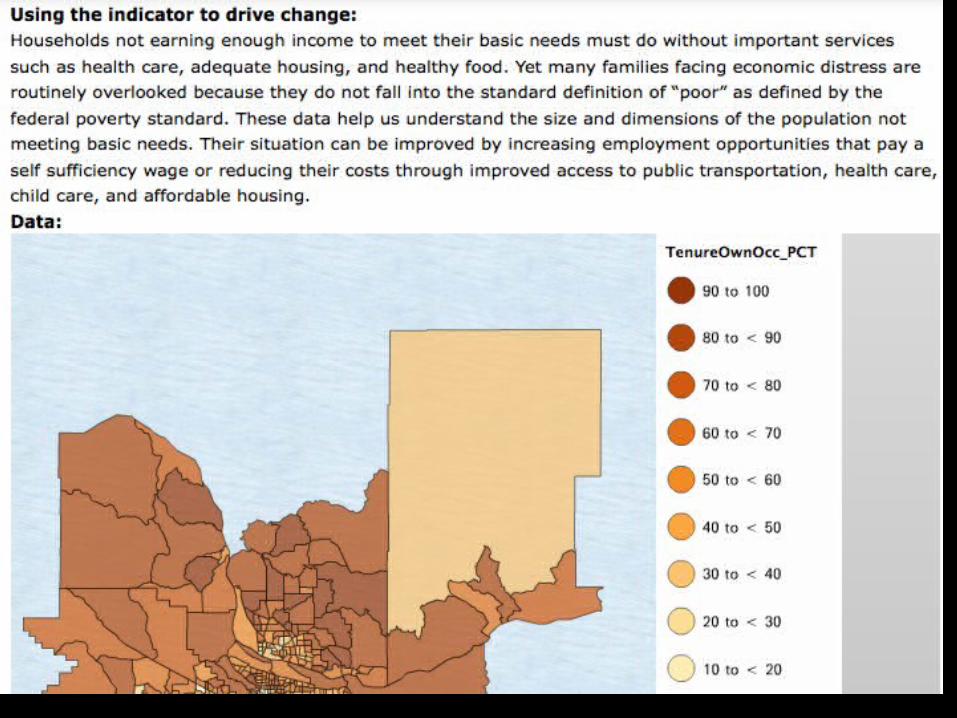
Controlled Content
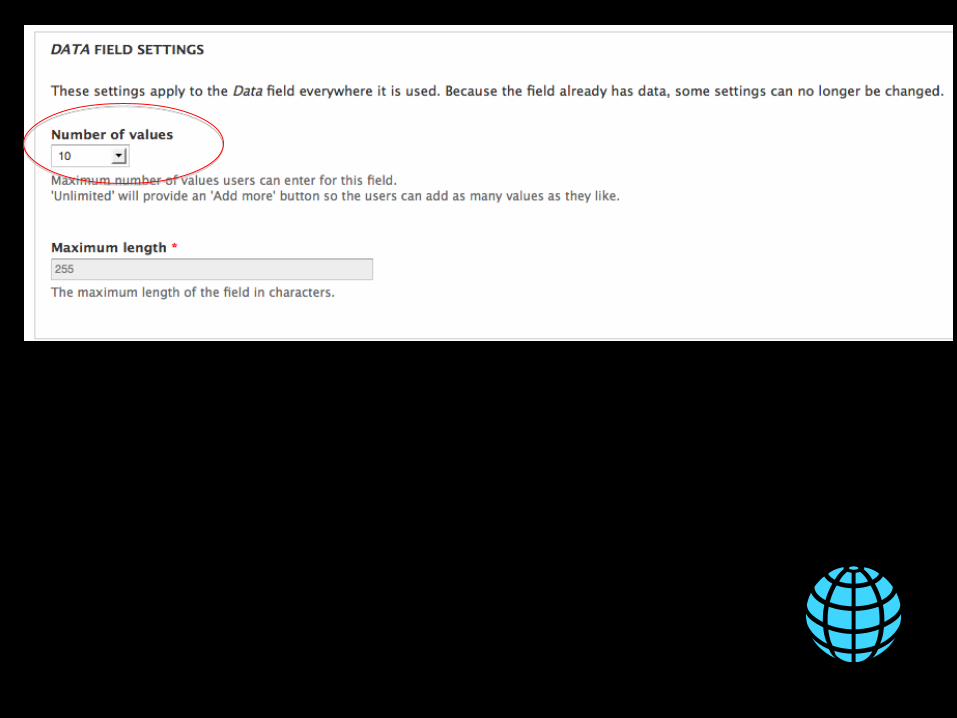
• Ability to have a pre-defined set of fields that are filled in for a TYPE of content page.
• In this case I defined an Indicators Type of page with a specific set of fields that come from our Indictor Sheets, which are also used for outreach.

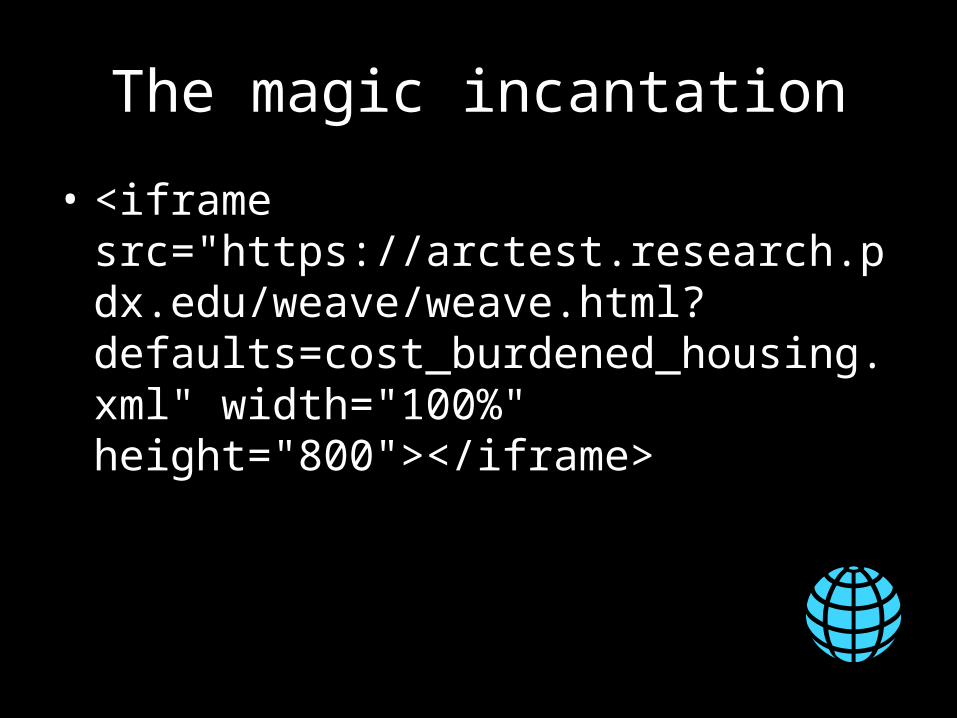
The magic incantation
• <iframe src="https://arctest.research.pdx.edu/weave/weave.html?defaults=cost_burdened_housing.xml" width="100%" height="800"></iframe>
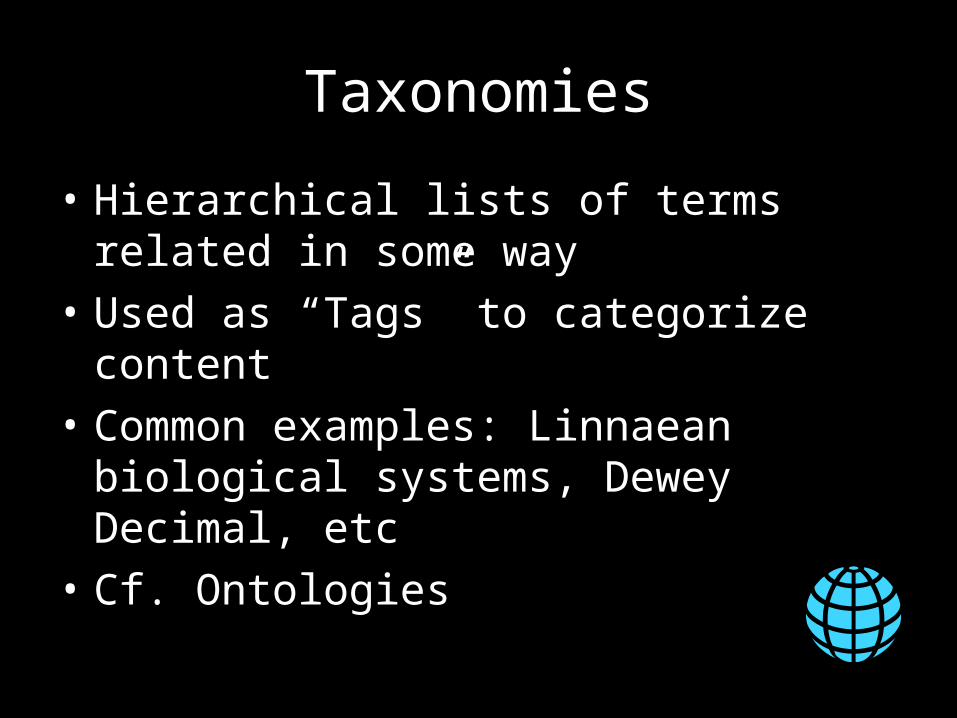
Taxonomies
• Hierarchical lists of terms related in some way
• Used as “Tags” to categorize content
• Common examples: Linnaean biological systems, Dewey Decimal, etc
• Cf. Ontologies
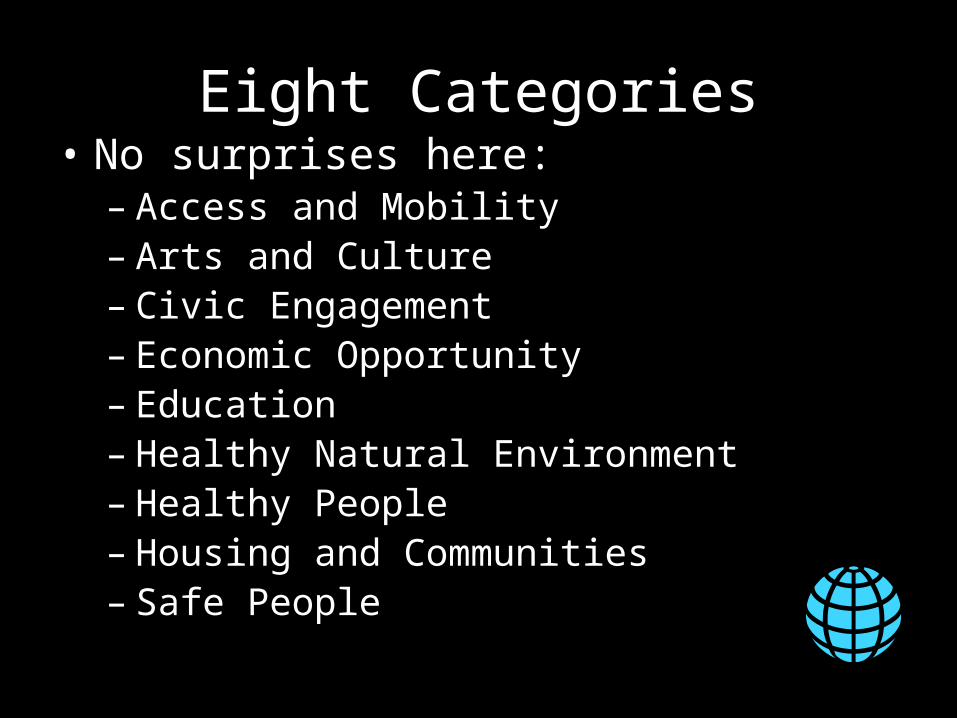
Eight Categories• No surprises here:
– Access and Mobility– Arts and Culture– Civic Engagement– Economic Opportunity– Education– Healthy Natural Environment– Healthy People– Housing and Communities– Safe People
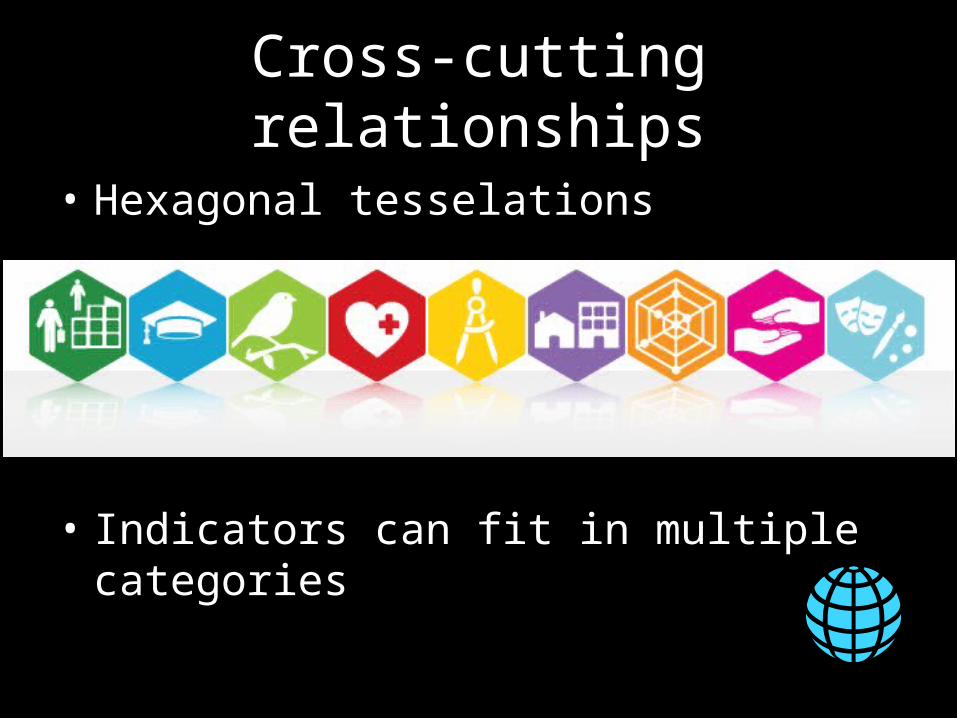
Cross-cutting relationships
• Hexagonal tesselations
• Indicators can fit in multiple categories
Modular Weave visualizations
• Each indicator visualization is created in Weave without “decoration”, no text description
• This allows the visualization to be used in multiple pages or applications
• Explanation of data is left to the containing page.
Web Services
• In order to share data with participating agencies, we use Open Geospatial Consortium (OGC) web services.
• WMS and WFS are the winners
• That’s a whole ‘nuther talk!
• Thanks!