Embed Size (px)
Citation preview
Ministry of the Environment and Energy DANIDA
Integrated Water Resource Management Strategies, Guidelines and Pilot Implementation in Three Water Management
Areas, South Africa
Output 8: Water Conservation and Demand Management Work Package 3: uMngeni Municipality Pilot Project
Volume 1: Study Report
Department of Water Affairs and Forestry South Africa
This report contains Carl Bro a|s restricted information DMM/WRP/PBA JOINT VENTURE and is for official use only. Ref. J. No. 123/138-0154 Date: April 2004
Table of contents 1. INTRODUCTION......................................................................................................................1
1.1. BACKGROUND.......................................................................................................................1 1.2. PURPOSE OF THIS REPORT.......................................................................................................1
2. OVERVIEW OF THE BUSINESS PLAN....................................................................................2 3. PILOT PROJECT......................................................................................................................4
3.1. OVERVIEW ............................................................................................................................4 3.2. PROJECT MANAGEMENT AND CO-ORDINATION ........................................................................4
3.2.1. Scope ............................................................................................................................4 3.2.2. Outputs .........................................................................................................................4 3.2.3. Comments .....................................................................................................................5
3.3. INTRODUCTION OF PROJECT AND SELECTION OF TRIAL AREAS..................................................5 3.3.1. Scope ............................................................................................................................5 3.3.2. Outputs .........................................................................................................................5 3.3.3. Comments .....................................................................................................................5
3.4. GIS / STRUCTURAL MODEL ....................................................................................................5 3.4.1. Scope ............................................................................................................................5 3.4.2. Outputs .........................................................................................................................5 3.4.3. Comments .....................................................................................................................6
3.5. CONSUMER REGISTER AND METERING ....................................................................................6 3.5.1. Scope ............................................................................................................................6 3.5.2. Outputs .........................................................................................................................6 3.5.3. Comments .....................................................................................................................6
3.6. SECTORISATION AND PRESSURE MANAGEMENT ......................................................................7 3.6.1. Scope ............................................................................................................................7 3.6.2. Outputs .........................................................................................................................7 3.6.3. Comments .....................................................................................................................7
3.7. ACTIVE LEAKAGE CONTROL...................................................................................................8 3.7.1. Scope ............................................................................................................................8 3.7.2. Outputs .........................................................................................................................8 3.7.3. Comments .....................................................................................................................8
3.8. PASSIVE LEAKAGE CONTROL..................................................................................................8 3.8.1. Scope ............................................................................................................................8 3.8.2. Outputs .........................................................................................................................8 3.8.3. Comments .....................................................................................................................9
3.9. CONSUMER USE REDUCTION...................................................................................................9 3.9.1. Scope ............................................................................................................................9 3.9.2. Outputs .........................................................................................................................9 3.9.3. Comments .....................................................................................................................9
3.10. REPORTING......................................................................................................................10 3.10.1. Scope ..........................................................................................................................10 3.10.2. Outputs .......................................................................................................................11 3.10.3. Comments ...................................................................................................................11
3.11. CAPACITY BUILDING .......................................................................................................11 3.11.1. Scope ..........................................................................................................................11 3.11.2. Outputs .......................................................................................................................11 3.11.3. Comments ...................................................................................................................11

UMNGENI MUNICIPALITY PILOT PROJECT STUDY REPORT
ii
4. RESOURCE DEPLOYMENT.................................................................................................12 4.1. INTRODUCTION....................................................................................................................12 4.2. BUDGETED RESOURCE ALLOCATION .....................................................................................12 4.3. ACTUAL RESOURCE ALLOCATION .........................................................................................13
5. SYSTEM PERFORMANCE RESULTS .................................................................................16 6. SUMMARY AND CONCLUSIONS........................................................................................18
UMNGENI MUNICIPALITY PILOT PROJECT STUDY REPORT
iii
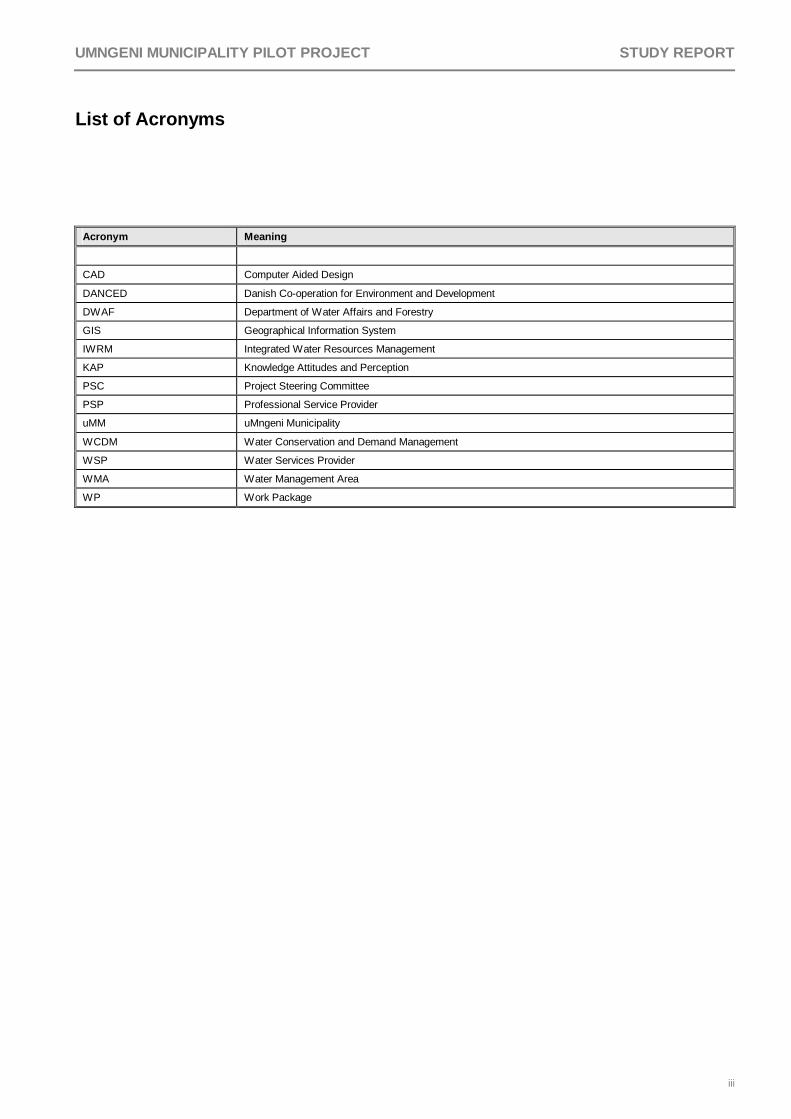
List of Acronyms
Acronym Meaning
CAD Computer Aided Design
DANCED Danish Co-operation for Environment and Development
DWAF Department of Water Affairs and Forestry
GIS Geographical Information System
IWRM Integrated Water Resources Management
KAP Knowledge Attitudes and Perception
PSC Project Steering Committee
PSP Professional Service Provider
uMM uMngeni Municipality
WCDM Water Conservation and Demand Management
WSP Water Services Provider
WMA Water Management Area
WP Work Package

1. INTRODUCTION
1.1. BACKGROUND
The Department of Water Affairs and Forestry (DWAF), in association with the Danish Co-operation for Environment and Development (DANCED) have initiated a number of studies to develop Integrated Water Resource Management (IWRM) strategies for specified Water Management Areas (WMA) in South Africa. The Township of Mpophomeni within the uMngeni Municipality (uMM) area of jurisdiction is the subject of this study. Mpophomeni is located about 10 km South-West of Howick along the R 617 road as is indicated in Figure 1.
DMM Environment and Water Resources, in association with WRP Consulting Engineers and Actus Integrated Management were appointed as the Professional Service Provider (PSP) to undertake the Pilot Project phase of this study.
The uMM is the appointed Water Service Provider (WSP) on behalf of the Umgungundlovu District Municipality. As such, the uMM has responsibility for water and sewerage services in the North-western area of the Mvoti to Mzimkulu WMA, the main urban areas being Howick, Hilton and Mpophomeni. The total population served is approximately 40,000. Umgeni Water, the local Water Board, supplies bulk water services to the uMM.
A Water Conservation and Demand Management (WCDM) situation assessment and a business plan for implementation of WCDM were prepared for uMM during a previous phase of this Integrated Water Resources and Management (IWRM), Work Package 2 (WP 2), Output 8 of the IWRM project. The situation assessment recommended a range of measures comprising both water saving measures and enabling works such as metering and information systems. The report was accepted by uMM and DWAF. This phase of the IWRM project (WP 3) comprised a pilot project to implement certain of the WCDM measures recommended in the Business Plan. The objective of the pilot project was to initiate a number of the recommended measures in the Mpophomeni supply area and to learn from that experience before embarking on implementation of the full Business Plan across the whole of the uMM area of jurisdiction. In addition, the pilot project was used to test and evaluate the WCDM strategies and guidelines developed under WP 1 of the IWRM Project.
The implementation of the pilot project involved routine maintenance activities undertaken by the uMM Technical Services Department, engineering and management activities undertaken by the PSP and physical works undertaken by emerging contractors.
1.2. PURPOSE OF THIS REPORT
uMngeni Municipality requested that a brief communication report be prepared to distil technical results into information for non-technical municipality personnel, councillors and stakeholders. The request was accepted and the Lead Consultant added their requirements for such a report, which has culminated in this Study Report (Volume 1). The technical aspects of the project are captured in a separate report (Volume 2). The purposes of this report were to :
• Summarise the main elements of the uMM WCDM Business Plan developed under WP 2;
• Provide an overview of the work undertaken and key results from the Pilot Project;
• Give an indication of the resources that were deployed in undertaking the Pilot Project; and
• Provide an account of the problems that were encountered and lessons learned during the implementation.
UMNGENI MUNICIPALITY PILOT PROJECT STUDY REPORT
2
2. OVERVIEW OF THE BUSINESS PLAN
The Business Plan for the five key areas within uMngeni Municipality was compiled under WP 2. These areas were Howick West, Merrivale, Mpophomeni, Howick and Hilton. The business plan provided the following:
• Identification of appropriate WCDM activities;
• Outline of the breakdown of work required for the implementation of each activity;
• The allocation of responsibilities for each activity; and
• Provisional estimates of cost to achieve implementation.
Mpophomeni was identified as an area that would benefit the most from the implementation of WCDM measures. Consequent thereof, WP 3 of the IWRM Project focused on Mpophomeni. However, generic procedures and awareness materials had to be developed so that they could be easily used / adapted to other areas.
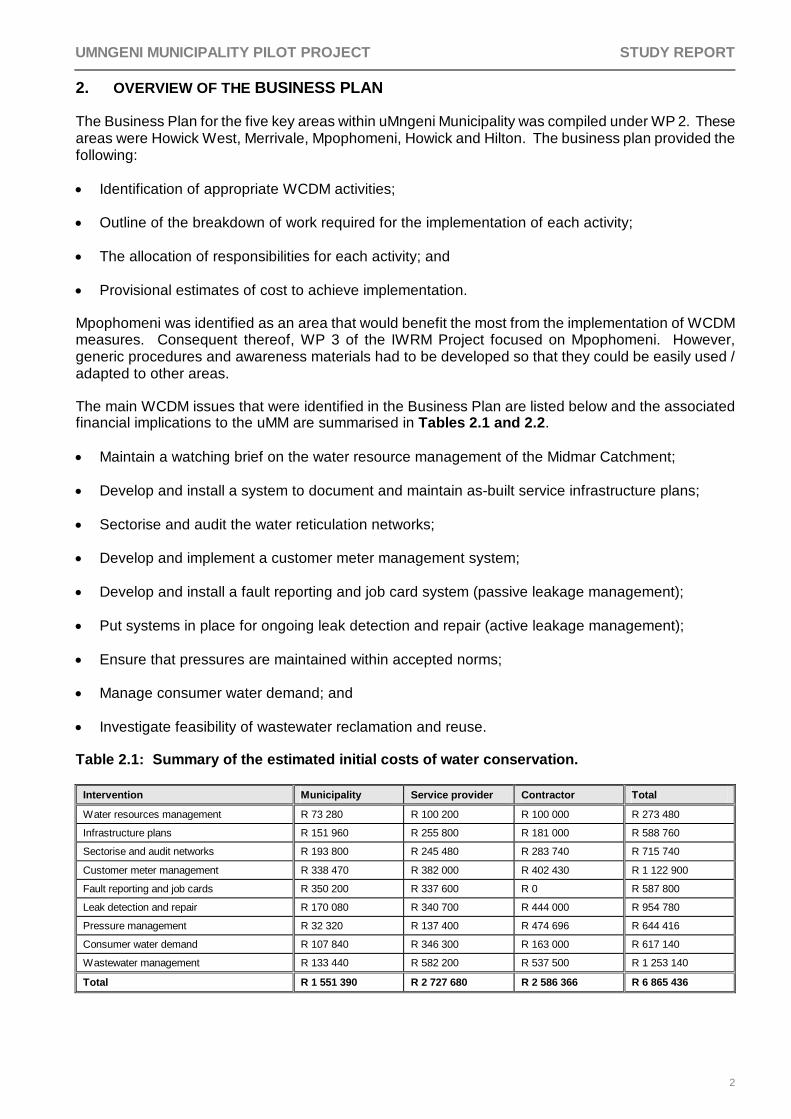
The main WCDM issues that were identified in the Business Plan are listed below and the associated financial implications to the uMM are summarised in Tables 2.1 and 2.2.
• Maintain a watching brief on the water resource management of the Midmar Catchment;
• Develop and install a system to document and maintain as-built service infrastructure plans;
• Sectorise and audit the water reticulation networks;
• Develop and implement a customer meter management system;
• Develop and install a fault reporting and job card system (passive leakage management);
• Put systems in place for ongoing leak detection and repair (active leakage management);
• Ensure that pressures are maintained within accepted norms;
• Manage consumer water demand; and
• Investigate feasibility of wastewater reclamation and reuse.
Table 2.1: Summary of the estimated initial costs of water conservation.
Intervention Municipality Service provider Contractor Total
Water resources management R 73 280 R 100 200 R 100 000 R 273 480
Infrastructure plans R 151 960 R 255 800 R 181 000 R 588 760
Sectorise and audit networks R 193 800 R 245 480 R 283 740 R 715 740
Customer meter management R 338 470 R 382 000 R 402 430 R 1 122 900
Fault reporting and job cards R 350 200 R 337 600 R 0 R 587 800
Leak detection and repair R 170 080 R 340 700 R 444 000 R 954 780
Pressure management R 32 320 R 137 400 R 474 696 R 644 416
Consumer water demand R 107 840 R 346 300 R 163 000 R 617 140
Wastewater management R 133 440 R 582 200 R 537 500 R 1 253 140
Total R 1 551 390 R 2 727 680 R 2 586 366 R 6 865 436
UMNGENI MUNICIPALITY PILOT PROJECT STUDY REPORT
3
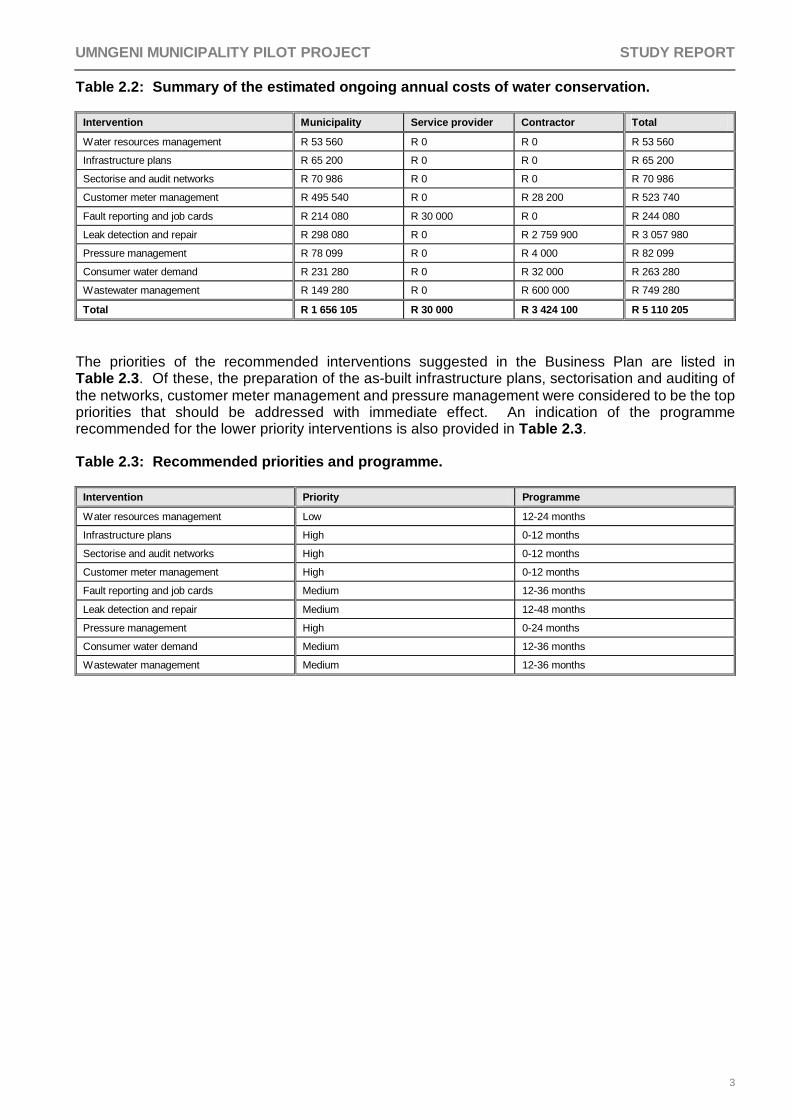
Table 2.2: Summary of the estimated ongoing annual costs of water conservation.
Intervention Municipality Service provider Contractor Total
Water resources management R 53 560 R 0 R 0 R 53 560
Infrastructure plans R 65 200 R 0 R 0 R 65 200
Sectorise and audit networks R 70 986 R 0 R 0 R 70 986
Customer meter management R 495 540 R 0 R 28 200 R 523 740
Fault reporting and job cards R 214 080 R 30 000 R 0 R 244 080
Leak detection and repair R 298 080 R 0 R 2 759 900 R 3 057 980
Pressure management R 78 099 R 0 R 4 000 R 82 099
Consumer water demand R 231 280 R 0 R 32 000 R 263 280
Wastewater management R 149 280 R 0 R 600 000 R 749 280
Total R 1 656 105 R 30 000 R 3 424 100 R 5 110 205
The priorities of the recommended interventions suggested in the Business Plan are listed in Table 2.3. Of these, the preparation of the as-built infrastructure plans, sectorisation and auditing of the networks, customer meter management and pressure management were considered to be the top priorities that should be addressed with immediate effect. An indication of the programme recommended for the lower priority interventions is also provided in Table 2.3.
Table 2.3: Recommended priorities and programme.
Intervention Priority Programme
Water resources management Low 12-24 months
Infrastructure plans High 0-12 months
Sectorise and audit networks High 0-12 months
Customer meter management High 0-12 months
Fault reporting and job cards Medium 12-36 months
Leak detection and repair Medium 12-48 months
Pressure management High 0-24 months
Consumer water demand Medium 12-36 months
Wastewater management Medium 12-36 months
UMNGENI MUNICIPALITY PILOT PROJECT STUDY REPORT
4
3. PILOT PROJECT
3.1. OVERVIEW
The Mpophomeni Pilot Project focused on the four high and three medium priority tasks that were identified in the Business Plan. The scope of work was workshopped with and approved by uMM and DWAF. The key tasks are listed in Table 3.1 and explained in Sections 3.2 to 3.11 together with the outputs produced.
Table 3.1: List of Pilot Project tasks.
Task Description
Task 1 Project management and co-ordination
Task 2 Introduction of project and selection of trial areas
Task 3 GIS & Infrastructure data
Task 4 Consumer register and metering
Task 5 Primary system metering
Task 6 Sectorisation
Task 7 Pressure Management
Task 8 Active leakage control
Task 9 Passive leakage control
Task 10 Consumer use reduction
Task 11 System performance report
Task 12 Capacity Building
Task 13 Final Technical Report
3.2. PROJECT MANAGEMENT AND CO-ORDINATION
3.2.1. Scope
This task entailed project management and co-ordination of activities. The main purpose of this task was to ensure that there was adequate communication between the regional and national client representatives from DWAF, the technical staff of the uMM, the PSP team and Mpophomeni community. Routine reporting on project progress and expenditure was also undertaken during the active periods of the assignment.
3.2.2. Outputs
• Inception report;
• Progress reports;
• Project Steering Committee (PSC) meetings;
• Study report;
• Technical report; and
• Participation and presentation at a Regional Workshop.
UMNGENI MUNICIPALITY PILOT PROJECT STUDY REPORT
5
3.2.3. Comments
Co-ordination of activities started well and communication with the Client bodies was good at the start of the assignment. However, there was a drop off in the number and frequency of PSC meetings in the latter half of the assignment, mainly due to a lack of funding for the Consultant to facilitate such meetings. Project closure took longer than expected and communication between the various project stakeholders suffered as a result.
3.3. INTRODUCTION OF PROJECT AND SELECTION OF TRIAL AREAS
3.3.1. Scope
Mpophomeni comprises a number of different socio-economic clusters which are indicative in the types of housing. Two trial areas were selected in Mpophomeni to implement consumer use reduction, consumer register and metering activities, one area representative of the subsidised housing areas (mainly lower-middle income earners employed in the Government Sector, housing is formal and individually designed with internal bathrooms and toilets) and the other representative of the old township housing areas (mainly low income earners or unemployed people, housing is the original Government mass constructed dwellings with toilets and showers housed separately from the main dwellings). Each area comprised approximately 300 properties. The selected areas were approved by the PSC and then introduced to the local community members, organisations and representatives through a public meeting convened by the uMM.
3.3.2. Outputs
• Two trial areas selected;
• Trial areas agreed to by the community; and
• Project introduced to the community.
3.3.3. Comments
The introduction of the project to the community went particularly smoothly. The high level of interest of the relevant uMM Councillors from Mpophomeni ensured that their constituencies were well informed. This was the case throughout the assignment.
3.4. GIS / STRUCTURAL MODEL
3.4.1. Scope
The task entailed the preparation of a working Geographical Information System (GIS) for Mpophomeni to provide assistance to the various water management tasks and that can be used for ongoing management of the services. Background maps and aerial photography were prepared to show all properties served by the water reticulation network. The paper copies of the water mains records with information such as pipe location (e.g. position within the road / footpath), diameter, material, location of all valves and hydrants (including operation of valves) were prepared and updated. The updated mains records were digitized and the attribute database populated to create a structural GIS model.
3.4.2. Outputs
• GIS software and hardware procured and installed;
• GIS training provided;
UMNGENI MUNICIPALITY PILOT PROJECT STUDY REPORT
6
• As-built mains plan (shape file) prepared;
• Pipeline devices recorded (shape file);
• Background maps acquired; and
• GIS infrastructure model developed.
3.4.3. Comments
This task proved to be more onerous than originally envisaged. It entailed the exposure (both manually and mechanically) of some 270 valve and hydrants so that the configuration and details of the pipeline network at each point could be determined. Pipelines were also exposed in areas where either the location or details were not clear. Two spin off benefits came about through this exercise, namely:
• All of the isolating valves that were located and exposed were serviced (many were leaking); and
• The operation of each valve could be determined with a greater degree of confidence.
3.5. CONSUMER REGISTER AND METERING
3.5.1. Scope
The existing consumer register and historical data on meter readings and other specified attribute data were obtained from uMM. A meter audit was undertaken in the pilot project areas to determine the accuracy of the consumer register. The assessment found that only 4989 connections were registered on the billing database out of a possible maximum of 6219 registered properties in Mpophomeni. Furthermore, an in-situ meter test was undertaken within the two pilot areas to determine the accuracy of the meters.
The technical report includes a detailed description of the consumer profile and meter stock, which included a schedule and specifications of meters that were replaced within the pilot project areas. 300 new meters were procured and 140 of these have been installed in the pilot areas. The remainder are being installed in other locations where existing connections do not have meters.
3.5.2. Outputs
• Consumer register and meter database reviewed;
• Meter audits undertaken;
• Profile of consumers and meter stock established;
• Meter tests undertaken;
• Consumer meters replaced based on outcome of meter tests and accuracy of meter;
3.5.3. Comments
The major concern with the water use data was that almost 30% of monthly meter readings recorded zero water use. This could be an indication of problems with either the meter reading process or the data capture process. About 7% of the monthly meter readings recorded water uses greater than 30kl/month. The key findings were:
UMNGENI MUNICIPALITY PILOT PROJECT STUDY REPORT
7
• The authorized consumption is only 57% of the system input to Mpophomeni;
• 99% of the meters assessed are the standard 15 mm size;
• 70% of the meters are aged 10 years or older;
• 20% of the consumer meters cannot be read (not accessible; dials illegible or no meter installed)
3.6. SECTORISATION AND PRESSURE MANAGEMENT
3.6.1. Scope
The objective of this task was to enable the division of Mpophomeni supply area into two sectors fed independently from the two Umgeni Water supplies thereby enabling pressure management and to establish separate zones that can be monitored through one meter at the inlet to each zone.
As mentioned in Section 3.4, the operation of all known isolating valves was checked and those found to be faulty were serviced. One of the main valves controlling the input to the whole of Mpophomeni was damaged and had to be replaced.
Preliminary field work indicated that sectorisation into two would be difficult and that pressure management on either zone would not be possible. Eventually two supply zones were established through trial and error of closing valves and undertaking pressure drop tests. Recommendations for further sub-sectorisation of the network were determined at a desktop level using information from the GIS and fieldwork. Given the topography, pressure management was only found to be viable at smaller zone levels. One such installation was designed and is in the process of being implemented in the MC Housing Area.
3.6.2. Outputs
• Valve audit undertaken;
• All known valves exposed and maintained/replaced;
• Sectorisation plans prepared;
• Area sub-divided into two zones and one successful pressure zero test;
• Training on step test procedures provided;
• Demonstration of step test undertaken;
• Pressure control for MC Housing Area designed and in process of implementation;
3.6.3. Comments
The current sectorisation is not ideal and the recommended sectorisation plan should be implemented in a systematic manner. The sub-division of the two large zones may be difficult to maintain since the supply from Vulindlela is not reliable and the reservoir is a lot smaller than the main reservoir at Mpophomeni. Many of the current meter installations need to be upgraded and/or repaired to facilitate routine monitoring.
UMNGENI MUNICIPALITY PILOT PROJECT STUDY REPORT
8
3.7. ACTIVE LEAKAGE CONTROL
3.7.1. Scope
Procedures for an active leakage control procedure were devised and uMM staff were trained in the application thereof. Basic leak location equipment was demonstrated to uMM technical staff, however, these systems were deemed to be unnecessary by uMM. An old ground microphone is the only leak detection device in use at present, and this is used very seldom.
Implementation of active leakage control was limited to one zone in the Hume Housing area. Logging was undertaken so that both a night flow analysis and step test could be undertaken. Leaks were identified and reported to uMM for repair.
In addition to the step test, many surface leaks were obvious throughout Mpophomeni. To this end, an audit was undertaken and a total of 84 leaks were observed and reported to uMM for repair (this is really a passive leakage management approach). Only 17 of these leaks have been confirmed as being repaired.
3.7.2. Outputs
• Equipment for flow logging was procured and commissioned;
• Pre and post project monitoring was undertaken;
• Sites that were adequate for logging were monitored;
• Leaks were identified through both monitoring and manual observation; and
• A small number of leaks were repaired.
3.7.3. Comments
The lack of attention given to the leaks has been reported by uMM as a human resource problem. No additional plumbers were provided to help with this backlog and an offer to use outside contractors was declined. In addition, there does seem to be a lack of management regarding customer complaints (the leaks were reported in this manner). It is left to the plumber to prioritise and allocate complaints jobs, which is quite clearly beyond his job function. Furthermore, job cards are not filled in after a job has been completed and there is no way of knowing whether a complaint has been sorted out. The management and supervision of this process is clearly lacking.
3.8. PASSIVE LEAKAGE CONTROL
3.8.1. Scope
This task entailed assisting uMM establish procedures for rapid response to customer complaints regarding leakage. Passive leakage control comprised public awareness initiatives and internal communications and monitoring procedures. UMM is responsible for implementing the passive leakage control procedures. The procedures were tested through the leakage audit discussed in Section 3.7.
3.8.2. Outputs
• Newsletters;
• Leakage audit; and
UMNGENI MUNICIPALITY PILOT PROJECT STUDY REPORT
9
• Recommendations for passive leakage control procedures
3.8.3. Comments
The current approach to dealing with customer complaints leaves a lot to be desired as is discussed in Section 3.7. There are two aspects that require different approaches, namely the backlog of leakage should be addressed urgently by short-term dedicated resources, and the ongoing management of leakage. The customer system needs serious attention particularly from a management perspective to successfully deal with the latter approach.
3.9. CONSUMER USE REDUCTION
3.9.1. Scope
This task focused on assisting householders in both of the trial areas identified in Section 3 to take maximum advantage of the free basic water policy. An analysis of metered consumption data, which was compared to the consumer profiles in order to determine the scope for reducing end user consumption, was undertaken.
A first Knowledge, Attitudes and Perceptions (KAP) survey was undertaken in 2003 during the early stages of the project. The findings of the survey were passed on to the Client to design a consumer use reduction campaign. Input was provided on both the technical and budgetary aspects of the proposed campaign. However, due to budgetary constraints the Client requested the Service Provider to continue with the consumer use reduction campaign. A second follow up KAP survey was undertaken in March 2004.
3.9.2. Outputs
• First KAP survey report;
• Consumer use reduction campaign; and
• Second KAP survey report.
3.9.3. Comments
The first and second KAP surveys provided an interesting insight into the attitudes of the consumers in the pilot areas, some aspects of which are listed below, together with improvements between the two surveys:
• 75% of candidates responded negatively on the question of a lower pressure water tap during the first KAP survey. This was reversed in the second survey with 68% of the candidates indicating that they would accept a lower tape pressure because they had been made aware that it would reduce pipe bursts and their water bills;
• 62% of candidates indicated that they do not pay their water bills during the first KAP survey and this figure came down to 40.7% in the second survey, an improvement of almost 20% in less than a year.
• Most candidates knew where their water meter was but only 5% and 16 % have ever bothered to read their meter according to the first and second KAP surveys, respectively. This shows an improvement of 11% in 8 months;
• 63% of the candidates indicated that they had never been influenced or heard of the importance of water conservation during the first KAP survey. However, during the second KAP survey, 100% of the candidates thought it was very important to implement water conservation and demand management;
UMNGENI MUNICIPALITY PILOT PROJECT STUDY REPORT
10
• According to the first KAP survey, 57% had never tried any method of reducing consumption of toilet water; and this figure came down to 31% in the second KAP survey, and
• Almost all candidates interviewed in the first KAP survey did not know anything about how the ‘free basic water policy’ worked in their municipal area. During the second KAP survey, most candidates knew about the policy through the awareness material and electronic media but did not know how they could exactly benefit from this policy in Mpophomeni Township.
3.10. REPORTING
3.10.1. Scope
At the inception of the project it was intended that Technical Report will be compiled on project completion which will be a synopsis of the findings in the various task reports. It was also intended that a system performance report will also be drafted to monitor the extent and performance of the water infrastructure, the customer base and water utilisation in the future. However, Volume 2 – Technical Report contains the relevant information for such purposes thereby rendering a stand alone system performance report redundant. In its place, Volume 1 – Study Report has been prepared. This report is aimed at officials and non-technical audience and is a summary of work undertaken, outputs produced and resources deployed.
UMNGENI MUNICIPALITY PILOT PROJECT STUDY REPORT
11
3.10.2. Outputs
• Communication report; and
• Study report
3.10.3. Comments
The two reports are intended for different audiences therefore slight repetition has resulted. However, they are both stand alone reports.
3.11. CAPACITY BUILDING
3.11.1. Scope
Training was provided to the following people during the course of the project :
• Mr V. Gumede (Technician, uMM Technical Services);
• Mr M Mlotshwa (Graduate Trainee, seconded to the project);
• Mr M Sithole (Emerging contractor, Mpophomeni community);
• Mr S Mgwane (Emerging contractor, Mpophomeni community);
3.11.2. Outputs
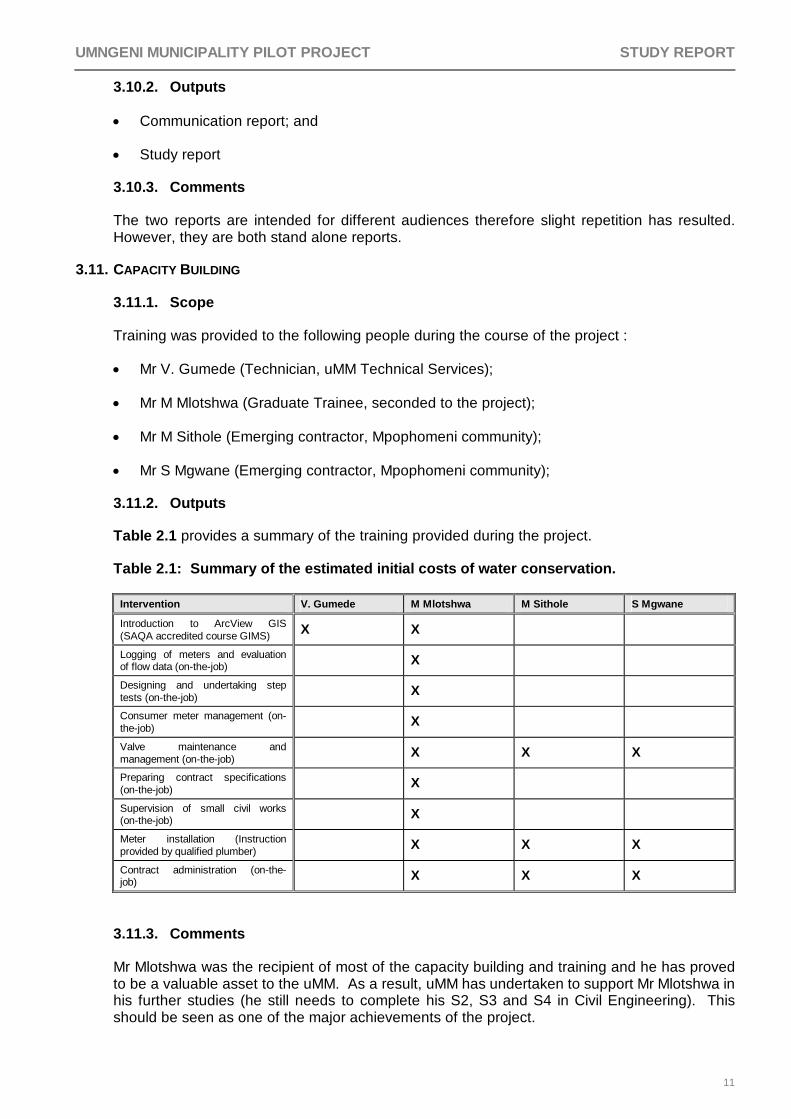
Table 2.1 provides a summary of the training provided during the project.
Table 2.1: Summary of the estimated initial costs of water conservation.
Intervention V. Gumede M Mlotshwa M Sithole S Mgwane
Introduction to ArcView GIS (SAQA accredited course GIMS) X X
Logging of meters and evaluation of flow data (on-the-job) X
Designing and undertaking step tests (on-the-job) X
Consumer meter management (on-the-job) X
Valve maintenance and management (on-the-job) X X X
Preparing contract specifications (on-the-job) X
Supervision of small civil works (on-the-job) X
Meter installation (Instruction provided by qualified plumber) X X X
Contract administration (on-the-job) X X X
3.11.3. Comments
Mr Mlotshwa was the recipient of most of the capacity building and training and he has proved to be a valuable asset to the uMM. As a result, uMM has undertaken to support Mr Mlotshwa in his further studies (he still needs to complete his S2, S3 and S4 in Civil Engineering). This should be seen as one of the major achievements of the project.
UMNGENI MUNICIPALITY PILOT PROJECT STUDY REPORT
12
4. RESOURCE DEPLOYMENT
4.1. INTRODUCTION
The resources, both human and financial, budgeted to implement the project were quantified during the inception phase. The client representatives from both DWAF/DANIDA and uMM approved the Inception Report thereby committing the budgeted resources to the project. The intention of this section of the Study Report is to present a summary of the actual resources deployed versus those that were originally committed.
4.2. BUDGETED RESOURCE ALLOCATION
The purpose of comparing the actual and committed resources is that the project did not achieve the water savings that were envisaged and part of this can be explained by the lower than expected resource allocation. Resources were committed by both uMM and DWAF/DANIDA. uMM undertook to provide technical manpower (in the form of their own staff) and to fund the small works contracts. DWAF assumed responsibility of funding the PSP and the assets that were installed. It is difficult to derive the cost of the manpower committed by uMM since this was based on a time allocation rather than a cost allocation. Estimates have been made of the cost of employment of the various personal originally committed to the assignment in order to determine the cost commitment. The estimated costs of employment are as follows:
• Senior engineer at R 3,000 per day;
• Technician at R 1,000 per day;
• Plumber at R 600 per day;
• TLB Driver at R 400 per day; and
• Labourer at R 200 per day.
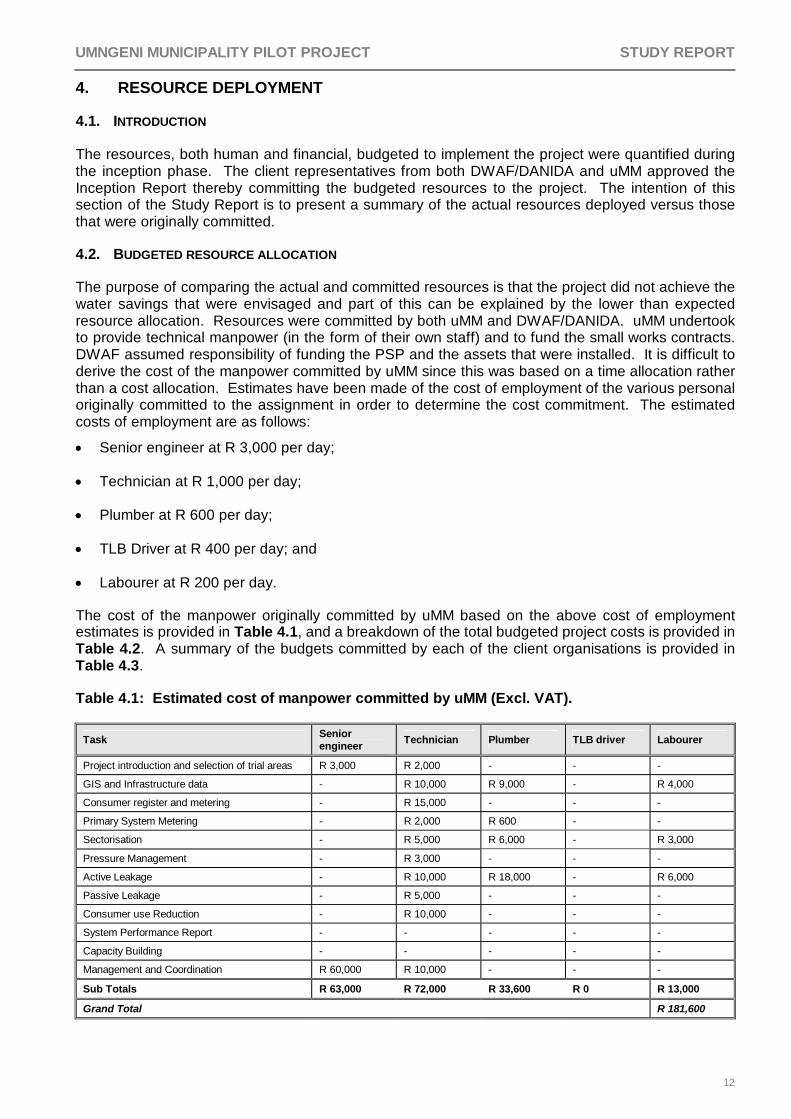
The cost of the manpower originally committed by uMM based on the above cost of employment estimates is provided in Table 4.1, and a breakdown of the total budgeted project costs is provided in Table 4.2. A summary of the budgets committed by each of the client organisations is provided in Table 4.3.
Table 4.1: Estimated cost of manpower committed by uMM (Excl. VAT).
Task Senior engineer Technician Plumber TLB driver Labourer
Project introduction and selection of trial areas R 3,000 R 2,000 - - -
GIS and Infrastructure data - R 10,000 R 9,000 - R 4,000
Consumer register and metering - R 15,000 - - -
Primary System Metering - R 2,000 R 600 - -
Sectorisation - R 5,000 R 6,000 - R 3,000
Pressure Management - R 3,000 - - -
Active Leakage - R 10,000 R 18,000 - R 6,000
Passive Leakage - R 5,000 - - -
Consumer use Reduction - R 10,000 - - -
System Performance Report - - - - -
Capacity Building - - - - -
Management and Coordination R 60,000 R 10,000 - - -
Sub Totals R 63,000 R 72,000 R 33,600 R 0 R 13,000
Grand Total R 181,600
UMNGENI MUNICIPALITY PILOT PROJECT STUDY REPORT
13
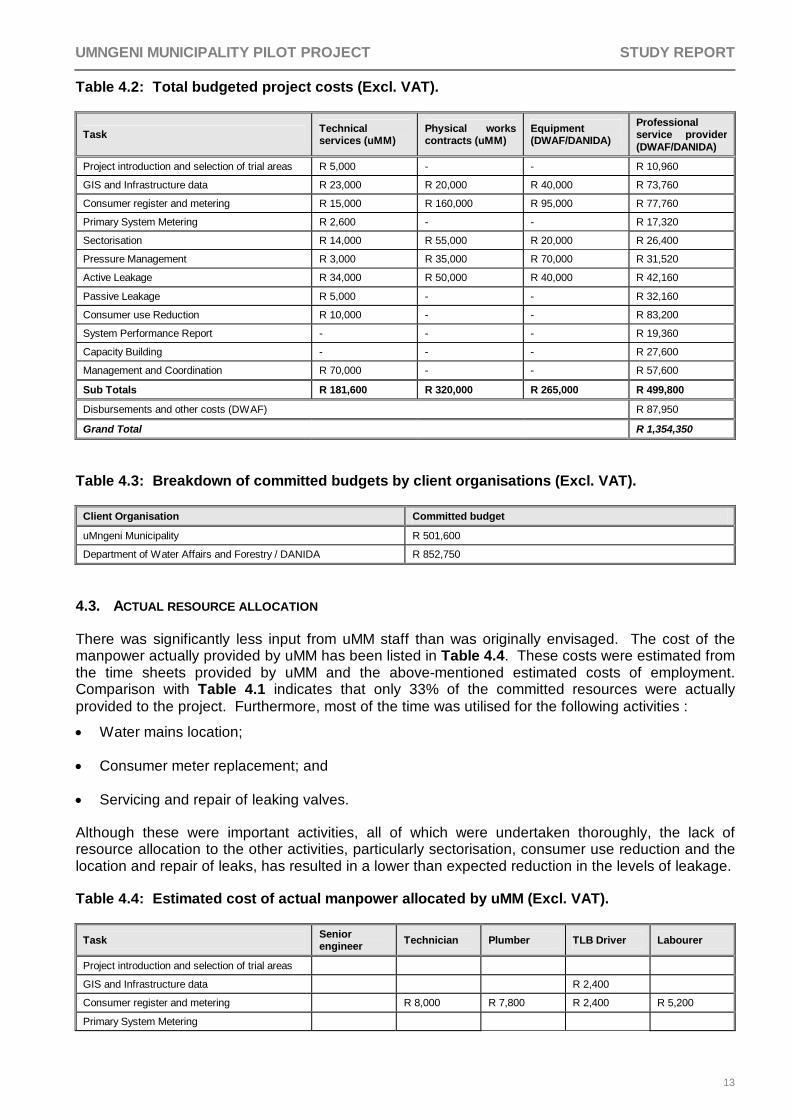
Table 4.2: Total budgeted project costs (Excl. VAT).
Task Technical services (uMM)
Physical works contracts (uMM)
Equipment (DWAF/DANIDA)
Professional service provider (DWAF/DANIDA)
Project introduction and selection of trial areas R 5,000 - - R 10,960
GIS and Infrastructure data R 23,000 R 20,000 R 40,000 R 73,760
Consumer register and metering R 15,000 R 160,000 R 95,000 R 77,760
Primary System Metering R 2,600 - - R 17,320
Sectorisation R 14,000 R 55,000 R 20,000 R 26,400
Pressure Management R 3,000 R 35,000 R 70,000 R 31,520
Active Leakage R 34,000 R 50,000 R 40,000 R 42,160
Passive Leakage R 5,000 - - R 32,160
Consumer use Reduction R 10,000 - - R 83,200
System Performance Report - - - R 19,360
Capacity Building - - - R 27,600
Management and Coordination R 70,000 - - R 57,600
Sub Totals R 181,600 R 320,000 R 265,000 R 499,800
Disbursements and other costs (DWAF) R 87,950
Grand Total R 1,354,350
Table 4.3: Breakdown of committed budgets by client organisations (Excl. VAT).
Client Organisation Committed budget
uMngeni Municipality R 501,600
Department of Water Affairs and Forestry / DANIDA R 852,750
4.3. ACTUAL RESOURCE ALLOCATION
There was significantly less input from uMM staff than was originally envisaged. The cost of the manpower actually provided by uMM has been listed in Table 4.4. These costs were estimated from the time sheets provided by uMM and the above-mentioned estimated costs of employment. Comparison with Table 4.1 indicates that only 33% of the committed resources were actually provided to the project. Furthermore, most of the time was utilised for the following activities :
• Water mains location;
• Consumer meter replacement; and
• Servicing and repair of leaking valves.
Although these were important activities, all of which were undertaken thoroughly, the lack of resource allocation to the other activities, particularly sectorisation, consumer use reduction and the location and repair of leaks, has resulted in a lower than expected reduction in the levels of leakage.
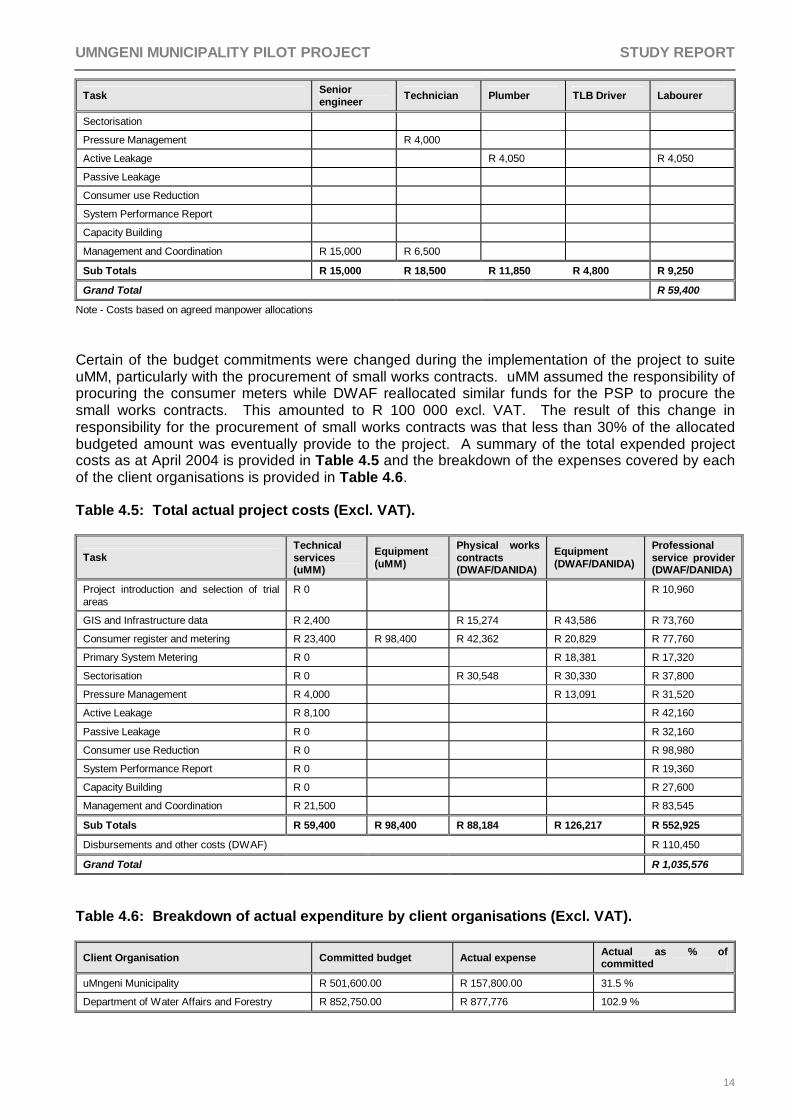
Table 4.4: Estimated cost of actual manpower allocated by uMM (Excl. VAT).
Task Senior engineer Technician Plumber TLB Driver Labourer
Project introduction and selection of trial areas
GIS and Infrastructure data R 2,400
Consumer register and metering R 8,000 R 7,800 R 2,400 R 5,200
Primary System Metering
UMNGENI MUNICIPALITY PILOT PROJECT STUDY REPORT
14
Task Senior engineer Technician Plumber TLB Driver Labourer
Sectorisation
Pressure Management R 4,000
Active Leakage R 4,050 R 4,050
Passive Leakage
Consumer use Reduction
System Performance Report
Capacity Building
Management and Coordination R 15,000 R 6,500
Sub Totals R 15,000 R 18,500 R 11,850 R 4,800 R 9,250
Grand Total R 59,400
Note - Costs based on agreed manpower allocations
Certain of the budget commitments were changed during the implementation of the project to suite uMM, particularly with the procurement of small works contracts. uMM assumed the responsibility of procuring the consumer meters while DWAF reallocated similar funds for the PSP to procure the small works contracts. This amounted to R 100 000 excl. VAT. The result of this change in responsibility for the procurement of small works contracts was that less than 30% of the allocated budgeted amount was eventually provide to the project. A summary of the total expended project costs as at April 2004 is provided in Table 4.5 and the breakdown of the expenses covered by each of the client organisations is provided in Table 4.6.
Table 4.5: Total actual project costs (Excl. VAT).
Task Technical services (uMM)
Equipment (uMM)
Physical works contracts (DWAF/DANIDA)
Equipment (DWAF/DANIDA)
Professional service provider (DWAF/DANIDA)
Project introduction and selection of trial areas
R 0 R 10,960
GIS and Infrastructure data R 2,400 R 15,274 R 43,586 R 73,760
Consumer register and metering R 23,400 R 98,400 R 42,362 R 20,829 R 77,760
Primary System Metering R 0 R 18,381 R 17,320
Sectorisation R 0 R 30,548 R 30,330 R 37,800
Pressure Management R 4,000 R 13,091 R 31,520
Active Leakage R 8,100 R 42,160
Passive Leakage R 0 R 32,160
Consumer use Reduction R 0 R 98,980
System Performance Report R 0 R 19,360
Capacity Building R 0 R 27,600
Management and Coordination R 21,500 R 83,545
Sub Totals R 59,400 R 98,400 R 88,184 R 126,217 R 552,925
Disbursements and other costs (DWAF) R 110,450
Grand Total R 1,035,576
Table 4.6: Breakdown of actual expenditure by client organisations (Excl. VAT).
Client Organisation Committed budget Actual expense Actual as % of committed
uMngeni Municipality R 501,600.00 R 157,800.00 31.5 %
Department of Water Affairs and Forestry R 852,750.00 R 877,776 102.9 %
UMNGENI MUNICIPALITY PILOT PROJECT STUDY REPORT
15
The small works contracts were prepared and let by the PSP throughout the duration of the project. The main focus of these contracts were on the following activities:
• Determination of the location of pipelines;
• Excavation of and reinstatement of isolating valves; and
• Replacement of consumer meters
Other ad-hoc contracts were let for minor assignments such as meter audits and helping with a TLB to excavate pipelines. Furthermore, although a contract was prepared for the repair of leaks, the uMM rejected this task being outsourced and undertook to do the work in-house. It is noted from Table 4.4 that very little attention eventually was given by uMM to active leakage management.
UMNGENI MUNICIPALITY PILOT PROJECT STUDY REPORT
16
5. SYSTEM PERFORMANCE RESULTS
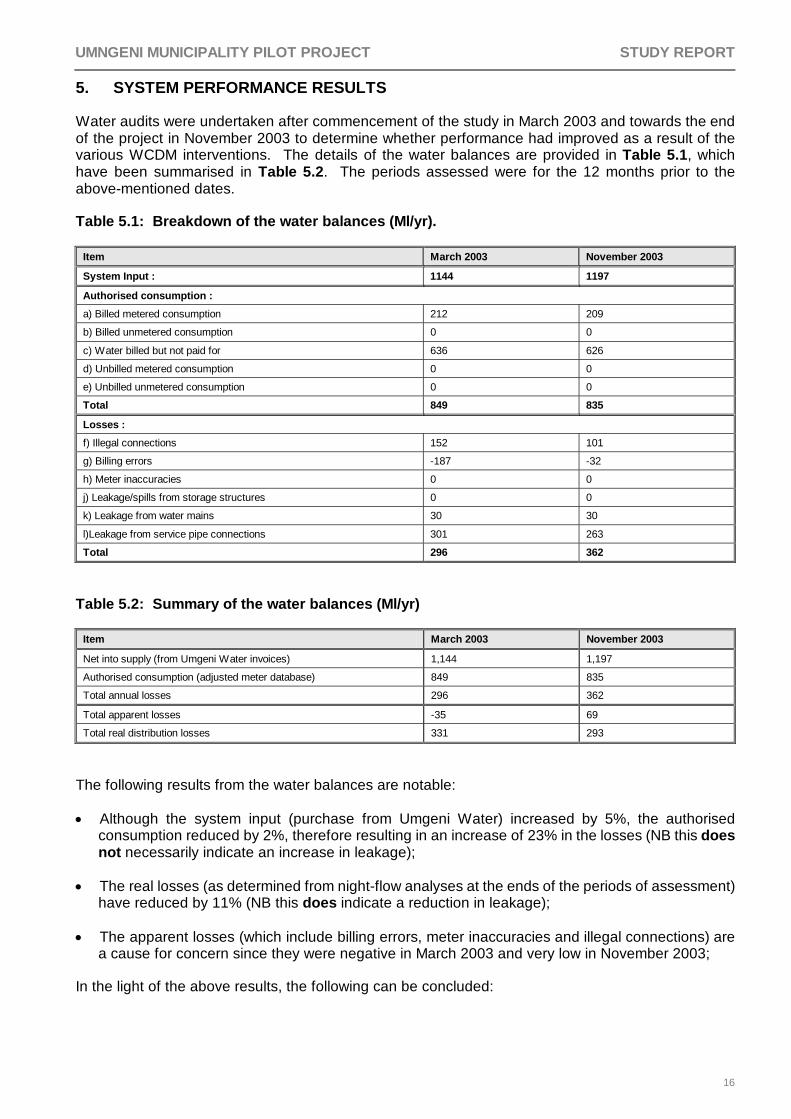
Water audits were undertaken after commencement of the study in March 2003 and towards the end of the project in November 2003 to determine whether performance had improved as a result of the various WCDM interventions. The details of the water balances are provided in Table 5.1, which have been summarised in Table 5.2. The periods assessed were for the 12 months prior to the above-mentioned dates.
Table 5.1: Breakdown of the water balances (Ml/yr).
Item March 2003 November 2003
System Input : 1144 1197
Authorised consumption : a) Billed metered consumption 212 209
b) Billed unmetered consumption 0 0
c) Water billed but not paid for 636 626
d) Unbilled metered consumption 0 0
e) Unbilled unmetered consumption 0 0
Total 849 835
Losses : f) Illegal connections 152 101
g) Billing errors -187 -32
h) Meter inaccuracies 0 0
j) Leakage/spills from storage structures 0 0
k) Leakage from water mains 30 30
l)Leakage from service pipe connections 301 263
Total 296 362
Table 5.2: Summary of the water balances (Ml/yr)
Item March 2003 November 2003
Net into supply (from Umgeni Water invoices) 1,144 1,197
Authorised consumption (adjusted meter database) 849 835
Total annual losses 296 362
Total apparent losses -35 69
Total real distribution losses 331 293
The following results from the water balances are notable:
• Although the system input (purchase from Umgeni Water) increased by 5%, the authorised consumption reduced by 2%, therefore resulting in an increase of 23% in the losses (NB this does not necessarily indicate an increase in leakage);
• The real losses (as determined from night-flow analyses at the ends of the periods of assessment) have reduced by 11% (NB this does indicate a reduction in leakage);
• The apparent losses (which include billing errors, meter inaccuracies and illegal connections) are a cause for concern since they were negative in March 2003 and very low in November 2003;
In the light of the above results, the following can be concluded:
UMNGENI MUNICIPALITY PILOT PROJECT STUDY REPORT
17
• The real losses (i.e. leakage from the mains and connections) has reduced, probably as a result of the valve refurbishment and the limited leak repair programmes;
• Although the number of connections have risen, the total authorised consumption seems to have reduced, probably as a result of the public awareness programme;
• There are many consumers who are using too much water given their socio-economic circumstances, which is probably a result of non-payment and internal leakage; and
• Although there is very little confidence in the apparent losses, these seem to have increased, possibly as a result of problems with meter reading and the database integrity.
These findings and results should be considered in light of the poor quality of the meter database, which is of particular concern since there seems to be much erroneous data. A number of assumptions had to be made to assess these data and allocate water use to the correct category. The poor billing data will influence the authorised consumption, the real and the apparent losses. This is considered a key obstacle for further WCDM initiatives in Mpophomeni.
UMNGENI MUNICIPALITY PILOT PROJECT STUDY REPORT
18
6. SUMMARY AND CONCLUSIONS
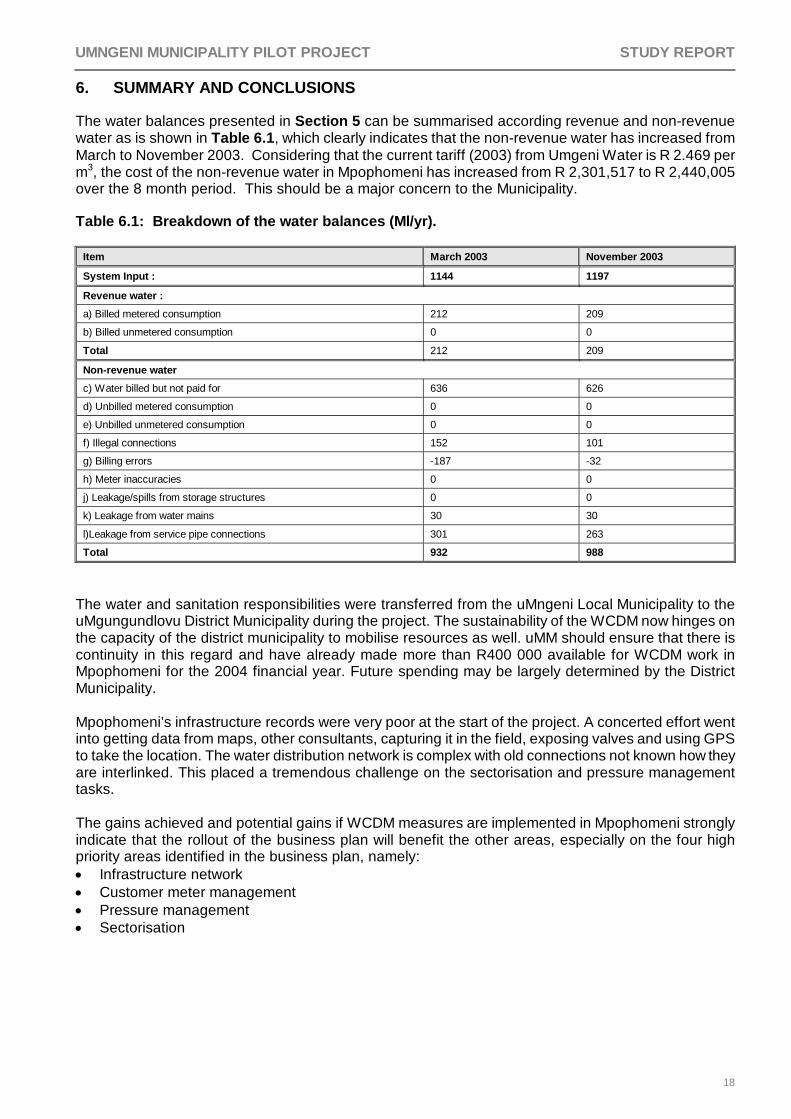
The water balances presented in Section 5 can be summarised according revenue and non-revenue water as is shown in Table 6.1, which clearly indicates that the non-revenue water has increased from March to November 2003. Considering that the current tariff (2003) from Umgeni Water is R 2.469 per m3, the cost of the non-revenue water in Mpophomeni has increased from R 2,301,517 to R 2,440,005 over the 8 month period. This should be a major concern to the Municipality.
Table 6.1: Breakdown of the water balances (Ml/yr).
Item March 2003 November 2003
System Input : 1144 1197
Revenue water : a) Billed metered consumption 212 209
b) Billed unmetered consumption 0 0
Total 212 209
Non-revenue water
c) Water billed but not paid for 636 626
d) Unbilled metered consumption 0 0
e) Unbilled unmetered consumption 0 0
f) Illegal connections 152 101
g) Billing errors -187 -32
h) Meter inaccuracies 0 0
j) Leakage/spills from storage structures 0 0
k) Leakage from water mains 30 30
l)Leakage from service pipe connections 301 263
Total 932 988
The water and sanitation responsibilities were transferred from the uMngeni Local Municipality to the uMgungundlovu District Municipality during the project. The sustainability of the WCDM now hinges on the capacity of the district municipality to mobilise resources as well. uMM should ensure that there is continuity in this regard and have already made more than R400 000 available for WCDM work in Mpophomeni for the 2004 financial year. Future spending may be largely determined by the District Municipality. Mpophomeni’s infrastructure records were very poor at the start of the project. A concerted effort went into getting data from maps, other consultants, capturing it in the field, exposing valves and using GPS to take the location. The water distribution network is complex with old connections not known how they are interlinked. This placed a tremendous challenge on the sectorisation and pressure management tasks. The gains achieved and potential gains if WCDM measures are implemented in Mpophomeni strongly indicate that the rollout of the business plan will benefit the other areas, especially on the four high priority areas identified in the business plan, namely: • Infrastructure network • Customer meter management • Pressure management • Sectorisation

UMNGENI MUNICIPALITY PILOT PROJECT STUDY REPORT
19
The findings of the KAP surveys undertaken in Mpophomeni indicate that the community is readily committed to play its role in Water Conservation and Demand Management if the Municipality addresses its complains (fixing reported leaks quickly, providing toll-free number for reporting leaks and other services complains, accurate meter readings, provide more plumbers, deal with poor workmanship by contractors) and provide information on free basic water, complimented by WCDM awareness education. The awareness education undertaken in Mpophomeni was augmented by the CMIP project and proved successful.
The following recommendations are made:
• The real losses have improved slightly and additional effort should be made by the Technical Services Department of uMM to further reduce these losses, such as :
1. Consideration should be given to an infrastructure replacement programme since many of the pipelines are very old and are at the end of their serviceable lives;
2. The sectorisation plan needs to be implemented, which will require substantial alteration to pipework and installation of valves and meters;
3. Intact zones should be monitored on an ongoing basis and zone files prepared to ensure that performance can be reported on a regular basis;
4. There is scope for additional pressure management, however, this will have to follow the sectorisation discussed above; and
5. Leak detection and repair requires a higher priority and plumbing staff require closer supervision in this regard.
• The apparent losses seem to have increased, however, the meter reading and integrity of the meter database is very suspect. The Financial Department should give this their urgent attention and work in close collaboration with the Technical Services Department to improve the situation. Issues to be addressed include:
1. The meter reading process requires a complete overhaul, staff need to be re-trained and re-deployed and close supervision provided;
2. Consideration should be made to changing the approach and type of meter database with the Technical Services Department being responsible for meter reading and the Financial Department being responsible for invoicing and cost recovery;
3. An intense programme of debt collection should be initiated in Mpophomeni;
• The Technical Services Department has limited capacity to deal with the backlog of water management problems in Mpophomeni and should give consideration to employing contract staff to address the backlog;
Implementation of Guidelines on Water Conservation in Pilot Project for
uMngeni Municipality, Mpophomeni
Advisor’s Conclusions on the Implementation and Results of the Project
and Comments on the Service Provider’s Final Report (WRP/DMM April 2004)
DWAF/Danida - IWRM Project Output 8: Water Conservation and Demand Management WP3 Implementation uMngeni Municipality – Advisor’s Conclusions and Comments on Final Report
1
Implementation of Guidelines on Water Conservation in Pilot Project for uMngeni Municipality, Mpophomeni
Advisor’s Conclusions on the Implementation and Results of the Project and
Comments on the Service Provider’s Final Report (WRP/DMM April 2004) 28.08.04
CONCLUSIONS OF THE IMPLEMENTATION AND RESULTS OF THE PROJECT Overview: Of the 11 outputs envisaged at the start of the project:
3 were achieved
3 were achieved in part
3 were not achieved during the period of the project
2 are unclear from the report, but probably achieved in part
The project was undertaken with considerable thoroughness and professionalism by the service provider, who demonstrated a willingness to adapt the workplan to suit the situation as found, and to find ways around the technical and administrative problems which were encountered. The service provider took on additional tasks related to the procurement of minor works, which were originally envisaged as being the responsibility of the municipality. However there are some shortfalls in the analysis of results and there are no specific recommendations for revisions / enhancements of the guidelines, apart from what can be gleaned from reading the report.
The active participation of the ward councillors in the project was a very positive feature of the project and contributed to the achievement of a good degree of community involvement.
The municipality technical services department struggled to deliver on its participation. There was a gain in human resource capacity as a result of the project, but not as much as potentially could have been realised.
Project Objectives: The Terms of Reference (ToR) for this pilot project, undertaken as Work Package 3 (WP3) of Output 8 of the IWRM project, defined two objectives of the Mpophomeni pilot project:
1. To test the water conservation and water demand management (WC/WDM) guidelines which had been prepared under a the first phase of the IWRM project (WP1), as a contribution towards the national project objectives
and
2. To implement as a trial, part of the WC/WDM business plan for uMngeni Municipality, which had been prepared under the second phase of the IWRM project (WP2), so as to learn from that experience before proceeding with implementation of the business plan for the municipality as a whole.
The first objective was met in part. The guideline procedure was not followed in all respects, however, and the report does not include a section on suggestions for revisions to the guidelines, as requested in the ToR.
The second objective was met in that many practical issues, and technical and administrative problems which had to be overcome, were highlighted by the project.
DWAF/Danida - IWRM Project Output 8: Water Conservation and Demand Management WP3 Implementation uMngeni Municipality – Advisor’s Conclusions and Comments on Final Report
2
However the report does not include any comments on whether, in the light of the experience of the pilot project, consideration needs to be given to revising the original business plan, such as the scope of the measures proposed, or reviewing the justification for or prioritisation of any specific measures recommended in the business plan.
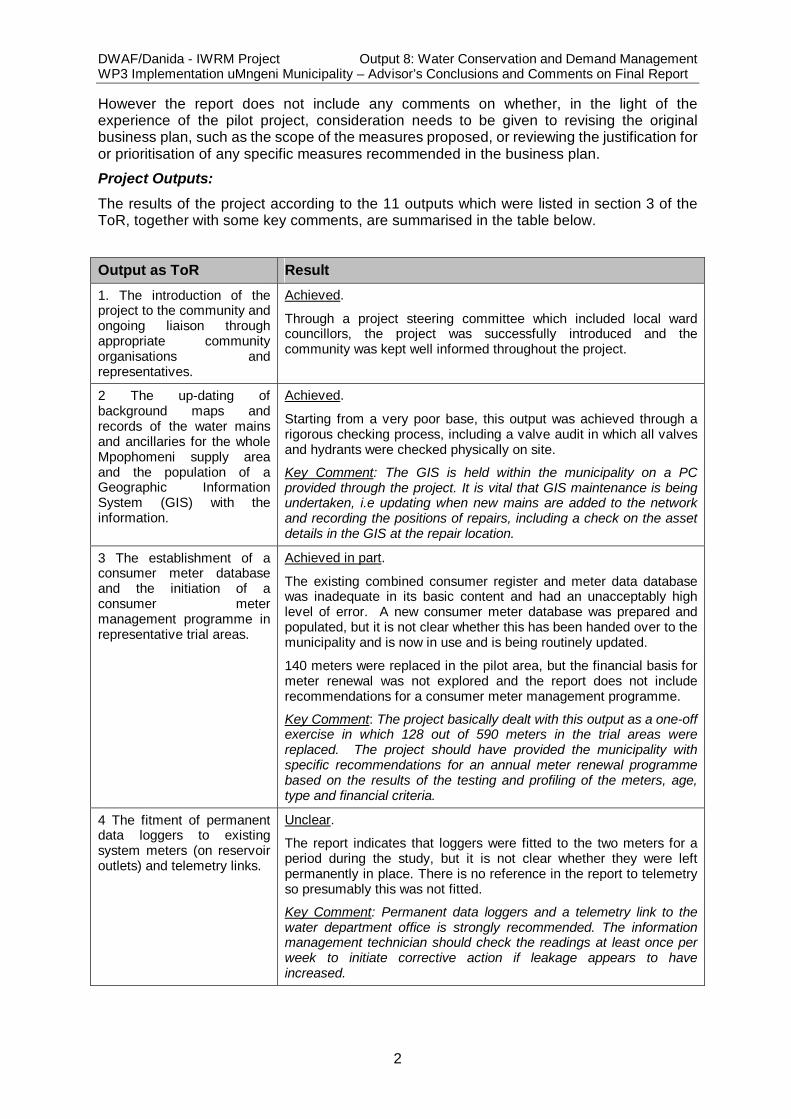
Project Outputs: The results of the project according to the 11 outputs which were listed in section 3 of the ToR, together with some key comments, are summarised in the table below.
Output as ToR Result 1. The introduction of the project to the community and ongoing liaison through appropriate community organisations and representatives.
Achieved.
Through a project steering committee which included local ward councillors, the project was successfully introduced and the community was kept well informed throughout the project.
2 The up-dating of background maps and records of the water mains and ancillaries for the whole Mpophomeni supply area and the population of a Geographic Information System (GIS) with the information.
Achieved.
Starting from a very poor base, this output was achieved through a rigorous checking process, including a valve audit in which all valves and hydrants were checked physically on site.
Key Comment: The GIS is held within the municipality on a PC provided through the project. It is vital that GIS maintenance is being undertaken, i.e updating when new mains are added to the network and recording the positions of repairs, including a check on the asset details in the GIS at the repair location.
3 The establishment of a consumer meter database and the initiation of a consumer meter management programme in representative trial areas.
Achieved in part.
The existing combined consumer register and meter data database was inadequate in its basic content and had an unacceptably high level of error. A new consumer meter database was prepared and populated, but it is not clear whether this has been handed over to the municipality and is now in use and is being routinely updated.
140 meters were replaced in the pilot area, but the financial basis for meter renewal was not explored and the report does not include recommendations for a consumer meter management programme.
Key Comment: The project basically dealt with this output as a one-off exercise in which 128 out of 590 meters in the trial areas were replaced. The project should have provided the municipality with specific recommendations for an annual meter renewal programme based on the results of the testing and profiling of the meters, age, type and financial criteria.
4 The fitment of permanent data loggers to existing system meters (on reservoir outlets) and telemetry links.
Unclear.
The report indicates that loggers were fitted to the two meters for a period during the study, but it is not clear whether they were left permanently in place. There is no reference in the report to telemetry so presumably this was not fitted.
Key Comment: Permanent data loggers and a telemetry link to the water department office is strongly recommended. The information management technician should check the readings at least once per week to initiate corrective action if leakage appears to have increased.
DWAF/Danida - IWRM Project Output 8: Water Conservation and Demand Management WP3 Implementation uMngeni Municipality – Advisor’s Conclusions and Comments on Final Report
3
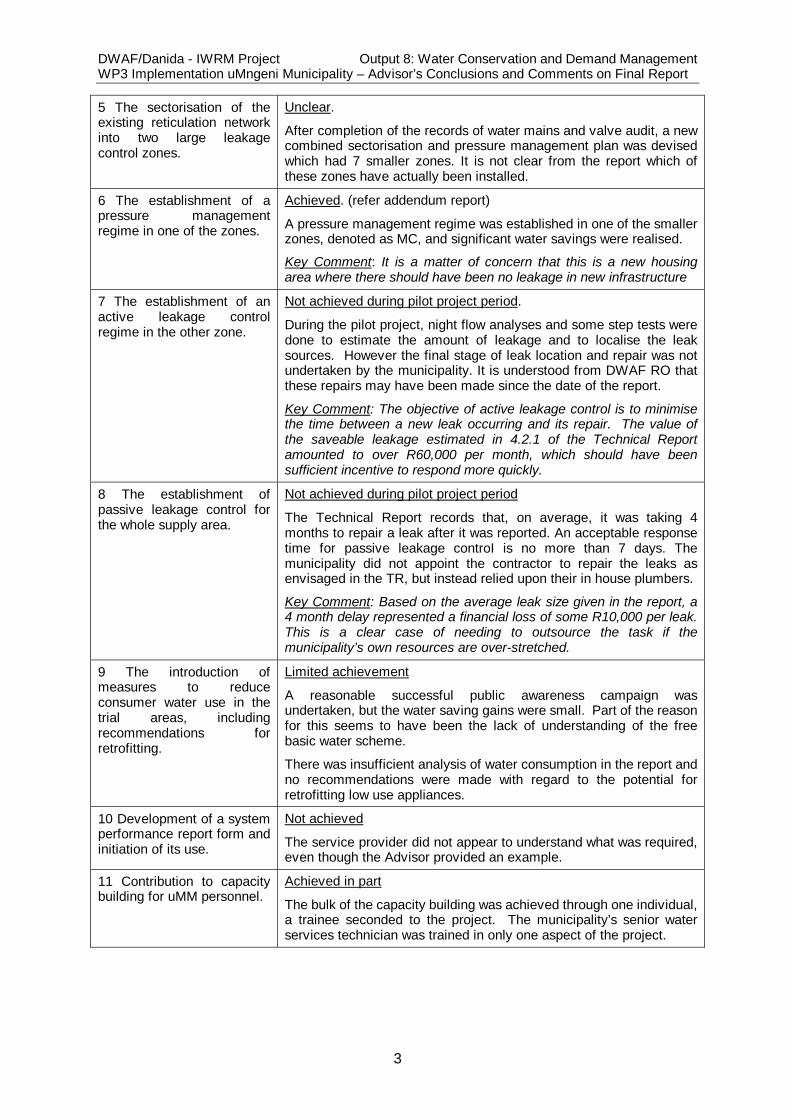
5 The sectorisation of the existing reticulation network into two large leakage control zones.
Unclear.
After completion of the records of water mains and valve audit, a new combined sectorisation and pressure management plan was devised which had 7 smaller zones. It is not clear from the report which of these zones have actually been installed.
6 The establishment of a pressure management regime in one of the zones.
Achieved. (refer addendum report)
A pressure management regime was established in one of the smaller zones, denoted as MC, and significant water savings were realised.
Key Comment: It is a matter of concern that this is a new housing area where there should have been no leakage in new infrastructure
7 The establishment of an active leakage control regime in the other zone.
Not achieved during pilot project period.
During the pilot project, night flow analyses and some step tests were done to estimate the amount of leakage and to localise the leak sources. However the final stage of leak location and repair was not undertaken by the municipality. It is understood from DWAF RO that these repairs may have been made since the date of the report.
Key Comment: The objective of active leakage control is to minimise the time between a new leak occurring and its repair. The value of the saveable leakage estimated in 4.2.1 of the Technical Report amounted to over R60,000 per month, which should have been sufficient incentive to respond more quickly.
8 The establishment of passive leakage control for the whole supply area.
Not achieved during pilot project period
The Technical Report records that, on average, it was taking 4 months to repair a leak after it was reported. An acceptable response time for passive leakage controI is no more than 7 days. The municipality did not appoint the contractor to repair the leaks as envisaged in the TR, but instead relied upon their in house plumbers.
Key Comment: Based on the average leak size given in the report, a 4 month delay represented a financial loss of some R10,000 per leak. This is a clear case of needing to outsource the task if the municipality’s own resources are over-stretched.
9 The introduction of measures to reduce consumer water use in the trial areas, including recommendations for retrofitting.
Limited achievement
A reasonable successful public awareness campaign was undertaken, but the water saving gains were small. Part of the reason for this seems to have been the lack of understanding of the free basic water scheme.
There was insufficient analysis of water consumption in the report and no recommendations were made with regard to the potential for retrofitting low use appliances.
10 Development of a system performance report form and initiation of its use.
Not achieved
The service provider did not appear to understand what was required, even though the Advisor provided an example.
11 Contribution to capacity building for uMM personnel.
Achieved in part
The bulk of the capacity building was achieved through one individual, a trainee seconded to the project. The municipality’s senior water services technician was trained in only one aspect of the project.
DWAF/Danida - IWRM Project Output 8: Water Conservation and Demand Management WP3 Implementation uMngeni Municipality – Advisor’s Conclusions and Comments on Final Report
4
COMMENTS ON THE REPORT (2 volumes) General
The service provider only partially followed the format of the report which had been agreed at the inception stage. Whilst that would not matter so much if the submitted format substantially included all of the intended content, there are some omissions of reasonable significance, such as the absence of a section on feedback to the guidelines. Since the guideline was not always followed, it would have been particularly useful to have the service provider’s comments.
Volume 1 Project Report (titled study report)
In section 3 Pilot Project, not all of the 11 outputs in the ToR are included (refer Table above in this note).
In 3.10.1, the statement that the information given in Technical Report makes the system performance report redundant is wrong. The purpose of the system performance report is to provide a format for annual reporting, tailored to suit the supply area in question. The Advisor provided an example of such a report from another project to the service provider.
In the Summary and Conclusions, it would have been beneficial to include the financial impact of the real losses, as well as the apparent losses.
Other comments on the Project Report are included in the table of outputs above in this note. Volume 2 Technical Report 1.1 Background
In para 4 it is stated that the business plan was accepted by both the municipality and DWAF. The Advisor gave comments on the business plan to the service provider, who agreed to take them into account in a re-issue. The Advisor has not had sight of the revised business plan, if it was in fact produced. One of the issues which was to be addressed was the need for the financial benefits of each of the proposed water loss reduction measures to be estimated, thereby providing a major part of the justification for the measures and as an aid to prioritisation.
Arguably, if this had been done, the linkage between delays in leak repairs and money would have been embedded in the municipality’s awareness base and faster action might have resulted.
[The question to ask of the municipal manager / director of technical services – if it was your house and your bills, do you wait for the municipal plumber to come round at some time in the future, time uncertain, or do you go out and get a private plumber to do it right away?] 3.2 Network Details
By attempting to put all of the pipe profiles in the one table, Table 3.2, clarity has been compromised. It would be better to have separate tables (even better histogram charts) for each of: diameter, material, age. There appears to be nothing between 5 and 30 years of age. 3.5 Sectorisation Details
It is not clear from the description what the current status is, i.e what zones have been created under the project, and which are still to be implemented.
3.6 Pressure reducing valve details
It is a matter for serious concern that brand new infrastructure is exhibiting the amount of leakage identified by the project. The municipality or other responsible authority must take urgent corrective action.
DWAF/Danida - IWRM Project Output 8: Water Conservation and Demand Management WP3 Implementation uMngeni Municipality – Advisor’s Conclusions and Comments on Final Report
5
3.7 & 4.1 Consumer metering
In terms of the various appraisals and tests, this work was thoroughly executed, but best use of the data was not made. A significant omission is details / recommendations for an ongoing meter renewal programme, based on the findings of the project, so that the municipality can plan and budget for this activity.
Although it is stated in the text that the distribution of meter accuracies seems to follow the age profiles, there is not a graph which shows this. Another factor of interest in this case is whether is the type / manufacturer has a bearing on accuracy – there are two major and two minor suppliers. Was the accuracy profile the same for the Kent and the Premier? If not then the meter renewal programme should take this into account.
The decision to replace meters based on a single factor of 2.5% accuracy was not optimised on a financial payback basis, especially having regard to the rising block tariff and free basic water for the first 6kl per month. The guideline indicates that as well as age, the consumption / earnings of a meter should be taken into account.
A domestic meter recording, say, 15 kl/ month or 180 kl/year “earns” R900 per year at an average water price of R5/kl (for this example ignoring fbw). If it is 2.5% inaccurate (under recording) it is losing only R22.50 per year, compared with the average cost of replacement of R1,118 (Table 7.9), and cannot be justified for replacement on a financial basis. On the other hand, if a meter on large commercial premises was earning R100,000 per year, say, and was 2.5% under recording, it would be losing R2,500 per year. The financial consequences and meter replacement decision is quite different.
Whilst it is appreciated that in Mpophomeni there are no large users, the basic principles could have been set out and a simple methodology developed for the municipality to use elsewhere. The question also remains - what is the recommended meter management programme for Mphomeni, what criteria are to be used and how should it be implemented? 4.2 Active leakage control
This section precedes the mass balance water audit in the report and starts with presentation of night flow and leakage estimates, it would have been clearer if the water audits presented in section 5 had been presented first and brought together with the night flow and leakage analyses. There appears to be a large anomaly in the real loss figures. From Tables 4.8, 4.9 and 5.4, total physical losses in November 2003 = 701-97 = 604 Ml/yr, but from Table 5.6, total real distribution losses are only 293 Ml/yr. One error was to assume that leakage in the day would be the same as at night and a correction factor should have been applied to the hourly night flow figure and not multiplied by 24 x 365, but it does not account for the whole difference.
The estimation of leakage losses is carried out using BABE, which is not unacceptable, but DWAF have standardised on infrastructure leakage index (ILI) as an indicator, as set out in the guidelines. Using BABE is a useful cross check and an interesting discussion point, but an ILI based target should also have been derived (as guideline Vol 3 section 5.4.of March 2003 issue).
Use of different terminology and definitions in water losses has hampered meaningful comparisons for many years and it was one of the objectives of the guidelines to establish a common basis for South Africa. The report uses the term “unexplained (and unaccounted for) leakage” which is not in the guideline and is in any case misleading since it really means “the sum of leaks which exceed a standard background estimate level”. Neither background leakage nor any other leakage above that should be referred to as “unexplained”.
The report uses certain default loss parameters in Table 4.3. Where do these come from? Is it recommended that these should be included in the guidelines?
DWAF/Danida - IWRM Project Output 8: Water Conservation and Demand Management WP3 Implementation uMngeni Municipality – Advisor’s Conclusions and Comments on Final Report
6
In Tables 4.10 and 5.6, it would have had greater impact to include the monetary value of the “unaccounted for leakage” (actually the target reduction for ALC). At R2.5/kl purchase cost from the water board, if correctly quantified (see above) these 20 esbs alone are costing the municipality about R760,000 per year. The total real losses in Table 5.6 represent R733,000 at R2.5/kl water purchase price. 4.3 Passive leakage control
The intended introduction of passive leakage control does not seem to have been implemented. It is not stated why. [A passive leakage control programme is judged by the response time to reports of visible leaks – 7 days is a not unreasonable target].
The report basically comprises an evaluation of the existing arrangements, which was very useful, and illustrated the effect of not having a passive leakage control programme. But it would have had much more impact if, like the active leakage control, the effect of the very delayed response to dealing with reported leaks had been quantified in monetary terms.
If we assume that an average leak is the esb value of 1.8 m3/hr night flow (say 32 m3/day allowing for diurnal pressure variation), then for water purchased at R2.5 per kl, a delay of 4 months between report and fix is costing the municipality an average of nearly R10,000 per leak, compared with an average cost to repair the leak of less than R300 (Table 7.8, but must add the cost of finding the leak, say R1,000 to be safe). Was this pointed out to the municipality? Presumably not, otherwise they would not have decided against appointing an external contractor as reported.
5.1 Consumption analysis
This important section is really too brief.
There is no attempt to explain the wide variances in household consumption shown in Fig 5.1. Are the lower / mid / higher ranges related to different categories of housing? Are the top 10% which are more than 3 times the average using water for irrigation? How does the consumption vary seasonally? Only by understanding why these variances exist can an effective water use reduction programme be devised.
For the purposes of testing the guidelines there should have been a comparison with Table 6A in Volume 2.
The ToR requested recommendations for retrofitting, if appropriate. This is not discussed.
In the comment on Tables 5.1 and 5.2, the report refers to a 3% increase in consumers falling into the 100% free basic water category. It is arguable whether this is statistically significant, but equally worth pointing out is the fact that there was a 9% reduction in the > 30 kl/month consumption category, which is more likely to be statistically significant. 6 Consumer attitudes
This appears to have been a valuable exercise and demonstrated the positive impact of the awareness campaign.
7 Resource deployment and costs
The information in this section is most useful and, together with corresponding information from the Cederberg pilot should be reviewed for incorporation in the guidelines (annex).
Did any of the activities cost considerably more or less than the estimates made in the business plan (WP2)? If so this should be mentioned and the justification / extent of that business plan component reviewed.
Hugh Allan
DWAF/Danced IWRM Project WC/WDM Advisor