Embed Size (px)
Citation preview

Integrated System Analysis ofOffshore Wind Projects
Deniz Ozkan, Ph.D.
[email protected] / [email protected]
Department of Engineering Management & Systems Engineering
School of Engineering and Applied Science
The George Washington University
NREL Wind Energy Systems Engineering Workshop Golden, Colorado
December 14, 2010
www.deniz.ws

Offshore Wind Farm
http://www.q7wind.nl/en/nieuws_fotos.asp
Prinses AmaliawindparkJune 2008
Wind turbines: 60 Vestas V80 / 2 MW
Capacity: 120 MW
Water depth: 19 - 24 meters
Distance from shore: 23 kilometers
Surface area: 14 km²
Hub height: 59 meters
Rotor diameter: 80 meters
Annual power production: 435 GWh
CO2-emissions avoidance: 225.000 tons/year
Enough to power: 125.000 households
Complex System
Relatively New Technology
Various, Interrelated
Uncertain Parameters
High COE
Inadequate,
Traditional LCC

Offshore Wind Plants
Installed Capacity (MW)
2008 1,515
2009 2,134
+ Under Construction (MW)
2010 3,072
2011 4,368
2012 5,502
Worldwide Cumulative Installed and under Construction
Offshore Wind Capacity 1990-2012 (MW)

Offshore Wind Plants
http://www.4coffshore.com/offshorewind/

Physical
Technical
Economical
Environmental
Social
Political
Uncertainty
http://www.nrel.gov/docs/gen/fy07/40462.pdf
Operation
Life-Cycle of an Offshore Wind ProjectSite Selection
Permits and Approvals
Power Purchase AgreementEnvironmental Impact Assessment
Met Mast Approval / InstallationPermit Application - Approval
Project FinancingLegal & Accounting
Site InvestigationSite Feasibility
Site Development
Preliminary DesignWind Resource Assessment
Seabed / Wave AssessmentWind Turbine SittingMechanical DesignElectrical DesignCivil Design
Final Design Project Build
Contracting
Manufacturing Payments
FoundationsCables
TowersTurbines
OffshoreOnshore
Installation Payments
Substations
Installation
Order & Manufacture
Last PaymentsProject Management
Decommissioning
CommissioningOperation 20 years

Offshore Wind Energy
Models, Projects, Tools
• NASA MOD
• Sunderland Model – University of Sunderland
• OPTI-OWECS – TUDelft
• WINDPACT – NREL, DOE
• OWECOP – ECN
• DOWEC – NEG Micon, LM Glasfiber, ACZ, ECN
• OWFLO – UMASS, GE, DOE
• RETSCREEN – Energy Diversification Research Laboratory, Canada
• Others

Research Questions
• Which cost drivers have the most impact on the wind generated cost
of electricity?
• To what extent can a wind generated cost of electricity be usefully
characterized by a probability distribution?
• What are the best financing methods and the impact of different
financing structures on the cost of wind generated electricity?
• To what extent can scheduling and project management variation
effect the cost of the wind generated electricity?
• How can a model best characterize the power market structure
affects with respect to the grid-generated cost of the wind generated
electricity?
• How can a model characterize CO2 cap and trade system (e.g.,
tradable Renewable Energy Credits) with respect to the cost of wind
generated electricity?

OFfshore Wind Integrated Cost
OFWIC
• Integrated
• Uncertainty
• Cost of Electricity
• Environment
• Financing
• Scheduling
• Power Network
• Risk Analysis
• Optimization
Wind
Wave
Turbine
Balance of Station
Operation and Maintenance
Engineering Economy
Environment
Financing
Scheduling
Power Network

OFWIC
Engineering
Economy
Wind Wave
Engineering
Economy
Engineering
Economy
Turbine
COE SimulationMonte Carlo
COE OptimizationGenetic Algorithms
O&M
Balance
of Station
Wind Data
Adjustment / Time Series
Wave Data
Optimize Blade Dimensions
Optimize Rotor Power Output
Turbine Components’ Weight & Costs
Optimize Tower DimensionsCalculate Weight and Cost
Optimize Foundation DimensionsCalculate Weight and Cost
Calculate Transportation, Installation & Grid Connection Costs
Calculate Farm Costs OWECs, Grid Conn., Project, WIC, Decomm.
Net Farm Energy Output(Availability, Efficiency & Losses)
O&M / Periodic Costs
Simulate & Optimize COELCC Assessment, DCF
Environment Financing Scheduling
Simulate & Optimize Revised1 COELCC Assessment, DCF
Power Network
Simulate Revised2 COELCC Assessment, DCF

Energy
Output
Wind Speed
Theoretical Wind Power
Turbine Power Curve
Annual Energy Output

COECost of
Electricity
COE ($/kWh)
Life Cycle Cost
LCC ($)
Initial Capital Cost
I ($)
Turbine
Rotor
Blades
Hub
Drive Train
Low Speed
Shaft
Bearings
Gearbox
MechanicalBrake
Generator
Electrical Equipment
Bedplate
Nacelle Cladding
Mechanical Equipment
Yaw System
BOS
Foundation
Foundation
Scour Protection
Tower Transportation
Foundation Transportation
Turbine + Tower Transportation
Installation
Cable Laying
-Within Farm -Foundation Cable Installation -Shore Connection -Onshore Grid Connection
Vessel Mob/Demob
-Offshore Substation -Foundation -Turbine+Tower
Installation
-Foundation -Scour Protection -Transition Piece -Turbine+Tower -Offshore Substation
Grid Connect.
SCADA
Cable
-Within Farm -Shore Connection -Onshore Grid Connection
Substation
-Offshore -Onshore
Network Connection
Project
Feasibility
-Site Investigation -Wind Resource Asses. -Environmental Asses. -Preliminary Desighn -Other
Development
-Permits & Approval s -Project Financing -Legal and Accounting -Project Management -Other
Engineering
-Wind Turbine Siting -Mechanical Design -Electrical Design -Civil Design -Contracting
Working Capital Cost
WIC ($)
Periodic Cost
Per ($)
Decomm. Cost
Dec ($)
Opearion and Maintenance
O&M ($)
Maintenance
Operation
-Property Taxes -Insurance -Gen. Admin -Labor -Bottom Lease
Net Energy Production
E (kWh)
Energy Production
Availability
Efficiencies -Farm -Electrical
Losses -Soiling -Transmission

Environment Module
• REC
• REC escalation factor
• Avoided Emissions
• Replaced generation type
Biomass, Coal, Diesel, Geothermal, Hydro, Natural Gas,
Nuclear, Oil
• CO2 emission ton/MWh
• CH4 emission ton/MWh
• N2O emission ton/MWh
• Fuel conversion efficiency
• Transmission and distribution losses
• GHG emission factor tCO2/MWh
• Cost of avoided emissions

Financing Module
• Back Leveraged
• Cash & PTC Leveraged
• Cash Leveraged
• Corporate
• Institutional Investor Flip
• Pay-As-You-Go
• Strategic Investor Flip
Financing structures are adopted from report “Wind Project Financing Structures: A Review & Comparative Analysis” http://eetd.lbl.gov/ea/emp/reports/63434.pdf

Cash & PTC Leveraged

Scheduling Module
• Allocation of Funds during
Construction (AFUDC)
• Interest During
Construction (IDC)
• Task Durations
• Project Scheduling
• Gantt Chart
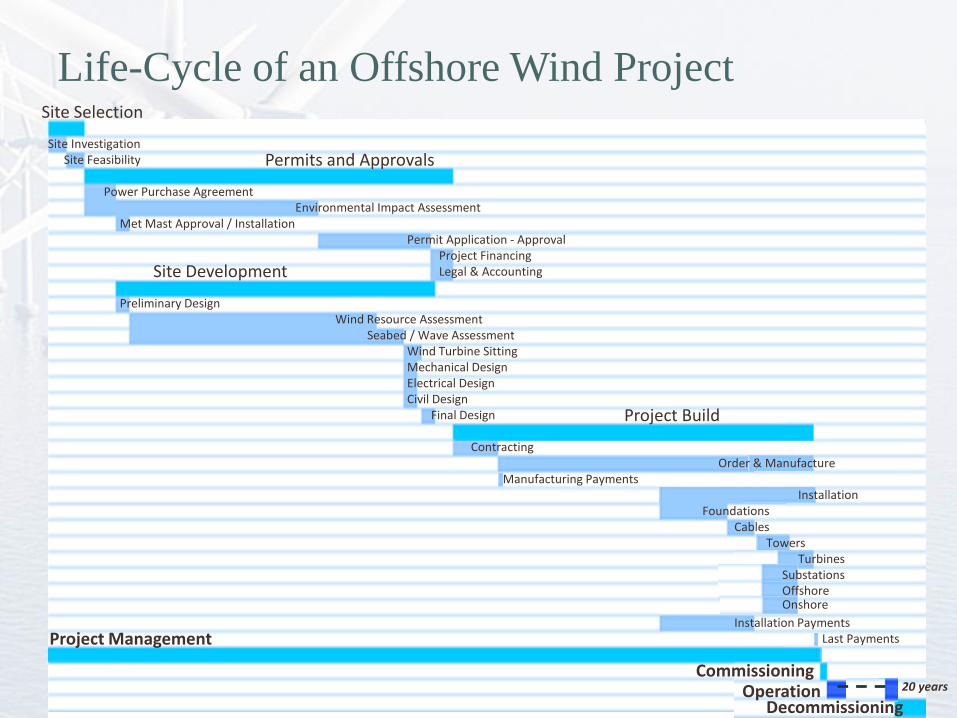
Power Network Module
Generators
Generators
Generators
ISO
AuctionDistributor
Distributor
U
S
E
R
S
Bilateral Contracts
Bilateral Contracts
B
I
D
S
U
S
E
R
S
Historical Time SeriesLMP, Load, WS
Forecasted Time Series
LMP, Load, WSForecast Errors
LMP, Load, WS
OFWIC Power Market Model

Simulation - Optimization
• Parametric optimization
• Complex, large stochastic system
• Formulation of objective function is difficult
• Non-linear probabilistic elements
• Simulation-based evaluation of the objective function
• Genetic algorithms
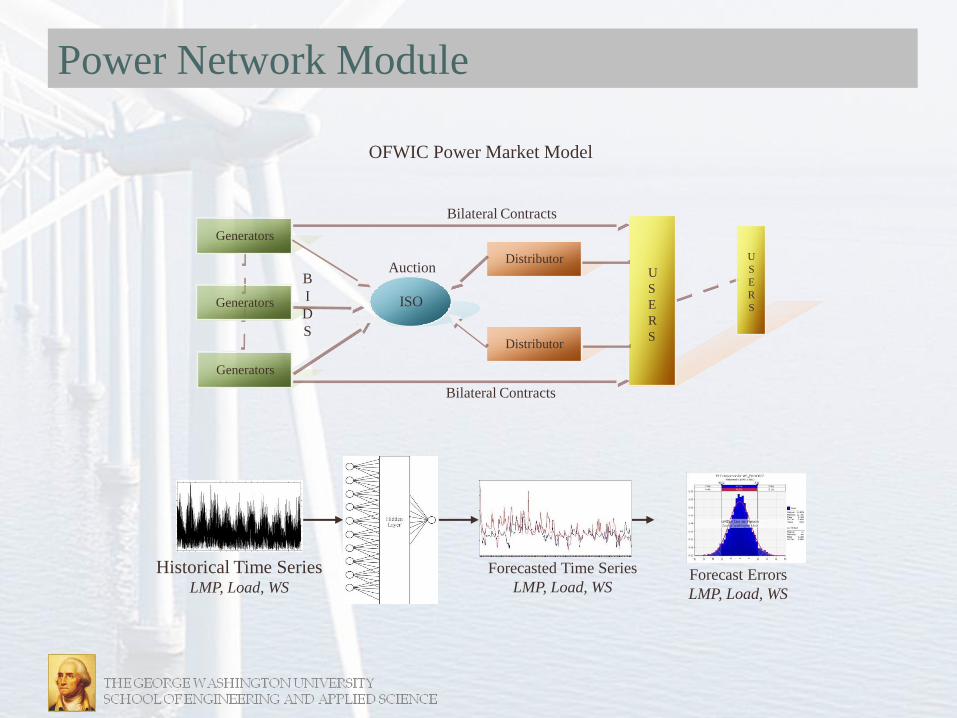
Case Study
0
0.05
0.1
0.15
0.2
0.25B
ase
Bas
e-P
TC
Bas
e-R
EC
Bas
e-P
TC
-RE
C
Bac
k
Bac
k-R
EC
Bac
k-S
Bac
k-S
-RE
C
Cas
h
Cas
h-R
EC
Cas
h-S
Cas
h-S
-RE
C
Cas
hP
TC
Cas
hP
TC
-RE
C
Cas
hP
TC
-S
Cas
hP
TC
-S-R
EC
Co
rpo
rate
Co
rpo
rate
-RE
C
Co
rpo
rate
-S
Co
rpo
rate
-S-R
EC
Inst
ituti
onal
Inst
ituio
nal
RE
C
Inst
ituti
onal
-S
Inst
ituti
onal
-S-R
EC
Pay
-As-
Yo
u-G
o
Pay
-As-
Yo
u-G
o-R
EC
Pay
-As-
Yo
u-G
o-S
Pay
-As-
Yo
u-G
o-S
-RE
C
Str
ateg
ic
Str
ateg
ic-R
EC
Str
ateg
ic-S
Str
ateg
ic-S
-RE
C
CO
E (R
eal.
20
08
$)
Future Work
• More sophisticated and analytic models for
– O&M cost estimation
– Farm efficiency and transmission loss estimations
– Updated component weight and cost estimations
• Expanded model scope to include
– Power flow problem
– Future foundation designs
– Different pollutant trading
– Different feed-in tariffs
– Different point of views, e.g. other generators, market itself, ISO and public.
• To analyze nationwide and hybrid scenarios
• Sensitivity analysis including financing and power network parameters
• A real life comparison

Questions
http://www.hornsrev.dk/Engelsk/default_ie.htm