Embed Size (px)
Citation preview
Water Resources Program
Integrated Statewide Groundwater
Monitoring Strategy
April 2017
Publication No. 17-11-005
Publication Information
This plan is available on the Department of Ecology’s website at:
www.ecy.wa.gov/biblio/1711005.html
Author and Contact Information
Tom Culhane
P.O. Box 47600
Water Resources Program
Washington State Department of Ecology
Olympia, WA 98504-7600
3
Table of Contents Abstract ............................................................................................................................................................ 4
Introduction ..................................................................................................................................................... 5
Background ..................................................................................................................................................... 5
U.S. Geological Survey Monitoring ....................................................................................................... 7
Recent EAP Investigations...................................................................................................................... 8
Monitoring Goals and Objectives .............................................................................................................. 8
Monitoring Goals ....................................................................................................................................... 8
Measurement Quality Objectives .......................................................................................................... 9
Future Groundwater Monitoring Strategy ............................................................................................... 9
Quality Management System .................................................................................................................. 9
Network Design ........................................................................................................................................ 10
Technology ................................................................................................................................................ 12
Training ...................................................................................................................................................... 12
Data Management .................................................................................................................................... 13
Reporting ................................................................................................................................................... 13
Conclusions .................................................................................................................................................. 14
References ..................................................................................................................................................... 16
Appendix Appendix A. Groundwater Monitoring Quality Assurance Monitoring Plan ..................................... 1
Figures Figure 1. Wells currently monitored by Water Resources. ................................................................. 7
Tables Table 1. Distribution of new AquiStar pressure transducers ............................................................. 12
4
Abstract
Groundwater data collected by the Department of Ecology’s Water Resources Program is used
within the program, and by other agency programs, outside state agencies, federal agencies, and the
public. Within Water Resources these data are used to support water management decisions, and
help regional staff understand and respond to issues associated with various regional conditions.
This document describes the program’s current groundwater monitoring, and describes how future
activities will be conducted to address both regional and statewide issues.
Groundwater monitoring conducted by the program varies in the four regions, which makes sense
since the monitoring opportunities and data needs are quite different on the west versus east sides of
the state. CRO and ERO both use the groundwater data they collect more extensively, since there
are many large irrigation areas (some with significant groundwater declines), there is less rainfall,
and there are regionally extensive aquifers that allow data to be extrapolated. At NWRO and SWRO
these factors are typically not an issue, and trend data is used minimally or not at all. Regarding
where monitoring should be conducted in the future, the same considerations that went into
deciding where the program currently monitors typically hold true today. If there was an area with a
suspected groundwater decline, quite likely the monitoring there needs to continue.
The quality of the groundwater data collected has historically met the program’s needs and has
proven defensible in court. However, to ensure consistent quality during future data collection, the
program will adhere to a Quality Assurance Management Plan (QAMP) and Standard Operating
Procedures (SOPs) provided in Appendix A of this report. Additionally, to advance all of the
groundwater monitoring efforts, this document recommends that the program’s approach
incorporate the following six elements:
1. Quality Management System - a QAMP and SOPs to ensure data are of consistent, known
quality.
2. Network Design - a monitoring system designed to meet program priorities and funding.
3. Technology - use of the best equipment for the task.
4. Training - learning opportunities to reduce the frequency of errors.
5. Data Management - a commitment to store data in EIM, preferably including establishing
one individual perform EIM data entry for the program.
6. Reporting - a process of reporting monitoring results on a once every other year basis to
convey the status of groundwater resources to a wide audience.
Two specific areas with room for improvement include ensuring that all groundwater data collected
by Water Resources are entered into EIM, and improving documentation and processing of
transducer data. The program’s plan to begin contributing a partial FTE toward an EIM data
coordinator responsible for entering all groundwater monitoring data into EIM, should increase the
likelihood that data will get entered and free up regional staff for the rest of monitoring.
In order to make these changes and implement other elements of this groundwater monitoring
strategy, Water Resources will need to authorize regional staff to prioritize these activities over
competing projects.
5
Introduction The Washington State Department of Ecology (Ecology) Water Resources Program conducts groundwater monitoring across the state to support water management decisions, and help regional staff understand and respond to limited water availability, aquifers with declining water levels, streamflow depletion, irrigation patterns, land use and landscape changes, and complaints. However, this monitoring has evolved over time to address regional programmatic needs. This plan describes how the program will conduct groundwater monitoring in the future to address both regional needs and groundwater management issues on a statewide level. Appendix A in this document is a Quality Assurance Monitoring Plan (QAMP) that describes steps taken to consistently maintain integrity during groundwater monitoring activities.
Background
Water Resources collects time-series, water-level data from about 420 wells statewide, with those being a mix of wells measured manually on an annual or semi-annual basis, and wells measured on a high frequency (sometimes referred to as “continuous”) basis using pressure transducer/data loggers. See Figure 1 below. A summary of the Program’s current monitoring efforts is as follows (counting each piezometer in wells with multiple piezometers as a separate well):
Manual Measurement Wells Transducer Wells Central Regional Office (CRO) 146 0
Eastern Regional Office (ERO) 133 62
Northwest Regional Office (NWRO) 23 3
Southwest Regional Office (SWRO) 51 3
When measurements are collected only once per year they are collected in March just prior to the start of the spring irrigation season in order to capture maximum recovery of the water table. If measurements are collected twice per year this includes not only one in March, but also one in fall once irrigation has ceased and aquifer drawdown is at its maximum. Water Resources maintains its’ Geographic Water Information System (GWIS), which is a statewide ArcGIS database used to store mapped water right information (places of use, diversion\ withdrawal point locations, etc.). These data are available to the public through the Water Resources Explorer at: https://fortress.wa.gov/ecy/waterresources/map/WaterResourcesExplorer2.aspx. CRO’s Central Region Groundwater Database (CRGDB) is a Microsoft ACCESS database that stores their groundwater measurement data, which are then uploaded to GWIS to make those data available in a geographic environment. All well water-level data collected by CRO are uploaded through an automated process from CRGDB into Ecology’s Environmental Information Management System (EIM). One benefit of GWIS is that it has hydrographs linked to the wells to make it easy to look for data trends.
6
ERO measures many irrigation wells once or twice per year within the Odessa subarea, where since
the 1970s Ecology has been required to assess groundwater mining per Chapter 173-130A WAC -
the Odessa Groundwater Subarea Management Policy. ERO also uses pressure transducers to
collect time-series data from a large number of monitoring wells throughout their region, including
some completed in the Spokane Valley-Rathdrum Prairie aquifer, and others located in the Palouse
Basin near Pullman and around Walla Walla. ERO maintains a Microsoft Access database to house
its water-level data, and periodically uploads these data to EIM. Some ERO transducer data have
been uploaded into EIM, but uploading the rest is a work in progress. ERO is the only region to
have developed quality assurance documents for its monitoring activities, and they also have relied
on a U.S. Geological Survey (USGS) quality assurance document developed by Drost (2005).
All wells monitored by NWRO are dedicated monitoring wells. SWRO is the only region that
monitors a large number of domestic-use wells on a regular basis, and in the Dungeness watershed
it monitors twelve such wells - often on a more than twice-a-year basis. NWRO has all of its water
level data entered into EIM, while SWRO primarily has only its manual water-level monitoring data
entered into EIM. Both regions have relied on Ecology’s Environmental Assessment Program
(EAP) for all EIM data entry.
In general the greater regional extent of aquifers and greater number of irrigation wells east of the
Cascades make it easier to conduct groundwater monitoring there. Irrigation wells can make very
useful monitoring wells, since they have distinct non-pumping seasons and many are equipped with
easily measured air lines. Another important consideration for the distribution of monitored wells
across the state is the use of the data, since CRO and ERO both use the groundwater data they
collect much more extensively.
CRO uses the groundwater data they collect when evaluating applications to change points of
withdrawal associated with water rights. If aquifer trend data are available for an area, CRO looks at
those data to see whether significant declines are indicated. If changing a water right will make
declines worse, CRO may deny that application. ERO also uses groundwater data they collect to
evaluate declines when making water right change decisions, especially in places like the Odessa,
Walla Walla and Palouse. In addition, ERO uses data they collect when evaluating Aquifer Storage
and Recovery (ASR) potential, aquifer test conditions, and the effects of rain events and/or drought.
Water Rights decisions at NWRO and SWRO typically rest mainly on the question of how
groundwater pumping will affect streams (often referred to as “hydraulic continuity”), and aquifer
trend data is used minimally or not at all there. There are a number of reasons for this, but
prominent among them is that there really is no widespread groundwater mining in the western half
of the state, in large part because there is more rainfall and there are no massive irrigation areas. In
addition, there are no regionally extensive aquifers like in the Columbia River Basalts, so in order to
use trend data it generally would need to have been collected nearby.
7
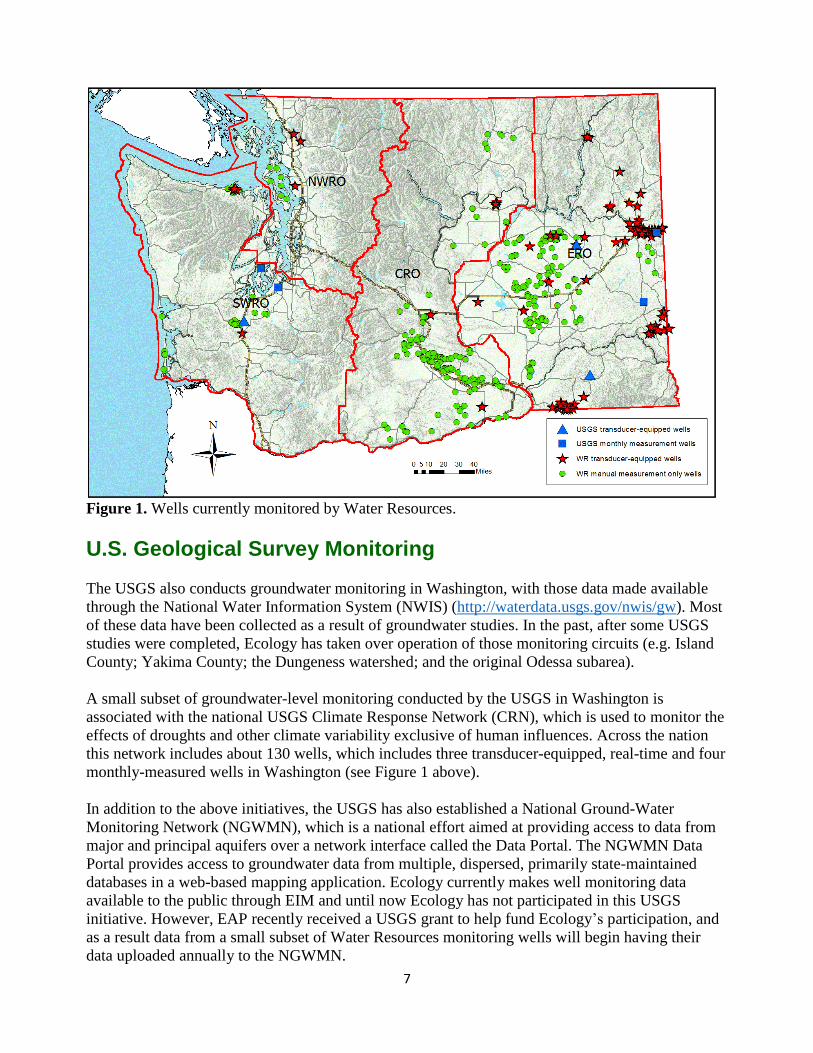
Figure 1. Wells currently monitored by Water Resources.
U.S. Geological Survey Monitoring
The USGS also conducts groundwater monitoring in Washington, with those data made available
through the National Water Information System (NWIS) (http://waterdata.usgs.gov/nwis/gw). Most
of these data have been collected as a result of groundwater studies. In the past, after some USGS
studies were completed, Ecology has taken over operation of those monitoring circuits (e.g. Island
County; Yakima County; the Dungeness watershed; and the original Odessa subarea).
A small subset of groundwater-level monitoring conducted by the USGS in Washington is
associated with the national USGS Climate Response Network (CRN), which is used to monitor the
effects of droughts and other climate variability exclusive of human influences. Across the nation
this network includes about 130 wells, which includes three transducer-equipped, real-time and four
monthly-measured wells in Washington (see Figure 1 above).
In addition to the above initiatives, the USGS has also established a National Ground-Water
Monitoring Network (NGWMN), which is a national effort aimed at providing access to data from
major and principal aquifers over a network interface called the Data Portal. The NGWMN Data
Portal provides access to groundwater data from multiple, dispersed, primarily state-maintained
databases in a web-based mapping application. Ecology currently makes well monitoring data
available to the public through EIM and until now Ecology has not participated in this USGS
initiative. However, EAP recently received a USGS grant to help fund Ecology’s participation, and
as a result data from a small subset of Water Resources monitoring wells will begin having their
data uploaded annually to the NGWMN.
8
Recent EAP Investigations
EAP has conducted two recent studies that have bearing on the Water Resources integrated
groundwater monitoring strategy. Relying on data collected by Water Resources, Sinclair (2016)
investigated the impacts of the 2015 drought on groundwater levels in Washington. The primary
deliverable of this investigation was a GIS-based story map illustrating the historical context of
groundwater level trends and providing a basis for comparison in the future. Three significant study
findings were that (1) the data indicate little impact of the drought on groundwater levels, (2) the
time lag between a drought's occurrence and corresponding water level responses makes it difficult
to discern cause and effect relationships (particularly in deep basaltic wells), and (3) it is often
difficult to detect short-term, drought-related trends due to wide-spread regional groundwater
declines. Beyond that, this study concluded that detection of short-term drought influences from
longer-term ambient water level trends was hampered by such factors as:
Few Water Resources monitored wells have the consistent long-term (10+ year), monthly
water-level measurement histories needed to define "normal" monthly water level ranges.
Not all wells are consistently measured each year.
Relying on published information, EAP has also investigated how climate change will likely impact
Washington’s groundwater in the coming century (Pitz, 2016). Some significant findings of that
study include:
Changes in the timing and location of recharge are more likely than changes in the amount
of annual recharge.
Groundwater pumping will likely increase due to climate change, and if allowed this will
produce a far greater impact on groundwater than direct effects.
In parts of Washington the direct effects of climate change may be difficult to detect in
groundwater, since those effects will be superimposed over existing, widespread
groundwater declines due to over-pumping.
Aside from concerns about the long-term sustainability of increased pumping, subsequent
groundwater declines will likely produce lower and warmer late summer stream baseflow.
Monitoring Goals and Objectives
Monitoring Goals
Due to the size of the state, the variety of hydrogeologic settings, local needs, political realities, and
legal constraints, it is difficult to couch the monitoring goals of the program in terms of specific
“needs.” However, the goals of Water Resources’ groundwater monitoring generally fall into two
categories, including monitoring conducted to produce data to support regional priorities, and
monitoring conducted to produce data to facilitate analyses of statewide significance. With respect
to regional data use, the goal of data collection is to help regional staff understand and respond to
9
conditions such as limited water availability, aquifers with declining water levels, streamflow
depletion, irrigation patterns, land use and landscape changes, and complaints. With respect to analyses of statewide significance, the goal of groundwater data collection is to have data available
that provides the basis for evaluating conditions across the state that might affect the program’s
policy or legal decisions.
Measurement Quality Objectives
Field measurement procedures inherently include uncertainty, and Measurement Quality Objectives
(MQOs) identify the acceptable data variability for a project. Both of the program’s groundwater
monitoring goals - supporting regional priorities and facilitating analyses of statewide significance -
have similar MQOs. These MQOs are fairly basic, since the program generally is concerned with
fairly large changes in head over long periods of time.
For Water Resources the accuracies associated with the various measurement methods are the main
determinant for MQOs, as opposed to how the data will be used. For example, changes measured on
the order of feet per year are acceptable if the only data available are those derived from airlines
with a potential measurement error of 2.5 feet. However, if measurements made with an e-tape for
depths less than 250 feet can be accurate to plus or minus 0.02 feet, then that is the MQO for that
type of measurement. Additionally, aquifer trends can be evaluated using measurements collected
once per year through manual measurements (provided the record is long enough) or once per hour
using a pressure transducers. Consequently there are too many variables to state simply that the
program’s MQOs will call for certain data collection methods or frequencies under certain
situations.
For the intended uses of the program, data of sufficient accuracy and frequency are collected
provided that reasonable care is taken while making groundwater measurements using the SOPs
outlined in Appendix A of the QAMP. Table 1 in that document provides anticipated instrument
accuracy and MQOs for the various water-level measurement methods.
Future Groundwater Monitoring Strategy
The Water Resources Program strategic approach is to be both realistic and opportunistic when it
comes to groundwater monitoring. To ensure that the program’s future monitoring objectives are
met, the strategy for the future should include the following six elements.
Quality Management System
Appendix A in this document is a Quality Assurance Monitoring Plan (QAMP) that describes steps
taken to maintain integrity during the program’s groundwater monitoring activities. That document
describes the procedures governing data acquisition to ensure that data are of consistent and known
quality. Appendix 1 of the QAMP provides Standard Operating Procedures (SOPs) followed by
10
Water Resources when collecting data. The two areas considered to have the largest potential for
improving quality associated with the groundwater data collection are ensuring that all data
collected by Water Resources are entered into EIM, and improved documentation and processing of
transducer data.
Network Design
The monitoring currently conducted by Water Resources has evolved over time largely based on
regional needs and well availability. Particularly at CRO and ERO regional staff have initiated
monitoring in subbasins where groundwater declines were known or suspected. The greater regional
extent of aquifers and the greater number of irrigation wells in eastern Washington generally make
it more effective to conduct groundwater monitoring there.
In other areas the program initiated groundwater monitoring mainly because the USGS developed a
well monitoring circuit there when conducting a study. When the USGS completed such studies
Water Resources took over the same dedicated monitoring wells. The USGS data when combined
with the Water Resources data in many cases has produced exceptionally long and useful periods of
record in areas with detailed hydrogeologic information.
Regarding where to monitor in the future, often the same considerations that went into deciding
where the program monitors currently, hold true today. Therefore in areas now monitored, most
monitoring should continue. That said, as new monitoring opportunities arise, Water Resources
needs to take advantage of these to fill in gaps in the networks. Considerations for deciding where
to monitor (and potentially drill) new wells should include locations that:
Provide good spatial coverage representative of the state’s major aquifer systems, including
both confined and unconfined conditions.
Provide information on areas with overdraft concerns.
Would not be overly subject to interference from nearby pumped wells.
Are on properties with long-term agreements to ensure well access far into the future.
Represent a mix of ambient (relatively undisturbed) and stressed aquifer conditions.
Adding additional transducer-equipped wells in CRO is one example of a future monitoring need.
Although CRO performs extensive periodic groundwater monitoring currently, only three of the
wells they monitor are equipped with pressure transducers. Due to known groundwater declines and
other issues in that region, the intent is to increase that number.
Regional staff also need to continually evaluate the value of wells that are currently monitored to
assess whether that monitoring should continue. Some considerations for deciding whether or not to
continue to monitor a well into the future should include:
Purpose of the monitoring.
Whether or not a well provides reliable data.
Well location relative to other monitoring in the region or state (in terms of coverage both
spatially and in various aquifers).
11
Whether or not a well is likely to change into production or be decommissioned.
Whether or not a well is too effected by neighboring pumping wells, and
Whether there is sufficient information regarding what a well is monitoring (e.g. well depth
and well construction information).
Regarding monitoring conducted to produce data used in statewide evaluations, the reality is that
hydrogeologic conditions vary significantly across the state, and it is impossible for the program’s
monitoring to be comprehensive. Therefore, the primary assumption is that if the program continues
to address regional needs, the data produced can be drawn upon when evaluating statewide issues.
Regarding how often wells should be monitored and what type of monitoring should occur there,
the program’s monitoring activities can be divided into hand measurements and electronic
transducer measurements. As described above, there are too many variables to generalize about how
and when data collection should occur to meet the program’s MQOs. However, ideally periodic
water-level measurements with e-tapes, steel tapes, or air lines should be made at least twice per
year. If a well is visited twice per year, generally this should occur in March prior to the start of the
irrigation season and in October after irrigation has ceased. If time constraints force a region to
collect measurements just once per year, a spring measurement is preferred. Long-term water-level
data are more valuable if consistently collected at the same time of year, so if possible timing of
visits should be consistent.
Time-series data collection using pressure transducer/data loggers provides more detail, but also
requires more effort. Optimally these sites should be visited at least 3 or 4 times per year to
download data, maintain the transducers, and collect static water level measurements. However,
budget, staff availability, and immediacy of the problem are all important considerations. If the
possibility of losing data and/or increased chance of error are acceptable, then visiting sites less
frequently may make sense. In other instances it may be necessary to seek more resources or request
outside help. If there is a chronic problem visiting all sites within a region, uploading data to EIM,
or adequately maintaining the quality of the data, it may be necessary to evaluate the region’s
overall monitoring commitment and drop some portion of the groundwater monitoring work.
The program’s current strategy is to arrange wells into regional well monitoring circuits - and that
approach should continue, since these circuits allow regional staff to visit wells efficiently and
logically. Information for each circuit should continue to be kept in three-ring well circuit binders,
with details on locating sites, tips for conducting measurements, and field sheets with the data.
12
Technology
In order for Water Resources’ monitoring efforts to be effective it is important to use appropriate
technology. Considerations include such factors as reliability, accuracy in deployed settings, costs,
and training. Water Resources staff already uses quite a bit of equipment well suited toward the
task, and generally the biggest current concern involves the number and types of pressure
transducers. To address this Water Resources recently purchased 95 new AquiStar PT2X
Submersible Pressure/Temperature Smart Sensor transducers (http://inwusa.com/products/smart-
sensors/pressure-and-level/pt2x/). Benefits to these units are that they have live memory (i.e. data
are not lost if the batteries go dead) and use replaceable batteries. Distribution of the new
transducers between the regions is as follows:
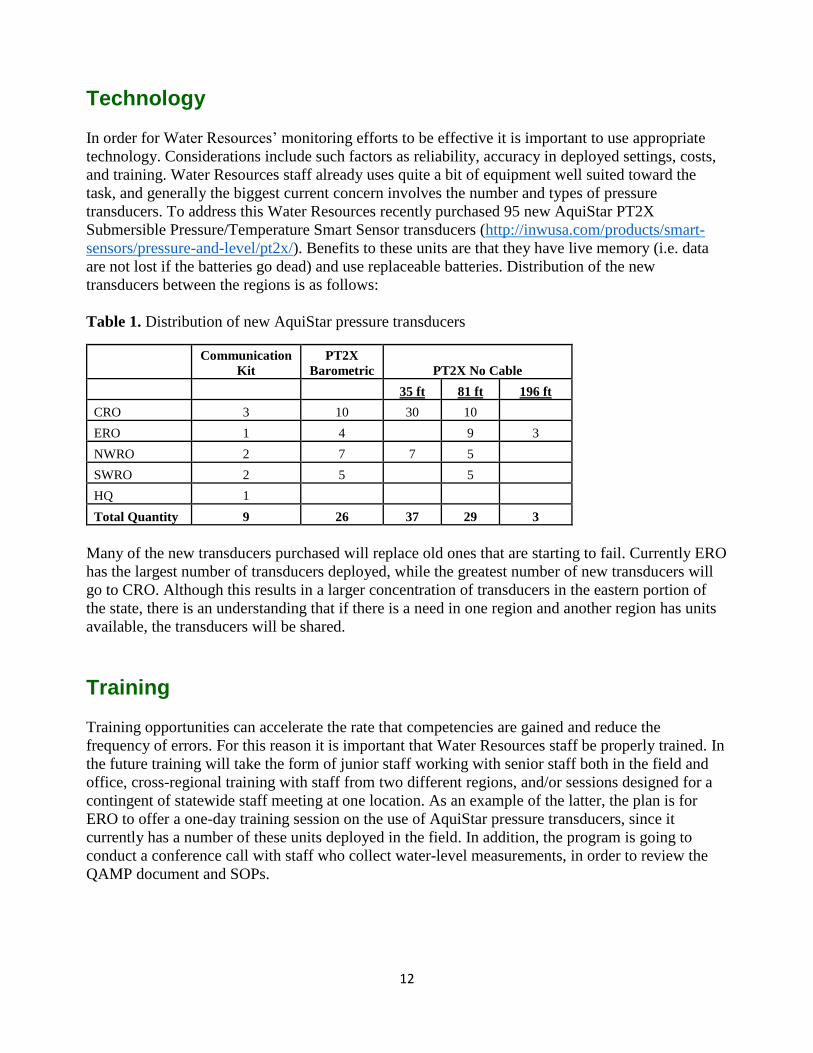
Table 1. Distribution of new AquiStar pressure transducers
Communication
Kit
PT2X
Barometric PT2X No Cable
35 ft 81 ft 196 ft
CRO 3 10 30 10
ERO 1 4 9 3
NWRO 2 7 7 5
SWRO 2 5 5
HQ 1
Total Quantity 9 26 37 29 3
Many of the new transducers purchased will replace old ones that are starting to fail. Currently ERO
has the largest number of transducers deployed, while the greatest number of new transducers will
go to CRO. Although this results in a larger concentration of transducers in the eastern portion of
the state, there is an understanding that if there is a need in one region and another region has units
available, the transducers will be shared.
Training
Training opportunities can accelerate the rate that competencies are gained and reduce the
frequency of errors. For this reason it is important that Water Resources staff be properly trained. In
the future training will take the form of junior staff working with senior staff both in the field and
office, cross-regional training with staff from two different regions, and/or sessions designed for a
contingent of statewide staff meeting at one location. As an example of the latter, the plan is for
ERO to offer a one-day training session on the use of AquiStar pressure transducers, since it
currently has a number of these units deployed in the field. In addition, the program is going to
conduct a conference call with staff who collect water-level measurements, in order to review the
QAMP document and SOPs.
13
Data Management
Data management involves the process of validating and storing data to provide access to future
information users. Storage of data in EIM ensures that such access is provided both internally and
externally to users of the agency’s environmental monitoring data.
As mentioned above, one of the areas with the biggest room for improvement with respect to Water
Resources’ groundwater monitoring is ensuring that all of the data collected are entered into EIM.
Currently all quality-checked well water-level data collected by CRO are uploaded into EIM.
Annually ERO enters quality-checked data from manually measured wells into EIM and has begun
to upload much of its transducer data to EIM. NWRO has all of its water level data entered into
EIM, while SWRO has only its manual water-level monitoring data entered into EIM. At this point
both NWRO and SWRO rely on EAP staff to enter any new data collected into EIM.
The goal for Water Resources is to enter all of the water-level data it collects into EIM. To help
accomplish this Water Resources plans to begin contributing a partial FTE toward an EIM data
coordinator that will work for EAP, and will enter all groundwater monitoring data into EIM for the
program. This makes sense since it takes time to keep current on the data submittal and it is more
efficient to have one person doing this than four. In the case of transducers, data reduction will still
occur in the regions, but this new position will upload the data into EIM.
One consideration regarding data management is that pressure transducers deployed by Water
Resources typically collect data hourly or perhaps every four hours, so much more data are
generated. Therefore, in order to meet the program’s EIM data commitment, more staff time needs
to be allotted to that task. A related area improvement involves the documentation and processing of
transducer data. Transducer data frequently require corrections for barometric pressure changes,
instrument drift, slippage of fastened cables, cable stretch, etc. EIM is designed to accept only
corrected transducer data, and since the process of correcting data can be complicated, it is prudent
not just to make corrections, but also to document this work soon after data corrections are made.
Once time-series data have been corrected, only corrected readings should be submitted into EIM.
Reporting
By entering its groundwater data into EIM, Water Resources makes data available to program and
other agency staff, consultants, and the general public. However, the program should regularly
interpret those data. At the request of Water Resources, EAP recently produced a GIS-based story
map that investigates and reports on groundwater level trends in Washington and the impacts of the
2015 drought (Sinclair, 2016). This presentation provides a basis for comparison of future
groundwater trends and impacts, and illustrates the status of groundwater resources to a wide
audience. Similar evaluations of all of Water Resources’ groundwater monitoring data should be
made on at least a once every other year basis. To make these evaluations more complete, reports
could potentially look at not just Water Resources data, but also long-term USGS or local agency
monitoring data, particularly at locations where Water Resources is not collecting any.
14
Conclusions
In conclusion, the Water Resources Program’s statewide groundwater monitoring network produces
a great deal of groundwater data used within the program, and by other agency programs, other state
agencies, federal agencies, and the public. Within Water Resources these data are used to support
water management decisions, and help regional staff understand and respond to issues associated
with various regional conditions.
Groundwater monitoring conducted by the program varies in the four regions, which makes sense
since the monitoring opportunities and data needs are very different on the west versus east sides of
the state. CRO and ERO both use the groundwater data they collect more extensively, since there
are many large irrigation areas there (many with significant groundwater declines), there is less
rainfall, and there are regionally extensive aquifers that allow data to be extrapolated. Conversely
water rights decisions at NWRO and SWRO typically rest mainly on the question of how
groundwater pumping affects streams, and trend data is used minimally or not at all.
For Water Resources the accuracies associated with the various measurement methods are the main
determinant for the MQOs as opposed to how the data will be used. For example, changes measured
on the order of feet per year are acceptable if the only data available are those derived from airlines
with a potential error of 2.5 feet per measurement. However, if a measurement made with an e-tape
for depths less than 250 feet can be as accurate as plus or minus 0.02 feet, then that is the MQO for
that type of measurement.
The Water Resources Program’s strategic approach is to be both realistic and opportunistic when it
comes to groundwater monitoring. Regarding where groundwater monitoring should be conducted
in the future, the same considerations that went into deciding where the program currently monitors
typically hold true today. In areas now monitored, most monitoring should continue. That said,
regional staff need to continually evaluate all of their groundwater monitoring activities to
determine where stations should be established or discontinued, how often measurements are
needed, staff skills required, and time necessary for monitoring.
The quality of the groundwater data collected by Water Resources historically has met the
program’s needs, has been defensible in court, and has been available to those outside the program.
However, to ensure the quality of data collected in the future, the program will adhere to the QAMP
and SOPs provided in Appendix A. Beyond this in order to advance all program groundwater
monitoring efforts, the approach to groundwater monitoring should include the following elements:
1. Quality Management System - a QAMP and SOPs that govern data acquisition to ensure
that data are of consistent, known quality.
2. Network Design - a monitoring system designed to meet program priorities and funding.
3. Technology - use of the best equipment for the task.
4. Training - learning opportunities to accelerate the rate that competencies are gained and
reduce the frequency of errors.
5. Data Management - a commitment to store data in EIM, potentially including having one
individual perform EIM data entry for the program.
6. Reporting – a process of reporting monitoring results on a once every other year basis to
illustrate the status of groundwater resources to a wide audience.
15
One area for improvement and one program goal is to ensure that all Water Resources groundwater
data collected are entered into EIM. A second area for improvement is the management of
transducer data. To address the former concern Water Resources plans to begin contributing a
partial FTE toward an EIM data coordinator that will work for EAP, and will enter all groundwater
monitoring data into EIM for the program. This makes sense since it takes time to keep current on
the data submittal and it is more efficient to have one person doing this than four. This should both
increase the likelihood that data will get entered into EIM and free up regional staff to carry out
other groundwater monitoring work. Also, to improve the management of transducer data, an SOP
is being established describing how data will be collected in a systematic, well-documented manner.
In order to achieve success implementing this groundwater monitoring strategy, Water Resources
will need to authorize regional staff to prioritize these activities over competing projects.
16
References
Department of Ecology Watershed Advancement Group, 2008. Ambient Groundwater Monitoring
Recommendations Report.
Drost, B.W. 2005. Quality-Assurance Plan for Ground-Water Activities, U.S. Geological Survey,
Washington Water Science Center, Open-File Report 2005-1126,
http://pubs.usgs.gov/of/2005/1126/pdf/ofr20051126.pdf
Freeman, L.A. et al. 2004. Use of Submersible Pressure Transducers in Water-Resources
Investigations, U.S. Geological Survey, Chapter A of Book 8, Instrumentation, Section A,
Instruments for Measurement of Water Level, Techniques of Water-Resources Investigations 8-A3,
https://pubs.usgs.gov/tWater Resourcesi/tWater Resourcesi8a3/pdf/tWater Resourcesi8-a3.pdf.
Pitz, C.F., 2016. Predicted Impacts of Climate Change on Groundwater Resources of Washington
State. Washington State Department of Ecology, Environmental Assessment Program, Publication
No. 16-03-006, https://fortress.wa.gov/ecy/publications/documents/1603006.pdf
Sinclair, K. 2016. 2014-15 Drought: Groundwater Level/Storage Response in Washington State.
Washington State Department of Ecology, Environmental Assessment Program, ESRI story map, http://waecy.maps.arcgis.com/apps/MapSeries/index.html?appid=b64d6f24e4894b878e47a209020b73a9
U.S. Army Field Manual. 2015. FM 5-484, Multiservice Procedures for Well-Drilling Operations,
http://www.globalsecurity.org/military/library/policy/army/fm/5-484/Ch8.htm
1
Table of Contents
Introduction ............................................................................................................................................... 2
Background ............................................................................................................................................... 2
Project Description .................................................................................................................................. 2
Organization and Schedule ................................................................................................................... 3
Quality Objectives .................................................................................................................................... 3
Measurement Process Design .............................................................................................................. 4
Measurement Procedures ...................................................................................................................... 6
Quality Control .......................................................................................................................................... 6
Training ....................................................................................................................................................... 8
Data Management Procedures ............................................................................................................. 8
Reporting and Groundwater Monitoring Assessments ................................................................. 9
References ................................................................................................................................................. 9
Appendix 1 - Groundwater Monitoring Standard Operating Procedures ................................ 10
Tables Table 1. Anticipated instrument accuracy and MQOs for water-level measurement methods. ................... 4 Table 2. Quality control steps taken during field activities. ......................................................................... 7
2
Introduction
The Washington State Department of Ecology (Ecology) Water Resources Program monitors wells
across the state to support water management decisions, and help regional staff understand and
respond to limited water availability, aquifers with declining water levels, streamflow depletion,
irrigation pattern, land use and landscape changes, and complaints. The program’s Integrated
Statewide Groundwater Monitoring Strategy (Ecology Publication No. 17-11-005, April, 2017)
provides background information on current groundwater monitoring, and indicates how activities
will be conducted in the future to address both regional and statewide issues. This appendix to that
strategy constitutes a Quality Assurance Monitoring Plan (QAMP) that describes the steps taken to
maintain integrity during groundwater monitoring activities. Appendix 1 below provides Standard
Operating Procedures (SOPs) that are followed by Water Resources staff when collecting data, so that
groundwater monitoring conducted will not differ substantially for similar activities.
Background
Water Resources monitors groundwater statewide in about 420 wells. Most wells are measured
manually on an infrequent basis (typically semi-annually), while others are measured at a high
frequency using pressure transducer/data loggers.
The program’s work varies in the four regions - which makes sense since the monitoring
opportunities and data needs are quite different on the west versus east sides of the state. CRO and
ERO both collect and use groundwater data more extensively, and approximately 80 percent of the
monitored wells are located east of the Cascade Mountains. In general the greater regional extent of
aquifers and greater number of irrigation wells in eastern Washington make it easier to conduct
groundwater monitoring there. Irrigation wells can make very useful monitoring wells, since they
have distinct non-pumping seasons and many are equipped with easily measured air lines. CRO and
ERO both use the collected groundwater data extensively, since there are a number of areas with
groundwater declines there, and the regional hydrogeology allows monitoring results to be
extrapolated more readily.
Project Description
The goals of Water Resources’ groundwater monitoring generally fall into two categories, including
monitoring conducted to produce data to support regional priorities, and monitoring conducted to
produce data to facilitate analyses of statewide significance. With respect to regional data use, the
goal of data collection is to help regional staff understand and respond to conditions such as limited
water availability, aquifers with declining water levels, streamflow depletion, irrigation patterns, land
use and landscape changes, and complaints. With respect to analyses of statewide significance, the
goal of groundwater data collection is have data available that provides the basis for evaluating
conditions across the state that might affect the program’s policy or legal decisions.
3
Organization and Schedule
Water Resources groundwater monitoring is conducted by different regional personnel based on staff
availability and competing projects. The primary regional contacts for this monitoring are:
Region Contact Email Phone
Central Regional Office (CRO) Chris Perra [email protected] 509-249-6298
Eastern Regional Office (ERO) Guy Gregory [email protected] 509-329-3509
Northwest Regional Office (NWRO) Jay Cook [email protected] 425-649-7013
Southwest Regional Office (SWRO) John Pearch [email protected] 360-407-0297
The primary contact for statewide groundwater monitoring issues is Tom Culhane,
[email protected], 360-407-7679. The program intends to establish an Environmental Information
Management System (EIM) data coordinator that will work for Ecology’s Environmental Assessment
Program (EAP) and enter all Water Resources groundwater monitoring data into EIM. That
individual will be the program’s data entry contact.
Most wells gauged with e-tapes, steel tapes or airlines are measured in March and September,
although ERO obtains spring (March) measurements alone on Odessa subarea wells. Wells where
time-series data are collected using pressure transducers are typically visited two to four times per
year, rarely with once per year visits at remote locations provided the risk of losing data is acceptable.
Quality Objectives
Both goals of the Water Resources Program - supporting regional priorities and facilitating analyses
of statewide significance - have similar Measurement Quality Objectives (MQOs). These MQOs are
fairly basic, since the program generally is concerned with fairly large changes in head over long
periods of time.
For Water Resources the accuracies associated with the various measurement methods are the main
determinant for MQOs, as opposed to how the data will be used. For example, changes measured on
the order of feet per year are acceptable if the only data available are those derived from airlines with
a potential measurement error of 2.5 feet. However, if measurements made with an e-tape for depths
less than 250 feet can be accurate to plus or minus 0.02 feet, then that is the MQO for that type of
measurement. Additionally, aquifer trends can be evaluated using measurements collected once per
year through manual measurements (provided the record is long enough) or once per hour using a
pressure transducers. Consequently there are too many variables to state simply that the program’s
MQOs will call for certain data collection methods or frequencies under certain situations.
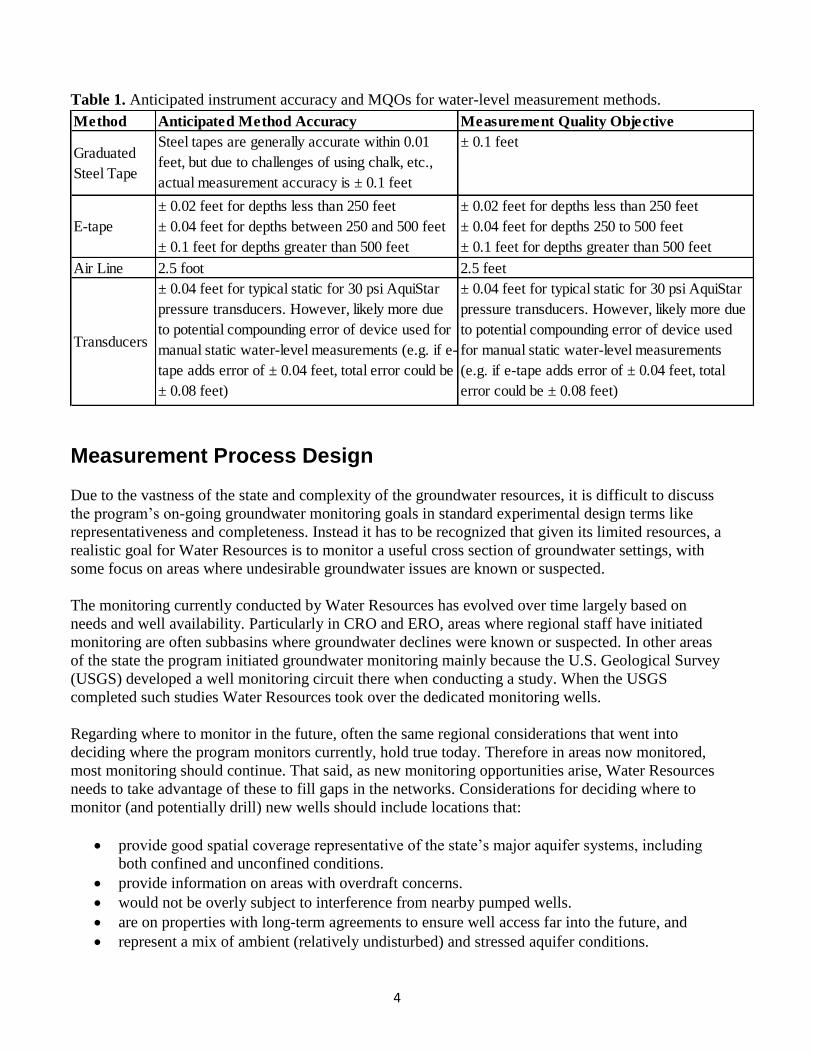
For the intended uses of the program, data of sufficient accuracy and frequency are collected provided
that reasonable care is taken while making groundwater measurements using the SOPs outlined in
Appendix 1. Table 1 below provides anticipated instrument accuracy and MQOs for the various
water-level measurement methods.
4
Table 1. Anticipated instrument accuracy and MQOs for water-level measurement methods.
Measurement Process Design
Due to the vastness of the state and complexity of the groundwater resources, it is difficult to discuss
the program’s on-going groundwater monitoring goals in standard experimental design terms like
representativeness and completeness. Instead it has to be recognized that given its limited resources, a
realistic goal for Water Resources is to monitor a useful cross section of groundwater settings, with
some focus on areas where undesirable groundwater issues are known or suspected.
The monitoring currently conducted by Water Resources has evolved over time largely based on
needs and well availability. Particularly in CRO and ERO, areas where regional staff have initiated
monitoring are often subbasins where groundwater declines were known or suspected. In other areas
of the state the program initiated groundwater monitoring mainly because the U.S. Geological Survey
(USGS) developed a well monitoring circuit there when conducting a study. When the USGS
completed such studies Water Resources took over the dedicated monitoring wells.
Regarding where to monitor in the future, often the same regional considerations that went into
deciding where the program monitors currently, hold true today. Therefore in areas now monitored,
most monitoring should continue. That said, as new monitoring opportunities arise, Water Resources
needs to take advantage of these to fill gaps in the networks. Considerations for deciding where to
monitor (and potentially drill) new wells should include locations that:
provide good spatial coverage representative of the state’s major aquifer systems, including
both confined and unconfined conditions.
provide information on areas with overdraft concerns.
would not be overly subject to interference from nearby pumped wells.
are on properties with long-term agreements to ensure well access far into the future, and
represent a mix of ambient (relatively undisturbed) and stressed aquifer conditions.
Method Anticipated Method Accuracy Measurement Quality Objective
Graduated
Steel Tape
Steel tapes are generally accurate within 0.01
feet, but due to challenges of using chalk, etc.,
actual measurement accuracy is ± 0.1 feet
± 0.1 feet
E-tape
± 0.02 feet for depths less than 250 feet
± 0.04 feet for depths between 250 and 500 feet
± 0.1 feet for depths greater than 500 feet
± 0.02 feet for depths less than 250 feet
± 0.04 feet for depths 250 to 500 feet
± 0.1 feet for depths greater than 500 feet
Air Line 2.5 foot 2.5 feet
Transducers
± 0.04 feet for typical static for 30 psi AquiStar
pressure transducers. However, likely more due
to potential compounding error of device used for
manual static water-level measurements (e.g. if e-
tape adds error of ± 0.04 feet, total error could be
± 0.08 feet)
± 0.04 feet for typical static for 30 psi AquiStar
pressure transducers. However, likely more due
to potential compounding error of device used
for manual static water-level measurements
(e.g. if e-tape adds error of ± 0.04 feet, total
error could be ± 0.08 feet)
5
Adding additional transducer-equipped wells in CRO is one example of a future monitoring need for
the program. Although CRO performs extensive periodic groundwater monitoring currently, only
three of the wells they monitor are equipped pressure transducers. Due to known groundwater
declines and other issues in that region, the intent is to increase that number.
Regional staff also need to continually evaluate the value of wells that are currently monitored to
assess whether that monitoring should continue. Some considerations for deciding whether or not to
continue to monitor a well into the future should include:
purpose of the monitoring.
whether or not a well provides reliable data.
well location relative to other monitoring in the region or state (in terms of coverage both
spatially and in various aquifers).
whether or not a well is likely to change into production or be decommissioned.
whether or not a well is too effected by neighboring pumping wells, and
whether there is sufficient information regarding what a well is monitoring (e.g. well depth
and well construction information).
Regarding how often wells should be monitored and what type of monitoring should occur, the
program’s monitoring activities can be divided into hand measurements and electronic transducer
data measurements - both designed to assemble water-level time-series data for each location.
Hand measurements include periodic water-level measurements conducted with e-tapes, steel tapes,
or air lines, with sites generally visited twice per year. If a well is visited twice per year, generally this
occurs in March prior to the start of the irrigation season and in October after irrigation has ceased. If
time constraints force a region to collect measurements just once per year, a spring measurement is
preferred. Long-term water-level data are more valuable if consistently collected at roughly the same
time of year, so if possible measurements should follow that practice.
Electronic pressure transducer/data loggers deployed by Water Resources typically collect data hourly
or perhaps every four hours. This means they produce much more detailed time-series information,
but installing these units and collecting the data requires more effort. Optimally these sites should be
visited at least 3 or 4 times per year to download data, maintain the transducers, and collect static
water level measurements.
In order to meet the program’s commitment to enter all its groundwater monitoring data into EIM,
there needs to be greater funding and staff time commitments to ensure that data processing and entry
occurs. If there is a chronic problem visiting all sites within a region, uploading data to EIM, or
adequately maintaining the quality of the data, it may be necessary to evaluate the region’s overall
monitoring commitment and drop some portion of the groundwater monitoring work.
The program’s strategy to arrange wells into regional well monitoring circuits that allow regional
staff to visit wells in particular areas efficiently and logically. Information for each circuit should
continue to be kept in three ring well circuit binders, with details on locating sites, tips for conducting
measurements, and field sheets with the data.
6
Measurement Procedures
Appendix 1 contains Standard Operating Procedures (SOPs) describing the program’s methods for
collecting water-level data using electric-tape, steel-tape, air-line, and pressure transducer methods, as
well as procedures for the collection of well site information, establishing a permanent measuring
point, measuring total well depth, disinfection of well monitoring equipment, and records
management are included. The procedures described were primarily developed from three sources,
including: the USGS, Washington Water Science Center document Quality-Assurance Plan for
Ground-Water Activities (Drost, 1995), and two groundwater monitoring SOPs developed by
Ecology’s Environmental Assessment Program, including Standard Operating Procedure for Manual
Well-Depth and Depth-to-Water Measurements, Version 1.1 (Marti, 2012) and Standard Operating
Procedure for the use of Submersible Pressure Transducers during Groundwater Studies, Version 1.1
(Sinclair and Pitz, 2015).
The Appendix 1 SOPs apply to the statewide groundwater water-level monitoring conducted by
Water Resources, primarily in the form of regional well monitoring circuits. However, the methods
described also apply to any other groundwater level measurements conducted by the program.
Quality Control
The procedures outlined in Table 2 below are followed by Water Resources staff to ensure that
quality control is maintained during field activities. Additional potential quality control steps are
identified in the Appendix 1 SOPs.
7
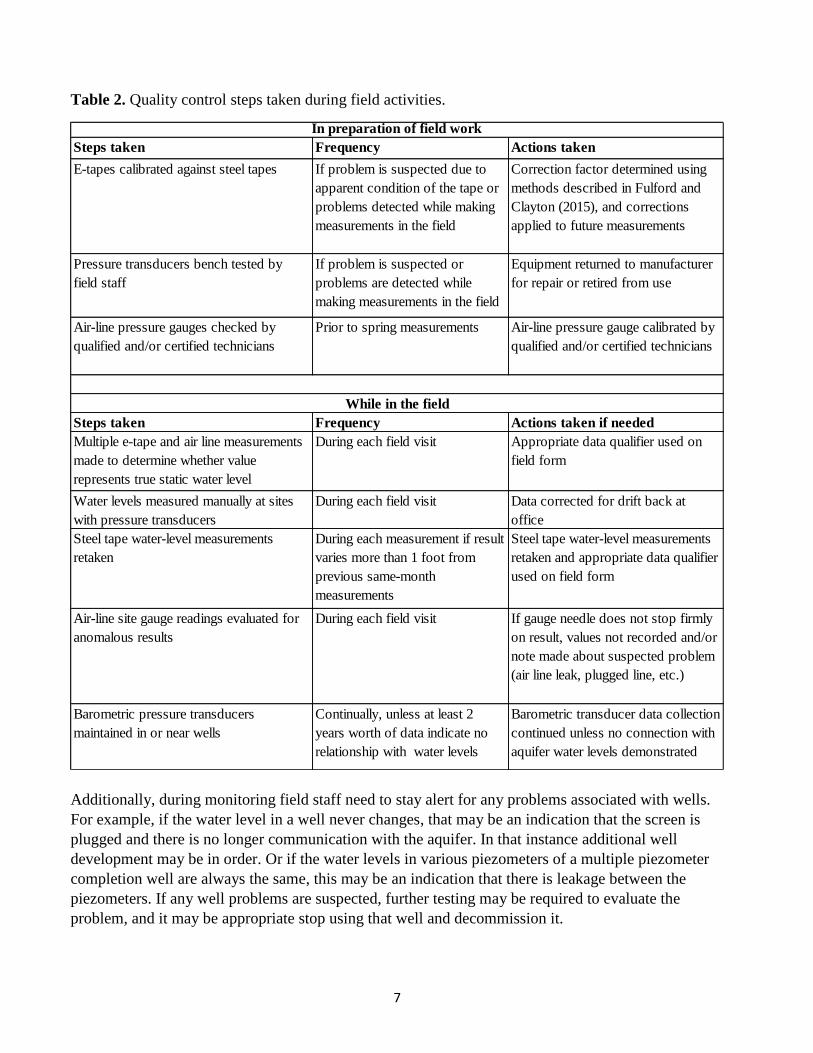
Table 2. Quality control steps taken during field activities.
Additionally, during monitoring field staff need to stay alert for any problems associated with wells.
For example, if the water level in a well never changes, that may be an indication that the screen is
plugged and there is no longer communication with the aquifer. In that instance additional well
development may be in order. Or if the water levels in various piezometers of a multiple piezometer
completion well are always the same, this may be an indication that there is leakage between the
piezometers. If any well problems are suspected, further testing may be required to evaluate the
problem, and it may be appropriate stop using that well and decommission it.
Steps taken Frequency Actions taken
E-tapes calibrated against steel tapes If problem is suspected due to
apparent condition of the tape or
problems detected while making
measurements in the field
Correction factor determined using
methods described in Fulford and
Clayton (2015), and corrections
applied to future measurements
Pressure transducers bench tested by
field staff
If problem is suspected or
problems are detected while
making measurements in the field
Equipment returned to manufacturer
for repair or retired from use
Air-line pressure gauges checked by
qualified and/or certified technicians
Prior to spring measurements Air-line pressure gauge calibrated by
qualified and/or certified technicians
Steps taken Frequency Actions taken if needed
Multiple e-tape and air line measurements
made to determine whether value
represents true static water level
During each field visit Appropriate data qualifier used on
field form
Water levels measured manually at sites
with pressure transducers
During each field visit Data corrected for drift back at
office
Steel tape water-level measurements
retaken
During each measurement if result
varies more than 1 foot from
previous same-month
measurements
Steel tape water-level measurements
retaken and appropriate data qualifier
used on field form
Air-line site gauge readings evaluated for
anomalous results
During each field visit If gauge needle does not stop firmly
on result, values not recorded and/or
note made about suspected problem
(air line leak, plugged line, etc.)
Barometric pressure transducers
maintained in or near wells
Continually, unless at least 2
years worth of data indicate no
relationship with water levels
Barometric transducer data collection
continued unless no connection with
aquifer water levels demonstrated
In preparation of field work
While in the field
8
Beyond these specific field quality control steps, the Water Resources statewide groundwater
monitoring strategy describes the following six elements that will be incorporated in the program’s
overall approach to ensure that data are of consistent, known quality:
1. Quality Management System - a QAMP and SOPs that govern data acquisition to ensure that
data are of consistent, known quality.
2. Network Design - a monitoring system designed to meet program priorities and funding.
3. Technology - use of the best equipment for the task.
4. Training - learning opportunities to accelerate the rate that competencies are gained and
reduce the frequency of errors.
5. Data Management - a commitment to store data in EIM, potentially including having one
individual perform EIM data entry for the program.
6. Reporting – a process of reporting monitoring results on a once every other year basis to
illustrate the status of groundwater resources to a wide audience.
Training
Training opportunities can accelerate the rate that competencies are gained and reduce the frequency
of errors. For this reason it is important that Water Resources staff be properly trained. In the future
training will take the form of junior staff working with senior staff both in the field and office, cross-
regional training with staff from two different regions, and/or sessions designed for a contingent of
statewide staff meeting at one location. As an example of the latter, in April 2017 ERO is offering a
one-day training session on the use of AquiStar pressure transducers, since it currently has a number
of these units deployed in the field. In addition, in 2017 the program will conduct a conference call
with staff who collect water-level measurements, in order to review the QAMP document and SOPs.
Data Management Procedures
Data Management involves the process of validating and storing data to provide access to future
information users. Storage of data in EIM ensures that such access is provided both internally and
externally to users of the agency’s environmental monitoring data.
Since transducer data frequently require corrections for such factors as barometric pressure,
instrument drift, cable slippage or stretch, etc., particular care needs to be taken with management of
these data. EIM is designed to accept only corrected transducer data, and since the process of
correcting data typically is complicated, corrections need to be made soon after field data are
downloaded. Once time-series data have been corrected, only corrected readings should be submitted
into EIM. Furthermore, since errors during data manipulation are possible, it is important to keep
notes of all field observations and subsequent data corrections.
Water Resources currently relies on EAP to enter some of the groundwater data it collects into EIM.
However, the Water Resources Program’s groundwater monitoring strategy calls for the program to
enter all water-level data it collects into EIM. To help accomplish this Water Resources plans to begin
contributing a partial FTE toward an EIM data coordinator that will work for EAP, and will enter all
9
groundwater monitoring data into EIM for the program. This makes sense since it takes time to keep
current on the data submittal and it is more efficient to have one person doing this than four.
Therefore in the case of transducers, data reduction will still occur in the regions, but this new
individual will upload the data into EIM.
Reporting and Groundwater Monitoring Assessments
By entering its groundwater data into EIM, Water Resources makes data available to program and
other agency staff, consultants, and the general public. However, the program’s strategy also includes
producing reports with interpretations of the program’s groundwater monitoring data, including
groundwater trends and impacts, on a once every other year basis. As described in the Water
Resources statewide groundwater monitoring strategy, these reports may take a form similar to the
Sinclair (2016) GIS-based story map that investigated groundwater level trends in Washington and
the impacts of the 2015 drought.
References
Culhane, T.J. 2017. Water Resources Program Integrated Statewide Groundwater Monitoring
Strategy. Washington State Department of Ecology, Water Resources Program, Ecology Publication
No. 17-11-005
Drost, B.W. 2005. Quality-Assurance Plan for Ground-Water Activities, U.S. Geological Survey,
Washington Water Science Center, Open-File Report 2005-1126,
http://pubs.usgs.gov/of/2005/1126/pdf/ofr20051126.pdf
Fulford, J.M., and Clayton, C.S., 2015. Accuracy testing of steel and electric groundwater-level
measuring tapes—Test method and in-service tape accuracy: U.S. Geological Survey Open-File
Report 2015–1137, 31 p., http://dx.doi.org/10.3133/ofr20151137
Marti, P.B. 2012. Standard Operating Procedure for Manual Well-Depth and Depth-to-Water
Measurements, Version 1.1, Washington State Department of Ecology, Environmental Assessment
Program,
http://www.ecy.wa.gov/programs/eap/qa/docs/ECY_EAP_SOP_ManualWellDepth&DepthtoWaterM
easures_v_1_1EAP052.pdf
Sinclair, K. 2016. 2014-15 Drought: Groundwater Level/Storage Response in Washington State.
Washington State Department of Ecology, Environmental Assessment Program, ESRI story map, http://waecy.maps.arcgis.com/apps/MapSeries/index.html?appid=b64d6f24e4894b878e47a209020b73a9
Sinclair, K. and Pitz, C.F. 2015. Standard Operating Procedure for the use of Submersible Pressure
Transducers during Groundwater Studies, Version 1.1, Washington State Department of Ecology,
Environmental Assessment Program,
http://www.ecy.wa.gov/programs/eap/qa/docs/ECY_EAP_SOP_SubmersiblePressureTransducers_v1
_1EAP074.pdf
10
Appendix 1
Washington State Department of Ecology Water Resources Program
Groundwater Monitoring Standard Operating Procedures
February 2017
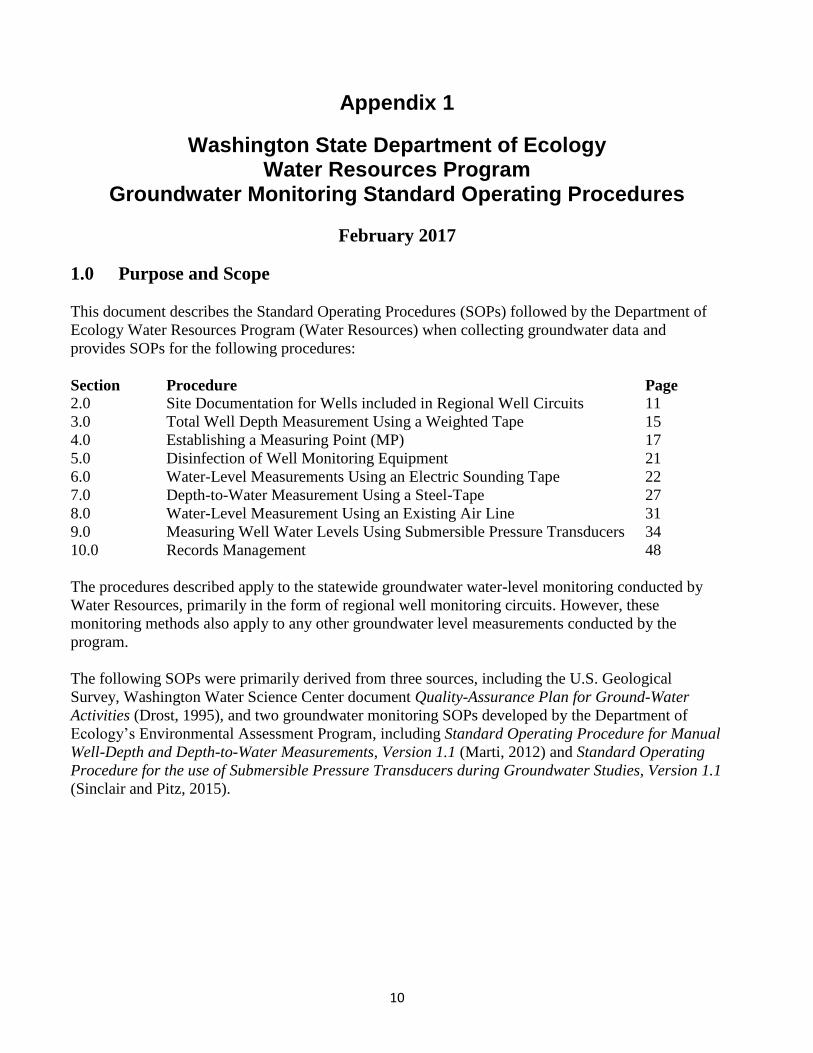
1.0 Purpose and Scope
This document describes the Standard Operating Procedures (SOPs) followed by the Department of
Ecology Water Resources Program (Water Resources) when collecting groundwater data and
provides SOPs for the following procedures:
Section Procedure Page
2.0 Site Documentation for Wells included in Regional Well Circuits 11
3.0 Total Well Depth Measurement Using a Weighted Tape 15
4.0 Establishing a Measuring Point (MP) 17
5.0 Disinfection of Well Monitoring Equipment 21
6.0 Water-Level Measurements Using an Electric Sounding Tape 22
7.0 Depth-to-Water Measurement Using a Steel-Tape 27
8.0 Water-Level Measurement Using an Existing Air Line 31
9.0 Measuring Well Water Levels Using Submersible Pressure Transducers 34
10.0 Records Management 48
The procedures described apply to the statewide groundwater water-level monitoring conducted by
Water Resources, primarily in the form of regional well monitoring circuits. However, these
monitoring methods also apply to any other groundwater level measurements conducted by the
program.
The following SOPs were primarily derived from three sources, including the U.S. Geological
Survey, Washington Water Science Center document Quality-Assurance Plan for Ground-Water
Activities (Drost, 1995), and two groundwater monitoring SOPs developed by the Department of
Ecology’s Environmental Assessment Program, including Standard Operating Procedure for Manual
Well-Depth and Depth-to-Water Measurements, Version 1.1 (Marti, 2012) and Standard Operating
Procedure for the use of Submersible Pressure Transducers during Groundwater Studies, Version 1.1
(Sinclair and Pitz, 2015).
11
2.0 Site Documentation for Wells included in Regional Well Circuits
2.1 Purpose
To specify procedures for a well site inventory when a well is to be included in one of the program’s
regional well monitoring circuits.
2.2 General Description
Basic information must be gathered at sites to properly identify wells and collect water-level data of
value. Data storage in the Department of Ecology’s Environmental Information Management System
(EIM) ensures access to users of the agency’s monitoring data, and therefore data collected should be
entered into EIM. Consequently, EIM site data requirements are one indication of what basic site
information must be collected. Information on the EIM data requirements are discussed in Section
10.2.2 - Well Location Information. Some of the information discussed in that section must be
obtained in the field and some of it can be developed back at the office.
In order to be efficient, regional offices have arranged the wells they monitor into well circuits, so
that all wells in a particular area can be measured efficiently and in a logical sequence. Information
for each of these circuits is kept in a well circuit binder - with information on locating a site, tips for
conducting the measurements, and the actual field data. These binders are separated by dividers into
sections for each individual well, and much of the following information is used to develop the
information provided about wells in these binders.
2.3 Materials and Instruments
1. A state highway or county road map, and a USGS 7.5-minute topographic quadrangle.
2. A Global Positioning System (GPS) instrument.
3. Form A1 - Well Site Documentation Form
4. Orienteering compass (optional).
5. Equipment for water-level measurements, dependent on method to be used.
6. Pen or pencil.
7. Camera.
8. Water Well Report from the program’s well log data base, or other documents pertaining to
the well that is being inventoried.
2.4 Data Accuracy and Limitations
1. Latitude and longitude values determined using a GPS instrument can be read to the nearest
tenth of a second and generally are accurate to at least one-half second. Also, the data Editor
module of EIM has GIS-based mapping tools that enable users to enter new well information
and define latitude, longitude and land surface elevations to a high degree of accuracy.
2. Well construction information obtained from a well driller is generally more reliable than
information obtained verbally from a well owner.
3. Altitudes determined from topographic maps are accurate to within one-half of the map
contour interval.
2.5 Assumptions
1. A ground-water site is a single point, not a geographic area or property.
2. Latitude and longitude obtained with a GPS instrument can be read to the nearest tenth of a
second and generally are accurate to at least one-half second.

12
3. All field notes are neat, legible, and leave no doubt about interpretation.
2.6 Instructions
At each site all information listed on Form A1 - Well Site Documentation Form should be
collected. Some considerations for this information collection include:
1. Well tag number, if present - If a well has not been previously tagged, it should be tagged. A
description of the procedure for tagging a well is described in EAP’s SOP EAP081- Standard
Operating Procedure for Tagging Wells (Pitz, 2011).
2. Well construction information - If a water well report is available from Water Resources well
log data base this should be brought to the field and verified with the well owner. If Water
Resources does not have a log on file, the owner may be able to provide one, or may be able
to provide some well information.
3. Photographs - Take photographs of the well location (noting the direction of view) and the
measuring point (MP) on the well. Preferably photographs will include something printed
indicating the well number or other identifying information.
4. Well Location Information - Determine and record the horizontal location of the well with a
GPS as follows (also see note below):
a. Place the GPS unit as close as possible to the well while still permitting the maximum
number of satellites (avoid interference from metal buildings, power lines, etc.).
b. Record the position of the GPS unit relative to the well (e.g., 40 ft southwest of well –
to avoid metal well house).
c. Once a steady reading of the GPS instrument is obtained, record the latitude,
longitude, number of satellites, estimated position error, Coordinates Reference
System, and datum used. Latitude and longitude should be recorded in decimal
degrees.
5. Determine and record the altitude of the well as follows (also see note below):
a) If it is possible to place a GPS directly on the well, record the altitude indicated. (Note:
vertical accuracy provided by GPS is much less than horizontal accuracy.)
b) Other methods may be used in the office to verify and improve vertical well location
information, such as plotting the location on a topographic map and reading land
surface elevation contours, or using GIS LIDAR.
6. Site sketch map (see description of form).
7. Water-Level Measurement - Measure water level in the well following the appropriate
procedure for the method used as described in Sections 5.0 through 9.0.
Once site information has been compiled a copy of the well documentation form, photographs, and
other useful information should be placed in the well circuit binder as a field reference. Copies of this
information should also be kept in the office, in case the field binder is ever lost.
Note: The data Editor module of EIM that is typically used to enter new wells has GIS-based
mapping tools that enable users to define latitude, longitude and land surface elevations to a high
degree of accuracy. These tools can be used to check the coordinates and elevations determined with
the hand held GPS in the field, and an additional advantage is that they provide locations and
elevations in agency standard format.
13
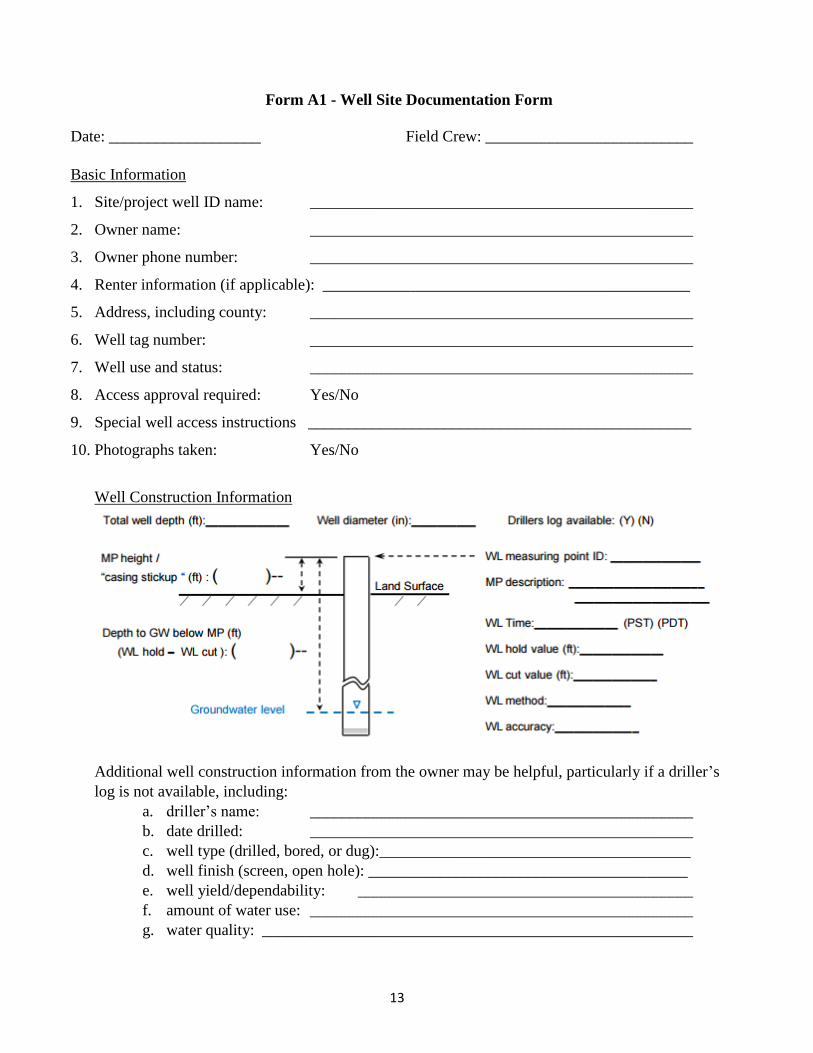
Form A1 - Well Site Documentation Form
Date: ___________________ Field Crew: __________________________
Basic Information
1. Site/project well ID name: ________________________________________________
2. Owner name: ________________________________________________
3. Owner phone number: ________________________________________________
4. Renter information (if applicable): ______________________________________________
5. Address, including county: ________________________________________________
6. Well tag number: ________________________________________________
7. Well use and status: ________________________________________________
8. Access approval required: Yes/No
9. Special well access instructions ________________________________________________
10. Photographs taken: Yes/No
Well Construction Information
Additional well construction information from the owner may be helpful, particularly if a driller’s
log is not available, including:
a. driller’s name: ________________________________________________
b. date drilled: ________________________________________________
c. well type (drilled, bored, or dug):_______________________________________
d. well finish (screen, open hole): ________________________________________
e. well yield/dependability: __________________________________________
f. amount of water use: ________________________________________________
g. water quality: ______________________________________________________
14
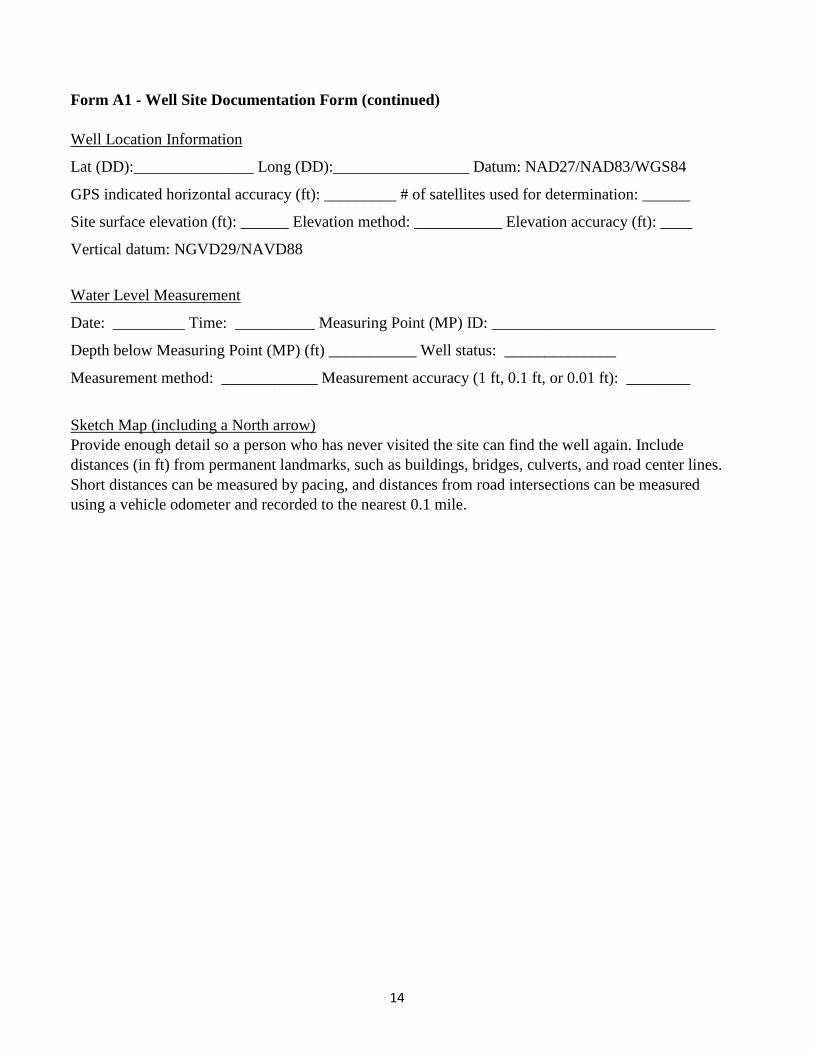
Form A1 - Well Site Documentation Form (continued)
Well Location Information
Lat (DD):_______________ Long (DD):_________________ Datum: NAD27/NAD83/WGS84
GPS indicated horizontal accuracy (ft): _________ # of satellites used for determination: ______
Site surface elevation (ft): ______ Elevation method: ___________ Elevation accuracy (ft): ____
Vertical datum: NGVD29/NAVD88
Water Level Measurement
Date: _________ Time: __________ Measuring Point (MP) ID: ____________________________
Depth below Measuring Point (MP) (ft) ___________ Well status: ______________
Measurement method: ____________ Measurement accuracy (1 ft, 0.1 ft, or 0.01 ft): ________
Sketch Map (including a North arrow)
Provide enough detail so a person who has never visited the site can find the well again. Include
distances (in ft) from permanent landmarks, such as buildings, bridges, culverts, and road center lines.
Short distances can be measured by pacing, and distances from road intersections can be measured
using a vehicle odometer and recorded to the nearest 0.1 mile.
15
3.0 Total Well Depth Measurement Using a Weighted Tape
3.1 Purpose
To measure the total depth of a well below land-surface datum using a graduated steel tape.
3.2 General Description
In order to understand what formation a well is monitoring, it is important to know the total depth
and/or screened interval of a well below land-surface. Typically this information is provided on a well
log, however, when it is not the total well depth often can be measured with a weighted graduated
tape. This method generally works best for wells less than 200-ft deep, since the weight of the tape
itself can make it difficult to sense the bottom of the well. In some instances when other is equipment
down a well (submersible pumps, riser pipes, centralizers, etc.), it is not possible obtain a
measurement using this technique.
3.2 Materials and Instruments
1. Steel tape or other graduated measuring device calibrated in feet, tenths and hundredths of
feet. A break-away brass, stainless steel, or iron weight should be attached to the end of the
tape strongly enough to hold the weight, but not so strong that it won’t pull free if the weight
becomes lodged (using something like fishing line).
2. Diluted household chlorine bleach solution with 1 part bleach to 20 parts tap water. Fresh
solutions should be mixed when old ones becomes visibly contaminated or at least every
several days, since residual chlorine concentrations diminish over time due to volatilization.
3. Roll of single-use paper towels.
4. Nitrile or latex gloves (optional)
5. Tool box.
6. Pen or pencil.
7. Gloves, of leather or other protective material (optional).
3.3 Data Accuracy and Limitations
1. A graduated steel tape commonly is accurate to 0.01 ft.
2. If the well casing is angled instead of vertical, the well depth should be corrected.
3.4 Instructions
1. If available bring any previous total depth measurement data for the well.
2. Use a calibrated measuring device.
3. Measure from the zero point on the tape to the bottom of the weight. Record this number as
the length of the weight interval.
4. Gain access to the well casing by removing the well cover, the well cap, the well access port
plug, etc.
5. If possible, remove any dedicated down-hole pumps or instrumentation.
6. Check that the measuring point (MP) is clearly marked. If a new MP needs to be established,
follow the procedures described in Section 4.0.
7. Clean or disinfect the portion of tape that will be lowered into the well using the procedures
described in Section 5.0.
8. Slowly lower the tape into the well until the weighted end reaches the bottom of the well and
the tape becomes slack.
16
9. To protect the tape as it is lowered, avoid letting the tape rub across the top edge of the well
casing rim or other rough surfaces.
10. Raise the tape until it is taut (the weighted end is vertical and off the bottom of the well).
Slowly lower the tape again to refine the point where the tape goes slack. This technique is
referred to as “sounding” the bottom of the well.
11. When the weighted tape touches the bottom of the well, pinch the tape between finger nails at
the point opposite the MP. This position on the tape is referred to as the “Hold”.
12. Read the tape scale held at the MP.
13. Withdraw the tape from the well 1–2 ft, so that the weight will hang freely above the bottom
of the well. Repeat measurement(s) until two consistent depth readings are obtained.
14. Calculate total well depth below land-surface datum (LSD) as follows: (Tape reading held at
the MP) + (Length of the weight interval) +/– (MP stick up) = total well depth below LSD. If
the device used to measure the well depth is missing a portion of the lower tape, the measured
depth can be corrected using the formula: (Tape reading held at the MP, a.k.a. “hold”) -
(length of missing tape, a.k.a. “cut) = Corrected tape reading relative to MP.
15. If the well casing is angled instead of vertical, the well depth can be corrected by measuring
the angle of deviation from vertical, then using the relationship: true well depth = (measured
depth) X cosine of measured angle.
16. Record the total well depth to the nearest foot.
17
4.0 Establishing a Measuring Point
4.1 Purpose
To establish a reference point from which all water levels are measured for a particular well.
4.2 General Description
A permanent measuring point (MP) from which all future depth-to-water/water levels will be
measured must be established for each well to ensure data comparability. MPs are normally
established on the top rim of the actual well casing – a position commonly referred to as ‘Top of
Casing’ (TOC), however, since casing tops are not always readily accessible, MPs can be other easily
identified features. The MP value will be used to convert measurements into values that are relative to
land surface.
4.3 Materials and Instruments
1. A tape graduated in feet, tenths, and hundredths of feet.
2. Pen or pencil.
3. Paintstick or marking pen in a bright color.
4. Tool box.
5. Field note book.
4.4 Data Accuracy and Limitations
MPs generally are established to the nearest 0.1 ft using a pocket tape to measure the distance from
the MP to the land surface datum (LSD). MPs change from time to time, especially on private wells.
In such instances, it is important to measure the relative differences between MPs. With multiple
MPs, after the first MP is established, all latter MPs should be measured to a precision of 0.01 ft,
relative to the first MP. For example, if an MP has been established on a well at the top of casing and
recorded as being 1.2 ft above LSD, and then a 0.52-ft piece of casing is added to the top of the well,
the new MP should be recorded as 1.72 ft above LSD (1.2 + 0.52).
4.5 Assumption
For comparability, water-level measurements must be referenced to the same datum.
4.6 Instructions
Because there can be differences in establishing MPs for dedicated monitoring wells versus water
supply wells, the two are discussed separately below.
Establishing a MP on Dedicated Monitoring Wells
1. Locate the MP at a convenient place from which to measure the water level. MPs are ideally
established on the top rim of the actual well casing, (known as TOC, see Figure 1 below).
However, since casing tops are not always readily accessible, MPs can be other features such
as a slant tube access port, an access port in the well cap, etc.
2. If establishing a MP in a well with a dedicated pump, it is prudent to establish the MP at a
location where the e-tape, etc. is less likely to get hung up on the pump power cables and
other obstacles.
3. If there is no preferred location for the MP, a good option is to establish this on the north side
of the casing rim. If a casing has been cut at a steep angle it is generally best to establish MP
at the lowest point of the casing rim.
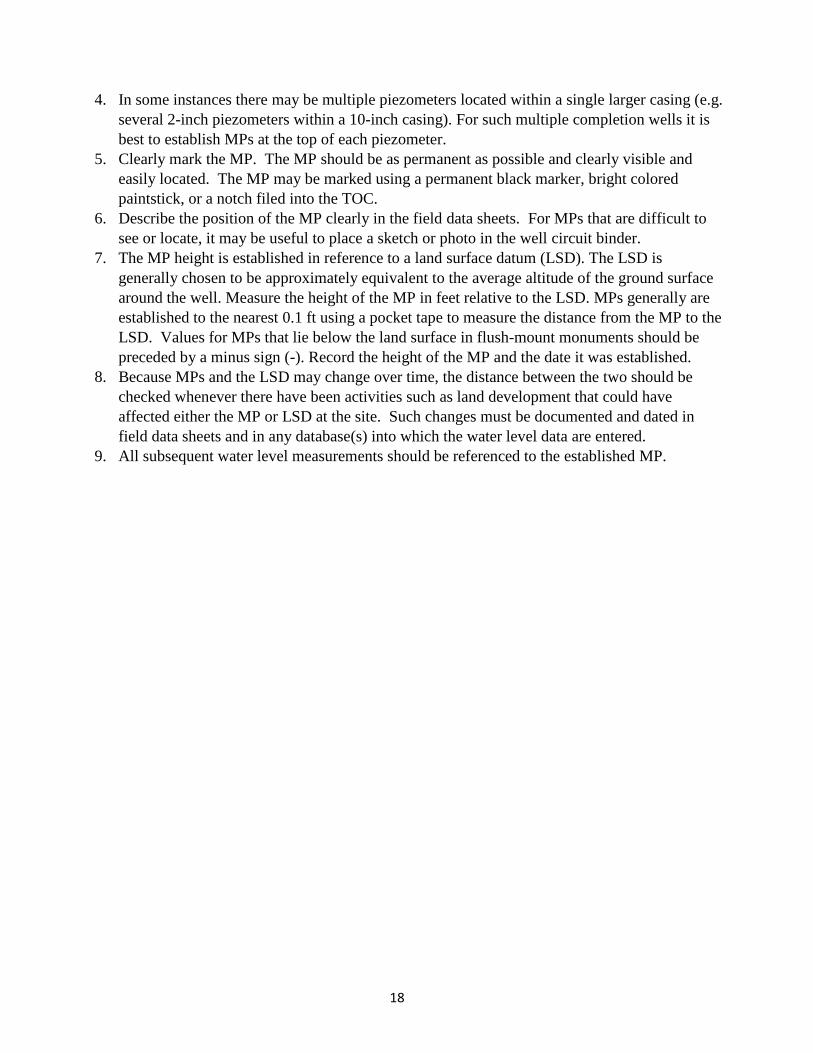
18
4. In some instances there may be multiple piezometers located within a single larger casing (e.g.
several 2-inch piezometers within a 10-inch casing). For such multiple completion wells it is
best to establish MPs at the top of each piezometer.
5. Clearly mark the MP. The MP should be as permanent as possible and clearly visible and
easily located. The MP may be marked using a permanent black marker, bright colored
paintstick, or a notch filed into the TOC.
6. Describe the position of the MP clearly in the field data sheets. For MPs that are difficult to
see or locate, it may be useful to place a sketch or photo in the well circuit binder.
7. The MP height is established in reference to a land surface datum (LSD). The LSD is
generally chosen to be approximately equivalent to the average altitude of the ground surface
around the well. Measure the height of the MP in feet relative to the LSD. MPs generally are
established to the nearest 0.1 ft using a pocket tape to measure the distance from the MP to the
LSD. Values for MPs that lie below the land surface in flush-mount monuments should be
preceded by a minus sign (-). Record the height of the MP and the date it was established.
8. Because MPs and the LSD may change over time, the distance between the two should be
checked whenever there have been activities such as land development that could have
affected either the MP or LSD at the site. Such changes must be documented and dated in
field data sheets and in any database(s) into which the water level data are entered.
9. All subsequent water level measurements should be referenced to the established MP.
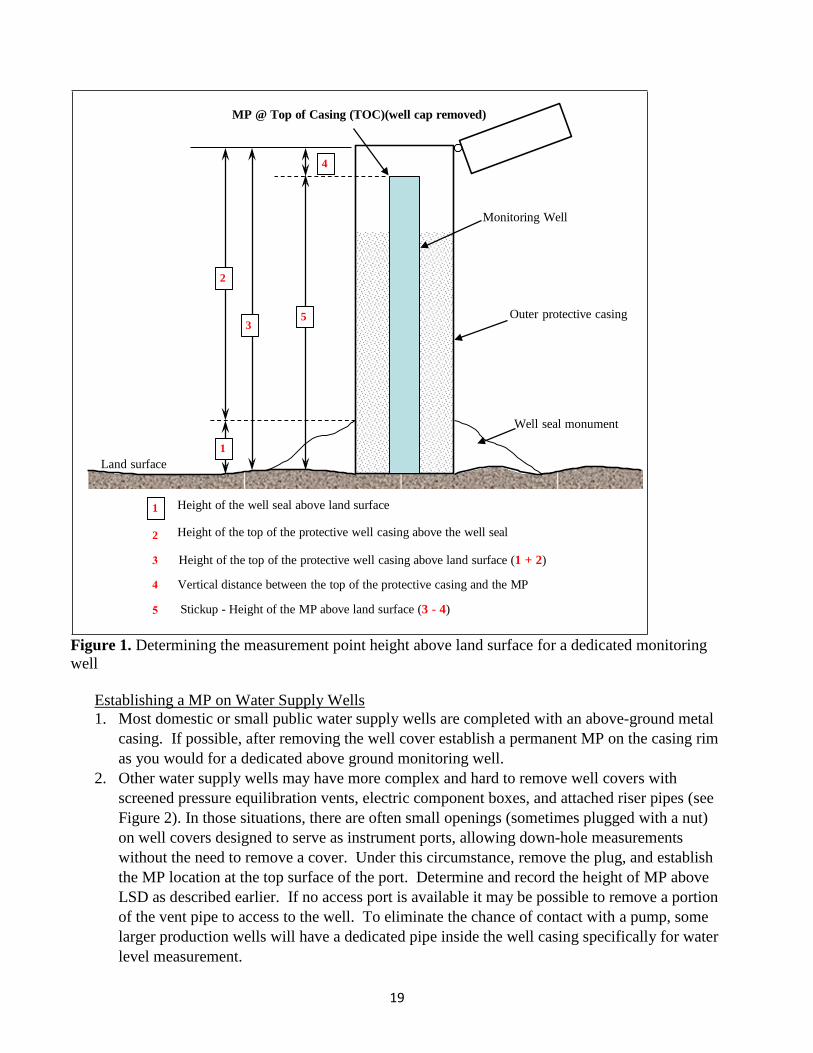
19
Figure 1. Determining the measurement point height above land surface for a dedicated monitoring
well
Establishing a MP on Water Supply Wells
1. Most domestic or small public water supply wells are completed with an above-ground metal
casing. If possible, after removing the well cover establish a permanent MP on the casing rim
as you would for a dedicated above ground monitoring well.
2. Other water supply wells may have more complex and hard to remove well covers with
screened pressure equilibration vents, electric component boxes, and attached riser pipes (see
Figure 2). In those situations, there are often small openings (sometimes plugged with a nut)
on well covers designed to serve as instrument ports, allowing down-hole measurements
without the need to remove a cover. Under this circumstance, remove the plug, and establish
the MP location at the top surface of the port. Determine and record the height of MP above
LSD as described earlier. If no access port is available it may be possible to remove a portion
of the vent pipe to access to the well. To eliminate the chance of contact with a pump, some
larger production wells will have a dedicated pipe inside the well casing specifically for water
level measurement.
1
MP @ Top of Casing (TOC)(well cap removed)
4
Monitoring Well
2
3 5 Outer protective casing
Well seal monument
1
Land surface
Height of the well seal above land surface
2 Height of the top of the protective well casing above the well seal
Height of the top of the protective well casing above land surface (1 + 2)
Vertical distance between the top of the protective casing and the MP
Stickup - Height of the MP above land surface (3 - 4)
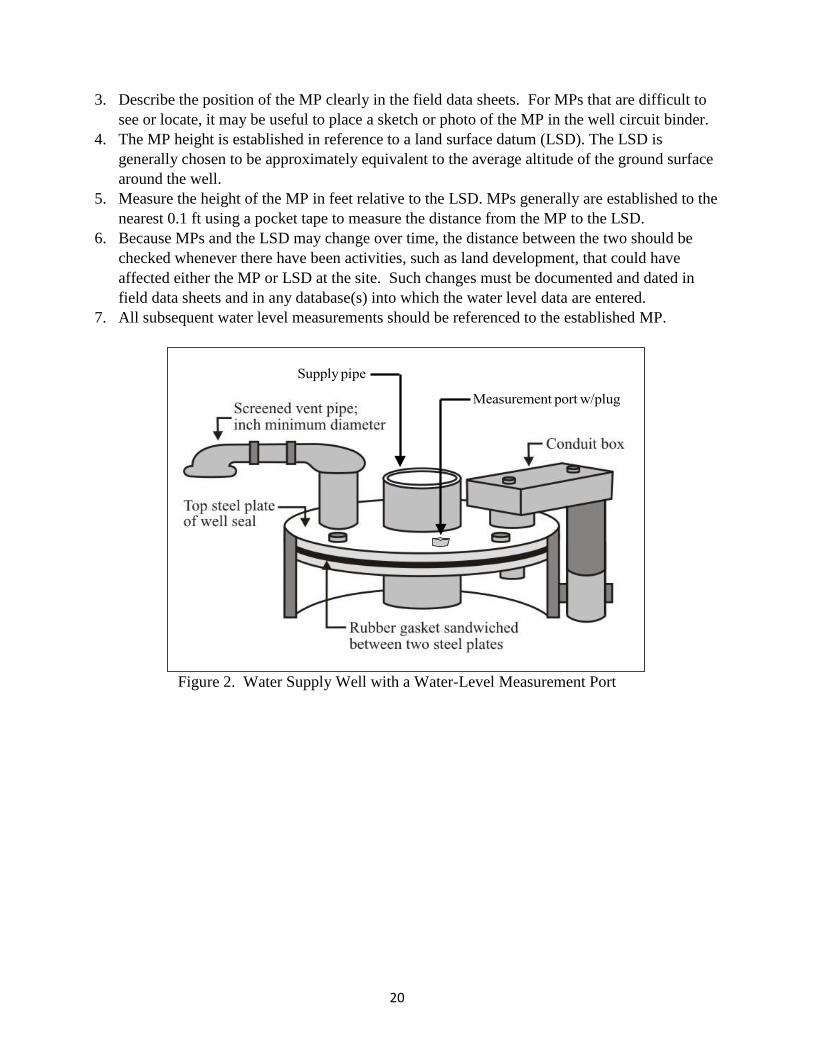
20
3. Describe the position of the MP clearly in the field data sheets. For MPs that are difficult to
see or locate, it may be useful to place a sketch or photo of the MP in the well circuit binder.
4. The MP height is established in reference to a land surface datum (LSD). The LSD is
generally chosen to be approximately equivalent to the average altitude of the ground surface
around the well.
5. Measure the height of the MP in feet relative to the LSD. MPs generally are established to the
nearest 0.1 ft using a pocket tape to measure the distance from the MP to the LSD.
6. Because MPs and the LSD may change over time, the distance between the two should be
checked whenever there have been activities, such as land development, that could have
affected either the MP or LSD at the site. Such changes must be documented and dated in
field data sheets and in any database(s) into which the water level data are entered.
7. All subsequent water level measurements should be referenced to the established MP.
Figure 2. Water Supply Well with a Water-Level Measurement Port
21
5.0 Disinfection of Well Monitoring Equipment
5.1 Purpose
This procedure describes how to disinfect well monitoring equipment.
5.2 General Description
It is important to make sure no equipment is placed down a drinking water supply well casing that
could spread contamination such as coliform or iron bacteria. When dealing with multiple wells that
are dedicated to water-level monitoring only, probes often are not disinfected between wells.
However, before conducting monitoring of all water supply wells, any portion of monitoring
equipment that could spread contamination must be disinfected between wells. In general monitoring
of well water levels is conducted with electric tapes (e-tapes), and as described here the preferred
disinfection method involves submerging at least the first 5–10 feet of e-tape and the weights in a 5
gallon bucket filled with a dilute solution of water and chlorine bleach.
5.3 Materials and Instruments
1. Diluted household chlorine bleach solution with 1 part bleach to 20 parts tap water. Fresh
solutions should be mixed when old ones becomes visibly contaminated, or at least every
several days since residual chlorine concentrations diminish over time due to volatilization.
2. 5 gallon plastic bucket with lid for bucket method.
3. Spray bottle for the spray method.
4. Roll of single-use paper towels.
5. Nitrile or Latex gloves (optional).
6. Clothing that could not be ruined if bleach is spilled on them.
5.4 Instructions
1. Before making a measurement in a well used for drinking-water supply, the weights and the
portion of the tape that will pass below the water level must be disinfected. Ideally this is done
just prior to placing the e-tape down the next well; however, it can be done right after the
previous well. If it is not known whether a probe was previously disinfected, then disinfection
of the tape must occur before placing it down the next well.
2. Before heading to the field, create a roughly 20:1 dilute household chlorine bleach disinfectant
solution (if mixing in a 5 gallon bucket, fill bucket almost full of water, then add one quart of
bleach). When dealing with a dilute bleach solution, Latex or Nitrile gloves are recommended,
both to increase sanitary condition and to protect the individual.
3. The preferred method of disinfection is to submerge the tape and weights in the dilute bleach
solution and generally it is only practical to submerge the first 5–10 ft of e-tape. If necessary,
the rest can be disinfected by running the tape over a clean cloth soaked in the bleach solution
as the tape is lowered into the well. It helps to have two individuals do this procedure.
4. Although it is not as effective, the spray bottle method is an option in situations where the e-
tape is not visibly contaminated. With this method a spray bottle filled with a dilute 20:1 water
and chlorine bleach solution is sprayed onto the tape once it has been rolled back onto the reel.
5. If the end of an e-tape is visibly contaminated as it is removed from a well (e.g. there is
significant rust), the tape must be cleaned as it is pulled onto the reel. This is achieved by
running the e-tape over a paper towel soaked with the dilute 20:1 water and chlorine bleach
solution (periodically replacing the towel with a clean one).
22
6.0 Water-Level Measurements Using an Electric Sounding Tape
6.1 Purpose
This procedure describes how to measure the depth to water surface below a MP using the electric-
tape (e-tape).
6.2 General Description
An e-tape consists of a battery, an indicator (buzzer and/or light) and an insulated wire with markings,
generally in feet and 0.01-ft intervals. A weight is suspended from the bottom of the tape so that it can
drop down to the water. Electrical current flows through the wire when the lower end of it touches the
water surface and completes the electrical circuit. To read the static water level, the wire is lowered
until it touches the water surface and the indicator beeps or a light goes off. A mark (MP) on the top
of the casing or piezometer is designated as the reference point from which measurements are made.
Water Resources uses several different types of e-tapes, which vary in the type of calibration (older
styles are only calibrated every 5 feet) and length. E-tapes measurements can be made easily and
quickly compared to other methods, which can be particularly important during aquifer tests. The
major disadvantage is that an e-tape may stretch and become less accurate than a steel tape.
6.3 Materials and Instruments
1. E-tape water-level measurement device graduated in 0.01-ft intervals and mounted on a hand-
cranked supply reel that contains space for batteries and some device for signaling when the
circuit is closed. A break-away brass, stainless steel, or iron weight should be attached to the
end of the tape, strong enough to hold the weight, but not so strongly as to prevent it from
pulling free if the weight becomes lodged. The weights most commonly used by Water
Resources are “sausage weights” - alternating several-inch long segments of surgical tubing
and stainless steel or brass rods.
2. Pen or pencil.
3. Water-level measurement field data sheet such as Form A-3 or similar form already in use in
the region.
4. Tool box.
5. Diluted household chlorine bleach (20:1 dilution with tap water), single-use towels, and latex
gloves (optional).
6. Gloves, of leather or other protective material (optional).
5.4 Data Accuracy and Limitations
Both the anticipated method accuracy and measurement quality objectives are as follows:
1. ± 0.02 ft for depths of less than about 250 ft.
2. ±0.04 ft for depths between about 250 ft and 500 ft.
3. ±0.1 ft for depths in excess of about 500 ft.
E-tapes are known to stretch and it is possible to calibrate e-tapes against steel measuring tapes.
Water Resources rarely performs such calibration, since the expected error associated with e-tape
stretch is within the Measurement Quality Objectives (MQOs) of the program. Specifically,
USGS Open-File Report 2015–1137 (Fulford and Clayton, 2015) found that some electrical tapes
may only be accurate to within ±0.03 feet (ft) per 100 ft as compared to a USGS accuracy
recommendation of ±0.01 ft per 100 ft.
23
6.5 Assumptions
1. An established MP exists or will be established as part of measurement. See Section 4.0 -
Establishing a Measuring Point.
2. The MP is clearly described so a person who has not measured the well will know where to
measure from.
3. The well is free of obstructions that could cause errors in the measurement by affecting the
plumbness of the e-tape.
4. All field notes are neat, legible, and leave no doubt about interpretation.
6.6 Instructions
1. Before making the water-level measurement in a well that is used for drinking-water supply,
disinfect the e-tape with diluted bleach solution (see Section 6.0 - Equipment Cleaning and
Disinfection), including weights.
2. Check circuitry of the e-tape before lowering the probe into the well, either by turning the
control to test mode, or placing the probe in water. If a tape has a sensitivity setting, start with
this in the mid-range and adjust as necessary.
3. Lower the tape and weight into the well. When lowering, the tape should not be allowed to rub
across the top of the casing because the insulating sheathing could be breached, resulting in
shorting of the circuit. If the e-tape goes slack before the sensor indicates contact with the
water, this is an indication that the probe is probably hung up in the well, and it should be
carefully raised and re-lowered as necessary to free the tape. If taking depth-to-water
measurements in wells with dedicated pumps, if possible the e-tape should be lowered at a
location that is away from pump power cables and other obstacles.
4. The tape and weight should be lowered slowly into the water to prevent splashing. Continue to
lower the end of the e-tape into the well until contact with the water surface completes the
circuit, thus activating the indicator (light, buzzer, etc.).
5. Once the tape indicator activates, slowly raise the tape until the indicator ceases functioning.
Pinch the tape between your thumb and forefinger and again lower and then raise the tape in
small increments until you can just rock the tape end into and out of the water (as determined
by the indicator) with a slight pinching of your fingers. Once you have defined the depth to
water, hold the tape against the MP and record the value on the tape in the `MP HOLD’
column of the water-level measurements field form.
6. On occasion and especially true in small diameter (< 2") wells, condensation on the interior
casing wall and probe can prematurely trigger the e-tape indicator giving a false positive
reading. In this situation it can help to center the tape in the well casing above the water level
and lightly shake the tape to remove water on the probe.
7. Approximately three minutes after completing the first measurement make a check
measurement by repeating steps 4 and 5. If the check measurement does not agree with the
original measurement within the accuracy given under data accuracy, continue to make check
measurements until the reason for the lack of agreement is determined or until the results are
accurate. If repeated measurements indicate a non-static condition (e.g., the water level is
rising due to recovery from recent pumping, or the water level is declining due to pumping of
a nearby well), indicate the appropriate status of the water level on the field form.
24
8. Record depth to water, date and time of measurement, and initials of party making the
measurement.
9. A correction to determine the depth to water below or above land-surface datum (LSD) can be
obtained by adding or subtracting the casing stick up to the measurement from the MP using
the equation: (Tape reading held at the MP) + (Length of the weight interval) +/– (MP stick
up) = total well depth below LSD.
10. In some cases older e-tapes may have been repaired by cutting off a section of tape that was
defective and creating a sensor from the remaining section of tape. In those instances a tape
correction value will need to be determined. This is also commonly referred to as the “CUT”
value when using an e-tape. To determine the cut value, measure the distance from the
probe’s sensor to the nearest foot marker above the spliced section of tape, then subtract the
distance from the foot marker value. For example, if the nearest foot marker above the splice
is 20 feet, and the distance to the probe sensor is 0.85 foot, then the cut or tape correction will
be 19.15 feet. This cut value must be subtracted from all depth to water measurements
(“HOLD” values) to compensate for the section of missing tape.
11. If anything was removed in order to access the inside of the well, replace it when all work is
complete, then properly close the well.
12. Any physical changes in the well site, such as erosion or cracks in the protective concrete pad
or alterations to the well casing, should be noted on the field sheet. If any site activity has
modified the well MP or its height relative to previous visits, a new MP will need to be
established and described prior to conducting the measurement.
13. Field data forms are kept in three ring binders for each well circuit, and to ensure that data are
not lost the data needs to be regularly entered into EIM (see Section 10). Additionally, field
data sheets should be copied or scanned periodically, and copies kept in the office.
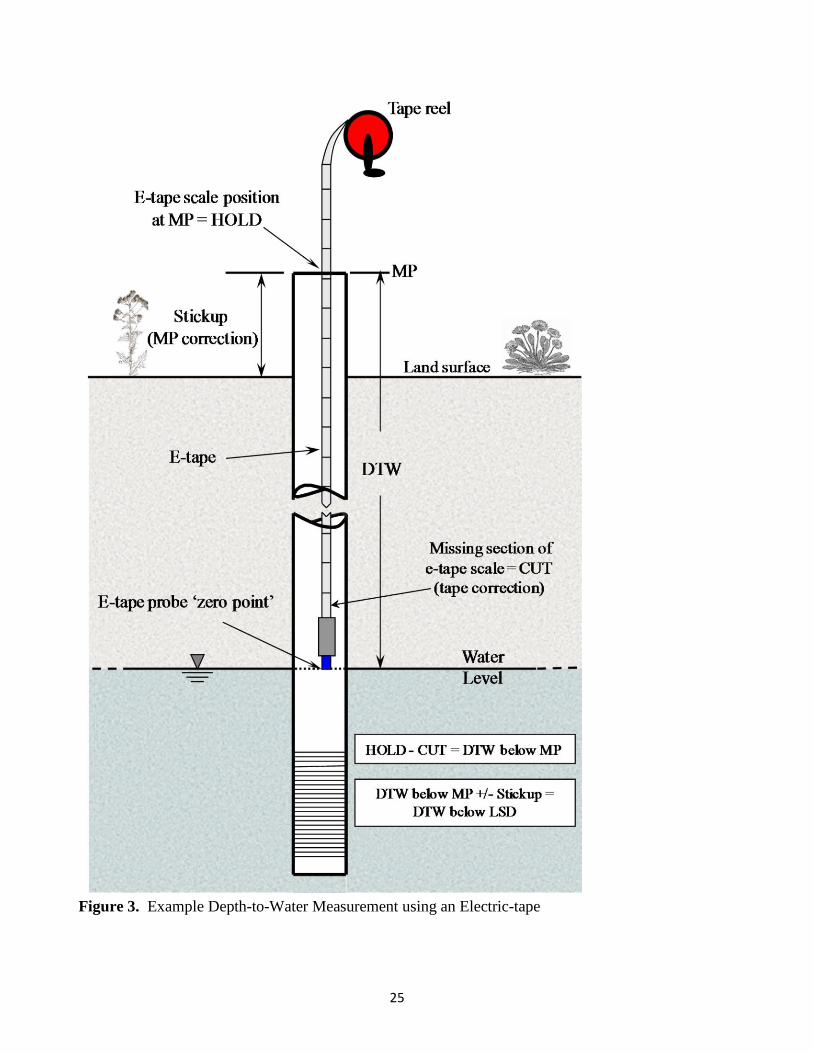
25
Figure 3. Example Depth-to-Water Measurement using an Electric-tape
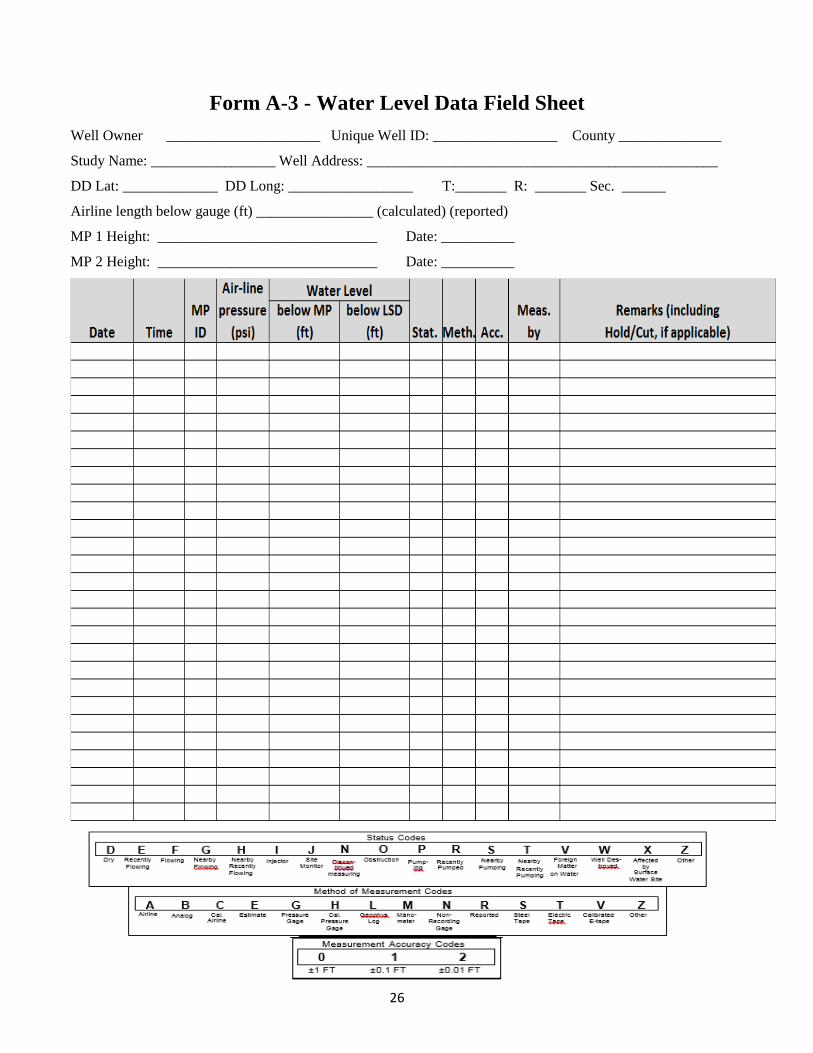
26
Form A-3 - Water Level Data Field Sheet
Well Owner _____________________ Unique Well ID: _________________ County ______________
Study Name: _________________ Well Address: ________________________________________________
DD Lat: _____________ DD Long: _________________ T:_______ R: _______ Sec. ______
Airline length below gauge (ft) ________________ (calculated) (reported)
MP 1 Height: ______________________________ Date: __________
MP 2 Height: ______________________________ Date: __________
27
7.0 Depth-to-Water Measurement Using a Steel-Tape
7.1 Purpose
This procedure describes how to measure the depth to water surface below a MP using the graduated
steel tape (wetted-tape) method.
7.2 General Description
Steel tapes graduated in feet, tenths of feet and hundredths of feet can be used to measure static water
levels in wells. The measurement procedure involves determining the anticipated water level based on
previous measurements, then using a piece of blue carpenter’s chalk to mark a segment of the tape
above and below the anticipated depth. Once the tape is reeled down the well and then back up, a
wetted chalk mark will identify that part of the tape that was submerged.
7.3 Materials and Instruments
1. A steel tape graduated in feet, tenths and hundredths of feet. The tape should be periodically
checked for rust, breaks, and kinks. If the steel-tape is new, be sure the black sheen on the tape
has been dulled so that the tape will retain the chalk. In most instances a break-away brass,
stainless steel, or iron weight should be attached to the end of the tape, strong enough to hold
the weight, but not so strongly as to prevent it from pulling free if the weight becomes lodged.
However, it is permissible to use an unweighted tape where conditions do not allow weighted
tape access.
2. Blue carpenter’s chalk.
3. Clean rag.
4. Pen or pencil.
5. Water-level measurement field data sheet such as Form A-3 or similar form already in use in
the region.
6. Tool box.
7. Diluted household chlorine bleach (20:1 dilution with tap water), single-use towels, and latex
gloves (optional).
8. Gloves, of leather or other protective material (optional).
7.4 Data Accuracy and Limitations
A graduated steel tape is commonly accurate to 0.01 ft, however, due to the complexities of using
chalk (including scraping of the chalked area against a casing potentially wet from condensation
when reeling in the tape), a realistic objective for actual measurements is ± 0.5 feet. In extremely cold
conditions, freezing of water on the tape sometimes distorts the wetted chalk mark and may also make
drying and rechalking the tape very difficult.
7.5 Assumptions
1. An established MP exists or will be established as part of measurement. See Section 4.0 -
Establishing a Measuring Point.
2. The MP is clearly described so a person who has not measured the well previously will know
where to measure from.
3. A water-level measurement taken during the last field visit or from the driller’s log is
available to estimate the length of tape that should be lowered into the well. If no previous
28
measurement information is available, the first measurement may be done without chalk to get
an idea approximately where the tape begins to be wet.
4. The well is free of obstructions that could cause errors in the measurement by affecting the
plumbness of the steel tape.
5. All field notes are neat, legible, and leave no doubt about interpretation.
7.6 Instructions
1. Before making the water-level measurement in a well that is used for drinking-water supply,
disinfect with diluted bleach solution (see Section 6.0 - Equipment Cleaning and Disinfection)
and dry with a clean towel or rag the lower 5 to 10 ft of the tape, including weights.
2. Chalk the lower several feet of the tape by pulling the tape across a piece of blue carpenter’s
chalk. During the measurement the wetted chalk mark will identify that part of the tape that
was submerged.
3. Before lowering the tape into the well the target depth must be determined. If available,
previous water level measurement data should be used to determine the length of tape that
should be lowered into the well. If previous data are not available, an electric-tape may be
used to provide an estimate.
4. Lower the tape and weight into the well until the lower end of the tape is submerged below the
water. The tape should be lowered by sliding it over the palm of one hand (leather gloves may
be helpful to avoid cutting your hand) which is held as directly above the well as possible
while the other hand holds the handle of the tape reel and swings it in a pendulum motion
(allowing the weight of the tape to be felt continuously, thereby reducing the chance that the
tape will hang up and become tangled). The tape should be lowered slowly into the water to
prevent splashing.
5. Continue to lower the end of the tape into the well until the tape has reached several feet past
the assumed water-level depth, but not so far that you fully submerge the chalked portion of
the tape. The goal is to hold the tape against the MP right at a whole foot mark (to make
calculations easier), so a good method is to lower the tape to a point just short of the next
whole foot mark on the tape, then pinch the tape between thumb and index finger and slowly
lower the tape for the remaining 0.1 foot or so. Then lift the tape above the MP, retrieve the
tape, and record the value on the tape in the “HOLD” column of the water-level measurements
field form. The chalked steel-tape should not be in the water longer than a few seconds to
avoid water wicking up the chalked surface. If the steel-tape goes slack before contact with
the water, it is probably hung up in the well and the tape should be carefully raised and re-
lowered as necessary.
6. Rapidly bring the tape to the surface before the wetted chalk mark dries and becomes difficult
to read. Record the number of the wetted chalk mark (referred to as the cut) in the `CUT’
column of the water-level measurements field form.
7. Subtract the “CUT” number from the “HOLD” number to determine the depth to water from
the MP, and record this number in the `DTW from MP’ column of the water-level
measurements field form. Record depth to water, date and time of measurement, and initials of
party making the measurement.
8. A correction to determine the depth to water below or above land-surface datum can be
obtained by adding or subtracting the casing stick up to the measurement from the MP.
29
9. If no problems are perceived during an initial measurement as indicated by a measurement
similar to those observed during previous events in the same season, a single steel tape
measurement may suffice – particularly for very deep wells. If a second measurement is
deemed necessary, a check should be made by repeating steps 1 through 8. The check
measurement should be made using a different hold value than that used for the original
measurement. If repeated measurements indicate a non-static condition (e.g., the water level is
rising due to recovery from recent pumping, or the water level is declining due to pumping of
a nearby well), indicate the appropriate status of the water level on the field form.
10. In some pumped wells (typically those with turbine pumps), a layer of oil may float on the
water surface. If the oil layer is thin (generally a foot thick or less), read the tape at the top of
the oil mark and use this data for the water-level measurement instead of the wetted chalk
mark. The measurement will differ slightly from the water level that would be indicated were
the oil not present. If a water-level measurement cannot be obtained due to the presence of oil,
the field sheet should be marked to indicate this.
11. In order to prevent microbial cross-contamination of other wells, the exposed portion of the
tape can be disinfected by running it through a rag soaked in a dilute chlorine solution as the
tape is reeled in.
12. If anything was removed in order to access the inside of the well, replace it when all work is
complete, then properly close the well.
13. Any physical changes in the well site, such as erosion or cracks in the protective concrete pad
or alterations to the well casing, should be noted on the field sheet. If any site activity has
modified the well MP or its height relative to previous visits a new MP will need to be
established and described prior to conducting the measurement.
14. Field data forms are kept in three ring binders for each well circuit, and to ensure that data are
not lost the data needs to be regularly entered into EIM (see Section 10). Additionally, field
data sheets should be copied or scanned periodically, and copies kept in the office.
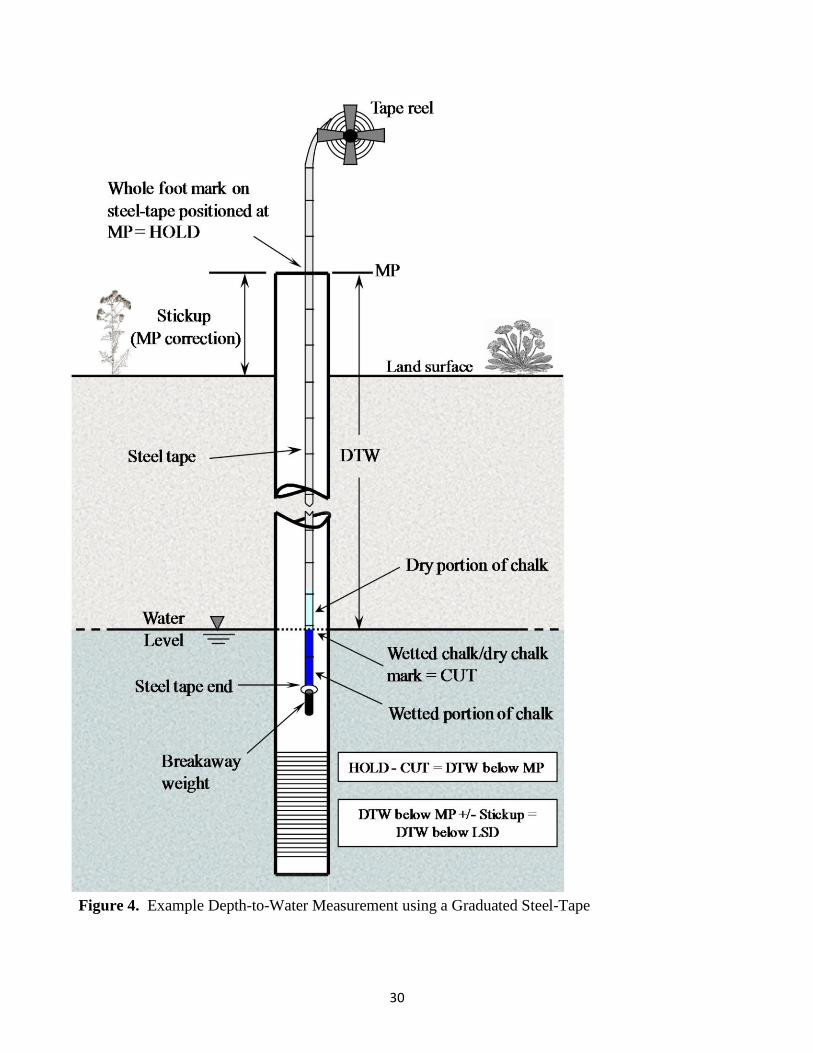
30
Figure 4. Example Depth-to-Water Measurement using a Graduated Steel-Tape
31
8.0 Water-Level Measurement Using an Existing Air Line
8.1 Purpose
This procedure describes how to measure the depth to water surface below a MP using the submerged
air-line method.
8.2 General Description
Air lines are small-diameter tubes that extend from the top of the well into the water. Measurements
are made by attaching air lines to a pressure gauge on a gas tank. As the gauge is opened, gas is
pumped through the gauge into the air line and excess gas bubbles into the water column. Purging gas
is pumped into the air line until the pressure shown on the gauge levels off and is constant, indicating
that all of the air has been forced out of the line. The purging gas is then turned off and the resultant
pressure is read. That pressure is representative of the head of water above the end of the air line.
Recorded pressure is converted to height of water, then depth to water is calculated by subtracting this
value from the known depth of the air line.
Advantages of air-line measurements are that they are quick and easy to make, and in many eastern
Washington irrigation wells they are the only means of measuring water levels (since no other well
casing access is available). Disadvantages are that air-line measurements are less accurate than those
made with steel or e-tape methods, and measurements require information on the air-line lengths that
may or may not be accurate.
8.3 Materials and Instruments
1. Pressure gauge with a tee connector with a pneumatic quick disconnect at one end to connect
to the gas tank regulator, and a Schrader tire valve stem connector at the other end to connect
to the air line. The program owns multiple gauge sets in 0-150 and 0-300 pounds per square
inch (psi) pressure ranges. Before spring measurements each year gauges should be
professionally calibrated to ensure readings within the precision cited on the gauge face. If
gauges are bumped or used improperly, they may not produce accurate readings and should be
recalibrated. ERO takes its gauges to McCune’s Instruments and calibration may take 6
weeks.
2. Five-pound tanks filled with food-grade carbon dioxide (CO2) gas and equipped with a
regulator. Springtime measurements may take up to seven weeks to complete, so tanks may
need to be filled several times if many deep wells are measured. ERO gas tanks are refilled at
Oxarc.
3. Pen or pencil.
4. Tool box.
5. Water-level measurement field data sheet such as Form A-3 or similar form already in use in
the region.
8.4 Data Accuracy and Limitations
1. Water-level measurements using an existing air line should be accurate to 1 ft.
2. When measuring deep water levels, corrections for fluid temperatures and vertical differences
in air density can be additional considerations (Garber and Koopman, 1968).
32
8.5 Assumptions
1. An established MP exists or will be established as part of measurement. See Section 4.0 -
Establishing a Measuring Point.
2. The reported air-line length is accurate.
3. The exposed end of the air line is clearly described so a person who has not measured the well
will be able to find it.
4. All field notes are neat, legible, and leave no doubt about interpretation.
8.6 Instructions
1. For best accuracy select a pressure gauge for which the reading will fall within about the
middle one-third of the gauge’s range. The pressure gauge attached to the tee connector and
quick disconnects are used for making the measurement and not the gauges on the regulator.
2. Attach pressure gauge to the air line using the Schrader tire valve stem connector end of the
tee connector. If the well’s air line has its own separate valve, open that valve to facilitate the
measurement.
3. Attach CO2 tank regulator to the tee connector using pneumatic quick disconnect, then open
the tank main valve.
4. Open the tank regulator valve to expel all water from air line using compressed CO2. If
measurements have been made prior and a pressure is anticipated, over-inflate the line by
about 20 psi to clear the line. At this point a bubbling noise can sometimes be heard within the
well casing.
5. Slowly back off on the pressure while watching the gauge. A reading representative of the
water pressure outside of the end of the airline is evident when the pressure shown on the
gauge levels off and is constant. Often this step must be repeated multiple times until a
trustworthy measurement can be obtained. After the first such measurement, the process
should be repeated to make sure the measurement is consistent.
6. Turn off the main tank valve, then release the hose quick disconnect that connects the tank
regulator to the tee valve assembly to allow gas in the air line to bleed off.
7. Record the pressure (psi) on the field form, including date, time, and initials of the party
making the measurement.
8. The depth to water can be calculated by first multiplying the pressure reading (psi) by 2.31
(ft/psi) to determine the height of the water column above the air line. The depth to water
below the MP can then be obtained by subtracting the height of the water column from the
known length of the air line.
9. Knowing the air line length is critical for measurement accuracy, and well owners should be
asked whether they have this information. If the air line appears to have changed, the owner
should be asked if they have the new air line length. If an owner does not have this
information and if it is possible to measure the depth to water in the well using a tape, the air
line length can be calculated from the tape measurement. This can be done by dividing the
measurement pressure by 2.31, then adding that value to the tape measurement.
10. Note any physical changes in the field data sheets, such as erosion or cracks in the protective
concrete pad or alterations to the air line or well casing.
11. Field data forms are kept in three ring binders for each well circuit, and to ensure that data are
not lost the data needs to be regularly entered into EIM (see Section 10). Additionally, field
data sheets should be copied or scanned periodically, and copies kept in the office.
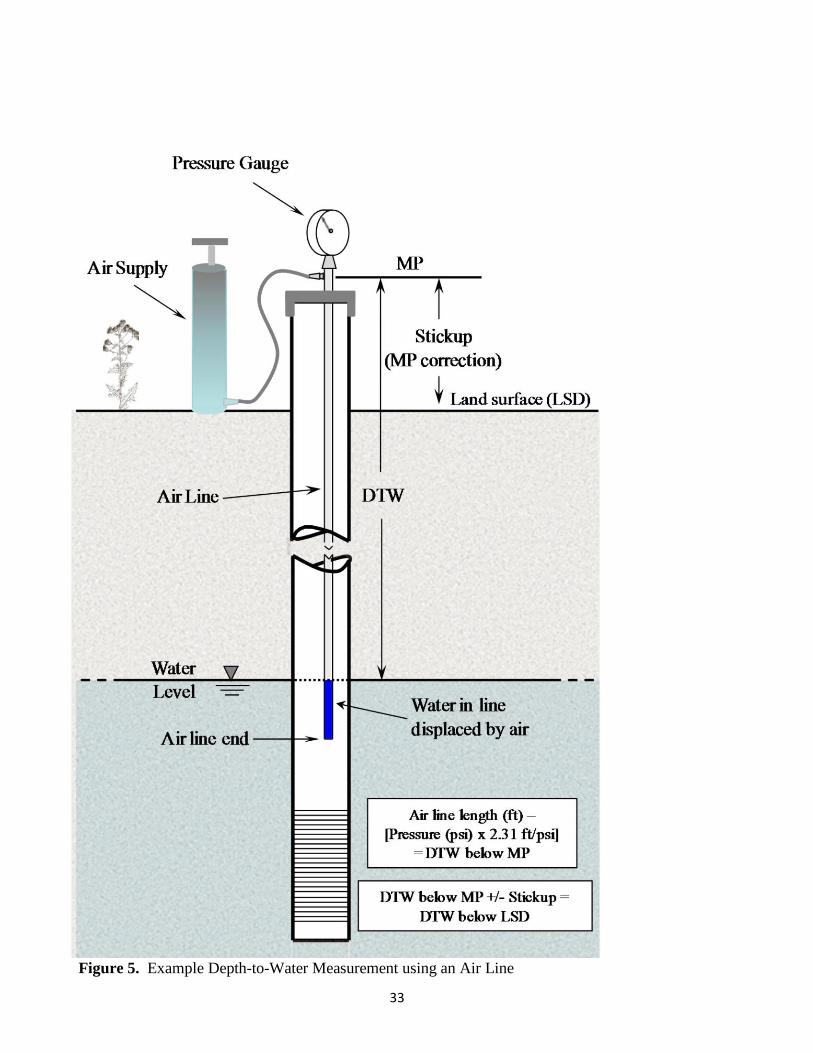
33
Figure 5. Example Depth-to-Water Measurement using an Air Line
34
9.0 Measuring Well Water Levels Using Submersible Pressure Transducers
9.1 Purpose
This procedure describes how to collect time-series, static water-level data in wells using submersible
pressure transducers/data loggers (referred to below simply as “transducers”). Currently Water
Resources uses only non-vented transducers, so this SOP only addresses those installations.
9.2 General Description
Submersible pressure transducers are used to collect “time series” (often referred to as “continuous”)
water temperature and water-level data. When installed at fixed well depths, transducers measure and
record pressures in the water column above the sensor. Those pressure readings can then be converted
to static water level depths over time for the well.
Pressure transducers can be of the vented (also known as gauged) or non-vented (also known as
absolute) variety. Vented transducer measurements automatically compensate for the effects of
atmospheric pressure changes. Non-vented transducers do not, and typically must be deployed in
close proximity to barometric transducers, so the latter data can be used to barometrically compensate
the recorded water-level pressures for changes in atmospheric pressure. One advantage of vented
transducers is that a cable extends to the top of the well, thus simplifying data downloads.
Disadvantages of vented transducers include the fact that they are more expensive, they may require
more maintenance, and that excess cable must be stored at the well head.
Pressure transducers are deployed by hanging them beneath the water surface in a well at a point
where they will not go dry. For the Water Resources Program typically they are set to record water
temperatures and water levels every hour or every four hours. When they are first deployed, a manual
static water level is measured in the well (typically with e-tape) to confirm instrument placement. The
well is then visited several times per year to download data and collect additional manual static water
level measurements. Once the data have been retrieved, they can be corrected for changes in
barometric pressure, instrument drift, slippage from fastened cables, cable stretch, etc. Transducers
operate only within a limited depth range, so the unit installed in a well must have the correct range to
accommodate anticipated water level changes.
9.3 Materials and Instruments
1. Water-level pressure transducer/data logger and a barometric transducer (if applicable).
2. Line for suspending the transducer, such as braided (zero stretch), 50 pound test, fishing line.
Alternately, stainless steel downrigger cable or Surflon nylon coated 1 X 7 stainless steel
leader wire (or similar product) can be used, both of which require appropriately sized
crimping sleeves.
3. A plastic reel, such as one for extension cords, to roll up the suspension line.
4. Device for anchoring the top of the suspension line, such as a flat square of plastic 1-inch
larger than the casing upon which it will sit. An inexpensive, plastic cutting board can be used
as stock material from which to fabricate the square.
5. A programming or data readout device (e.g. laptop computer loaded with correct software),
and hardware such as a cable to connect this with the transducer.
6. A clean towel or rag to dry the end of the transducer before reconnecting it to the
communication cable.
35
7. Calibrated water-level indicator graduated in hundredths of feet (typically an e-tape).
8. Calibrated tape to attach to the transducer if a field calibration test is made.
9. Copies of well construction report and water level history for the well that is being
instrumented (if available).
10. Key(s) for wells or site access gates as appropriate.
11. Form A-2 – Transducer Installation Form, and Form A-5 - Transducer Download and Site
Visit Record Form.
12. Pen or pencil.
13. Replacement batteries (if replaceable in the unit).
14. Tool box.
15. Digital camera.
16. GPS instrument.
9.4 Data Accuracy and Limitations
1. Water level measurements, including in-place measurements for calibration of pressure
transducers, should be measured to 0.01 ft, where possible.
2. Measurement accuracy depends on the accuracy of the transducer and that of the manual
water-level measurement device. For example, typical static measurements for 30 psi
AquiStar pressure transducers are ± 0.04 feet, while the accuracy of an e-tape for a 250 to 500
foot measurement might also be ± 0.04 feet, total error, which leads to a potential
compounding error ± 0.08 feet for a single measurement. 3. Pressure transducers are subject to drift, offset and slippage of the suspension system. For this
reason, the transducer readings should be checked against the water level measured with an e-
tape on every visit.
9.5 Assumptions
1. An established MP exists or will be established as part of measurement. See Section 4.0 -
Establishing a Measuring Point.
2. The user is familiar with the transducer specifications and limitations.
3. The transducer’s range is appropriate for the range of water levels expected in the well.
4. The transducer has been calibrated, either by the manufacturer or by the user, for the
conditions expected in the field installation.
5. All field notes are neat, legible, and leave no doubt about interpretation.
9.6 Instructions
Currently Water Resources uses only non-vented pressure transducers, so this method description
only addresses these types of installations.
When establishing a new installation:
1. Due to the possibility of losing equipment down wells, installing transducers down water
supply wells, or other wells containing pumps, is not recommended without a separate
transducer sleeve.
2. Select a transducer in the proper pressure range for the well being instrumented – preferably
based on static water-level measurements collected over one or more years.
3. Prior to heading to the field with the device used to program the transducer (typically a
laptop), be sure that its internal clock is synchronized with the official US time.
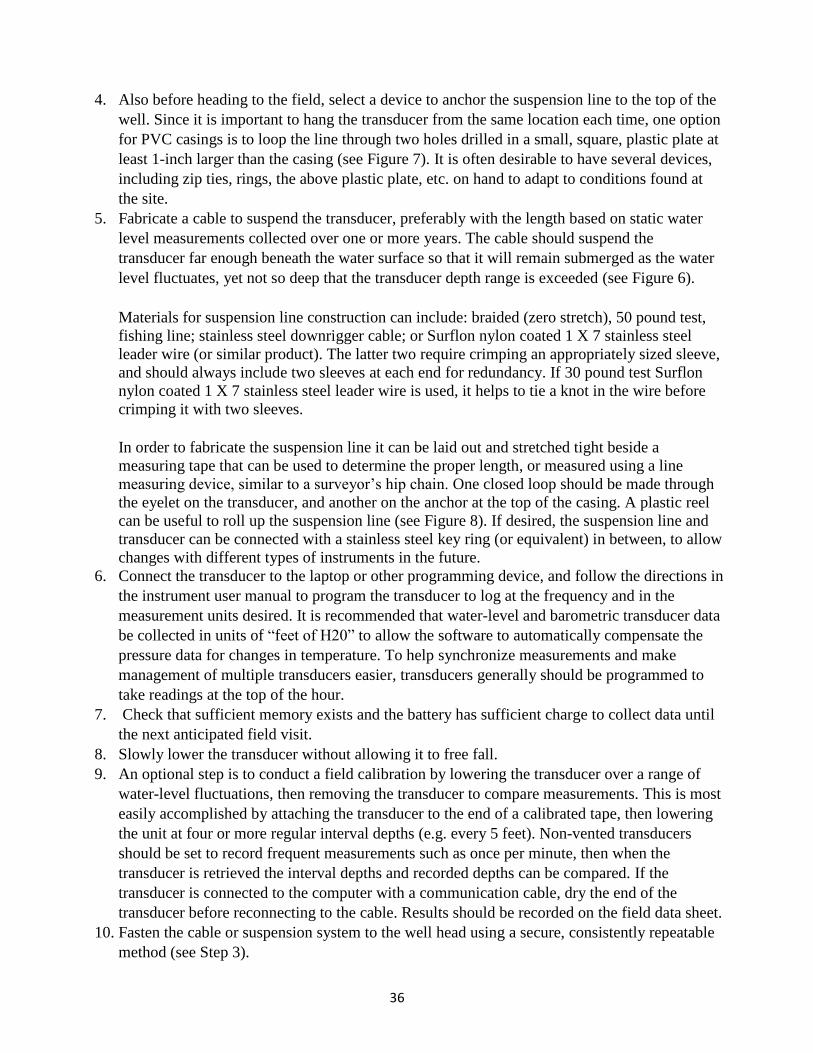
36
4. Also before heading to the field, select a device to anchor the suspension line to the top of the
well. Since it is important to hang the transducer from the same location each time, one option
for PVC casings is to loop the line through two holes drilled in a small, square, plastic plate at
least 1-inch larger than the casing (see Figure 7). It is often desirable to have several devices,
including zip ties, rings, the above plastic plate, etc. on hand to adapt to conditions found at
the site.
5. Fabricate a cable to suspend the transducer, preferably with the length based on static water
level measurements collected over one or more years. The cable should suspend the
transducer far enough beneath the water surface so that it will remain submerged as the water
level fluctuates, yet not so deep that the transducer depth range is exceeded (see Figure 6).
Materials for suspension line construction can include: braided (zero stretch), 50 pound test,
fishing line; stainless steel downrigger cable; or Surflon nylon coated 1 X 7 stainless steel
leader wire (or similar product). The latter two require crimping an appropriately sized sleeve,
and should always include two sleeves at each end for redundancy. If 30 pound test Surflon
nylon coated 1 X 7 stainless steel leader wire is used, it helps to tie a knot in the wire before
crimping it with two sleeves.
In order to fabricate the suspension line it can be laid out and stretched tight beside a
measuring tape that can be used to determine the proper length, or measured using a line
measuring device, similar to a surveyor’s hip chain. One closed loop should be made through
the eyelet on the transducer, and another on the anchor at the top of the casing. A plastic reel
can be useful to roll up the suspension line (see Figure 8). If desired, the suspension line and
transducer can be connected with a stainless steel key ring (or equivalent) in between, to allow
changes with different types of instruments in the future.
6. Connect the transducer to the laptop or other programming device, and follow the directions in
the instrument user manual to program the transducer to log at the frequency and in the
measurement units desired. It is recommended that water-level and barometric transducer data
be collected in units of “feet of H20” to allow the software to automatically compensate the
pressure data for changes in temperature. To help synchronize measurements and make
management of multiple transducers easier, transducers generally should be programmed to
take readings at the top of the hour.
7. Check that sufficient memory exists and the battery has sufficient charge to collect data until
the next anticipated field visit.
8. Slowly lower the transducer without allowing it to free fall.
9. An optional step is to conduct a field calibration by lowering the transducer over a range of
water-level fluctuations, then removing the transducer to compare measurements. This is most
easily accomplished by attaching the transducer to the end of a calibrated tape, then lowering
the unit at four or more regular interval depths (e.g. every 5 feet). Non-vented transducers
should be set to record frequent measurements such as once per minute, then when the
transducer is retrieved the interval depths and recorded depths can be compared. If the
transducer is connected to the computer with a communication cable, dry the end of the
transducer before reconnecting to the cable. Results should be recorded on the field data sheet.
10. Fasten the cable or suspension system to the well head using a secure, consistently repeatable
method (see Step 3).
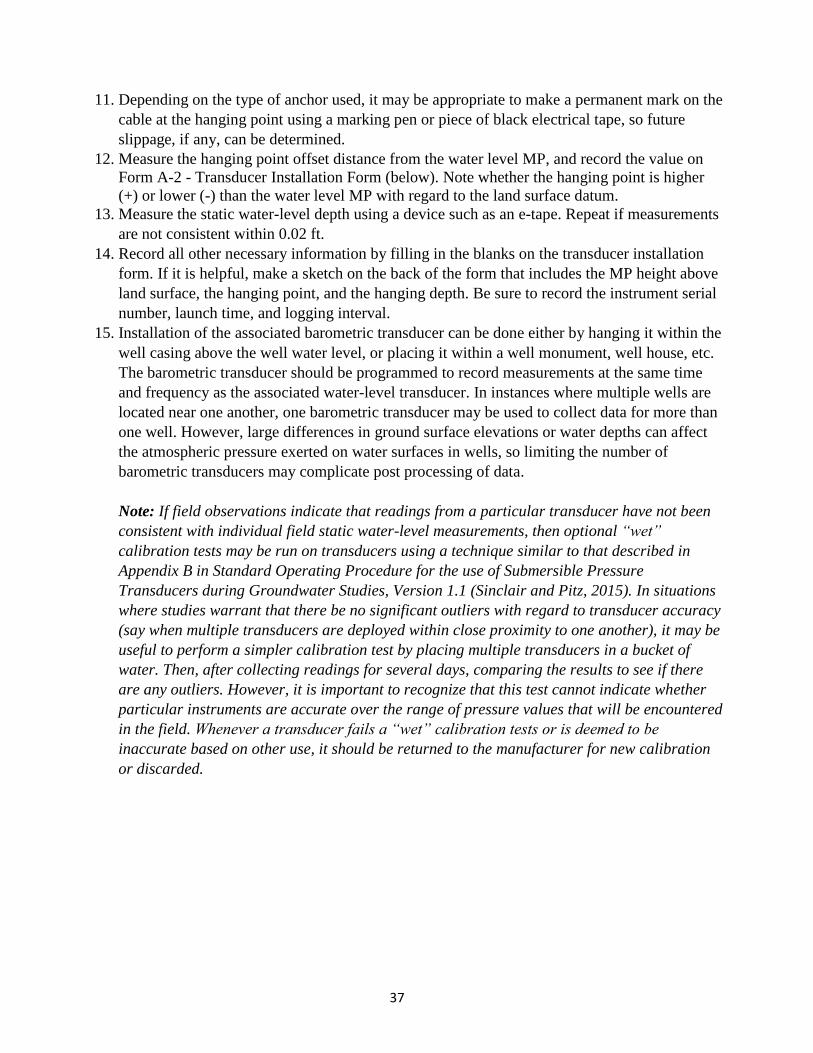
37
11. Depending on the type of anchor used, it may be appropriate to make a permanent mark on the
cable at the hanging point using a marking pen or piece of black electrical tape, so future
slippage, if any, can be determined.
12. Measure the hanging point offset distance from the water level MP, and record the value on
Form A-2 - Transducer Installation Form (below). Note whether the hanging point is higher
(+) or lower (-) than the water level MP with regard to the land surface datum.
13. Measure the static water-level depth using a device such as an e-tape. Repeat if measurements
are not consistent within 0.02 ft.
14. Record all other necessary information by filling in the blanks on the transducer installation
form. If it is helpful, make a sketch on the back of the form that includes the MP height above
land surface, the hanging point, and the hanging depth. Be sure to record the instrument serial
number, launch time, and logging interval.
15. Installation of the associated barometric transducer can be done either by hanging it within the
well casing above the well water level, or placing it within a well monument, well house, etc.
The barometric transducer should be programmed to record measurements at the same time
and frequency as the associated water-level transducer. In instances where multiple wells are
located near one another, one barometric transducer may be used to collect data for more than
one well. However, large differences in ground surface elevations or water depths can affect
the atmospheric pressure exerted on water surfaces in wells, so limiting the number of
barometric transducers may complicate post processing of data.
Note: If field observations indicate that readings from a particular transducer have not been
consistent with individual field static water-level measurements, then optional “wet”
calibration tests may be run on transducers using a technique similar to that described in
Appendix B in Standard Operating Procedure for the use of Submersible Pressure
Transducers during Groundwater Studies, Version 1.1 (Sinclair and Pitz, 2015). In situations
where studies warrant that there be no significant outliers with regard to transducer accuracy
(say when multiple transducers are deployed within close proximity to one another), it may be
useful to perform a simpler calibration test by placing multiple transducers in a bucket of
water. Then, after collecting readings for several days, comparing the results to see if there
are any outliers. However, it is important to recognize that this test cannot indicate whether
particular instruments are accurate over the range of pressure values that will be encountered
in the field. Whenever a transducer fails a “wet” calibration tests or is deemed to be
inaccurate based on other use, it should be returned to the manufacturer for new calibration
or discarded.
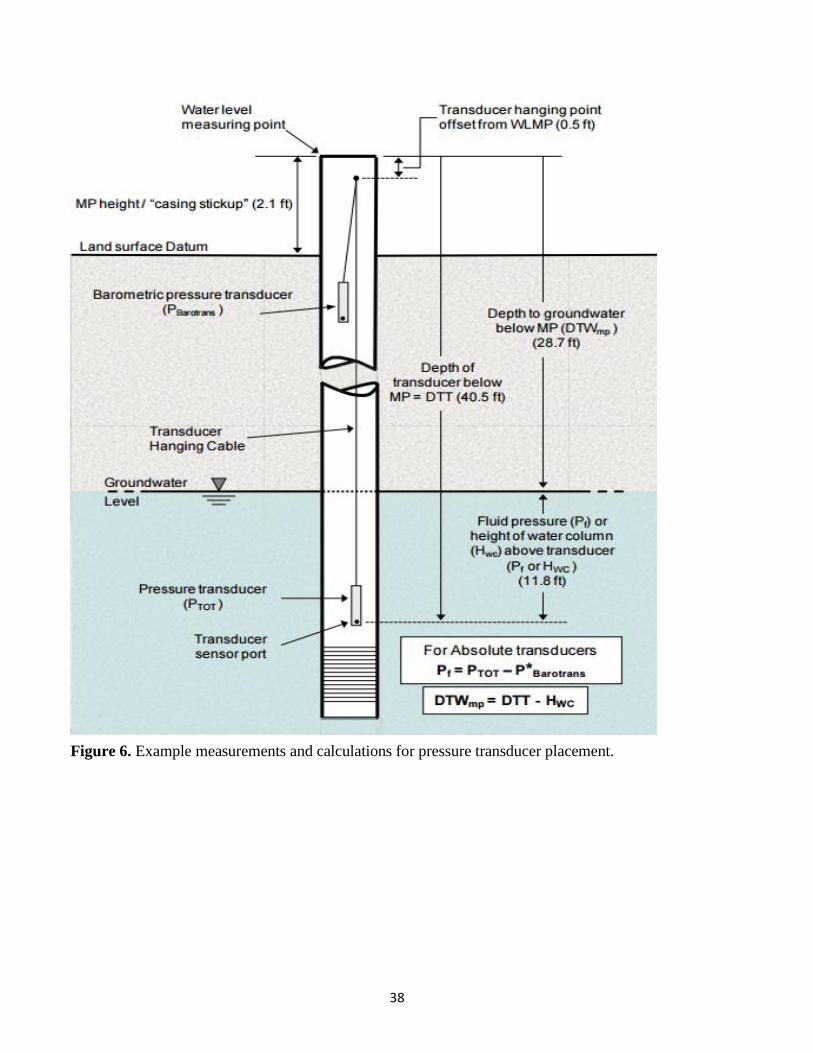
38
Figure 6. Example measurements and calculations for pressure transducer placement.
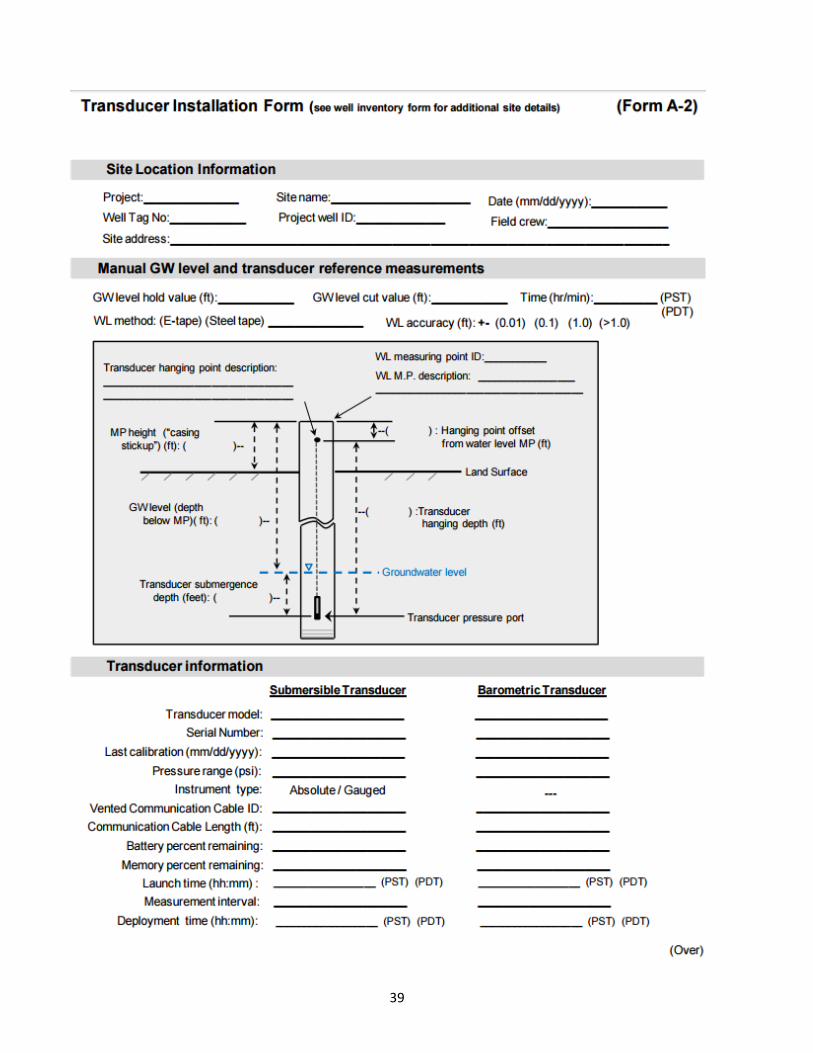
39
40
(Form A-2, Page 2) Instrument Placement Check Measurements . Other Observations .
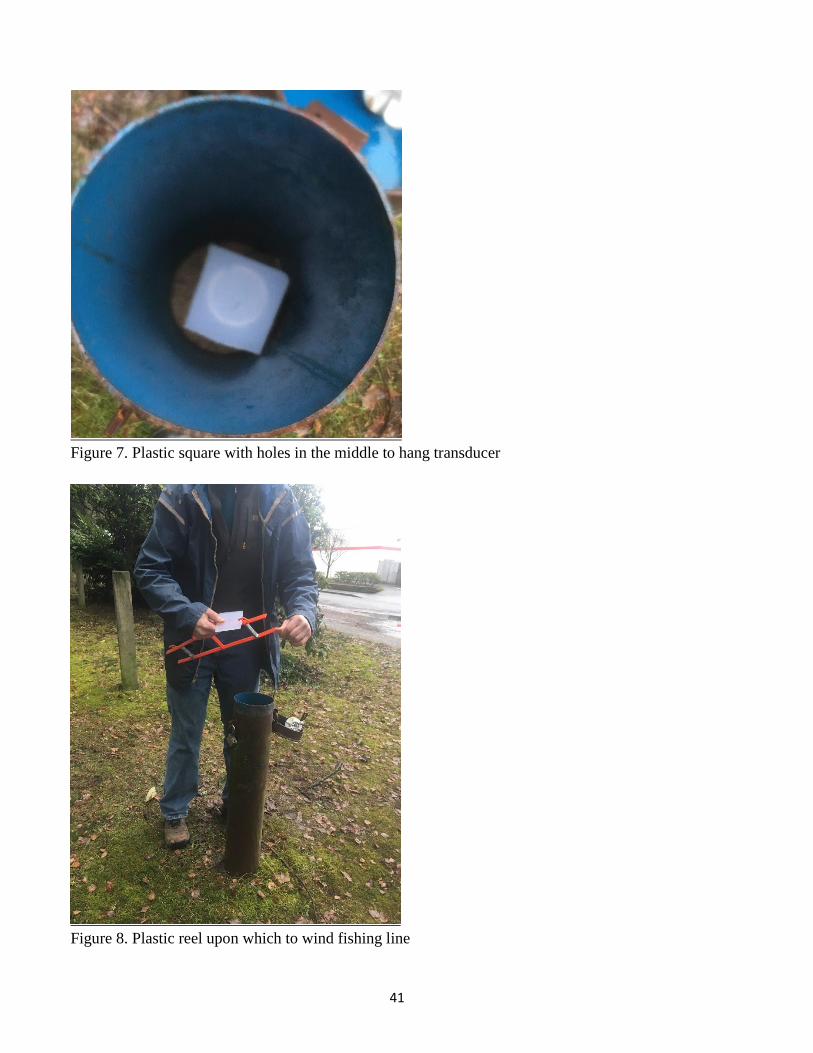
41
Figure 7. Plastic square with holes in the middle to hang transducer
Figure 8. Plastic reel upon which to wind fishing line
42
When visiting an existing installation:
Pressure transducers must be serviced periodically during use to check and replace instrument
batteries, download data, and assess potential changes in local site conditions or instrument
integrity over time. Manual static water level measurements made during these visits are
compared to readings stored on the transducer to determine whether corrections are needed or
there has been equipment failure. Visiting a site 3 or 4 times per year is recommended, unless the
possibility of losing data and/or increased chance of error is deemed acceptable.
1. Record the well number and location, MP, and any changes at or near the site that may affect
the measurements (e.g. adjacent land use changes, recent flooding, nearby well construction
activity, etc.).
2. Measure the water level with a device such as an e-tape, using the same MP as when the
transducer was installed. Make at least two measurements to confirm static conditions. Record
the measurement time and the water level in feet below the MP on Form A-6 - Transducer
Download and Site Visit Record Form (below), noting whether the well was pumped when
measured, was pumped recently, or a nearby well was pumping during the measurement.
3. Pull up the cable to raise the transducer during a period when the unit is not actively making a
measurement. An extension cord storage reel or equivalent can be used to help keep the cable
clean and kink free as it is reeled up. Note any possible indications that the cable has slipped.
4. Before connecting the transducer to the computer with a communication cable, dry the end of
the transducer with a clean towel or rag.
5. Connect the transducer to the field computer. Use the computer and instrument software to
download the transducer per manufacturer instructions. Record the download time and file
name on the field form. View the data graph to confirm a successful download has occurred
and to identify obvious problems such as missing or unusual values that might suggest a
compromised instrument or installation. Check and record the battery and memory status on
the field form.
6. While in the field compare the manual measurement to the most recent measurement recorded
by the transducer. To do this perform the following calculations (similar to those described in
the “Follow up office work” section below):
a. For the most recent readings, subtract the barometric transducer value from the water-
level transducer value to produce a barometrically-corrected water-level depth value.
b. Subtract the barometrically corrected water-level value from the depth that the
pressure transducer is set at to produce a depth to water from the water-level MP.
c. Compare the transducer-measured depth to water value from the manually measured
static water-level value.
If the readings differ significantly, consider replacing the transducer.
7. If data collection is continuing and the transducer memory may fill up prior to the next field
visit, delete sufficient memory for the remainder of testing. Similarly if data collection is
continuing and there may not be sufficient battery to last until the next field visit, replace the
batteries for user serviceable units or replace the transducer for other units.
8. If a new transducer is deployed:
a. Launch the unit using the same measurement frequency and time period as the
previous deployment (e.g. every hour on the hour) using a time-delayed launch
command.
43
b. Launch the unit using the same time datum as the initial launch or at least make good
notes that the time datum changed between deployments.
c. Confirm instrument placement depth if a different instrument type is used to replace
the unit (not all instruments are the same length).
d. Record information on these changes on the field form.
9. Record all other necessary information by filling in the blanks on the transducer download
form.
10. If a barometric transducer was deployed at the site, retrieve this and download the logged data.
View the data graph to confirm a successful download and to identify obvious problems such
as missing values, unusual data spikes, or other issues that might suggest a compromised unit.
Follow similar steps to those for the water-level transducer to ensure that the memory and
battery are sufficient to last until the next field visit.
11. Secure the well.
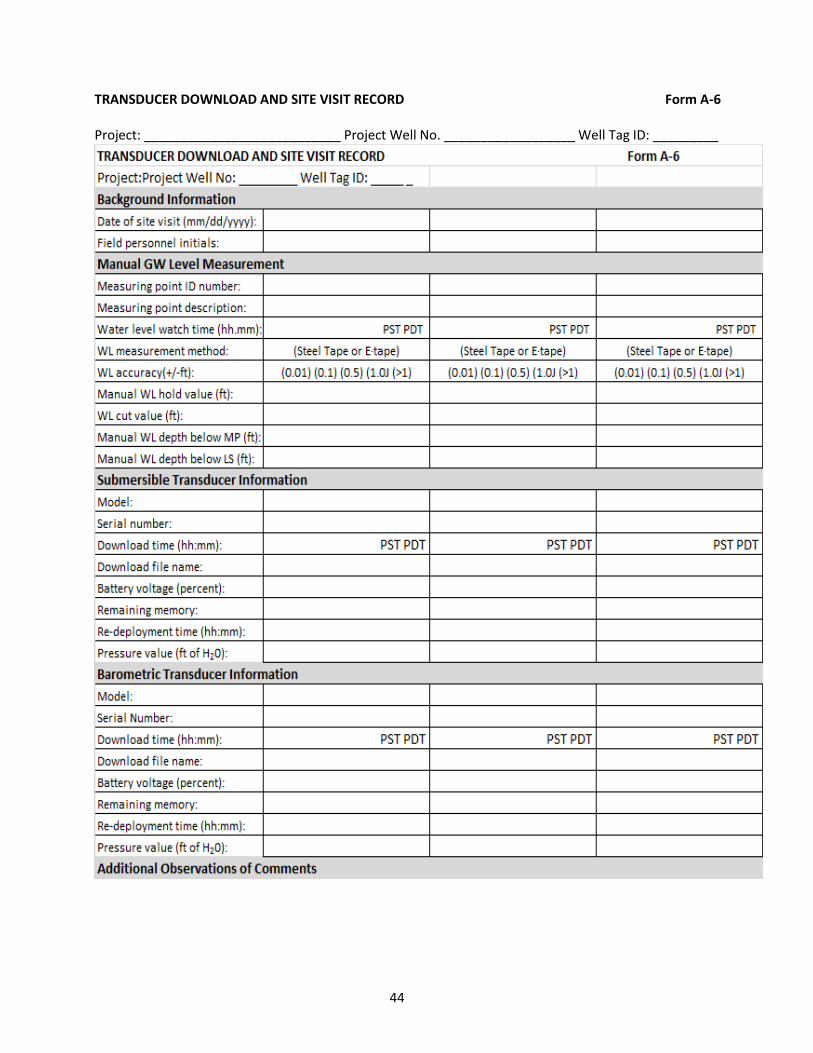
44
TRANSDUCER DOWNLOAD AND SITE VISIT RECORD Form A-6 Project: ___________________________ Project Well No. __________________ Well Tag ID: _________
45
Follow up office work:
Raw pressure values from transducers must be processed and verified to produce useable water-
level data, and prepare it before it is uploaded to Ecology’s Environmental Information
Management System (EIM). The general steps required to process non-vented water-level/
barometric pressure transducer data are described here and illustrated in Figure 9 below.
1. In the office create a folder on one of Ecology’s backed up network drives to store
documentation for the well. If the well is contained in a regional well circuit this new folder
should be a sub-folder within the well circuit folder.
2. Begin data processing by first saving a digital copy of the unprocessed transducer file(s) and
supporting documentation including: the original field forms and notes, transducer installation
forms, manual water level records, and other transducer download notes. Archive the records
in the proper project subdirectory stored on an agency shared drive. Do not alter the original
transducer file and instead make a copy, then process the data using the copied file.
3. Transducer software has varying capability to process transducer data. If possible, water-level
and barometric transducer data should be collected in units of “feet of H20”, since this allows
the software to automatically compensate the pressure data for changes in temperature.
4. When working with non-vented transducers atmospheric pressure effects typically must be
measured and subtracted from the recorded water pressure values. This can either be done
using transducer manufacturer software or in a Microsoft Excel® (Excel) spreadsheet. If
manufacturer software is used to correct raw water pressure transducer data for barometric
affects, export the barometrically corrected water pressures to an Excel file. The method for
making barometric pressure corrections in Excel is shown in Step 1 of Figure 9.
5. Calculate the depth to groundwater in feet below the water-level MP by following Step 2 in
Figure 9 below. If the suspension line hanging point is different than the water level MP, an
additional offset must be added or subtracted. Similarly if measurements in feet below land
surface datum are desired, the water level MP height should be subtracted from the depth to
groundwater below the water level MP.
6. As shown in Step 3, compare resulting transducer values against corresponding manual water
level values to determine whether transducer measurements are within an acceptable accuracy
range, which is generally ± 0.05 ft of the accuracy of the device used for discrete static water-
level measurements. If there is an unacceptable difference between the two types of values,
the hydrogeologist needs to decide whether to apply a data correction to the transducer data.
Sometimes it may make sense to apply a bulk shift that effectively changes the transducer
depth value from that point on, resulting in a calculated groundwater depth equal to the
manual water level value at least on that date. At other times it may make sense to split the
difference and change the transducer depth value slightly, to correct the depth to groundwater
so that it is closer but not equal to the manual water level value. Optionally a gradual linear
drift correction can also be made following the procedure described in Appendix C in
Standard Operating Procedure for the use of Submersible Pressure Transducers during
Groundwater Studies, Version 1.1 (Sinclair and Pitz, 2015).
It is important to keep sight of data quality objectives for the data being collected. Minor
deviations from the “true” water level depth are to be expected in all field-collected data.
Manual water-level measurements made with e-tapes include errors, and transducers have a
factory calibrated accuracy which introduces error before they are even deployed. The goal is
to minimize introduced errors to achieve acceptable accuracy.
46
7. Assess the overall data quality and assign the appropriate water level method, accuracy code,
and data qualifier(s) (if any), to individual transducer results.
8. Based on the above analysis either 1) accept the results for use, 2) assign additional data
qualifiers, if warranted, or 3) reject the results as unusable.
9. Finally, document the data reduction steps employed to produce the final results for each
transducer. This can be done within the Excel file or by creating a Microsoft Word®
document that is maintained in the project subdirectory on the agency shared drive. Using a
few sentences this documentation should describe each data download/data processing event,
including: 1) equipment problems or other issues that influenced the results, 2) water
level/barometric measurements corrections applied 3), datum or drift corrections, if any, and
4) remarks or other observations that influenced the quality of the final results.
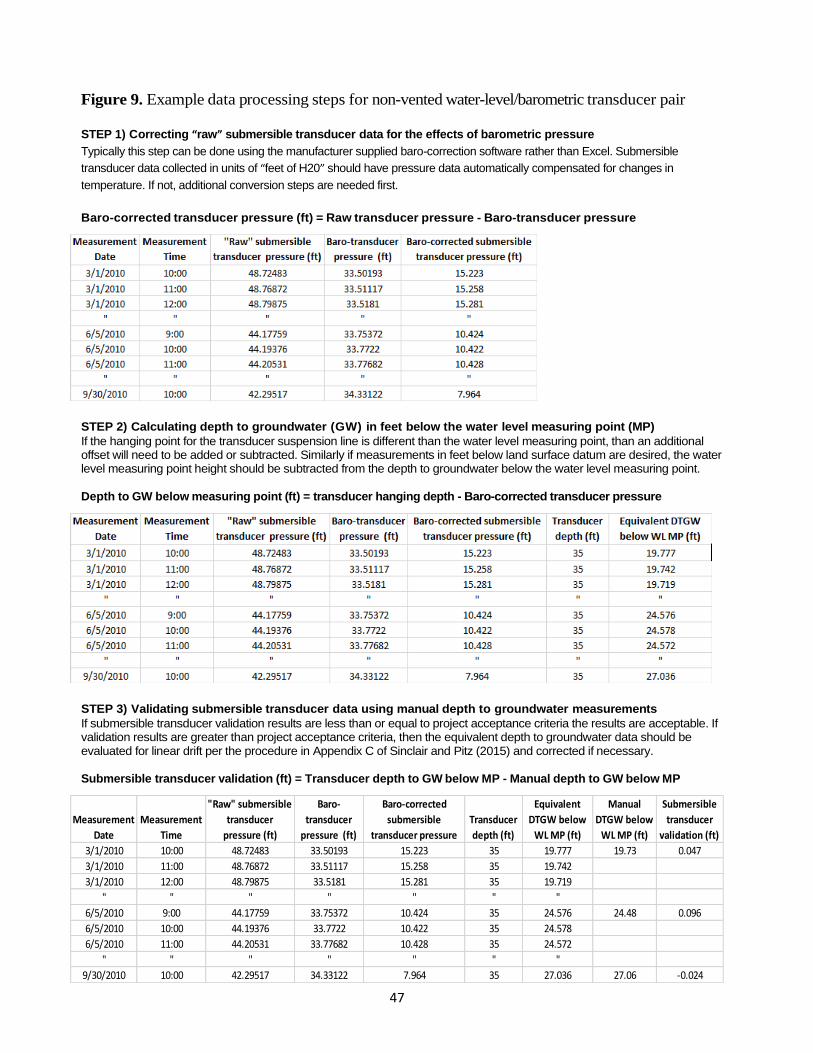
47
Figure 9. Example data processing steps for non-vented water-level/barometric transducer pair
STEP 1) Correcting “raw” submersible transducer data for the effects of barometric pressure
Typically this step can be done using the manufacturer supplied baro-correction software rather than Excel. Submersible
transducer data collected in units of “feet of H20” should have pressure data automatically compensated for changes in
temperature. If not, additional conversion steps are needed first.
Baro-corrected transducer pressure (ft) = Raw transducer pressure - Baro-transducer pressure
STEP 2) Calculating depth to groundwater (GW) in feet below the water level measuring point (MP)
If the hanging point for the transducer suspension line is different than the water level measuring point, than an additional offset will need to be added or subtracted. Similarly if measurements in feet below land surface datum are desired, the water level measuring point height should be subtracted from the depth to groundwater below the water level measuring point.
Depth to GW below measuring point (ft) = transducer hanging depth - Baro-corrected transducer pressure
STEP 3) Validating submersible transducer data using manual depth to groundwater measurements
If submersible transducer validation results are less than or equal to project acceptance criteria the results are acceptable. If validation results are greater than project acceptance criteria, then the equivalent depth to groundwater data should be evaluated for linear drift per the procedure in Appendix C of Sinclair and Pitz (2015) and corrected if necessary.
Submersible transducer validation (ft) = Transducer depth to GW below MP - Manual depth to GW below MP
Measurement
Date
Measurement
Time
"Raw" submersible
transducer
pressure (ft)
Baro-
transducer
pressure (ft)
Baro-corrected
submersible
transducer pressure
Transducer
depth (ft)
Equivalent
DTGW below
WL MP (ft)
Manual
DTGW below
WL MP (ft)
Submersible
transducer
validation (ft)
3/1/2010 10:00 48.72483 33.50193 15.223 35 19.777 19.73 0.047
3/1/2010 11:00 48.76872 33.51117 15.258 35 19.742
3/1/2010 12:00 48.79875 33.5181 15.281 35 19.719
" " " " " " "
6/5/2010 9:00 44.17759 33.75372 10.424 35 24.576 24.48 0.096
6/5/2010 10:00 44.19376 33.7722 10.422 35 24.578
6/5/2010 11:00 44.20531 33.77682 10.428 35 24.572
" " " " " " "
9/30/2010 10:00 42.29517 34.33122 7.964 35 27.036 27.06 -0.024
48
10.0 Records Management
10.1 Purpose
This procedure describes what site and water-level information needs to be entered into the
Department of Ecology’s Environmental Information Management System (EIM).
10.2 Instructions
Data storage in EIM ensures that access is provided both internally and externally to users of the
agency’s environmental monitoring data. Three basic types of data are required in order to enter
groundwater data into EIM, including study information, site data, and results data. Study information
has already been entered into EIM for monitoring conducted by each of the regional offices, and site
data has been entered for many of the currently monitored well sites. If site data have not been
entered for a particular well, the information under the heading 10.2.2 Well Location Information
below will need to be provided to EIM before results data can be entered. Once those entries are
complete only the items under the heading 10.2.1 Water Level Measurements will need to be
collected and entered into EIM. Electronic or hard copy documentation of site documentation
information and field data sheets should be kept and maintained at the regional offices in case any of
the well circuit binders are ever lost.
The Water Resources Integrated Statewide Groundwater Monitoring Strategy recommends that one
individual be designated to enter all groundwater monitoring data into EIM for the program.
Assuming this recommendation is followed, field staff should only need to collect information in the
field then turn this over to the program’s EIM data coordinator for entry into EIM. However, in the
case of pressure transducer data, regional field staff will also need to perform all data corrections
before sending this to the EIM data coordinator. Instructions for uploading data into EIM are
available at: http://www.ecy.wa.gov/eim/submitdata.htm, and a link toward the bottom of that website
provides videos from recent training.
10.2.1 Total Well Depth or Water Level Measurements
For each site where well depth or depth-to-water measurements are being collected, the following
data should be recorded on the field data sheets:
1. Well site name
2. Well tag number, if available
3. Description of MP location
4. MP height (stickup)
5. Total well depth or depth-to-water measurement, including Hold, Cut and any corrections that
need to be applied.
6. Date and time of measurement
7. Observations or remarks on depth-to-water or well depth measurements or conditions of the
well site that may affect data quality.
49
10.2.2 Well Location Information
In order to enter water level measurement data the following well location information and data must
be entered into EIM. Some entry fields can be developed back at the office, so to aid field work the
information that must be obtained in the field is indicated with bold text. Since data requirements for
EIM may change, the following list may not be up to date. Therefore, check the EIM help documents
for a list of current locations requirements.
Location Information
1. User location ID - Unique user-assigned ID to identify the field location in EIM.
2. Location Name - Unique descriptive name for a field location.
3. Location Address
4. Location Type - Describes the field location in relation to the surrounding environment (i.e.
land for well locations).
5. Location Status - Current status with respect to monitoring activity.
6. Location Geometric Type - Identifies which of three spatial type’s best describes the field
Location (i.e. wells are identified as a point).
7. Location Well Flag - A Yes (Y) or No (N) flag that indicates whether a field Location is a
Well. Additional data must be entered for a Well Location.
8. Location Description - A short narrative description of the field location that can be used by
others to locate the site in the field.
Note: The data Editor module of EIM that is typically used to enter new wells has GIS-based
mapping tools that enable users to define latitude, longitude and land surface elevations to a high
degree of accuracy. These tools can be used to check the coordinates and elevations determined with
the hand held GPS in the field, and an additional advantage is that they provide locations and
elevations in agency standard format.
Horizontal Location Information
1. Location Coordinates
2. Location Coordinates Reference System - Coordinate referencing system used when field
location geographic position is entered into EIM (i.e. Latitude/Longitude in Decimal Degrees,
State Plane Coordinate System, or Universal Transverse Mercator System). Note: EIM
converts all locations into NAD83HARN (Latitude/Longitude (Decimal Degrees).
3. Horizontal Reference Datum - Model used to match the horizontal position of features on
the ground to coordinates and Locations on a map (i.e. NAD83).
4. Horizontal Accuracy Measure - The range within which the measured value of the horizontal
coordinate for the field Location may vary from the actual value.
5. Horizontal Collection Methods - Technique used to collect the horizontal coordinates of a
field Location (i.e. address, GPS, surveyed).
6. Horizontal Reference Point – General description of the geographic position of the field
Location in relationship to the ground.
7. Source Map Scale - Scale of the base map (if applicable) used to determine the geographic
position of the field Location.
50
Vertical Location Information
1. Vertical Location Value
2. Vertical Measure and Unit of Measure - The elevation of the land surface at a field
Location.
3. Vertical Reference - The reference point used to calculate the Elevation (Vertical Measure)
of a field Location (i.e. mean sea level).
4. Vertical Collection Methods - The technique used to calculate the Elevation (Vertical
Measure) of a field Location (i.e. map, GPS, surveyed).
5. Vertical Datum - Model used to match the Elevation (Vertical Measure) of field Locations on
the ground to field Locations on a map (i.e. NAVD88).
6. Vertical Accuracy - Indicates the accuracy of a field Location's Elevation (Vertical Measure).
Other Well Location Information
1. Well ID – Sub ID for well clusters or multiple completions at a single well (i.e. 1,2,3).
2. Well Tag Number - Unique six-digit alpha-numeric identifier stamped on an aluminum tag.
3. Well Owner Name - This information is not made public without filing a formal request.
4. Well Status - Describes whether a well is still in existence or has been abandoned.
5. Well Use - Describes the primary use of the well (i.e. monitor, withdrawal).
6. Well Water Use - Describes the primary use of the water from the well (i.e. water supply,
irrigation).
7. Well Construction Start and End Dates - Dates well construction was started and completed.
8. Well Construction Method - Method used to create the borehole and construct the well.
9. Well Completion Depth and Unit of Measure - Final completion depth below land surface for
a well as determined during initial construction.
10. Well Hole Depth and Unit of Measure – Depth below land surface to the bottom of the
borehole on completion of drilling.
11. Well Maximum Casing Diameter and Unit of Measure - Diameter of the outermost permanent
casing used to complete the well.
12. Well Completion Method - Method of well completion (i.e. open hole, gravel pack with
screened casing).
13. Well Measuring Point Name - Name used to describe a unique reference point on a well from
which depth-to-water measurements are routinely made (i.e. MP1).
14. Well Measuring Point Height and Unit of Measure - Distance (height) from the well MP to the
land surface at the well.
15. Well Measuring Point Description - Description of the physical point on the well from which
water levels are measured.
16. Well Measuring Point Effective Date - Date when MP was first used.
17. Well Measuring Point End Date - Date when a MP was abandoned.
10.2.2 Well Interval Information
Well interval information can be entered into EIM if a well driller’s log is available. This information
describes the well or borehole by interval and can include information on geologic unit, well casing
materials (type, depth, and diameter), well finish (screen, open hole), and fill material (type and
volume).
51
11.0 References
Culhane, T.J. 2017. Water Resources Program Integrated Statewide Groundwater Monitoring
Strategy. Washington State Department of Ecology, Water Resources Program, Ecology Publication
No. 17-11-005
Drost, B.W. 2005. Quality-Assurance Plan for Ground-Water Activities, U.S. Geological Survey,
Washington Water Science Center, Open-File Report 2005-1126,
http://pubs.usgs.gov/of/2005/1126/pdf/ofr20051126.pdf
Fulford, J.M., and Clayton, C.S., 2015. Accuracy testing of steel and electric groundwater-level
measuring tapes—Test method and in-service tape accuracy: U.S. Geological Survey Open-File
Report 2015–1137, 31 p., http://dx.doi.org/10.3133/ofr20151137
Garber, M.S., and Koopman, F.C., 1968, Methods of measuring water levels in deep wells: U.S.
Geological Survey Techniques of Water-Resources Investigations, book 8, chap. A1, 23 p.
Marti, P.B. 2012. Standard Operating Procedure for Manual Well-Depth and Depth-to-Water
Measurements, Version 1.1, Washington State Department of Ecology, Environmental Assessment
Program,
http://www.ecy.wa.gov/programs/eap/qa/docs/ECY_EAP_SOP_ManualWellDepth&DepthtoWaterM
easures_v_1_1EAP052.pdf
Sinclair, K. and Pitz, C.F. 2015. Standard Operating Procedure for the use of Submersible Pressure
Transducers during Groundwater Studies, Version 1.1, Washington State Department of Ecology,
Environmental Assessment Program,
http://www.ecy.wa.gov/programs/eap/qa/docs/ECY_EAP_SOP_SubmersiblePressureTransducers_v1
_1EAP074.pdf
Pitz, C.F. 2011. Standard Operating Procedure for Tagging Wells, Version 1.1, Washington State
Department of Ecology, Environmental Assessment Program,
http://www.ecy.wa.gov/programs/eap/qa/docs/ECY_EAP_SOP_WellTaggingV_1_1EAP081.pdf