Embed Size (px)
Citation preview
Integrated SMART Survey
(Nutrition, WASH, Food Security and Livelihoods)
Mwingi District
Kenya
Funded by
April 2011
Action Against Hunger (USA) Integrated SMART Survey, April 2011, Mwingi District, Kenya 2
Table of Contents
List of Tables .................................................................................................................................................................. 3 Abbreviations ................................................................................................................................................................. 4 Acknowledgements ....................................................................................................................................................... 5 1 Executive Summary ............................................................................................................................................... 6 2 Background Information ....................................................................................................................................... 9 3 Survey Objectives ................................................................................................................................................ 10 4 Methodology....................................................................................................................................................... 11
4.1. Sampling ..................................................................................................................................................... 11 4.2. Training and organization of survey teams ................................................................................................ 11 4.3. Data Quality Assurance Processes ............................................................................................................. 11 4.4. Data Collection ........................................................................................................................................... 11 4.5. Data Entry and Analysis .............................................................................................................................. 12
5 Results & Discussion ........................................................................................................................................... 14 5.1. Socio- Demographics Characteristics ......................................................................................................... 14 5.2. Nutritional Status ....................................................................................................................................... 15 5.3. Retrospective mortality .............................................................................................................................. 18 5.4. Morbidity, Coverage of Vitamin A and Measles Immunization .................................................................. 18 5.5. Health seeking behaviour and maternal & child care practices ................................................................. 19 5.6. Food Security and Livelihoods .................................................................................................................... 21 a) Crop Production ............................................................................................................................................. 21 b) Coping Strategies ............................................................................................................................................ 22 c) Live stock holding ........................................................................................................................................... 23 d) Dietary Diversity ............................................................................................................................................. 23 e) Market Price ................................................................................................................................................... 24 5.7. Water and sanitation ................................................................................................................................. 24 a) Household water sources & water treatment ................................................................................................ 24 b) Water Source .................................................................................................................................................. 25 c) Hand washing practices .................................................................................................................................. 26 d) Household solid waste and human waste management................................................................................ 26 e) Household mosquito net use ......................................................................................................................... 27
6 Conclusion and Recommendations..................................................................................................................... 28 Annex 1: SMART Survey Anthropometric Form (April 2011) 6-59 months old children ............................................ 30 Annex II: Calendar of Events ........................................................................................................................................ 31 Annex III: Cluster Mortality Questionnaire .................................................................................................................. 32 Annex IV: WASH and Food Security and Livelihood Questionnaire............................................................................. 33 Annex V: Anthropometric data plausibility check (WHO) ........................................................................................... 38
Action Against Hunger (USA) Integrated SMART Survey, April 2011, Mwingi District, Kenya 3
List of Tables Table I: Summary of key Findings ................................................................................................................... 7 Table II: Demographic characteristics ........................................................................................................... 14 Table III: Distribution of age and sex of sample............................................................................................ 15 Table IV: Prevalence of acute malnutrition based on weight-for-height z-scores (and/or oedema) and by sex (WHO standards) ..................................................................................................................................................... 15 Table V: Prevalence of acute malnutrition based on weight-for-height z-scores (and/or oedema) and by NCHS ...................................................................................................................................................................... 15 Table VI: Prevalence of acute malnutrition by age based on weight-for-height z-scores and/or oedema WHO standards. ..................................................................................................................................................... 16 Table VII: Prevalence of acute malnutrition based on the percentage of the median and/or oedema ....... 16 Table VIII: Prevalence of malnutrition by age, based on weight-for-height percentage of the median and oedema ...................................................................................................................................................................... 17 Table IXI: Prevalence of GAM and SAM by MUAC ........................................................................................ 17 Table X: Prevalence of underweight based on weight-for-age z-scores by sex ............................................ 17 Table XI: Prevalence of underweight by age based on weight-for-height z-scores and oedema ................. 17 Table XII: Prevalence of stunting based on height-for-age z-scores and by sex ........................................... 18 Table XIII: Prevalence of stunting by age based on height-for-age z-scores ................................................ 18 Table XIVI: Mean z-scores, Design Effects and excluded subjects ................................................................ 18 Table XV: Vitamin A supplementation, Measles Immunization Status, OTP/SFP and Morbidity ................. 19 Table XVI: Maternal and children feeding practices. .................................................................................... 20 Table XVII: Dietary Diversity Indicator for Children 6 – 23 Months .............................................................. 21 Table XVIII:Source of food ............................................................................................................................ 22 Table XIX: Livestock Holding ......................................................................................................................... 23 Table XX: Household Dietary Diversity Score ............................................................................................... 24 Table XXI: Market Price ................................................................................................................................ 24 Table XXII: Distance to Water Source ........................................................................................................... 25 Table XXIII: Water treatment ........................................................................................................................ 26 Table XXIV:Hand Washing Practices. ............................................................................................................ 26 Table XXV: Household disposal of solid and human waste .......................................................................... 26 List of Figures Figure I: Areas Surveyed in the district. ........................................................................................................ 10 Figure II: Education status ............................................................................................................................ 14 Figure III: Health Seeking Behavior ............................................................................................................... 20 Figure IV: Main source of food – Ranking. .................................................................................................... 22 Figure V: Coping Strategies ........................................................................................................................... 23 Figure VI: Source of water ............................................................................................................................ 25 Figure VII: Household mosquito net use ...................................................................................................... 27
Action Against Hunger (USA) Integrated SMART Survey, April 2011, Mwingi District, Kenya 4
Abbreviations ALRMP Arid Lands Resource Management Project ASAL Arid and Semi-Arid Lands BSFP Blanket Supplementary Feeding Programme CI Confidence Interval CSB Corn-Soya Blend CTC Community Therapeutic Care DNOs District Nutrition Officers ENA Emergency Nutrition Assessment FFA Food for Assets GAM Global Acute Malnutrition GFD General Food Distribution HDDS Household Dietary Diversity Score IYCF Infant and Young Child Feeding KAP Knowledge, Attitudes and Practices KFSSG Kenya Food Security Steering Group MOH Ministry of Health MUAC Middle Upper Arm Circumference NGOs Non-governmental Organizations OTP Outpatient therapeutic Programme SC Stabilization Centre SFP Supplementary Feeding Programme SMART Standardized Monitoring and Assessment of Relief and Transition WFH Weight for Height WFP World Food Programme WHO World Health Organization
Action Against Hunger (USA) Integrated SMART Survey, April 2011, Mwingi District, Kenya 5
Acknowledgements
ACF Kenya Mission would like to acknowledge the support of the following;
• UNICEF for providing financial support for the survey • Parents and caretakers for allowing their children and households to be assessed and for sharing valuable
information • Ministry of Health team in the Larger Mwingi, especially District Nutrition Officers for Mwingi and Kyuso
Districts. They provided relevant team support and vital information necessary for planning the survey • Team members from Kenya National Bureau of Statistics, The Ministry of Public Health and the Arid Lands
Resource Management Office • District Commissioners, District Arid Lands Management Project office, District health planning teams,
chiefs and sub-chiefs in Mwingi, Tseikuru and Kyuso districts. They helped in mobilization, availed population data and provided important local contacts thus easing the planning of the survey
• Village elders in Tseikuru, Nuu, Ngomeni and Nguni for as acting as guides and introducers to the teams in survey locations
• ACF staff on ground, and in Nairobi for management of personnel, logistics and Administrative issues without whose support the survey would not have been possible
• Data collectors and field survey supervisors for hard work and dedication and good cheer in the field • The survey drivers for timely movement of field staff
Action Against Hunger (USA) Integrated SMART Survey, April 2011, Mwingi District, Kenya 6
1 Executive Summary
Mwingi district is predominantly marginal environmentally, agriculturally and economically. It is characterized by unreliable and erratic rainfall as well as poor infrastructure. The district has been under Emergency Operations (EMOP) since August, 2004, with a scale up in 2009 due to a severe drought and reduction in 2010 due to improved conditions.
The nutrition situation has, however, since deteriorated from moderate risk to high risk in late 2010. This was as a result of poor rainfall performance attributed to La Nina, an extreme dry weather phenomenon increasingly being associated with Climate Change. If the expected long rains in 2011 perform poorly, the situation is likely to lead to an acute food and livelihood crisis.
In this regard, ACF-USA and the Ministry of Health (MOH), Mwingi, conducted an integrated nutrition survey in selected areas within the Larger Mwingi District, Eastern Province, Kenya.
The survey covered two districts Kyuso and Tseikuru. The survey was carried out in these specific areas within the two districts: Tseikuru, Nuu, Nguni and Ngomeni. The nutrition survey was implemented using the Standardized Monitoring and Assessment of Relief and Transitions (SMART) methodology.
The survey was realized in collaboration with the Ministry of Health, Arid Lands Resources Management Project (ALRMP) and the Kenya National Bureau of Statistics (KNBS).
A four day training of on the SMART methodology was done on April 13 to 16, 2011 followed by a data collection between April 18 and 25, 2011.
Methodology
Two-stage cluster sampling with probability proportional to size (PPS) methodology was used for this survey. Population data was obtained from chiefs, sub chiefs and village elders.
Emergency Nutrition Assessment (ENA) for SMART software was used in determining the sample size. The last nutrition survey conducted in the area was in October 2009, the survey results reported a GAM of 8.3% (6.1 – 11.3) and SAM of 0.6% (0.2 –1.5). Factoring the upper CI limit of 11.3, a precision of 3.7, a design effect of 2.0 and a 3% non response rate resulted in 563 children (528 HH) targeted for the survey.
To calculate the mortality sample, a prevalence of 0.13 (upper limit) per 10,000/day, precision of 0.18 and design effect 1.5, was used and a total of 487 households (2880 persons) were selected.
The anthropometric survey sample (528), the higher of the two, was used in the sample. This translated into 40x13 cluster design with an overall sample size of 528 households. 13 households, as used in the previous survey, were estimated to be the maximum number of households that could be surveyed in one day.
At the second stage, systematic random sampling was used to select households to be visited. A list of all households in target village (cluster) was availed by a village elder; consequently, the total number of households was divided by the required sample size per cluster (13) to determine the sampling interval. A random number was then chosen to select the first household and the sampling interval repeatedly added to determine the remaining sample households. Respondents were primarily heads of households and/or their spouses.
Survey Implementation
Five survey teams each comprising of a team leader, and four data collectors were formed. The five team leaders were from the Ministry of Health (3), ALRMP (1) and KNBS (1).
The data collection process took place from the 13th to the 25th of April, 2011. A four day training on SMART methodology preceded an 8 day data collection process.
Anthropometric and mortality data was entered and analyzed using the ENA for SMART Software, October 2008 version. Excel and SPSS were used to analyse Food Security and Water & Sanitation data.
Action Against Hunger (USA) Integrated SMART Survey, April 2011, Mwingi District, Kenya 7
Survey Results
A total of 598 children (292 males and 306 females) aged 6-59 months were sampled. There was no exclusion. For Mortality, 3417 people from 518 households were sampled.
The mean number of people and under five years old per household was 6.5 persons and 1.3 children, respectively.
The Global Acute Malnutrition (GAM) was 10.2% (95% CI: 7.5 - 13.7) and severe acute malnutrition (SAM) was 1.5% (95% CI: 0.7-3.2). No Oedema cases were reported. The acute malnutrition level with 95% Confidence Interval ranges from poor to serious according to the WHO standards.
The Crude Death Rate finding was 0.06 (0.02-0.24) per 10,000 persons per day, below the emergency threshold of 1/10,000/day.
The assessment revealed high levels of morbidity in the area (45.0%). The highest incidence of disease was fever with difficulty in breathing (20.1%), followed by chills like malaria reported was 19.6%. The incidence of diarrhea reported was 13%; within two weeks prior to the assessment. ARI’s, Malaria and Diarrhea have been shown to have a direct relationship with acute malnutrition leading to poor nutritional outcomes through poor utilization of the nutrients in the body.
61% and 49.7% of surveyed children has measles vaccination (by card) and vitamin A supplementation respectively.
The main source of water was unprotected shallow well (54.2%) with a majority of the respondents doing nothing to the water before using for household use.
Open defection occurred in 67.1% of all households interviewed indicative of poor sanitation practices.
The most common sources of food in the 30 days before the survey were purchase, and own production, respectively used by 68.1% and 23.3%. Recent finding by KFSSG showed agree with this results, showing less than optimal crop performance in the previous planting season. Resulting from poor rains in the past few years, households experienced repeated crop failures. For instance, even though over 97.9 of the households reported to have been engaged in crop farming only about 23.1% reported to food stock remaining. The average number of food groups consumed based on the 12 food groups and 24 hour recall period was 3.76
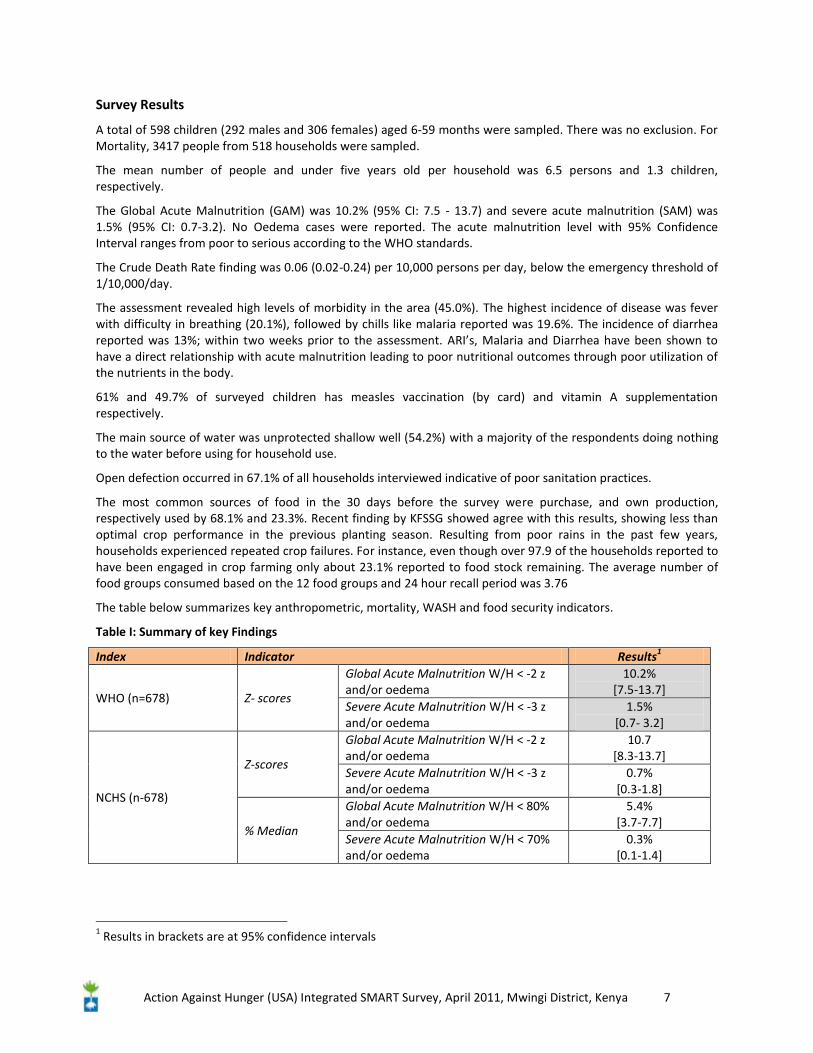
The table below summarizes key anthropometric, mortality, WASH and food security indicators.
Table I: Summary of key Findings
Index Indicator Results1
WHO (n=678) Z- scores
Global Acute Malnutrition W/H < -2 z and/or oedema
10.2% [7.5-13.7]
Severe Acute Malnutrition W/H < -3 z and/or oedema
1.5% [0.7- 3.2]
NCHS (n-678)
Z-scores
Global Acute Malnutrition W/H < -2 z and/or oedema
10.7 [8.3-13.7]
Severe Acute Malnutrition W/H < -3 z and/or oedema
0.7% [0.3-1.8]
% Median
Global Acute Malnutrition W/H < 80% and/or oedema
5.4% [3.7-7.7]
Severe Acute Malnutrition W/H < 70% and/or oedema
0.3% [0.1-1.4]
1 Results in brackets are at 95% confidence intervals
Action Against Hunger (USA) Integrated SMART Survey, April 2011, Mwingi District, Kenya 8
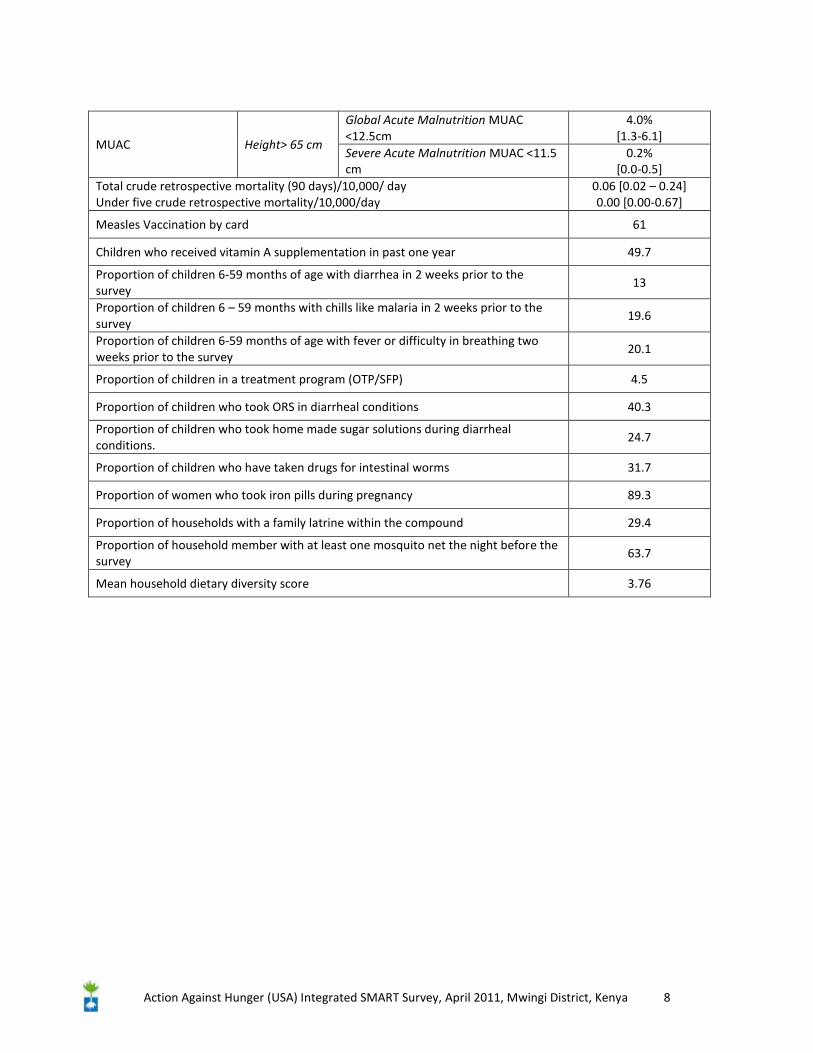
MUAC Height> 65 cm
Global Acute Malnutrition MUAC <12.5cm
4.0% [1.3-6.1]
Severe Acute Malnutrition MUAC <11.5 cm
0.2% [0.0-0.5]
Total crude retrospective mortality (90 days)/10,000/ day Under five crude retrospective mortality/10,000/day
0.06 [0.02 – 0.24] 0.00 [0.00-0.67]
Measles Vaccination by card 61
Children who received vitamin A supplementation in past one year 49.7
Proportion of children 6-59 months of age with diarrhea in 2 weeks prior to the survey
13
Proportion of children 6 – 59 months with chills like malaria in 2 weeks prior to the survey
19.6
Proportion of children 6-59 months of age with fever or difficulty in breathing two weeks prior to the survey
20.1
Proportion of children in a treatment program (OTP/SFP) 4.5
Proportion of children who took ORS in diarrheal conditions 40.3
Proportion of children who took home made sugar solutions during diarrheal conditions.
24.7
Proportion of children who have taken drugs for intestinal worms 31.7
Proportion of women who took iron pills during pregnancy 89.3
Proportion of households with a family latrine within the compound 29.4
Proportion of household member with at least one mosquito net the night before the survey
63.7
Mean household dietary diversity score 3.76
Action Against Hunger (USA) Integrated SMART Survey, April 2011, Mwingi District, Kenya 9
2 Background Information
After the August 2010 promulgation of a new Constitution in Kenya, Mwingi district was subsumed into Kitui to form Kitui County. For the purposes of this study, Mwingi refers to nine districts (now Sub-Counties), Central, Migwani, Tseikuru, Kyuso, Mumoni, Nguni, Ngomeni, Nuu and Mui. This area abuts Machakos to the west, Mbeere and Meru South to the north, and Tana River to the east. It lies between Latitudes 00 03’ and I0 12’ and Longitudes 370 47’ and 380 57’ and covers an area of 10, 030 km2. According to the 1999 National Census, Mwingi had a population of 377, 679. Mwingi is a mostly marginal district characterized by unreliable and erratic rainfall, poor infrastructure, inadequate social amenities, a high incidence of poverty and a sparse population density. The Kenya Demographic & Health Survey (2009) identifies Migwani (108/km2) and Central ((75/km2) as the areas with the highest population densities in Mwingi.
About 85% of the district’s inhabitants rely on agriculture (including pastoralism and honey harvesting) as the major means of livelihood (Kenya Demographic & Health Survey, 2009). However, given the area’s unreliable and erratic rainfall, regime, farming is a challenging livelihood choice. Consequently, the incidence of poverty in the district is high as most people have limited options to pathways out of poverty. The absolute dependency on rain-fed agriculture, paucity of irrigation, poor land use practices, poor infrastructure and a vast and remote district compound the burden of poverty upon the people. Mwingi has a poverty level of 60%, meaning that close to two thirds of the population lack sufficient nutrition (Ministry of Planning, 2009). Other than farming, other sources of livelihood include livestock keeping, honey harvesting, small and microenterprises (mostly in towns). Others are sand harvesting, construction of building blocks, casual and formal employment. Mwingi is also classified as a highly water stressed, food insecure and faces periodic food crisis which make crisis food interventions necessary.
Many other development indicators adduce supportive evidence for the high poverty levels: Mwingi is classified as food stressed due to recurrent food insecurity challenges that often, especially at the higher levels of poverty, devolve into food crisis. Anecdotal and research evidence shows that there are many state and non state (religious institutions, NGOs and CBOs) engaged in food aid in the district. Food for work and food for assets programs are common in Mwingi, further evidence of the district’s precariousness food security situation. Complexities and challenges that arise from intergenerational poverty do not just manifest in food inadequacy and nutritional insufficiency, but also in other indicators like under 5 mortality, child and maternal health, life expectancy , morbidity and mortality rates. According to statistics from the Ministry of Health (2009), life expectancy in Mwingi is 55 years, below the national average, and Under 5 mortality rate is 122/1000. The district also has an inordinately high number of disadvantaged demographics: neglected and abused children, orphans (mostly but not always as a result of bereavement from HIV/AIDS) and the poor and elderly. Furthermore, 30% and 4.5% of households are headed by females and children respectively. This exacerbates the burden of poverty at the household level, in the former as a result of cultural, structural and institutional factors that enable feminization of poverty and the latter due to a host of factors including inability to work due to physical and/or psychological causes, lack of education, neglect and abuse.
Mwingi does not fare well in terms of social infrastructure, healthcare and education. The vast area only has 51 healthcare facilities, the average distance to a health facility 30 km and doctor: patient ratio is 1: 50, 070 (Ministry of Planning, 2009). A 2008 UNICEF/Central Bureau of Statistics study in Mwingi identified healthcare and nutrition as major challenges to child welfare in Mwingi. These problems in turn manifest in the education system where enrolment, retention and transition numbers have been shown to be dependent (direct correlation) on food household food sufficient. The government, religious institutions and several NGOs have, as a result, established different food intervention programs, including school feeding programs, to ameliorate the impact of food insufficient—and by extension improve educational attainment and achievement. Other than household level variables, there are other community or government level factors that impact negatively on education: number of educational institutions (356 primary schools and less than 50 secondary schools) as well as teacher: pupil ratio (1:35) (Kenya Demographic & Health Survey, 2009).
Action Against Hunger (USA) Integrated SMART Survey, April 2011, Mwingi District, Kenya 10
3 Survey Objectives
The overall objective of the survey was to determine the level of acute malnutrition among children aged 6-59 months and to analyze the possible factors contributing to malnutrition.
Specific objectives included:
> Assessing the prevalence of acute malnutrition in children aged 6-59 months
> Estimating the Crude and Under five mortality rates
> Determine the Infant and Young child feeding practices among children 0 – 23 months.
> Investigate household food security and food consumption patterns.
> Estimate Morbidity rates of children 6 – 59 months.
> Determine the proportion of households with access to safe water.
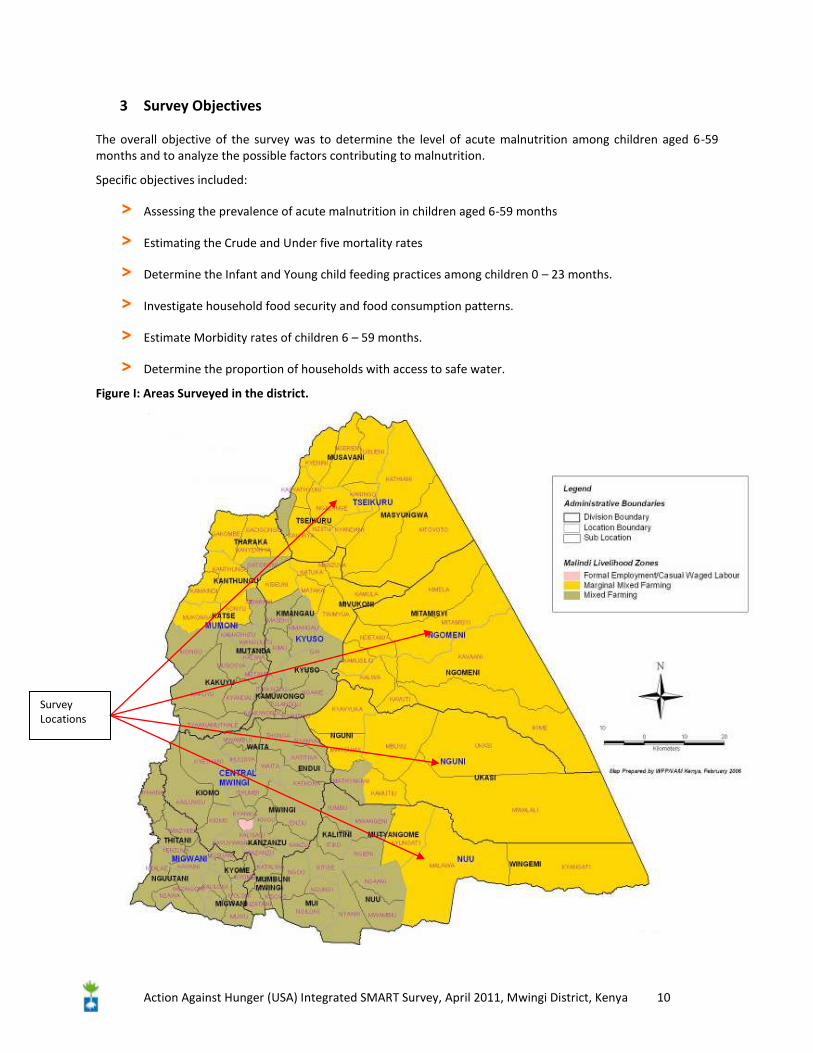
Figure I: Areas Surveyed in the district.
Survey Locations
Action Against Hunger (USA) Integrated SMART Survey, April 2011, Mwingi District, Kenya 11
4 Methodology
4.1. Sampling
A two-stage cluster sampling design with probability proportional to size (PPS) design was employed for this survey. The Emergency Nutrition Assessment (ENA) software for SMART was used to determine the sample size required using the October 2009 survey results. Village level population data were obtained from chiefs, sub-chiefs and elders in respective sub-locations. The survey found a GAM rate of 8.3% (6.1 – 11. 3 C.I) and SAM 0.6% (0.2 – 1.5 C.I), precision of 3.7%, a design effect of 2 and a 3% non response rate, 563 children (528 households) were then planned for the survey.
Mortality planning used an estimated prevalence of 0.13 per 10,000/day, precision of 0.18 and design effect 1.5, and the sample size was determined at 487 households and a targeted population of 2880. The maximum number of households (528) was used. This was translated to 40x13 cluster design with an overall sample size 528 households, as 13 households was estimated the maximum number of households a team could survey in one day.
To select households to be interviewed, systematic random sampling was used from the household list available from village elders. The total number of households in each village or cluster was divided by the required sample size per cluster (13) to determine the sampling interval. Then a random number was chosen between 1 and the sampling interval to select the first household and the sampling interval repeatedly added to determine the remaining households. Respondents were primarily heads of households and spouses. Additional information was solicited from the relevant household members.
4.2. Training and organization of survey teams
A four day, April 13th to 16th, intensive training session was conducted for 20 data collectors and 5 team leaders. Training focused on survey implementation, objectives, sample household selection and interviewing and anthropometric measurement techniques. The 5 team leaders in Mwingi were from the Ministry of Health (3), ALRMP (1) and KNBS (1) and they each had four data collectors to make five 5-member teams. The teams were organized based on the number of clusters to be completed and households/children to be interviewed or measured per cluster. Each team was requested to complete a cluster in a day (13 households). Data from the 2009 National Census was applied in determining these clusters.
4.3. Data Quality Assurance Processes
To ensure accurate and reliable measurements, survey teams were subjected to Standardization test on the third day of the second training. The results showed that some of them could not take measurements accurately and precisely. A session of anthropometric measurements was revisited. Additionally, field testing of the survey instruments and survey teams in a non surveyed village adjacent to Mwingi town was conducted on the last day of the training. The precision and the accuracy of the data collected as part of the pre-test were evaluated and feedback provided to the teams. To improve the accuracy in determining dates of childbirth, a local events calendar (Created with the help of enumerators) was used in case a mothers or caretakers were unable to provide a child card or recall the exact date of birth. At the end of each day during the data collection all the anthropometric data was entered, plausibility check performed and feedback provided to each team before commencement of the subsequent day’s data collection.
4.4. Data Collection
Field data collection was conducted from April 13th to 25th covering the 40 clusters/villages and 13 households from each cluster. The following categories of data were collected using three survey instruments:
Action Against Hunger (USA) Integrated SMART Survey, April 2011, Mwingi District, Kenya 12
• Anthropometric and mortality questionnaires were adopted from the SMART.
• WASH/Food Security was developed specifically for this survey and pre-tested as part of the training of enumerators and team leaders.
a) Anthropometric Indicators:
Children aged 6-59 months were measured using the standard survey form (see annex) that captures the following key variables:
• Age in months-determined from child card or with the help of a local calendar of events
• Sex- recorded as ‘m’ for male and ‘f’ for female
• Weight- Children were weighed to the nearest 100 g with a Salter Hanging Scale of 25 kg. All scales were calibrated daily by using a standard weight of 1 kg. In the field, it was calibrated with an empty weighing pant before each measurement.
• Height- Children were measured on a measuring board (precision of 0.1cm).Children less than 85cm were measured lying down, while those greater than or equal to 85cm were measured standing up.
• Mid-Upper Arm Circumference (MUAC) - measured in centimetres at mid-point of left upper arm to the nearest 0.1 cm with a MUAC tape.
• Bilateral oedema - assessed by the application of moderate thumb pressure for at least three seconds to both feet (upper side) simultaneously. Only children with bilateral oedema were recorded as having nutritional oedema.
• Measles vaccination- recorded for children aged 9-59 months from their vaccination cards. If no card was available at the time of the survey, the caretaker was asked if the child had been immunized against measles or not.
• Vitamin A coverage- assessed by first describing what a Vitamin A capsule looked like, then asking the mother if the child received the content of that capsule in the past. The answer was then recorded depending on how many times the child had received it in the last one year.
• Illness- assessed by asking each caretaker whether the child selected aged 6-59 months data was sick in the two weeks prior to the date of the survey. If the response was positive then the caretaker was further asked regarding the type of illnesses and the responses recorded.
b) Retrospective Mortality
The data required for estimating the death rate were collected using the SMART mortality survey form and 90 days recall period. The recall period estimated from mid January (18th) and the start of the survey. Each sample household regardless of having children 6-59 months of age was asked to enumerate current household members, indicate sex and age, members present at the time of the survey and at the beginning of the recall period, people joined or left during the recall period, and whether there was any birth or death in the recall period.
c) Food Security and WASH
From the same households the mortality data were collected, the WASH and food security questionnaires were administered to the head of the household and/or the spouse regardless of whether the selected household had a child 6-59 months of age. The questionnaire was used to gather data on health related variables from mothers with children under five, water availability and accessibility, sanitation and hygiene practices, crop and livestock production, food sources, dietary diversity, income and expenditure and coping strategies (see Annex V).
4.5. Data Entry and Analysis
The anthropometric and mortality data were entered and analyzed using the ENA Software, November 2008 version. The food security and WASH data entry was done in SPSS and Excel. In assessing the nutrition status of
Action Against Hunger (USA) Integrated SMART Survey, April 2011, Mwingi District, Kenya 13
children 6-59 months old, data on immediate and underlying causes of malnutrition such as disease, health seeking behaviour, water and sanitation and food security and livelihood indicators were analyzed. Nutrition status is improved when individuals are healthy, have secure access to food and access to resources and livelihood options. This analytical approach provided the framework in identifying possible casual factors leading to the final outcome of malnutrition.
a) Analysis of Acute Malnutrition
Acute malnutrition rates are estimated from the weight for height (WFH) index values combined with the presence of oedema. The WFH indices are expressed in both Z-scores and percentage of the median, according to WHO 2006 standards and NCHS 1977 reference.
Z-Score • Severe malnutrition is defined by WFH < -3 SD and/or existing bilateral oedema on the lower limbs. • Moderate malnutrition is defined by WFH < -2 SD and > -3 SD and no oedema. • Global acute malnutrition is defined by WFH < -2 SD and/or existing bilateral oedema.
Percentage of Median • Severe malnutrition is defined by WFH < 70 % and/or existing bilateral oedema on the lower limbs • Moderate malnutrition is defined by WFH < 80 % and >70 % and no oedema. • Global acute malnutrition is defined by WFH <80% and/or existing bilateral oedema
b) Analysis of Retrospective Mortality
The Crude Death Rate is defined as the number of people in the total population who died between the start of the recall period and the time of the survey. It is calculated using the following formula. Crude Mortality Rate (CMR) = 10,000/a*f/ (b+f/2-e/2+d/2-c/2), Where: a = Number of recall days b= Number of current household residents c = Number of people who joined household d = Number of people who left household e = Number of births during recall f = Number of deaths during recall period Crude Mortality Rate (CMR): Alert level: 1/10,000 people/day Emergency level: 2/10,000 people/day Under Five Mortality Rate (U5MR): Alert level: 2/10,000 people/day Emergency level: 4/10,000 people/day
c) Additional Health Information
• Illnesses of Children < 5 years and Health Seeking Behaviour, Morbidity: illnesses and treatment seeking behaviour and sources of health services.
• Infant and Young Child Feeding practices • Immunization (measles) and vitamin A coverage • Mosquito nets utilization
d) Food Security and Livelihoods
• In order to better understand the food security and livelihoods dynamics, the data collected and the analytical approaches include:
• Analysis of crop and livestock production practices and ownership structure and contribution to food security and livelihoods
• Dietary diversity score based on 12 food groups
Action Against Hunger (USA) Integrated SMART Survey, April 2011, Mwingi District, Kenya 14
Level of education
36%
8%34%
7%3%
12%
none non formal primary level secondary level above secondary other(specify)
e) WASH
• Sources of water and distance to the nearest sources, safety and quantity of water use for household consumption and its relation to nutritional outcomes
• Water treatment and hand washing practices • Access to and utilization of latrines • Solid waste practices
5 Results & Discussion
5.1. Socio- Demographics Characteristics
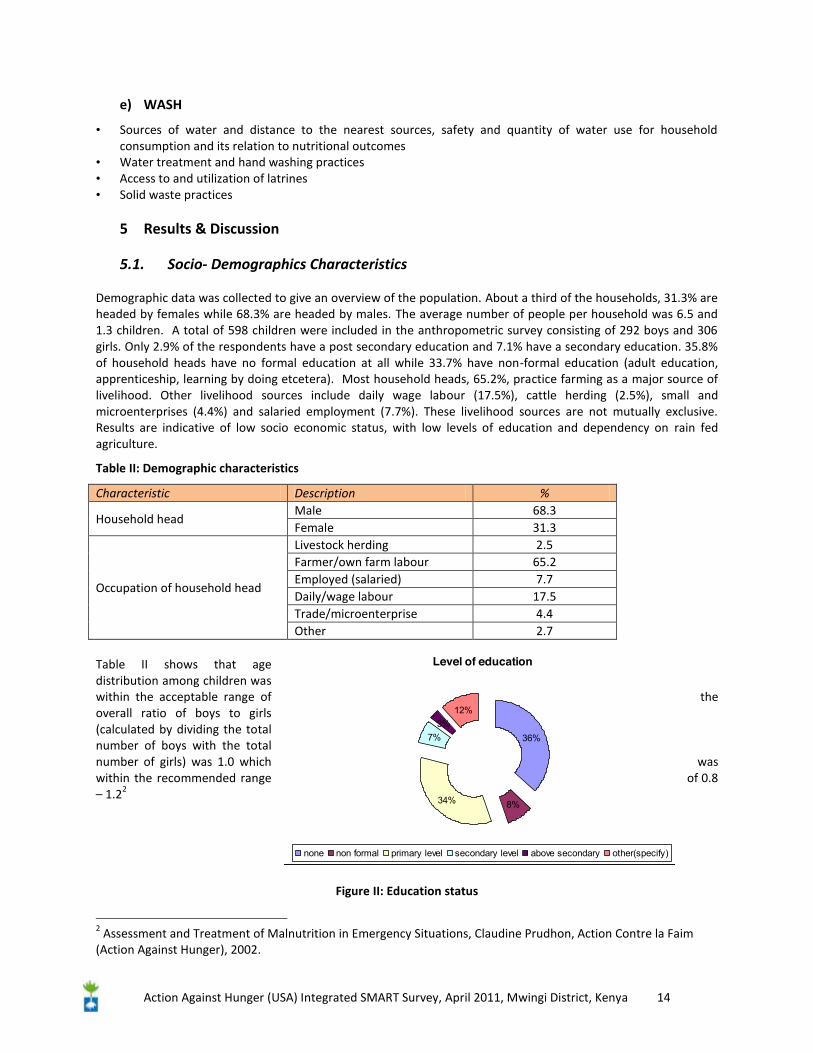
Demographic data was collected to give an overview of the population. About a third of the households, 31.3% are headed by females while 68.3% are headed by males. The average number of people per household was 6.5 and 1.3 children. A total of 598 children were included in the anthropometric survey consisting of 292 boys and 306 girls. Only 2.9% of the respondents have a post secondary education and 7.1% have a secondary education. 35.8% of household heads have no formal education at all while 33.7% have non-formal education (adult education, apprenticeship, learning by doing etcetera). Most household heads, 65.2%, practice farming as a major source of livelihood. Other livelihood sources include daily wage labour (17.5%), cattle herding (2.5%), small and microenterprises (4.4%) and salaried employment (7.7%). These livelihood sources are not mutually exclusive. Results are indicative of low socio economic status, with low levels of education and dependency on rain fed agriculture.
Table II: Demographic characteristics
Characteristic Description %
Household head Male 68.3 Female 31.3
Occupation of household head
Livestock herding 2.5 Farmer/own farm labour 65.2 Employed (salaried) 7.7 Daily/wage labour 17.5 Trade/microenterprise 4.4 Other 2.7
Table II shows that age distribution among children was within the acceptable range of the overall ratio of boys to girls (calculated by dividing the total number of boys with the total number of girls) was 1.0 which was within the recommended range of 0.8 – 1.22
Figure II: Education status
2 Assessment and Treatment of Malnutrition in Emergency Situations, Claudine Prudhon, Action Contre la Faim (Action Against Hunger), 2002.
Action Against Hunger (USA) Integrated SMART Survey, April 2011, Mwingi District, Kenya 15
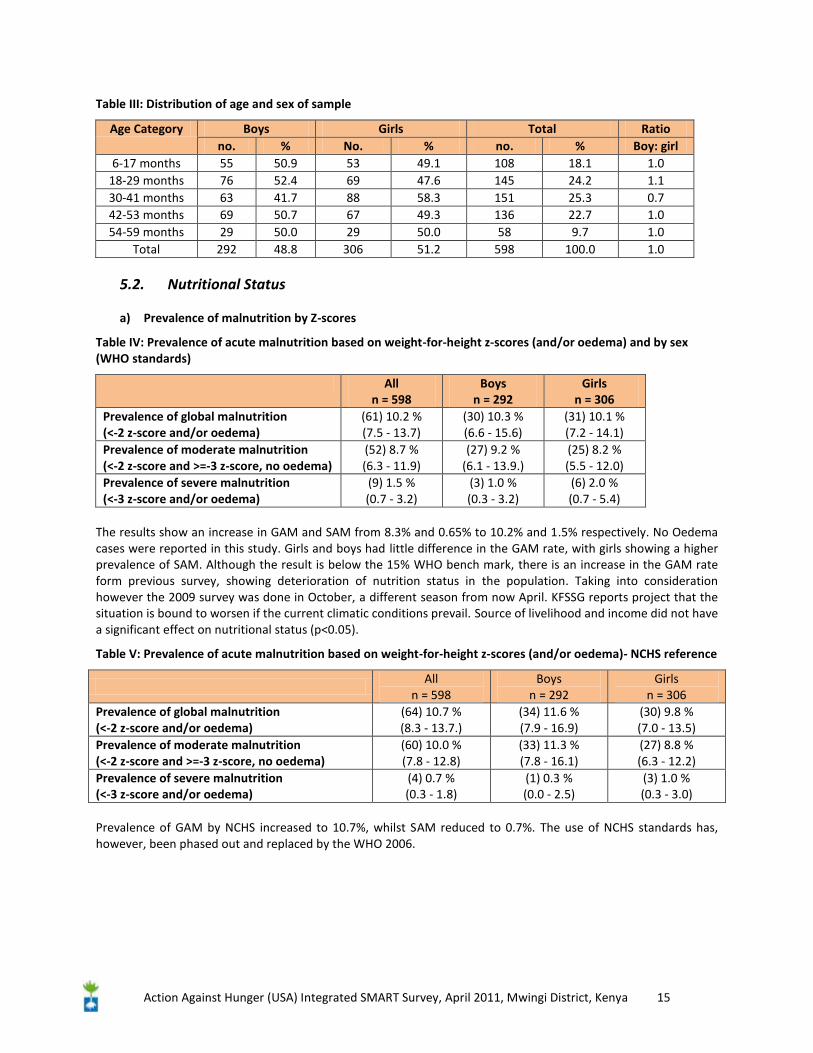
Table III: Distribution of age and sex of sample
Age Category Boys Girls Total Ratio no. % No. % no. % Boy: girl
6-17 months 55 50.9 53 49.1 108 18.1 1.0 18-29 months 76 52.4 69 47.6 145 24.2 1.1 30-41 months 63 41.7 88 58.3 151 25.3 0.7 42-53 months 69 50.7 67 49.3 136 22.7 1.0 54-59 months 29 50.0 29 50.0 58 9.7 1.0
Total 292 48.8 306 51.2 598 100.0 1.0
5.2. Nutritional Status
a) Prevalence of malnutrition by Z-scores
Table IV: Prevalence of acute malnutrition based on weight-for-height z-scores (and/or oedema) and by sex (WHO standards)
All n = 598
Boys n = 292
Girls n = 306
Prevalence of global malnutrition (<-2 z-score and/or oedema)
(61) 10.2 % (7.5 - 13.7)
(30) 10.3 % (6.6 - 15.6)
(31) 10.1 % (7.2 - 14.1)
Prevalence of moderate malnutrition (<-2 z-score and >=-3 z-score, no oedema)
(52) 8.7 % (6.3 - 11.9)
(27) 9.2 % (6.1 - 13.9.)
(25) 8.2 % (5.5 - 12.0)
Prevalence of severe malnutrition (<-3 z-score and/or oedema)
(9) 1.5 % (0.7 - 3.2)
(3) 1.0 % (0.3 - 3.2)
(6) 2.0 % (0.7 - 5.4)
The results show an increase in GAM and SAM from 8.3% and 0.65% to 10.2% and 1.5% respectively. No Oedema cases were reported in this study. Girls and boys had little difference in the GAM rate, with girls showing a higher prevalence of SAM. Although the result is below the 15% WHO bench mark, there is an increase in the GAM rate form previous survey, showing deterioration of nutrition status in the population. Taking into consideration however the 2009 survey was done in October, a different season from now April. KFSSG reports project that the situation is bound to worsen if the current climatic conditions prevail. Source of livelihood and income did not have a significant effect on nutritional status (p<0.05).
Table V: Prevalence of acute malnutrition based on weight-for-height z-scores (and/or oedema)- NCHS reference
All
n = 598 Boys
n = 292 Girls
n = 306 Prevalence of global malnutrition (<-2 z-score and/or oedema)
(64) 10.7 % (8.3 - 13.7.)
(34) 11.6 % (7.9 - 16.9)
(30) 9.8 % (7.0 - 13.5)
Prevalence of moderate malnutrition (<-2 z-score and >=-3 z-score, no oedema)
(60) 10.0 % (7.8 - 12.8)
(33) 11.3 % (7.8 - 16.1)
(27) 8.8 % (6.3 - 12.2)
Prevalence of severe malnutrition (<-3 z-score and/or oedema)
(4) 0.7 % (0.3 - 1.8)
(1) 0.3 % (0.0 - 2.5)
(3) 1.0 % (0.3 - 3.0)
Prevalence of GAM by NCHS increased to 10.7%, whilst SAM reduced to 0.7%. The use of NCHS standards has, however, been phased out and replaced by the WHO 2006.
Action Against Hunger (USA) Integrated SMART Survey, April 2011, Mwingi District, Kenya 16
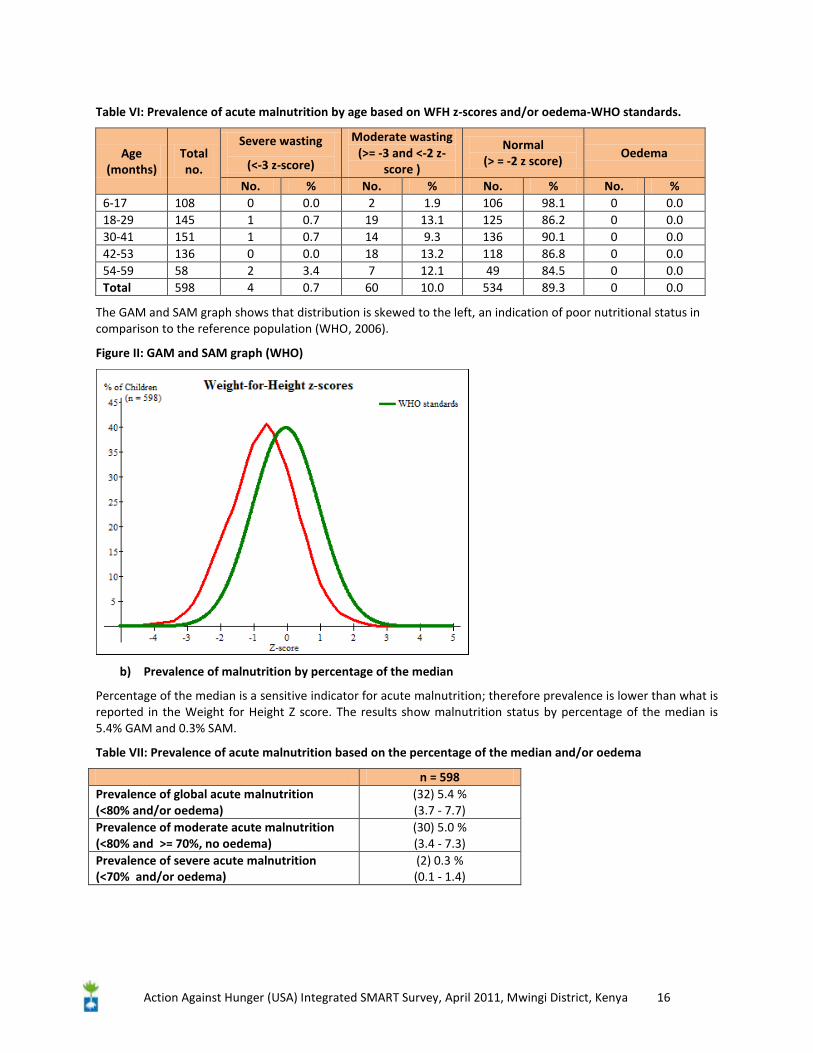
Table VI: Prevalence of acute malnutrition by age based on WFH z-scores and/or oedema-WHO standards.
Age (months)
Total no.
Severe wasting
(<-3 z-score)
Moderate wasting (>= -3 and <-2 z-
score )
Normal (> = -2 z score)
Oedema
No. % No. % No. % No. % 6-17 108 0 0.0 2 1.9 106 98.1 0 0.0 18-29 145 1 0.7 19 13.1 125 86.2 0 0.0 30-41 151 1 0.7 14 9.3 136 90.1 0 0.0 42-53 136 0 0.0 18 13.2 118 86.8 0 0.0 54-59 58 2 3.4 7 12.1 49 84.5 0 0.0 Total 598 4 0.7 60 10.0 534 89.3 0 0.0
The GAM and SAM graph shows that distribution is skewed to the left, an indication of poor nutritional status in comparison to the reference population (WHO, 2006).
Figure II: GAM and SAM graph (WHO)
b) Prevalence of malnutrition by percentage of the median
Percentage of the median is a sensitive indicator for acute malnutrition; therefore prevalence is lower than what is reported in the Weight for Height Z score. The results show malnutrition status by percentage of the median is 5.4% GAM and 0.3% SAM.
Table VII: Prevalence of acute malnutrition based on the percentage of the median and/or oedema
n = 598 Prevalence of global acute malnutrition (<80% and/or oedema)
(32) 5.4 % (3.7 - 7.7)
Prevalence of moderate acute malnutrition (<80% and >= 70%, no oedema)
(30) 5.0 % (3.4 - 7.3)
Prevalence of severe acute malnutrition (<70% and/or oedema)
(2) 0.3 % (0.1 - 1.4)
Action Against Hunger (USA) Integrated SMART Survey, April 2011, Mwingi District, Kenya 17
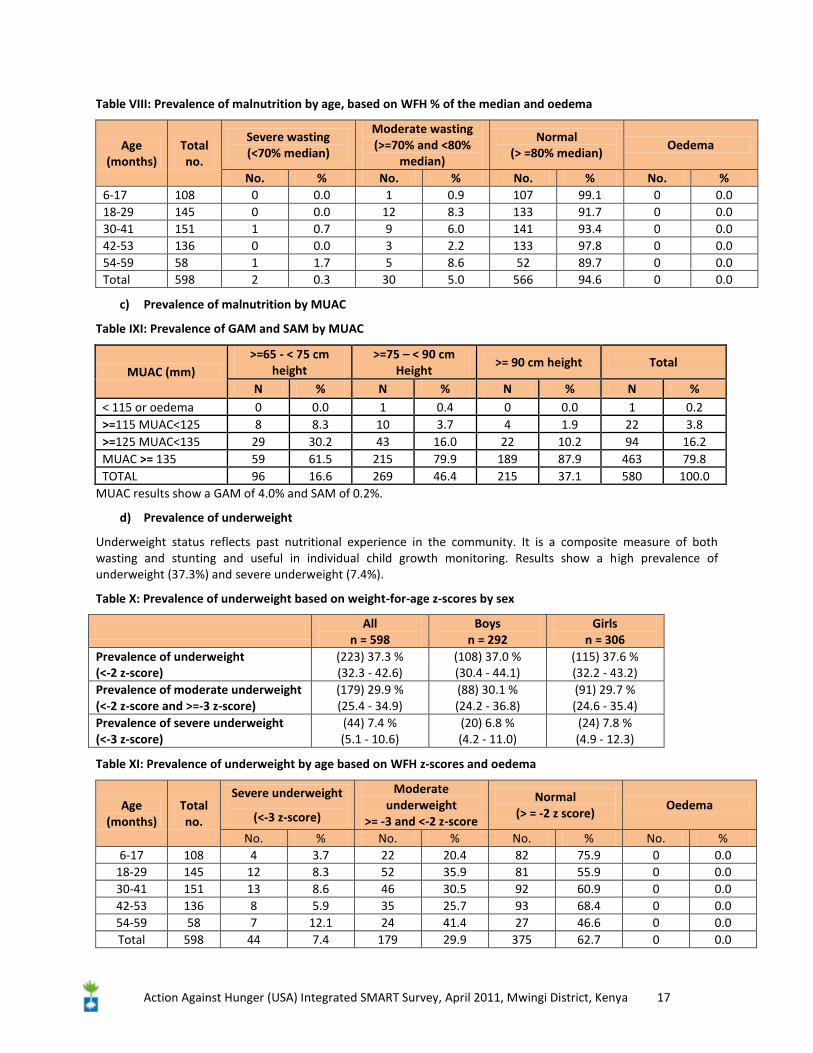
Table VIII: Prevalence of malnutrition by age, based on WFH % of the median and oedema
Age (months)
Total no.
Severe wasting (<70% median)
Moderate wasting (>=70% and <80%
median)
Normal (> =80% median)
Oedema
No. % No. % No. % No. % 6-17 108 0 0.0 1 0.9 107 99.1 0 0.0 18-29 145 0 0.0 12 8.3 133 91.7 0 0.0 30-41 151 1 0.7 9 6.0 141 93.4 0 0.0 42-53 136 0 0.0 3 2.2 133 97.8 0 0.0 54-59 58 1 1.7 5 8.6 52 89.7 0 0.0 Total 598 2 0.3 30 5.0 566 94.6 0 0.0
c) Prevalence of malnutrition by MUAC
Table IXI: Prevalence of GAM and SAM by MUAC
MUAC (mm) >=65 - < 75 cm
height >=75 – < 90 cm
Height >= 90 cm height Total
N % N % N % N % < 115 or oedema 0 0.0 1 0.4 0 0.0 1 0.2 >=115 MUAC<125 8 8.3 10 3.7 4 1.9 22 3.8 >=125 MUAC<135 29 30.2 43 16.0 22 10.2 94 16.2 MUAC >= 135 59 61.5 215 79.9 189 87.9 463 79.8 TOTAL 96 16.6 269 46.4 215 37.1 580 100.0
MUAC results show a GAM of 4.0% and SAM of 0.2%.
d) Prevalence of underweight
Underweight status reflects past nutritional experience in the community. It is a composite measure of both wasting and stunting and useful in individual child growth monitoring. Results show a high prevalence of underweight (37.3%) and severe underweight (7.4%).
Table X: Prevalence of underweight based on weight-for-age z-scores by sex
All
n = 598 Boys
n = 292 Girls
n = 306 Prevalence of underweight (<-2 z-score)
(223) 37.3 % (32.3 - 42.6)
(108) 37.0 % (30.4 - 44.1)
(115) 37.6 % (32.2 - 43.2)
Prevalence of moderate underweight (<-2 z-score and >=-3 z-score)
(179) 29.9 % (25.4 - 34.9)
(88) 30.1 % (24.2 - 36.8)
(91) 29.7 % (24.6 - 35.4)
Prevalence of severe underweight (<-3 z-score)
(44) 7.4 % (5.1 - 10.6)
(20) 6.8 % (4.2 - 11.0)
(24) 7.8 % (4.9 - 12.3)
Table XI: Prevalence of underweight by age based on WFH z-scores and oedema
Age (months)
Total no.
Severe underweight
(<-3 z-score)
Moderate underweight
>= -3 and <-2 z-score
Normal (> = -2 z score)
Oedema
No. % No. % No. % No. % 6-17 108 4 3.7 22 20.4 82 75.9 0 0.0
18-29 145 12 8.3 52 35.9 81 55.9 0 0.0 30-41 151 13 8.6 46 30.5 92 60.9 0 0.0 42-53 136 8 5.9 35 25.7 93 68.4 0 0.0 54-59 58 7 12.1 24 41.4 27 46.6 0 0.0 Total 598 44 7.4 179 29.9 375 62.7 0 0.0
Action Against Hunger (USA) Integrated SMART Survey, April 2011, Mwingi District, Kenya 18
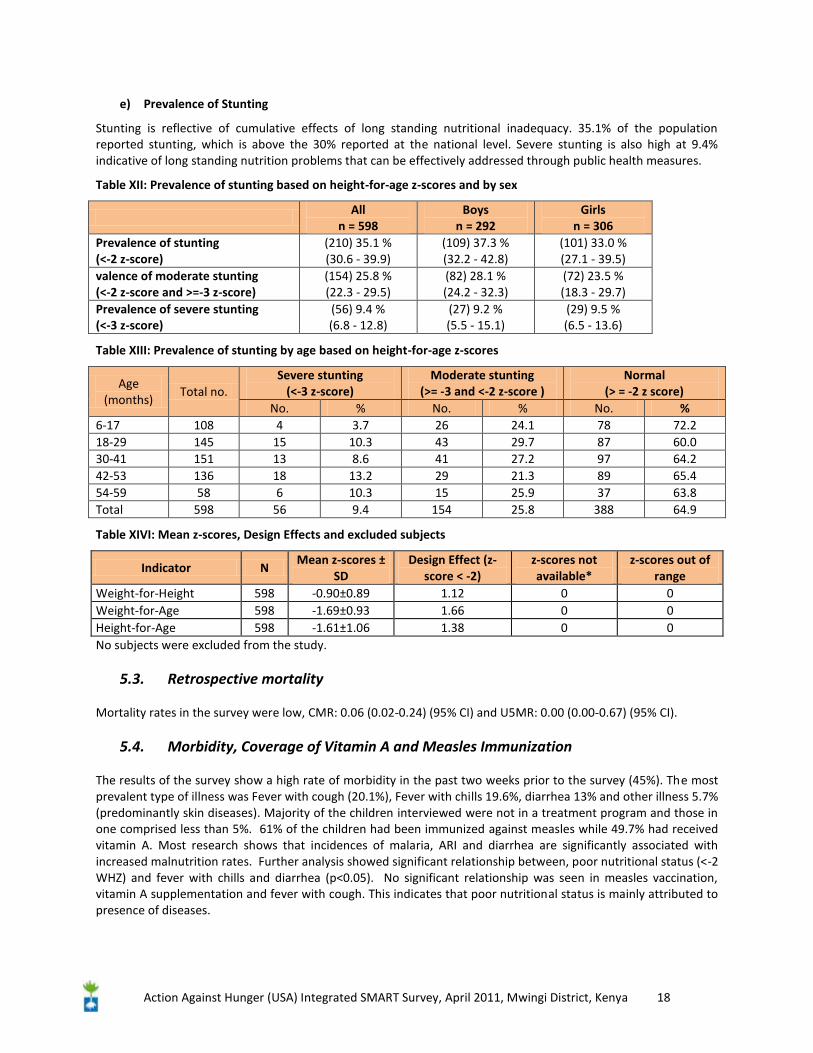
e) Prevalence of Stunting
Stunting is reflective of cumulative effects of long standing nutritional inadequacy. 35.1% of the population reported stunting, which is above the 30% reported at the national level. Severe stunting is also high at 9.4% indicative of long standing nutrition problems that can be effectively addressed through public health measures.
Table XII: Prevalence of stunting based on height-for-age z-scores and by sex
All
n = 598 Boys
n = 292 Girls
n = 306 Prevalence of stunting (<-2 z-score)
(210) 35.1 % (30.6 - 39.9)
(109) 37.3 % (32.2 - 42.8)
(101) 33.0 % (27.1 - 39.5)
valence of moderate stunting (<-2 z-score and >=-3 z-score)
(154) 25.8 % (22.3 - 29.5)
(82) 28.1 % (24.2 - 32.3)
(72) 23.5 % (18.3 - 29.7)
Prevalence of severe stunting (<-3 z-score)
(56) 9.4 % (6.8 - 12.8)
(27) 9.2 % (5.5 - 15.1)
(29) 9.5 % (6.5 - 13.6)
Table XIII: Prevalence of stunting by age based on height-for-age z-scores
Age (months)
Total no. Severe stunting
(<-3 z-score) Moderate stunting
(>= -3 and <-2 z-score ) Normal
(> = -2 z score) No. % No. % No. %
6-17 108 4 3.7 26 24.1 78 72.2 18-29 145 15 10.3 43 29.7 87 60.0 30-41 151 13 8.6 41 27.2 97 64.2 42-53 136 18 13.2 29 21.3 89 65.4 54-59 58 6 10.3 15 25.9 37 63.8 Total 598 56 9.4 154 25.8 388 64.9
Table XIVI: Mean z-scores, Design Effects and excluded subjects
Indicator N Mean z-scores ±
SD Design Effect (z-
score < -2) z-scores not available*
z-scores out of range
Weight-for-Height 598 -0.90±0.89 1.12 0 0 Weight-for-Age 598 -1.69±0.93 1.66 0 0 Height-for-Age 598 -1.61±1.06 1.38 0 0 No subjects were excluded from the study.
5.3. Retrospective mortality
Mortality rates in the survey were low, CMR: 0.06 (0.02-0.24) (95% CI) and U5MR: 0.00 (0.00-0.67) (95% CI).
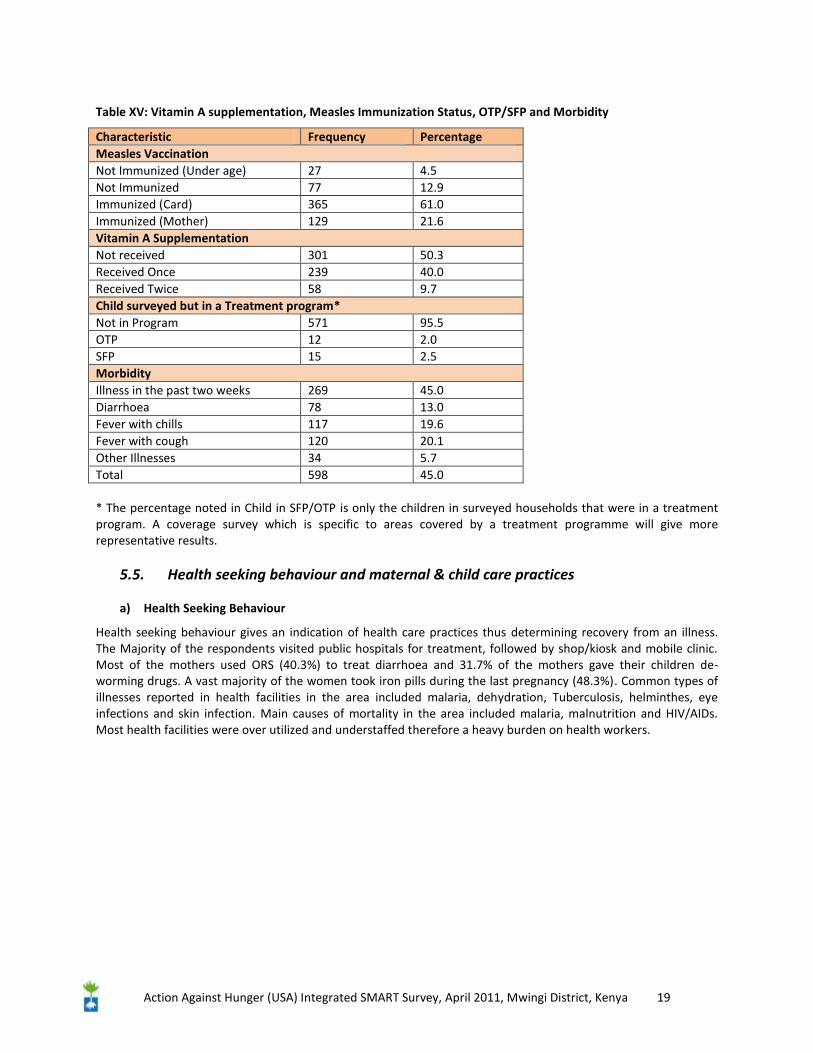
5.4. Morbidity, Coverage of Vitamin A and Measles Immunization
The results of the survey show a high rate of morbidity in the past two weeks prior to the survey (45%). The most prevalent type of illness was Fever with cough (20.1%), Fever with chills 19.6%, diarrhea 13% and other illness 5.7% (predominantly skin diseases). Majority of the children interviewed were not in a treatment program and those in one comprised less than 5%. 61% of the children had been immunized against measles while 49.7% had received vitamin A. Most research shows that incidences of malaria, ARI and diarrhea are significantly associated with increased malnutrition rates. Further analysis showed significant relationship between, poor nutritional status (<-2 WHZ) and fever with chills and diarrhea (p<0.05). No significant relationship was seen in measles vaccination, vitamin A supplementation and fever with cough. This indicates that poor nutritional status is mainly attributed to presence of diseases.
Action Against Hunger (USA) Integrated SMART Survey, April 2011, Mwingi District, Kenya 19
Table XV: Vitamin A supplementation, Measles Immunization Status, OTP/SFP and Morbidity
Characteristic Frequency Percentage Measles Vaccination Not Immunized (Under age) 27 4.5 Not Immunized 77 12.9 Immunized (Card) 365 61.0 Immunized (Mother) 129 21.6 Vitamin A Supplementation Not received 301 50.3 Received Once 239 40.0 Received Twice 58 9.7 Child surveyed but in a Treatment program* Not in Program 571 95.5 OTP 12 2.0 SFP 15 2.5 Morbidity Illness in the past two weeks 269 45.0 Diarrhoea 78 13.0 Fever with chills 117 19.6 Fever with cough 120 20.1 Other Illnesses 34 5.7 Total 598 45.0 * The percentage noted in Child in SFP/OTP is only the children in surveyed households that were in a treatment program. A coverage survey which is specific to areas covered by a treatment programme will give more representative results.
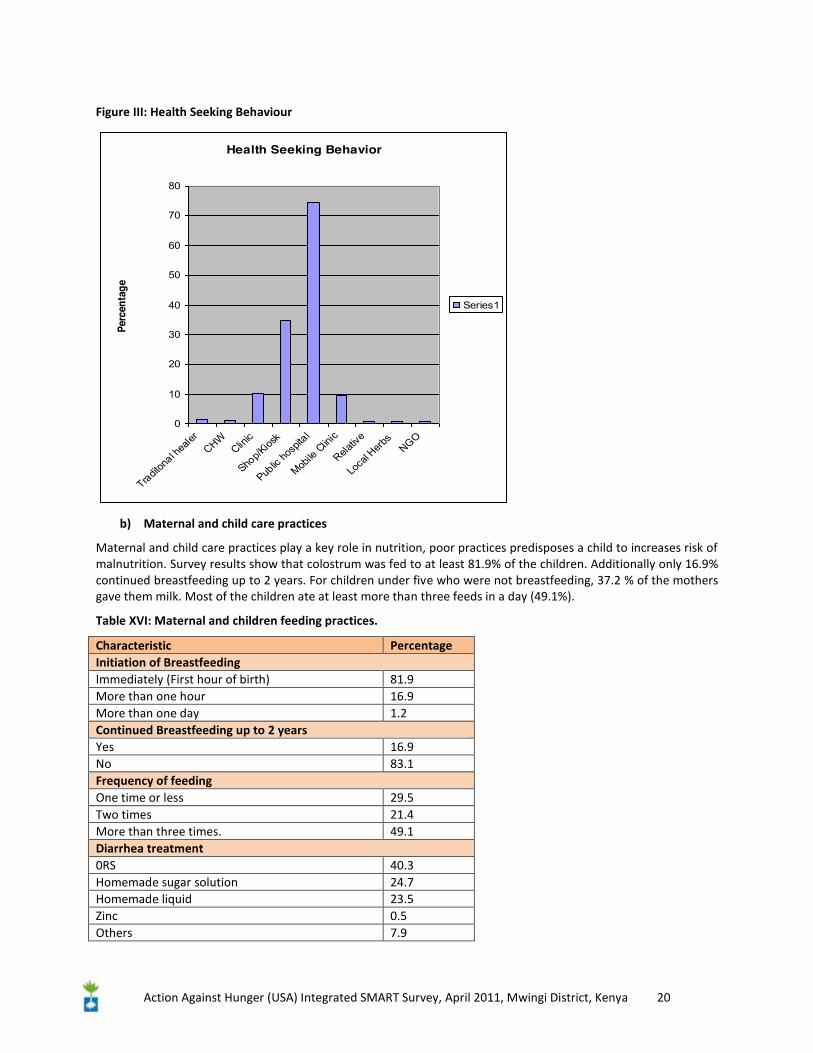
5.5. Health seeking behaviour and maternal & child care practices
a) Health Seeking Behaviour
Health seeking behaviour gives an indication of health care practices thus determining recovery from an illness. The Majority of the respondents visited public hospitals for treatment, followed by shop/kiosk and mobile clinic. Most of the mothers used ORS (40.3%) to treat diarrhoea and 31.7% of the mothers gave their children de-worming drugs. A vast majority of the women took iron pills during the last pregnancy (48.3%). Common types of illnesses reported in health facilities in the area included malaria, dehydration, Tuberculosis, helminthes, eye infections and skin infection. Main causes of mortality in the area included malaria, malnutrition and HIV/AIDs. Most health facilities were over utilized and understaffed therefore a heavy burden on health workers.
Action Against Hunger (USA) Integrated SMART Survey, April 2011, Mwingi District, Kenya 20
Figure III: Health Seeking Behaviour
Health Seeking Behavior
0
10
20
30
40
50
60
70
80
Traditon
al hea
lerCHW
Clinic
Shop/K
iosk
Public
hosp
ital
Mobile
Clin
ic
Relativ
e
Loca
l Herb
sNGO
Perc
enta
ge
Series1
b) Maternal and child care practices
Maternal and child care practices play a key role in nutrition, poor practices predisposes a child to increases risk of malnutrition. Survey results show that colostrum was fed to at least 81.9% of the children. Additionally only 16.9% continued breastfeeding up to 2 years. For children under five who were not breastfeeding, 37.2 % of the mothers gave them milk. Most of the children ate at least more than three feeds in a day (49.1%).
Table XVI: Maternal and children feeding practices.
Characteristic Percentage Initiation of Breastfeeding Immediately (First hour of birth) 81.9 More than one hour 16.9 More than one day 1.2 Continued Breastfeeding up to 2 years Yes 16.9 No 83.1 Frequency of feeding One time or less 29.5 Two times 21.4 More than three times. 49.1 Diarrhea treatment 0RS 40.3 Homemade sugar solution 24.7 Homemade liquid 23.5 Zinc 0.5 Others 7.9
Action Against Hunger (USA) Integrated SMART Survey, April 2011, Mwingi District, Kenya 21
Other Indicators Child taken drugs for Intestinal Worms 31.7 Iron pills in pregnancy 48.3 Under five not Breastfeeding receiving milk 37.2
High Impact Nutrition interventions were assessed in this survey. Literature shows most children do not get a good start in life that through exclusive breastfeeding. Majority of pregnant women and children under five are anaemic, many more suffer from Vitamin A and Zinc deficiency. Promotions of key indicators are seen to reduce under-five mortality rates3. Results here show that that most of the mothers used ORS during diarrheal treatment, 24.7% used sugar sugars solutions. 31.7% took drugs for intestinal worms and 48.3% received milk.
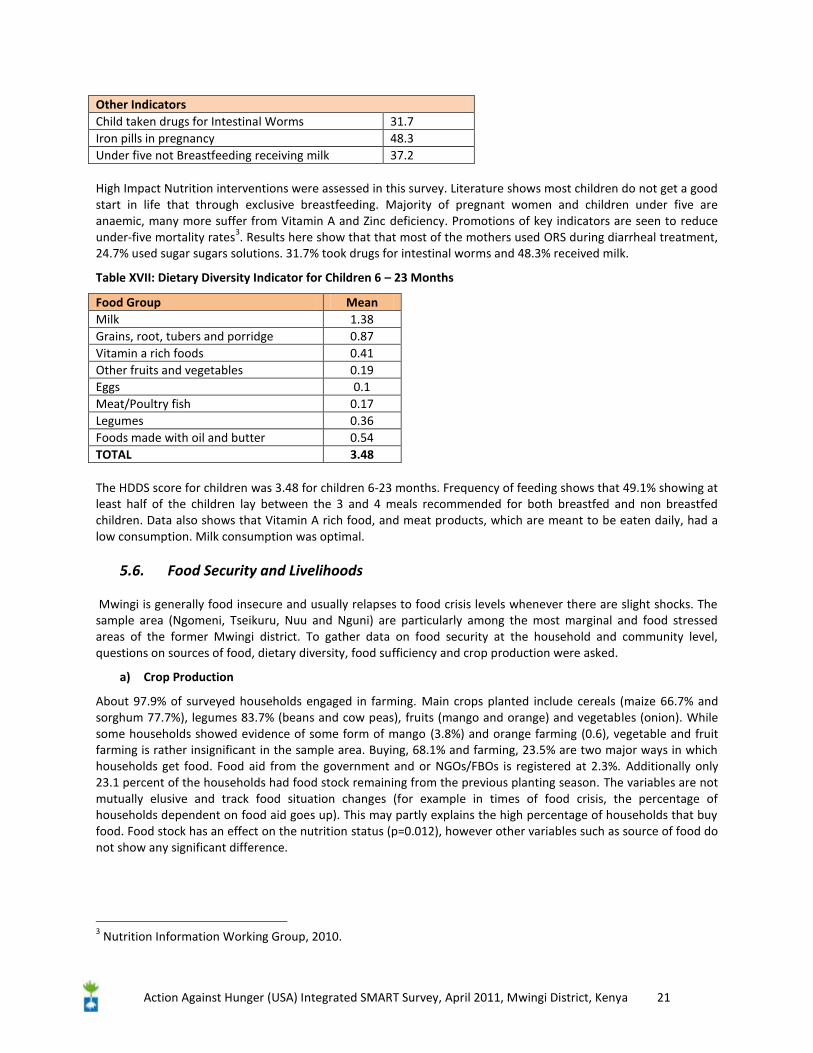
Table XVII: Dietary Diversity Indicator for Children 6 – 23 Months
Food Group Mean Milk 1.38 Grains, root, tubers and porridge 0.87 Vitamin a rich foods 0.41 Other fruits and vegetables 0.19 Eggs 0.1 Meat/Poultry fish 0.17 Legumes 0.36 Foods made with oil and butter 0.54 TOTAL 3.48 The HDDS score for children was 3.48 for children 6-23 months. Frequency of feeding shows that 49.1% showing at least half of the children lay between the 3 and 4 meals recommended for both breastfed and non breastfed children. Data also shows that Vitamin A rich food, and meat products, which are meant to be eaten daily, had a low consumption. Milk consumption was optimal.
5.6. Food Security and Livelihoods
Mwingi is generally food insecure and usually relapses to food crisis levels whenever there are slight shocks. The sample area (Ngomeni, Tseikuru, Nuu and Nguni) are particularly among the most marginal and food stressed areas of the former Mwingi district. To gather data on food security at the household and community level, questions on sources of food, dietary diversity, food sufficiency and crop production were asked.
a) Crop Production
About 97.9% of surveyed households engaged in farming. Main crops planted include cereals (maize 66.7% and sorghum 77.7%), legumes 83.7% (beans and cow peas), fruits (mango and orange) and vegetables (onion). While some households showed evidence of some form of mango (3.8%) and orange farming (0.6), vegetable and fruit farming is rather insignificant in the sample area. Buying, 68.1% and farming, 23.5% are two major ways in which households get food. Food aid from the government and or NGOs/FBOs is registered at 2.3%. Additionally only 23.1 percent of the households had food stock remaining from the previous planting season. The variables are not mutually elusive and track food situation changes (for example in times of food crisis, the percentage of households dependent on food aid goes up). This may partly explains the high percentage of households that buy food. Food stock has an effect on the nutrition status (p=0.012), however other variables such as source of food do not show any significant difference.
3 Nutrition Information Working Group, 2010.
Action Against Hunger (USA) Integrated SMART Survey, April 2011, Mwingi District, Kenya 22
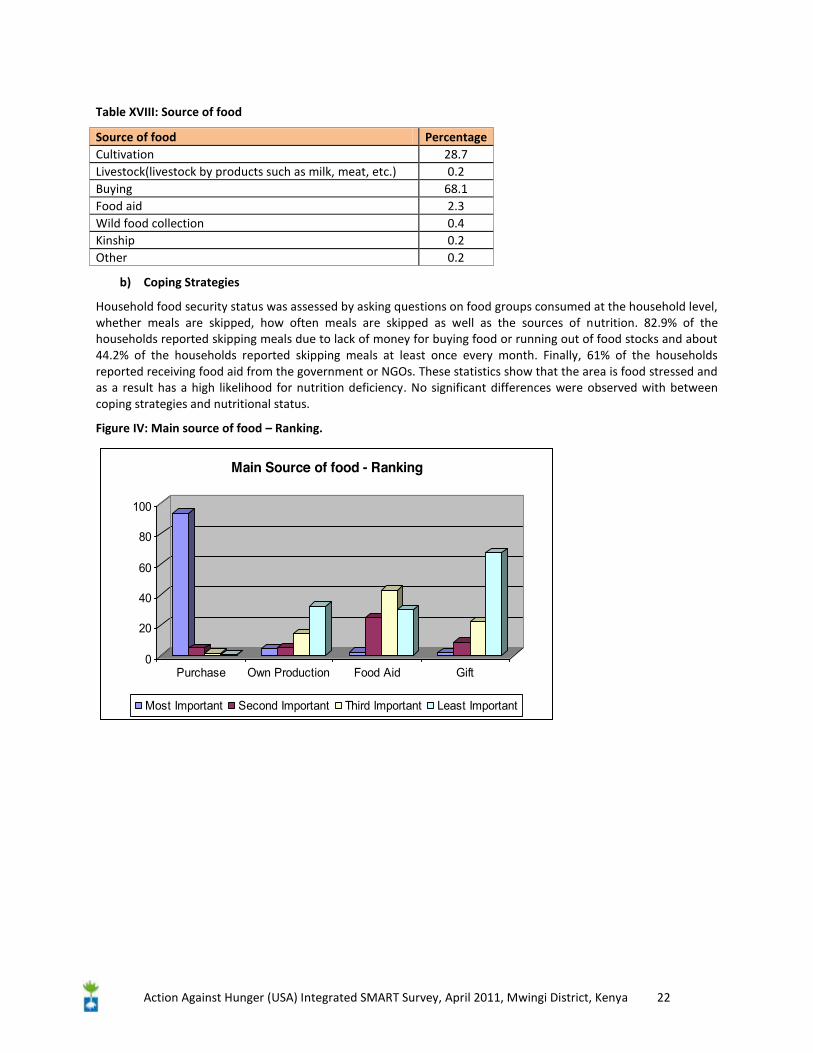
Table XVIII: Source of food
Source of food Percentage Cultivation 28.7 Livestock(livestock by products such as milk, meat, etc.) 0.2 Buying 68.1 Food aid 2.3 Wild food collection 0.4 Kinship 0.2 Other 0.2
b) Coping Strategies
Household food security status was assessed by asking questions on food groups consumed at the household level, whether meals are skipped, how often meals are skipped as well as the sources of nutrition. 82.9% of the households reported skipping meals due to lack of money for buying food or running out of food stocks and about 44.2% of the households reported skipping meals at least once every month. Finally, 61% of the households reported receiving food aid from the government or NGOs. These statistics show that the area is food stressed and as a result has a high likelihood for nutrition deficiency. No significant differences were observed with between coping strategies and nutritional status.
Figure IV: Main source of food – Ranking.
0
20
40
60
80
100
Purchase Own Production Food Aid Gift
Main Source of food - Ranking
Most Important Second Important Third Important Least Important
Action Against Hunger (USA) Integrated SMART Survey, April 2011, Mwingi District, Kenya 23
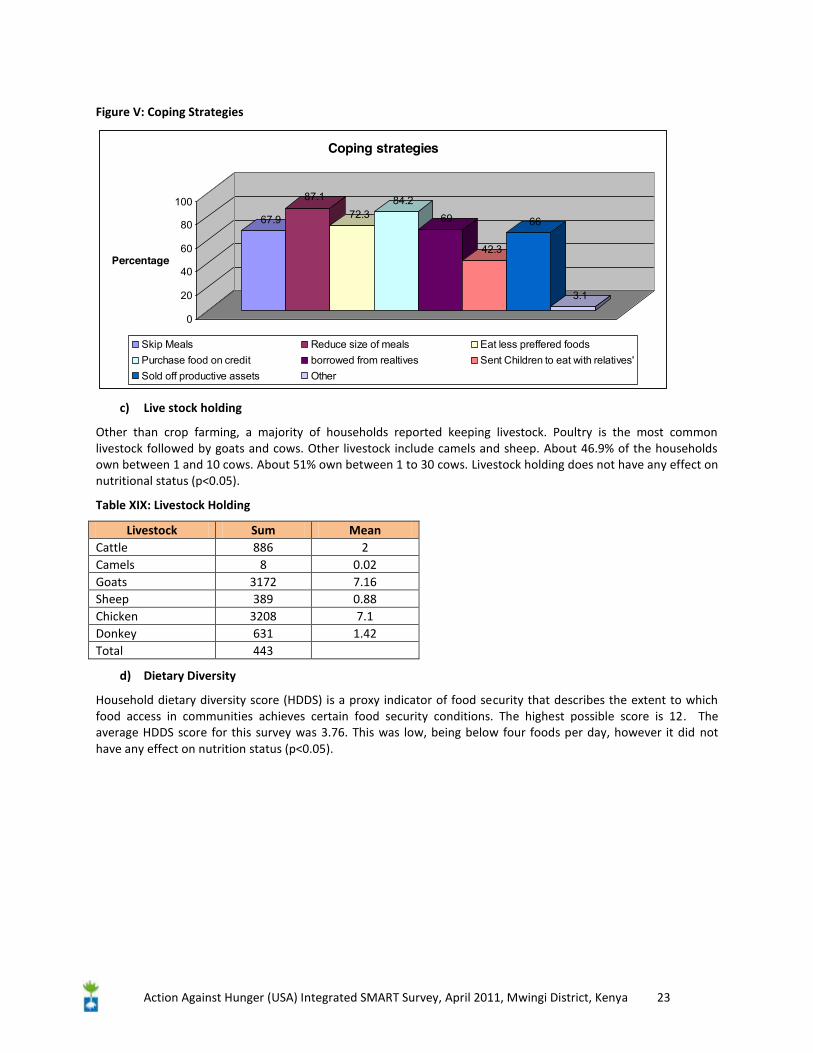
Figure V: Coping Strategies
67.9
87.1
72.384.2
69
42.3
66
3.1
0
20
40
60
80
100
Percentage
Coping strategies
Skip Meals Reduce size of meals Eat less preffered foodsPurchase food on credit borrowed from realtives Sent Children to eat with relatives'Sold off productive assets Other
c) Live stock holding
Other than crop farming, a majority of households reported keeping livestock. Poultry is the most common livestock followed by goats and cows. Other livestock include camels and sheep. About 46.9% of the households own between 1 and 10 cows. About 51% own between 1 to 30 cows. Livestock holding does not have any effect on nutritional status (p<0.05).
Table XIX: Livestock Holding
Livestock Sum Mean Cattle 886 2 Camels 8 0.02 Goats 3172 7.16 Sheep 389 0.88 Chicken 3208 7.1 Donkey 631 1.42 Total 443
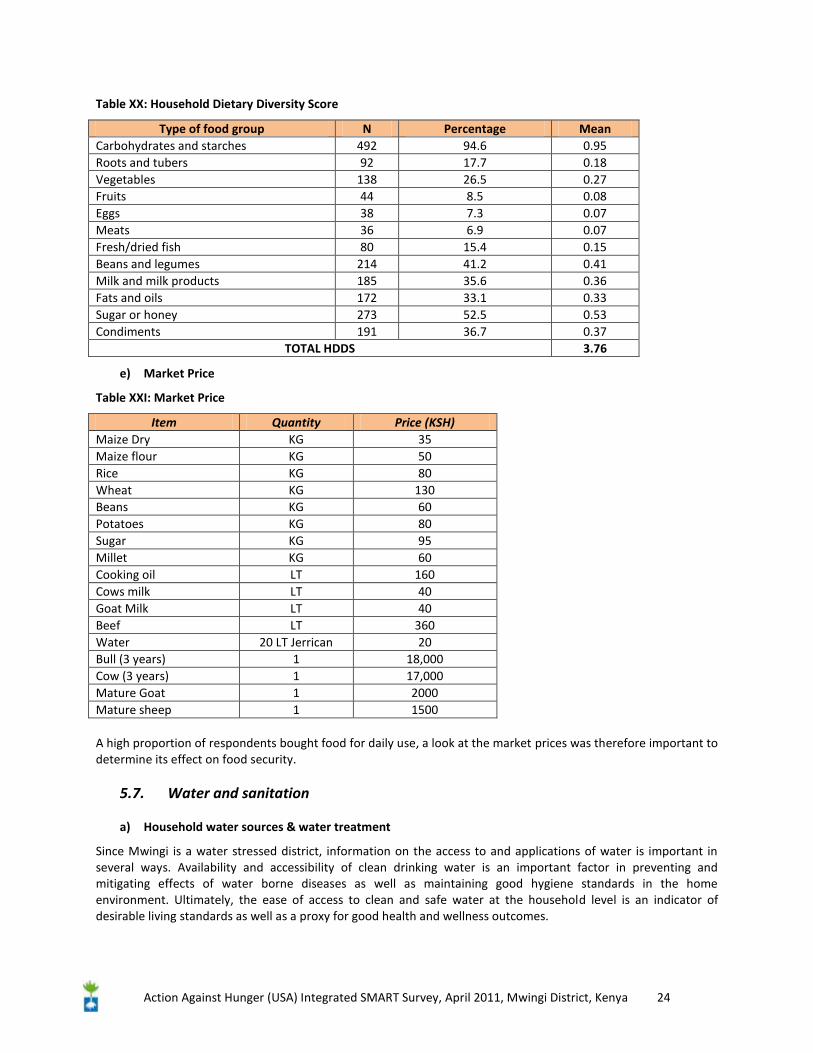
d) Dietary Diversity
Household dietary diversity score (HDDS) is a proxy indicator of food security that describes the extent to which food access in communities achieves certain food security conditions. The highest possible score is 12. The average HDDS score for this survey was 3.76. This was low, being below four foods per day, however it did not have any effect on nutrition status (p<0.05).
Action Against Hunger (USA) Integrated SMART Survey, April 2011, Mwingi District, Kenya 24
Table XX: Household Dietary Diversity Score
Type of food group N Percentage Mean Carbohydrates and starches 492 94.6 0.95 Roots and tubers 92 17.7 0.18 Vegetables 138 26.5 0.27 Fruits 44 8.5 0.08 Eggs 38 7.3 0.07 Meats 36 6.9 0.07 Fresh/dried fish 80 15.4 0.15 Beans and legumes 214 41.2 0.41 Milk and milk products 185 35.6 0.36 Fats and oils 172 33.1 0.33 Sugar or honey 273 52.5 0.53 Condiments 191 36.7 0.37
TOTAL HDDS 3.76
e) Market Price
Table XXI: Market Price
Item Quantity Price (KSH) Maize Dry KG 35 Maize flour KG 50 Rice KG 80 Wheat KG 130 Beans KG 60 Potatoes KG 80 Sugar KG 95 Millet KG 60 Cooking oil LT 160 Cows milk LT 40 Goat Milk LT 40 Beef LT 360 Water 20 LT Jerrican 20 Bull (3 years) 1 18,000 Cow (3 years) 1 17,000 Mature Goat 1 2000 Mature sheep 1 1500 A high proportion of respondents bought food for daily use, a look at the market prices was therefore important to determine its effect on food security.
5.7. Water and sanitation
a) Household water sources & water treatment
Since Mwingi is a water stressed district, information on the access to and applications of water is important in several ways. Availability and accessibility of clean drinking water is an important factor in preventing and mitigating effects of water borne diseases as well as maintaining good hygiene standards in the home environment. Ultimately, the ease of access to clean and safe water at the household level is an indicator of desirable living standards as well as a proxy for good health and wellness outcomes.
Action Against Hunger (USA) Integrated SMART Survey, April 2011, Mwingi District, Kenya 25
b) Water Source
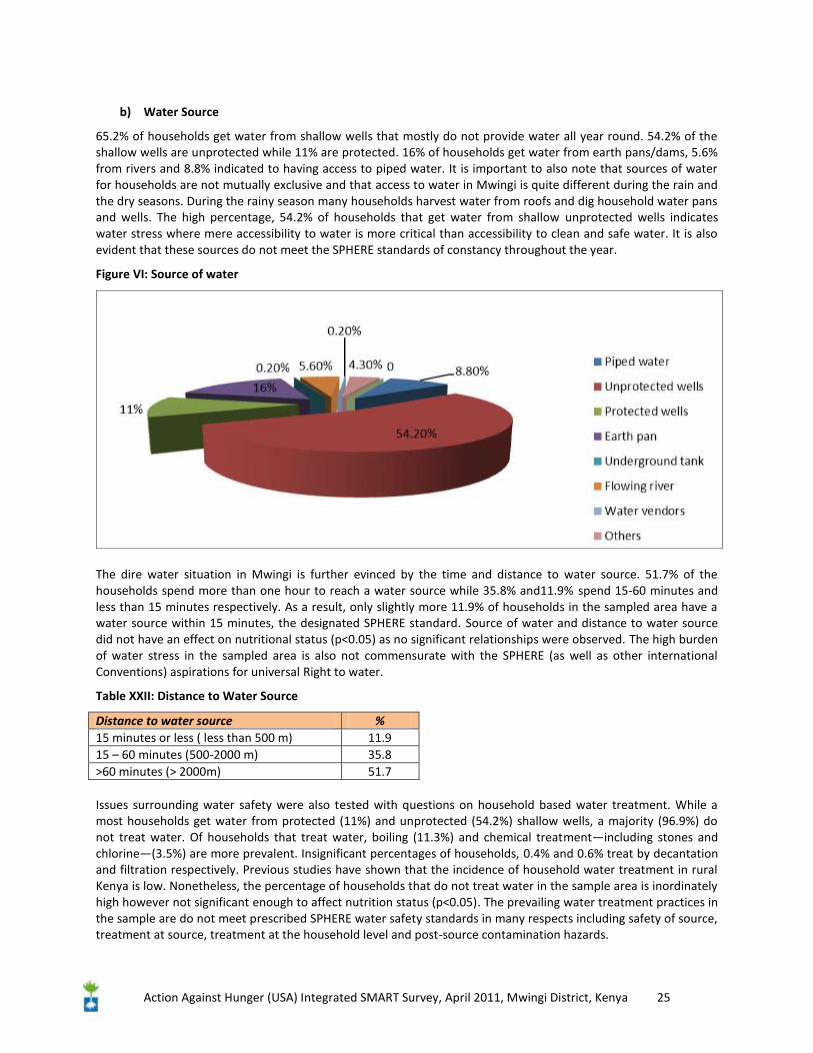
65.2% of households get water from shallow wells that mostly do not provide water all year round. 54.2% of the shallow wells are unprotected while 11% are protected. 16% of households get water from earth pans/dams, 5.6% from rivers and 8.8% indicated to having access to piped water. It is important to also note that sources of water for households are not mutually exclusive and that access to water in Mwingi is quite different during the rain and the dry seasons. During the rainy season many households harvest water from roofs and dig household water pans and wells. The high percentage, 54.2% of households that get water from shallow unprotected wells indicates water stress where mere accessibility to water is more critical than accessibility to clean and safe water. It is also evident that these sources do not meet the SPHERE standards of constancy throughout the year.
Figure VI: Source of water
The dire water situation in Mwingi is further evinced by the time and distance to water source. 51.7% of the households spend more than one hour to reach a water source while 35.8% and11.9% spend 15-60 minutes and less than 15 minutes respectively. As a result, only slightly more 11.9% of households in the sampled area have a water source within 15 minutes, the designated SPHERE standard. Source of water and distance to water source did not have an effect on nutritional status (p<0.05) as no significant relationships were observed. The high burden of water stress in the sampled area is also not commensurate with the SPHERE (as well as other international Conventions) aspirations for universal Right to water.
Table XXII: Distance to Water Source
Distance to water source % 15 minutes or less ( less than 500 m) 11.9 15 – 60 minutes (500-2000 m) 35.8 >60 minutes (> 2000m) 51.7 Issues surrounding water safety were also tested with questions on household based water treatment. While a most households get water from protected (11%) and unprotected (54.2%) shallow wells, a majority (96.9%) do not treat water. Of households that treat water, boiling (11.3%) and chemical treatment—including stones and chlorine—(3.5%) are more prevalent. Insignificant percentages of households, 0.4% and 0.6% treat by decantation and filtration respectively. Previous studies have shown that the incidence of household water treatment in rural Kenya is low. Nonetheless, the percentage of households that do not treat water in the sample area is inordinately high however not significant enough to affect nutrition status (p<0.05). The prevailing water treatment practices in the sample are do not meet prescribed SPHERE water safety standards in many respects including safety of source, treatment at source, treatment at the household level and post-source contamination hazards.
Action Against Hunger (USA) Integrated SMART Survey, April 2011, Mwingi District, Kenya 26
Table XXIII: Water treatment
Characteristic % Did not treat water 96.9 Boiling 11.3 Chemical treatment 3.5 Traditional 1.7 Decantation 0.4 Filtration 0.6
c) Hand washing practices
Hand washing is an important health factor especially in a water stressed area like Mwingi where water insufficiency maybe a major cause of poor hygiene standards. Questions on hand washing reflected SPHERE standards on when to wash hands, before handling food, before and after eating, and before and after breastfeeding. It is also healthy to wash hands after visiting the toilet. How people wash hands is also important—with just water, soap and water or disinfectants. SPHERE establishes a standard for at least a 250g soap to be available for a household with at least 5 members.
Table XXIV: Hand Washing Practices.
Hand washing practice % Does wash hands 95.4 Washes hands only when dirty 44.4 Before visiting the latrine 16 After visiting the latrine 51.7 Before cooking 37.1 Before eating 64.0 Before breastfeeding 19.4 After taking child to the toilet 9.6 After handling animal 5.2 Only 54.2% of respondents wash their hands when dirty. This question is a proxy to the constancy of washing hands as one engages with chores at the household level. 51.7% wash hands after visiting the latrine while 47.5% do not. With regard to handling food, only 37% wash hands before cooking, 64% before eating and for female respondents, only 19.4% wash hands before breastfeeding. However, a big majority, 90.4% do not wash hands after taking a child to the latrine. On whether household members use water with any other materials, soap or disinfectants, 69.6% reported just using water for hand washing. While 23.8% use soap and water regularly, 4.8% reported using soap contingent to its availability. Again, for water stressed area, this level (relatively low) of hand washing as well as the use of soap is low and may explain particular hygiene related health hazards. No significant differences were observed when comparing poor nutritional status to hand washing practices and water source.
d) Household solid waste and human waste management
Proper management (including disposal) of household solid waste and human waste is critical to a health household and community environment. Lack of proper disposal mechanisms for either solid waste or human waste can lead to accumulation of pathogens and other toxins that imperil health at the individual, household and community levels.
Table XXV: Household disposal of solid and human waste
Method of waste disposal % Bushes 67.1 Conventional pit latrines 29.4 Ventilated Improved Pit latrines 2.7
Action Against Hunger (USA) Integrated SMART Survey, April 2011, Mwingi District, Kenya 27
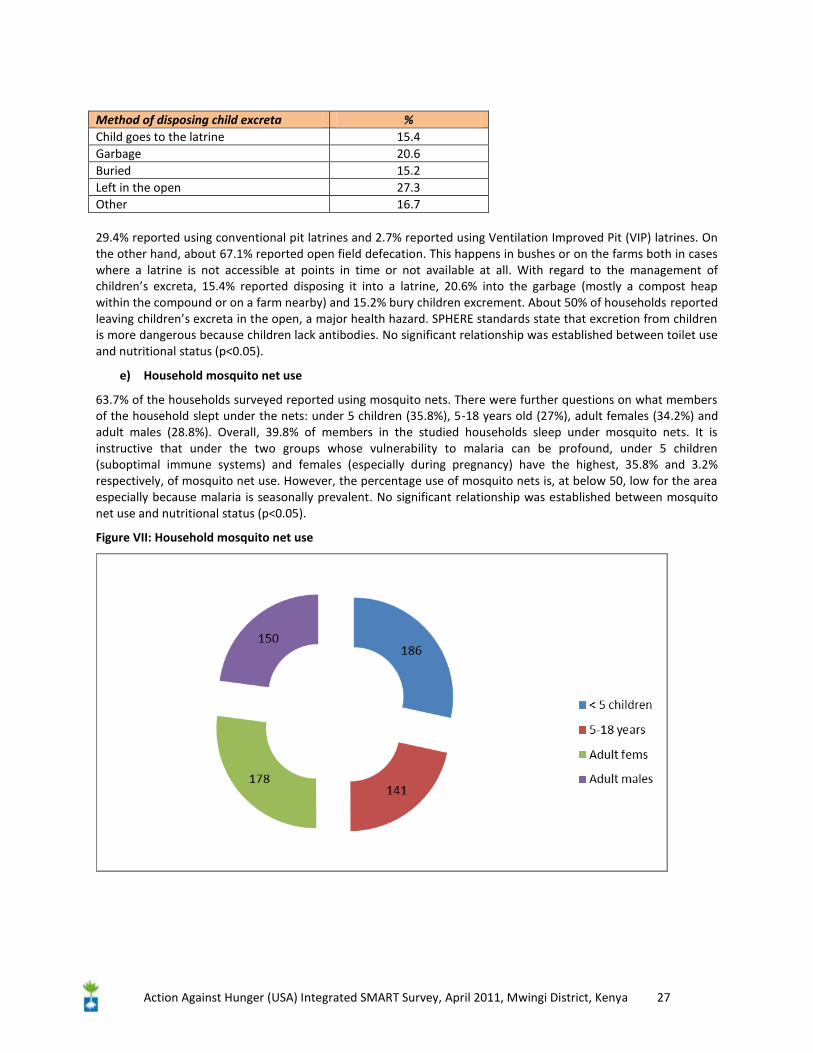
Method of disposing child excreta % Child goes to the latrine 15.4 Garbage 20.6 Buried 15.2 Left in the open 27.3 Other 16.7 29.4% reported using conventional pit latrines and 2.7% reported using Ventilation Improved Pit (VIP) latrines. On the other hand, about 67.1% reported open field defecation. This happens in bushes or on the farms both in cases where a latrine is not accessible at points in time or not available at all. With regard to the management of children’s excreta, 15.4% reported disposing it into a latrine, 20.6% into the garbage (mostly a compost heap within the compound or on a farm nearby) and 15.2% bury children excrement. About 50% of households reported leaving children’s excreta in the open, a major health hazard. SPHERE standards state that excretion from children is more dangerous because children lack antibodies. No significant relationship was established between toilet use and nutritional status (p<0.05).
e) Household mosquito net use
63.7% of the households surveyed reported using mosquito nets. There were further questions on what members of the household slept under the nets: under 5 children (35.8%), 5-18 years old (27%), adult females (34.2%) and adult males (28.8%). Overall, 39.8% of members in the studied households sleep under mosquito nets. It is instructive that under the two groups whose vulnerability to malaria can be profound, under 5 children (suboptimal immune systems) and females (especially during pregnancy) have the highest, 35.8% and 3.2% respectively, of mosquito net use. However, the percentage use of mosquito nets is, at below 50, low for the area especially because malaria is seasonally prevalent. No significant relationship was established between mosquito net use and nutritional status (p<0.05).
Figure VII: Household mosquito net use
Action Against Hunger (USA) Integrated SMART Survey, April 2011, Mwingi District, Kenya 28
6 Conclusion and Recommendations
Most of the households were predominantly male headed, of poor socio economic status with household heads having low levels of education. Nutritional status of children is seen to have deteriorated since the 2009 survey. These surveys though were done in different time periods therefore not wholly comparable. The GAM rate is 10.2% and SAM 1.5%. This is attributable to fairly prolonged unsuitable weather conditions that would have been expected to improve the nutritional situation considerably, if it were favourable. Again in 2010, food aid was scaled up due to deteriorating conditions. KFSSG projects the situation is bound to worsen should the weather conditions not improve. Admission to OTP/SFP for treatment of malnutrition is low. Significant relationships were established between nutritional status, presence of disease and presence of food stock. Other variables did not have a significant effect on nutritional status.
Small holder farming is the main source of livelihood in the region. The predominant source of food at household level was purchase. HDDS scores was less than four considered low. Further analysis shows condiments, fats and oils and sugar contributed to the score. With increasing food prices, depletion of food stock the situation is likely to deteriorate much further. Short rain assessment report shows the district is borderline food insecure with increased risk of deteriorating into acute phase. The increased GAM rate will further exacerbate the situation.
Results indicate poor access to safe water sources (piped and protected wells) as well as a high percentage not treating water before household use. Additionally majority had to travel more than an hour to the nearest water source way below SPHERE standards. More importantly few people have access to toilet facilities with 67% using open fields. Poor sanitation predisposes one to the risk of malnutrition by increasing the risk of waterborne diseases.
Generally there was a high morbidity rate in the past two weeks, focus group discussion held with health care workers confirmed this was the case in health facilities. Poor nutritional status was significantly associated with morbidity showing it had an effect. A large number of households reported having and using a mosquito net.
The following recommendations were arrived at;
Health and Nutrition
> Increased in GAM and SAM calls for scaling up of pre-existing SFP, OTP, SC centers in the district to capture all acutely malnourished children at all levels of the health system (communities, health facilities, hospitals, central ministries offices)
> Integration and continuous assessment of HINI should be entrenched in the district health care structure to prevent rising cases of malnutrition.
> Continued strengthening of appropriate IYCF practices even at household level.
> Most residents grew negligible amounts of fruits and vegetables and ate them at household level as HDDS shows. This should be encouraged through kitchen gardening and nutrition education and feasibility of small scale irrigation examined.
> There was generally a very poor consumption of animal protein, and vitamin A rich food essential in child diet. This is despite the availability of livestock in some homes. Promotion of nutrition education with emphasis on dietary diversity should be done.
Action Against Hunger (USA) Integrated SMART Survey, April 2011, Mwingi District, Kenya 29
Water and Sanitation
> The results and past reports show that there is paucity of water in the surveyed areas in terms of distance and water quality. A need to support construction and provision of large water containers to ease water storage and reduce amount of time used to fetch water.
> Even though hand washing practices showed a high percentage, this cannot be translated to actual practice. Health education targeting proper sanitation practices, simple water treatment, proper hand washing considering its contribution to water borne diseases such as diarrhoea.
> Poor disposal of human waste will undoubtedly contribute to spread of communicable diseases such as diarrhoea. Increasing latrine coverage in Mwingi, educate residents on proper use would contribute to improved hygiene and health and ultimately to improved nutritional status.
Food Security/Livelihoods
> The results indicate that the most important source of livelihood is farm and farm products. Additionally it shows that a very small percentage of the still has food stock from the previous planting season. The data also shows that buying food is common. Reports also indicate an increase in market prices further exacerbating the situation. If the current conditions prevail it is expected to be worse in the coming months.
> Contingency measures to respond to the expected food security deterioration situation including up-scaling of food aid distribution in more vulnerable areas.
> Initiating, encouraging and supporting income-generating activities especially because most people were low income earner and a large percentage depended purchase most of the foods.
> Diversification to more drought tolerant crops like sorghum, millet may help alleviate the situation.
> Potential of irrigation should be examined to facilitate fruits and vegetables cultivation and remove dependency on rain fed agriculture. Results show very few households grew these foods.
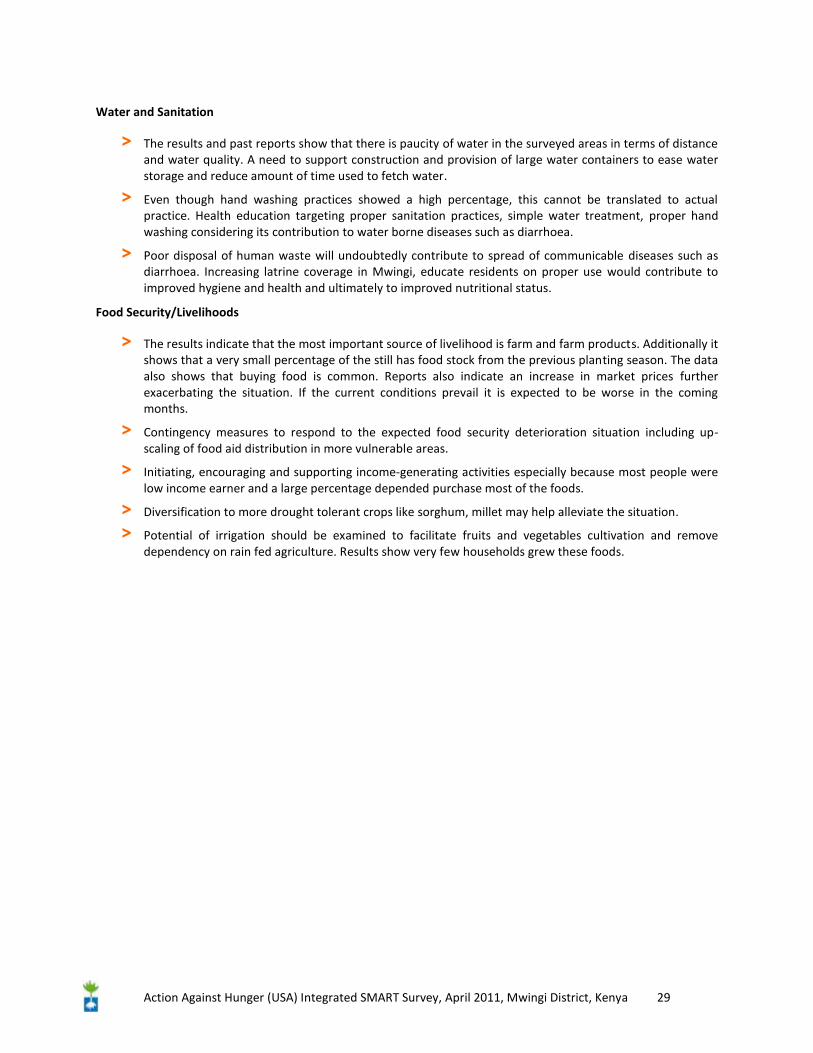
Annex 1: SMART Survey Anthropometric Form (April 2011) 6-59 months old children
1. Identification Data Collector___________________ Team Leader_______________ 1.1 Larger District 1.2 Division 1.3 Location 1.4 Sub-location 1.5 Cluster No 1.6 Team Number 1.7 Date
Chil
d no.
HH no.
Sex (F/M
)
Age in Month
s
Weight
##.# kg
Height
###.# cm
Weigh-for-
height %
Oedema
(Y/N)
MUAC
##.# cm
Measles Vaccination 0= Not immunized 1= Card 2= Mothers verification
In the last one
year how
many times
received
Vitamin A
Child in any Nutrition center? 0= No 1= OTP 2= SFP
In the past two weeks did the child suffer from any sickness? 0=No 1= Yes
If yes, which sicknesses
Diarrhea
0= No 1= Yes
Fever with chills like
malaria
0= No 1= Yes
Fever, cough,
difficult breathin
g 0= No 1= Yes
Other (specify
)
0= No 1= Yes
1
2
3
4
5
6
7
8
9
10
11
12
13
14
15
Action Against Hunger (USA) Integrated SMART Survey, April 2011, Mwingi District, Kenya 31
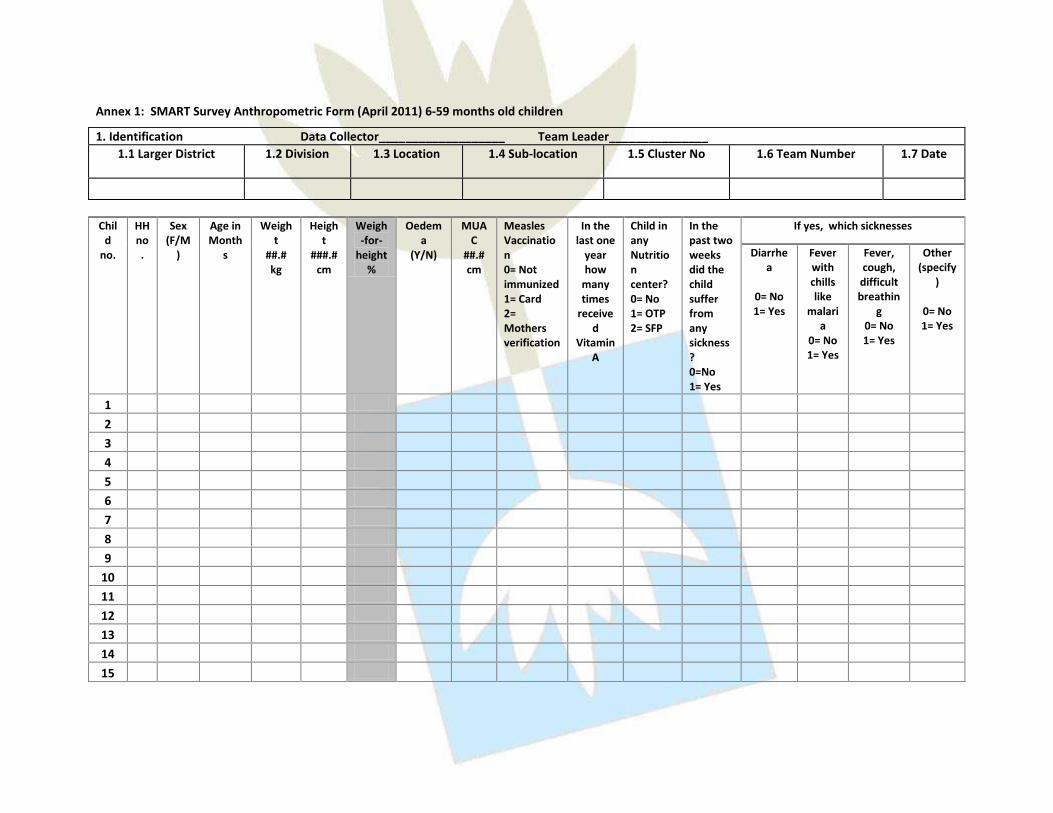
Annex II: Calendar of Events
MONTH Seasons 2006 2007 2008 2009 2010 2011
JANUARY (Mwai wa Mbee)
51 39 27 15 3 Harvest, New year celebrations, Schools opening
FEBRUARY (Mwai wa keli)
50 38 26 14 2 Valentine day, harvest
MARCH (Mwai wa Katatu)
49 37 25 13 1 Move to water points preparation of farmlands.
APRIL (Mwai wa Kana)
48 36 24 12
Short rains
MAY (Mwai wa Katano)
59 47 35 23 11
Labour day, Short rains
JUNE (Mwai wa Thanthatu)
58 46 34 22 10
Madaraka day, harvesting
JULY (Mwai wa Muonza)
57 45 33 21 9
AUGUST (Mwai wa Nyanya)
56 44 32 20 8
Boys circumcision
SEPTEMBER (Mwai wa Keenda)
55 43 31 19 7 Preparation of farm lands
OCTOBER (Mwai wa Ikumi)
54 42 30 18 6 Moi day, Kenyatta day celebrations, Planting and long rains
NOVEMBER (Mwai wa Ikumi na Umwe)
53 41 29 17 5
KCPE, KCSE exams, Long rains
DECEMBER (Mwai wa Ikumi na Ili)
52 40 28 16 4
Celebrate Christmas. Long rains
Action Against Hunger (USA) Integrated SMART Survey, April 2011, Mwingi District, Kenya 32
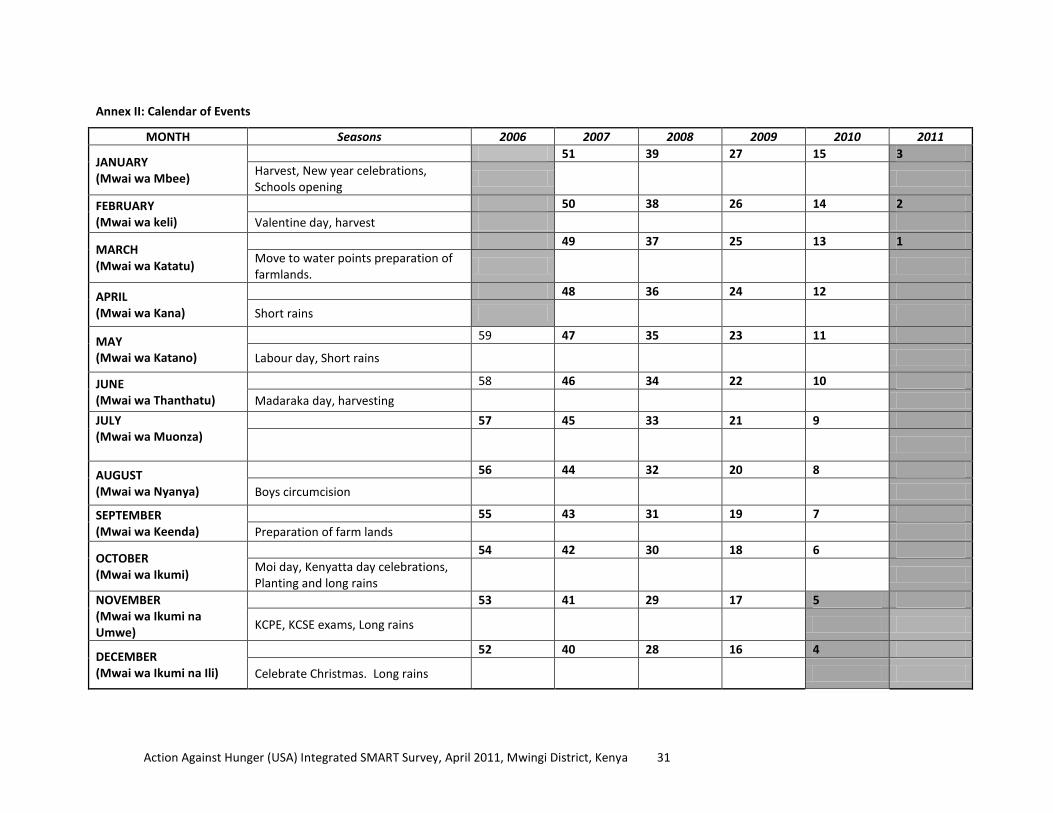
Annex III: Cluster Mortality Questionnaire
Division: _________________________________ Location: _________________________________ Sub location: _________________________ Date: _________________ Cluster number: _____________Team number: _______
HH Current HH
member
Current HH members who
arrived during recall (exclude births)
Past HH members who left during recall (exclude deaths)
Births during recall
Deaths during recall
Total < 5 Total <5 Total < 5 Total < 5 1 2 3 4 5 6 7 8 9 10 11 12 13 14 15 16 17 18 19 20 21 22 23 24 25 26 27 28 29 30 31 32 Total
Action Against Hunger (USA) Integrated SMART Survey, April 2011, Mwingi District, Kenya 33
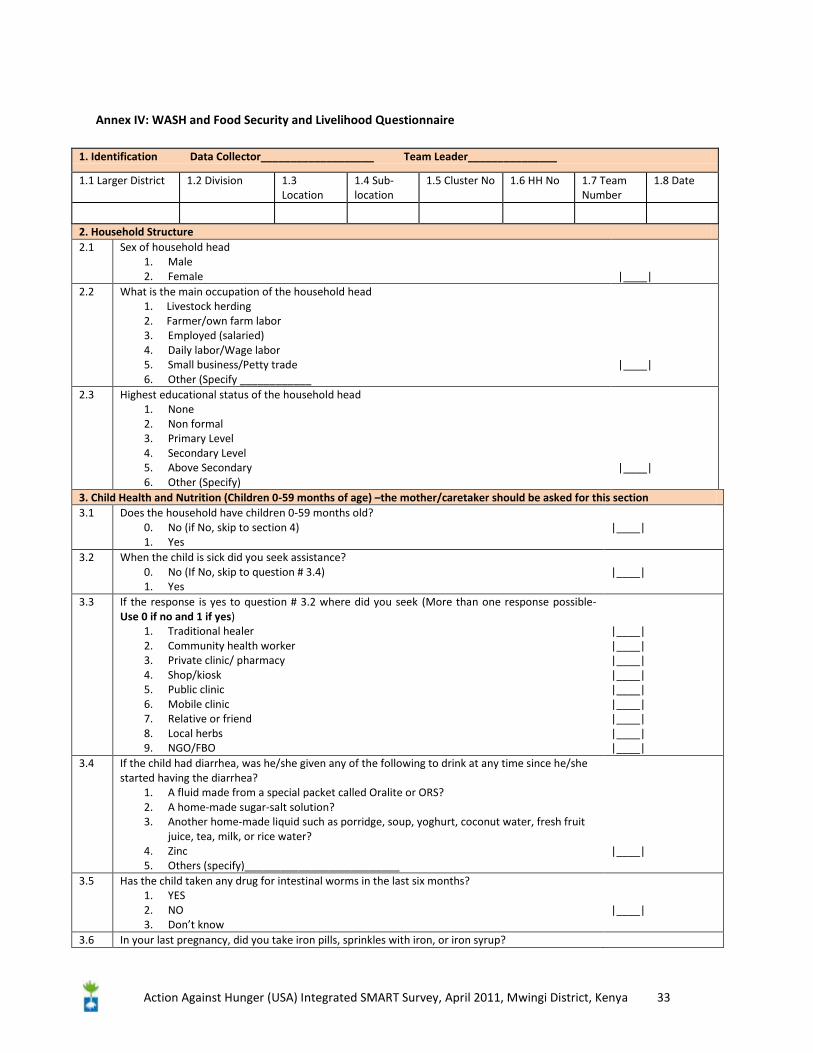
Annex IV: WASH and Food Security and Livelihood Questionnaire
1. Identification Data Collector___________________ Team Leader_______________
1.1 Larger District 1.2 Division 1.3 Location
1.4 Sub-location
1.5 Cluster No 1.6 HH No 1.7 Team Number
1.8 Date
2. Household Structure 2.1 Sex of household head
1. Male 2. Female
|____|
2.2 What is the main occupation of the household head 1. Livestock herding 2. Farmer/own farm labor 3. Employed (salaried) 4. Daily labor/Wage labor 5. Small business/Petty trade 6. Other (Specify ____________
|____|
2.3 Highest educational status of the household head 1. None 2. Non formal 3. Primary Level 4. Secondary Level 5. Above Secondary 6. Other (Specify)
|____|
3. Child Health and Nutrition (Children 0-59 months of age) –the mother/caretaker should be asked for this section 3.1 Does the household have children 0-59 months old?
0. No (if No, skip to section 4) 1. Yes
|____|
3.2 When the child is sick did you seek assistance? 0. No (If No, skip to question # 3.4) 1. Yes
|____|
3.3 If the response is yes to question # 3.2 where did you seek (More than one response possible- Use 0 if no and 1 if yes)
1. Traditional healer 2. Community health worker 3. Private clinic/ pharmacy 4. Shop/kiosk 5. Public clinic 6. Mobile clinic 7. Relative or friend 8. Local herbs 9. NGO/FBO
|____| |____| |____| |____| |____| |____| |____| |____| |____|
3.4 If the child had diarrhea, was he/she given any of the following to drink at any time since he/she started having the diarrhea?
1. A fluid made from a special packet called Oralite or ORS? 2. A home-made sugar-salt solution? 3. Another home-made liquid such as porridge, soup, yoghurt, coconut water, fresh fruit
juice, tea, milk, or rice water? 4. Zinc 5. Others (specify)__________________________
|____|
3.5 Has the child taken any drug for intestinal worms in the last six months? 1. YES 2. NO 3. Don’t know
|____|
3.6 In your last pregnancy, did you take iron pills, sprinkles with iron, or iron syrup?
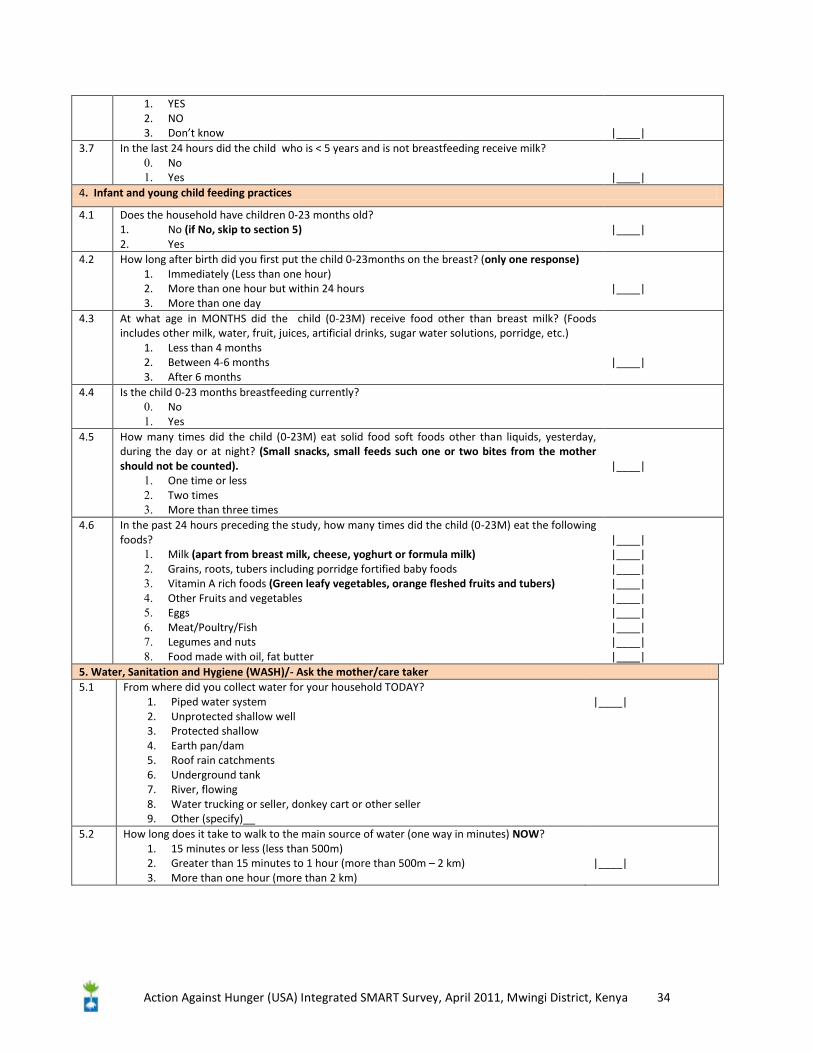
Action Against Hunger (USA) Integrated SMART Survey, April 2011, Mwingi District, Kenya 34
1. YES 2. NO 3. Don’t know
|____|
3.7 In the last 24 hours did the child who is < 5 years and is not breastfeeding receive milk? 0. No 1. Yes
|____|
4. Infant and young child feeding practices
4.1 Does the household have children 0-23 months old? 1. No (if No, skip to section 5) 2. Yes
|____|
4.2 How long after birth did you first put the child 0-23months on the breast? (only one response) 1. Immediately (Less than one hour) 2. More than one hour but within 24 hours 3. More than one day
|____|
4.3 At what age in MONTHS did the child (0-23M) receive food other than breast milk? (Foods includes other milk, water, fruit, juices, artificial drinks, sugar water solutions, porridge, etc.)
1. Less than 4 months 2. Between 4-6 months 3. After 6 months
|____|
4.4 Is the child 0-23 months breastfeeding currently? 0. No 1. Yes
4.5 How many times did the child (0-23M) eat solid food soft foods other than liquids, yesterday, during the day or at night? (Small snacks, small feeds such one or two bites from the mother should not be counted).
1. One time or less 2. Two times 3. More than three times
|____|
4.6 In the past 24 hours preceding the study, how many times did the child (0-23M) eat the following foods?
1. Milk (apart from breast milk, cheese, yoghurt or formula milk) 2. Grains, roots, tubers including porridge fortified baby foods 3. Vitamin A rich foods (Green leafy vegetables, orange fleshed fruits and tubers) 4. Other Fruits and vegetables 5. Eggs 6. Meat/Poultry/Fish 7. Legumes and nuts 8. Food made with oil, fat butter
|____| |____| |____| |____| |____| |____| |____| |____| |____|
5. Water, Sanitation and Hygiene (WASH)/- Ask the mother/care taker 5.1 From where did you collect water for your household TODAY?
1. Piped water system 2. Unprotected shallow well 3. Protected shallow 4. Earth pan/dam 5. Roof rain catchments 6. Underground tank 7. River, flowing 8. Water trucking or seller, donkey cart or other seller 9. Other (specify)__
|____|
5.2 How long does it take to walk to the main source of water (one way in minutes) NOW? 1. 15 minutes or less (less than 500m) 2. Greater than 15 minutes to 1 hour (more than 500m – 2 km) 3. More than one hour (more than 2 km)
|____|
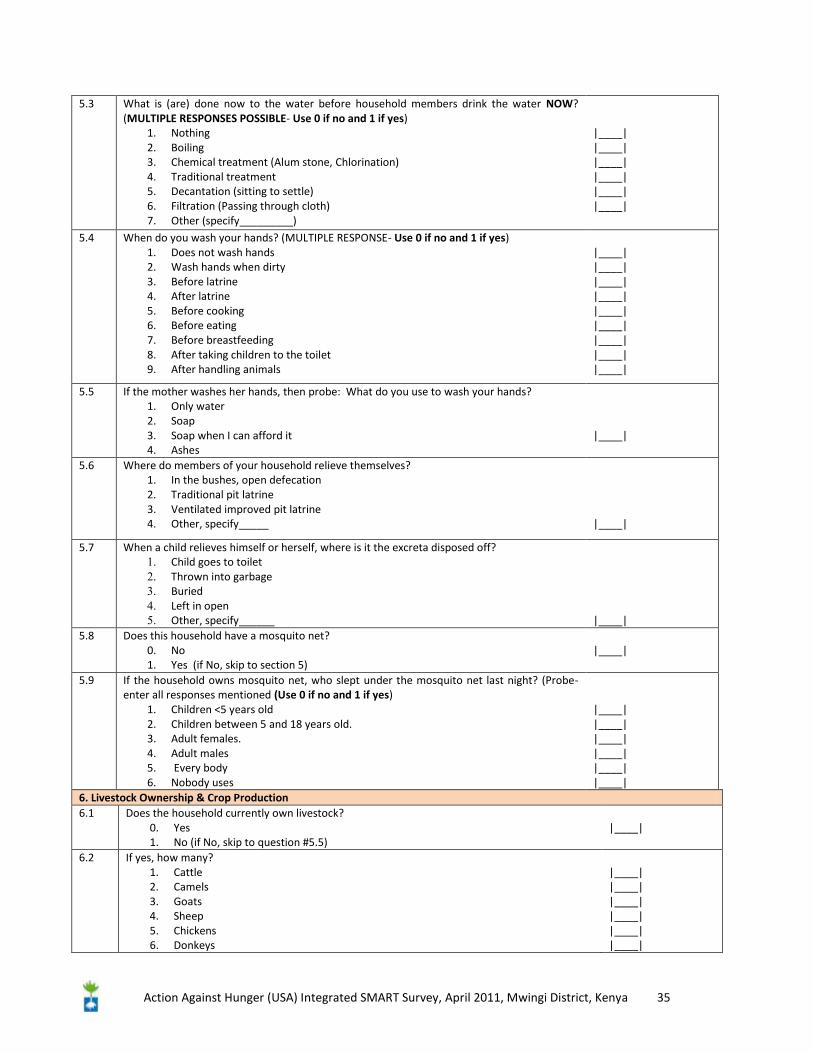
Action Against Hunger (USA) Integrated SMART Survey, April 2011, Mwingi District, Kenya 35
5.3 What is (are) done now to the water before household members drink the water NOW? (MULTIPLE RESPONSES POSSIBLE- Use 0 if no and 1 if yes)
1. Nothing 2. Boiling 3. Chemical treatment (Alum stone, Chlorination) 4. Traditional treatment 5. Decantation (sitting to settle) 6. Filtration (Passing through cloth) 7. Other (specify_________)
|____| |____| |____| |____| |____| |____|
5.4 When do you wash your hands? (MULTIPLE RESPONSE- Use 0 if no and 1 if yes) 1. Does not wash hands 2. Wash hands when dirty 3. Before latrine 4. After latrine 5. Before cooking 6. Before eating 7. Before breastfeeding 8. After taking children to the toilet 9. After handling animals
|____| |____| |____| |____| |____| |____| |____| |____| |____|
5.5 If the mother washes her hands, then probe: What do you use to wash your hands? 1. Only water 2. Soap 3. Soap when I can afford it 4. Ashes
|____|
5.6 Where do members of your household relieve themselves? 1. In the bushes, open defecation 2. Traditional pit latrine 3. Ventilated improved pit latrine 4. Other, specify_____
|____|
5.7 When a child relieves himself or herself, where is it the excreta disposed off? 1. Child goes to toilet 2. Thrown into garbage 3. Buried 4. Left in open 5. Other, specify______
|____|
5.8 Does this household have a mosquito net? 0. No 1. Yes (if No, skip to section 5)
|____|
5.9 If the household owns mosquito net, who slept under the mosquito net last night? (Probe-enter all responses mentioned (Use 0 if no and 1 if yes)
1. Children <5 years old 2. Children between 5 and 18 years old. 3. Adult females. 4. Adult males 5. Every body 6. Nobody uses
|____| |____| |____| |____| |____| |____|
6. Livestock Ownership & Crop Production 6.1 Does the household currently own livestock?
0. Yes 1. No (if No, skip to question #5.5)
|____|
6.2 If yes, how many? 1. Cattle 2. Camels 3. Goats 4. Sheep 5. Chickens 6. Donkeys
|____| |____| |____| |____| |____| |____|
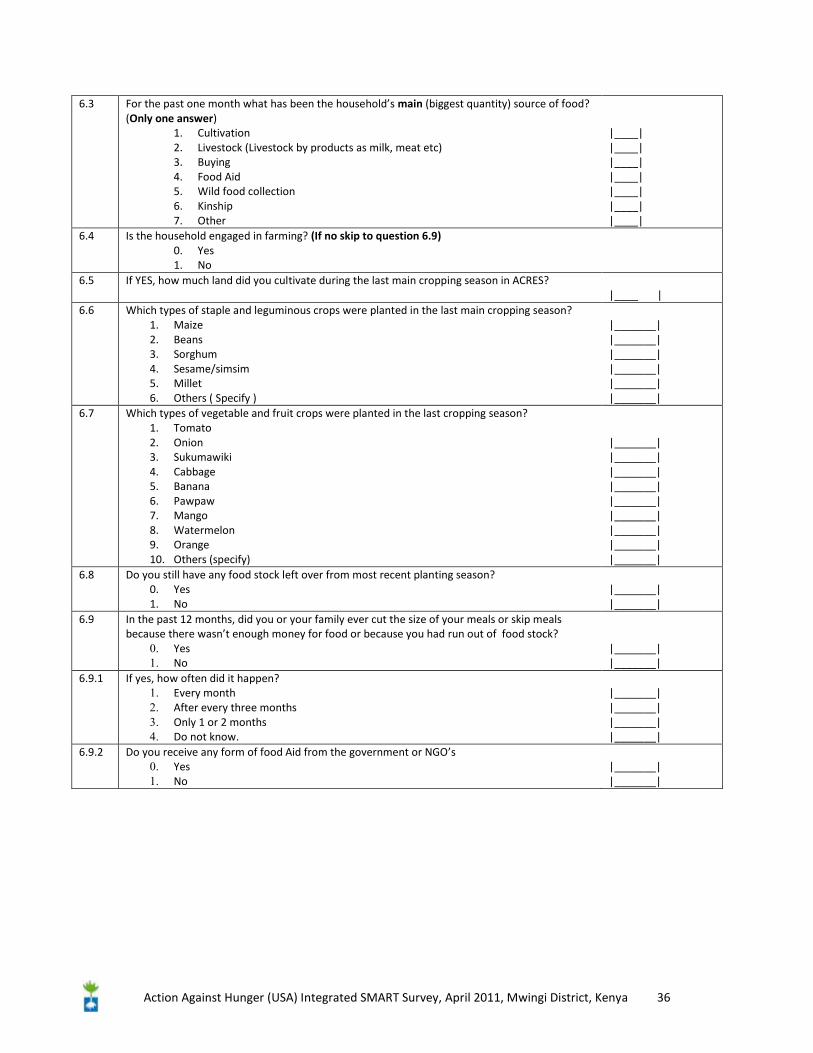
Action Against Hunger (USA) Integrated SMART Survey, April 2011, Mwingi District, Kenya 36
6.3 For the past one month what has been the household’s main (biggest quantity) source of food? (Only one answer)
1. Cultivation 2. Livestock (Livestock by products as milk, meat etc) 3. Buying 4. Food Aid 5. Wild food collection 6. Kinship 7. Other
|____| |____| |____| |____| |____| |____| |____|
6.4 Is the household engaged in farming? (If no skip to question 6.9) 0. Yes 1. No
6.5 If YES, how much land did you cultivate during the last main cropping season in ACRES? |____ |
6.6 Which types of staple and leguminous crops were planted in the last main cropping season? 1. Maize 2. Beans 3. Sorghum 4. Sesame/simsim 5. Millet 6. Others ( Specify )
|_______| |_______| |_______| |_______| |_______| |_______|
6.7 Which types of vegetable and fruit crops were planted in the last cropping season? 1. Tomato 2. Onion 3. Sukumawiki 4. Cabbage 5. Banana 6. Pawpaw 7. Mango 8. Watermelon 9. Orange 10. Others (specify)
|_______| |_______| |_______| |_______| |_______| |_______| |_______| |_______| |_______|
6.8 Do you still have any food stock left over from most recent planting season? 0. Yes 1. No
|_______| |_______|
6.9 In the past 12 months, did you or your family ever cut the size of your meals or skip meals because there wasn’t enough money for food or because you had run out of food stock?
0. Yes 1. No
|_______| |_______|
6.9.1 If yes, how often did it happen? 1. Every month 2. After every three months 3. Only 1 or 2 months 4. Do not know.
|_______| |_______| |_______| |_______|
6.9.2 Do you receive any form of food Aid from the government or NGO’s 0. Yes 1. No
|_______| |_______|
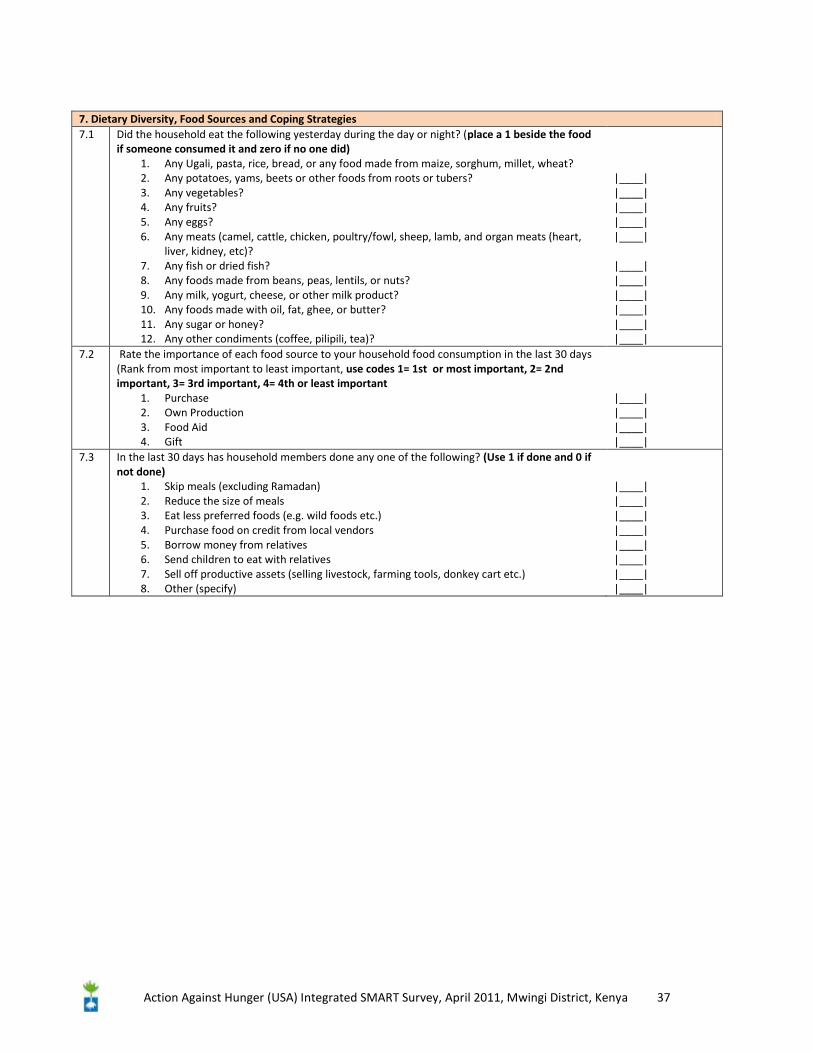
Action Against Hunger (USA) Integrated SMART Survey, April 2011, Mwingi District, Kenya 37
7. Dietary Diversity, Food Sources and Coping Strategies 7.1 Did the household eat the following yesterday during the day or night? (place a 1 beside the food
if someone consumed it and zero if no one did) 1. Any Ugali, pasta, rice, bread, or any food made from maize, sorghum, millet, wheat? 2. Any potatoes, yams, beets or other foods from roots or tubers? 3. Any vegetables? 4. Any fruits? 5. Any eggs? 6. Any meats (camel, cattle, chicken, poultry/fowl, sheep, lamb, and organ meats (heart,
liver, kidney, etc)? 7. Any fish or dried fish? 8. Any foods made from beans, peas, lentils, or nuts? 9. Any milk, yogurt, cheese, or other milk product? 10. Any foods made with oil, fat, ghee, or butter? 11. Any sugar or honey? 12. Any other condiments (coffee, pilipili, tea)?
|____| |____| |____| |____| |____| |____| |____| |____| |____| |____| |____|
7.2 Rate the importance of each food source to your household food consumption in the last 30 days (Rank from most important to least important, use codes 1= 1st or most important, 2= 2nd important, 3= 3rd important, 4= 4th or least important
1. Purchase 2. Own Production 3. Food Aid 4. Gift
|____| |____| |____| |____|
7.3 In the last 30 days has household members done any one of the following? (Use 1 if done and 0 if not done)
1. Skip meals (excluding Ramadan) 2. Reduce the size of meals 3. Eat less preferred foods (e.g. wild foods etc.) 4. Purchase food on credit from local vendors 5. Borrow money from relatives 6. Send children to eat with relatives 7. Sell off productive assets (selling livestock, farming tools, donkey cart etc.) 8. Other (specify)
|____| |____| |____| |____| |____| |____| |____| |____|
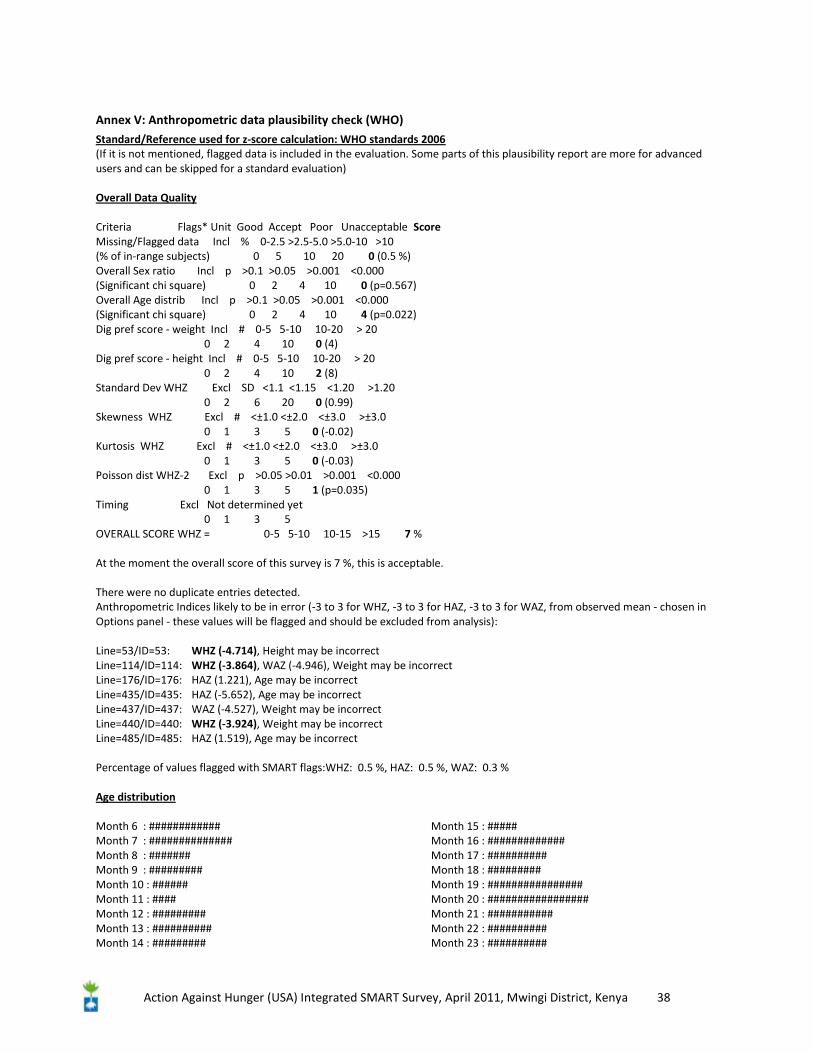
Action Against Hunger (USA) Integrated SMART Survey, April 2011, Mwingi District, Kenya 38
Annex V: Anthropometric data plausibility check (WHO)
Standard/Reference used for z-score calculation: WHO standards 2006 (If it is not mentioned, flagged data is included in the evaluation. Some parts of this plausibility report are more for advanced users and can be skipped for a standard evaluation) Overall Data Quality Criteria Flags* Unit Good Accept Poor Unacceptable Score Missing/Flagged data Incl % 0-2.5 >2.5-5.0 >5.0-10 >10 (% of in-range subjects) 0 5 10 20 0 (0.5 %) Overall Sex ratio Incl p >0.1 >0.05 >0.001 <0.000 (Significant chi square) 0 2 4 10 0 (p=0.567) Overall Age distrib Incl p >0.1 >0.05 >0.001 <0.000 (Significant chi square) 0 2 4 10 4 (p=0.022) Dig pref score - weight Incl # 0-5 5-10 10-20 > 20 0 2 4 10 0 (4) Dig pref score - height Incl # 0-5 5-10 10-20 > 20 0 2 4 10 2 (8) Standard Dev WHZ Excl SD <1.1 <1.15 <1.20 >1.20 0 2 6 20 0 (0.99) Skewness WHZ Excl # <±1.0 <±2.0 <±3.0 >±3.0 0 1 3 5 0 (-0.02) Kurtosis WHZ Excl # <±1.0 <±2.0 <±3.0 >±3.0 0 1 3 5 0 (-0.03) Poisson dist WHZ-2 Excl p >0.05 >0.01 >0.001 <0.000 0 1 3 5 1 (p=0.035) Timing Excl Not determined yet 0 1 3 5 OVERALL SCORE WHZ = 0-5 5-10 10-15 >15 7 % At the moment the overall score of this survey is 7 %, this is acceptable. There were no duplicate entries detected. Anthropometric Indices likely to be in error (-3 to 3 for WHZ, -3 to 3 for HAZ, -3 to 3 for WAZ, from observed mean - chosen in Options panel - these values will be flagged and should be excluded from analysis): Line=53/ID=53: WHZ (-4.714), Height may be incorrect Line=114/ID=114: WHZ (-3.864), WAZ (-4.946), Weight may be incorrect Line=176/ID=176: HAZ (1.221), Age may be incorrect Line=435/ID=435: HAZ (-5.652), Age may be incorrect Line=437/ID=437: WAZ (-4.527), Weight may be incorrect Line=440/ID=440: WHZ (-3.924), Weight may be incorrect Line=485/ID=485: HAZ (1.519), Age may be incorrect Percentage of values flagged with SMART flags:WHZ: 0.5 %, HAZ: 0.5 %, WAZ: 0.3 % Age distribution Month 6 : ############ Month 7 : ############## Month 8 : ####### Month 9 : ######### Month 10 : ###### Month 11 : #### Month 12 : ######### Month 13 : ########## Month 14 : #########
Month 15 : ##### Month 16 : ############# Month 17 : ########## Month 18 : ######### Month 19 : ################ Month 20 : ################# Month 21 : ########### Month 22 : ########## Month 23 : ##########
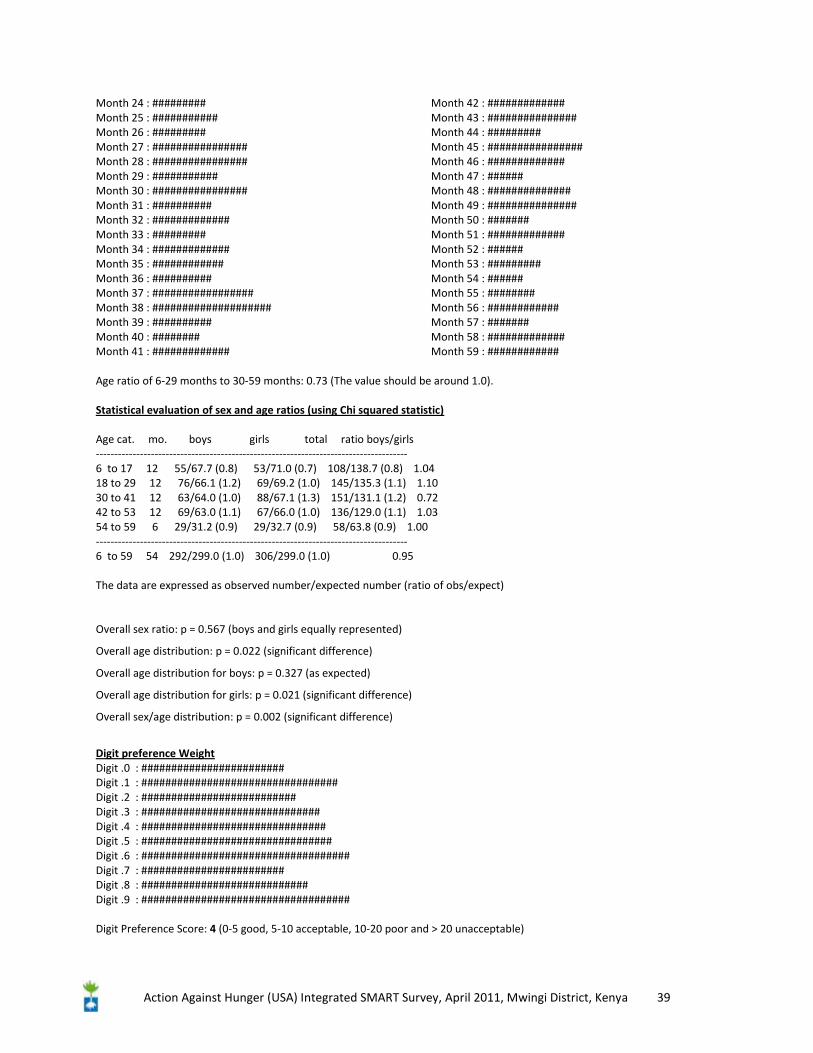
Action Against Hunger (USA) Integrated SMART Survey, April 2011, Mwingi District, Kenya 39
Month 24 : ######### Month 25 : ########### Month 26 : ######### Month 27 : ################ Month 28 : ################ Month 29 : ########### Month 30 : ################ Month 31 : ########## Month 32 : ############# Month 33 : ######### Month 34 : ############# Month 35 : ############ Month 36 : ########## Month 37 : ################# Month 38 : #################### Month 39 : ########## Month 40 : ######## Month 41 : #############
Month 42 : ############# Month 43 : ############### Month 44 : ######### Month 45 : ################ Month 46 : ############# Month 47 : ###### Month 48 : ############## Month 49 : ############### Month 50 : ####### Month 51 : ############# Month 52 : ###### Month 53 : ######### Month 54 : ###### Month 55 : ######## Month 56 : ############ Month 57 : ####### Month 58 : ############# Month 59 : ############
Age ratio of 6-29 months to 30-59 months: 0.73 (The value should be around 1.0). Statistical evaluation of sex and age ratios (using Chi squared statistic) Age cat. mo. boys girls total ratio boys/girls ------------------------------------------------------------------------------------- 6 to 17 12 55/67.7 (0.8) 53/71.0 (0.7) 108/138.7 (0.8) 1.04 18 to 29 12 76/66.1 (1.2) 69/69.2 (1.0) 145/135.3 (1.1) 1.10 30 to 41 12 63/64.0 (1.0) 88/67.1 (1.3) 151/131.1 (1.2) 0.72 42 to 53 12 69/63.0 (1.1) 67/66.0 (1.0) 136/129.0 (1.1) 1.03 54 to 59 6 29/31.2 (0.9) 29/32.7 (0.9) 58/63.8 (0.9) 1.00 ------------------------------------------------------------------------------------- 6 to 59 54 292/299.0 (1.0) 306/299.0 (1.0) 0.95 The data are expressed as observed number/expected number (ratio of obs/expect)
Overall sex ratio: p = 0.567 (boys and girls equally represented)
Overall age distribution: p = 0.022 (significant difference)
Overall age distribution for boys: p = 0.327 (as expected)
Overall age distribution for girls: p = 0.021 (significant difference)
Overall sex/age distribution: p = 0.002 (significant difference)
Digit preference Weight Digit .0 : ######################## Digit .1 : ################################# Digit .2 : ########################## Digit .3 : ############################## Digit .4 : ############################### Digit .5 : ################################ Digit .6 : ################################### Digit .7 : ######################## Digit .8 : ############################ Digit .9 : ################################### Digit Preference Score: 4 (0-5 good, 5-10 acceptable, 10-20 poor and > 20 unacceptable)
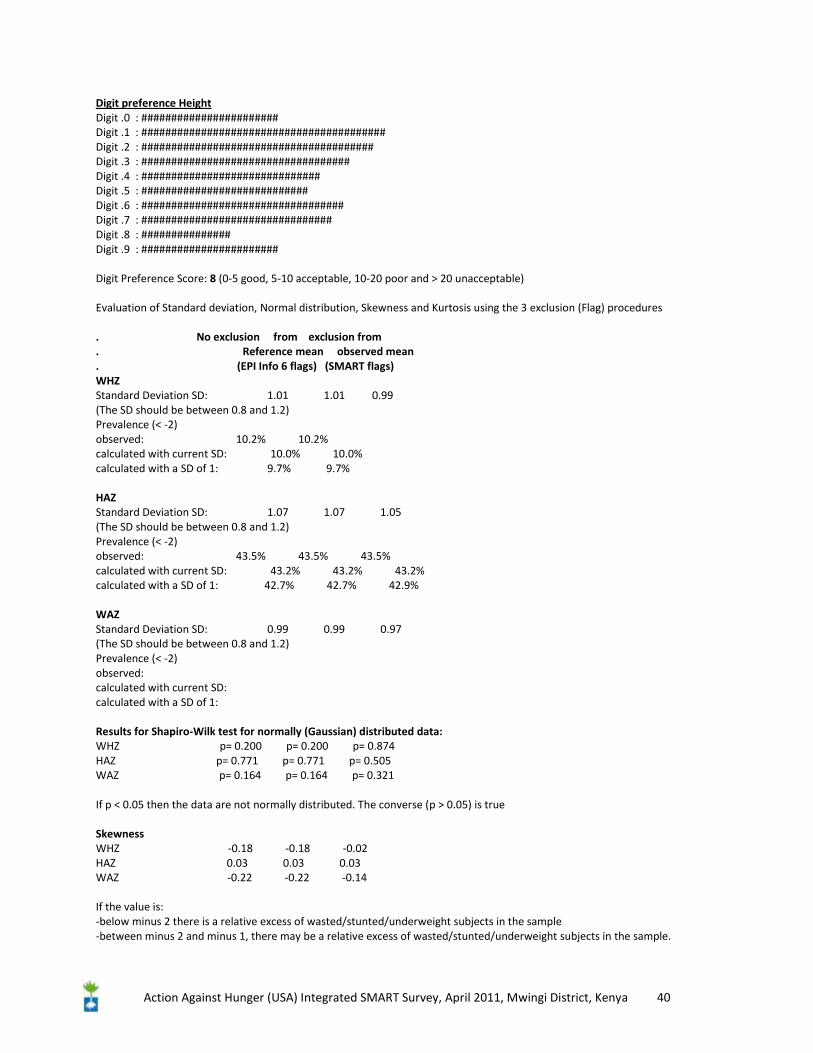
Action Against Hunger (USA) Integrated SMART Survey, April 2011, Mwingi District, Kenya 40
Digit preference Height Digit .0 : ####################### Digit .1 : ######################################### Digit .2 : ####################################### Digit .3 : ################################### Digit .4 : ############################## Digit .5 : ############################ Digit .6 : ################################## Digit .7 : ################################ Digit .8 : ############### Digit .9 : ####################### Digit Preference Score: 8 (0-5 good, 5-10 acceptable, 10-20 poor and > 20 unacceptable) Evaluation of Standard deviation, Normal distribution, Skewness and Kurtosis using the 3 exclusion (Flag) procedures . No exclusion from exclusion from . Reference mean observed mean . (EPI Info 6 flags) (SMART flags) WHZ Standard Deviation SD: 1.01 1.01 0.99 (The SD should be between 0.8 and 1.2) Prevalence (< -2) observed: 10.2% 10.2% calculated with current SD: 10.0% 10.0% calculated with a SD of 1: 9.7% 9.7% HAZ Standard Deviation SD: 1.07 1.07 1.05 (The SD should be between 0.8 and 1.2) Prevalence (< -2) observed: 43.5% 43.5% 43.5% calculated with current SD: 43.2% 43.2% 43.2% calculated with a SD of 1: 42.7% 42.7% 42.9% WAZ Standard Deviation SD: 0.99 0.99 0.97 (The SD should be between 0.8 and 1.2) Prevalence (< -2) observed: calculated with current SD: calculated with a SD of 1: Results for Shapiro-Wilk test for normally (Gaussian) distributed data: WHZ p= 0.200 p= 0.200 p= 0.874 HAZ p= 0.771 p= 0.771 p= 0.505 WAZ p= 0.164 p= 0.164 p= 0.321 If p < 0.05 then the data are not normally distributed. The converse (p > 0.05) is true Skewness WHZ -0.18 -0.18 -0.02 HAZ 0.03 0.03 0.03 WAZ -0.22 -0.22 -0.14 If the value is: -below minus 2 there is a relative excess of wasted/stunted/underweight subjects in the sample -between minus 2 and minus 1, there may be a relative excess of wasted/stunted/underweight subjects in the sample.
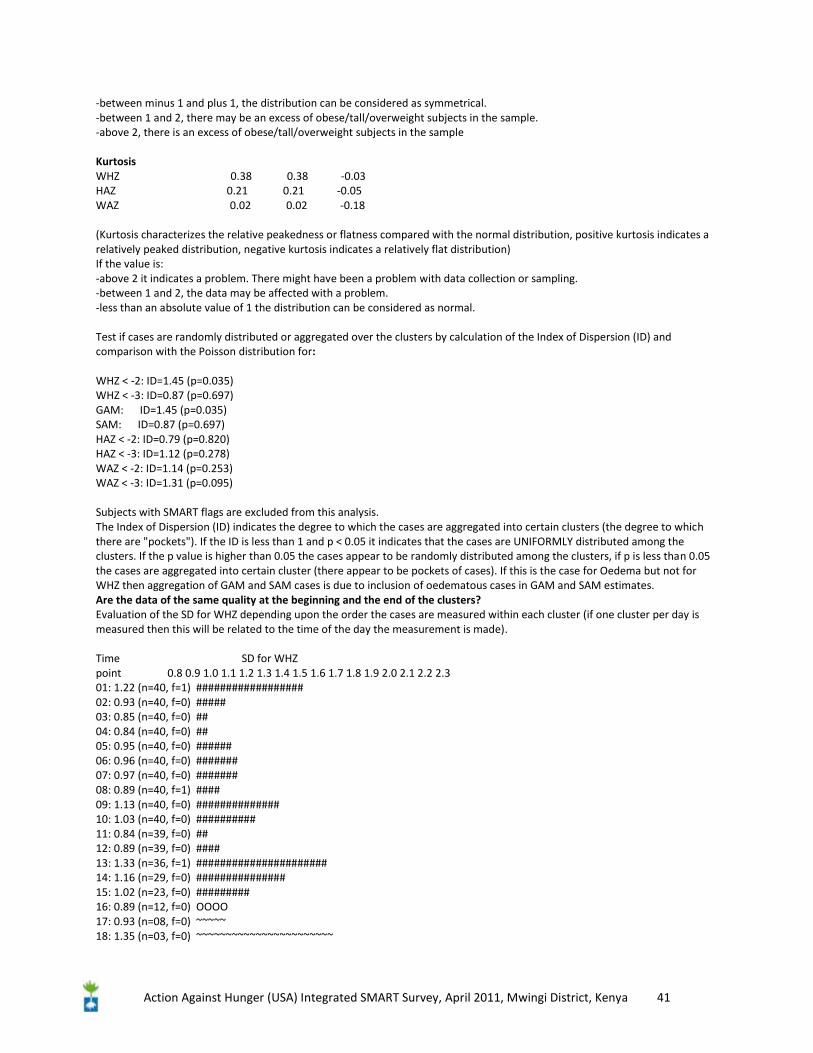
Action Against Hunger (USA) Integrated SMART Survey, April 2011, Mwingi District, Kenya 41
-between minus 1 and plus 1, the distribution can be considered as symmetrical. -between 1 and 2, there may be an excess of obese/tall/overweight subjects in the sample. -above 2, there is an excess of obese/tall/overweight subjects in the sample Kurtosis WHZ 0.38 0.38 -0.03 HAZ 0.21 0.21 -0.05 WAZ 0.02 0.02 -0.18 (Kurtosis characterizes the relative peakedness or flatness compared with the normal distribution, positive kurtosis indicates a relatively peaked distribution, negative kurtosis indicates a relatively flat distribution) If the value is: -above 2 it indicates a problem. There might have been a problem with data collection or sampling. -between 1 and 2, the data may be affected with a problem. -less than an absolute value of 1 the distribution can be considered as normal. Test if cases are randomly distributed or aggregated over the clusters by calculation of the Index of Dispersion (ID) and comparison with the Poisson distribution for: WHZ < -2: ID=1.45 (p=0.035) WHZ < -3: ID=0.87 (p=0.697) GAM: ID=1.45 (p=0.035) SAM: ID=0.87 (p=0.697) HAZ < -2: ID=0.79 (p=0.820) HAZ < -3: ID=1.12 (p=0.278) WAZ < -2: ID=1.14 (p=0.253) WAZ < -3: ID=1.31 (p=0.095) Subjects with SMART flags are excluded from this analysis. The Index of Dispersion (ID) indicates the degree to which the cases are aggregated into certain clusters (the degree to which there are "pockets"). If the ID is less than 1 and p < 0.05 it indicates that the cases are UNIFORMLY distributed among the clusters. If the p value is higher than 0.05 the cases appear to be randomly distributed among the clusters, if p is less than 0.05 the cases are aggregated into certain cluster (there appear to be pockets of cases). If this is the case for Oedema but not for WHZ then aggregation of GAM and SAM cases is due to inclusion of oedematous cases in GAM and SAM estimates. Are the data of the same quality at the beginning and the end of the clusters? Evaluation of the SD for WHZ depending upon the order the cases are measured within each cluster (if one cluster per day is measured then this will be related to the time of the day the measurement is made). Time SD for WHZ point 0.8 0.9 1.0 1.1 1.2 1.3 1.4 1.5 1.6 1.7 1.8 1.9 2.0 2.1 2.2 2.3 01: 1.22 (n=40, f=1) ################## 02: 0.93 (n=40, f=0) ##### 03: 0.85 (n=40, f=0) ## 04: 0.84 (n=40, f=0) ## 05: 0.95 (n=40, f=0) ###### 06: 0.96 (n=40, f=0) ####### 07: 0.97 (n=40, f=0) ####### 08: 0.89 (n=40, f=1) #### 09: 1.13 (n=40, f=0) ############## 10: 1.03 (n=40, f=0) ########## 11: 0.84 (n=39, f=0) ## 12: 0.89 (n=39, f=0) #### 13: 1.33 (n=36, f=1) ###################### 14: 1.16 (n=29, f=0) ############### 15: 1.02 (n=23, f=0) ######### 16: 0.89 (n=12, f=0) OOOO 17: 0.93 (n=08, f=0) ~~~~~ 18: 1.35 (n=03, f=0) ~~~~~~~~~~~~~~~~~~~~~~~
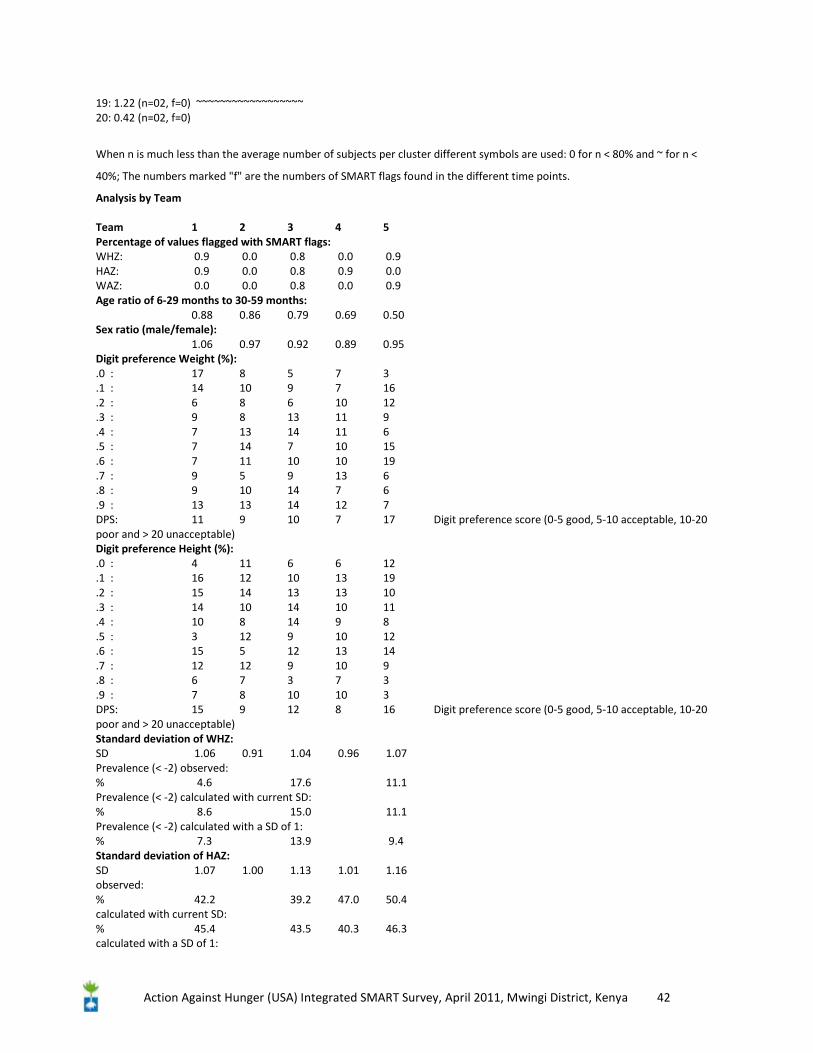
Action Against Hunger (USA) Integrated SMART Survey, April 2011, Mwingi District, Kenya 42
19: 1.22 (n=02, f=0) ~~~~~~~~~~~~~~~~~~ 20: 0.42 (n=02, f=0)
When n is much less than the average number of subjects per cluster different symbols are used: 0 for n < 80% and ~ for n <
40%; The numbers marked "f" are the numbers of SMART flags found in the different time points.
Analysis by Team Team 1 2 3 4 5 Percentage of values flagged with SMART flags: WHZ: 0.9 0.0 0.8 0.0 0.9 HAZ: 0.9 0.0 0.8 0.9 0.0 WAZ: 0.0 0.0 0.8 0.0 0.9 Age ratio of 6-29 months to 30-59 months: 0.88 0.86 0.79 0.69 0.50 Sex ratio (male/female): 1.06 0.97 0.92 0.89 0.95 Digit preference Weight (%): .0 : 17 8 5 7 3 .1 : 14 10 9 7 16 .2 : 6 8 6 10 12 .3 : 9 8 13 11 9 .4 : 7 13 14 11 6 .5 : 7 14 7 10 15 .6 : 7 11 10 10 19 .7 : 9 5 9 13 6 .8 : 9 10 14 7 6 .9 : 13 13 14 12 7 DPS: 11 9 10 7 17 Digit preference score (0-5 good, 5-10 acceptable, 10-20 poor and > 20 unacceptable) Digit preference Height (%): .0 : 4 11 6 6 12 .1 : 16 12 10 13 19 .2 : 15 14 13 13 10 .3 : 14 10 14 10 11 .4 : 10 8 14 9 8 .5 : 3 12 9 10 12 .6 : 15 5 12 13 14 .7 : 12 12 9 10 9 .8 : 6 7 3 7 3 .9 : 7 8 10 10 3 DPS: 15 9 12 8 16 Digit preference score (0-5 good, 5-10 acceptable, 10-20 poor and > 20 unacceptable) Standard deviation of WHZ: SD 1.06 0.91 1.04 0.96 1.07 Prevalence (< -2) observed: % 4.6 17.6 11.1 Prevalence (< -2) calculated with current SD: % 8.6 15.0 11.1 Prevalence (< -2) calculated with a SD of 1: % 7.3 13.9 9.4 Standard deviation of HAZ: SD 1.07 1.00 1.13 1.01 1.16 observed: % 42.2 39.2 47.0 50.4 calculated with current SD: % 45.4 43.5 40.3 46.3 calculated with a SD of 1:
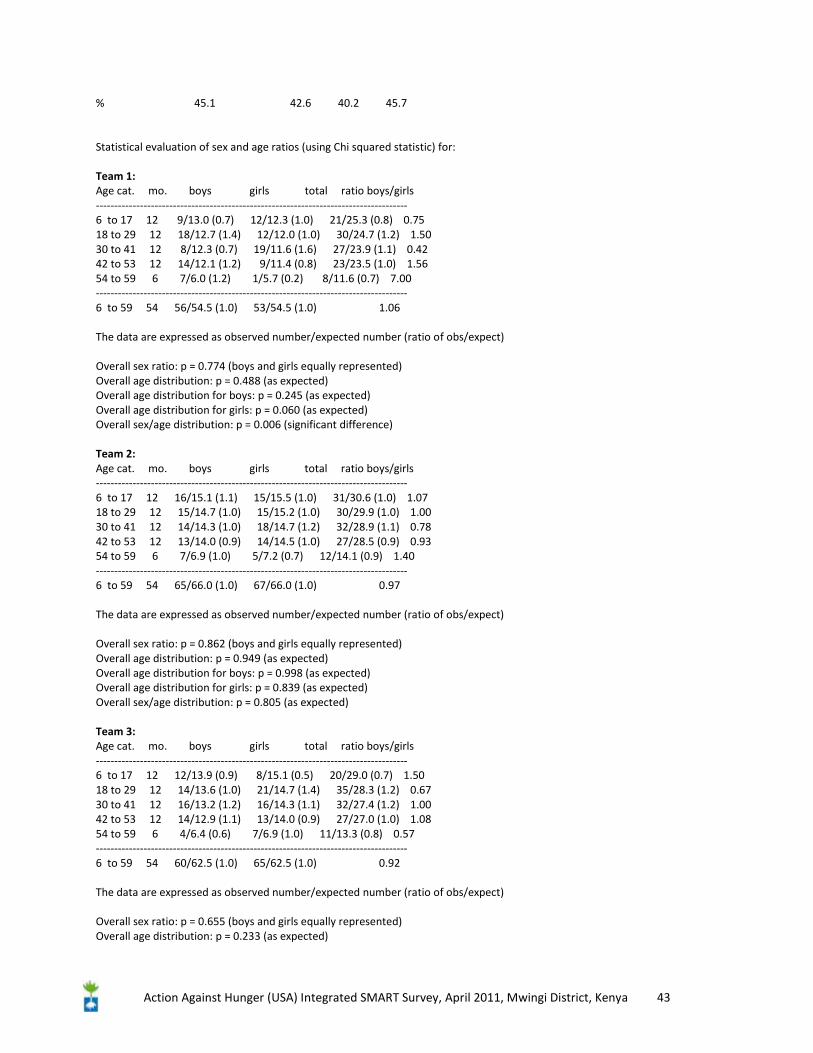
Action Against Hunger (USA) Integrated SMART Survey, April 2011, Mwingi District, Kenya 43
% 45.1 42.6 40.2 45.7 Statistical evaluation of sex and age ratios (using Chi squared statistic) for: Team 1: Age cat. mo. boys girls total ratio boys/girls ------------------------------------------------------------------------------------- 6 to 17 12 9/13.0 (0.7) 12/12.3 (1.0) 21/25.3 (0.8) 0.75 18 to 29 12 18/12.7 (1.4) 12/12.0 (1.0) 30/24.7 (1.2) 1.50 30 to 41 12 8/12.3 (0.7) 19/11.6 (1.6) 27/23.9 (1.1) 0.42 42 to 53 12 14/12.1 (1.2) 9/11.4 (0.8) 23/23.5 (1.0) 1.56 54 to 59 6 7/6.0 (1.2) 1/5.7 (0.2) 8/11.6 (0.7) 7.00 ------------------------------------------------------------------------------------- 6 to 59 54 56/54.5 (1.0) 53/54.5 (1.0) 1.06 The data are expressed as observed number/expected number (ratio of obs/expect) Overall sex ratio: p = 0.774 (boys and girls equally represented) Overall age distribution: p = 0.488 (as expected) Overall age distribution for boys: p = 0.245 (as expected) Overall age distribution for girls: p = 0.060 (as expected) Overall sex/age distribution: p = 0.006 (significant difference) Team 2: Age cat. mo. boys girls total ratio boys/girls ------------------------------------------------------------------------------------- 6 to 17 12 16/15.1 (1.1) 15/15.5 (1.0) 31/30.6 (1.0) 1.07 18 to 29 12 15/14.7 (1.0) 15/15.2 (1.0) 30/29.9 (1.0) 1.00 30 to 41 12 14/14.3 (1.0) 18/14.7 (1.2) 32/28.9 (1.1) 0.78 42 to 53 12 13/14.0 (0.9) 14/14.5 (1.0) 27/28.5 (0.9) 0.93 54 to 59 6 7/6.9 (1.0) 5/7.2 (0.7) 12/14.1 (0.9) 1.40 ------------------------------------------------------------------------------------- 6 to 59 54 65/66.0 (1.0) 67/66.0 (1.0) 0.97 The data are expressed as observed number/expected number (ratio of obs/expect) Overall sex ratio: p = 0.862 (boys and girls equally represented) Overall age distribution: p = 0.949 (as expected) Overall age distribution for boys: p = 0.998 (as expected) Overall age distribution for girls: p = 0.839 (as expected) Overall sex/age distribution: p = 0.805 (as expected) Team 3: Age cat. mo. boys girls total ratio boys/girls ------------------------------------------------------------------------------------- 6 to 17 12 12/13.9 (0.9) 8/15.1 (0.5) 20/29.0 (0.7) 1.50 18 to 29 12 14/13.6 (1.0) 21/14.7 (1.4) 35/28.3 (1.2) 0.67 30 to 41 12 16/13.2 (1.2) 16/14.3 (1.1) 32/27.4 (1.2) 1.00 42 to 53 12 14/12.9 (1.1) 13/14.0 (0.9) 27/27.0 (1.0) 1.08 54 to 59 6 4/6.4 (0.6) 7/6.9 (1.0) 11/13.3 (0.8) 0.57 ------------------------------------------------------------------------------------- 6 to 59 54 60/62.5 (1.0) 65/62.5 (1.0) 0.92 The data are expressed as observed number/expected number (ratio of obs/expect) Overall sex ratio: p = 0.655 (boys and girls equally represented) Overall age distribution: p = 0.233 (as expected)
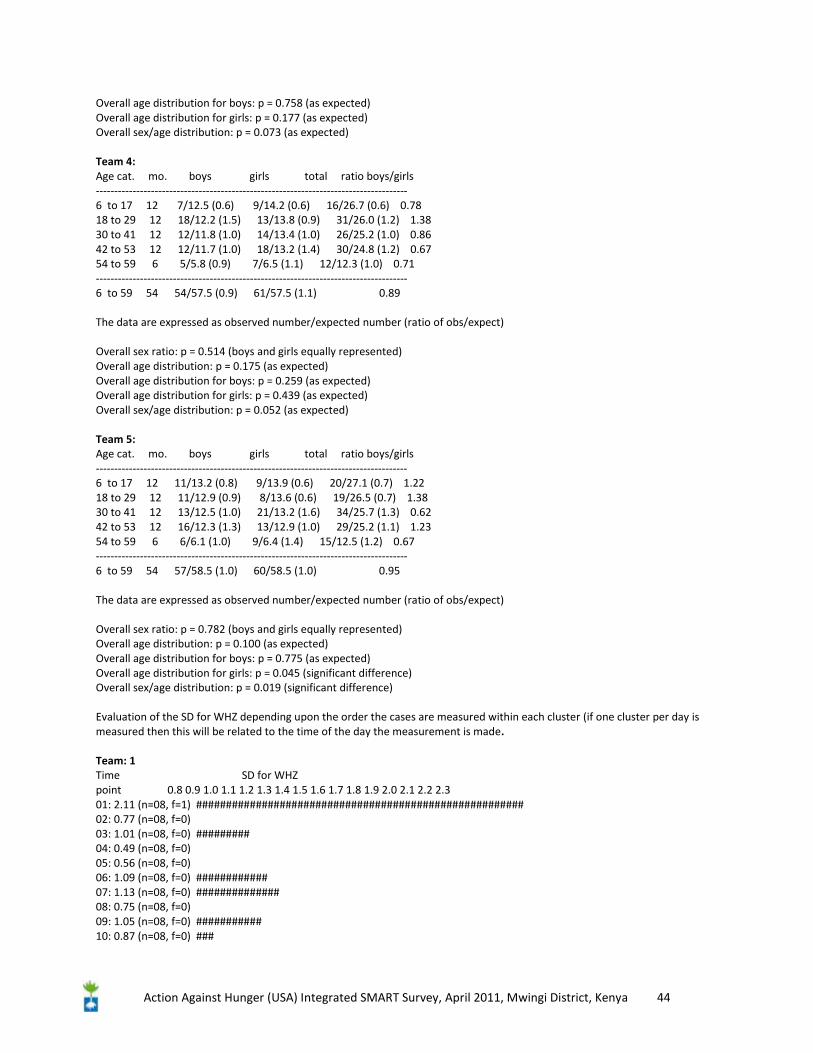
Action Against Hunger (USA) Integrated SMART Survey, April 2011, Mwingi District, Kenya 44
Overall age distribution for boys: p = 0.758 (as expected) Overall age distribution for girls: p = 0.177 (as expected) Overall sex/age distribution: p = 0.073 (as expected) Team 4: Age cat. mo. boys girls total ratio boys/girls ------------------------------------------------------------------------------------- 6 to 17 12 7/12.5 (0.6) 9/14.2 (0.6) 16/26.7 (0.6) 0.78 18 to 29 12 18/12.2 (1.5) 13/13.8 (0.9) 31/26.0 (1.2) 1.38 30 to 41 12 12/11.8 (1.0) 14/13.4 (1.0) 26/25.2 (1.0) 0.86 42 to 53 12 12/11.7 (1.0) 18/13.2 (1.4) 30/24.8 (1.2) 0.67 54 to 59 6 5/5.8 (0.9) 7/6.5 (1.1) 12/12.3 (1.0) 0.71 ------------------------------------------------------------------------------------- 6 to 59 54 54/57.5 (0.9) 61/57.5 (1.1) 0.89 The data are expressed as observed number/expected number (ratio of obs/expect) Overall sex ratio: p = 0.514 (boys and girls equally represented) Overall age distribution: p = 0.175 (as expected) Overall age distribution for boys: p = 0.259 (as expected) Overall age distribution for girls: p = 0.439 (as expected) Overall sex/age distribution: p = 0.052 (as expected) Team 5: Age cat. mo. boys girls total ratio boys/girls ------------------------------------------------------------------------------------- 6 to 17 12 11/13.2 (0.8) 9/13.9 (0.6) 20/27.1 (0.7) 1.22 18 to 29 12 11/12.9 (0.9) 8/13.6 (0.6) 19/26.5 (0.7) 1.38 30 to 41 12 13/12.5 (1.0) 21/13.2 (1.6) 34/25.7 (1.3) 0.62 42 to 53 12 16/12.3 (1.3) 13/12.9 (1.0) 29/25.2 (1.1) 1.23 54 to 59 6 6/6.1 (1.0) 9/6.4 (1.4) 15/12.5 (1.2) 0.67 ------------------------------------------------------------------------------------- 6 to 59 54 57/58.5 (1.0) 60/58.5 (1.0) 0.95 The data are expressed as observed number/expected number (ratio of obs/expect) Overall sex ratio: p = 0.782 (boys and girls equally represented) Overall age distribution: p = 0.100 (as expected) Overall age distribution for boys: p = 0.775 (as expected) Overall age distribution for girls: p = 0.045 (significant difference) Overall sex/age distribution: p = 0.019 (significant difference) Evaluation of the SD for WHZ depending upon the order the cases are measured within each cluster (if one cluster per day is measured then this will be related to the time of the day the measurement is made. Team: 1 Time SD for WHZ point 0.8 0.9 1.0 1.1 1.2 1.3 1.4 1.5 1.6 1.7 1.8 1.9 2.0 2.1 2.2 2.3 01: 2.11 (n=08, f=1) ####################################################### 02: 0.77 (n=08, f=0) 03: 1.01 (n=08, f=0) ######### 04: 0.49 (n=08, f=0) 05: 0.56 (n=08, f=0) 06: 1.09 (n=08, f=0) ############ 07: 1.13 (n=08, f=0) ############## 08: 0.75 (n=08, f=0) 09: 1.05 (n=08, f=0) ########### 10: 0.87 (n=08, f=0) ###
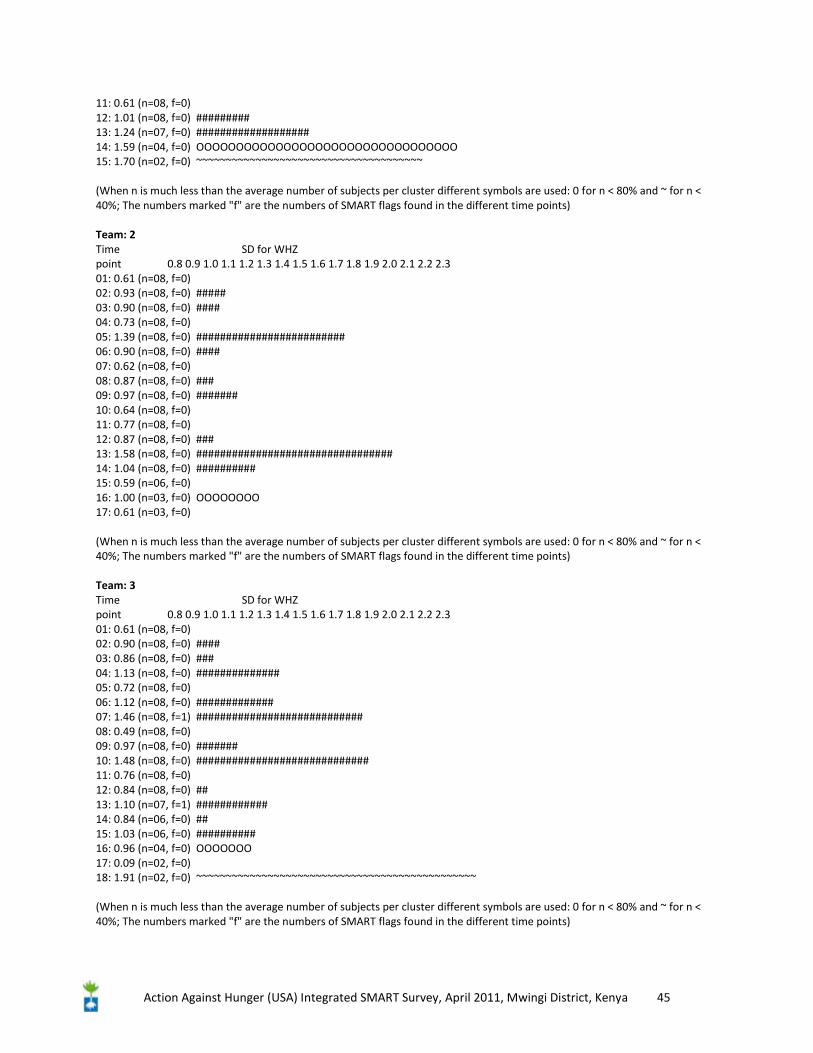
Action Against Hunger (USA) Integrated SMART Survey, April 2011, Mwingi District, Kenya 45
11: 0.61 (n=08, f=0) 12: 1.01 (n=08, f=0) ######### 13: 1.24 (n=07, f=0) ################### 14: 1.59 (n=04, f=0) OOOOOOOOOOOOOOOOOOOOOOOOOOOOOOOOO 15: 1.70 (n=02, f=0) ~~~~~~~~~~~~~~~~~~~~~~~~~~~~~~~~~~~~~~ (When n is much less than the average number of subjects per cluster different symbols are used: 0 for n < 80% and ~ for n < 40%; The numbers marked "f" are the numbers of SMART flags found in the different time points) Team: 2 Time SD for WHZ point 0.8 0.9 1.0 1.1 1.2 1.3 1.4 1.5 1.6 1.7 1.8 1.9 2.0 2.1 2.2 2.3 01: 0.61 (n=08, f=0) 02: 0.93 (n=08, f=0) ##### 03: 0.90 (n=08, f=0) #### 04: 0.73 (n=08, f=0) 05: 1.39 (n=08, f=0) ######################### 06: 0.90 (n=08, f=0) #### 07: 0.62 (n=08, f=0) 08: 0.87 (n=08, f=0) ### 09: 0.97 (n=08, f=0) ####### 10: 0.64 (n=08, f=0) 11: 0.77 (n=08, f=0) 12: 0.87 (n=08, f=0) ### 13: 1.58 (n=08, f=0) ################################# 14: 1.04 (n=08, f=0) ########## 15: 0.59 (n=06, f=0) 16: 1.00 (n=03, f=0) OOOOOOOO 17: 0.61 (n=03, f=0) (When n is much less than the average number of subjects per cluster different symbols are used: 0 for n < 80% and ~ for n < 40%; The numbers marked "f" are the numbers of SMART flags found in the different time points) Team: 3 Time SD for WHZ point 0.8 0.9 1.0 1.1 1.2 1.3 1.4 1.5 1.6 1.7 1.8 1.9 2.0 2.1 2.2 2.3 01: 0.61 (n=08, f=0) 02: 0.90 (n=08, f=0) #### 03: 0.86 (n=08, f=0) ### 04: 1.13 (n=08, f=0) ############## 05: 0.72 (n=08, f=0) 06: 1.12 (n=08, f=0) ############# 07: 1.46 (n=08, f=1) ############################ 08: 0.49 (n=08, f=0) 09: 0.97 (n=08, f=0) ####### 10: 1.48 (n=08, f=0) ############################# 11: 0.76 (n=08, f=0) 12: 0.84 (n=08, f=0) ## 13: 1.10 (n=07, f=1) ############ 14: 0.84 (n=06, f=0) ## 15: 1.03 (n=06, f=0) ########## 16: 0.96 (n=04, f=0) OOOOOOO 17: 0.09 (n=02, f=0) 18: 1.91 (n=02, f=0) ~~~~~~~~~~~~~~~~~~~~~~~~~~~~~~~~~~~~~~~~~~~~~~~ (When n is much less than the average number of subjects per cluster different symbols are used: 0 for n < 80% and ~ for n < 40%; The numbers marked "f" are the numbers of SMART flags found in the different time points)
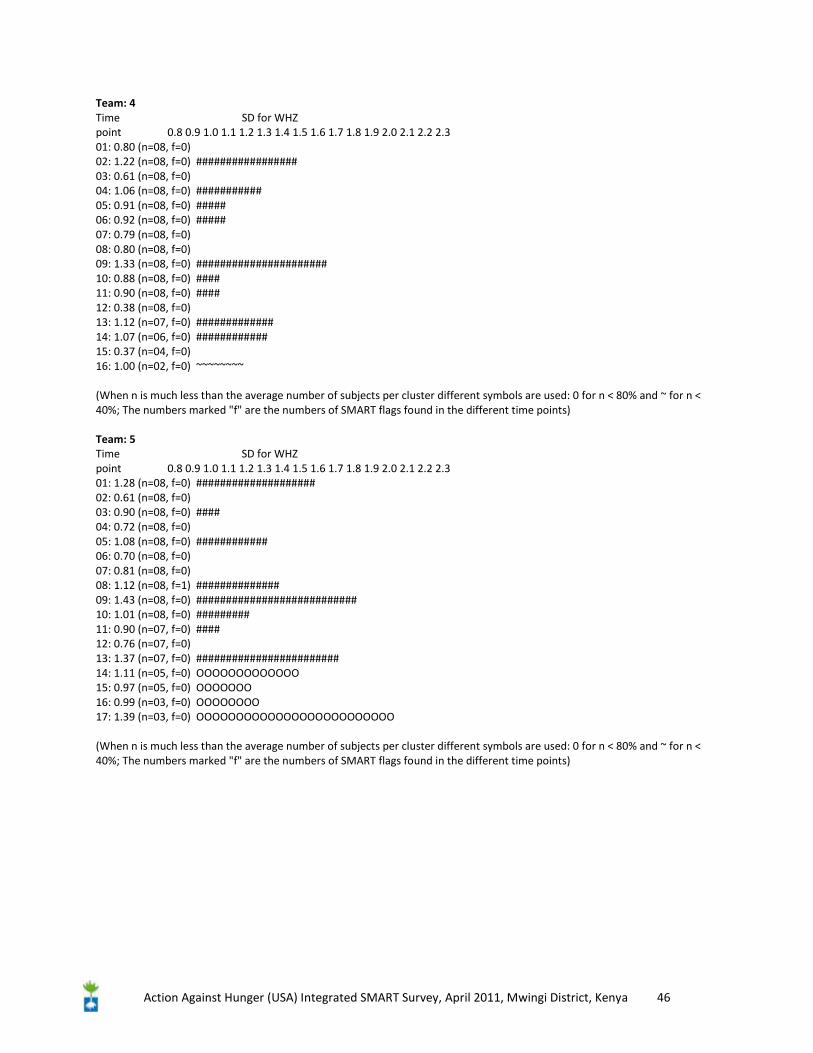
Action Against Hunger (USA) Integrated SMART Survey, April 2011, Mwingi District, Kenya 46
Team: 4 Time SD for WHZ point 0.8 0.9 1.0 1.1 1.2 1.3 1.4 1.5 1.6 1.7 1.8 1.9 2.0 2.1 2.2 2.3 01: 0.80 (n=08, f=0) 02: 1.22 (n=08, f=0) ################# 03: 0.61 (n=08, f=0) 04: 1.06 (n=08, f=0) ########### 05: 0.91 (n=08, f=0) ##### 06: 0.92 (n=08, f=0) ##### 07: 0.79 (n=08, f=0) 08: 0.80 (n=08, f=0) 09: 1.33 (n=08, f=0) ###################### 10: 0.88 (n=08, f=0) #### 11: 0.90 (n=08, f=0) #### 12: 0.38 (n=08, f=0) 13: 1.12 (n=07, f=0) ############# 14: 1.07 (n=06, f=0) ############ 15: 0.37 (n=04, f=0) 16: 1.00 (n=02, f=0) ~~~~~~~~ (When n is much less than the average number of subjects per cluster different symbols are used: 0 for n < 80% and ~ for n < 40%; The numbers marked "f" are the numbers of SMART flags found in the different time points) Team: 5 Time SD for WHZ point 0.8 0.9 1.0 1.1 1.2 1.3 1.4 1.5 1.6 1.7 1.8 1.9 2.0 2.1 2.2 2.3 01: 1.28 (n=08, f=0) #################### 02: 0.61 (n=08, f=0) 03: 0.90 (n=08, f=0) #### 04: 0.72 (n=08, f=0) 05: 1.08 (n=08, f=0) ############ 06: 0.70 (n=08, f=0) 07: 0.81 (n=08, f=0) 08: 1.12 (n=08, f=1) ############## 09: 1.43 (n=08, f=0) ########################### 10: 1.01 (n=08, f=0) ######### 11: 0.90 (n=07, f=0) #### 12: 0.76 (n=07, f=0) 13: 1.37 (n=07, f=0) ######################## 14: 1.11 (n=05, f=0) OOOOOOOOOOOOO 15: 0.97 (n=05, f=0) OOOOOOO 16: 0.99 (n=03, f=0) OOOOOOOO 17: 1.39 (n=03, f=0) OOOOOOOOOOOOOOOOOOOOOOOOO (When n is much less than the average number of subjects per cluster different symbols are used: 0 for n < 80% and ~ for n < 40%; The numbers marked "f" are the numbers of SMART flags found in the different time points)