Embed Size (px)
Citation preview

ORIGINAL PAPER
Integrated risk management: a Petrobras application in offshore wellconstruction safety to minimize critical emergency disconnections
Claudio Benevenuto de Campos Lima1,2 • Pedro Esteves Aranha1 • Jose Francisco Tebaldi de Castro1,2 •
Gilson Brito Alves Lima2 • Augusto Borella Hougaz1 • Felipe de Souza Terra1
Received: 6 April 2017 / Published online: 24 March 2018� The Author(s) 2018
AbstractIn order to avoid mistakes and to save a great deal of time in analysis, an innovative methodology was developed that can
analyze the well operations and rig characteristics involved to define the best emergency disconnect sequence (EDS)
available. A solution was developed based on the characteristics of the rigs and blowout preventers (BOPs), and six
variables were considered that directly affect the choice of EDS. All possible combinations of 64 scenarios were analyzed,
and the priority of choice of the EDS was defined empirically. This paper presents an approach to EDS risk management
and examples of exposure time (time without riser safety margin and shear capability) for the same well, which can be
lowered from 13% to 0.1%. The impact of this reduction is related to the ability of the BOP to cut some of the heavy
casings, in addition to improved availability of EDS modes. This implementation opened up many possibilities for the
performance of risk exposure analysis, enabling comparison of several BOP configurations of contracted rigs and selection
of the best options. This innovative approach allowed a better management of the rig schedules, prioritizing safety aspects
and making it possible to allocate the fleet in a systematic way.
Keywords Well safety � Safety barriers � Emergency disconnect sequence (EDS) � Well control � Kick � Well design
AbbreviationsBOP Blowout preventer
BSR Blind shear ram
CAPEX Capital expenditure
CSR Casing shear ram
EDS Emergency disconnect sequence
LBSR Lower blind shear ram
LMRP Lower marine riser package
MPD Managed pressure drilling
RSM Riser safety margin
SEEDS System of emergency disconnect sequence
UBD Underbalanced drilling
UBSR Upper blind shear ram
1 Introduction
Petrobras is the biggest Brazilian oil operator, currently
operating worldwide in the energy sector, primarily in the
areas of exploration, production, refining, marketing and
transportation of oil, natural gas and their products. In
recent years, Petrobras has made several significant oil field
discoveries in the Brazilian Pre-Salt layer, with an
impressive production potential in deepwater. However,
the development of production from these new fields pre-
sents many technological and logistical challenges
demanding intensive optimization of the work processes
and an increasing number of operational activities,
including offshore well construction. An important aspect
to consider in the future of these projects is sensitivity to
the environment, as during well construction operations,
many problems can occur. Oil spills can result in the most
catastrophic events in terms of cost, loss of assets, envi-
ronmental damage and personnel safety when their occur-
rences and escalations are not handled properly
(Januarilham 2012). Although large-scale oil spills are
generally rare, distinct events can account for most of the
Edited by Xiu-Qin Zhu
& Claudio Benevenuto de Campos Lima
1 Petrobras, Rio de Janeiro, RJ, Brazil
2 Department of Production Engineering, Federal Fluminense
University, Niteroi, RJ, Brazil
123
Petroleum Science (2018) 15:421–431https://doi.org/10.1007/s12182-018-0223-4(0123456789().,-volV)(0123456789().,-volV)

cumulative oil spill volume (Ji et al. 2014), spills from oil
production can also be very large, and pollution from
blowouts and other incidents sometimes exceeds that
caused by major tank accidents (Nihoul and Ducrotoy
1994). From the drilling perspective, well design and
construction require the addressing of safety issues, espe-
cially those associated with well control operations. Per-
sonnel training and certification, as well as the proper well
control operation, require reliable computational tools,
such as kick simulators (Avelar et al. 2009). Petrobras’
major concern is to develop its reserves under the best
safety conditions, in order to preserve the environment, its
people and its assets. Thus, it has been necessary to focus
more on the ability to perform safe disconnection regard-
less of the operation occurring in the well (Paula and
Fonseca 2013).
The construction of petroleum wells is becoming more
and more complex and challenging, especially in regard to
drilling and completion in deep and ultra-deepwater, which
requires the use of increasingly sophisticated dynamically
positioned rigs (Paula and Fonseca 2013). In normal dril-
ling operations, the primary well control is the hydrostatic
pressure exerted by the drilling fluid in the well, which can
be adjusted to specific conditions through variations in the
fluid density. Proper well planning requires that the pres-
sure inside the wellbore should overbalance the formation
pressure by a certain safety margin. This can be attained by
the hydrostatic head of the drilling fluid or the combination
of applied surface backpressure and the hydrostatic head of
the drilling fluid (managed pressure drilling—MPD sce-
nario). As a secondary barrier during drilling, the blowout
preventer (BOP) is designed to close the well annulus or
the drill pipe (Cai et al. 2012). In deepwater and ultra-
deepwater drilling operations, the BOP is latched onto a
wellhead, situated on the seabed (Huse and Alme 2013).
Blowout preventers have several functions, but the most
important is the ability to prevent large blowouts of
hydrocarbons from the well (Østby 2008). Kick is descri-
bed as the unwanted influx of formation fluid into a well-
bore during drilling operation as a result of pressure
differences in the wellbore. This influx is unwanted
because it can flow to the surface and create a blowout,
harming people, the environment and causing property
damage (Januarilham 2012). Kicks are early signs of
potentially disastrous blowouts (Ajienka and Owolabi
1991), and there are several cases where such blowouts
may occur, including high pressure in the well and plat-
form drift-off (Østby 2008). In the event of primary control
loss resulting from a sudden increase in formation pressure
or lost circulation, it becomes necessary to seal off the well
by some other means to prevent uncontrollable flow, or
blowout, of formation fluids (Vujasinovic 1986). The
blowout preventer (BOP) is one of several barriers in the
well to prevent kicks and blowouts and is the most
important and critical piece of equipment as it is the last
line of protection against blowouts during well interven-
tions (Januarilham 2012). It may be defined as one or more
valves installed at the wellhead to prevent the escape of
pressure, either in the annular space between the casing and
the drill pipe or in the open hole during drilling or com-
pletion operations (Huse and Alme 2013).
The BOP is a structure with a large set of valves and
rams placed on the top of the well, which can be closed
when the drilling crew have uncontrolled flow of formation
fluid in the wellbore (Januarilham 2012). Often the
expression ‘‘BOP’’ is used for ‘‘BOP stacks,’’ which is an
assembly of many blowout preventers (annular preventers,
pipe ram preventers, shear or blind rams) and other well
control equipment such as the kill and choke lines (Huse
and Alme 2013). The subsea BOP system consists mainly
of the subsea BOP control system and the subsea BOP
stack. A typical subsea BOP system is illustrated in Fig. 1
(Cai et al. 2012). During normal operation, the BOP valves
are operated with fluid power from the rig through an
umbilical. In the event of an emergency where the umbil-
ical may be accidentally cut, the BOP must therefore
contain the necessary energy to operate the rams without a
topside connection (Østby 2008). BOP configurations vary
because of differences in drilling regions, ocean depths,
and so on. Until now, no definitive configuration standards
have been established (Cai et al. 2012).
Different preventer configurations provide different
levels of performance for subsea BOP systems. Specifi-
cally, a blind shear ram preventer, which is regarded as an
emergency device, is used to shear the pipe and seal the
well. As shown in Fig. 1, the typical subsea BOP is
equipped with two annular preventers and four or five ram
preventers, including two blind shear rams and two or three
pipe rams. The configuration of the stack is dependent on
the expected operations, redundancy, flexibility and the
trade-off between the advantages and disadvantages of
each configuration (Januarilham 2012). Besides the annular
preventers, ram preventers, connectors and other compo-
nents such as the flexible joint, choke/kill valves and
choke/kill lines are integrated to form the whole subsea
BOP stack (Cai et al. 2012). There are several types of
rams which have different tasks in addition to sealing the
well. One may be designed to grip and hold equipment
lowered into the well, while others are designed to cut
equipment and pipes which are blocking the ram. The latter
is the shear seal ram (Østby 2008). The subsea BOP stack
is usually equipped with two hydraulic connectors, the
LMRP connector and the wellhead connector. The LMRP
contains the control system of the BOP and one or two
annular preventers, depending on the BOP configuration.
The LMRP connector enables retrieval of the control
422 Petroleum Science (2018) 15:421–431
123

system, and the annular preventer enables maintenance
without the necessity of removing the whole BOP stack,
therefore saving time and making it safer, besides being
used to connect the LMRP to the BOP stack. The wellhead
connector is used to connect the BOP stack to the wellhead
(Cai et al. 2012).
Loss of position of the dynamically positioned rig
without safe disconnection could result in critical damage
to the well barrier, as well as to exposed subsea equipment.
The ultimate consequence could be a blowout and/or sev-
ere damage to subsea production systems like production
templates, resulting in risk to personnel, environmental
damage, financial loss and harm to the reputation of the
Wellhead connector
Pipe ram
Pipe ram
Pipe ram
Blind shear ram
Lower annular preventer
Subsea yellow pod
LMRP connector
Upper annular preventer
Drilling rig
Subsea blue pod
Central control unit
redundant controllersTriple modular
Work station
Driller’s panelToolpusher’s panel
Fig. 1 Typical architecture of a subsea BOP system. Reproduced with permission from Cai et al. (2012)
Petroleum Science (2018) 15:421–431 423
123

company (Paula and Fonseca 2013). Currently, all
dynamically positioned rigs are equipped with an emer-
gency disconnect button which initiates a pre-programmed
sequence of functions designed to secure the well in a
minimal amount of time prior to disconnecting the LMRP
riser connector (Sattler and Lewis 2004). An emergency
disconnect sequence (EDS) is a sequence of actions, events
and interlocks that are automatically initiated once the EDS
button is pressed on any BOP panel in the rig. These
actions will activate the mechanism or equipment respon-
sible for disconnecting the rig from the well (Paula and
Fonseca 2013).
One of the problems is that each rig has a different
combination of EDS, even when they have similar BOP
configurations. It is interesting to note that some functions
are activated even though they should already be in a
particular position. This is done to ensure the well is
secured upon disconnecting (Sattler and Lewis 2004).
Despite extensive technology, an emergency disconnection
may occur at any time in dynamically positioned drilling
rigs, sometimes surprisingly so, be it through human error,
adverse environmental conditions or blackouts. The prior
selection of proper EDS, followed by well-thought-out
operational decisions, is essential for reduction in potential
damage caused by disconnections (Paula and Fonseca
2013). The operating philosophy behind the emergency
disconnection guidelines, as shown graphically in Fig. 2, is
that decisions which have been previously considered and
planned should be initiated as soon as possible.
Based on this philosophy, Petrobras adopted the ‘‘de-
graded status’’ concept. It considers that, when the rig has
lost any of its backup systems, such that a single failure in
any of the dynamic positioning (DP) system equipment
causes the rig to lose its capability of maintaining position,
it is considered to be in ‘‘degraded status.’’ From the
‘‘degraded status’’ to the ‘‘yellow status,’’ the crew may
have some time to think and perform pre-planned actions.
The moment the ‘‘red alarm’’ sounds, the only thing left to
be done is disconnect the rig as fast as possible or risk
getting stuck to the wellhead, thereby putting the well and
the rig at risk.
This paper is organized in six sections, as follows:
Sect. 2 presents the EDS bibliography survey. Section 3
describes the automatic generation of operational sequen-
ces with EDS. Section 4 presents the SEEDS method-
ological approach. Section 5 shows the results and
applications. At last, Sect. 6 presents the conclusions and
future steps.
2 EDS state-of-the-art survey
To investigate what is known on the subject, it was nec-
essary to see what is already available in the literature.
Thus, a bibliographic search was conducted from 1980 to
October 4, 2015, taking as reference the SCOPUS data-
base, which is significant in several fields of knowledge.
Initially, the key words used were: ‘‘emergency disconnect
sequence’’ or ‘‘system of emergency disconnect sequence’’
or ‘‘emergency disconnection’’ or ‘‘disconnection emer-
gency guidelines’’ or ‘‘system of emergency disconnec-
tion.’’ The 113 results were found with articles and
conference papers, considering only the ‘‘physical sci-
ences’’ category. A new filter was applied, where the
‘‘computer science,’’ ‘‘earth and planetary sciences,’’
‘‘physics and astronomy,’’ ‘‘social sciences,’’ ‘‘materials
science,’’ ‘‘mathematics,’’ ‘‘medicine’’ and ‘‘environmental
science’’ areas were removed, due to the fact that the
subject is specific to the oil and gas industry. Using this
filter, it was possible to obtain 69 documents. In a more
detailed analysis of these articles, 21 documents were then
selected to form the core of the bibliographic research. It is
concluded that the subject presented here is innovative,
very current and it is still developing.
In the literature, important works are found on the
construction of offshore wells, using risk analysis tech-
niques, such as Bayesian network, fault tree, event tree and
bow tie (Bhandari et al. 2015; Khakzad et al. 2013;
Abimbola et al. 2014). Such studies help to determine the
probability of blowouts, facilitating the preventive and
mitigating actions for undesired events. Also described in
the literature is the impact on the operation risk by the
introduction of new drilling techniques, such as MPD
(managed pressure drilling) and UBD (underbalanced
drilling) (Abimbola et al. 2015). Although there were
interesting assessments on the probabilities of failure of
several basic events in offshore well construction opera-
tions (Abimbola et al. 2014; OREDA 2002), no studies
were found in the literature that included the selection of
the closure sequence (EDS) of the BOP stack rams, in
emergency disconnect events, in case of BOP closing
failure. Incorrect selection of the closing sequence can lead
Normalstatus
Degradedstatus
Yelowstatus
Red alarmstatus
Emmergencydisconnection
(EDS)
Planneddisconnection
ReactionDecisions
Without lost ofposition
With lost ofposition
Concernbeginning
Fig. 2 Operational philosophy of emergency disconnection guide-
lines. Reproduced with permission from Paula and Fonseca (2013)
424 Petroleum Science (2018) 15:421–431
123

to the events of blind rams, which do not have the cutting
and well sealing capacity acting on pipes, severely
increasing the probability of failure of the blind ram.
The correct selection of EDS will increase the chance of
leaving the well closed in the event of an emergency dis-
connection. The major problem is, as mentioned before,
each rig has its own EDS options, and even when they have
the same shear and blind shear ram configuration, they do
not have the same EDS options. Furthermore, there are
dozens of different associated operations that may take
place and be analyzed to define the best EDS to be adopted,
and this context needs to comply with the limits of the rig.
Without the proper tools, this analysis to select the rig EDS
should be performed repeatedly for each well design and
operation, and depending on the people involved in the
discussion, a different EDS may be selected for the same
operation and rig.
In order to avoid mistakes and save a great deal of
analysis time, Petrobras decided to develop a tool that
could analyze the well operations and the rig involved, in
order to define the best EDS available, based on pre-de-
fined standard criteria to maximize the chance of leaving
the well closed. Therefore, it was possible to concentrate
efforts, with the best people available, on defining robust
criteria that could be reproduced in all well designs and
operations.
3 Automatic generation of operationalsequence with EDS
High risks are inherent to any well construction due to the
uncertainties and unknowns in geological modeling and in
rock and fluid properties. Although risks cannot be elimi-
nated, they can certainly be reduced by using an appro-
priate safety approach during design and planning phases
(Miura et al. 2006). The design of a well can be defined as
an interactive process, involving specialists and informa-
tion to set up a sufficiently detailed plan to drill the well
safely and economically. The process is characterized by a
set of activities, which present a strong interdependent
relationship (Mendes et al. 2003). In order to provide an
estimation of exposure time for each EDS during the stages
of well construction, Petrobras has developed a system
called SEEDS, which compares several BOP settings of the
rigs and calculates risk exposure times. Such an approach
enables an increase in well design robustness in terms of
safety, while also making it possible to supply recom-
mended EDS for each operation in the design phase. This
practice encourages discussion on the well construction
project, involving both the operations team and company
site representatives. The system cost is around 0.01% of the
CAPEX (CAPital EXpenditure) of Petrobras well
construction. All the development and implementation of
SEEDS were performed in house.
The main consequences are an improvement in the
quality of the well construction process and also better
competence development across the teams involved in
important safety issues. This system developed by Petro-
bras is state of the art in the oil industry. There is no
standard description or list making process for EDS, and
unfortunately, each rig has its own EDS numbers depend-
ing on the BOP model. The EDS list shown in Table 1 is an
attempt by the Petrobras team to standardize EDS possi-
bilities. This list considers the four BOP configurations
regarding the number of shear rams (and blind shear)
available nowadays. These options do not take into con-
sideration the autoshear configuration availability but do
provide for the possibility of the rig not having a proper
EDS for the operation, or more than one option, based on
the criteria developed.
With the solution proposed, it is possible to compare and
quantify exposure to EDS 0 (no shear possibilities—see
Table 1 above) without riser safety margin (RSM). This
condition is critical, as in the event of an emergency dis-
connection the well would not have the fluid barrier and the
BOP would be unable to isolate the well from the outside
environment through the blind shear rams. This could
represent a catastrophic event such as an oil spill in the
ocean. This approach was developed to cover the whole
drilling process, including, top hole drilling, bottom hole
drilling and temporary abandonment of wells. This pro-
gram (SEEDS) automates and accelerates the documenta-
tion containing recommendations, standards and schedule
of well construction operations, contributing to better
knowledge management. The approach also allows the use
of different software adopted by Petrobras for probabilistic
forecasting of well runtime.
4 SEEDS methodological approach
Based on the characteristics of the rigs and the BOPs that
equip them, six variables were considered that directly
affect the choice of EDS. Then, all possible combinations
of these variables (64 scenarios) were analyzed and, for
each scenario, the priority order of choice of the EDS was
defined empirically, with the premises that the blind ram
selected for closure was able to cut the element in front of
the BOP and keep the seal, therefore, closing the well
safely or, if the blind rams are not capable of cutting, the
blind ram selected for closing must close without any
material at the front of the BOP, sealing the well securely.
Petroleum Science (2018) 15:421–431 425
123

4.1 SEEDS description
The application has a data input module where the infor-
mation for each phase is inserted, such as well depth, well
diameter, flow rates, casing diameters, the length of cement
left within the casing and cased and open hole tripping
rates for each phase (already automatically entered through
system integration with the rig values, which can be cus-
tomized by the user). It is also necessary to define the
number of bits for each phase and their drilling rates. The
program makes a consistency analysis with databases and
displays warning messages in the case of input errors.
Every change is automatically saved by the system.
The following information should also be fed into
SEEDS: if the stage/phase to be drilled will have RSM and
BOP tests, which drills will be performed, if the phase will
have enlargement (simultaneously or with dedicated trip),
if the phase is going to be cased at the end of drilling, if
open hole logging is planned, cementing evaluation log-
ging and if a coring operation will be performed or not. The
next step is the generation of the well operation plan,
whereby the user can add or delete steps, or edit the text
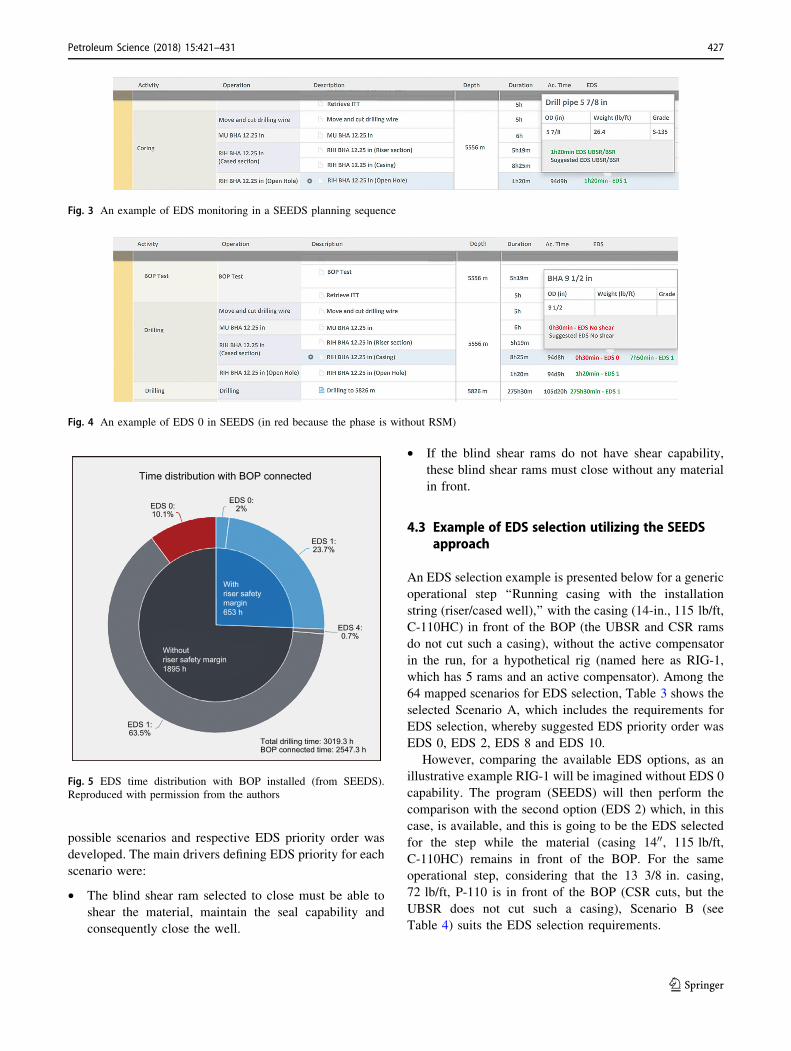
and the calculated duration of a specific step. Following a
generated planning sequence (considering a complete well
design), after BOP installation, according to the plan,
SEEDS will start monitoring the suggested EDS for each
step. An example is shown in Fig. 3.
The program presents the EDS in green when the first
EDS option selected by the model is available for the rig. If
EDS is shown in yellow, the rig selected for that specific
well does not have the primary option suggested by EDS.
In this case, another scenario option was obtained for the
mentioned rig. If it is EDS 8, the selected rig is unable to
safely perform this planned stage. If EDS 9 has been
selected, it means that there is more than one option
available with the same importance. (It is mandatory for
the design review to define the appropriate EDS.) Finally,
if EDS 10 is occurring, this indicates that it is necessary to
rethink this step, because the developed model has not
found an answer, usually due to incorrect input of the rig
characteristics, available EDS or material cutting capabil-
ities. If EDS 0 is selected in the scenario where the well
does not have RSM, the selected EDS will appear in red
because of the high risk involved (Fig. 4).
The program also provides a summary of selected EDS,
during the BOP connected period, for whole planning, as
shown in Fig. 5.
In Fig. 5, the blue section is the total time with RSM, the
gray area is the total time without the RSM but with shear
and seal capability and the red section is the total time
without RSM and EDS 0 (no shear) selected.
4.2 SEEDS development
A new concept of automated generation of the operational
sequence in well construction was implemented with
SEEDS. In order to develop the sequence, logic was used
to split the drilling steps into packages. The packages have
equations to estimate the time and well depth at each step,
to correlate which material is in front of the BOP and to
define if the operation is utilizing the rig movement com-
pensator or not. Besides the operational sequence, an
additional routine is used for each BOP test (expected after
each casing/liner run and cementing job performed). This
procedure inserts an additional BOP test into the opera-
tional sequence, depending on whether the period of
21 days (504 h) between BOP tests has been exceeded.
In the EDS selection module, six requirements should be
addressed. Table 2 shows an overview of EDS selection.
With these six requirements, a model with sixty-four
Table 1 EDS modesEDS Description
0 No sheara
1 UBSR or BSR
2 CSR
3 LBSR
4 CSR ? UBSR or CSR ? BSR
5 LBSR ? UBSR
6 UBSR ? LBSR
7 CSR ? LBSR
8 BOP does not provide a proper EDS
9 More than one option of EDS available with the same importance
10 No EDSb
aDisconnect LMRP from BOP stack without activating any blind or casing shear rambUsed for anchored rigs or if the model developed has not found an answer, usually by incorrect input of the
rig characteristics, available EDS or material cutting capabilities
426 Petroleum Science (2018) 15:421–431
123
possible scenarios and respective EDS priority order was
developed. The main drivers defining EDS priority for each
scenario were:
• The blind shear ram selected to close must be able to
shear the material, maintain the seal capability and
consequently close the well.
• If the blind shear rams do not have shear capability,
these blind shear rams must close without any material
in front.
4.3 Example of EDS selection utilizing the SEEDSapproach
An EDS selection example is presented below for a generic
operational step ‘‘Running casing with the installation
string (riser/cased well),’’ with the casing (14-in., 115 lb/ft,
C-110HC) in front of the BOP (the UBSR and CSR rams
do not cut such a casing), without the active compensator
in the run, for a hypothetical rig (named here as RIG-1,
which has 5 rams and an active compensator). Among the
64 mapped scenarios for EDS selection, Table 3 shows the
selected Scenario A, which includes the requirements for
EDS selection, whereby suggested EDS priority order was
EDS 0, EDS 2, EDS 8 and EDS 10.
However, comparing the available EDS options, as an
illustrative example RIG-1 will be imagined without EDS 0
capability. The program (SEEDS) will then perform the
comparison with the second option (EDS 2) which, in this
case, is available, and this is going to be the EDS selected
for the step while the material (casing 1400, 115 lb/ft,
C-110HC) remains in front of the BOP. For the same
operational step, considering that the 13 3/8 in. casing,
72 lb/ft, P-110 is in front of the BOP (CSR cuts, but the
UBSR does not cut such a casing), Scenario B (see
Table 4) suits the EDS selection requirements.
Fig. 3 An example of EDS monitoring in a SEEDS planning sequence
Fig. 4 An example of EDS 0 in SEEDS (in red because the phase is without RSM)
Time distribution with BOP connected
Withriser safetymargin653 h
Withoutriser safety margin1895 h
EDS 0:10.1%
EDS 0:2%
EDS 1:23.7%
Total drilling time: 3019.3 hBOP connected time: 2547.3 h
EDS 4:0.7%
EDS 1:63.5%
Fig. 5 EDS time distribution with BOP installed (from SEEDS).
Reproduced with permission from the authors
Petroleum Science (2018) 15:421–431 427
123
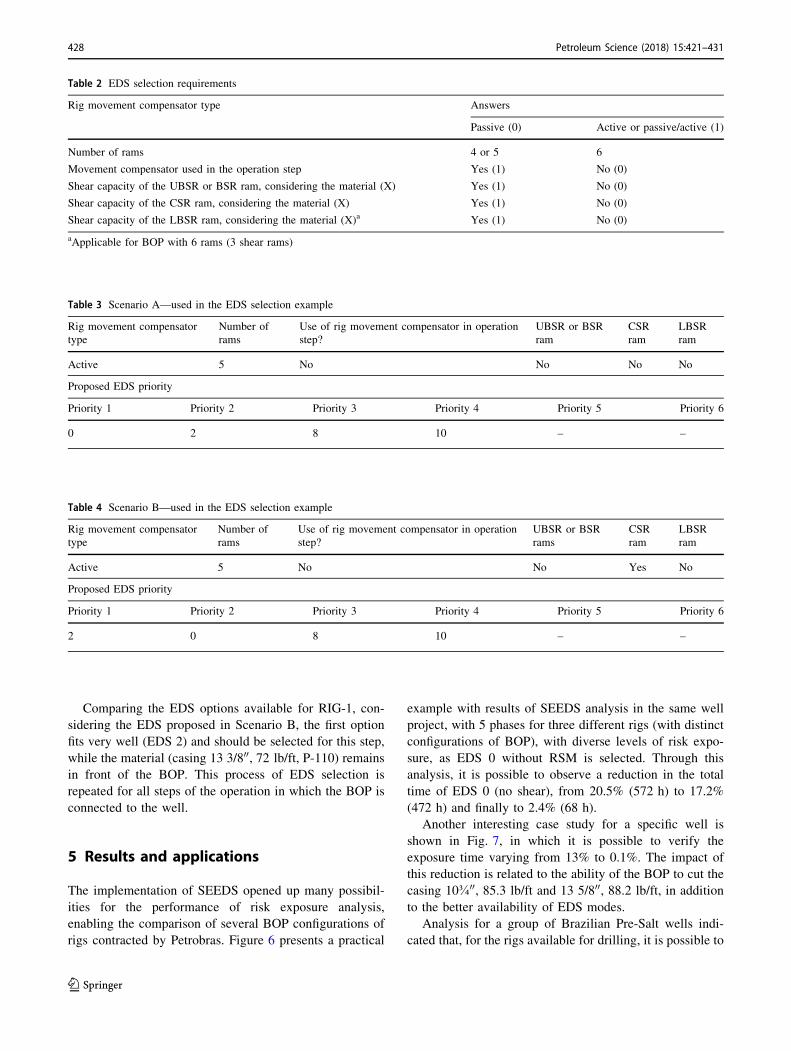
Comparing the EDS options available for RIG-1, con-
sidering the EDS proposed in Scenario B, the first option
fits very well (EDS 2) and should be selected for this step,
while the material (casing 13 3/800, 72 lb/ft, P-110) remains
in front of the BOP. This process of EDS selection is
repeated for all steps of the operation in which the BOP is
connected to the well.
5 Results and applications
The implementation of SEEDS opened up many possibil-
ities for the performance of risk exposure analysis,
enabling the comparison of several BOP configurations of
rigs contracted by Petrobras. Figure 6 presents a practical
example with results of SEEDS analysis in the same well
project, with 5 phases for three different rigs (with distinct
configurations of BOP), with diverse levels of risk expo-
sure, as EDS 0 without RSM is selected. Through this
analysis, it is possible to observe a reduction in the total
time of EDS 0 (no shear), from 20.5% (572 h) to 17.2%
(472 h) and finally to 2.4% (68 h).
Another interesting case study for a specific well is
shown in Fig. 7, in which it is possible to verify the
exposure time varying from 13% to 0.1%. The impact of
this reduction is related to the ability of the BOP to cut the
casing 10�00, 85.3 lb/ft and 13 5/800, 88.2 lb/ft, in addition
to the better availability of EDS modes.
Analysis for a group of Brazilian Pre-Salt wells indi-
cated that, for the rigs available for drilling, it is possible to
Table 2 EDS selection requirements
Rig movement compensator type Answers
Passive (0) Active or passive/active (1)
Number of rams 4 or 5 6
Movement compensator used in the operation step Yes (1) No (0)
Shear capacity of the UBSR or BSR ram, considering the material (X) Yes (1) No (0)
Shear capacity of the CSR ram, considering the material (X) Yes (1) No (0)
Shear capacity of the LBSR ram, considering the material (X)a Yes (1) No (0)
aApplicable for BOP with 6 rams (3 shear rams)
Table 3 Scenario A—used in the EDS selection example
Rig movement compensator
type
Number of
rams
Use of rig movement compensator in operation
step?
UBSR or BSR
ram
CSR
ram
LBSR
ram
Active 5 No No No No
Proposed EDS priority
Priority 1 Priority 2 Priority 3 Priority 4 Priority 5 Priority 6
0 2 8 10 – –
Table 4 Scenario B—used in the EDS selection example
Rig movement compensator
type
Number of
rams
Use of rig movement compensator in operation
step?
UBSR or BSR
rams
CSR
ram
LBSR
ram
Active 5 No No Yes No
Proposed EDS priority
Priority 1 Priority 2 Priority 3 Priority 4 Priority 5 Priority 6
2 0 8 10 – –
428 Petroleum Science (2018) 15:421–431
123

have a reduction from 13% to 0.1% in the exposure time to
EDS 0 without RSM, depending on the definition of rig for
the well location.
Over the years, the industry has developed and become
more organized, making it clear that increased profit was
justified by higher quality production and by the use of
faster and more efficient processes. To stay on top, it was
necessary to know the competitors and features that made
products more attractive to customers and processes at a
lower cost (Stapenhurst 2009). Based on this need,
EDS 0:20.5%
RIG # 1 RIG # 2
RIG # 3
EDS 0:4.5%
EDS 1:21.5%
EDS 0:17.2%
EDS 0: 1.6%
EDS 4: 4.9%
EDS 6:11.1%
EDS 7:8.1%
EDS 4:16.7%
EDS 0: 2.4% EDS 0: 2.8%
EDS 4:21.9%
EDS 7:1.3%
EDS 7:0%
EDS 4:71.5%
EDS 7:16.4%
EDS 6: 24.1%EDS 1: 53.5%
Withriser safetymargin724 h
Withriser safetymargin701 h
Withriser safetymargin727 h
Withoutriser safety margin2063 h
Withoutriser safety margin2035 h
Withoutriser safety margin2063 h
Fig. 6 SEEDS analysis: same well with three different rigs
RIG # 1 RIG # 2
RIG # 3 RIG # 4
EDS 0:13%
EDS 1:22.2% EDS 1:
22.2%
EDS 1:74.3%
EDS 6:5.8%
EDS 7:7%
EDS 7:15%
EDS 4:31.8%
EDS 1:63.2%
EDS 1:18.5%
EDS 4:10%
EDS 2:14.8%
EDS 0: 1.6%
EDS 0: 1.1% EDS 0: 1.6%
EDS 4: 41.7%
EDS 1: 5.5%EDS 2: 6.1%
EDS 0: 1.9%
EDS 0: 0.1%
EDS 6: 28.9%
EDS 0: 0.5%EDS 4: 10.2%
EDS 0: 1.6%
Withriser safetymargin557 h
Withoutriser safety margin1791 h
Withriser safetymargin557 h
Withoutriser safety margin1791 h
Withriser safetymargin557 h
Withoutriser safety margin1791 h
Withriser safetymargin557 h
Withoutriser safety margin1791 h
Fig. 7 SEEDS analysis for different scenarios
Petroleum Science (2018) 15:421–431 429
123

benchmarking emerges, with the first studies based on the
exchange of information between two companies and the
benchmarking clubs. Camp (1995) defined benchmarking
as the process of learning and exchange of corporate
information, with the purpose of promoting adaptations in
an organization based on the observation of the best
practices of the market. To develop this analysis, it is
necessary to define metrics and evaluation processes to
make the comparisons (Boxwell 1994). In the case of this
research, no study was found in another company that
could be comparable. Due to the current lack of external
benchmarking, it would be very welcome to have new
research in the future to compare the performance inter-
nally in the company studied.
6 Conclusions and future steps
The methodology presented in this paper enables the user
to compare the planning of the same well for different rig
possibilities, analyzing the EDS times of each step as well
as the total exposure times. This tool also makes it possible
to export the drilling schedule with the planned time,
selected EDS, recommendations and standards of each step
to the Petrobras database. This is an important break-
through in operation planning, enabling the selection of
scenarios with lower risk EDS. An important achievement
is the possibility of negotiating with the drilling contractors
to provide additional EDS modules and/or increase the
shear capability of the blind rams, in order to eliminate
situations with no possibility of closing the well safely.
The use of this approach allows the effective reduction
in exposure time in situations where there is neither shear
capability nor RSM. This aspect is relevant when preparing
the rig schedules, which have their security increased. In
this way, the pool of rigs can be adapted to the portfolio of
wells in the planning phase, allowing minimizing exposure
to EDS 0 condition without RSM.
The next steps involve the implementation of automated
planning for completions and workover operations by
selecting EDS. Another possibility is to compare the EDS
selected during the operation with the simulation by the
system, allowing alarms and avoiding human failure. To
better understand the importance of the proposed approach,
new research can be carried out in the future to compare
the performance in the company studied. These initiatives
are mandatory for the safe and efficient development of
new Petrobras discoveries.
Acknowledgements The authors wish to thank Petrobras for the
permission to publish this paper. We also acknowledge the support of
Intelie Soucoes em Informatica LTDA.
Open Access This article is distributed under the terms of the Creative
Commons Attribution 4.0 International License (http://creative
commons.org/licenses/by/4.0/), which permits unrestricted use,
distribution, and reproduction in any medium, provided you give
appropriate credit to the original author(s) and the source, provide a
link to the Creative Commons license, and indicate if changes were
made.
References
Abimbola M, Khan F, Khakzad N. Dynamic safety risk analysis of
offshore drilling. J Loss Prev Process Ind. 2014;30:74–85.
https://doi.org/10.1016/j.jlp.2014.05.002.
Abimbola M, Khan F, Khakzad N, Butt S. Safety and risk analysis of
managed pressure drilling operation using Bayesian network. Saf
Sci. 2015;76:133–44. https://doi.org/10.1016/j.ssci.2015.01.010.
Ajienka JA, Owolabi OO. Application of mass balance of kick fluid in
well control. J Pet Sci Eng. 1991;6(2):161–74. https://doi.org/10.
1016/0920-4105(91)90035-L.
Avelar CS, Ribeiro PR, Sepehrnoori K. Deepwater gas kick
simulation. J Pet Sci Eng. 2009;67(1–2):13–22. https://doi.org/
10.1016/j.petrol.2009.03.001.
Boxwell RJ Jr. Benchmarking for competitive advantage. New York:
McGraw-Hill; 1994.
Bhandari J, Abbassi R, Garaniya V, Khan F. Risk analysis of
deepwater drilling operations using Bayesian network. J Loss
Prev Process Ind. 2015;38:11–23. https://doi.org/10.1016/j.jlp.
2015.08.004.
Cai B, Liu Y, Liu Z, Tian X, Zhang Y, Liu J. Performance evaluation
of subsea blowout preventer systems with common-cause
failures. J Pet Sci Eng. 2012;90:18–25. https://doi.org/10.1016/
j.petrol.2012.04.007.
Camp RC. Business process benchmarking: finding and implementing
best practices. Milwaukee: ASQ Quality Press; 1995.
Huse, JR, Alme, IA. BOP reliability monitored real time. Paper
presented at the SPE European HSE conference and exhibition
held in London, UK; 2013. https://doi.org/10.2118/164987-MS.
Januarilham, Y. Analysis of component criticality in the blowout
preventer. Master’s Thesis presented at the University of
Stavanger, Faculty of Science and Technology; 2012. http://
hdl.handle.net/11250/182183.
Ji Z, Johnson WR, Wikel GL. Statistics of extremes in oil spill risk
analysis. Environ Sci Technol. 2014;48(17):10505–10. https://
doi.org/10.1021/es501515j.
Khakzad N, Khan F, Amyotte P. Quantitative risk analysis of offshore
drilling operations: a Bayesian approach. Saf Sci.
2013;57:108–17. https://doi.org/10.1016/j.ssci.2013.01.022.
Mendes JRP, Morooka CK, Guilherme IR. Case-based reasoning in
offshore well design. J Pet Sci Eng. 2003;40(1–2):47–60. https://
doi.org/10.1016/S0920-4105(03)00083-4.
Miura K, Morooka CK, Mendes JRP, Guilherme IR. Characterization
of operational safety in offshore oil wells. J Pet Sci Eng.
2006;51(1–2):111–26. https://doi.org/10.1016/j.petrol.2005.11.
018.
Nihoul C, Ducrotoy J. Impact of oil on the marine environment:
policy of the Paris Commission on operational discharges from
the offshore industry. Mar Pollut Bull. 1994;29(6–12):323–9.
https://doi.org/10.1016/0025-326X(94)90648-3.
OREDA. Offshore reliability data handbook, 41th ed. SINTEF,
Trondheim; 2002.
Østby, P. Improvement of response time and cutting capability of
blow out preventer (BOP), Master’s Thesis presented at the
Norwegian University of Science and Technology, Department
430 Petroleum Science (2018) 15:421–431
123

of Energy and Process Engineering; 2008. http://hdl.handle.net/
11250/235064.
Paula Jr, RR, Fonseca, DR. Emergency disconnection guidelines.
Paper presented at the offshore technology conference Brazil
held in Rio de Janeiro, Brazil; 2013. http://dx.doi.org/10.4043/
24418-MS.
Sattler, J, Lewis, E. Qualitative risk analysis of emergency BOP
control systems to ensure availability. Paper presented at IADC/
SPE drilling conference held in, Dallas, Texas; 2004. http://dx.
doi.org/10.2118/87157-MS.
Stapenhurst T. The benchmarking book: a how-to-guide to best
practice for managers and practitioners. Kidlington: Elsevier;
2009.
Vujasinovic AN. How blowout preventers work. J Pet Technol.
1986;38(09):935–7. https://doi.org/10.2118/15795-PA.
Petroleum Science (2018) 15:421–431 431
123