Embed Size (px)
Citation preview

www.a2a.eu
Integrated Report Supplement 2016

The EPCG Group
Governance
Risks and opportunities
Stakeholder engagement and materiality analysis
Financial capital
Manufacturing capital
Natural capital
Human capital
Relational capital
Supplement - A2A 2016 Integrated Report 19
Figure 24 | Statement of calculation of global value added [G4-EC1_EC4]
(millions of euro) 2014 2015 2016
+A) Production value 4,984 4,921 5,093
Revenue from sales and services (- revenue adjustments)
4,742 4,715 4,808
Change in inventory of products in progress, semi-finished products and finished products
- - -
Change in contract work in progress 19 17 5
Other revenue and income 223 189 280
Government grants - - -
- B) Intermediate production costs consumption 3,472 3,623 3,526
Raw materials and consumables consumption 158 169 181
Energy and fuel 2,210 2,135 2,010
Costs for services 698 704 790
Other operating costs 86 78 108
Bad debt provision for current receivables 27 22 24
Provisions for risks 30 57 61
Other write-downs of fixed assets 159 359 261
Sundry operating expenses 123 117 105
Material own work capitalised -19 -18 -14
GROSS CORE VALUE ADDED 1,512 1,298 1,567
- C) Financial balance -64 -12 -41
Financial income 7 9 16
Financial expenses other than interest on loans -26 -17 -53
Unrealised gains and losses on equity investments in associates
-45 -4 -4
- D) Auxiliary and extraordinary components -56 -23 108
+/- auxiliary balance -65 -22 52
+/- extraordinary balance 9 -1 56
GROSS GLOBAL VALUE ADDED 1,392 1,263 1,634
- Depreciation and amortisation 446 395 429
NET GLOBAL VALUE ADDED 946 868 1,205
Financial capital

Financial capital
20 A2A 2016 Integrated Report - Supplement
Figure 25 | Statement of distribution of gross global value added - millions of euro [G4-EC1_EC4]
2014 2015 2016
REMUNERATION OF PERSONNEL 493 466 477
Wages and salaries 412 414 416
Employees’ leaving entitlement (TFR) 25 25 26
Other costs 56 27 35
REMUNERATION OF EQUITY CAPITAL 121 -17 141
Profits distributed 102 113 126
Minority net profit for the year 19 -130 15
REMUNERATION OF DEBT CAPITAL 146 125 117
TRANSFERS TO THE GOVERNMENT 234 261 304
Direct taxes for the Treasury 77 97 139
Other taxes and duties for the Treasury 1 1 1
Social security charges 156 163 164
TRANSFERS TO THE LOCAL COMMUNITY 91 73 68
Direct taxes for local authorities 37 14 28
Local taxes and duties 49 54 36
Sponsorships 2 2 1
Contributions to AEM and ASM foundations, aid, donations and charity 3 3 3
COMPANY REMUNERATION 307 355 527
Reserves -139 -40 98
Depreciation and amortisation 446 395 429
GROSS GLOBAL VALUE ADDED 1,392 1,263 1,634
Figure 26 | Gross operating margin by business unit - millions of euro
2014 2015 2016
Generation and Trading 328 348 404
Commercial 87 102 144
Environment 222 210 240
Networks and Heat 61 353 397
EPCG 66 53 69
Other services and corporate -21 -18 -23
Total 743 1,048 1,231
Figure 27 | Balance sheet - millions of euro
2014 2015 2016
Net fixed capital 6,194 5,829 6,129
Working capital 348 180 277
Assets/liabilities held for sale - 147 1
Net capital employed 6,542 6,156 6,407
Shareholders’ equity 3,179 3,259 3,271
- Attributable to the Group 2,579 2,646 2,717
- Attributable to minorities 600 613 554
Net financial position 3,363 2,897 3,136
Total sources 6,542 6,156 6,407
Gross debt 4,124 3,815 3,817

The EPCG Group
Governance
Risks and opportunities
Stakeholder engagement and materiality analysis
Financial capital
Manufacturing capital
Natural capital
Human capital
Relational capital
Supplement - A2A 2016 Integrated Report 21
Figure 28 | Main financial indicators
2014 2015 2016
Turnover by permanent worker (millions of euro) 0.41 0.4 0.38
GOM per permanent worker (millions of euro) 0.08 0.09 0.09
Average number of permanent workers 12,212 12,338* 13,438
* Updated figure with respect to the 2015 Sustainability Report.
Figure 29 | CAPEX - Capital expenditures by business unit - millions of euro
2014 2015 2016
Generation and Trading 42 65 36
Commercial 6 4 8
Environment 41 59 79
Networks and Heat 183 177 213
International 25 27 27
Other services and corporate 10 9 23
Total 307 341 386
Figure 30 | Share performance
2014 2015 2016
Average capitalisation (millions of euro) 2,639 3,405 3,685
Capitalisation at December 31 (millions of euro) 2,624 3,929 3,853
Average volumes 15,847,798 17,204,368 11,140,269
Average share price* (euros per share) 0.842 1.087 1.176
Maximum share price* (euros per share) 1.029 1.352 1.287
Minimum share price* (euros per share) 0.701 0.792 0.956
* Euros per share (source: Bloomberg)

22 A2A 2016 Integrated Report - Supplement
Manufacturing capital
Energy production
Figure 31 | Average availability factor for all plants [G4 - EU30]
Average availability factor (%) 2014 2015 2016
Traditional coal-powered 80% 81% 89%Traditional heavy fuel oil 85% 73% 80%Combined cycle natural gas 79% 68% 79%Run-of-the river hydroelectric 79% 76% 78%Basin hydroelectric 76% 86% 88%Storage hydroelectric 85% 78% 88%
Figure 32 | Net electricity generated by type of plant and source - GWh [G4-EU2]
2014 2015 2016
Generation and Trading Business Unit
Thermoelectric plantsHigh-yield natural gas combined cycle
2,252 3,797 4,424
Multi-fuel plants 3,192 4,333 3,448Hydroelectric plants 6,066 4,451 4,218Photovoltaic plants (including energy consumed)
3 3 3
Networks and Heat Business Unit
Cogeneration plants229 229 187
Environment Business Unit
Waste-to-energy plants (including biogas) and natural gas boilers
1,095 979 1,002
Total 12,837 13,792 13,282
Figure 33 | Net heat energy generated by type of plant and source - GWh [G4-EU2]
2014 2015 2016Environment Business Unit
Waste-to-energy plants (including biogas) and natural gas boilers
1,066 1,238 1,348
Networks and Heat Business Unit
Cogeneration plants 527 576 480Natural gas heating plants 331 411 421Renewable source heating plants (heat pumps, biogas engines and solar panels)
25 23 30
Generation and Trading Business Unit Heat recovery
0 23 20
Total 1,949 2,271 2,299
Figure 34 | Percentages of electricity generated by type of source [G4-EU2]
2014 2015 2016Renewable sources (hydraulic, renewable fraction of waste*, biogas, solar)
51.7% 36.0% 35.6%
Coal 14.3% 16.2% 17.5%Natural gas** 19.3% 28.4% 33.9%Petroleum products 10.6% 16.0% 9.3%Non-renewable fraction of waste 4.1% 3.4% 3.7%
* For non-hazardous waste, a renewable fraction of 51% was assumed (ref. Decree of the Ministry of Economic Development of December 18, 2008). Consequently, the non-renewable fraction was assumed to be 49%.
** The 2014 and 2015 figures have been modified since they did not take account of energy produced by cogeneration.

The EPCG Group
Governance
Risks and opportunities
Stakeholder engagement and materiality analysis
Financial capital
Manufacturing capital
Natural capital
Human capital
Relational capital
Supplement - A2A 2016 Integrated Report 23
Figure 35 | Energy generated by waste-to-energy processes [G4-EU2]
2014 2015 2016
Heat energy from waste-to-energy and biogas
52.6% 51.7% 55.7%
Electricity from waste-to-energy and biogas
8.5% 7.1% 7.5%
* The figure 2015 has been modified since it did not consider the electricity generated by the Verziano plant.
Figure 36 | Energy performance [G4-EN5_G4-EU11]
2014 2015 2016
Average yield of thermoelectric plants 37.9% 39.0% 41.1%Yield of high-yield natural gas combined cycle plants
47.3% 49.0% 49.9%
Yield of multi-fuel plants 33.2% 33.2% 33.6%Average yield of cogeneration of fossil fuel plants
81.0% 80.3% 78.0%
Average electricity generated from 1 t of waste (KWh/t)
828 773 803
Average heat energy generated from 1 t of waste (KWh/t)
722 899 918
Electricity distribution
Figure 37 | Electricity, heat and gas injected into the network [G4-EU12]
2014 2015 2016
Electricity distributed (GWh) 10,782 10,227 11,027Network electricity losses (GWh) 192 383 323Heating and cooling energy (GWh) 1,993 2,324 2,351Natural gas* (Mm3) 1,809 1,995 2,010
* Includes natural gas supplied directly to users by Retragas.
Figure 38 | Public lighting - number
2014 2015 2016
Light points 204,498 206,587 210,805Light towers 466 465 462Lampposts 139,427 135,656 137,855Suspended lights 11,214 11,291 11,304Lighted complexes 98 127 130
Figure 39 | Traffic lights (Milan) - number
2014 2015 2016
Traffic light regulators 726 728 729Supports 11,288 11,541 11,600Traffic lights 22,044 22,368 22,397Lamps 65,662 66,674 66,776

Manufacturing capital
24 A2A 2016 Integrated Report - Supplement
Figure 40 | Security systems (Milan) - number
2014 2015 2016
Video cameras 1,573 1,716 1,902Traffic monitoring 160 - -SoS stations 174 174 196Monitoring stations N/A 45 48Digital islands 27 29 29Wi-Fi antennae 1,100 900 1,140Remote natural gas reading concentrators - - 170Environmental sensors installed - - 50
Integrated water cycle
Figure 41 | Procurement and distribution
2014 2015 2016Wells (no.) 262 261 262Springs (no.) 232 243 243Drinking water plants (no.) 67 63 65Total network length (km) 4,747 4,814 4,878Water supplied to users (Mm3)* 68 63 62Water withdrawn (Mm3) 112 120 112Network leaks and unmetered water (Mm3)** 33 39 38Potability analysis – samples (no.) 19,266 21,966 19,567Potability analysis – total parameters (no.) 268,235 260,211 264,454
* Until 2014 the figure included water actually supplied but not metered. Starting in 2015, the figure refers to actual water supplied to users and metered.
** Until 2014 the figure referred solely to network losses.
Figure 42 | Collection and treatment
2014 2015 2016
Sewers - network length (km) 2,155 2,186 2,203Waste water treated (Mm3) 57 49 46Treatment facilities (no.) 59 57 54Loads treated – COD (t) 13,235 14,941 17,905Loads treated – BOD (t) 6,180 6,799 8,339Loads treated - Total nitrogen (t) 1,469 1,712 1,780Loads treated - Phosphorus (t) 206 222 244

The EPCG Group
Governance
Risks and opportunities
Stakeholder engagement and materiality analysis
Financial capital
Manufacturing capital
Natural capital
Human capital
Relational capital
Supplement - A2A 2016 Integrated Report 25
Waste management
Figure 43 | Waste collected, transported and intermediated - t
2014 2015 2016
Urban waste collected 1,232,906* 1,282,786 1,320,938Special waste intermediated 134,805 159,261 109,790
* Updated figure with respect to the 2015 Sustainability Report.
Figure 44 | Waste treated by type of facility* - t
2014 2015 2016
Waste-to-energy plants 1,342,222 1,385,574 1,411,423Landfills 465,198 397,324 192,451Bio-drying plants and production of RDF 451,258 468,449 480,834Other recovery plants 390,536 471,227 502,542Total 2,649,214 2,722,574 2,587,250
* All incoming waste to the Group’s plants is considered.

26 A2A 2016 Integrated Report - Supplement
Natural capital
Resources and materials used
Figure 45 | Resources used in the Generation and Trading Business Unit [G4-EN1_ EN3_ EN4_EN8]
2014 2015 2016
Fuel (TJ)Natural gas 17,249 27,758 31,661Coal 18,928 22,100* 23,315Petroleum derivatives (heavy fuel oil, diesel) 16,375* 25,856* 14,771Automotive fuels (TJ)Petrol 2.9 0.8 1.5Diesel 3.9 7.9 5.1Methane 0.5 - -Electricity (TJ) 837 578 618Water resources consumed (thousands of m3)From aqueducts 104 106 87From wells 2,728 3,122 3,239From surface water 987 1,064 660Chemical products and materials (t) Mineral acids 304 288 307Water additives/conditioners 154 95 77Ammonia (solution) 464 906 1,191Lime and sold neutralisers 26,412 36,884 30,399Active carbon - - - Cement, sand and inert materials - - - Sodium chloride 4 - 5Technical gases (nitrogen, CO2, hydrogen and oxygen) 54 32 39Sodium hydroxide (solution) 196 267 227Methane, solvents and other products 9 8 8Odorants - - - Oils and lubricants 57 7,149 98Urea (solution) - - -
* Updated figures with respect to the 2015 Sustainability Report.

The EPCG Group
Governance
Risks and opportunities
Stakeholder engagement and materiality analysis
Financial capital
Manufacturing capital
Natural capital
Human capital
Relational capital
Supplement - A2A 2016 Integrated Report 27
Figure 46 | Resources used in the Environment Business Unit [G4-EN1_ EN3_ EN4_EN8]
2014 2015 2016
Fuel (TJ)Natural gas 393* 463* 464Petroleum derivatives (heavy fuel oil and diesel) 30 27 24Waste, biomass and CSS 16,063 15,572 15,889Biogas (from landfills and treatment facilities) 782 683 624Automotive fuels (TJ)Petrol 5 6 6Diesel 346 379 398Methane 94 99 96Electricity (TJ) 178* 220* 189Water resources consumed (thousands of m3)From aqueducts 857* 898* 871From wells 2,746 2,649* 2,495Chemical products and materials (t) Mineral acids 1,236 1,748 1,771Water additives/conditioners 290 291 310Ammonia (solution) 4,973 4,739 5,223Lime and solid neutralisers 24,527 22,768 26,068Active carbon 924 1,064 1,052Cement, sand and inert materials 231,436 161,030 136,605Sodium chloride 102 2,434* 98Technical gases (nitrogen, CO2, hydrogen and oxygen)
717 851 848
Sodium hydroxide (solution) 2,424 3,386 3,131Methanol, solvents and other products 1,703 1,074 1,486Odorants - - - Oils and lubricants 263 76 58Urea (solution) 1,873 1,714 1,139
* Updated figures with respect to the 2015 Sustainability Report..

Natural capital
28 A2A 2016 Integrated Report - Supplement
Figure 47 | Resources used in the Networks and Heat Business Unit [G4-EN1_ EN3_ EN4_EN8]
2014 2015 2016
Fuel (TJ)Natural gas 3,133* 3,356* 2,804Coal 1,593 1,812 1,846Petroleum products (diesel) 0.1* 0.3 0.5Biogas (from the Group’s treatment facilities) 8 8 7Automotive fuels (TJ)Petrol 11.4 11.8 11.8Diesel 19.5 17.6 17.7Methane 12.9 10.4 10.0Electricity (TJ) 481 493 465Heat energy (TJ - purchased from external sources) 913 1,216 1,385Water resources consumed (thousands of m3)From aqueducts 609* 722* 673From wells 2,930 1,990 1,857Chemical products and materials (t) Mineral acids 408 505 554Water additives/conditioners 7,867 8,098 8,581Ammonia (solution) - - - Lime and solid neutralisers 1,215 1,391 1,420Active carbon 52 60 50Cement, sand an inert materials - - - Sodium chloride 15 8 1Technical gases (nitrogen, CO2, hydrogen and oxygen) 166 153 162Sodium hydroxide (solution) 104 159 176Methanol, solvents and other products 583 633* 738Odorants 38 50 48Oils and lubricants 28 11 22Urea (solution) 492 474 439
Figure 48 | Resources used in the Corporate Business Unit [G4-EN1_ EN3_ EN4_EN8]
2014 2015 2016
Water (thousands of m3) 178 165 184Electricity (TJ) 53 64 61Fuel (TJ) Diesel - - - Methane 26 35 35Fuels (TJ) Petrol 1.4 1.6 1.5Diesel 9.7 12.1 11.6Methane 2.5* 2.0 1.8
* Updated figure with respect to the 2015 Sustainability Report.

The EPCG Group
Governance
Risks and opportunities
Stakeholder engagement and materiality analysis
Financial capital
Manufacturing capital
Natural capital
Human capital
Relational capital
Supplement - A2A 2016 Integrated Report 29
Effluents and Waste
Figure 49 | Industrial waste water - volumes - thousands of m3 [G4-EN22]
2014 2015 2016
Networks and Heat Business Unit
Discharged into sewers 233* 296* 372Discharged into surface water 168 151 170Recovered in the production cycle
3.1 1.5 3.8
Water used for cooling 64 14 18Generation and Trading Business Unit
Discharged into sewers - - -Discharged into surface water 2,378 2,180 2,131Recovered in the production cycle
1,138 1,364 1,088
Water used for cooling 1,021,832 1,488,828 1,172,849Water extracted for hydroelectric generation
6,106,498 3,659,612 2,432,901
Environment Business Unit
Discharged into sewers 439 402 284Discharged into surface water 960 1,405 1,402Recovered in the production cycle
376 384 363
Used for cooling 902 792 709
* Updated figure with respect to the 2015 Sustainability Report.
Figure 50 | Industrial waste water - discharges of pollutants into surface water - t [G4-EN22]
2014 2015 2016
Networks and Heat Business Unit BOD 1.2 0.9 0.9COD 3.3 2.6 3.3
Generation and Trading Business Unit BOD 10.5 10.4 14.0COD 47.8 38.4 47.6
Environment Business Unit BOD 15.3 26.4 26.5COD 49.7 82.9 114.4
Figure 51 | Non-hazardous special waste produced by the Group - t [G4-EN23]
2014 2015 2016
Networks and Heat Business Unit 30,355* 32,737* 32,333Generation and Trading Business Unit 66,198 53,848 36,040Environment Business Unit 498,791* 492,071* 443,791Corporate Business Unit 84 48 48Total 595,429 578,703 512,212
* Data updated with respect to the 2015 Sustainability Report to reflect different allocation of waste to BUs.

Natural capital
30 A2A 2016 Integrated Report - Supplement
Figure 52 | Hazardous special waste produced by the Group - t [G4-EN23_EN25]
2014 2015 2016
Networks and Heat Business Unit 120* 262* 275Generation and Trading Business Unit 4,221 4,522 4,903Environment Business Unit 85,395* 79,970* 84,306Corporate Business Unit 11 51 26Total 89,746 84,805 89,510
* The figures in question have been updated compared to the previous year to reflect a different allocation of waste to the BUs.
Figure 53 | Cross-border hazardous special waste exported by the Group - t [G4-EN23_EN25]
2014 2015 2016
Total* 21,237 21,530 24,012
* Including waste from treatment facilities (neutralisation).
Figure 54 | Special waste produced by the Group (hazardous and non-hazardous) sent for recovery [G4-EN23]
2014 2015 2016
Networks and Heat Business Unit 92% 90%* 92%Generation and Trading Business Unit 97% 66% 72%Environment Business Unit 41% 46% 47%Corporate Business Unit 97% 100% 90%A2A Group average figure. 49% 50%* 52%
* Updated figure with respect to the 2015 Sustainability Report.
Emissions
Figure 55 | Total emissions of CO2 from combustion processes - t [G4-EN15]
2014 2015 2016
Networks and Heat Business Unit 341,069* 365,706* 338,675Generation and Trading Business Unit 4,001,183 5,603,561* 5,047,153Environment Business Unit 992,436* 930,520* 904,171Corporate Business Unit 1,482 1,938* 1,940Total 5,336,172 6,901,725 6,291,939
* Updated figures with respect to the 2015 Sustainability Report.
Figure 56 | CO2 emissions from motor vehicles - t [G4-EN15]
2014 2015 2016
Networks and Heat Business Unit 2,926 2,734 2,721
Generation and Trading Business Unit 526 635 483
Environment Business Unit 31,279* 33,893 35,060
Corporate Business Unit 953 1,120 1,070
Total 35,684 38,382 39,334
* Updated figure with respect to the 2015 Sustainability Report.

The EPCG Group
Governance
Risks and opportunities
Stakeholder engagement and materiality analysis
Financial capital
Manufacturing capital
Natural capital
Human capital
Relational capital
Supplement - A2A 2016 Integrated Report 31
Figure 57 | Other emissions: greenhouse gases and ozone layer depleting substances- kg [G4-EN15_EN20]
2014 2015 2016
Sulphur hexafluoride (SF6) 60 65 86
R134a 2,002 1,453 1,277
R22 (HCFC22) 27 - 138
R407C 74 241* 297
R410A 108 209 221
R422 352 285 288
Other refrigerant fluids 90* 91 183
Methane (CH4) - losses from natural gas distribution networks**
19,077,148 21,228,448 21,326,185
Methane (CH4) – biogas losses released in landfills
1,946,418 1,683,126 1,753,297
* Updated figures with respect to the 2015 Sustainability Report.** Figure calculated as the difference between the amount injected into the network and the amount supplied or estimated.
Figure 58 | Total direct emissions (Scope 1) - tCO2eq
2014 2015 2016
Combustion 5,336,172 6,901,725* 6,291,939
Motor vehicles 35,684* 38,382 39,334
Fluoride gases 5,570* 5,183 6,005
Dispersion of methane from the distribution networks 534,160 594,397* 597,133
Dispersion of methane from landfills 54,500 47,128* 49,092
Total 5,966,086 7,586,815 6,983,503
* Updated figures with respect to the 2015 Sustainability Report.
Figure 59 | Indirect emissions of greenhouse gases - Scope 2 - t [G4-EN16]
2014 2015 2016
Networks and Heat Business Unit 45,523* 46,106* 41,854
Generation and Trading Business Unit 79,285 54,074 55,647
Environment Business Unit 16,889* 20,576* 16,982
Corporate Business Unit 5,051 5,967 5,454
Total 146,747 126,723* 119,937
* Updated figures with respect to the 2015 Sustainability Report.

Natural capital
32 A2A 2016 Integrated Report - Supplement
Figure 60 | Global impact indicators
2014 2015 2016
Total emissions of ozone layer depleting gases (KgR11eq) 0.9 - 4.7
Total acidifying emissions (tSO2eq) 3,365 3,865 3,372
Figure 61 | Impact indicators due to the purchase and use of fossil fuels [G4-EN33]
2014 2015 2016
Carbon footprint (tCO2eq/year) 730,829* 1,015,031* 863,223
Water footprint (thousands of m3 of water) 23,397* 35,215* 24,048
* Updated figure with respect to the 2015 Sustainability Report.
Figure 62 | Greenhouse gas emissions - t CO2 eq [G4-EN15_EN16_EN17_EN33]
2014 2015 2016
Total greenhouse gas emissions - Scope 1 5,966,086* 7,586,815* 6,983,503
Indirect greenhouse gas emissions - Scope 2 146,747 126,723* 119,937
Other indirect greenhouse gas emissions - Scope 3 1,437,635* 1,781,924* 1,638,017
* Updated figure with respect to the 2015 Sustainability Report.
Figure 63 | Total NOX emissions - t [G4-EN21]
2014 2015 2016
Networks and Heat Business Unit 193 210 203
Generation and Trading Business Unit 2,584 2,757 1,881
Environment Business Unit 631 611 621
Total 3,408 3,578 2,705
Figure 64 | Total particulate emissions - t [G4-EN21]
2014 2015 2016
Networks and Heat Business Unit 1 0.4 0.4
Generation and Trading Business Unit 84.4 106.6 113.7
Environment Business Unit 3.5 3.2 2.8
Total 89.0 110.3 116.9

The EPCG Group
Governance
Risks and opportunities
Stakeholder engagement and materiality analysis
Financial capital
Manufacturing capital
Natural capital
Human capital
Relational capital
Supplement - A2A 2016 Integrated Report 33
Figure 65 | Total SO2 emissions - t [G4-EN21]
2014 2015 2016
Networks and Heat Business Unit 127 144 118
Generation and Trading Business Unit 839 1,206 1,348
Environment Business Unit 13 11 16
Total 979 1,361 1,482
Figure 66 | Micro-pollutants [G4-EN21]
2014 2015 2016
Polycyclic aromatic hydrocarbons (kg) 0.63 0.09 0.06
Mercury (kg) 6 25 18
Other metals (Sb + As + Pb + Cr + Cu + Mn + Ni + V + Sn+Cd+Tl) (kg)
746* 513 495
Dioxins (grams - toxic equivalency) 0.020 0.024 0.016
Dioxin-like PCBs (polychlorinated biphenyls) (grams - toxic equivalency)
0.006 0.004 0.004
* Updated figure with respect to the 2015 Sustainability Report.
Figure 67 | 2016 environmental sanctions [G4-EN29]
2016
Number 3
Value (euro) 10,800
Descriptive note The only significant sanction (10,000 euros) concerns the failure to file with the EPRTR (European Pollutant Release and Transfer Register) by a production facility.
34 A2A 2016 Integrated Report - Supplement
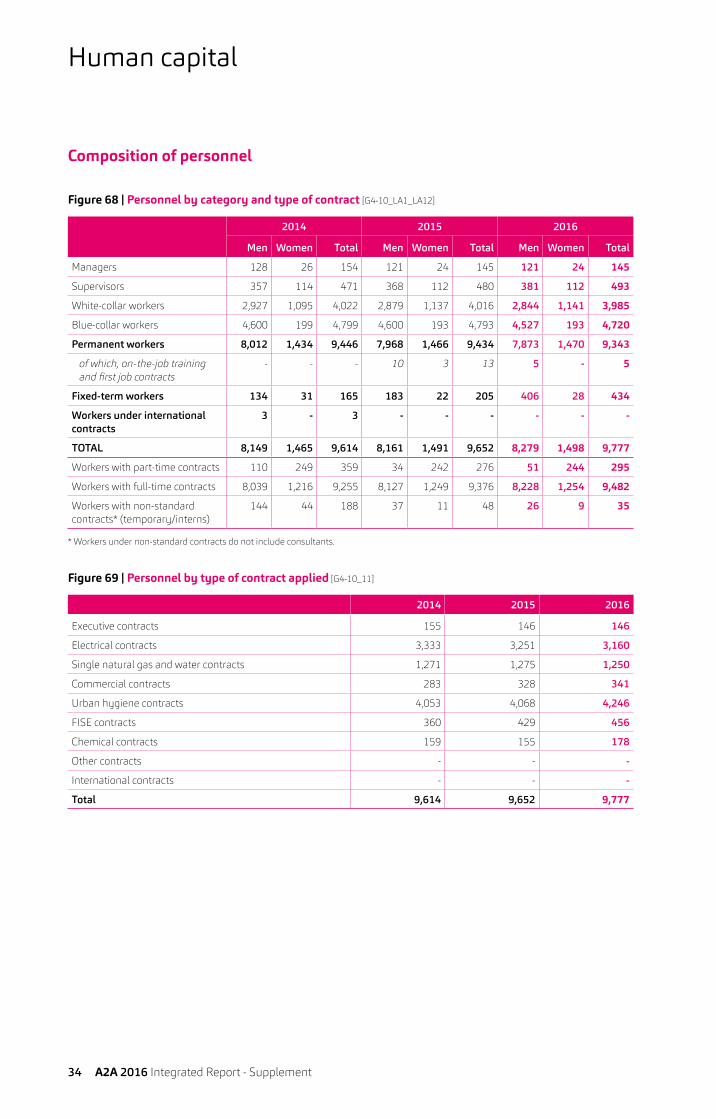
Composition of personnel
Figure 68 | Personnel by category and type of contract [G4-10_LA1_LA12]
2014 2015 2016
Men Women Total Men Women Total Men Women Total
Managers 128 26 154 121 24 145 121 24 145
Supervisors 357 114 471 368 112 480 381 112 493
White-collar workers 2,927 1,095 4,022 2,879 1,137 4,016 2,844 1,141 3,985
Blue-collar workers 4,600 199 4,799 4,600 193 4,793 4,527 193 4,720
Permanent workers 8,012 1,434 9,446 7,968 1,466 9,434 7,873 1,470 9,343
of which, on-the-job training and first job contracts
- - - 10 3 13 5 - 5
Fixed-term workers 134 31 165 183 22 205 406 28 434
Workers under international contracts
3 - 3 - - - - - -
TOTAL 8,149 1,465 9,614 8,161 1,491 9,652 8,279 1,498 9,777
Workers with part-time contracts 110 249 359 34 242 276 51 244 295
Workers with full-time contracts 8,039 1,216 9,255 8,127 1,249 9,376 8,228 1,254 9,482
Workers with non-standard contracts* (temporary/interns)
144 44 188 37 11 48 26 9 35
* Workers under non-standard contracts do not include consultants.
Figure 69 | Personnel by type of contract applied [G4-10_11]
2014 2015 2016
Executive contracts 155 146 146
Electrical contracts 3,333 3,251 3,160
Single natural gas and water contracts 1,271 1,275 1,250
Commercial contracts 283 328 341
Urban hygiene contracts 4,053 4,068 4,246
FISE contracts 360 429 456
Chemical contracts 159 155 178
Other contracts - - -
International contracts - - -
Total 9,614 9,652 9,777
Human capital

The EPCG Group
Governance
Risks and opportunities
Stakeholder engagement and materiality analysis
Financial capital
Manufacturing capital
Natural capital
Human capital
Relational capital
Supplement - A2A 2016 Integrated Report 35
Figure 70 | Personnel by workplace [G4-10]
Region 2014 2015 2016
Men Women Total Men Women Total Men Women Total
Abruzzo 52 6 58 51 5 56 51 5 56
Calabria 83 1 84 77 1 78 79 1 80
Campania 194 15 209 192 15 207 192 15 207
Emilia Romagna 49 7 56 45 6 51 47 6 53
Friuli Venezia Giulia 194 4 198 188 5 193 156 5 161
Lazio 2 2 4 2 2 4 2 1 3
Lombardy 7,264 1,407 8,671 7,290 1,427 8,717 7,491 1,440 8,931
Piedmont 64 13 77 99 24 123 78 21 99
Puglia 68 3 71 54 2 56 28 - 28
Sicily 169 4 173 158 4 162 151 4 155
Veneto 7 3 10 - - - - - -
International 3 - 3 5 - 5 4 - 4
Total 8,149 1,465 9,614 8,161 1,491 9,652 8,279 1,498 9,777
Figure 71 | Number of hires and turnover rate, by age, gender and geographical area* [G4-LA1]
Age brackets 2014 2015 2016
Men Women Total Men Women Total Men Women Total
Permanent workers
Up to age 30 14 10 24 132 54 186 83 12 95
From 31 to 40 18 10 28 71 12 83 67 8 75
From 41 to 50 26 3 29 35 3 38 36 6 42
Over 50 15 0 15 17 1 18 34 - 34
Fixed-term workers
Up to age 30 85 19 104 319 65 384 224 24 248
From 31 to 40 64 5 69 135 29 164 144 8 152
From 41 to 50 31 4 35 69 5 74 58 2 60
Over 50 9 - 9 27 1 28 22 - 22
Total 262 51 313 805 170 975 668 60 728
New hires as a percentage of total headcount (%)
3.2 3.5 3.3 9.9 11.4 10.1 8.1 4.0 7.4
* In 2014-2016 one male worker under age 30 was hired abroad under a fixed-term contract ( in 2014).

Human capital
36 A2A 2016 Integrated Report - Supplement
Figure 72 | Workers departures during the year and turnover rate, by gender and geographical area* [G4-LA1]
2014 2015 2016
Men Women Total Men Women Total Men Women Total
Retirement 91 8 99 177 11 188 133 7 140
Voluntary resignation 50 3 53 101 45 146 88 22 110
Decease 14 - 14 13 2 15 9 1 10
Dismissal 254 54 308 81 16 97 132 13 145
Other (e.g., end of fixed-term contract)
161 12 173 426 71 497 239 20 259
Total 570 77 647 798 145 943 601 63 664
Turnover rate** (%) 7.00 5.26 6.73 9.78 9.73 9.77 7.30 4.20 6.80
* Outside of Italy, one female contractor left in the three-year period 2014-2016 - in the “Other” category (2014).** The turnover rate was calculated according to the following formula: (departures) / (workforce) at December 31.
The term “departures” refers to the departures of workers due to retirement, voluntary resignation, decease or dismissal.
Figure 73 | Workers departures during the year and turnover rate, by age bracket and geographical area* [G4-LA1]
2014 2015 2016
Up to 30
31-41
41-50
Over 51
Total Up to 30
31-41
41-50
Over 51
Total Up to 30
31-41
41-50
Over 51
Total
Retirement - - - 99 99 - - - 188 188 - - - 140 140
Voluntary resignation
10 17 6 20 53 73 32 16 25 146 23 27 16 44 110
Decease - - 3 11 14 - 2 1 12 15 - 1 3 6 10
Dismissal 6 17 35 259 308 13 7 14 63 97 - 8 11 126 145
Other (e.g., end of fixed-term contract)
95 49 19 10 173 272 130 73 22 497 113 74 39 33 259
Total 111 83 63 399 647 358 171 104 310 943 136 110 69 349 664
Turnover rate** (%) 16.49 4.66 1.74 11.28 6.73 48.44 9.78 3.05 8.25 9.77 16.77 6.08 2.16 8.81 6.80
* Outside of Italy, one female contractor in the age bracket 31-41 left in 2014-2015 (2014).** The turnover rate was calculated according to the following formula: (departures) / (workforce) at December 31.
The term “departures” refers to the departures of workers due to retirement, voluntary resignation, decease or dismissal.
The EPCG Group
Governance
Risks and opportunities
Stakeholder engagement and materiality analysis
Financial capital
Manufacturing capital
Natural capital
Human capital
Relational capital
Supplement - A2A 2016 Integrated Report 37
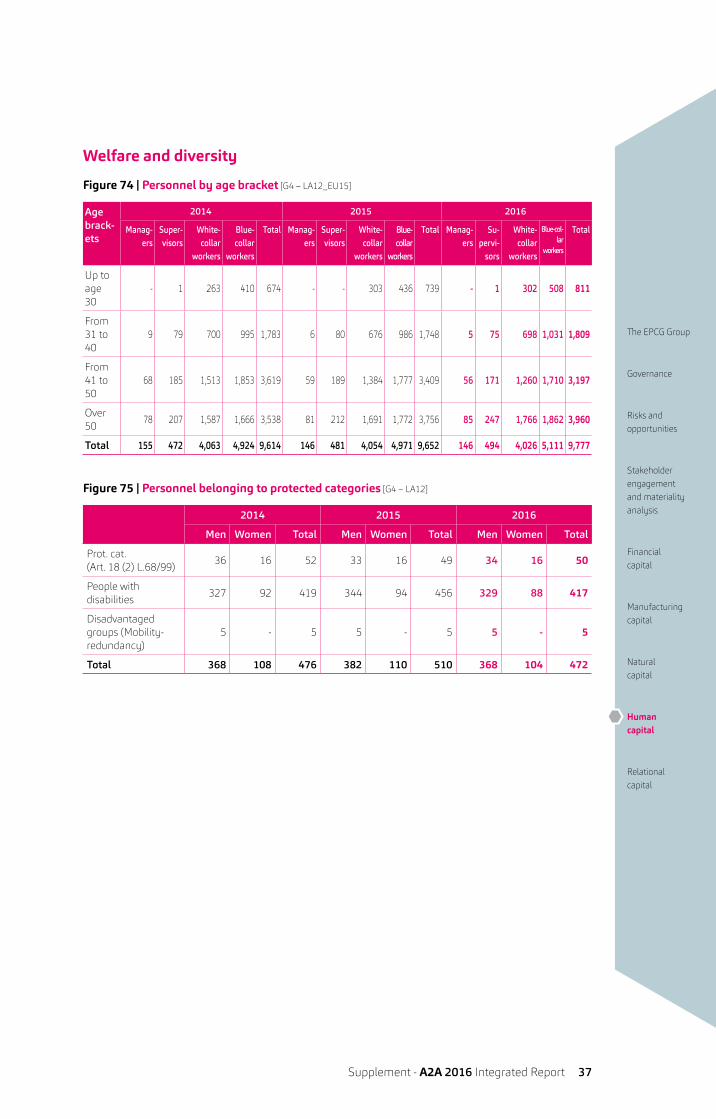
Welfare and diversity
Figure 74 | Personnel by age bracket [G4 – LA12_EU15]
Age brack-ets
2014 2015 2016
Manag-ers
Super-visors
White-collar
workers
Blue-collar
workers
Total Manag-ers
Super-visors
White-collar
workers
Blue-collar
workers
Total Manag-ers
Su-pervi-
sors
White-collar
workers
Blue-col-lar
workers
Total
Up to age 30
- 1 263 410 674 - - 303 436 739 - 1 302 508 811
From 31 to 40
9 79 700 995 1,783 6 80 676 986 1,748 5 75 698 1,031 1,809
From 41 to 50
68 185 1,513 1,853 3,619 59 189 1,384 1,777 3,409 56 171 1,260 1,710 3,197
Over 50
78 207 1,587 1,666 3,538 81 212 1,691 1,772 3,756 85 247 1,766 1,862 3,960
Total 155 472 4,063 4,924 9,614 146 481 4,054 4,971 9,652 146 494 4,026 5,111 9,777
Figure 75 | Personnel belonging to protected categories [G4 – LA12]
2014 2015 2016
Men Women Total Men Women Total Men Women Total
Prot. cat. (Art. 18 (2) L.68/99)
36 16 52 33 16 49 34 16 50
People with disabilities
327 92 419 344 94 456 329 88 417
Disadvantaged groups (Mobility-redundancy)
5 - 5 5 - 5 5 - 5
Total 368 108 476 382 110 510 368 104 472

Human capital
38 A2A 2016 Integrated Report - Supplement
Figure 76 | Personnel by position and company seniority [G4-EU15]
2014 2015 2016
Managers Supervisors White-collar workers
Blue-collar workers
TOTAL % Manag-ers
Super-visors
White-collar
workers
Blue-col-lar
workers
Total % Manag-ers
Supervi-sors
White-collar
workers
Blue-collar
workers
TOTAL %
Up to 10 years 60 143 1,082 2,083 3,368 35.1% 56 138 1,066 2,018 3,278 34.0% 58 145 1,066 2,142 3,411 34.9%
From 11 to 20 49 83 626 955 1,713 17.8% 44 100 671 1,107 1,922 19.9% 42 102 631 1,125 1,900 19.4%
From 21 to 30 38 173 1,655 1,434 3,300 34.3% 36 167 1,500 1,378 3,081 31.9% 35 160 1,495 1,403 3,093 31.7%
Over 30 8 73 700 452 1,233 12.8% 10 76 817 468 1,371 14.2% 11 87 834 441 1,373 14.0%
Total 155 472 4,063 4,924 9,614 100% 146 481 4,054 4,971 9,652 100% 146 494 4,026 5,111 9,777 100%
Figure 77 | Personnel by academic qualification
2014 2015 2016
Men Women Total % Men Women Total % Men Women Total %
Undergradu-ate degree
620 369 989 10.3% 653 390 1,043 10.8% 703 408 1,111 11.4%
Secondary school diploma
3,001 738 3,739 38.9% 3,153 763 3,916 40.6% 3,195 706 3,955 40.5%
Vocational degree
712 92 804 8.4% 611 83 694 7.2% 606 78 684 7.0%
Compulsory education
3,816 266 4,082 42.5% 3,744 255 3,999 41.4% 3,775 252 4,027 41.2%
Total 8,149 1,465 9,614 100.0% 8,161 1,491 9,652 100.0% 8,279 1,498 9,777 100.0%
Personnel training and development
Figure 78 | Training by position [G4-LA9]
2014 2015 2016
Number of hours
Average annual hours
of training per employee
Number of hours
Average annual hours
of training per employee
Number of hours
Average annual hours
of training per employee
Managers 2,387 15.4 2,805 19.2 4,322 29.6
Supervisors 13,110 27.8 11,700 24.3 15,935 32.3
White-collar workers 76,752 18.9 61,629 15.2 78,124 19.4
Blue-collar workers 51,473 10.5 63,425 12.8 65,443 12.8
Total 143,722 14.9 139,559 14.5 163,824 16.8
Figure 79 | Training by gender* [G4-LA9]
2014 2015 2016
Number of hours
Average hours per employee
Number of hours
Average hours per employee
Number of hours
Average hours per employee
Men 124,154 15.24 121,322 14.9 144,317 17.4
Women 19,568 13.36 18,237 12.2 19,507 13
* The number of personnel as at December 31 was used to calculate the average hours of training per employee.

The EPCG Group
Governance
Risks and opportunities
Stakeholder engagement and materiality analysis
Financial capital
Manufacturing capital
Natural capital
Human capital
Relational capital
Supplement - A2A 2016 Integrated Report 39
Figure 76 | Personnel by position and company seniority [G4-EU15]
2014 2015 2016
Managers Supervisors White-collar workers
Blue-collar workers
TOTAL % Manag-ers
Super-visors
White-collar
workers
Blue-col-lar
workers
Total % Manag-ers
Supervi-sors
White-collar
workers
Blue-collar
workers
TOTAL %
Up to 10 years 60 143 1,082 2,083 3,368 35.1% 56 138 1,066 2,018 3,278 34.0% 58 145 1,066 2,142 3,411 34.9%
From 11 to 20 49 83 626 955 1,713 17.8% 44 100 671 1,107 1,922 19.9% 42 102 631 1,125 1,900 19.4%
From 21 to 30 38 173 1,655 1,434 3,300 34.3% 36 167 1,500 1,378 3,081 31.9% 35 160 1,495 1,403 3,093 31.7%
Over 30 8 73 700 452 1,233 12.8% 10 76 817 468 1,371 14.2% 11 87 834 441 1,373 14.0%
Total 155 472 4,063 4,924 9,614 100% 146 481 4,054 4,971 9,652 100% 146 494 4,026 5,111 9,777 100%
Figure 80 | Health and safety training
2014 2015 2016
Training hours 79,282 84,689 86,492
Figure 81 | Training costs
2014 2015 2016
Millions of euro 1.95 2.04 1.80
Figure 82 | Employees trained during the year
2014 2015 2016
Percentage of the total 83% 75% 87%
Figure 83 | Percentage of employees who regularly receive performance assessments [G4-LA11]
2014 2015 2016
Percentage of the total 46% 48% 47%
Figure 84 | Number of employees of third companies involved in health and safety training activities
No. employees involved
Training hours provided
2014 93 372
2015 n.a. n.a.
2016 1,691 6,011

Human capital
40 A2A 2016 Integrated Report - Supplement
Health and safety at work
Figure 85 | Accident data [G4-LA6]
GENERATION AND TRADING BU
ENVIRONMENT BU NETWORKS AND HEAT BU COMMERCIAL BU CORPORATE BU OTHER COMPANIES A2A TOTAL
2014 2015 2016 2014 2015 2016 2014 2015 2016 2014 2015 2016 2014 2015 2016 2014 2015 2016 2014 2015 2016
No. accidents (excluding commuting)
15 8 4 449 417 471 42 33 46 1 1 3 9 3 2 10 13 30 526 475 556
No. of days of absence 854 238 91 11,034 10,366 10,765 1,126 844 1,306 11 40 74 95 89 19 500 417 1,068 13,620 11,951 13,323
Average duration 56.9 29.75 22.75 24.57 24.86 22.86 26.81 25.58 28.39 11 40 24.67 10.56 29.67 9.5 50 32.08 35.6 25.89 25.16 23.96
Frequency index FI 6.9 4.01 2.21 62.26 53.56 62.60 11.67 9.36 13.13 1.45 1.43 3.91 6.63 5.14 54.69 19.58 25.13 1.42 34.00 29.79 35.72
Severity index SI* 0.4 0.12 0.05 1.53 1.38 1.43 0.31 0.24 0.37 0.02 0.06 0.10 0.07 0.06 1.95 0.98 0.81 0.01 0.88 0.78 0.86
Incidence index II* 10.9 6.56 3.58 12.61 13.82 13.51 19.44 15.72 8.55 2.23 2.19 14.20 13.73 5.59 12.83 - 12.35 5.87 10.53 10.46 11.00
Commuting accidents* 2 - 4 58 67 64 24 22 18 7 6 7 12 5 12 - 4 2 103 104 107
* The figures for the Environment BU (and thus also the total figures) have been modified for 2014 and 2015 due to a change in the calculation method.
When calculating indices, only professional accidents that result in at least one day of absence, not including the day of the event, are considered. Medications and precautionary absences and unrecognised accidents are therefore excluded. Professional accidents also include those that occur in transit, with or without a vehicle. All accidents involving workers are considered, regardless of the type of work (e.g., temporary labour contract). Commuting accidents: accidents suffered by workers while commuting from home to work and vice-versa (but not while in service).
FI = frequency index (no. accidents x 1,000,000: hours worked) SI = severity index (no days of absence x 1,000: hours worked) II = incidence index (no accidents x 1,000: headcount): it is calculated on the number of commuting accidents. Commuting accidents: accidents suffered by workers while commuting from home to work and vice-versa (but not while in service).
Figure 86 | Number of professional accidents by gender
Gender No. of accidents
2014 Women 47
Men 479
2015 Women 38
Men 437
2016 Women 50
Men 506
Figure 87 | Accident indices for contractors and subcontractors in construction and maintenance work [G4-EU17]
No. of hours worked by
contractors
No. of accidents Days lost Frequency index Severity index
2014 1,526,436 9 150 5.9 0.1
2015 1,776,465 15 467 8.44 0.26
2016 1,720,753 11 464 6.39 0.27
Figure 88 | Health data for 2016 by BU
Generation and Trading BU
Commercial BU Environment BU Networks and Heat BU
Corporate BU
No. visits 722 152 4,119 1,513 454
No. audits 1,414 95 7,604 1,793 366

The EPCG Group
Governance
Risks and opportunities
Stakeholder engagement and materiality analysis
Financial capital
Manufacturing capital
Natural capital
Human capital
Relational capital
Supplement - A2A 2016 Integrated Report 41
Health and safety at work
Figure 85 | Accident data [G4-LA6]
GENERATION AND TRADING BU
ENVIRONMENT BU NETWORKS AND HEAT BU COMMERCIAL BU CORPORATE BU OTHER COMPANIES A2A TOTAL
2014 2015 2016 2014 2015 2016 2014 2015 2016 2014 2015 2016 2014 2015 2016 2014 2015 2016 2014 2015 2016
No. accidents (excluding commuting)
15 8 4 449 417 471 42 33 46 1 1 3 9 3 2 10 13 30 526 475 556
No. of days of absence 854 238 91 11,034 10,366 10,765 1,126 844 1,306 11 40 74 95 89 19 500 417 1,068 13,620 11,951 13,323
Average duration 56.9 29.75 22.75 24.57 24.86 22.86 26.81 25.58 28.39 11 40 24.67 10.56 29.67 9.5 50 32.08 35.6 25.89 25.16 23.96
Frequency index FI 6.9 4.01 2.21 62.26 53.56 62.60 11.67 9.36 13.13 1.45 1.43 3.91 6.63 5.14 54.69 19.58 25.13 1.42 34.00 29.79 35.72
Severity index SI* 0.4 0.12 0.05 1.53 1.38 1.43 0.31 0.24 0.37 0.02 0.06 0.10 0.07 0.06 1.95 0.98 0.81 0.01 0.88 0.78 0.86
Incidence index II* 10.9 6.56 3.58 12.61 13.82 13.51 19.44 15.72 8.55 2.23 2.19 14.20 13.73 5.59 12.83 - 12.35 5.87 10.53 10.46 11.00
Commuting accidents* 2 - 4 58 67 64 24 22 18 7 6 7 12 5 12 - 4 2 103 104 107
Figure 89 | Percentage of workers represented in formal health and safety committees [G4-LA5]
2014 2015 2016
Percentage of the total 100% 100% 100%
Absenteeism
Figure 90 | Absenteeism: working days lost [G4-LA6]
2014 2015 2016
No. days
% incidence
Working days
per staff member
No. days
% incidence
Working days
per staff member
No. days
% incidence
Working days
per staff member
Illness 109,949 4.6% 11.2 109,510 4.8% 11.1 111,989 5.0% 11.5
Unpaid leave/absence
6,820 0.3% 0.7 8,301 0.4% 0.8 7,442 0.3% 0.8
Company strikes
105 0.0% 0.01 398 0.0% 0.04 3,135 0.1% 0.3
National strikes
1,458 0.1% 0.2 68 0.0% 0.01 439 0.0% 0.04
Accidents* 16,260 0.7% 1.7 14,113 0.6% 1.4 14,867 0.7% 1.5
Total 134,592 5.6% 13.8 132,390 5.8% 13.5 137,871 6.1% 14.1
* It should be noted that the figures presented in this table refer solely to working days lost due to accidents and not to calendar days lost, which are used to calculate the severity index.
2014 2015 2016
Average number of employees in service 9,789 9,829 9,748
Total working days* 2,413,114 2,398,493* 2,253,718
Total hours worked 15,578,853 15,888,689 15,622,092
Per capita days of absence out of total possible working days
5.3% 5.5% 5.8%
Annual average per capita days of absence 13.75 13.47 14.14
* The figures for 2015 and 2016 are not comparable with the figure for 2014 because the method of calculation was changed. In 2014 the number of working days was calculated by multiplying the number of possible working days during the year by the number of employees at December 31. The figures for 2015 and 2016 were calculated by adding the number of working days to the number of days of absence.

Human capital
42 A2A 2016 Integrated Report - Supplement
Figure 91 | Number of working days lost by gender [G4-LA6]
2014 2015 2016
Men Women Men Women Men Women
Illness 92,196 17,752 92,800 16,710 94,360 17,629
Unpaid leave/absence 4,990 1,830 6,569 1,732 5,761 1,681
Company strikes 78 2 316 82 2,926 209
National strikes 1,463 161 65 2 410 29
Accidents 14,544 1,716 12,959 1,154 12,884 1,983
Total 113,271 21,461 112,709 19,680 116,340 21,531
Figure 92 | Lost days rate* (number of total days lost to accident or illness of total hours worked by the workforce during the reporting period) [G4-LA6]
2014 2015 2016
Hours lost due to occupational illness** - - -
Hours lost to accidents 105,627 92,261 90,962
Lost days rate 0.68% 0.58% 0.58%
* “Lost days” are days that cannot be worked due to an accident or occupational illness. They are not counted if there is a partial return to working activity.
** “Occupational illness” is defined as an illness caused by the working environment or professional activity (e.g., stress or regular exposure to harmful chemical substances) or resulting from an accident.
Figure 93 | Parental leave [G4-LA3]
2014 2015 2016*
Men Women Men Women Men Women
Employees who took parental leave 68 117 102 128 119 133
of whom, employees who returned to work in 2014
55 85 - - - -
of whom, employees who returned to work in 2015
13 31 80 87 - -
of whom, employees who returned to work in 2016
- 1 19 38 103 103
* Employees who have not yet returned to work in 2016 have not necessarily left service; their period of leave may be ongoing.

The EPCG Group
Governance
Risks and opportunities
Stakeholder engagement and materiality analysis
Financial capital
Manufacturing capital
Natural capital
Human capital
Relational capital
Supplement - A2A 2016 Integrated Report 43
Figure 94 | Union membership
2014 2015 2016
no. % no. % no. %
Italy - members of union federations
3,738 38.9% 3,716 38.5% 3,424 35.0%
Italy - members of other unions
1,265 13.2% 1,105 11.4% 1,062 10.9%
Employees not enrolled in unions
4,608 47.9% 4,826 50.0% 5,287 54.1%
International - Employees not enrolled in unions
3 0.0% 5 0.1% 4 0.0%
Total 9,614 100.0% 9,652 100.0% 9,777 100.0%
Figure 95 | Hours of strikes
2014 2015 2016
Total strike hours
Strike hours per capita*
Total strike hours
Strike hours per capita*
Total strike hours
Strike hours per capita*
No. of hours 10,848 1.11 3,526 0.4 22,700 2
* Per capita hours are calculated on the average headcount.
Figure 96 | Contributions to recreational and welfare associations [G4_LA2]
2014 2015 2016
Total 4,741,928 4,591,981 4,631,251

44 A2A 2016 Integrated Report - Supplement
Relations with customers
Electricity and natural gas sales service
Figure 97 | Electricity supply contracts by type of market [G4 - EU3]
2014 2015 2016Protected market 767,781 717,353 674,551Free market 202,627 267,717 321,746Total 970,408 985,070 996,297
Figure 98 | Electricity supply contracts by type of customer [G4 - EU3]
2014 2015 2016Domestic 795,136 804,341 820,420SME 112,395 119,864 111,179Large customers 28,765 27,021 30,954Condominiums 34,112 33,844 33,744Total 970,408 985,070 996,297
Figure 99 | Natural gas supply contracts by type of market [G4 - EU3]
2014 2015 2016Protected market 941,604 881,530 813,729Free market 170,281 215,950 276,898Total 1,111,885 1,097,480 1,090,627
Figure 100 | Natural gas supply contracts by type of customer [G4 - EU3]
2014 2015 2016Domestic 1,038,640 1,026,914 1,022,433 SME 55,927 55,446 53,859 Large customers 7,339 5,454 4,997 Condominiums 9,979 9,666 9,338 Total 1,111,885 1,097,480 1,090,627
Figure 101 | Geographic breakdown of electricity sales volumes
2014 2015 2016Lombardy 81% 84% 78%Rest of Italy 19% 16% 22%
Figure 102 | Geographic breakdown of natural gas sales volumes
2014 2015 2016Lombardy 94% 91% 88%Rest of Italy 6% 9% 12%
Relational capital
The EPCG Group
Governance
Risks and opportunities
Stakeholder engagement and materiality analysis
Financial capital
Manufacturing capital
Natural capital
Human capital
Relational capital
Supplement - A2A 2016 Integrated Report 45
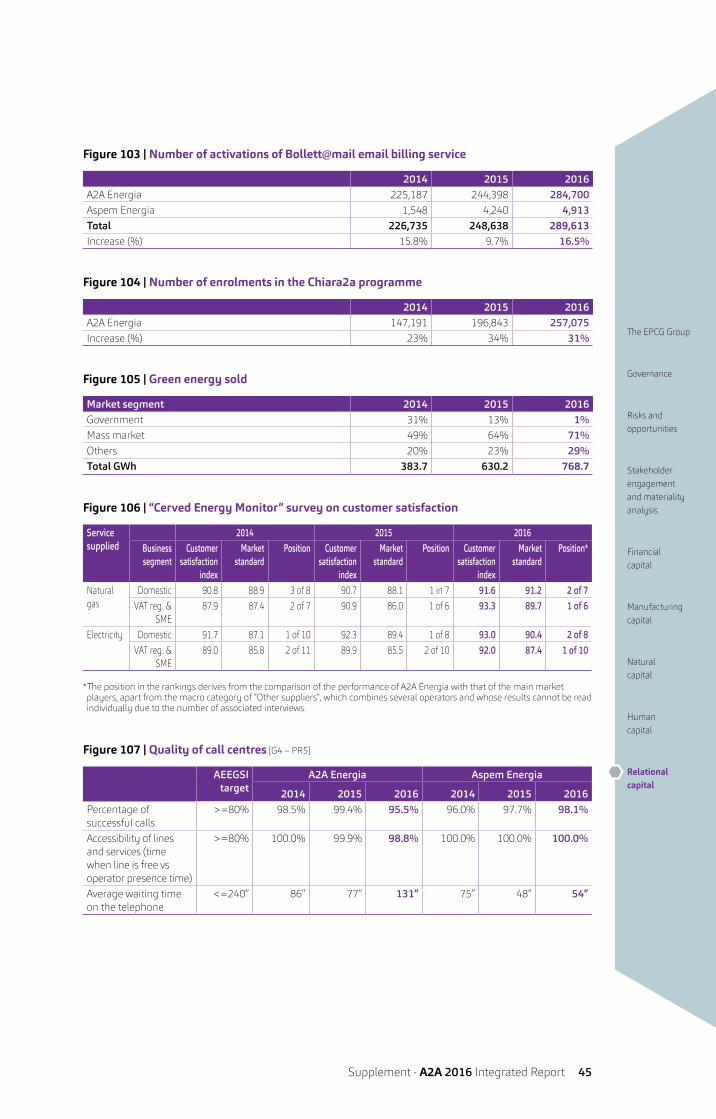
Figure 103 | Number of activations of Bollett@mail email billing service
2014 2015 2016A2A Energia 225,187 244,398 284,700Aspem Energia 1,548 4,240 4,913Total 226,735 248,638 289,613Increase (%) 15.8% 9.7% 16.5%
Figure 104 | Number of enrolments in the Chiara2a programme
2014 2015 2016A2A Energia 147,191 196,843 257,075Increase (%) 23% 34% 31%
Figure 105 | Green energy sold
Market segment 2014 2015 2016Government 31% 13% 1%Mass market 49% 64% 71%Others 20% 23% 29%Total GWh 383.7 630.2 768.7
Figure 106 | “Cerved Energy Monitor” survey on customer satisfaction
Service supplied
2014 2015 2016Business segment
Customer satisfaction
index
Market standard
Position Customer satisfaction
index
Market standard
Position Customer satisfaction
index
Market standard
Position*
Natural gas
Domestic 90.8 88.9 3 of 8 90.7 88.1 1 in 7 91.6 91.2 2 of 7VAT reg. &
SME87.9 87.4 2 of 7 90.9 86.0 1 of 6 93.3 89.7 1 of 6
Electricity Domestic 91.7 87.1 1 of 10 92.3 89.4 1 of 8 93.0 90.4 2 of 8 VAT reg. &
SME89.0 85.8 2 of 11 89.9 85.5 2 of 10 92.0 87.4 1 of 10
* The position in the rankings derives from the comparison of the performance of A2A Energia with that of the main market players, apart from the macro category of “Other suppliers”, which combines several operators and whose results cannot be read individually due to the number of associated interviews.
Figure 107 | Quality of call centres [G4 – PR5]
AEEGSI target
A2A Energia Aspem Energia
2014 2015 2016 2014 2015 2016Percentage of successful calls
>=80% 98.5% 99.4% 95.5% 96.0% 97.7% 98.1%
Accessibility of lines and services (time when line is free vs operator presence time)
>=80% 100.0% 99.9% 98.8% 100.0% 100.0% 100.0%
Average waiting time on the telephone
<=240’’ 86’’ 77’’ 131” 75’’ 48’’ 54”

Relational capital
46 A2A 2016 Integrated Report - Supplement
Figure 108 | Electricity and natural gas complaint trends
2014 2015 2016Number of complaints 3,008 2,672 2,823% “simple” complaints out of average no. of customers* 0.15% 0.14% 0.14%**
* AEEGSI defines complaints as “simple” when they refer exclusively to the seller and do not require any data pertaining to the distribution
company in order to prepare the answer.** The complaint index is calculated according to the number of customers as at June 30, 2016. The figure as at December 31, 2016
is not yet available.
Figure 109 | Mediation procedures
2014 2015 2016
Applications received 39 28 24Of which
Problems relating to metering 77% 61% 89%Invoices for anomalous amounts 4% - -Contractual changes 19% 8% -Problems relating to invoicing - 15% 11%Unrequested contracts - 8% -Credit management - 8% -
Outcome of mediation proceduresSuccessful 72% 75% 37%Mediation failed 22% 10% 10%Pending resolution 6% 15% 53%
Figure 110 | Electricity bill cost trends (in euro) for a typical household*
2014 2015 2016
Sales services 256.57 226.53 216.05Network services 190.63 219.78 215.35Tax 21.78 21.77 21.79VAT 46.90 46.81 45.32Total 515.88 514.89 498.51
* For electricity, the Authority took as an example a resident domestic use contract, with 3 kW of available power and an average annual
use of 2,700 kWh.
Figure 111 | Cost trends in the natural gas bill (in euro) for a typical household*
2014 2015 2016
Sales services 542.22 477.82 401.88Network services 209.69 224.98 209.62Tax 231.15 242.46 224.68VAT 180.15 169.03 170.55Total 1,163.21 1,114.30 1,006.73
* For natural gas, domestic use with independent heating in the north-east and an annual use of 1,400 m3 was taken as the example.

The EPCG Group
Governance
Risks and opportunities
Stakeholder engagement and materiality analysis
Financial capital
Manufacturing capital
Natural capital
Human capital
Relational capital
Supplement - A2A 2016 Integrated Report 47
Figure 112 | Office visits*
2014 2015 2016
Total number of customers served** 314,253 275,288 300,814Average office waiting time in minutes*** 9'58'' 5'03'' 13'48''
* Figures for the Milan office include payment service.** The figure refers to the offices in Milan, Brescia and Bergamo and, for 2016, Varese.*** The figure refers to the offices in Milan, Brescia and Bergamo.
Figure 113 | Number of visits to the commercial websites
2014 2015 2016
Total number of visits 1,955,652 1,956,964 2,686,178
Electricity and natural gas distribution service
Figure 114 | Extension of the electricity distribution service [G4 – EU3_EU4]
2014 2015 2016
Km of electricity network 13,837 13,952 14,039of which underground cable 11,787 11,922 12,013
Customers connected 1,121,954 1,120,197 1,135,038Municipalities served 54 54 50
Figure 115 | Customers of the electricity distribution service by geographical area [G4 - EU3]
2014 2015 2016
Lombardy 1,121,954 1,120,197 1,135,038of which, Milan 886,338 887,976 896,728of which, Brescia 235,616 232,221 238,310
Figure 116 | Extension of the natural gas distribution service [G4 – EU3_EU4]
2014 2015 2016
Km of natural gas network 8,033 8,055 8,057End customers connected 1,259,986 1,260,233 1,259,287Municipalities served 204 204 203
Figure 117 | Customers of the natural gas distribution service by geographical area [G4 - EU3]
2014 2015 2016
Lombardy 1,217,309 1,217,304 1,216,053Other regions of Northern Italy 13,305 13,277 13,303Rest of Italy 29,372 29,652 29,931

Relational capital
48 A2A 2016 Integrated Report - Supplement
Figure 118 | Technical quality of electricity [G4 – EU29_EU28]
Service continuity indicator
MilanHigh density area Medium density area Low density area
2014 2015 2016 2016 AEEGSI
objective
2014 2015 2016 2016 AEEGSI
objective
2014 2015 2016 2016 AEEGSI
objective
Average annual minutes of outage per LV user due to long outages without notice
23.79 23.77 26.63 25 44.63 41.75 36.67 40 n.a. n.a. n.a. /
Average annual number of outages per LV user due to long outages without notice
1.21 1.31 1.54 1.14 1.96 2.11 1.71 2.04 n.a. n.a. n.a. /
Service continuity indicator
Brescia
High density area Medium density area Low density area
2014 2015 2016 2016 AEEGSI
objective
2014 2015 2016 2016 AEEGSI
objective
2014 2015 2016 2016 AEEGSI
objective
Average annual minutes of outage per LV user due to long outages without notice
6.34 5.80 5.24 25 14.49 14.06 9.92 40 29.56 24.96 21.77 60
Average annual number of outages per LV user due to long outages without notice
1.06 0.81 0.69 1 1.61 1.5 1.33 2 2.60 2.18 2.46 4
Figure 119 | Specific indicators for technical quality of electricity [G4 – EU28]
MILAN BRESCIA2014 2015 2016 2014 2015 2016
No. MV customers with more than six outages a year for high density areas
25 5 0 2 0 0
No. of MV customers with more than nine outages a year for low density areas
n.a. 0 0 6 0 0
In the event of an electricity shortfall, Terna - National Electrical Network requests that distributors implement a scheduled rotating outage plan in order to avoid a general blackout. There are five levels of severity of electricity shortfall used to determine the number of users involved and the frequency of outages. Terna informs customers of the outages, which have a maximum duration of 90 minutes, with advance notice of 30 minutes, and they may occur at any time during the hourly periods indicated, not necessarily at the beginning of each period. The scheduled outage plan prepared by Unareti, by day and time slot, is available from the company’s website.

The EPCG Group
Governance
Risks and opportunities
Stakeholder engagement and materiality analysis
Financial capital
Manufacturing capital
Natural capital
Human capital
Relational capital
Supplement - A2A 2016 Integrated Report 49
Figure 120 | Commercial quality of electricity: specific indicators for the Milan-Brescia area [G4 – EU21]
Specific indicators AEEGSI Level Res. 198/11
AEEGSI Level Res. 646/15 of January 1,
2016
Services provided on the indicated timetable (%)
Average time to execute the service
(days)
2014 2015 2016 2014 2015 2016
Time to prepare estimate for work on the network
20 working days for LV
40 working days for MV
10 working days for LV
30 working days for MV
99.54% 99.26% 99.61% 7.33 6.76 6.37
Execution time for simple work
15 working days for LV
30 working days for MV
10 working days for LV
20 working days for MV
99.57% 99.56% 99.71% 5.56 5.75 5.03
Execution time for complex work
n.a. 50 working days n.a. n.a. 100% n.a. n.a. 9.22
Activation time for LV/MV supply
5 working days 5 working days 99.81% 99.81% 99.89% 1.13 0.91 0.73
Supply de-activation time
5 working days for LV
7 working days for MV
5 working days 99.67% 99.73% 99.81% 0.94 0.70 0.65
Reactivation time following suspension due to non-payment
1 working day 1 working day 99.41% 99.70% 99.87% 0.16 0.11 0.10
Observance of time bracket for appointments
Two hours Two hours 99.64% 99.82% 99.85% n.a. n.a. n.a.
Time to restore service following failure of meter equipment during business days from 8 AM to 6 PM on the LV network
Three hours Three hours 87.99% 87.82% 90.42% 1.97 2.30 1.77
Time to restore service following failure of meter equipment during business days from 6 PM to 8 AM on the LV network
Four hours Four hours 97.06% 92.22% 98.28% 1.83 2.19 1.40
Time to report results of testing of LV/MV meter equipment
15 working days 15 working days 99.57% 94.98% 97.16% 8.51 9.65 9.18
Time to report results of voltage test
20 working days 20 working days 100% 92.31% 96.55% 29.50 15.50 15.76

Relational capital
50 A2A 2016 Integrated Report - Supplement
Figure 121 | Commercial quality of electricity: general indicators for the Milan-Brescia area [G4 – EU21]
Type of service AEEGSI level - LV
Services provided on the indicated timetable (%)
2014 2015 2016
Percentage of requests to execute complex work completed within the maximum period of 60 working days*
85% 99.91% 99.94% /
Minimum percentage of detailed responses to written complaints or requests for information provided within the maximum period of 30 calendar days
95% 95.29% 99.20% 99.41%
Type of service AEEGSI level
- MVServices provided on the indicated timetable
(%)2014 2015 2016
Minimum percentage of requests to execute complex work completed within the maximum period of 60 working days*
90% 98.80% 100% /
Minimum percentage of detailed responses to written complaints or requests for information provided within the maximum period of 30 calendar days
95% 97.18% 98.10% 99.72%
* Specific indicator since 2016, please refer to Figure 120.
Figure 122 | Technical quality of natural gas [G4 – EU21]
Base level
Ref. level
2014 actual level 2015 actual level 2016 actual levelMilan Brescia Bergamo Varese Milan Brescia Bergamo Varese Milan Brescia Bergamo Varese
Annual percentage of the high and medium pressure network inspected
30% 90% 71% 100% 99% 57% 58% 86% 100% 68% 73% 100% 100% 65%
Annual percentage of the low pressure network inspected
20% 70% 68% 74% 61% 90% 59% 58% 100% 92% 62% 63% 100% 77%
Annual number of leaks located per km of network inspected
0.8 0.1 0.084 0.065 0.068 0.189 0.134 0.091 0.037 0.169 0.09 0.08 0.01 0.23
Annual number of leaks located in response to reports from third parties per km of network
0.8 0.1 0.21 0.085 0.45 0.042 0.26 0.086 0.035 0.068 0.23 0.08 0.03 0.06
Conventional number of measurements of degree of natural gas odorant per thousand end customers
0.19 0.5 0.895 1.55 3.66 1.38 0.95 1.82 3.66 1.39 0.94 1.73 4.80 1.39
Figure 123 | Natural gas emergency service [G4 – EU21]
Annual number of calls to the switchboard with a time to arrival of the team at destination <= 60 minBase level 90%Ref. level 95%
2014 2015 2016
Milan 98.17% 98.78% 98.85%Brescia 99.39% 99.85% 99.72%Bergamo 100% 100% 100%Varese 99.46% 99.74% 100%

The EPCG Group
Governance
Risks and opportunities
Stakeholder engagement and materiality analysis
Financial capital
Manufacturing capital
Natural capital
Human capital
Relational capital
Supplement - A2A 2016 Integrated Report 51
Figure 124 | Natural gas commercial quality: specific indicators: Milan, Brescia, Bergamo and Chieti Area [G4 – EU21]
Type of service AEEGSI Level Res. 574/13 of
January 1, 2014
Services provided on the indicated timetable (%)
Average time to execute the service (days)
2014 2015 2016 2014 2015 2016
Estimate time (simple work) 15 working days
99.18% 99.46% 96.33% 6.34 7.09 9.03
Execution time (simple work) 10 working days
97.50% 98.03% 92.72% 6.12 7.14 7.16
Estimate time (complex work) 30 working days 93.11% 97.71% 94.24% 15.47 11.55 15.09Supply activation time 10 working
days99.89% 99.93% 99.93% 2.79 2.85 3.72
Supply de-activation time 5 working days 99.86% 99.87% 99.51% 3.05 3 3.09Reactivation time following suspension due to non-payment
2 working days 96.59% 96.42% 97.59% 1.15 1.15 1.24
Observance of time bracket for appointments
Two hours 99.83% 99.82% 99.78% N/A N/A N/A
Time to notify results of testing of meter equipment
20 working days
N/A 67.57% 62.86% N/A 22.92 20.11
Figure 125 | Natural gas commercial quality: specific indicators for Varese [G4 – EU21]
Type of service AEEGSI Levels Res. 5743/13 of January 1, 2014
Services provided on the indicated timetable (%)
Average time to execute the service (days)
2014 2015 2016 2014 2015 2016
Estimate time (simple work) 15 working days
100% 100% 100% 6.7 4.2 6.2
Execution time (simple work) 10 working days
100% 100% 100% 2.5 3.2 1.9
Estimate time (complex work)
30 working days
100% 100% 100% 3.7 4.2 6.0
Supply activation time 10 working days
100% 100% 100% 1.3 1.8 3.4
Supply de-activation time 5 working days
100% 100% 100% 2.1 2.1 2.1
Reactivation time following suspension due to non-payment
2 working days
100% 99% 100% 1 1.1 1.4
Observance of time brackets for appointments
Two hours 100% 100% 100% N/A N/A N/A
Time to notify results of testing of meter equipment
20 working days
N/A N/A N/A N/A N/A N/A
Figure 126 | Natural gas commercial quality: general indicators [G4 – EU21]
Services provided on the indicated timetable (%)
AEEGSI level
Milan, Brescia, Bergamo and other provinces
Varese
2014 2015 2016 2014 2015 2016
Percentage of requests to execute complex work completed within the maximum period of 60 working days
90% 98.53% 99.54% 99.70% 100% 100% 100%
Percentage of detailed responses to written complaints or requests for information provided within the maximum period of 30 working days
95% 96.79% 99.50% 99.21% 100% 100% 99.21%

Relational capital
52 A2A 2016 Integrated Report - Supplement
Integrated water service
Figure 127 | Extension of the integrated water service [G4 - EU3]
Aqueduct service Treatment service Sewer service2014 2015 2016 2014 2015 2016 2014 2015 2016
Munici-palities served
108 108 108 66 66 66 69 69 69
Total customers
280,092 282,254 283,479 186,371 186,746 187,431 188,683 189,065 189,589
Inhabit-ants
813,466 812,948 812,654 546,937 549,636 549,311 564,051 563,887 563,516
Figure 128 | Quality of the A2A Ciclo Idrico call centre [G4-PR5]
2014 2015 2016
Service accessibility rate (free lines with respect to operator presence time) 100% 100% 100%Number of calls to the call centre* 87,607 81,761 79,277 Average telephone waiting time for calls from end customers (sec) 137 84 73Percentage of successful calls 79.20% 88.10% 87.70%
* Figure also updated for 2014-2015.
Figure 129 | Quality of the A2A Ciclo Idrico service (days)
2014 2015 2016
Response time to estimate requests for aqueduct connections
3.83 3.98 7.37
Response time to estimate requests for sewer connections
3.5 3.3 4.6
Aqueduct connection times 12.7 12.1 13.7Supply activation time 2.5 2.4 2.7Sewer connection times 19.8 12.3 19.3
District heating and heat management
Figure 130 | Geographical distribution of the district heating service [G4 - EU3]
2014 2015 2016CUSTOMERS*
(no.)VOLUMES
SERVED (Mm3)
CUSTOMERS* (no.)
VOLUMES SERVED
(Mm3)
CUSTOMERS* (no.)
VOLUMES SERVED
(Mm3)
Brescia and province 20,634 41.8 20,726 41.9 20,392 42.1Bergamo and province 518 5.8 545 6.2 585 6.5Milan and province 2,945 42.4 3,109 44.9 3,181 47Varese and province 145 2.7 146 2.7 145 2.7TOTAL 24,242 92.7 24,526 95.7 24,303 98
* Customers may be individual residential units in the case of independent heating or whole buildings in the case of centralised heating.
Figure 131 | Transformations completed by the heat management service*
2014 2015 2016
Transformations (no.) 27 18 13Capacity installed (kW) 37,340 9,394 16,950
* These refer to replacement of methane with methane with a condensing boiler, of methane with district heating, of diesel with methane with a condensing boiler and of diesel with district heating.

The EPCG Group
Governance
Risks and opportunities
Stakeholder engagement and materiality analysis
Financial capital
Manufacturing capital
Natural capital
Human capital
Relational capital
Supplement - A2A 2016 Integrated Report 53
Integrated waste cycle
Figure 132 | Urban hygiene service: collection and sweeping [G4 - EU3]
2014 2015 2016
Municipalities served 93 101 117Population served 2,428,933 2,539,136 2,645,886
Figure 133 | Paid services: waste disposal and other services for individuals [G4 - EU3]
Customers served 2014 2015 2016
Amsa 8,045 8,167 9,206Aprica 1,290 1,270 1,357
Figure 134 | Waste disposal service – A2A Ambiente [G4 - EU3]
2014 2015 2016
Municipalities served 1,047 952 962Companies served 1,960 1,844 1,860
Figure 135 | Satisfaction of Amsa customers – Milan [G4 – PR5]
Points in tenths 2014 2015 2016
Unsorted waste collection 8.06 8.18 8.08Separate glass collection 8.48 8.47 8.11Separate collection of paper, paperboard, cardboard and beverage packaging cardboard
8.43 8.44 8.10
Separate collection of plastic and metal 8.35 8.45 8.10Fine sweeping 7.12 7.28 7.30Massive sweeping 7.14 7.2 7.37Comprehensive sweeping 7.18 7.32 7.40Cleaning of tunnels and porticoes 7.57 7.57 7.82Sidewalk cleaning 6.85 6.96 7.53Cleaning of tree rows 6.83 7.01 7.25Emptying of large/small bins 6.96 7.05 7.04Temporary market cleaning service 7.77 7.73 7.78Park cleaning service 6.94 7.06 7.30Sump drainage and clearing service 6.16 6.49 6.41Elimination of illegal dumps on public land 6.48 6.72 7.03Cemetery services 7.54 7.51 7.50Cleaning and waste collection service before and/or during and/or after events
7.4 7.54 7.51
Home collection of cumbersome waste 8.7 8.85 8.69Removal of graffiti 7.6 7.88 7.40Toll-free number 8.29 8.14 8.06Office 8.1 7.89 7.15Website 7.74 7.88 7.58Online cumbersome waste collection 8.17 8.08 7.89Organic collection (overall) 8.18 8.11 8.05
Relational capital
54 A2A 2016 Integrated Report - Supplement
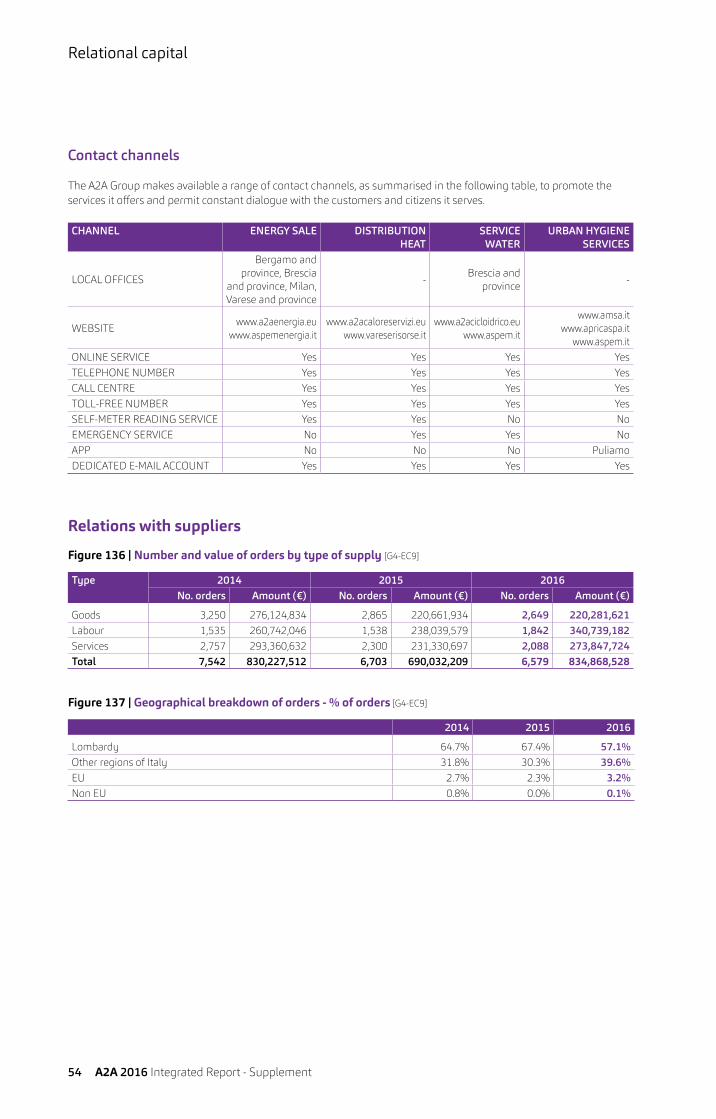
Contact channels
The A2A Group makes available a range of contact channels, as summarised in the following table, to promote the services it offers and permit constant dialogue with the customers and citizens it serves.
CHANNEL ENERGY SALE DISTRIBUTION HEAT
SERVICE WATER
URBAN HYGIENE SERVICES
LOCAL OFFICES
Bergamo and province, Brescia
and province, Milan, Varese and province
-Brescia and
province-
WEBSITEwww.a2aenergia.eu
www.aspemenergia.itwww.a2acaloreservizi.eu
www.vareserisorse.itwww.a2acicloidrico.eu
www.aspem.it
www.amsa.itwww.apricaspa.it
www.aspem.itONLINE SERVICE Yes Yes Yes YesTELEPHONE NUMBER Yes Yes Yes YesCALL CENTRE Yes Yes Yes YesTOLL-FREE NUMBER Yes Yes Yes YesSELF-METER READING SERVICE Yes Yes No NoEMERGENCY SERVICE No Yes Yes NoAPP No No No PuliamoDEDICATED E-MAIL ACCOUNT Yes Yes Yes Yes
Relations with suppliers
Figure 136 | Number and value of orders by type of supply [G4-EC9]
Type 2014 2015 2016No. orders Amount (€) No. orders Amount (€) No. orders Amount (€)
Goods 3,250 276,124,834 2,865 220,661,934 2,649 220,281,621Labour 1,535 260,742,046 1,538 238,039,579 1,842 340,739,182Services 2,757 293,360,632 2,300 231,330,697 2,088 273,847,724Total 7,542 830,227,512 6,703 690,032,209 6,579 834,868,528
Figure 137 | Geographical breakdown of orders - % of orders [G4-EC9]
2014 2015 2016
Lombardy 64.7% 67.4% 57.1%Other regions of Italy 31.8% 30.3% 39.6%EU 2.7% 2.3% 3.2%Non EU 0.8% 0.0% 0.1%