Embed Size (px)
Citation preview
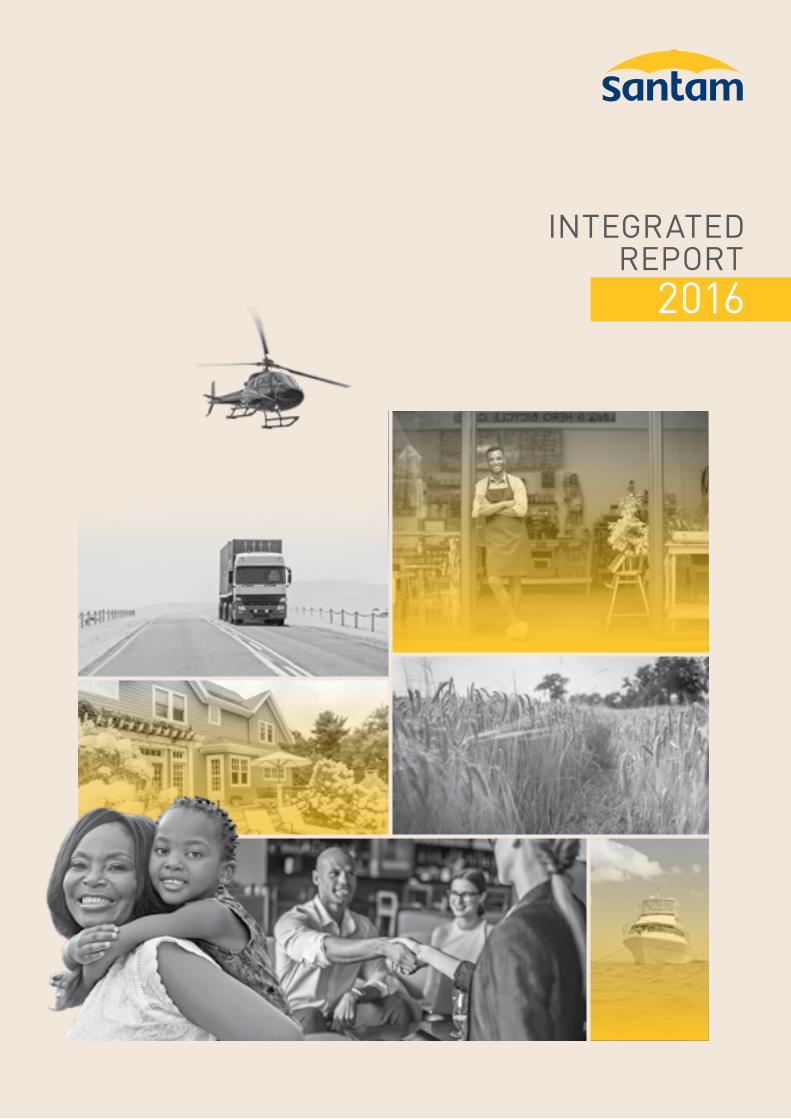
INTEGRATEDREPORT
2016
OUR STORY IN 2016
Our promise to deliver Insurance good and proper was tested by the worsening claims environment this year, compounded by financial market
volatility, low domestic growth, limited consumer disposable income, growing competition, soft premium rates, higher auto repair and related costs,
and increasing claims associated with systemic risk.
What emerged, was the confirmation that what matters most to you, our stakeholders, matters most to us. This was endorsed by business
conversations about the future, wide engagement through partnerships and feedback from our clients.
We share some of these real experiences with you in this report. Seven stories highlight what mattered most to you:
1. Subsistence farmers struggle to become financially astute commercial farmers, who can manage their risks and access markets and funding.
We have found ways to help.
2. A 10-year old has her first experience of theft, the insurance claims process and the relief of being able to replace her phone.
3. Collaboration is taking city infrastructure development in Africa to the next level – where insurance partners and city officials create proactive
solutions together.
4. Fires are devastating for shack owners: smoke alarms offer a solution for vulnerable communities that form part of Santam’s Risk and
Resilience programme.
5. When a client is in a dangerous situation, we are sometimes in a position to offer more than just telephone support.
6. Many low-income households are battling with debt, but find help and learn to manage with the assistance of agencies that are supported by
the Santam Resilience Investment (SRI) Fund.
7. We tackle cyber and safety issues creatively through a new campaign and a blockchain hackathon.
These examples illustrate how we operate in an ever-changing world and how client needs evolve over time. For Santam, this means that we
have to provide protection and the opportunity for people to access the cover that they need for the things that matter to them, wherever they are.
It is also what Insurance good and proper means: we make it our business to understand what clients value, and know that different things are
important to different people.
Please share your experience of reading this report via one of the following channels:
A FEW TIPS FOR READERS OF THIS REPORT− There is a glossary of insurance and financial terms on page 132.
− The assurance process and elements are explained on page 5.
− The disclaimer related to forward-looking statements is on page 5.
− Santam’s full set of reporting elements can be found on page 5.
− Santam’s performance over the long term (seven years), according to key performance indicators, is set out on page 130.
For more information, please visit www.santam.co.za.
FOLLOW US ON:

SA
NT
AM
INT
EG
RA
TE
D R
EP
OR
T 2
016
1
CO
NT
EN
TS
4 ABOUT THIS REPORT
5 SCOPE AND BOUNDARY
8 THE ROLE OF INSURANCE IN SOCIETY
14 MATERIAL MATTERS AND KEY FUTURE DRIVERS
22 GROUP AT A GLANCE
40 LEADERSHIP REPORT
58 CHIEF FINANCIAL OFFICER’S REPORT
68 CORPORATE GOVERNANCE REPORT
76 MESSAGE FROM THE CHAIRMAN
77 CORPORATE GOVERNANCE REPORT
88 RISK MANAGEMENT REPORT
92 REMUNERATION REPORT
98 TRANSFORMATION REPORT
101 VALUE-ADDED STATEMENT
104 SUMMARY CONSOLIDATED FINANCIAL STATEMENTS
130 APPENDICES
130 SEVEN-YEAR REVIEW
132 GLOSSARY
134 ADMINISTRATION
CONTENTS
INSURANCE GOOD AND PROPER IS ABOUT PEOPLE.
Clients trust us to protect what is important to them and to put them at the centre of what we do. The qualities we value most within our business are humanity and integrity. We strive to see beyond the facts in front of us and care about the human behind them. Our employees are our most valuable human capital assets. It’s with their skills, resourcefulness and hard work that we can live up to our promise of insurance good and proper. We make it our business to help drive the economy, growth and development in Africa and internationally, as well as create jobs and develop infrastructure. This is insurance that invests in people and the environments they work and live in. It is one of the reasons why we are South Africa’s leading general insurer and have also been certified a Top Employer in South Africa in 2017.


SA
NT
AM
INT
EG
RA
TE
D R
EP
OR
T 2
016
4
AB
OU
T T
HIS
RE
PO
RT
TARGET AUDIENCE AND CONTENTSantam Ltd (Santam or the group) is a South African company listed
on the JSE since 1964 under the insurance (non-life) sector. The
company was founded in 1918 and its headquarters are in Cape Town,
South Africa. This integrated report reviews the financial year for the
12 months ended 31 December 2016 and covers general insurance
and investment operations in South Africa and Namibia, as well
as investments in emerging market insurance companies through
Sanlam Emerging Markets in the rest of Africa, India and
Southeast Asia.
The report provides information targeted at Santam’s providers
of financial capital. The interest of other stakeholders was also
considered in determining what is material and appropriate to
include. The development of content was further informed by the
scenario process and outcomes described from page 14. The process
provided a robust view of what matters most – those elements that
are material for the creation of value. Accordingly, the structure of
this report was adapted, with the further inclusion of real-life stories
that highlight how the six capitals of value creation (as described by
the International Integrated Reporting Council’s <IR> Framework),
the group’s strategy and risk management efforts created value in
specific circumstances. Refer to page 11 for information about the
six capitals. The content remains comparable to the 2015 report in
terms of the entities covered, the measurement methods applied and
time frames used for financial and non-financial data.
The following events can impact comparability and should be kept in
mind when reading the report:
The acquisition of a 30% interest by SAN JV (Pty) Ltd (SAN JV) in
Saham Finances SA (Saham Finances) was completed during the first
quarter of 2016. Saham Finances is the insurance arm of the Saham
Group. Santam and Sanlam Emerging Markets (SEM) hold 25% and
75% of the shareholding in SAN JV, respectively. Santam’s effective
interest in Saham Finances is 7.5%.
A further economic interest of 8% in Shriram General Insurance
Co Ltd (SGI) was acquired during the second half of 2016.
ABOUT THIS REPORTIn this report, all references to Santam refer to the group. The
Santam branded business units (Santam Commercial and Personal,
Santam Specialist, MiWay and Santam re) and subsidiaries are
mentioned by name when discussed.
This report includes summary consolidated financial statements.
Cross-references to notes in this report refer to the full set of the
annual financial statements, available on www.santam.co.za.
The Santam broad-based black economic empowerment (BBBEE)
certificate is available on the website.
APPROVAL OF THIS REPORTThe 2016 integrated report was reviewed by the audit and the social,
ethics and sustainability committees. The reviewed report was
recommended to the board and final approval was granted on
1 March 2017. On this basis, the board is satisfied that the report
offers the necessary substance for the providers of financial capital to
make considered evaluations about the performance and sustainable
value creation ability of the group.
NAVIGATIONThe following icons are applied throughout the report to improve
usability and show the integration between the relevant elements
of the report.
THIS ICON IS USED TO REFER TO THE SANTAM WEBSITE: WWW.SANTAM.CO.ZA.
THIS ICON IS USED FOR CROSS-REFERENCES IN THE REPORT.
SA
NT
AM
INT
EG
RA
TE
D R
EP
OR
T 2
016
5
AB
OU
T T
HIS
RE
PO
RT
REPORTING FRAMEWORKS, GUIDELINES AND STANDARDS This report was developed with due consideration of the following
reporting requirements and principles:
− King III Report on Governance for South Africa, 2009 (King III)
− International Financial Reporting Standards (IFRS)
− The Companies Act, 71 of 2008, as amended
− JSE Listings Requirements
− International Integrated Reporting Council’s (IIRC) Integrated
Reporting <IR> Framework
CONTENT ASSURANCESantam’s 2016 integrated report is the result of combined material
input from all the different business units reporting on their activities
and achievements for the year. PricewaterhouseCoopers Inc provided
assurance of the summary consolidated financial statements
included in this report. Data relating to BBBEE was verified
by AQRate.
Non-financial indicators were reviewed by an internal process that
includes approval by the executive committee.
FORWARD-LOOKING STATEMENTSIn this report, certain statements are made that are not historical
facts and relate to analyses and other information based on forecasts
of future results not yet determinable, relating, among others, to
gross premium growth levels, underwriting margins and investment
returns. These are forward-looking statements, as defined in the
United States Private Securities Litigation Reform Act of 1995. Words
such as “believe”, “anticipate”, “intend”, “seek”, “will”, “plan”, “could”,
“may”, “endeavour”, “project” and similar expressions are intended
to identify such forward-looking statements, but are not the exclusive
means of identifying such statements.
Forward-looking statements involve inherent risks and uncertainties
and, if one or more of these risks materialise, or should the
underlying assumptions prove incorrect, actual results may differ
from those that were anticipated. Forward-looking statements apply
only as of the date on which they are made, and Santam does not
undertake any obligation to update or revise any of them, whether
as a result of new information, future events or otherwise.
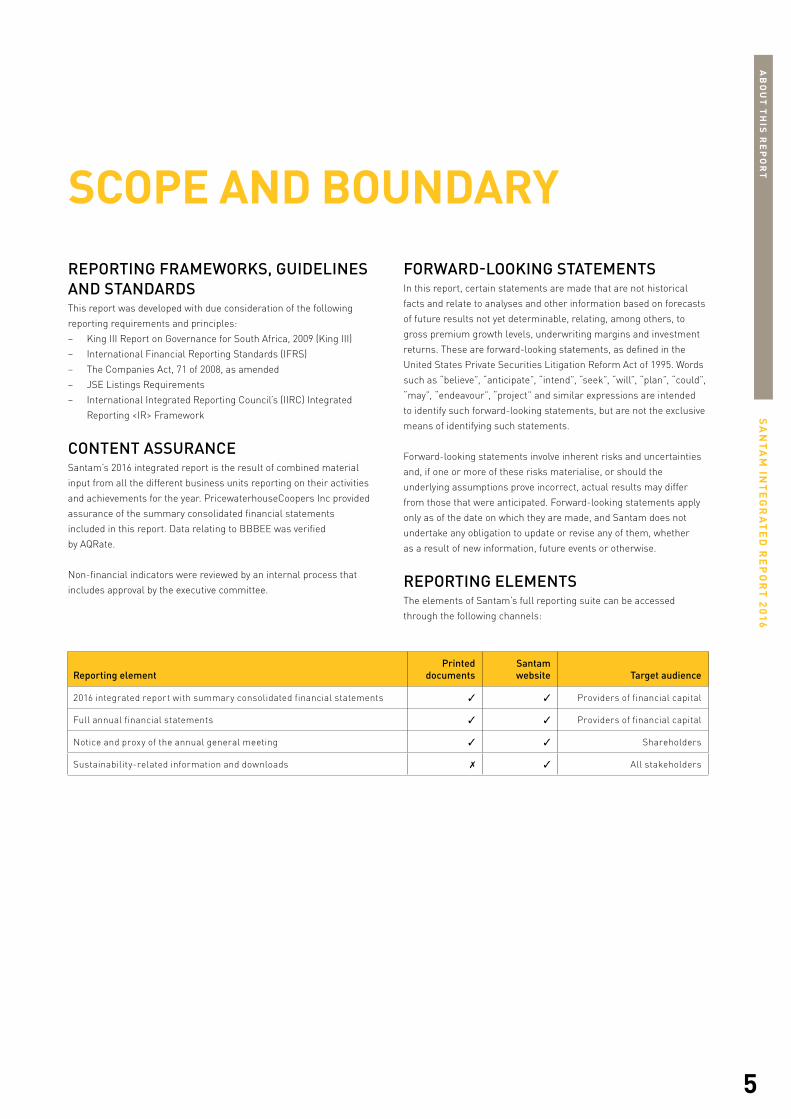
REPORTING ELEMENTSThe elements of Santam’s full reporting suite can be accessed
through the following channels:
SCOPE AND BOUNDARY
Reporting elementPrinted
documentsSantam website Target audience
2016 integrated report with summary consolidated financial statements ✓ ✓ Providers of financial capital
Full annual financial statements ✓ ✓ Providers of financial capital
Notice and proxy of the annual general meeting ✓ ✓ Shareholders
Sustainability-related information and downloads ✗ ✓ All stakeholders

We have been offering personal insurance for almost 100 years. Over this time, we made it our business to understand what is most important to our clients and the risks they face. That is how, whatever our clients value most, we give them the peace of mind that they are covered by South Africa’s largest general insurer. An insurer that is there for them 24/7 and able to put them back in the same position they were before any loss occurred, while also paying out more claims than any other insurer.
KNOWING WHAT MATTERS MOST TO OUR CLIENTS COMES WITH EXPERIENCE.

SA
NT
AM
INT
EG
RA
TE
D R
EP
OR
T 2
016
8
TH
E R
OL
E O
F IN
SU
RA
NC
E IN
SO
CIE
TY
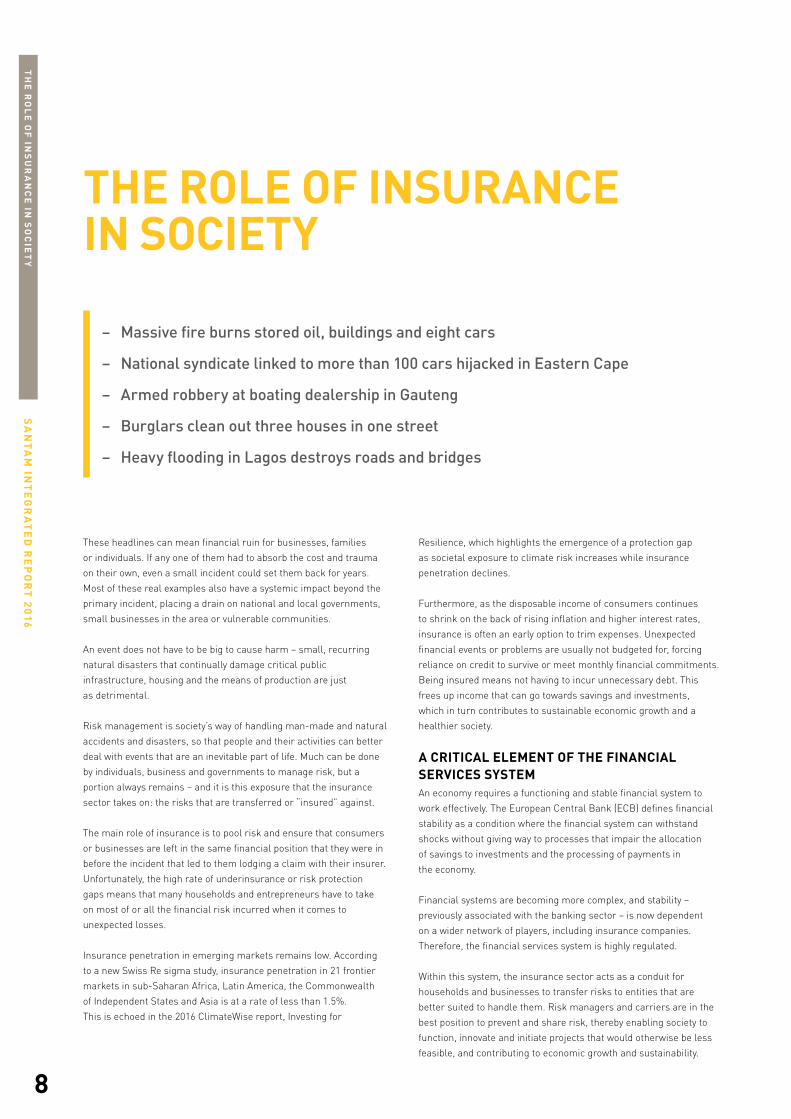
THE ROLE OF INSURANCE IN SOCIETY
These headlines can mean financial ruin for businesses, families
or individuals. If any one of them had to absorb the cost and trauma
on their own, even a small incident could set them back for years.
Most of these real examples also have a systemic impact beyond the
primary incident, placing a drain on national and local governments,
small businesses in the area or vulnerable communities.
An event does not have to be big to cause harm – small, recurring
natural disasters that continually damage critical public
infrastructure, housing and the means of production are just
as detrimental.
Risk management is society’s way of handling man-made and natural
accidents and disasters, so that people and their activities can better
deal with events that are an inevitable part of life. Much can be done
by individuals, business and governments to manage risk, but a
portion always remains – and it is this exposure that the insurance
sector takes on: the risks that are transferred or “insured” against.
The main role of insurance is to pool risk and ensure that consumers
or businesses are left in the same financial position that they were in
before the incident that led to them lodging a claim with their insurer.
Unfortunately, the high rate of underinsurance or risk protection
gaps means that many households and entrepreneurs have to take
on most of or all the financial risk incurred when it comes to
unexpected losses.
Insurance penetration in emerging markets remains low. According
to a new Swiss Re sigma study, insurance penetration in 21 frontier
markets in sub-Saharan Africa, Latin America, the Commonwealth
of Independent States and Asia is at a rate of less than 1.5%.
This is echoed in the 2016 ClimateWise report, Investing for
Resilience, which highlights the emergence of a protection gap
as societal exposure to climate risk increases while insurance
penetration declines.
Furthermore, as the disposable income of consumers continues
to shrink on the back of rising inflation and higher interest rates,
insurance is often an early option to trim expenses. Unexpected
financial events or problems are usually not budgeted for, forcing
reliance on credit to survive or meet monthly financial commitments.
Being insured means not having to incur unnecessary debt. This
frees up income that can go towards savings and investments,
which in turn contributes to sustainable economic growth and a
healthier society.
A CRITICAL ELEMENT OF THE FINANCIAL SERVICES SYSTEMAn economy requires a functioning and stable financial system to
work effectively. The European Central Bank (ECB) defines financial
stability as a condition where the financial system can withstand
shocks without giving way to processes that impair the allocation
of savings to investments and the processing of payments in
the economy.
Financial systems are becoming more complex, and stability –
previously associated with the banking sector – is now dependent
on a wider network of players, including insurance companies.
Therefore, the financial services system is highly regulated.
Within this system, the insurance sector acts as a conduit for
households and businesses to transfer risks to entities that are
better suited to handle them. Risk managers and carriers are in the
best position to prevent and share risk, thereby enabling society to
function, innovate and initiate projects that would otherwise be less
feasible, and contributing to economic growth and sustainability.
– Massive fire burns stored oil, buildings and eight cars
– National syndicate linked to more than 100 cars hijacked in Eastern Cape
– Armed robbery at boating dealership in Gauteng
– Burglars clean out three houses in one street
– Heavy flooding in Lagos destroys roads and bridges
SA
NT
AM
INT
EG
RA
TE
D R
EP
OR
T 2
016
9
TH
E R
OL
E O
F IN
SU
RA
NC
E IN
SO
CIE
TY
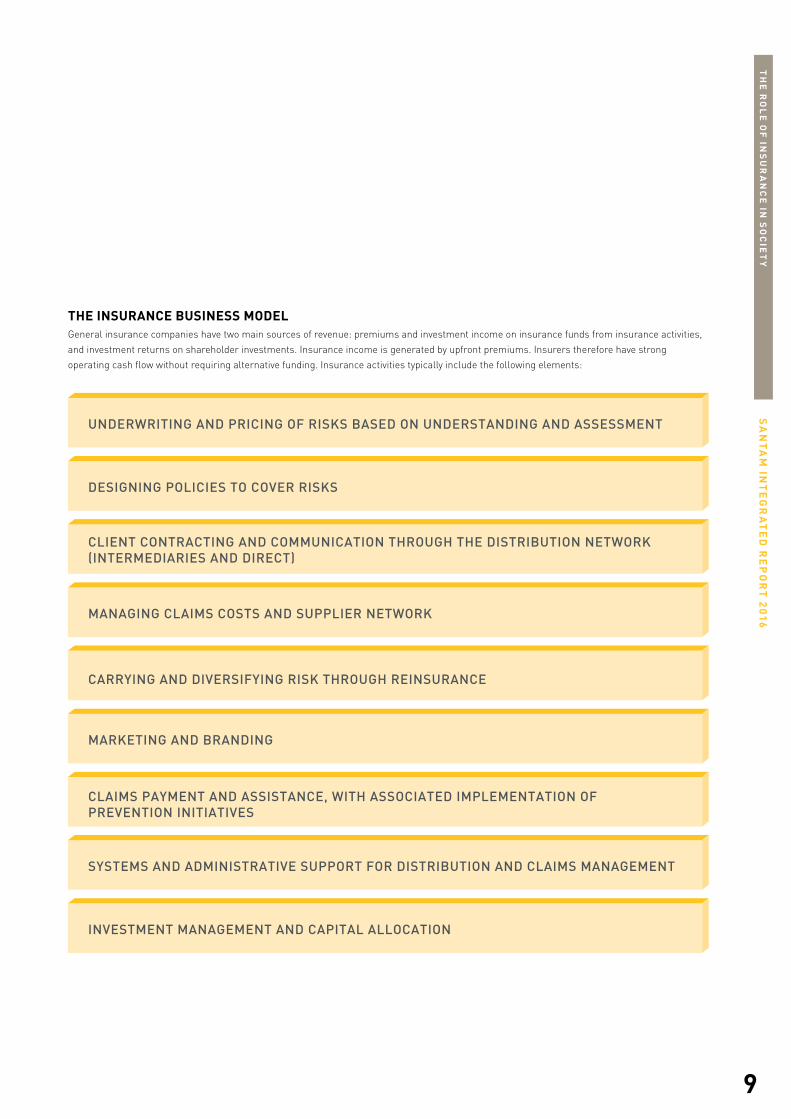
THE INSURANCE BUSINESS MODELGeneral insurance companies have two main sources of revenue: premiums and investment income on insurance funds from insurance activities,
and investment returns on shareholder investments. Insurance income is generated by upfront premiums. Insurers therefore have strong
operating cash flow without requiring alternative funding. Insurance activities typically include the following elements:THE INSURANCE BUSINESS MODEL
UNDERWRITING AND PRICING OF RISKS BASED ON UNDERSTANDING AND ASSESSMENT
DESIGNING POLICIES TO COVER RISKS
CLIENT CONTRACTING AND COMMUNICATION THROUGH THE DISTRIBUTION NETWORK (INTERMEDIARIES AND DIRECT)
MANAGING CLAIMS COSTS AND SUPPLIER NETWORK
CARRYING AND DIVERSIFYING RISK THROUGH REINSURANCE
MARKETING AND BRANDING
CLAIMS PAYMENT AND ASSISTANCE, WITH ASSOCIATED IMPLEMENTATION OF PREVENTION INITIATIVES
SYSTEMS AND ADMINISTRATIVE SUPPORT FOR DISTRIBUTION AND CLAIMS MANAGEMENT
INVESTMENT MANAGEMENT AND CAPITAL ALLOCATION
SA
NT
AM
INT
EG
RA
TE
D R
EP
OR
T 2
016
10
TH
E R
OL
E O
F IN
SU
RA
NC
E IN
SO
CIE
TY
Clients select a policy based on the cover that they require and the
trust they have in the insurer or brand. Complex commercial or
specialist insurance options further depend on advisory input from
an intermediary.
The policy is priced by using several modelling techniques to predict
client behaviour. For example, analytics include the level of cover,
the claims history of groups of people with similar characteristics
and requirements, potential safety features, replacement value and
demographics. In the contracting process, the client agrees to share
risk with the insurer, which takes the form of excess payment for the
client in the case of a claim.
When the client suffers an insured loss, they lodge a claim and the
insurer, which has agreed to shoulder the majority of the risk, pays
out the claim to reimburse the client.
Initiating a claim is often called the “moment of truth” in an insurer’s
relationship with a client. A positive claims experience ensures client
loyalty and persistency, whereas a negative experience can cause far-
reaching reputational damage for the insurer, including penalties.
Insurance fraud occurs in a variety of forms: from slightly
exaggerated claims to deliberately causing accidents or damage.
Submitting a false claim is a crime and results in higher premiums
as it impacts the analytic ratings, which ultimately affect affordability
for all clients.
Income generated through premiums is invested to generate a return
for shareholders, and to provide a capital buffer that enables the
insurer to maintain liquidity to cover liabilities associated with claims
made against the policies that they underwrite.
Therefore, underwriting is the key determinant of an insurance
company’s profitability. Underwriting is the process of evaluating
and pricing the risk that each prospective client poses. A good
underwriting process will allow the insurance company to optimise
the balance between a policy premium and potential claims against
the policy.
Reinsurance – as a form of insurance cover for insurance
companies – is an insurance company’s safety net: it reduces the
volatility of their results due to large claims and helps balance
available capital.
For the business model to function, an insurer needs a sophisticated
administration system, a reliable network of suppliers, and access to
specialised skills, such as actuarial and underwriting.
SANTAM’S CONTRIBUTION TO INSURANCESantam creates value by contributing to a robust, inclusive and
responsible general insurance industry that offers stakeholders value
and stability – in all the markets where it operates. This supports
sustainable social, environmental and economic development.
Santam considers all six capitals to be able to effectively manage
the size, quality and diversity of the risk pool in which the group
operates. Long-term sustainability relies on the group’s ability
to manage systemic risk through partnerships, to diversify its
geographic footprint, product and service offering, and to improve
operating efficiency. The group’s diversified portfolio of business
with good growth prospects is backed by a healthy financial position
and a supportive majority shareholder. Santam is also committed to
consumer financial education and increasing access to insurance for
emerging and uninsured communities and individuals.
Santam’s commitment to its clients is captured in the brand
promise: Insurance good and proper. The group’s strategy is defined
by focus areas that are continuously refined to entrench the group’s
competitiveness and resilience, and to deliver ongoing sustainable
and positive performance.

SA
NT
AM
INT
EG
RA
TE
D R
EP
OR
T 2
016
11
TH
E R
OL
E O
F IN
SU
RA
NC
E IN
SO
CIE
TYSIX CAPITAL INPUTS, OUTPUTS AND OUTCOMES
FINANCIALFinancial capital is generated through gross written premiums, an increased underwriting margin and investment returns, and conserved through efficiency initiatives. It funds business activities – including acquisitions and investment in technology, which generate more financial capital over the long term – and is distributed in the case of claims, as dividends or group expenses, such as the payment of salaries. It is also applied to improved socio economic conditions, thereby making it a sustainably available capital.
Read the real-life story on page 31 to see how this capital can be transformed and regenerated.
MANUFACTUREDManufactured capital relates to infrastructure used by insurance companies and the physical assets of clients that are insured. To operate, insurers use buildings and systems, with a growing footprint as they expand into new territories. Insurance companies also provide insurance cover for manufactured capital and invest funds in infrastructure development projects. Insurers are therefore highly invested in the landscape in which they operate, as it constitutes a large portion of the risk pool. Insurance companies’ influence on spatial, green design and the development of capabilities such as geocoding, can assist in protecting and maintaining this capital.
Read more about how the sustainability of manufactured capital is ensured through initiatives such as Dar es Salaam on page 33 or the Partnerships for Risk and Resilience on page 50.
Human capital takes the form of employees who work for insurance companies, intermediaries and supply chain partners. This capital depends on the availability of appropriate skills, and efforts by the industry to invest in, expand and transfer skills. Multinational groups are in a strong position to transfer skills through board memberships, secondments and group-wide training initiatives. Santam’s commitment to human capital growth is evident from its focus on improving employee diversity, developing supply chain preferential partners and collaborating with industry associations, such as the Financial Intermediaries Association of Southern Africa (FIA) and the South African Insurance Association (SAIA) to develop a black broker base for the industry.
Read more about human capital development in “The right people” on page 53, as well as in “Transformation highlights” on page 100.
INTELLECTUALIntellectual capital takes the form of industry-specific expertise and know-how and is changing with the expansion of the direct business model and other forms of technology-driven change. Regulatory requirements direct the use of this capital in terms of product development, distribution, pricing and client centricity. Intellectual capital provides a competitive advantage through the improved ability to price risk, innovative risk management capabilities and deep industry and underwriting experience and knowledge.
Read more about the safety campaign and Santam 24-hour Blockchain Hackathon initiative on page 37.
SOCIAL AND RELATIONSHIP
Insurance companies rely on relationships of trust to deliver on the promises made through their branded marketing activities. Instances of fraud or dissatisfaction destroy this capital to the detriment of the entire industry, while transformation to meet the needs of every market context expands this capital. This includes introducing more people to the benefits of insurance through financial literacy and other social investment initiatives. An insurance company’s value network of intermediaries and suppliers is an essential element of the business model.
Read more in the real-life story on page 33 and the section on Insurance good and proper on page 47.
NATURALAlthough insurance companies use relatively low levels of natural capital in their direct business activities, they impact the use, transformation and destruction of this capital through their investment activities and the risks that they insure. Climate risk, ecological degradation and natural disasters can have a significant impact on the financial capital of insurance companies. They rely on systemic risk management for mitigation.
Read more about proactive ways in which to manage natural disasters in the real-life story about Dar es Salaam on page 33.
HUMAN
SIX CAPITAL INPUTS, OUTPUTS AND OUTCOMESInsurance companies have the potential to positively impact all six capitals – the stocks of value that are affected or transformed by business
activities and outputs. This is possible given insurers’ ability to indirectly influence socio-economic activities through underwriting practices, claims
management and risk products. Increasing insurance penetration and reducing the risk protection gap benefits society in any market where an
insurer operates.

12
Running a business, large or small, requires hard work and the right partnerships. Our commercial expertise enables us to truly understand the risks a business faces and helps us ensure the correct insurance cover. That is one of the reasons 86 of the top 100 JSE-listed companies trust us to protect their businesses.
WE KNOW WHAT IS IMPORTANT FOR BUSINESS.


SA
NT
AM
INT
EG
RA
TE
D R
EP
OR
T 2
016
14
MA
TE
RIA
L M
AT
TE
RS
AN
D K
EY
FU
TU
RE
DR
IVE
RS
MATERIAL MATTERS AND KEY FUTURE DRIVERS
While the board has to consider financial priorities, such as Santam’s
ongoing solvency position, it also deliberates on early warning
indicators that may affect the future viability of the business. This
includes evaluating the implications arising from interaction between
the various financial and non-financial factors, as Santam has to be
able to respond with agility to emerging challenges and opportunities.
As part of the annual strategy review for 2016, Santam’s executive
team initiated a cross-group Insurance 2025 future-sketch scenario
process to inquire into the fundamental shifts at play in the world
and the group’s target market. The overarching framing question of
the exercise was: Insurance 2025: What is driving our future? The
approach ensured that the business formed a systemic, business-
portfolio-based and longer-term view of resource allocation.
MEGATRENDS SHAPING FUTURE WORLDSThe following megatrends – those transformative, global forces that
define the future world with a far-reaching impact on businesses,
societies, economies, cultures and personal lives – were used as
contextualising input into the scenario conversations.
Santam set ambitious targets for the group in Vision 2020: being the leading general insurer in selected emerging markets. To achieve this, and in the process of approving the group strategy, the board acknowledged that the business is exposed to a dynamic and shifting environment, locally and internationally, with much disruption being forecast for the insurance sector over the next decade.
The Insurance 2025 future-sketch scenarios enabled Santam to identify those matters that are most material for stakeholders – and therefore material for the group to continue creating value in the longer term.
VOLATILE ECONOMIC ENVIRONMENT
FEAR AND UNCERTAINTY IMPACTING DECISION-MAKING
THE FOOD-ENERGY-WATER NEXUS
COLLABORATION, SHARING AND PLATFORMS BECOMING THE NORM
URBAN MOVEMENT: (UN)PLANNED CHANGING FACES OF CITIES
GOVERNANCE: A CRISIS OF TRUST
THE NEW AFRICAN/ASIAN CONSUMER
MEGATRENDS SHAPING FUTURE WORLDS

SA
NT
AM
INT
EG
RA
TE
D R
EP
OR
T 2
016
15
MA
TE
RIA
L M
AT
TE
RS
AN
D K
EY
FU
TU
RE
DR
IVE
RS
VOLATILE ECONOMIC ENVIRONMENTLOCAL CONTEXTSouth Africa is facing a depressed economic outlook with evidence
of declining levels of business confidence, an uncertain political
environment, growing incidence of violent activism and low GDP
growth. Further social challenges include pay disparities, strikes
and continued inequality.
GLOBAL CONTEXTThe projection for global growth remains modest with continued
episodes of global asset market volatility, some loss of growth
momentum in the advanced economies, and continuing headwinds
for emerging market economies and lower-income countries.
Global non-life sector growth is expected to weaken due to moderate
economic activity and soft pricing, mainly in developed markets. The
outlook for emerging markets is mixed. Emerging Asia is forecast to
grow robustly, mainly driven by China because of government support
for insurance. Further backing will come from rate hikes in motor
third-party liability (MTPL) insurance in India, and infrastructure
investments in other Asian markets. However, detariffication of motor
in China and Malaysia could offset some of the positive momentum in
the region. Non-life premiums in Africa, the Middle East and Central
Asia is expected to continue to grow, but at a lower rate.
FEAR AND UNCERTAINTY IMPACTING DECISION-MAKINGVolatility has become an inherent feature of the international financial
system. Massive inflows of private capital into emerging markets are
frequently followed by sudden reversals. In many emerging countries,
government revenue from earnings on exports has also fallen –
especially for economies reliant on commodities – while deposit
growth in banking systems has waned.
Credit rating agencies are playing a critical role in channelling
reliable, objective and transparent information, which forms the basis
of investors’ decisions regarding where to invest and the pricing of
their investments.
THE FOOD-ENERGY-WATER NEXUSWith 2016 confirmed as the hottest year on record globally, major
parts of the world are experiencing droughts, water scarcity or floods
and rising sea levels, which are disrupting ecosystems and leading to
more extreme weather events. The drought fuelled by El Niño (likely
worsened by climate change) affected prices of goods and overall
food security in the short and medium term.
COLLABORATION, SHARING AND PLATFORMS BECOMING THE NORMThe fourth industrial revolution is disrupting almost every industry
in every country, transforming entire systems of production,
management and governance. This is creating a peer economy of
sharing, collaborative consumption and commercial peer-to-peer
mutualisation systems. These platforms allow consumers to engage
in monetised exchanges through peer-to-peer-based services or
temporary access to goods.
URBAN MOVEMENT: (UN)PLANNED CHANGING FACES OF CITIESThe world, including sub-Saharan Africa, is undergoing the largest
wave of urban growth in history. While today’s cities are designed
around the automobile, there is a shift in the demand for public
transportation options, parking spaces and pedestrian traffic.
Cities will increasingly use water and climate change as drivers for
development to create the best conditions for future generations.
Smart cities will use digital technologies to enhance performance and
well-being, to reduce costs and resource consumption, and to engage
more effectively and actively with citizens.
GOVERNANCE: A CRISIS OF TRUSTOne of the emerging global risks is a crisis of trust in institutions.
Citizens increasingly distrust public institutions, particularly
governments, large corporations, banks and multinationals – and
the traditional media. This is partly the result of rising inequality,
a sense of disenfranchisement and rising job insecurity, driving a
growing alienation between the elite and middle class. On the other
hand, institutions face an increasing level of scrutiny in the form of
increasing regulation.
This is resulting in an increasing need for businesses to act
more responsibly, ethically, transparently and be more
stakeholder orientated.
THE NEW AFRICAN/ASIAN CONSUMER60% of the global population lives in Asia and 16% in Africa, with the
current Asian median age at 29 and the comparative African age
at about 18.6 years. Africa’s young population is expected to drive
consumption and economic growth in the coming decades.
Africans are exceptionally optimistic about their future as they
become busier, healthier and more informed. Due to growth in
internet penetration and travel, Africans are more connected to global
trends than ever. Spending patterns are changing with a growing
middle class in Africa and Asia: more people are buying technology
goods and cars, and spending money on holidays, providing more
insurance options and demand.
SA
NT
AM
INT
EG
RA
TE
D R
EP
OR
T 2
016
16
MA
TE
RIA
L M
AT
TE
RS
AN
D K
EY
FU
TU
RE
DR
IVE
RS
THE SANTAM SCENARIO DEVELOPMENT PROCESSAt the core of the process was a two-day workshop, which involved
a wide range of stakeholders, including Santam and Sanlam
employees from a wide variety of business units, suppliers, service
providers, academic institutions, as well as public institutions and
industry associations. The participants were selected to be diverse
and represent a range of insights relevant to the contexts, territories
and market spaces for Santam – including external experts and
young millennials as conversation catalysts and to represent
broader perspectives.
Workshop participants developed future sketches by considering
the impact of megatrends, economic context, value networks and the
role of fintech (new and often disruptive technology and innovation
start-ups) in shaping financial services, including insurance, for
defined contexts.
The outcome of the process enabled the board and executive
management to understand the fundamental shifts at play in the
world and in the group’s competitive target markets. It also served
to prioritise the broader material stakeholder issues the group must
respond to for long-term sustainable value creation.
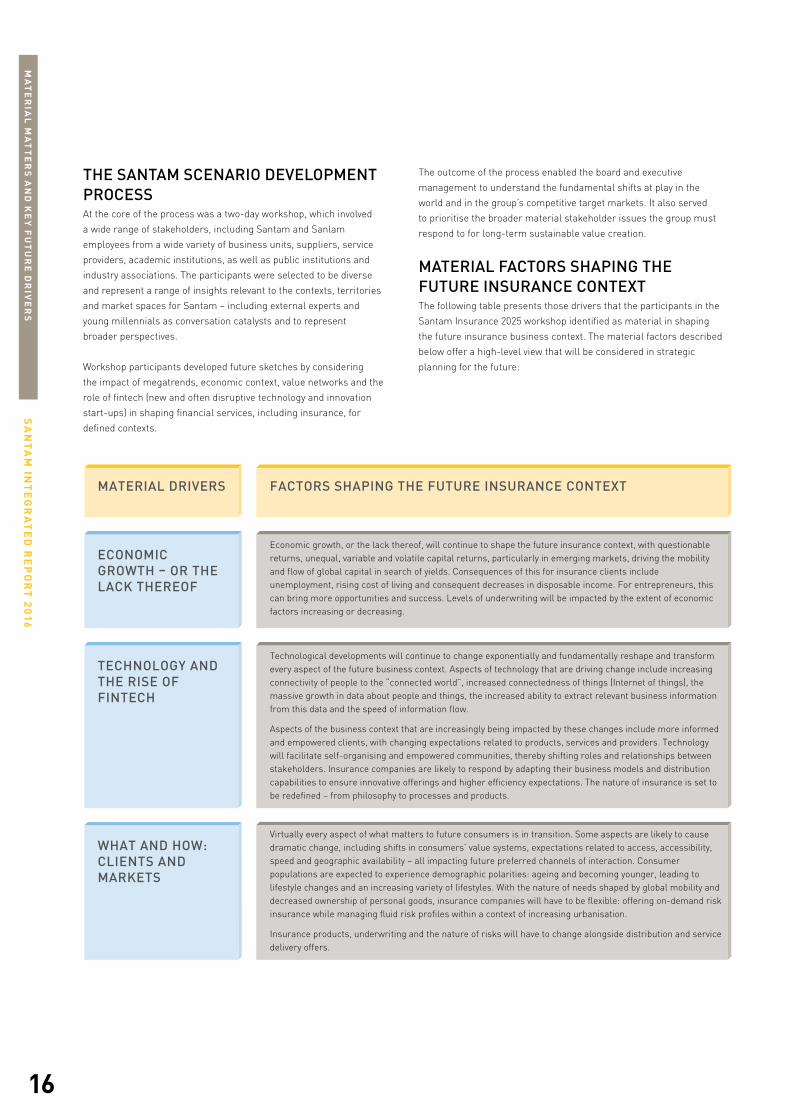
MATERIAL FACTORS SHAPING THE FUTURE INSURANCE CONTEXTThe following table presents those drivers that the participants in the
Santam Insurance 2025 workshop identified as material in shaping
the future insurance business context. The material factors described
below offer a high-level view that will be considered in strategic
planning for the future:
MATERIAL FACTORS
ECONOMIC GROWTH – OR THE LACK THEREOF
Economic growth, or the lack thereof, will continue to shape the future insurance context, with questionable returns, unequal, variable and volatile capital returns, particularly in emerging markets, driving the mobility and flow of global capital in search of yields. Consequences of this for insurance clients include unemployment, rising cost of living and consequent decreases in disposable income. For entrepreneurs, this can bring more opportunities and success. Levels of underwriting will be impacted by the extent of economic factors increasing or decreasing.
TECHNOLOGY AND THE RISE OF FINTECH
Technological developments will continue to change exponentially and fundamentally reshape and transform every aspect of the future business context. Aspects of technology that are driving change include increasing connectivity of people to the “connected world”, increased connectedness of things (Internet of things), the massive growth in data about people and things, the increased ability to extract relevant business information from this data and the speed of information flow.
Aspects of the business context that are increasingly being impacted by these changes include more informed and empowered clients, with changing expectations related to products, services and providers. Technology will facilitate self-organising and empowered communities, thereby shifting roles and relationships between stakeholders. Insurance companies are likely to respond by adapting their business models and distribution capabilities to ensure innovative offerings and higher efficiency expectations. The nature of insurance is set to be redefined – from philosophy to processes and products.
WHAT AND HOW: CLIENTS AND MARKETS
MATERIAL DRIVERS FACTORS SHAPING THE FUTURE INSURANCE CONTEXT
Virtually every aspect of what matters to future consumers is in transition. Some aspects are likely to cause dramatic change, including shifts in consumers’ value systems, expectations related to access, accessibility, speed and geographic availability – all impacting future preferred channels of interaction. Consumer populations are expected to experience demographic polarities: ageing and becoming younger, leading to lifestyle changes and an increasing variety of lifestyles. With the nature of needs shaped by global mobility and decreased ownership of personal goods, insurance companies will have to be flexible: offering on-demand risk insurance while managing fluid risk profiles within a context of increasing urbanisation.
Insurance products, underwriting and the nature of risks will have to change alongside distribution and service delivery offers.

SA
NT
AM
INT
EG
RA
TE
D R
EP
OR
T 2
016
17
MA
TE
RIA
L M
AT
TE
RS
AN
D K
EY
FU
TU
RE
DR
IVE
RS
ESG risks are increasing and will show an accelerated impact on the risk universe. Fundamental drivers include population growth, urbanisation, increased interconnectedness in societies, business and infrastructure, global climate risk, energy, water and food shortages, and failed or failing levels of governments. The changing risk profiles will include lower predictability of the nature and magnitude of risks, while taking into account the increasing interconnectedness of risks. Knock-on effects may include secondary impacts on infrastructure and business, potentially leading to dysfunctional and overwhelmed urban governments. Insurance products and the nature of risks underwritten will change, with a direct effect on underwriting philosophy, approach and processes.
ENVIRONMENTAL, SOCIAL AND GOVERNANCE (ESG) RISK PROFILES
POLITICAL AND REGULATORY INTERFACES
A combination of changing political agendas and regulatory regimes will continue shaping the future insurance environment. This includes drivers such as national protectionism and social objectives, combined with consumer protection demands.
Aspects of insurance that will continue to be informed by this include the potentially reduced ease of doing business and requirements for client data protection and usage. This is likely to increase the cost and complexity of doing business.
MATERIAL DRIVERS FACTORS SHAPING THE FUTURE INSURANCE CONTEXT
Increasing complexity will result from clients’, business’s and governments’ changing technology, lifestyle and risk profiles. Factors driving increased complexity include globalisation of business with the concomitant requirement to operate in different territories. Clients’ expectations for speed and convenience will drive insurance on demand, speed and universality of access. Aspects of insurance businesses that will be impacted include business models, the product range, design and development philosophy, underwriting approach and philosophy, with new demands placed on management and technical expertise. This will require employees and suppliers to be more flexible, open to change, and able to innovate and think differently.
A NEW INSURANCE VALUE CHAIN
Changes in the insurance value chain will continue to accelerate adjustments to all aspects of the business model. The underlying drivers include technology developments, fintech and increasing competition in response to mass customisation and omnichannel opportunities. The globalisation of risk and risk capital is likely to be one of the outcomes. This will result in changing underwriting and distribution models, and accelerated disintermediation, combined with collaboration opportunities with alternative or new players in the value chain. Insurers are likely to have to increase their size by expanding either scope or scale.
BUSINESS BECOMING SOCIAL ECOSYSTEMS
Collaboration and the forming of partnerships around various components of the value chain will change business, with increased partnerships with government(s) and cooperation with communities and consumer groupings. Relationships will be impacted, leading to new forms of competition.
DISRUPTIVE COMPETITION
COMPLEXITY RULES
The variety and sources of competition will increasingly blur traditional boundaries, reshape products, distribution and underwriting. Supplementary change factors include technology and fintech developments, and the globalisation of risk and capital markets. The need for new business volumes to drive premium growth and to diversify the risk pool will result in a blurring between insurance and reinsurance, in addition to alternative approaches to fulfilling insurance needs, e.g. self-insurance, insurance by product suppliers and community-based risk support schemes. Insurers’ approach to risk management, underwriting, insurance products and distribution will have to change.

SA
NT
AM
INT
EG
RA
TE
D R
EP
OR
T 2
016
18
MA
TE
RIA
L M
AT
TE
RS
AN
D K
EY
FU
TU
RE
DR
IVE
RS
SANTAM’S STRATEGIC RESPONSESantam strives to maximise socio-economic welfare, enhance
stakeholders’ sustainability and build a more resilient world through
the provision of risk solutions in selected emerging markets, while
delivering on its brand promise of Insurance good and proper.
The group follows a regular and robust strategic review process –
with the addition of a scenario development initiative this year. The
strategy development process focuses on material imperatives and
is designed to:
− identify the material contextual drivers of the ESG systems
that the business portfolio is embedded in;
− sense the changes in the competitive environment that
are relevant;
− identify the strategic variables that the group has to manage
for present and future success;
− make clear and informed choices about what the group will
and will not do; and
− review and establish strategic imperatives and performance
criteria at group and business unit level.
The group determines the strategic focus areas and targets. Each
business unit then takes responsibility for its own strategic process,
focusing on implementation through go-to-market strategies and
projects, operational implications and resource allocations. A
dashboard tracks strategic implementation against key metrics and
is shared with the board on a quarterly basis.
The annual budget and business planning cycle ensures that the
group takes a systemic, portfolio-based and long-term view of
resource allocation, cultural and behavioural elements and strategic
initiatives. The aim is to ensure the effective setting of and delivery on
the strategy and targets.
Santam’s Vision 2020 strategy was tested against the future contexts
and continued to provide appropriate and relevant focus for the group.
The following five focus areas were retained for the group to be
able to create value by being the leading general insurer in selected
emerging markets:
INSURANCEGOOD AND
PROPER
GROWTH THROUGH
INNOVATION ANDDIVERSIFI-
CATION
CONTINUOUSLYINCREASE
EFFICIENCY
MANAGETHE RISK
POOL
THE LEADINGGENERAL INSURER
IN SELECTEDEMERGINGMARKETS
THE RIGHTPEOPLE
Vision 2020 recognises that progression relies on adherence to
the Santam Way, the creation of stakeholder value, long-term
sustainability, reducing systemic risk and fulfilling Santam’s socio-
economic responsibility.
The Santam Way defines the culture that is embedded throughout the
group. Although some of the business units and subsidiaries have
formulated their own values and codes, these are fully aligned with
the group values of integrity, passion, humanity, innovation
and excellence.
READ MORE ABOUT PROGRESS PER STRATEGIC FOCUS AREA IN THE LEADERSHIP REPORT FROM PAGE 47.
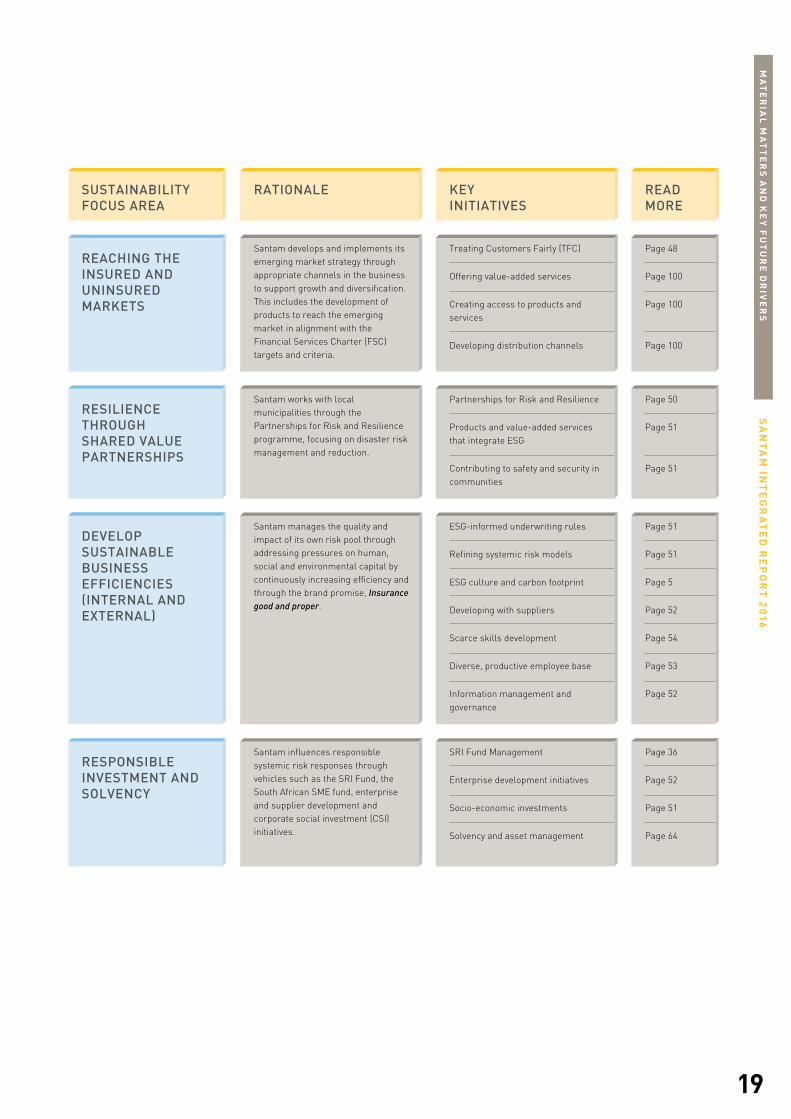
SUSTAINABILITY FOCUS AREASThe Santam sustainability framework is continually reviewed
and refined with the social, ethics and sustainability committee
providing regular oversight. Key initiatives have been identified with
accountabilities allocated to relevant executives.
SA
NT
AM
INT
EG
RA
TE
D R
EP
OR
T 2
016
19
MA
TE
RIA
L M
AT
TE
RS
AN
D K
EY
FU
TU
RE
DR
IVE
RS
MATERIAL FACTORS
REACHING THE INSURED AND UNINSURED MARKETS
Santam develops and implements its emerging market strategy through appropriate channels in the business to support growth and diversification. This includes the development of products to reach the emerging market in alignment with the Financial Services Charter (FSC) targets and criteria.
RESILIENCE THROUGH SHARED VALUE PARTNERSHIPS
DEVELOP SUSTAINABLE BUSINESS EFFICIENCIES (INTERNAL AND EXTERNAL)
RESPONSIBLE INVESTMENT AND SOLVENCY
SUSTAINABILITY FOCUS AREA
RATIONALE
Treating Customers Fairly (TFC)
Offering value-added services
Creating access to products and services
Developing distribution channels
KEY INITIATIVES
Page 48
Page 100
Page 100
Page 100
READMORE
Santam works with local municipalities through the Partnerships for Risk and Resilience programme, focusing on disaster risk management and reduction.
Partnerships for Risk and Resilience
Products and value-added services that integrate ESG
Contributing to safety and security in communities
Page 50
Page 51
Page 51
Santam influences responsible systemic risk responses through vehicles such as the SRI Fund, the South African SME fund, enterprise and supplier development and corporate social investment (CSI) initiatives.
SRI Fund Management
Enterprise development initiatives
Socio-economic investments
Solvency and asset management
Page 36
Page 52
Page 51
Page 64
Santam manages the quality and impact of its own risk pool through addressing pressures on human, social and environmental capital by continuously increasing efficiency and through the brand promise, Insurance good and proper.
ESG-informed underwriting rules
Refining systemic risk models
ESG culture and carbon footprint
Developing with suppliers
Scarce skills development
Diverse, productive employee base
Information management and governance
Page 51
Page 51
Page 5
Page 52
Page 54
Page 53
Page 52


Our intermediaries are a crucial link to our clients, and remain the cornerstone of our business. That is why we nurture the future success of intermediaries by offering them tools, support and advice to help them deliver insurance good and proper.
OUR STRENGTH LIES IN OUR PARTNERSHIPS.
SA
NT
AM
INT
EG
RA
TE
D R
EP
OR
T 2
016
22
GR
OU
P A
T A
GL
AN
CE
GROUP AT A GLANCE
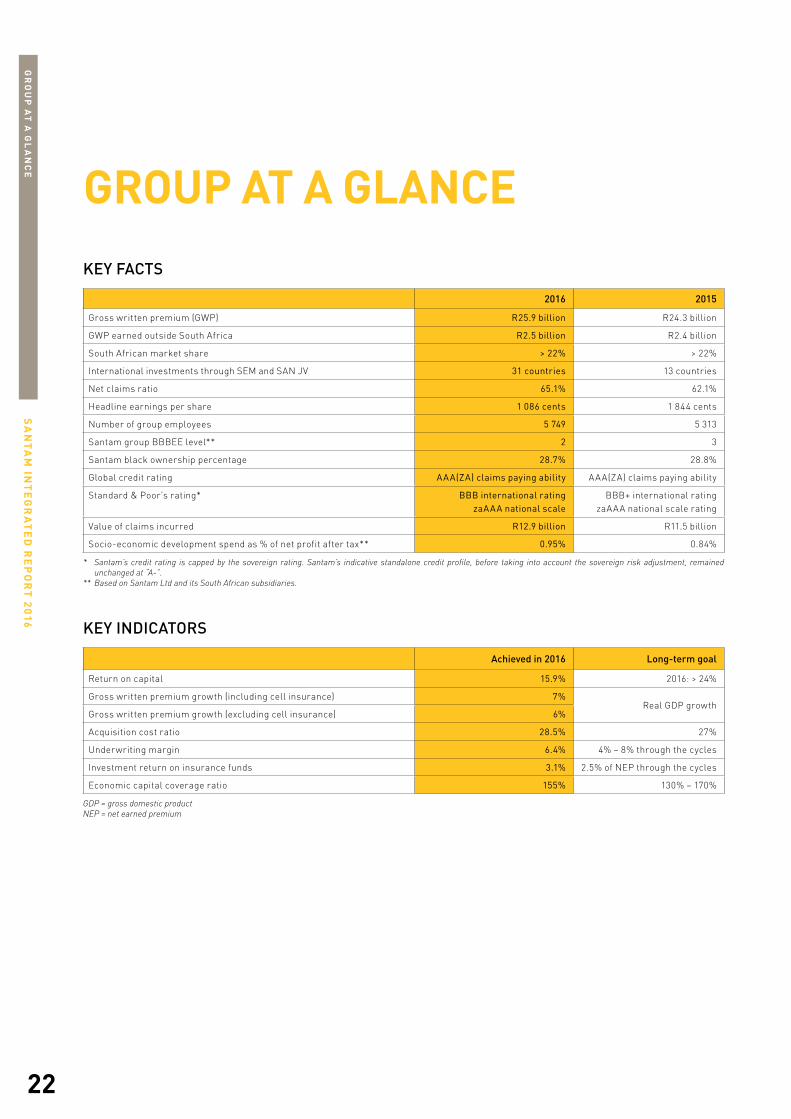
2016 2015
Gross written premium (GWP) R25.9 billion R24.3 billion
GWP earned outside South Africa R2.5 billion R2.4 billion
South African market share > 22% > 22%
International investments through SEM and SAN JV 31 countries 13 countries
Net claims ratio 65.1% 62.1%
Headline earnings per share 1 086 cents 1 844 cents
Number of group employees 5 749 5 313
Santam group BBBEE level** 2 3
Santam black ownership percentage 28.7% 28.8%
Global credit rating AAA(ZA) claims paying ability AAA(ZA) claims paying ability
Standard & Poor’s rating* BBB international ratingzaAAA national scale
BBB+ international rating zaAAA national scale rating
Value of claims incurred R12.9 billion R11.5 billion
Socio-economic development spend as % of net profit after tax** 0.95% 0.84%
* Santam’s credit rating is capped by the sovereign rating. Santam’s indicative standalone credit profile, before taking into account the sovereign risk adjustment, remained unchanged at “A-”.
** Based on Santam Ltd and its South African subsidiaries.
KEY INDICATORS
KEY FACTS
Achieved in 2016 Long-term goal
Return on capital 15.9% 2016: > 24%
Gross written premium growth (including cell insurance) 7%Real GDP growth
Gross written premium growth (excluding cell insurance) 6%
Acquisition cost ratio 28.5% 27%
Underwriting margin 6.4% 4% – 8% through the cycles
Investment return on insurance funds 3.1% 2.5% of NEP through the cycles
Economic capital coverage ratio 155% 130% – 170%
GDP = gross domestic productNEP = net earned premium

SA
NT
AM
INT
EG
RA
TE
D R
EP
OR
T 2
016
23
GR
OU
P A
T A
GL
AN
CE
THIS IS THE SANTAM GROUPSantam is a multinational general insurance group that writes
insurance business in South African and Namibia and has
investments and clients in a further 31 countries. It is the leading
general insurer in South Africa with a market share of more than
22%. The group provides a diversified range of general insurance
products and services through a network of 2 700 intermediaries and
direct channels. The group boasts more than 1 million policyholders,
ranging from individuals to commercial and specialist business
owners and institutions in South Africa.
The group derives revenue from insurance activities and investments.
Insurance activities include commercial and personal insurance
and alternative risk cover. The performance of insurance activities is
based on gross written premium as a measure of growth, with net
underwriting result as a measure of profitability.
The group consists of the Santam branded business units (Santam
Commercial and Personal, Santam Specialist and Santam re) and
wholly-owned subsidiaries – MiWay (direct insurer), Centriq (cell
captive insurer) and Brolink (an independently managed insurance
administration business). A number of specialist underwriting
managers are included within Santam Specialist.
The group also participates in investments and partnerships in
emerging markets in Africa, India and Southeast Asia through
collaboration with SEM.
Santam holds an effective 7.5% stake in the Moroccan-based
Saham Finances via its 25% shareholding in SAN JV with SEM,
which significantly expands the Santam footprint across the African
continent. The group’s other significant associates constitute its
40% interest in Western Group Holdings (personal and commercial
insurer). The group also holds a 49% interest in start-up general
insurer Professional Provident Society Short-term Insurance
Company Ltd (PST) and a 24% interest in Indwe (an independently
managed insurance intermediary business).
The Santam business units set out in the accompanying diagram are
responsible for implementing their business strategies and plans
to contribute collectively to the value creation of the group. The
Santam group governance policy stipulates the manner in which each
business unit undertakes its business and how this is agreed between
the parties and approved by the relevant boards. Over and above this,
shareholder and/or binder holder agreements form the contractual
basis whereby outsourced underwriting activities are governed.
A core “tight” principle that applies throughout the group is that
Santam does not underwrite business that is not well understood.
The business units share various group governance and support
functions for consistency and efficiency.
Santam is a subsidiary of South African financial services group,
Sanlam, which holds 61.5% of Santam’s shares.
SA
NT
AM
INT
EG
RA
TE
D R
EP
OR
T 2
016
24
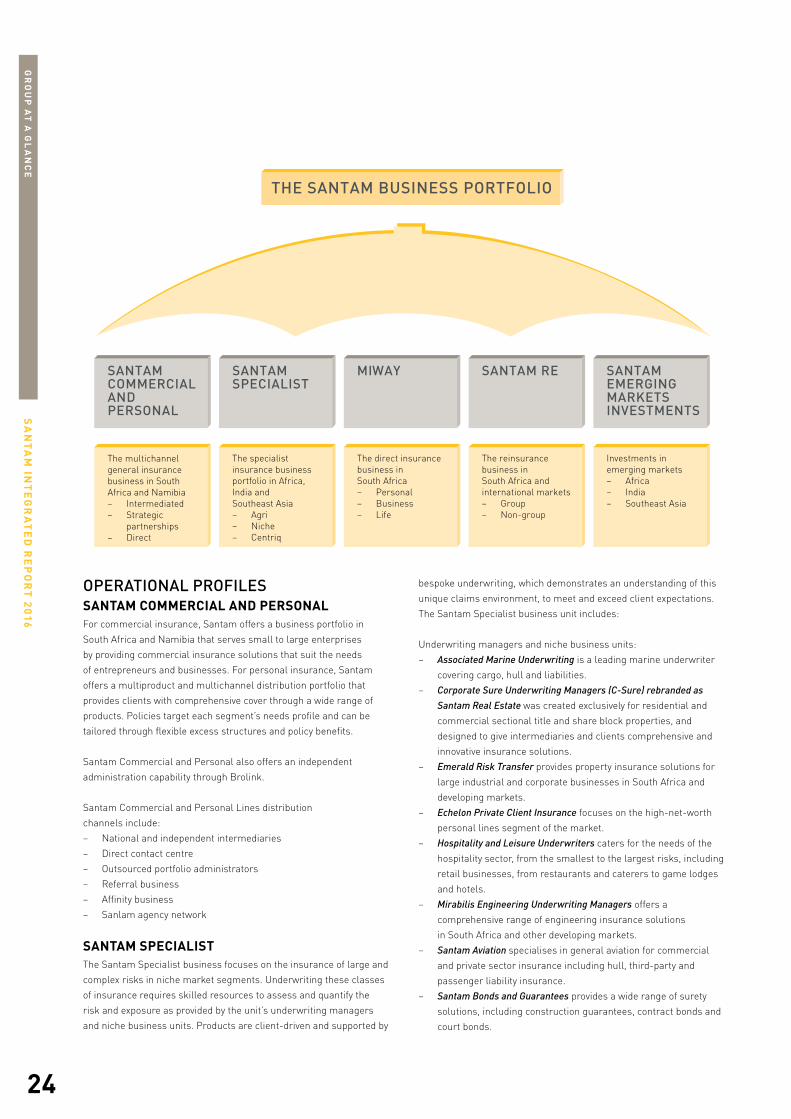
THE SANTAM BUSINESS PORTFOLIO
MIWAY SANTAM RESANTAM SPECIALIST
SANTAM COMMERCIALANDPERSONAL
SANTAM EMERGINGMARKETSINVESTMENTS
The multichannel general insurance business in South Africa and Namibia– Intermediated– Strategic
partnerships– Direct
The specialist insurance business portfolio in Africa, India and Southeast Asia– Agri– Niche– Centriq
The direct insurance business in South Africa– Personal– Business– Life
The reinsurance business in South Africa and international markets– Group– Non-group
Investments in emerging markets– Africa– India– Southeast Asia
OPERATIONAL PROFILESSANTAM COMMERCIAL AND PERSONAL For commercial insurance, Santam offers a business portfolio in
South Africa and Namibia that serves small to large enterprises
by providing commercial insurance solutions that suit the needs
of entrepreneurs and businesses. For personal insurance, Santam
offers a multiproduct and multichannel distribution portfolio that
provides clients with comprehensive cover through a wide range of
products. Policies target each segment’s needs profile and can be
tailored through flexible excess structures and policy benefits.
Santam Commercial and Personal also offers an independent
administration capability through Brolink.
Santam Commercial and Personal Lines distribution
channels include:
− National and independent intermediaries
− Direct contact centre
− Outsourced portfolio administrators
− Referral business
− Affinity business
− Sanlam agency network
SANTAM SPECIALISTThe Santam Specialist business focuses on the insurance of large and
complex risks in niche market segments. Underwriting these classes
of insurance requires skilled resources to assess and quantify the
risk and exposure as provided by the unit’s underwriting managers
and niche business units. Products are client-driven and supported by
bespoke underwriting, which demonstrates an understanding of this
unique claims environment, to meet and exceed client expectations.
The Santam Specialist business unit includes:
Underwriting managers and niche business units:
− Associated Marine Underwriting is a leading marine underwriter
covering cargo, hull and liabilities.
− Corporate Sure Underwriting Managers (C-Sure) rebranded as
Santam Real Estate was created exclusively for residential and
commercial sectional title and share block properties, and
designed to give intermediaries and clients comprehensive and
innovative insurance solutions.
− Emerald Risk Transfer provides property insurance solutions for
large industrial and corporate businesses in South Africa and
developing markets.
− Echelon Private Client Insurance focuses on the high-net-worth
personal lines segment of the market.
− Hospitality and Leisure Underwriters caters for the needs of the
hospitality sector, from the smallest to the largest risks, including
retail businesses, from restaurants and caterers to game lodges
and hotels.
− Mirabilis Engineering Underwriting Managers offers a
comprehensive range of engineering insurance solutions
in South Africa and other developing markets.
− Santam Aviation specialises in general aviation for commercial
and private sector insurance including hull, third-party and
passenger liability insurance.
− Santam Bonds and Guarantees provides a wide range of surety
solutions, including construction guarantees, contract bonds and
court bonds.
GR
OU
P A
T A
GL
AN
CE

SA
NT
AM
INT
EG
RA
TE
D R
EP
OR
T 2
016
25
− Santam Transport is the leading heavy commercial vehicle insurer
in South Africa, offering comprehensive cover to transport
contractors.
− Stalker Hutchinson Admiral (SHA) provides insurance against
broad-form liability, bankers blanket, cyber and computer
crime, directors’ and officers’ liability, professional indemnity
for traditional and emerging professions, as well as personal
accident, kidnap and ransom, and motor fleet insurance.
− Travel Insurance Consultants (TIC) is South Africa’s largest travel
insurance provider that offers specialised travel insurance
solutions, including emergency medical, loss of money
or baggage, travel supplier insolvency for leisure and
corporate travellers.
− Vulindlela Underwriting Managers (VUM) specialises in providing
a range of insurance solutions for owners of minibus, midibus
and metered taxis in South Africa. VUM has recently entered the
small, medium and micro-enterprises (SMME) market to expand
the relationship off the taxi base to include other assets and
motor vehicles in emerging markets.
Centriq is a specialist cell captive insurer that focuses on
alternative risk transfer, underwriting management and affinity
insurance sectors.
Santam Agriculture is the leading crop insurer in South Africa,
focusing on named peril insurance and multiperil crop insurance.
MIWAYMiWay is a direct insurer in the group, underwriting predominantly
personal lines general insurance business, with a business insurance
product that was launched in 2014. MiWay supports Santam’s strategy
of growth through diversification and enables it to coexist well with
and complement the intermediary business model within the group.
MiWay launched a broker-direct model in May 2015.
Current services include:
− General insurance (motor, home owners and household contents)
− Motor warranty
− Credit life
− Accidental death and disability
− Other value-added products
− Business insurance
− Life insurance (underwritten by Sanlam Life Insurance Ltd)
SANTAM RESantam re is a wholesale reinsurance service provider for
the Santam/Sanlam group general insurance businesses and
independent general insurers in South Africa, Africa, India and Asia,
including China and South Korea. Santam re operates on the Santam
general insurance licence and enables the group to optimise the
size, quality and diversity of its overall risk pool, relative to its capital
resources and risk appetite.
SANTAM EMERGING MARKETS INVESTMENTSThrough its partnership with SEM, Santam has economic
participation in 13 countries in Africa, India and Southeast Asia.
SEM’s shareholding in Saham Finances, through its shareholding in
SAN JV, expanded this to North, East and West Africa, and the Middle
East, with Saham Finances operating in 26 countries. Santam acts as
the general insurance technical partner for SEM. The international
diversification strategy is enabled by Santam re and Santam
Specialist. This forms part of the group’s multichannel and multi-
territory strategy through different business units.
READ MORE ABOUT THE PERFORMANCE OF EACH BUSINESS UNIT IN THE LEADERSHIP REPORT FROM PAGE 40 AND THE FINANCIAL REVIEW FROM PAGE 58.
CLASSES OF GENERAL INSURANCE PRODUCTSSantam Commercial and Personal Santam Specialist MiWay Santam re
Accident
Aviation
Engineering
Guarantee
Liability
Marine
Motor
Property
Accident and health
Alternative risk transfer
Aviation
Crop
Engineering
Guarantee
Liability
Life
Livestock and game
Marine
Motor
Property
Life
Motor
Property
Accident
Engineering
Guarantee
Liability
Marine
Motor
Property
Santam re writes proportional and non-proportional reinsurance on marine and non-marine classes.
Santam Emerging Markets Investments provides technical support in all classes to all investment partners.
GR
OU
P A
T A
GL
AN
CE

SA
NT
AM
INT
EG
RA
TE
D R
EP
OR
T 2
016
26
SANTAM’S SUSTAINABLE COMPETITIVE ADVANTAGES
90% 90%
10%
68%
32%
Geographic transformation (source of gross premium)
Channel transformation (source of gross premium)
Employee profile
Intermediated Direct Black White
10 years ago:
100%10 years ago:
100%10 years ago:
44%
10-YEAR TRANSFORMATION AND DIVERSIFICATION INDICATORS
R1.5 billioninvested in technology enablers over the past 10 years to replace legacy systems and position Santam for multinational growth
“We will continue to focus on transformation of our employees and suppliers.”
– Lizé Lambrechts
4% 4% 2%
South Africa
Namibia
Rest of Africa
Southeast Asia, India, Middle East and China
GR
OU
P A
T A
GL
AN
CE
Note: The above represents Santam group (excluding SEM and SAN JV investments).

SA
NT
AM
INT
EG
RA
TE
D R
EP
OR
T 2
016
27
SUSTAINABLE COMPETITIVE ADVANTAGES
COMPETITIVENESSSantam’s geographical footprint, scale, brand strength, business diversity and distribution networks put the group in a strong competitive position in South Africa, where it has a market share in excess of 22%. The group also benefits from the diversity of its product offering and multiple channel capabilities (including a growing direct channel market share), which have contributed to sustained underwriting surpluses despite challenging operating conditions. It currently insures 86 of the top 100 companies listed on the JSE and has a network of more than 2 700 intermediaries.
Through its partnership with SEM, it offers intermediaries access to insurance licences across the African continent, India and Malaysia.
CONSISTENCYSantam has been able to achieve underwriting profits consistently, while adapting its business model to the prevailing market conditions and risks. Since its establishment in 1918, the group has diversified its portfolio, focusing on profitability rather than only on increasing market share. The group has enjoyed the benefit of a strong, stable and strategically aligned core shareholder in Sanlam.
Santam continues to be recognised in the market: it was again voted the leading general insurer in South Africa by the intermediary community in the Personal Insurance category at the Financial Intermediaries Association (FIA) of Southern Africa’s annual Insurer of the Year awards in 2016. Consumers recognise the brand through the South African Consumer Satisfaction Index, the Sunday Times Top Brands Survey and Top Employer certification.
COMPETENCESantam has a world-class scientific underwriting capability supported by a strong and experienced management team. Its pool of specialist insurance skills and knowledge is evident in the success of its specialist business, which offers a complex range of insurance cover. Due to its integrated systems and processes, the group is also able to deal proactively with and benefit from regulatory changes, which can constitute high barriers of entry into the industry for new players.
Santam’s competence includes its ability to maintain and grow a large and complex network of intermediaries, suppliers and business partners.
Santam has a stringent capital management framework underpinned by an internally developed, risk-based capital model and embedded enterprise risk management (ERM) framework, which is integrated into strategic decision-making and capital allocation.
GROWTH OPPORTUNITIES
Santam has a strong international diversification capability through its partnership with SEM, and through Santam re and Santam Specialist. This gained further traction in Africa following the SAN JV (Saham Finances) transaction. A new agreement was also concluded with Munich Re of Africa for certain Santam businesses to use its AA- S&P credit rating from 1 January 2017. MiWay attracts new and previously uninsured policyholders through its new online life and business insurance offerings in South Africa. Acquisitive growth opportunities in the local market are limited due to Santam’s dominant position, but organic growth remains a focus area, driven by Santam’s well-established intermediary network, integration opportunities with Sanlam’s distribution network and development of the Santam direct distribution channel.
RETURNSEfficient capital management and a stable dividend policy have enabled Santam to deliver consistent returns. An average return on capital of 23.6% has been achieved over the last 10 years and 22.5% over the last five years. Ordinary dividend per share compound growth of 8.9% has been achieved over the last 10 years and four special dividends have been paid. The unwinding of the BBBEE scheme in 2015 created a combined value of R1.1 billion for participants. The business is highly cash generative and investment performance has a solid track record.
THE SANTAM BRAND
Santam is associated with brands such as MiWay, Centriq, the specialist underwriting managers’ brands and several niche business unit brands. These other brands are well regarded and acknowledge the importance of being associated with the Santam brand – which is internationally known – when doing business on the continent. The Santam brand remains the most recognised and awarded among the group brands, all of which embrace the ethos around Santam’s brand positioning, Insurance good and proper, which emphasises responsible and ethical insurance.
SUSTAINABLE AND RESPONSIBLE
Santam plays a leading and active role amid global insurance players by setting the tone in South Africa and selected emerging markets through participation in ClimateWise and PSI initiatives. Santam’s integrated approach to managing long-term sustainability through improved management of systemic risk ensures alignment with the strategic drivers of the business. Santam’s sustainability journey focuses on:− reaching the insured and uninsured markets;− resilience through shared value partnerships;− responsible investment and solvency; and− developing sustainable business efficiencies (internal and external).
GR
OU
P A
T A
GL
AN
CE

SA
NT
AM
INT
EG
RA
TE
D R
EP
OR
T 2
016
28
SAN JV (Saham Finances) investment
Santam group subsidiaries
SEM investments
GEOGRAPHIC ANALYSIS OF INVESTMENTS
“Santam has a strong competitive position, mainly stemming from its favourable brand and reputation, dominant position in the South African market, and an operating performance that we consider to be better than its peers ... It remains the market leader and we believe Santam can draw on its positive brand differentiation relative to peers to help shape the South African market.” – S&P Global, RatingsDirect, May 2016
GR
OU
P A
T A
GL
AN
CE

SA
NT
AM
INT
EG
RA
TE
D R
EP
OR
T 2
016
29
GR
OU
P A
T A
GL
AN
CE
SA
NT
AM
INT
EG
RA
TE
D R
EP
OR
T 2
016
30
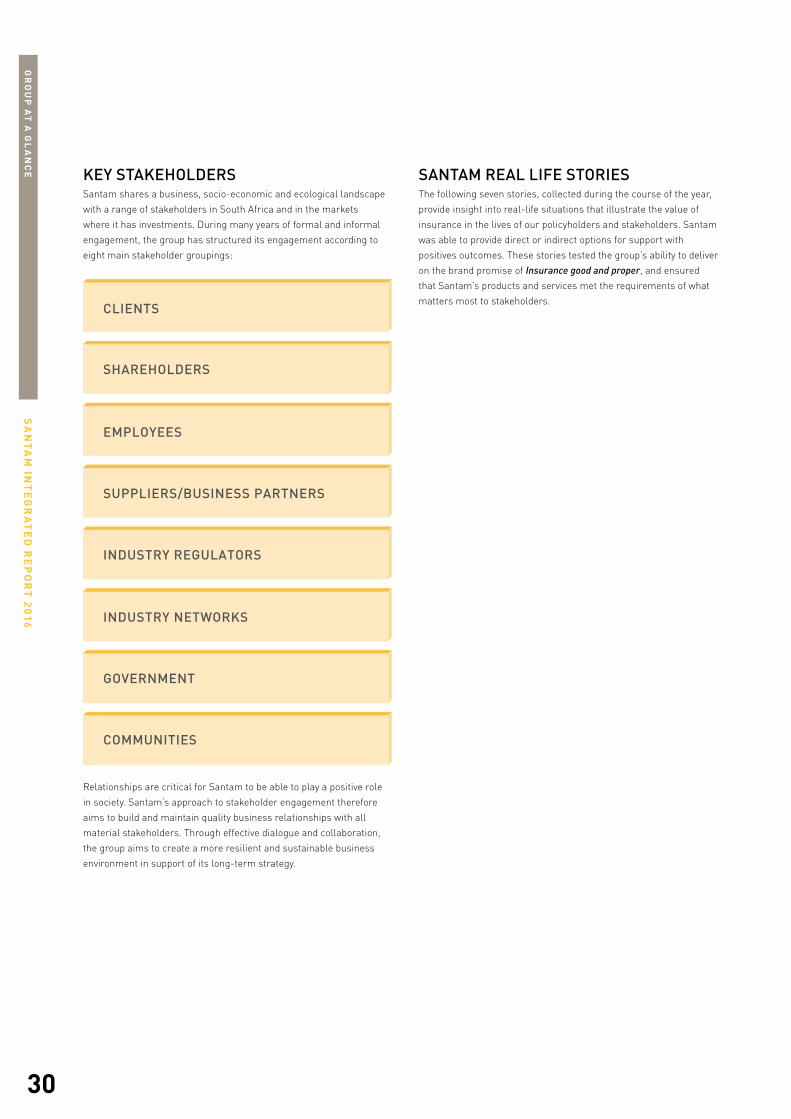
KEY STAKEHOLDERSSantam shares a business, socio-economic and ecological landscape
with a range of stakeholders in South Africa and in the markets
where it has investments. During many years of formal and informal
engagement, the group has structured its engagement according to
eight main stakeholder groupings:
CLIENTS
SHAREHOLDERS
EMPLOYEES
SUPPLIERS/BUSINESS PARTNERS
INDUSTRY REGULATORS
INDUSTRY NETWORKS
GOVERNMENT
COMMUNITIES
Relationships are critical for Santam to be able to play a positive role
in society. Santam’s approach to stakeholder engagement therefore
aims to build and maintain quality business relationships with all
material stakeholders. Through effective dialogue and collaboration,
the group aims to create a more resilient and sustainable business
environment in support of its long-term strategy.
SANTAM REAL LIFE STORIESThe following seven stories, collected during the course of the year,
provide insight into real-life situations that illustrate the value of
insurance in the lives of our policyholders and stakeholders. Santam
was able to provide direct or indirect options for support with
positives outcomes. These stories tested the group’s ability to deliver
on the brand promise of Insurance good and proper, and ensured
that Santam’s products and services met the requirements of what
matters most to stakeholders.
GR
OU
P A
T A
GL
AN
CE

31
FROM EMERGING TO COMMERCIAL FARMERS
It is not an easy time to be a farmer in South Africa. Besides changing weather patterns, the crippling drought, labour costs and unrest, crop disease, declining competitiveness in global markets and limited resources are all putting strain on South Africa’s shrinking agricultural sector.
One of the sector’s challenges is to convert subsistence farming into commercial farming, thereby empowering emerging farmers to become profitable and sustainable. A recent Santam training programme, involving close to 800 emerging farmers from villages and rural towns across the country, contributed to imparting necessary financial and business skills to the farmers.
“The training has really assisted me in managing my small farming enterprise,” says William Mmakola, an emerging farmer from the Tsimanyane Village in Limpopo and a member of the Willpot Young Farmers Cooperative. “The practical lessons I learnt are now helping me to set and manage my business plans and do financial projections. I have already drawn up a worksheet to manage the turnover earned from the cultivation of fresh produce,” he says.
Klass Ridane, from Mpumalanga, shares Mmakola’s sentiment and says the training provided him with useful information that is helping him manage the financial duties in his small farming operation. “The training has given me a lot of practical tips and ideas on how to run the business better and to motivate our workers as we start planting our winter crops.”
“I wish the rest of our community had the opportunity to attend the training as I learnt so much,” says Mapule Emily Moggi from Brilliant Farming Corporation in Gauteng. “It is something many people can benefit from and it will help us to be better farmers.”
Gerhard Diedericks, head of Santam Agriculture, explains that the insurer recognises agriculture as key to the future health of the South African economy, and thus embarked on this training campaign, the first of its kind in the industry. “Santam is committed to assisting emerging farmers, as they are vital to the long-term sustainability of the agriculture sector. While significant challenges face all farmers, small and emerging farmers require even more support. They may not always have the necessary skills and support to bounce back when fate steps in.”
Farmers were given face-to-face financial skills training, information on risk management, and ongoing mentorship and support. Participants were sourced through Santam’s relationship with agricultural bodies such as the African Farmers’ Association of South Africa (AFASA), the National Emergent Red Meat Producers’ Organisation (NERPO) and existing Santam clients.
Santam’s emerging farmer training programme forms part of a broader consumer financial education strategy initiated by the insurer aimed at community upliftment and promoting access to financial services. It is done in support of government’s drive to combat the challenges of poverty, unemployment and inequality, but with the understanding that emerging markets have specific needs.

32
INSURING A NEXT-GENERATION CLIENT
Dear Santam
Good morning my name is Angelica Bottari. I am 10 years old. We had a car break-in in Cape Town where they stole my phone, jacket and earphones. Thank you for replacing my stolen items so fast.
Kind regards
A future clientAngelica Bottari
This was the letter received by Santam Claims from the 10-year-old daughter of a happy Johannesburg client in July 2016. Angelica had come to Cape Town on holiday with her family and, while they were having lunch in a restaurant in the Bo-Kaap, her possessions were stolen out of their rental car.
“We parked the car and, as always, I told Angelica to put her cellphone away. She left it on the car seat and covered it with her new K-Way jacket. When we got back to the car, the back window had been smashed and her jacket, earphones and cellphone were all gone. She started crying and, even after we flew back to Johannesburg the next day, she was inconsolable,” says her mom, Carol Bottari.
Carol, who runs her own insurance brokerage firm, submitted an insurance claim with Santam and, within a few days, Angelica’s new replacement phone, earphones and jacket had been delivered to her.
“I use my phone mainly to play games, watch YouTube, take photos and have WhatsApp convos with my friends. I was very impressed at how quickly Santam replaced everything and so happy to have a phone again,” says Angelica, who turned 10 last December.
As the daughter of an insurance broker, Angelica is already familiar with the concept of insurance and wanted to say “thank you” to the Santam employee who helped her, “Just like a thank you letter to Santa.”
Santam Claims did extensive work this year to map the customer’s journey. This required that employees put themselves into the shoes of the client, and recognise how they impact the client’s experience at every point in the process. The team shifted the expectation that “the client should follow up” to a proactive, client-centric approach. Below are examples of client feedback:
From a policyholder:I wish to highlight to you both the excellent and speedy service I received with regard to my cellphone claim. I accidentally dropped my phone yesterday late afternoon; lodged the claim and was about to go and get a damage report done today. However, Nafisa called and said that Santam is prepared to have my phone replaced and she set the process in motion. She has sourced a phone already and it is at present available for collection. Thank you, Nafisa! You are really an ambassador for the Santam brand of Insurance good and proper with your commitment to outstanding service delivery.
From an intermediary:Thank you very much for your assistance with this difficult matter. Thank you for keeping on following up and giving feedback. Thank you for keeping on referring the matter and obtaining assistance, and for keeping calm and professional. That is really providing good client service.
From a policyholder:Just wished to notify you of the extremely efficient service we received from one of your listed plumbers as well as your efficient call centre lady. I called in Friday afternoon Oct 14th at wits’ end, with problems relating to our apartment geyser. I was truly impressed by their quick, efficient and professional service. I honestly assumed because it was a Friday afternoon call to your call centre, my geyser will only get attended to the Monday after the weekend and we would have to somehow make do, or seek alternate arrangements. I was truly and honestly impressed at how quickly the matter was attended to.

33
DAR ES SALAAM CITY MANAGEMENT LEARNS ABOUT RISK AND RESILIENCE IN INFRASTRUCTURE DEVELOPMENT
Billions of dollars are flowing into Africa to meet the growing infrastructure needs of the continent. However, with this massive investment comes the responsibility to create and build sustainably. This raises the question as to whether the stakeholders involved in individual projects are mindful of the broader risks and impacts, especially over the longer term. This entails the eventual asset management once the project is completed and handed over to asset owners.
The port city of Dar es Salaam in Tanzania faces two challenges. The first is that, as one of the fastest growing economies in Africa with limited financial resources, the city has to invest in public infrastructure, which carries a number of risks, not least of which is flooding on a near-annual basis. The second challenge is that global financial institutions providing capital for large infrastructure projects typically only seek insurance cover towards the end of the process. Unfortunately, often at a late stage in the process, some unavoidable risks are typically already embedded in the project.
Building on lessons learnt from the United Nations Environment Programme Finance Initiative’s (UNEF FI) Principles for Sustainable Insurance (PSI) Global Resilience Project (GRP), it was felt that there would be benefit in considering risk management proactively – before projects are contracted and in a non-competitive space, where city managers could engage with insurance professionals.
Santam initiated a process in 2014 to explore how the general insurance industry in the region might best engage with infrastructure decision-makers in Africa, for example city engineers and planners. Sustainable city infrastructure is a critical element to enhance protection and readiness against possible disaster events such as fires and floods. Under the banner of “African Infrastructure Risk and Resilience”, a series of conversations and workshops took place through 2015 and 2016. These involved representatives from Santam and Sanlam, including various experts in sustainable infrastructure, finance and investment.
The research included a two-day intensive workshop in Dar es Salaam in October 2016, with members of the insurance sector and Dar es Salaam city officials. The workshop was declared a breakthrough in mutual understanding, opening up a range of opportunities for future learning and collaboration for both sides. What emerged, aside from a lengthy list of collaborative actions various participants committed to, was a mutually agreed “decision pathway” describing the logical necessary steps a city government must take if it is to attain genuinely resilient, sustainable infrastructure. The city officials said they found this – and the discussions leading up to the workshop – exceptionally helpful, as they had never considered decision-making from a proactive risk management perspective before.
A key outcome of the intervention was the request for insurers to demonstrate the cost/benefit at city level for risk protection and sensible regulation. The initiative pioneered a methodology of motivating city management to engage with the insurance sector, which will be shared globally. It was founded in a partnership approach and included Marsh, Munich Re, Sanlam, Santam, Global Infrastructure Basel, ClimateWise and PSI representatives. A research paper, documenting learnings, will be published via ClimateWise early in 2017 to share important proactive risk management insights with other cities and insurance sector players.
Santam’s has a presence in the Tanzanian market via the SEM partnership.
34
SMOKE ALARMS HELP PREVENT SHACK FIRES
Ivy Malopi and Novunga Shadrack lost everything when their wooden house in the Simile informal settlement in Thaba Chweu, in Sabie outside Mbombela, burnt down in the early hours of the morning. Fortunately, they were visiting friends and no one was home. With the help of family, friends and the local municipality, the couple has since managed to build a new wooden home.
It is estimated that more than 8 000 people are left homeless each year as a result of shack fires. Between 2009 and 2012, about 5 000 informal settlement fires were reported. Many lose their valuable possessions, but even more tragic is the trauma suffered by families and communities – and the loss of life during such events.
Over the last two years, 8 600 structural fires and 9 018 veld fires have occurred in Thaba Chweu local municipality. Seven people lost their lives in these incidents.
Ivy and Novunga were some of the first beneficiaries of smoke alarms sponsored by Santam for 1 000 homes in informal settlements in their district. The project, launched on the International Day for Disaster Risk Reduction, aims to raise awareness about practical interventions, such as identifying high-risk areas and the appropriate responses that can be factored into disaster management and planning to reduce the risks on the ground.
The alarm system has proven to detect smoke in less than 15 seconds. This will help raise the alarm of a fire danger quickly, lessen the level of smoke inhalation and, in doing so, save lives. The battery-operated smoke alarm, with a lifespan of 10 years, increases exponentially the chances of surviving a fire.
Santam has partnered with the Ehlanzeni District Municipality and Chubb Fire & Security to roll out this project in Thaba Chweu. The project forms part of Santam’s active work with municipalities through the Partnership for Risk and Resilience programme to identify risks such as fire and flooding.
Since establishing the partnership in 2012, Santam has invested more than R5.4 million, helping the original 24 municipalities respond more appropriately and timeously to the risk of fire and flood. The programme has been expanded to assist 53 local municipalities in disaster-prone, high-risk areas over the next five years.
According to Councillor J Sidell, executive mayor of the Ehlanzeni District Municipality, they face increasing levels of disasters, ranging from severe heatwaves to drought, forest and structural fires, hail and thunderstorms and floods. These natural and man-made disasters affect mostly the poor and people living in vulnerable areas, such as informal settlements, rural communities and floodplains.
“We are immensely grateful to Santam for their continuous support to our disaster management efforts in our district. Through this smoke detector project, we are able to make a significant impact and hopefully save lives in the process. Thank you for your partnership and for the example you set as a responsible corporate citizen,” Councillor Sidell said.

35
MIWAY CUSTOMER’S SAFETY IS PERSONALLY PRIORITISED BY CALL CENTRE AGENT
When first-time driver, Lehlogonolo Selathla’s car broke down one night in Johannesburg, she knew that her best bet was to contact her insurer, MiWay, to arrange for tow truck assistance. However, it was already past 7 p.m., and as she pulled off to the side of the R101 to Centurion, she realised that she was not in the safest area.
“My Renault Clio had a mechanical failure and I still had the learner sign on the back window, plus the area I was in was not well lit at all. When I called MiWay for help, I got through to Tshepiso Thole, who talked me through the process and stayed on the line with me for a while,” she recalls.
However, once Tshepiso had arranged for the tow truck assistance and hung up, Lehlogonolo noticed that several cars driving past were flashing their lights at her. She looked around and saw a group of men were approaching her car.
“I was panicking by now, but managed to somehow get the car started and while I was doing that, Tshepiso called back to check on me. He could hear that I was panicking and advised me to get to the nearest garage or well-lit area and he stayed on the phone with me. The garage was less than 500 m away, so I managed to get there,” she says.
Less than 10 minutes later, she was a bit wary when a young man approached her, but his first words were: “Hi, I’m Tshepiso from MiWay. You sounded scared on the phone, so my friend and I will wait with you until the tow truck arrives.”
And so they did. The young MiWay call centre agent, whose call from Lehlogonolo was his last for that shift, did not stop to think twice. He simply got into his car and drove out to assist a client he had never met or spoken to before that day.
Tshepiso says it was actually his first month on the MiWay emergency helpline.
“When we got there, you could see the relief on her face. That kind of expression from a client helps you realise what you are actually doing to help people. At MiWay, our clients are not just clients, but they are people that we value. When you assist someone with passion and they thank you, it brings a smile to your heart. To me, this job is not just about rendering a service, but is about helping another person,” he says.
In a bid to improve customer service and reduce response times, MiWay Insurance took its 24-hour emergency call centre in-house in July 2016, helping the insurer to ensure that clients receive the appropriate levels of service, and they can easily monitor the progress of each incident to a successful resolution.
Greta Goosen, head of Client Services at MiWay, says that the new call centre was developed over a two-month period, with a “soft launch” two weeks prior to the official launch.
“The ‘soft launch’ allowed us to iron out any challenges before the system went live, thus reducing any impact on our clients. Our reason for bringing the call centre in-house was to improve the service we offer to clients at a critical time for them – when they experience a crisis – so it was important that our clients receive world-class assistance from the onset,” she says. “Thanks to the hard work of the entire team, the project has already been a huge success.”
36
A FAMILY USES DEBT CONSOLIDATION TO KEEP THEIR HOME
Overindebtedness has become one of the biggest problems facing South Africans today as salaries fail to keep pace with inflation. Fortunately, debt consolidation and a good financial plan can help. Ghadija Lawrence of Mitchells Plain was in financial trouble a few years ago. As the cost of living continued to rise, the combined income that she and her husband were bringing home was not enough to make ends meet. Desperate, they took out credit, but then found themselves in a cycle of debt. Ghadija already had two defaults on loans from African Bank and her husband was under administration.
With three children to support, Ghadija and her husband were in danger of losing the home they had lived in for 15 years. When Ghadija’s sister heard an advert for Mattfin Money Matters on a Christian radio station, it sounded like the answer to their problems.
Mattfin Money Matters provides a service to overindebted consumers that own property and still have at least 70% equity in the property. Graham Sinclair, chief executive of Mattfin Money Matters explains that Mattfin steps in and helps clients by settling their debt via funds that are placed in an attorney’s trust account. The SRI Fund is one of the funders that supports Mattfin in assisting overindebted consumers. To date, Mattfin has managed to help 38 families using this funding, working towards a scenario where they are no longer overindebted and can use their money to build their assets instead.
Mattfin negotiates reduced settlements with the client’s creditors and the client pays back a single loan at a lower interest rate than that of a credit card or personal loan. Once all the debts have been settled, Mattfin helps the client by contacting the credit bureaus and updating their credit records.
“Once the client has a healthy credit record again, we help them apply for a new home loan on their property, which then gets transferred back into their name,” Sinclair says.
Ghadija calls the management at Mattfin her angels and says she is so much more relaxed now, knowing that her household finances are under control and she no longer has to worry about debt collectors.
“From beginning to end, Mattfin helped us through the whole process. It took us six months to a year to get out of debt. Mattfin helped us find a sustainable solution, where we were able to pay off our debt and, at the same time, have money to live on each month,” she says.
She has also reaped the benefits of Mattfin’s follow-up consumer financial education programme, which ensures that rehabilitated clients do not fall into the debt trap again.
The SRI Fund targets investments based on Santam’s ESG needs or focus, including investments into companies or organisations with the intention to generate social and environmental impact while generating a sustainable financial return. Ghadija’s family is an example of the way in which the fund enables stability, financial literacy and, ultimately, grows the assets of a family that will soon be in a position to insure these – with a positive impact on future generations.

37
INNOVATIVE PLATFORMS TO INSPIRE ENTREPRENEURS
In a world where technology is constantly evolving and blockchain threatens to disrupt conventional financial systems, there is huge scope for entrepreneurs to step forward with solutions that address the needs of the future.
Ntsako Mgiba is one such individual. He visited his aunt in the township of Emalahleni last July, and was disturbed when her home and five other houses in the same street were burgled on the same night. The criminals got away with R50 000 worth of goods from one home alone. Although the police were notified, it took them three hours to get to the scene, by which time the criminals were long gone.
Mgiba brainstormed with his friends, Ntandoyenkosi Shezi and Kabir Prema at college, and the three came up with the idea of Jonga, which means “we are watching”.
Shezi says the sad reality is that modern security systems are very expensive and come with hefty maintenance costs.
“The average household income in township communities is around R3 200, so it is unrealistic to get such expensive systems into the townships. The situation is exacerbated because neighbours often aren’t aware of what is going on until it is too late and police response times are ridiculously slow,” he says.
Jonga is a low-cost alert system “dedicated to getting communities connected and getting them protected”. It involves the use of a motion sensor in the home that sends a signal to an app if a perimeter is breached. The app in turn alerts the residents and neighbours, who can then take action to secure the property. The overall cost of the system was estimated at R800 for the motion sensor and the app, with plans to roll it out to the public in February 2017.
Jonga was subsequently selected as a finalist in the Santam Safety Ideas campaign in 2016. The recognition inspired Shezi, who wants to become an entrepreneur when he graduates.
“I believe in the future of Africa, so I would love to be at the forefront of developing ideas and establishing companies that will change our continent. I also believe that job creation will only happen in South Africa when there are more entrepreneurs,” he says.
Santam believes the programme creates a platform for improving people’s lives and protecting their livelihood, one idea at a time.
Entrants had to submit a short video entry online outlining their idea and register online to secure a slot to pitch their idea. Finalists were chosen based on the originality, applicability, market attractiveness, and estimated length of time to take the product to market.
Prototypes and high-level business plans were developed for the 10 best concepts during an intensive 14-week LaunchLab Knowledge Acceleration Programme. The programme underlines Santam’s commitment to keeping South Africans safe while providing Insurance good and proper.
Another young South African who benefitted from an innovative initiative by Santam was Jonathan Jardim, a software developer for SilverBridge, who participated in the Santam 24-hour Blockchain Hackathon in September 2016. Insurance fraud in South Africa amounts to a staggering R3.6 billion per year. This results in huge losses for insurers, and negatively affects consumers. The problem is experienced industry-wide and to date no effective solutions have been found.
“SilverBridge had been investigating the new world of cryptocurrencies and blockchain, and when we heard about the Santam Hackathon, we decided it would be an awesome opportunity to learn more about this new technology.
This was a whole new experience as it was the first hackathon I participated in. Obviously, the biggest challenge is trying to stay awake for over 30 hours, as it is very difficult to concentrate when you are beyond exhausted. With regard to the actual problems that I needed to solve, I think they got them spot on. These problems were not so specific that you were tied down, but they were broad enough to allow out-of-the-box thinking, but not so broad that people went completely off topic. A difficult part was coming up with an initial solution, but once I had this, and I started bouncing ideas off the professionals that were there, it became a simple process,” Jardim says.
More than 80 hackers participated, including entrepreneurs, software geeks, website developers and blockchain enthusiasts. The hackers used blockchain and other technologies to identify solutions to four challenges, predetermined by Santam, with the ultimate goal of combating insurance fraud.
For Santam, the hackathon served to explore how crowdsourcing and innovative technology solutions can be used to reduce or even remove fraud from the general insurance industry. Innovative use of blockchain can, for example, create smart contracts, secure payments and enable the tracking of insured assets.

SEM

Our partnership with Sanlam Emerging Markets (SEM) is part of our international diversification strategy. We support SEM through our specialised general insurance, ensuring that, no matter what the business requires, it is delivered with the highest level of expertise. The partnership enables us to have economic participation in 31 countries in Africa, India, Southeast Asia and China.
WE GROW THROUGH DIVERSIFICATION.
SA
NT
AM
INT
EG
RA
TE
D R
EP
OR
T 2
016
40
LE
AD
ER
SH
IP R
EP
OR
T
Santam’s performance returned to normal following an exceptional 2015. The impact of soft pricing and intensifying competition was evident across the group, but particularly in the Santam Specialist businesses. Claims costs and frequencies in Santam Commercial and Personal, Santam Specialist and MiWay increased, with the weakened rand putting pressure on the profitability of most of these businesses. The higher procurement costs on imported motor parts negatively impacted the motor books. The group remains in good shape, but shares the collective concern about the global and South African economy, and the challenging conditions under which our current and potential policyholders want to safeguard their assets and businesses.
LEADERSHIP REPORT
Last year, mild weather conditions and strong investment returns
worked in our favour. This year, the group absorbed more significant
claims, including catastrophe hail events in Gauteng and North West
in January, a few large commercial property claims and flash flooding
in Gauteng in November.
Investment income was significantly negatively impacted by
foreign exchange losses, following the relevant strengthening of the
rand since December 2015, and the negative performance of the SEM
investment portfolio.
These factors are mostly out of our control. However, Santam’s
almost 100 years’ experience through cycles and catastrophe events
has equipped the management team to be able to manage and
mitigate challenges effectively. We significantly reduced claims’
impact through reinsurance and continued to manage costs
downward through efficiency initiatives.
SALIENT FEATURES OF 2016− The group made the following acquisitions:
• A further economic stake of 8% in SGI through SEM at a
purchase price of R251 million, taking our full stake to 15%
• The completion of the acquisition of a 7.5% interest
in Saham Finances for R1.4 billion, through a 25%
shareholding in SAN JV
• A further R49 million participatory investment in SEM
general insurance businesses in Botswana and Zimbabwe
• The purchase of a 49% shareholding in PST for R55 million
in cash in March 2016. During November 2016, a pro rata
recapitalisation took place in terms of which Santam
injected a further R10 million into the company
• The acquisition of the Absa Intermediated Commercial
Lines Business from Absa Insurance Company Ltd for
R13.2 million in cash, including contingent payments
estimated at R28 million
− We received approval from the Financial Services Board (FSB) to
launch a formal internal model approval process in preparation
for the risk-based solvency assessment and management (SAM)
regulatory regime that will soon be implemented in South Africa
− The group successfully issued R1 billion of subordinated debt
− Santam was certified as a Top Employer for 2017
− A new agreement was concluded with Munich Re of Africa for
certain Santam businesses to use its AA- S&P credit rating from
1 January 2017
− Santam made a R2 million commitment to the new South African
SME fund, an additional R30 million allocation to the ASISA
enterprise and supplier development fund, R228 000 to the
Agri Securitas Trust Fund and a R2 million donation to the
National Drought Disaster Relief Fund
− A further R36 million capital contribution to SORAS Assurances
Générales Ltd (SORAS), our investment with SEM in Rwanda,
following the uncovering of financial irregularities
− The board declared a special interim dividend of 800 cents, with
the dividend for the year at 881 cents – up 8% on 2015
− The acquisition of 100% of the issued share capital of RMB-SI,
a specialised insurance business, is still pending, subject to the
fulfilment of certain conditions precedent
– The acquisition of a further 16.6% interest in Saham Finances via
SAN JV by SEM and Santam for a total subscription consideration
of US$329 million plus transaction costs. The subscription
consideration includes Santam’s contribution of US$7.35 million
plus transaction costs. The transaction is still pending, subject
to regulatory approval
2016 PERFORMANCESantam achieved gross premium growth of 7% (2015: 7%) on the back
of a diversified geographic presence and product offering. Following
the SAN JV (Saham Finances) transaction, which was effective during
the first quarter of 2016, we have started exploring opportunities to
expand and diversify into further new territories.
SA
NT
AM
INT
EG
RA
TE
D R
EP
OR
T 2
016
41
LE
AD
ER
SH
IP R
EP
OR
T
The net underwriting margin at 6.4% was lower than the exceptional
9.6% of 2015, but still within the group’s target range over the long
term of 4% to 8%.
The impact of soft pricing and intensifying competition are being
felt across the group, but particularly in the Specialist businesses.
Claims impact and frequencies in Santam Commercial and Personal
and MiWay increased, with the weaker rand putting pressure on the
profitability of most of these businesses. The higher procurement
costs on imported motor parts negatively impacted the motor books.
SANTAM COMMERCIAL AND PERSONALSustained performance of Santam Commercial and Personal relies
on understanding and meeting clients’ changing needs. This was
evidenced by good growth delivered by Santam Direct, which was
launched in response to client behaviour shifts. Despite the growth
in this segment, Santam Commercial and Personal continues to rely
on strong relationships with intermediaries as the foundation of its
business model.
The tied agent initiative with Sanlam is progressing particularly
well. Competitive pressures and the impact of the weak economic
environment were the key drivers for the lower-than-expected growth
rates in the rest of the business unit.
Underwriting results for Santam Commercial and Personal were
negatively impacted by a higher number of catastrophe events
compared to 2015. These included hailstorms in Johannesburg
and the North West Province in January, and severe storms in
KwaZulu-Natal and Gauteng in July and again in November, resulting
in extensive flood damage. This was exacerbated by a number of large
property claims due to fire losses.
Claim frequencies increased by 11.9% this year. The average cost per
claim increased by 8.1%. Cost containment efforts were challenged
by a volatile exchange rate leading to rising prices of motor repairs,
an increase in fees and settlement amounts, more catastrophe claims
and capacity constraints due to higher levels of claims incidents.
Progress with the roll-out of the new administration platform,
combined with the new system ability to develop innovative products
and offerings, will drive future growth and efficiency.
SANTAM SPECIALISTSantam Specialist has a leadership position across most segments in
which it does business and leverages this position across the Santam
distribution channels and specialist intermediaries. The business unit
continues to diversify and grow its footprint outside South Africa.
19% (2015: 18%) of the niche business’s gross written premium was
earned beyond South Africa this year.
Soft market conditions and increased local and international
competition continued to strain growth and profitability for Santam
Specialist. The business unit’s underwriting results were negatively
impacted by large property claims in Emerald and lower premium
growth in Mirabilis.
The complexity of some of these claims tested the robustness of
the business unit’s relationships with intermediaries, with positive
outcomes and recognition of the quality of service on both sides.
Centriq showed solid growth and profit well ahead of 2015, positively
impacted by investment performance. Centriq continues to hold a
material share of the cell captive market, with a business model that
is difficult to replicate – positioning it as strategically important to
the group.
Santam Specialist’s acquisition costs increased due to higher gross
commission paid on business from outside South Africa, lower
reinsurance profit commission and pressure on premium growth.
The crop portfolio was under pressure due to the continued drought
across the region, but delivered a positive underwriting margin.
Santam crop delivered a net underwriting result of R69 million
(2015: R131 million). Santam Specialist continues to explore
opportunities to expand its crop insurance footprint and product
offering, especially in central and eastern Africa.
Despite challenging business conditions, the business still delivered
good returns and will benefit from the agreement with Munich Re of
Africa for certain Santam Specialist underwriting managers to use its
AA- S&P credit rating from 1 January 2017.
MIWAYMiWay’s direct client relationships, enabled by an effective digital
platform and strong brand, continue driving sustained growth. The
business unit reported a gross written premium of R2.1 billion
(2015: R1.8 billion), which is 19% higher than last year and an 8%
contribution to the group’s GWP (2015: 7%).
The business unit delivered strong growth on the back of new
business offerings that were launched in the past few years,
including direct life and business insurance. Growth was supported
by good cost management, which impacted the underwriting
margin positively.
As a result of an increase in the cost of motor parts, which followed
the weakening of the rand in 2015 and the impact of new business
growth, MiWay reported a claims ratio of 63.6%, up from 60.9%
in 2015.

SA
NT
AM
INT
EG
RA
TE
D R
EP
OR
T 2
016
42
The acquisition cost ratio reduced to 28.7% (2015: 29.8%). MiWay
ended 2016 with 278 000 clients (2015: 242 000) (excluding value-
added products) and 1 551 employees (2015: 1 311).
An in-depth rerating process evaluated pricing against risk exposure
and resulted in increases in selected areas. Although this had a
short-term impact on conversion rates, it will result in an improved
loss ratio and ensure profitable growth going forward.
SANTAM RESantam re continues to contribute to the group’s diversification
strategy and the ability to create long-term value. The business
unit delivered higher-than-expected growth at an acceptable
underwriting margin.
Progress in exploring combined initiatives with Saham Finances
included shared training and facilitation agreements in various
territories to enhance reinsurance business flows to the
Saham Finances.
Santam re remains the main vehicle for group reinsurance
optimisation. It continues to build partnerships with international
reinsurers with portfolios of good standing and has been able to
secure good new business flows from international partner cessions.
The business unit increased its business intelligence capability and
is now able to automate and access rich sources of management
information. This will enable it to identify improvement opportunities
and further encourage future cross-selling in the group.
SANTAM EMERGING MARKETS INVESTMENTSSantam continues to provide comprehensive technical support to
SEM business partnerships. This includes product, pricing,
underwriting and reinsurance input and resulted, for example, in
tenders won in India. Negotiations on a bancassurance distribution
agreement for general insurance products in Africa have been
successfully concluded.
A lowlight for the year was the identification of financial
misstatements related to pre-acquisition periods at SORAS in
Rwanda. Immediate corrective action was taken and the Santam
manager of operational finance was seconded to Rwanda for a
four-month period to assist with the implementation of improved
controls for the business.
The Pacific & Orient Insurance Co. Berhad (P&O) business in
Malaysia experienced lower premium growth due to competitive
market conditions. There is a significant focus on expanding the
current P&O product offering, and growth reported in the non-motor
business line was positive.
SEM businesses in Tanzania and Uganda performed well, with SGI
in India experiencing higher-than-anticipated volumes for all product
lines. Operations in Kenya, Malawi and Zambia were under pressure.
Santam and SEM respectively holds 25% and 75% of the shareholding
in SAN JV, which acquired a 30% interest in Saham Finances during
the first quarter of 2016.
Saham Finances results for the nine months to September 2016
fell somewhat short of expectation. The results were negatively
impacted by the economic conditions prevailing in Angola and Syria.
Furthermore, the decline in oil prices impacted activities in Nigeria,
Ghana and Gabon. The notable strengthening of the Moroccan dirham
against the Nigerian naira and the Angolan kwanza further depressed
results. This was partly offset by strong performance from Saham
Assurance Morocco, still contributing the bulk of premiums and
earnings for Saham Finances.
The group takes a long-term view of the SEM partner businesses and
will continue investing in technical support capacity, despite slower
growth than anticipated.
MULTIPLE WAYS OF MANAGING RISKSSantam’s risk approach takes many forms. This year, we conducted
a risk assessment survey, which involved 188 participants, assessing
20 risks across operational, financial and strategic risk categories.
Ethics and compliance risks received the lowest risk rating scores.
The highest velocity risks included extreme weather events
(e.g. floods, drought) and financial health/economic uncertainty
(including risk of downgrade). This means that they can be expected
to occur in a short time frame with high impact.
The group and business units each have a detailed risk appetite
policy with criteria that consider financial and non-financial risk
categories. All this indicates how much risk Santam is willing to take
in the pursuit of achieving its strategic and operational objectives, and
quantifies the amount of capital the group is willing to put at risk in
the pursuit of value creation.
When a risk event occurs – despite mitigating and preventative
measures – constructive action is taken. An example was the
financial irregularities identified at SORAS in Rwanda relating to
prior financial years. Corrective measures were immediately taken
to address these irregularities.
LE
AD
ER
SH
IP R
EP
OR
T

SA
NT
AM
INT
EG
RA
TE
D R
EP
OR
T 2
016
43
MATERIAL FACTORS
DELIVERY ON GROWTH TARGETS THROUGH MULTIPLE DISTRIBUTION CHANNELS
STRATEGIC RISKS DESCRIPTION AND SANTAM RESPONSE TREND
Growth outside South Africa remains a key strategic focus, while maintaining our local leadership position. Country-specific initiatives between SEM, Santam Specialist and Santam re include increasing business visibility, quote volumes and sales capability, while managing acquisition cost. We continue to explore acquisition opportunities that can add to our product offering and generate profitable premiums.
OUTSIDE-IN FACTORS: POLITICAL, ECONOMIC, SOCIAL AND COUNTRY RISK (INCLUDING THE RISK OF A SOVEREIGN DOWNGRADE)
South Africa’s low growth is exacerbating already high unemployment, inequality, and macro vulnerabilities. Inflation will impact consumer spending, which may result in an increase in cancellations and return debits.
Investing in other regions allows the group to better manage its South African exposure. The agreement with Munich Re of Africa to use their AA- international credit rating should support growth strategies for Santam Specialist and Santam re businesses.
RISKS ASSOCIATED WITH INTERNATIONAL DIVERSIFICATION
Santam is expanding in multiple territories through SEM, the Santam re and Santam Specialist businesses. This diversification introduces additional operational risks, specifically in the underwriting process and through reliance on intermediaries within these territories. Technical support is critical in some areas, combined with specific operational controls around underwriting processes.
INVESTMENT PERFORMANCE
Investment performance is most significantly impacted by the group’s exposure to volatile investment markets. The group actively manages its investment portfolio to optimise the investment return within the agreed risk appetite. Appropriate rebalancing of investment assets is managed with the payment of ordinary and special dividends.
REALISING BENEFITS IN DEVELOPMENT OF A NEW CORE UNDERWRITING, ADMINISTRATION AND PRODUCT MANAGEMENT PLATFORM
The business has to migrate to new operational environment and technology platform without compromising stability to optimise efficiency. The Santam Commercial and Personal business unit is currently undergoing such an implementation, which is tightly managed and monitored by formal project and oversight structures. Potential delays in the further deployment and migration might result from capacity constraints, complexity and competing business priorities. Progress and risks are monitored at board level, given the size of the investment. Good progress and high confidence levels highlight the overall downward trend of this risk over time. Management remains confident about the delivery of this project.
The risk table below provides a summary of strategic risks – all rated as high-ranking – and indicates where these have increased in probability
and severity in the past year:
LE
AD
ER
SH
IP R
EP
OR
T
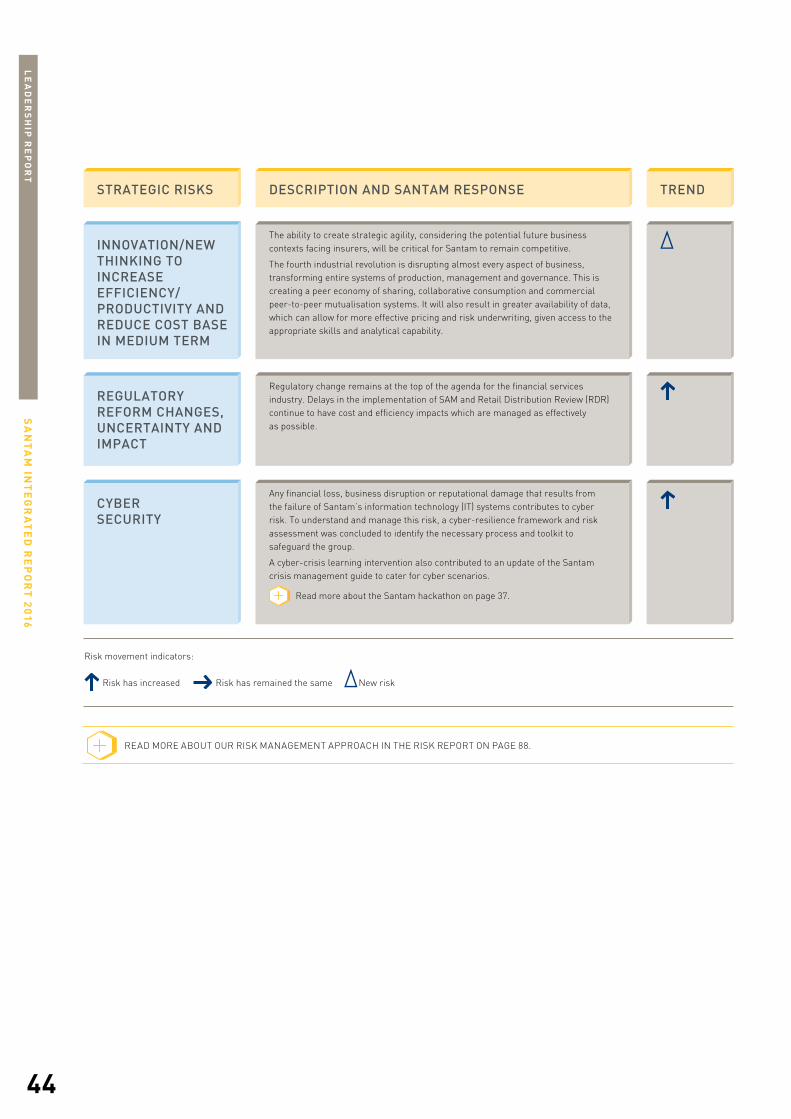
SA
NT
AM
INT
EG
RA
TE
D R
EP
OR
T 2
016
44
INNOVATION/NEW THINKING TO INCREASE EFFICIENCY/PRODUCTIVITY AND REDUCE COST BASE IN MEDIUM TERM
The ability to create strategic agility, considering the potential future business contexts facing insurers, will be critical for Santam to remain competitive.
The fourth industrial revolution is disrupting almost every aspect of business, transforming entire systems of production, management and governance. This is creating a peer economy of sharing, collaborative consumption and commercial peer-to-peer mutualisation systems. It will also result in greater availability of data, which can allow for more effective pricing and risk underwriting, given access to the appropriate skills and analytical capability.
REGULATORY REFORM CHANGES, UNCERTAINTY AND IMPACT
Regulatory change remains at the top of the agenda for the financial services industry. Delays in the implementation of SAM and Retail Distribution Review (RDR) continue to have cost and efficiency impacts which are managed as effectively as possible.
CYBER SECURITY
Any financial loss, business disruption or reputational damage that results from the failure of Santam’s information technology (IT) systems contributes to cyber risk. To understand and manage this risk, a cyber-resilience framework and risk assessment was concluded to identify the necessary process and toolkit to safeguard the group.
A cyber-crisis learning intervention also contributed to an update of the Santam crisis management guide to cater for cyber scenarios.
Read more about the Santam hackathon on page 37.
Risk has increased Risk has remained the same New risk
STRATEGIC RISKS DESCRIPTION AND SANTAM RESPONSE TREND
Risk movement indicators:
READ MORE ABOUT OUR RISK MANAGEMENT APPROACH IN THE RISK REPORT ON PAGE 88.
LE
AD
ER
SH
IP R
EP
OR
T
SA
NT
AM
INT
EG
RA
TE
D R
EP
OR
T 2
016
45
TRANSFORMING FOR GROWTH IN SOUTH AFRICASantam’s approach to business transformation is directly aligned to
the vision and the brand promise of Insurance good and proper.
We understand the value of diversity and an inclusive approach to
drive superior and sustainable business results. Santam’s progress
in transforming the business – and contributing to transformation in
the industry and the economy – has created significant value for our
stakeholders.
For the South African businesses, BBBEE remains a key priority. A
new, focused transformation strategy was adopted to ensure delivery
on the following objectives:
– Driving high-impact transformation initiatives for business and
societal value
– Creating a diverse and inclusive culture
– Driving transformation through innovation
– Leading transformation compliance
We have developed specific initiatives and actions for each objective,
with the executive team taking responsibility for the implementation,
monitoring and evaluation of the transformation agenda across
the group.
Salient transformation features for 2016 include:
− Diversifying our supplier network by investing a further
R30 million into the ASISA Edge Growth fund (a total of
R40 million to date) to create access to loan funding for new
and small BBBEE suppliers in the sector
− 11 of the 19 participating suppliers in the Sanlam Santam
Enterprise Development Programme in partnership with ASISA
are Santam-specific suppliers
− Improvement in the mechanisms used to grow our footprint into
the South African entry-level market include the establishment
of “Lemon” (lateral emerging market opportunity network)
to provide the different business units with a formal platform
to share, explore and identify strategies and actions to create
access to and for this market. These include, for example,
Santam Agri, Santam Direct and VUM, and provide a central
reporting facility for targets set on consumer financial education
initiatives, activation and impact
− Santam achieved a level 2 BBBEE status based on the new
FSC requirements. The group has been able to retain its
ownership score after the unwinding of the BBBEE scheme
in 2015
− Finding and developing a viable and affordable offering for the
lower market segments in South Africa remains challenging.
R8.3 million was invested in consumer financial education
across business channels and more than 129 000 policies
were sold as access products in South Africa through
75% FSC-approved products
READ MORE ABOUT OUR PROGRESS WITH CONSUMER FINANCIAL EDUCATION INITIATIVES IN THE STORY ON PAGE 36 AND TRANSFORMATION IN THE REPORT ON PAGE 98.
RESPONSIBLE COLLABORATIONWe continue to expand our collaboration with Sanlam where it makes
sense for us to do so. This includes, for example, our support of
Sanlam’s group chief executive, Ian Kirk, who represented the wider
group in recent engagements with government and inter-ministerial
teams to develop solutions for South African job creation, economic
stability and growth.
Where Santam enters into transactions with Sanlam through SEM
Investments, these are governed and at arm’s length, with specific
involvement of Santam’s independent directors.
Collaboration with Sanlam further entails participation in the
governance roll-out through SEM. Following the fraud uncovered in
Rwanda, there is even more focus on ensuring that all subsidiary
boards and partners subscribe to the group’s ethics, anti-bribery and
anti-corruption policies. We have also done further work in developing
risk appetites in collaboration with the management teams in
different territories – all to prevent future reputational damage.
Collaboration between Santam, the Department of Cooperative
Governance and Traditional Affairs and the Emthunzini Broad-based
Black Economic Empowerment Community Trust has resulted in an
acceleration of the Partnership for Risk and Resilience programme,
which will now be extended from five to 53 local municipalities over
the next five years.
READ MORE ABOUT THE IMPACTS OF THIS PARTNERSHIP ON PAGE 50.
LE
AD
ER
SH
IP R
EP
OR
T
SA
NT
AM
INT
EG
RA
TE
D R
EP
OR
T 2
016
46
OUTLOOKWe focus on the future to ensure that our board and management
teams are attuned to what might happen – and how quickly things
are changing. Agility will be our most important capability when
considering future business contexts. This will also enable us to
respond to what matters most to our stakeholders, as we recognise
that this matters most to us.
South African trading conditions remain competitive in a low-growth
economic environment, which translates into almost no growth
of insurable assets for the insurance industry.
The group’s focus remains on profitable growth in South Africa and
to increase its international diversification through the Santam
Specialist business and Santam re. Santam continues to focus
strategically on supporting the development of the SEM general
insurance businesses in emerging markets by allocating appropriate
technical resources. In South Africa, focus areas include developing
Santam’s full multichannel capability and MiWay’s business insurance
and broker-direct offerings, and the MiWay Life insurance initiative
with Sanlam Life.
We continue to focus on the optimisation of the claims and
procurement value chains to increase efficiency and counter the
impact of the weakening rand. The group will also maintain its focus
on cost-efficiencies to improve the management expense ratio over
the medium term.
The investment market is likely to remain uncertain. The higher-
interest-rate environment will result in increased interest income
for the group but higher volatility is expected on interest-bearing
instruments. The increased exposure to non-rand-denominated
business further increases foreign exchange volatility.
With our new transformation strategy for the South African business
units contracted and firmly on track, we expect improvements to
become visible and measurable as we create a diverse workforce,
intermediary and supplier base, enable access for non-traditional
markets to products and services and make further impactful
investments into communities.
APPRECIATIONMany people contributed to the good management and stability
at Santam in a challenging year. We recognise the efforts of our
employees, intermediaries and old and new business partners. We
also thank the board for their support and ability to steer the group
on its journey towards our vision for 2020. The executive management
team has again proven their tenacity and commitment to the group,
industry and all its stakeholders. We are confident in the ability of our
people to create opportunities in the face of a challenging 2017.
Grant GelinkChairman
Lizé LambrechtsChief executive officer
LE
AD
ER
SH
IP R
EP
OR
T

SA
NT
AM
INT
EG
RA
TE
D R
EP
OR
T 2
016
47
STRATEGY REVIEWThe five focus areas of the Santam strategy remain relevant to all group entities and territories. However, the implementation emphasis is at
different levels of maturity in different areas of the business. A group dashboard tracks operational progress on a quarterly basis, and continuously
evolves to include reporting from new territories, acquisitions or ventures. The strategy report below is still weighted towards the South African
business units, and provides examples of how the strategic focus areas are being implemented across the group.
INSURANCE GOOD AND PROPERSantam’s products and services continue to be designed, marketed
and delivered in a way that is fair, respects others and adds to the
well-being of clients and broader stakeholder groups. However,
Insurance good and proper goes beyond products and services to
include Santam’s commitment to:
− building a successful and sustainable business in Africa;
− actively contributing to transformation and economic
development in South Africa and Africa through successful
community partnerships, investments and sustainable
business initiatives; and
− progressively improving the social and economic well-being of its
stakeholders and customers by reducing risk when it comes to
insuring the needs of its customers.
A CLIENT-CENTRIC GROWTH CULTUREThe claims experience is a policyholder’s opportunity to test
Santam’s delivery on the brand promise of Insurance good and proper.
Therefore, client satisfaction is an important measure for the brand.
Santam Commercial and Personal measures client satisfaction on
three levels:
− Directly with clients after every interaction – from quotation
through to the claims process. A benchmarking score of 80%
must be achieved on a client satisfaction scale
− A client diagnostic measure of overall satisfaction according to
future intent
− An external credible independent measure called the South
African Customer Satisfaction Index (SAcsi)
SAcsi is an independent national benchmark of customer satisfaction
of the quality of products and services available to household
consumers in South Africa. According to the 2016 SAcsi results,
Santam retained its leadership position in the short-term insurance
industry, increasing its client satisfaction score from 77.3 to 80.0.
The survey indicated that the competitive practice of lowering
premiums by cutting out intermediaries, is no longer carrying favour
from customers, as reflected in a marked drop in expectations,
perceived quality and perceived value.
A further external measure of client satisfaction is the Ombudsman
for Short-Term Insurance (OSTI) annual report statistics. The 2016
report (relating to 2015 data) indicated that Santam received the
highest share of claims (FSB statistics) in the industry at 12.11% due
to its leading market position, whereas its share of OSTI claims were
only 7.29%. In 30% of the finalised OSTI cases against Santam, the
policyholder received some benefit, just slightly above an industry
average of 27%. This means that 70% of claims (71% in 2015) were
awarded in favour of Santam.
3.05% of ombudsman claims related to MiWay claims and 86.2%
(2015: 77.4%) were upheld in favour of MiWay.
LE
AD
ER
SH
IP R
EP
OR
T
THE LEADING
GENERAL INSURERIN SELECTED
EMERGINGMARKETS
INSURANCEGOOD AND
PROPER
THE RIGHTPEOPLE
MANAGETHE RISK
POOL
CONTINUOUSLYINCREASE
EFFICIENCY
GROWTH THROUGH
INNOVATION ANDDIVERSIFI-
CATION
Deliver on the promise to clients in a way that creates value for all stakeholders
Achieve responsible, profitable and sustainable growth in South Africa and internationally
Ensure proactive sustainable risk management while promoting dialogue and collaboration on risk and resilience
Maintain high standards of operational efficiency, ultimately creating more robust and sustainable stakeholder outcomes
Influence and enable successful execution of the Santam strategy through engaged and competent people and partners
SA
NT
AM
INT
EG
RA
TE
D R
EP
OR
T 2
016
48
MiWay measures client satisfaction for nine touchpoints, based on
TCF principles. The nine elements include feedback on premium
changes, new policy activation, quotations not accepted, emergency
assistance, claims experience and retention. In the past year, the
business unit received highest monthly scores from clients who
activated new policies or went through the retention process, which
indicates a high understanding of the product, related service and
their experience of the take-on/retention process. Lowest scores
were measured in the dispute and complaints categories, where
small samples are dominated by clients who are not satisfied with the
outcome of their complaint. A dedicated team focuses on improving
these clients’ experiences.
Santam won the Financial Intermediaries Association of Southern
Africa’s (FIA) Short-Term Insurer of the Year: Personal Lines award
for the sixth time since 2007. The FIA awards are one of the most
comprehensive total industry broker satisfaction benchmarks
produced in South Africa. It awards insurers that provide the best
support to the country’s financial advisers and insurance brokers.
These accolades strengthen the credibility in the Insurance good and
proper proposition.
SUPPORTING THE SANTAM BRAND PROMISEAs part of strengthening the Insurance good and proper positioning
and driving innovation, Santam launched a safety ideas initiative this
year. The campaign invited submission of safety ideas and concepts
for the public with the winning concepts going through an incubation
process for further development into prototypes to further stand
the chance of being turned into viable businesses. This initiative
strengthens our association with safety and risk management creates
opportunities for enterprise development and investment, and
ultimately supports Santam’s commitment to manage the risk pool
and reducing systemic risk.
A further initiative to entrench the brand promise related to Santam
suppliers: training was undertaken with 32 motor body repairers
on Santam’s code of ethics, the Business Integrity policy and
preventative measures for reducing the risk of misconduct within
their own businesses. They were also encouraged to participate in
International Fraud Awareness Week.
Santam’s internal Staff Reporting Initiative celebrates 10 years of
reporting. It provides employees with a platform for safe reporting
of misconduct through a range of whistle-blowing channels, including
an internal fraud line, hotlines (in South Africa and Namibia), SMS,
WhatsApp and e-mail facilities. Whistle-blowers are ensured of
being protected as they are able to make disclosures in a safe and
confidential environment. The initiative dealt with 4 000 reports,
reported 1 150 criminal cases and secured 300 convictions over
the 10-year period. Leads originated from employees, suppliers,
intermediaries and policyholders.
The risk of fraud and crime, which directly undermines the brand
promise, is further mitigated by collaborative internal efforts. An
example of this is the newly established Business Integrity Forum,
which was set up to enable easy transfer and sharing of information
between Santam subsidiaries. These efforts are all aligned to protect
the Santam brand and reputation.
READ MORE ABOUT ETHICS RISK MANAGEMENT ON PAGE 77.
Santam also recently joined the Coalition for the promotion of Ethical
Operations (the CEO initiative) showing support to promoting ethical
business and good governance in the sub-Saharan African region.
Due to its presence in the region through SEM, Santam is in a position
to share best practices to reduce corruption, to promote training for
SMEs and engage in collaborative action.
READ MORE ABOUT SANTAM’S INITIATIVES TO ALIGN ETHICAL CULTURES AND LEADERSHIP IN “THE RIGHT PEOPLE” ON PAGE 53.
TREATING CUSTOMERS FAIRLYSantam is committed to embedding the principles of Treating
Customers Fairly (TCF) into its strategy and culture as the
cornerstone of the brand promise, Insurance good and proper.
A pragmatic approach is applied for TCF implementation,
balancing outcomes and fairness with business sustainability
and commercial imperatives.
Quarterly TCF forum meetings are held to monitor implementation
and progress, with a TCF dashboard part of scheduled input to
the board.
The focus this year was on maturing the TCF management
information. This included improving complaints data reporting and
developing product risk assessment matrices. The need for more
product training for intermediaries was identified as a focus area
going forward.
LE
AD
ER
SH
IP R
EP
OR
T

SA
NT
AM
INT
EG
RA
TE
D R
EP
OR
T 2
016
49
GROWTH THROUGH INNOVATION AND DIVERSIFICATIONSantam is the largest South African insurer and the most diversified
among its peers. The group currently generates 10% of its premiums
from outside of South Africa and has a strategic goal
to grow this contribution significantly through the Santam
Emerging Markets Investments, Santam re and Santam Specialist
business units.
GEOGRAPHIC DIVERSIFICATIONThe group has a presence in 31 countries following recent
acquisitions. Growth in South Africa remains challenging due to
economic conditions and Santam’s leading market position, which
limits acquisition opportunities. The group’s main growth options
are international.
FIND THE DETAIL OF CURRENT GEOGRAPHIES ON PAGE 28 AND READ MORE ABOUT ACQUISITIONS IN THE LEADERSHIP REPORT FROM PAGE 40.
GROWTH THROUGH INNOVATIONTechnology and the availability of data create many novel insurance
options, such as pay-as-you-go packages. Although Santam
continuously explores innovative solutions, the associated risks in
terms of fraud and regulatory complexities, challenge the viability
of these offerings.
Telematics as a way to measure various aspects of vehicle location
and driver behaviour, continue to be a value add option for motor
insurance. However, given the fact that South Africa’s safety
and security considerations – related to theft and hijacking –
remain a priority, the cost does not yet justify perceived benefits
for policyholders. Nevertheless, Santam offers an approved
vehicle recovery or telematics system which can help clients
limit their exposure to vehicle accidents and thereby reduce
insurance premiums.
Santam and Sanlam created a tied agency model in 2015 to contribute
to the group’s multichannel strategy and proactively respond to the
pending RDR legislation. This new distribution channel will restrict
agents to a range of Santam, Santam Specialist and MiWay products,
in exchange for a more favourable remuneration structure. Early
adopters were provided with incentives, which resulted in significant
new business.
Santam’s direct business is a further element of channel
diversification and is performing to expectation. The focus remains
on understanding the market, customer experience and expectations,
and finding best practices to meet these proactively.
GROWTH THROUGH NEW MARKET SEGMENTSWe continue to invest in ways to penetrate new and non-traditional
markets. Consumer financial education has been identified as one
of the most effective ways in which Santam creates new market
opportunities. This requires specific and targeted initiatives and
platforms to provide access and to meet the needs of previously
underserved individuals and communities.
These initiatives transfer knowledge and skills to potential clients by
creating an understanding of insurance products and services. This
enables Santam’s potential client target market to make informed
decisions about their finances and lifestyle. For example, we targeted
individuals through the Twelve Apostles Church in Christ (TACC)
CE Awareness campaign, as well as through small enterprise and
business education. Another example is Santam Specialist partnering
with The Box Shop, a recently established retail outlet and business
incubator situated within the Vilakazi Street precinct of Soweto. The
business embarked on a pilot programme to set up a learning hub,
providing specialist consumer financial education for entrepreneurs.
The focus is on interactive teaching, covering concepts such as the
basics of financial planning, business budgeting, insurance do’s and
don’ts and the risks faced by entrepreneurs. As at the end of 2016,
426 entrepreneurs were trained.
READ MORE ABOUT SANTAM’S EMERGING FARMER EDUCATION INITIATIVE ON PAGE 31.
The development of a value proposition for the lower-income
market remains challenging. This will receive attention in the next
financial year.
LE
AD
ER
SH
IP R
EP
OR
T

SA
NT
AM
INT
EG
RA
TE
D R
EP
OR
T 2
016
50
MANAGE THE RISK POOLThrough managing our risk pool, we ensure proactive sustainable risk
management while we diversify.
Risk pooling is integral to the efficient functioning of markets,
economies and society. As the risk landscape evolves, spawning
new and complex risks, Santam continuously monitors trends and
changes that can materially impact risk profiles and claims patterns.
Santam’s approach encompasses end-to-end risk management, and
includes assisting policyholders in managing their own risks better –
often through incentives linked to proactive measures.
An example of responsive product development was the inclusion
of extended cover for solar panel installations. As more individuals,
business and farmers started securing independent power sourcing
options as a more reliable and cost-effective option, Santam
recognised that these installations are also susceptible to theft or
weather damage. In the agricultural sector, in particular, this can
take the form of critical power generation for farm equipment or
machinery such as windmills or water pumps or to the main farm
buildings as a source of additional power or heat.
Santam is the only South African insurer with a scientific
experimental farm that conducts accurate, in-depth hail simulation
research on crops to ensure accurate damage assessments. The
research entails specific analyses of crop damage at different growth
stages that are unique to South Africa’s climate, soil and cultivars.
The research results enable us to differentiate between new varieties
introduced in the past few years in terms of recovery potential
following physical damage from weather events. More accurate
damage assessments also assist the group in adjusting risk rating
levels more accurately.
BUILDING PARTNERSHIPS FOR RISK AND RESILIENCEWe remain mindful of the challenges South Africa faces that require
strong partnerships to meet the sustainable development goals
and make the National Development Plan (NDP) a reality. Santam
has heeded the call to improve the resilience of communities and
continues to secure significant successes with our holistic, shared
risk management partnerships with a wide range of stakeholders,
including business, land owners and local government. Our
Partnership for Risk and Resilience, previously known as Business-
Adopt-a-Municipality (BAAM), continues to gain momentum.
Partnerships are key to reduce risk on the ground. This includes
disaster risks, such as floods and fires, which can have a significant
impact on communities and businesses. The creation of the
Partnership for Risk and Resilience attempts to include both the work
done under BAAM since 2011 and the work done under the Santam
High Risk Node initiative to address climate and systemic risk.
Santam expanded and accelerated the programme in response
to government’s request for increased assistance to support
municipalities that are dysfunctional and at risk. The needs
of vulnerable communities have also been increasing in these
municipalities.
The Emthunzini Broad-based Black Economic Empowerment
Community Trust was approached for increased funding over
the next five years to expand the programme from five to
53 local municipalities.
The Partnership for Risk and Resilience programme has the potential
to positively impact the lives of over five million South Africans as
it addresses the issues of disaster risk management, job creation,
installation of early warning systems and ensuring capacity in
municipalities to improve service delivery.
The following municipalities were targeted in 2016:
− Ehlanzeni District Municipality (five local municipalities)
− Sarah Baartman District Municipality (seven district
municipalities)
− Sedibeng District Municipality (five local municipalities)
The objective is to target three district municipalities per annum until
2020. Santam will endeavour to bring various partners on board to
support the programme.
READ MORE ABOUT SMOKE ALARMS AS A WAY TO REDUCE RISK IN TARGETED MUNICIPALITIES ON PAGE 34.
LE
AD
ER
SH
IP R
EP
OR
T
SA
NT
AM
INT
EG
RA
TE
D R
EP
OR
T 2
016
51
CSI BRINGS FURTHER RISK SUPPORTInvesting in communities makes them more resilient and self-
sufficient over the longer term. This is good for business and
has a positive impact on the economy. Santam’s corporate social
investment strategy is directed primarily at building resilience in
communities in the targeted high-risk municipalities (Ehlanzeni,
Sarah Baartman and Sedibeng).
Focus areas include:
− Driving community risk awareness through partnerships to
address the drivers of risk and inculcate appropriate risk
response behaviour
− Partnering with appropriate entities to increase capacity for
disaster response and disaster relief in vulnerable communities
− Assisting with the improvement of technology to enable
communities to use early warning systems to drive proactive risk
management behaviour
− Addressing the causes of fire risks in communities by providing
safer alternatives, for example replacing candles with solar
candles, heat and smoke sensors, etc.
− Where appropriate, assisting neighbourhood watches with
necessary equipment to improve their service to communities
− Focusing on hotspots in the high-risk communities and address
high-risk activities through partnerships and programmes, for
example eradication of alien vegetation projects for job creation
purposes, firebreaks, etc.
Santam invested R21 million in CSI projects, including consumer
financial education (CFE) (2015: R16 million), with the majority
allocated to environmental and development programmes.
READ MORE ABOUT SANTAM’S CSI INITIATIVES ONLINE.
MANAGING CLIMATE RISKSWeather patterns are becoming difficult to predict in the context of
global warming, exacerbated by urbanisation and the impact
of increased concentration in big cities.
Santam has been a member of ClimateWise since 2009. We are
committed to forward action on climate risk and to find ways for
our actions, products and solutions to effect positive change, build
resilience and to reduce the risks that the climate poses for our
industry, our business and society at large.
Santam uses the PwC ClimateWise Principles Independent Review
to track its progress in addressing climate risk. The ClimateWise
Principles provide an international standard tailored specifically to
the insurance sector. Adherence to these principles demonstrates
a commitment to orientate business practice towards a resilient,
low-carbon economy.
Santam has improved its ranking among ClimateWise members from
14th in 2015 to 12th place. The group achieved an overall score of 56%
(2015: 49%).
A number of initiatives have been implemented to account for the
impact of climate challenges, including geocoding, actuarial pricing
and providing support to local authorities. Santam investigated the
impact of water scarcity on underwriting. This was typically residually
rated as low, as policy wording in most instances excluded cover in
water scarcity scenarios. It is now included in the top lists of risks
and is being actively monitored to determine mitigating actions and
potential interaction with other perils due to the potential wider
impact of water scarcity.
The group continues to engage with policymakers nationally and
internationally to improve systemic resilience. Santam participated
in the PSI GRP and signed the Sendai Statement for disaster risk
management. The group is a member of the stakeholder council
of the Global Infrastructure Basel (GIB) voluntary Standard for
Sustainable and Resilient Infrastructure and was a signatory to the
Paris Pledge for Action in support of achieving and exceeding the
implementation ambitions of the final COP21 agreement in 2015.
READ MORE ABOUT COLLABORATION REGARDING INFRASTRUCTURE AT RISK DUE TO CLIMATE RISK IN THE REAL-LIFE STORY ON PAGE 33.
LE
AD
ER
SH
IP R
EP
OR
T
SA
NT
AM
INT
EG
RA
TE
D R
EP
OR
T 2
016
52
MULTINATIONAL RISK MANAGEMENT Santam is building capacity to improve the understanding of risk
exposures in the geographical markets where we invest. The failure
rate has been high for multinationals penetrating African markets
without a deep understanding of local dynamics, skills and
conditions. Santam develops an understanding of market dynamics
through research and relationships and by recognising that Africa
is made up of 54 sovereign states that cover a range of natural
ecosystems and an even more vast range of cultures, with about
2 000 languages spoken.
READ MORE ABOUT HOW WE APPROACH RESPONSIBLE DIVERSIFICATION ON PAGE 54.
DATA AND SYSTEMS SUPPORTING RISK MANAGEMENTSantam’s multiyear investment in a new policy administration system
is enabling the business to improve risk assessment, pricing and
underwriting. The new system, which has been implemented for
personal policies and is at the policy migration phase for commercial,
also improves the group’s ability to respond quickly to the market
from a product perspective. It helps streamline and improve
processes and system infrastructure, and enables us to interact
with customers through a variety of channels.
READ MORE ABOUT SANTAM’S INVESTMENT IN NEW SYSTEMS IN “CONTINUOUSLY INCREASE EFFICIENCY” ON PAGE 52.
Santam’s claims experience over the last few years reflects rising
levels of flood, fire and storm events. The group has been investing
in data access and quality to improve our understanding of these
phenomena.
RISK MANAGEMENT THROUGH THE INTERNAL CAPITAL MODELWith the implementation of SAM now scheduled for 2017, Santam
has entered the next phase in the approval of its internal capital
model. Santam operates an internal capital model that is in line with
best practice, to assist with capital management, risk quantification
and decision-making. The group has been engaging with the FSB
for several years to establish the suitability of the internal model
for regulatory use once SAM is enacted. The FSB has evaluated the
internal dimensions of the model through thematic reviews, and
has now given the go-ahead for Santam to enter the formal
application phase.
CONTINUOUSLY INCREASE EFFICIENCYWe maintain high standards of operational efficiency, ultimately
creating more robust and sustainable stakeholder outcomes by
continuously increasing efficiency.
Santam’s willingness to invest in large, long-term projects to provide
data capabilities and agility for future business contexts is delivering
the anticipated benefits. An investment in technology of R212 million
capitalised since inception has, for example, enabled Santam
Commercial and Personal to improve productivity measurably. The
investment assists the business unit in implementing the strategy
and being competitive in a world of digital disruption. It provides
optionality in optimising current processes and accessing new
business models. In practice, this means that intermediaries and
policyholders can select their Santam interface, offering and profile
seamlessly – at any time, from anywhere.
The majority of personal line policies have been migrated to the new
system. This is expected to be completed in 2017. New business is
already being written on the system. Commercial policies have been
migrating since June 2016.
TRANSFORMING SUPPLY RELATIONSHIPSSantam’s suppliers form an integral part of the claims management
process and the group’s ability to deliver on its promise to clients.
Procurement and sourcing have been centralised for the Sanlam
Group, including Santam, but subsidiaries still have the option to
manage their own sourcing, for example at MiWay.
Suppliers encompass functional elements that include claims
assessment, contact centres, drive-in centres, a variety of technical
specialists, repairers and the internal arbitrator. The robustness of
the supplier network is tested for efficiency, cost-effectiveness and
reliability by catastrophe events, such as floods in Johannesburg this
year. Total claims incurred for the year amounted to R12.9 billion
(2015: R11.5 billion).
The supplier network is also an area of high impact through
empowerment initiatives, with the opportunity to encourage local
employment and sourcing. In collaboration with the Sanlam
Group, Santam continued its participation in the Sanlam Santam
Enterprise Development Programme in partnership with ASISA.
Santam has contributed R40 million over two years by investing in
the sustainability of small and medium-sized enterprises in the
group supply chain. The programme assisted 81 small and medium
enterprises that support 264 jobs, including 67 new jobs.
LE
AD
ER
SH
IP R
EP
OR
T

SA
NT
AM
INT
EG
RA
TE
D R
EP
OR
T 2
016
53
In total, 88.7% (2015: 96.9%) of the group’s spend is with BBBEE
suppliers, of which 43.9% (2015: 41.3%) are qualifying small
enterprises or exempt micro-enterprises.
Santam also engages regularly with stakeholders such as the
South African Auto Repairer and Salvage Association (SAARSA) and
South African Building Contractors and Civils Association (SABCCA)
to find ways to increase its support of supplier development initiatives
and direct its spend to enable empowerment.
CONTINUOUS COST MANAGEMENTA weaker currency has a direct impact on Santam’s claims costs
in South Africa. To mitigate and manage this risk, Santam has
implemented a value-based decision model that directs spend to the
most suitable suppliers based on their value offering to the group.
This entails an assessment based on quality, service, price and
transformation criteria.
The group continues to explore initiatives to contain costs, as
this contributes positively to Santam’s loss ratio and supports
affordable insurance premiums. Some progress has been made in
contracting direct supply of parts to motor body repairers through
original equipment manufacturers. This is a long-term initiative
with engagements at different stages of maturity, and overall good
interaction with dealer groups.
The Santam claims card is functioning well with further functional
enhancements implemented to support flexible, client-centric claims
fulfilment processes. Further roll-out of the card mechanism and
leveraging of the supply base in this regard is planned for 2017.
Santam’s internal cost management process includes quarterly
expense forum meetings, which monitor expense trends and
drive savings. This is approached holistically, considering cost
management from policy formulation through to cultural drivers.
We believe in constantly making small improvements to deliver
long-term optimisation.
THE RIGHT PEOPLEFor the past 99 years, people have been at the heart of Santam’s
business and its success. Our strategic focus on “the right people”
ensures that we have the right people in the right positions to deliver
on our chosen strategies.
Our achievements include the continuous adjustment to a diverse
employee complement that is suited to the contexts in which we do
business, and progress towards meeting our transformation targets.
THE RIGHT PEOPLE FOR A MULTINATIONAL CONTEXTSantam’s expansion outside South Africa requires building people
capabilities to manage increasing size, scale and complexity. With
a growing presence in South Africa, sub-Saharan Africa, India and
Malaysia, the group has to take the development of leadership skills
beyond the traditional to include traits such as the ability to influence,
cultural intelligence and an understanding how to manage and lead in
different environments.
Our leadership programmes – at junior, middle and senior
management levels – have a strong leaning towards managing
diversity, leading and managing change, innovation across different
geographies and collaboration with global partners. These
programmes are designed and facilitated in partnership with external
parties and business schools.
Our business, and that of our partners in other geographies, also
requires key technical skills that include general insurance, specialist
underwriting, actuarial, operational and finance. For example,
through SEM, we are in the process of rolling out a surveyor training
e-learning course, with the necessary on-site support.
To support the business partners where we invest, we have
employees in medium-term secondments (one to three years) and
short-term (three to six months) assignments. This creates the
opportunity for talent mobility and development across the business.
We also have partnerships through which our business partners
in international markets assign their employees for training and
knowledge sharing in the Santam South African businesses.
It is vital that we are able to “export” the Santam culture, underpinned
by the values of integrity, passion, humanity, innovation and
excellence. These engender trust in the Santam brand wherever
we operate.
LE
AD
ER
SH
IP R
EP
OR
T

SA
NT
AM
INT
EG
RA
TE
D R
EP
OR
T 2
016
54
THE RIGHT PEOPLE FROM A TRANSFORMED PERSPECTIVEAt Santam, transformation is embedded and integrated into the way
our business operates and across our stakeholder value chain.
Our focus remains on the diversification of our South African
workforce, intermediary and supplier network, providing opportunities
for non-traditional markets to access Santam’s products, as well as
investment in the communities in which Santam employees live and
where the group does business. Transformation initiatives reinforce
the brand promise of Insurance good and proper.
A new diversity strategy was launched in April 2016 to ensure that the
Santam culture supports sustainable transformation.
To ensure future availability of black intermediaries for the
industry, and as a critical element of Santam’s business model and
transformation priorities, the Santam Black Broker Development
programme, which focuses predominantly on developing skilled black
people as intermediaries, has delivered 166 black learners in 2015
and 2016. The learners have graduated from the programme with
a full insurance qualification and are now contributing to the South
African economy.
The programme has been expanded to smaller cities like
Pietermaritzburg and Bloemfontein to provide broader access. The
goal is to expand the programme to youth in rural towns. Efforts to
increase the placement of Black Broker Development graduates in
permanent employment are progressing, following the establishment
of a central structure in Santam to encourage and promote cross-
selling opportunities and generate business leads across various
distribution channels.
As part of Santam’s effort to build a pipeline of new entrants into the
insurance industry, a concerted effort is made to place as many of the
Black Broker Development graduates with either intermediaries or
Santam. Twelve per cent of the graduates of the class of 2015 have
been placed.
Santam’s learnership programmes for 2016 included:
− The Santam general insurance learnership programme
− The Santam motor assessor learnership programme
− The Santam Black Broker Development programme
− The empowerment incubator (Uyanda STI Careers)
THE RIGHT PEOPLE FROM AN ORGANISATIONAL PERSPECTIVESantam participated in the Top Employer Certification Programme
for the first time and was subsequently certified as a Top Employer
for 2017.
Attracting and securing new talent remains a challenge for Santam
and the insurance sector as a whole. Santam invests funds and
resources in the form of subsidised study assistance for employees,
leadership programmes, graduate development programmes and the
Black Broker learnership programme (the biggest general insurance
learnership in South Africa). As a prospective employer, Santam
provides cross-border mobility and opportunities in diverse fields,
such as aviation, agriculture, marine and transport insurance.
Santam is also making progress with the implementation of the
Strategic Resourcing Plan (SRP), which is creating additional roles to
mitigate critical skills needs. Santam’s talent management strategy
supports the plan: high-potential successors for senior and middle
management have been identified and talent pools have been created
for critical skills, such as assessors and underwriters.
The Santam group annual recognition awards are targeted at
individuals and teams who have made an exceptional contribution
to the business and had an impact on the Santam strategy.
Santam drives performance excellence through a culture of
performance accountability, employee engagement, reward and
recognition. A project to review Santam’s total rewards framework
is in progress to ensure that our total rewards approach effectively
supports talent attraction and retention.
All group employees have performance contracts in place for each
year, with clear key performance indicators (KPIs), weightings,
targets and measurements set for that period. These KPIs align
with the group strategy and the business unit and team focus areas.
In this way, the strategy is deployed into executive and business
unit scorecards, and ultimately cascaded to individual performance
contracts. Employees are formally appraised twice a year and given
informal feedback on an ongoing basis. A four-level recognition
framework and online 360-degree evaluation functionality was
implemented to support the culture of performance excellence.
READ MORE ABOUT PERFORMANCE INCENTIVES IN THE REMUNERATION REPORT ON PAGE 93.
LE
AD
ER
SH
IP R
EP
OR
T
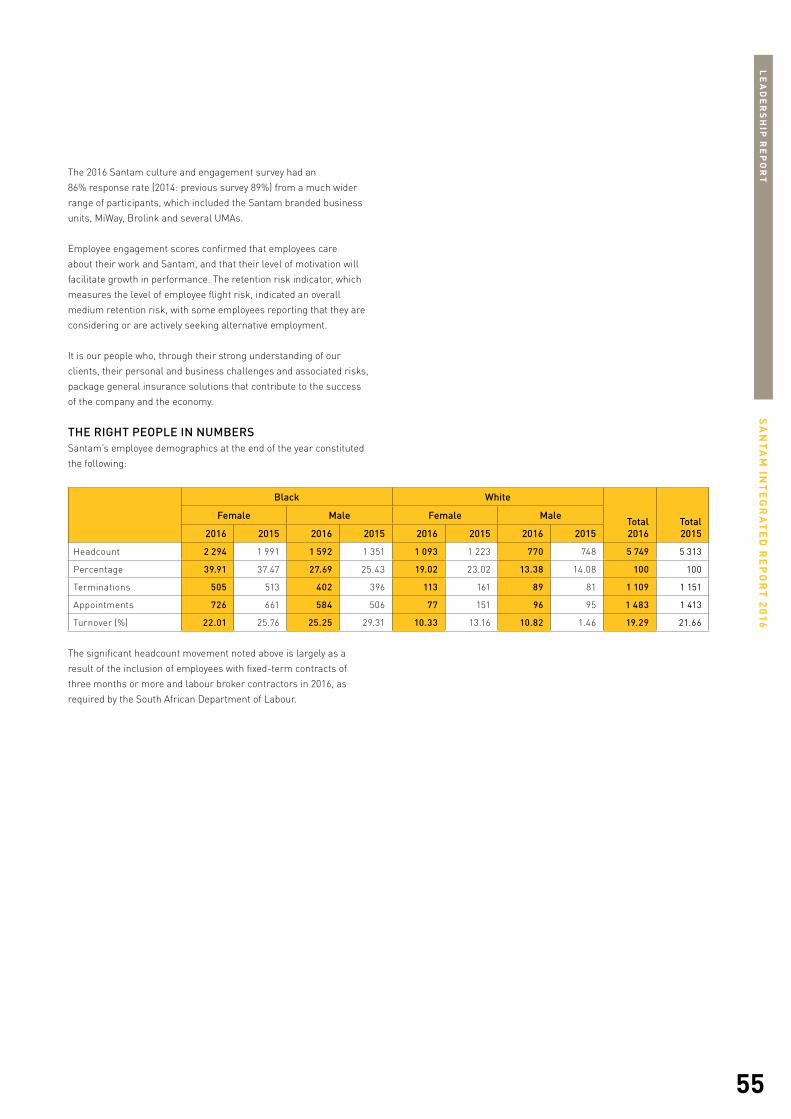
SA
NT
AM
INT
EG
RA
TE
D R
EP
OR
T 2
016
55
The 2016 Santam culture and engagement survey had an
86% response rate (2014: previous survey 89%) from a much wider
range of participants, which included the Santam branded business
units, MiWay, Brolink and several UMAs.
Employee engagement scores confirmed that employees care
about their work and Santam, and that their level of motivation will
facilitate growth in performance. The retention risk indicator, which
measures the level of employee flight risk, indicated an overall
medium retention risk, with some employees reporting that they are
considering or are actively seeking alternative employment.
It is our people who, through their strong understanding of our
clients, their personal and business challenges and associated risks,
package general insurance solutions that contribute to the success
of the company and the economy.
THE RIGHT PEOPLE IN NUMBERSSantam’s employee demographics at the end of the year constituted
the following:
Black White
Total 2016
Total 2015
Female Male Female Male
2016 2015 2016 2015 2016 2015 2016 2015
Headcount 2 294 1 991 1 592 1 351 1 093 1 223 770 748 5 749 5 313
Percentage 39.91 37.47 27.69 25.43 19.02 23.02 13.38 14.08 100 100
Terminations 505 513 402 396 113 161 89 81 1 109 1 151
Appointments 726 661 584 506 77 151 96 95 1 483 1 413
Turnover (%) 22.01 25.76 25.25 29.31 10.33 13.16 10.82 1.46 19.29 21.66
The significant headcount movement noted above is largely as a
result of the inclusion of employees with fixed-term contracts of
three months or more and labour broker contractors in 2016, as
required by the South African Department of Labour.
LE
AD
ER
SH
IP R
EP
OR
T

Our agriculture business understands that today’s farmers know more than just farming. They have to take care of their farms, their families and their workers. That’s why we help lighten the load by offering insurance that covers their farms, crops and livestock, as well as their personal assets, under one umbrella.
WE KNOW FARMERS VALUE MORE THAN JUST THEIR FARMS.

SA
NT
AM
INT
EG
RA
TE
D R
EP
OR
T 2
016
58
CH
IEF
FIN
AN
CIA
L O
FF
ICE
R’S
RE
PO
RT
CHIEF FINANCIALOFFICER’S REPORT
OVERVIEWThe Santam group reported underwriting results for the
2016 financial year well within the target range of 4% to 8% with
a net underwriting margin of 6.4% compared to the exceptional 9.6%
in 2015. The negative impact of a number of large property claims and
the drought on the crop insurance business was set off by disciplined
underwriting actions in the Commercial and Personal business,
as well as a strong performance by the liability business and
MiWay. Significant catastrophe claims were contained through
reinsurance recoveries.
Acceptable gross written premium growth of 7% was achieved
(6% excluding the impact of cell captive insurance business)
in the current low-growth economic environment.
Investment income, net of fair value movements on financial assets and liabilities, of R832 million was significantly lower compared to R1 445 million in 2015. The South African investment portfolio performed better than the market. The relative strengthening of the rand during 2016, compared to the very weak position at December 2015, resulted in significant foreign currency losses of R372 million (including the SEM investment portfolio) compared to gains of R467 million included in investment income in 2015. In addition, the value of the SEM general insurance business portfolio showed negative unrealised fair value movements following tough trading conditions in certain emerging markets.
Headline earnings per share decreased by 41%, while a return on
capital of 15.9% on an annualised basis was achieved. Normalising
the results for the impact of the foreign currency gains and losses in
2015 and 2016, headline earnings per share would have decreased
by 14%, while return on capital would have improved to 18.5%.
Cash generated from operations decreased to R2.2 billion
(2015: R3.7 billion) impacted by the normalised underwriting
performance in 2016 compared to 2015. The economic capital
coverage ratio of 155% was close to the midpoint of the target
range of 130% to 170%.
FINANCIAL RESULTSA summary set of financial statements for 2016, prepared in
accordance with IAS 34, is included in this integrated report.
The full annual financial statements are available on our website
at www.santam.co.za or in printed format on request from the
company secretary.
READ MORE ABOUT THE KEY FINANCIAL STATISTICS ON PAGE 22.
ECONOMIC ENVIRONMENTReal annual GDP was a low 0.7% for 2016 with inflation (average
CPI) of 6.4%, which equates to low growth of insurable assets for
the insurance industry. The repo rate increased by a further 75 basis
points in 2016, following the 50 basis points increase in 2015, which
resulted in more pressure on consumers and increased interest
income for the group.
The rand appreciated by 12% against the US dollar since
January 2016 following the significant weakening in December 2015,
which resulted in significant currency losses on foreign assets in
2016. The rand is, however, still weaker than pre-2014 levels, which
continues to have a negative impact on claims cost (mainly imported
motor parts). Santam continues to focus on the optimisation of the
claims and procurement value chains to increase efficiency and
counter the impact of the weakening rand.
CREDIT RATING AGREEMENT South Africa’s foreign currency sovereign rating was affirmed at BBB-
(negative outlook) in December 2016. S&P, however, lowered its local
currency rating on South Africa to BBB from BBB+, reflecting their
view of South Africa’s weakening debt position and continued low
GDP growth.
As a result of this downgrade Santam’s international counterparty
credit and insurer financial strength rating was also lowered to BBB
from BBB+ as it is limited to the level of the S&P local currency
sovereign credit rating. The revised rating was a reflection of S&P’s
view on South Africa and was not driven by any change in the financial
performance of Santam.
In order to compete in the international insurance market an
A- or better international credit rating is often required. Santam
has therefore entered into an agreement with Munich Reinsurance
Company of Africa Ltd (Munich Re of Africa) in October 2016 in
terms of which selected Santam business units will be able to use
the reinsurer’s S&P AA- credit rating to write inwards international
reinsurance business on Munich Re of Africa’s licence. This will
enable Santam to further the group’s strategic objective to profitably
grow its business flows from territories outside South Africa in
situations where an international credit rating of A- or better is
required. The agreement between Santam and Munich Re of Africa
is effective 1 January 2017.
The agreement with Munich Re of Africa replaces a credit rating
agreement with another international reinsurer which expired
on 31 December 2016, in terms of which Santam could use that
insurer’s licence for business which was dependent on a minimum
international scale rating.

SA
NT
AM
INT
EG
RA
TE
D R
EP
OR
T 2
016
59
CH
IEF
FIN
AN
CIA
L O
FF
ICE
R’S
RE
PO
RT
INSURANCE RESULTSUNDERWRITING PERFORMANCEThe net underwriting margin of 6.4% decreased from the exceptional
margin of 9.6% achieved in 2015. It is on par with the 10-year average
of 6.4%.
Gross written premium growth of 7% (6% excluding the impact of
cell insurance business), was on par with the 7% (7% excluding cell
business) achieved in the corresponding period in 2015, impacted
by competitive market conditions and the economic slowdown in
South Africa.
The property class achieved strong growth of 11% on the back of
increased corporate property business written in the rest of Africa
and Asia and good growth achieved by the Santam re property
portfolio. The motor class benefitted from the 19% growth reported
by MiWay, but was negatively impacted by corrective actions on
unprofitable books of business on outsourced platforms.
The liability and transport classes experienced significant
competitive market pressure and reported a decline in gross written
premiums of 9% and 1% respectively. The engineering business for
large construction contracts was under strain following reduced
construction activity in the current economic climate, reflecting
growth of only 2%.
The crop insurance business showed significant growth of 17%
following the low premium growth in 2015 due to prevailing drought
conditions. Acceptable growth of 7% was achieved in the alternative
risk class.
The group’s focus on international diversification continued to
reflect positive growth results with gross written premium from the
rest of Africa, India, Southeast Asia and China of R1 431 million for
the period (2015: R1 354 million). Santam Namibia reported gross
written premium of R1 118 million (2015: R1 056 million), resulting
in total gross written premium from outside South Africa for 2016
increasing to R2 549 million compared to the R2 410 million
achieved in 2015. In addition, Santam’s portion of the gross written
premium from SEM insurance businesses increased to R1 939 million
(2015: R675 million).
The motor and property classes of business were positively
impacted by continued disciplined underwriting, including a
significant improvement in the underwriting results from business
on outsourced platforms. The impact of the catastrophe hail events
during 2016 was significantly reduced by recoveries from the
catastrophe and sideways reinsurance programmes, resulting in
the net impact of 2016 catastrophe events to be in line with 2015. A
number of large corporate property claims reduced the underwriting
results in the property class of business. MiWay reported a claims
ratio of 63.6%, up from 60.9% in 2015, mainly due to the impact of
significant new business growth and an increase in motor parts cost
following the weakening of the rand in 2015. MiWay contributed an
underwriting profit of R160 million (2015: R163 million). The continued
investment in the expansion of Santam Direct, MiWay Business
Insurance and MiWay Broker Direct reduced the net underwriting
margin in 2016. These new initiatives however performed in line with
their business plans to generate future profitable growth.
The underwriting profit of the engineering class of business showed a
decrease compared to 2015, mainly due to the impact of competitive
market conditions. The liability class reflected a significant
improvement in underwriting results following claims estimate
releases and the absence of large claims during 2016.
Despite the severe drought conditions during the first half of 2016,
the crop insurance business achieved a net underwriting profit of
R69 million (2015: R131 million). This was as a result of disciplined
underwriting and fewer hail-related claims during the crop season.
Gross drought claims of R231 million were incurred during 2016.
The transportation class was negatively impacted by a number of
significant aviation claims. Santam re delivered satisfactory results
on third-party business.
There were no significant changes to the group’s reinsurance
programme for 2016 as the soft reinsurance market continued
to provide opportunities to optimise reinsurance placements.
NET INSURANCE RESULTS UNPACKED
2016 20155-year
average10-year average
R million % of NEP R million % of NEP % %Net earned premium (NEP) 19 826 100.0 18 523 100.0 100.0 100.0
Claims incurred 12 911 65.1 11 510 62.1 65.6 66.3
Acquisition costs 5 647 28.5 5 234 28.3 28.1 27.3
Underwriting surplus 1 268 6.4 1 779 9.6 6.3 6.4
Investment return on insurance funds 619 3.1 499 2.7 2.6 2.9
Net insurance result 1 887 9.5 2 278 12.3 8.9 9.3
Combined ratio 93.6 90.4 93.7 93.6

SA
NT
AM
INT
EG
RA
TE
D R
EP
OR
T 2
016
60
CH
IEF
FIN
AN
CIA
L O
FF
ICE
R’S
RE
PO
RT
The net acquisition cost ratio of 28.5% increased from 28.3% in 2015.
The management expense ratio decreased from 17.5% in 2015 to
16.5% in 2016. The 2015 comparatives included the management
expenses of Indwe Broker Holdings Group (Pty) Ltd (Indwe). Following
the sale of the controlling stake in Indwe in December 2015, the
management expenses of Indwe are no longer consolidated in 2016.
The adjusted ratio excluding Indwe for 2015 was 16.9%. Management
expenses growth was well contained despite new growth initiatives.
Strategic project costs, included as part of management expenses,
amounted to 0.8% of net earned premium (2015: 0.9%). These
costs mainly relate to the continued development of a new core
underwriting, administration and product management platform
for the Santam intermediated business. The project is progressing
according to plan with the majority of personal lines policies
now migrated to the new system. The development phase of the
commercial business product was completed in June 2016 and
the migration processes has commenced. Development costs
of R17 million were capitalised in 2016, bringing the total amount
capitalised since inception to R212 million. Santam will maintain its
focus on cost-efficiencies to improve the management expense ratio
over the medium term.
The net commission ratio was 12.0% (2015: 10.8%). The comparative
ratio in 2015 excluding Indwe was 11.5%. A decrease in the
commission ratio due to the growth in MiWay, where limited
commission expenses are incurred, was offset by lower reinsurance
commissions earned, mainly on crop and corporate property
business, following relatively worse loss ratios compared to 2015.
Furthermore, commission on inwards reinsurance business from
Santam re, as well as business written in Africa, typically carries
higher commission rates than South African business.
In managing Santam’s risk pool, the aim is to retain the optimum
amount of risk after reinsurance, taking into account the group’s
risk appetite and the cost of reinsurance. The level of reinsurance
earned premium as a percentage of gross earned premium increased
somewhat from 19.0% in 2015 to 19.8% in 2016 on a comparable
basis, excluding the impact of cell business. Favourable reinsurance
terms on specialist business lines, and increased reinsurance ceding
by Centriq, were key drivers for the increase.
INVESTMENT RETURN ON INSURANCE FUNDSThe assets backing the net insurance funds (excluding Centriq group)
decreased from R7.5 billion in December 2015 to R7.3 billion as at
31 December 2016, mainly due to lower technical reserves at the
end of 2016 compared to 2015. The assets backing the net insurance
funds (excluding Centriq group) were invested as follows:
23.3
32.7
76.7
67.3
2016 2015
ASSETS BACKING NET INSURANCE FUNDS (excl CENTRIQ GROUP) %
0
10
20
30
40
50
60
70
80
Interest-bearing instrumentsCash and money market
Currency mix of assets backing net insurance funds (excl Centriq group)
2016R million
2015R million
Cash and other short-term interest-bearing instruments
Rand 5 959 6 255US dollar 605 459Other currencies 324 315
Debt securitiesRand – 52US dollar 391 408Total 7 279 7 489
The investment return on insurance funds increased to R619 million
(2015: R499 million) supported by a 75 basis points increase in
interest rates during 2016, higher-average insurance funds for the
year, as well as the good investment performance of the investment
portfolios backing the insurance funds.

SA
NT
AM
INT
EG
RA
TE
D R
EP
OR
T 2
016
61
CH
IEF
FIN
AN
CIA
L O
FF
ICE
R’S
RE
PO
RT
INVESTMENT RESULTSINVESTMENT INCOMEThe South African investment portfolio achieved good returns in 2016;
however, the investment results were negatively impacted by foreign
currency losses and the performance of the SEM investments.
Listed equities achieved a return of 3.3%, lagging the SWIX
benchmark of 4.1%. A hedge structure over R1 billion of equities
entered into for the period May to December 2016 realised a profit
of R75 million, increasing the total return of the listed equity
portfolio to 8.4%. The Santam group’s interest exposure is managed
in enhanced cash and active income portfolios. The active income
portfolios include exposure to bonds and longer-dated instruments
and had about R7 billion invested in line with this strategy across the
group during 2016. The active income portfolios achieved a strong
performance of 10.6% for the year, comfortably exceeding the
STeFI-related benchmark.
Negative fair value movements (excluding foreign currency losses)
of R67 million (2015: positive movement of R47 million) in Santam’s
interest in SEM’s general insurance businesses in Africa, India and
Southeast Asia had a further negative impact on the investment
performance.
The following were key drivers of the fair value movements
of Santam’s share of the SEM investment portfolio:
– A downward adjustment to the value of the P&O business
in Malaysia of R88 million due to lower premium growth
in competitive market conditions. There is a significant focus
on expanding the current P&O product offering, and growth
reported in non-motor business lines was positive.
– A reduction in the value of the investment in SORAS in Rwanda
of R47 million following financial irregularities identified during
2016 relating to prior years. Corrective measures were taken to
address these irregularities, and the business was recapitalised
during the second half of 2016.
– An increase in the value of SGI of R51 million was
mainly attributed to good growth achieved in the Indian
insurance market.
Net earnings from associated companies of R67 million increased
from the R53 million reported in 2015 following the acquisition
of the Saham Finances investment through a 25% shareholding
in SAN JV, which contributed earnings of R43 million in 2016.
No earnings were recognised from Credit Guarantee Insurance
Corporation of Africa Ltd in 2016 (2015: R31 million) following
the sale of this investment in 2015.
5.5
7.9
25.8
25.0
20.5
20.9
16.4
12.4
19.4
18.7
12.4
15.1
2016 2015
SHAREHOLDER FUNDS ASSET MIX %
0
5
10
15
20
25
30
Oth
er a
sset
s
Inve
stm
ent i
n S
aham
Fin
ance
s v
ia S
AN J
V1
SEM
par
ticip
atio
ns
List
ed e
quiti
es
Inte
rest
-bea
ring
inst
rum
ents
and
pref
eren
ce s
hare
s
Cas
h an
dm
oney
mar
ket
1 2016 includes US$10 million cash designated for the further subscription of shares in Saham Finances via SAN JV, and 2015 included US$100 million cash designated for the initial subscription.
41.8
46.7
12.9
27.1
6.4 7.2
17.5
16.4
12.4
5.0 6.
6
2016 2015
SHAREHOLDER FUNDS CURRENCY MIX %
0
10
20
30
40
50
Oth
er c
urre
ncie
s (m
ainl
y N
amib
ian
dolla
r)
SEM
(var
ious
cu
rren
cies
)
Dir
ham
(in
vest
men
t in
Saha
m F
inan
ces
via
SAN
JV)
Pou
nd s
terl
ing
Dol
lar1
Ran
d
1 Includes cash designated for the Saham Finances transactions via SAN JV.

SA
NT
AM
INT
EG
RA
TE
D R
EP
OR
T 2
016
62
CH
IEF
FIN
AN
CIA
L O
FF
ICE
R’S
RE
PO
RT
INVESTMENT APPROACHSantam follows a policy of managing its investment portfolios in
a diversified manner. Our aim is to optimise investment income
within the approved risk appetite profile. Detail on risk management
practices can be found in note 3 to the annual financial statements.
The asset allocation is also managed and monitored from an asset/
liability perspective. This ensures that there are sufficient liquid funds
available to meet Santam’s insurance liabilities to ensure that the
subordinated debt obligations are adequately covered by matching
interest-bearing instruments, and that the shareholders’ funds are
not unduly exposed to investment risk. Foreign currency assets are
also held to back foreign currency insurance business conducted by
Santam in order to manage the currency risk.
As at 31 December 2016, funds to the value of R1.7 billion
(2015: R1.4 billion) backing the insurance liabilities and capital
relating to the business written in foreign currency were invested in
foreign currency bank accounts and global fixed income portfolios.
Investment management is mostly outsourced to Sanlam Investment
Management, an external fund manager under predetermined
mandates, which consists of a combination of various benchmarks,
inter alia, SWIX and STeFI-related benchmarks. The overall
performance of the fund manager against the mandates is monitored
and tracked by management and reported to the Santam investment
committee and board on a quarterly basis. The mandate guidelines
include performance objectives, market risk limitations such as
tracking error and duration, asset allocation, credit and exposure
limitations, the use of derivative structures and compliance with
relevant FSB regulations.
SEM PARTICIPATION INVESTMENTSSantam entered into a series of transactions with SEM in
December 2013, in terms of which Santam acquired participation
interests in SEM’s emerging markets general insurance investments.
The co-investment arrangement positions SEM as a single investor
for the Sanlam Group’s general insurance businesses in emerging
markets, while enabling Santam to share in the economic interest of
the current and future general insurance expansion in these markets.
In principle, SEM and Santam participate on a 65%/35% basis,
respectively, in the Sanlam Group’s general insurance businesses
in emerging markets. Through this participation, Santam obtains
exposure to the Indian, Malaysian and African emerging markets,
and has the opportunity to participate in the Sanlam Group’s future
emerging markets general insurance investments. Santam renders
technical services to the SEM general insurance partner companies.
Santam has subscribed for shares of separate classes in
SEM with each separate class linked to one of the following
participation interests:
SEM INVESTMENT HOLDINGS
Incorporated in
Santam effective
holding 2016%
Santam effective
holding 2015%
P&O Malaysia 15.4 15.4
SGI India 15.0 7.0
BIHL Insurance Company Ltd Botswana 21.2 20.5
NICO Holdings general insurance subsidiaries Malawi and Zambia 19.8 21.6
NICO Holdings general insurance subsidiaries Uganda 28.6 29.3
NICO Holdings general insurance subsidiaries Tanzania 17.4 18.1
SORAS Rwanda 26.1 22.1
SOCAR s.a. Burundi Burundi 8.6 7.3
FBN General Insurance Ltd Nigeria 12.3 12.3
Enterprise Insurance Company Ltd Ghana 14.0 14.0
Sanlam General Insurance Ltd (previously Gateway Insurance Company Ltd) Kenya 10.9 10.9
Botswana Insurance Company Ltd Botswana 10.3 –
Zimnat Lion Insurance Company Ltd Zimbabwe 14.0 –
Grand Reinsurance Company (Private) Ltd Zimbabwe 14.0 –

SA
NT
AM
INT
EG
RA
TE
D R
EP
OR
T 2
016
63
Santam accounts for these investments as fair value through income
financial instruments; the changes in market value are included in
the statement of comprehensive income.
Santam increased its participatory interest in SGI during the second
half of 2016 by 8% to 15% at a cost of R251 million.
SEM PARTICIPATION INVESTMENTS
Region2015
R millionAdditionsR million
Fair value movements
2016R million
Change in exchange
ratesR million
Change invaluationR million
Africa 271 83 (54) (30) 270Southeast Asia 382 – (49) (88) 245India 352 251 (42) 51 612
1 005 334 (145) (67) 1 127
ANALYSIS OF SANTAM’S SHARE OF THE UNDERWRITING PERFORMANCE OF THE SEM INVESTMENTS2016 2015
R million Key ratios (%) R million Key ratios (%)Gross written premium 962 675
Net written premium 688 494
Net earned premium 665 100 499 100
Net claims incurred 484 73 397 80
Net commission 32 5 19 4
Management expenses 162 24 103 21
Underwriting result (13) (2) (20) (4)
Investment return on insurance funds 119 18 79 16
Net insurance result 106 16 59 12
The acquisition of a 30% shareholding in Saham Finances, together
with SEM, was finalised during the first quarter of 2016. SEM and
Santam’s respective 75% and 255 acquisitions were structured
through SAN JV.
In December 2016, SEM and Santam announced a further acquisition
of a 16.6% interest in Saham Finances via a subscription for new
shares for US$325 million, which are still subject to regulatory
approval. Santam’s share of the purchase price is US$7.35 million
plus transaction costs. Santam’s ability to participate in the
transaction was limited due to the size of the investment already
held in Saham Finances through SAN JV. The investment in Saham
Finances comprised more than 17.5% of Santam’s shareholder
funds at 31 December 2016, making it the most significant strategic
investment held by Santam. Santam’s interest in SAN JV will
therefore dilute to 15% (previously 25%). The dilution of Santam’s
interest in SAN JV will, however, not affect any of its existing
shareholder rights.
During the second half of the year, Santam contributed R36 million to
the recapitalisation of SORAS.
The SEM investments accounted for 16.4% (2015: 12.4%) of the
Santam group’s shareholder funds.
ANALYSIS OF SANTAM’S SHARE OF THE UNDERWRITING PERFORMANCE OF THE SAHAM FINANCES INVESTMENT, THROUGH SAN JV, FOR THE 10 MONTHS TO 31 DECEMBER 2016
2016R million Key ratios (%)
Gross written premium 977 Net written premium 789 Net earned premium 749 100Claims incurred 498 67Net commission 89 12Management expenses 185 25
Underwriting result (23) (3)Investment return on insurance funds 61 8Net insurance result 38 5
CH
IEF
FIN
AN
CIA
L O
FF
ICE
R’S
RE
PO
RT

SA
NT
AM
INT
EG
RA
TE
D R
EP
OR
T 2
016
64
CH
IEF
FIN
AN
CIA
L O
FF
ICE
R’S
RE
PO
RT
CAPITAL MANAGEMENT AND SOLVENCYCAPITAL MANAGEMENT PHILOSOPHYSantam’s capital management philosophy is to maximise the
return on shareholders’ capital within an appropriate risk appetite
framework. The aim is to increase shareholder wealth by actively
managing the following:
– The amount and sources of capital in the business. This is also
linked to the current and future regulatory capital requirements
in terms of the existing and the newly formulated solvency
assessment and management regime (SAM).
− The allocation of capital to business units or new business
ventures/acquisitions.
− The amount and type of risk that the company is willing to
assume in the pursuit of value creation.
− The reinsurance programme and asset allocation to optimise
economic capital requirements.
Santam targeted a threshold return on capital hurdle rate of 24% in
2016. Capital is allocated to the various businesses in the group and
the returns on these businesses are measured against the threshold
hurdle rate.
UNSECURED SUBORDINATED CALLABLE NOTE PROGRAMMESantam Ltd established a new R4 billion unsecured subordinated
callable note programme on 29 February 2016. The group
successfully issued R1 billion of subordinated debt under this
programme in April 2016 with the purpose of investing the proceeds
in an interest-bearing investment portfolio in order to enhance the
group’s regulatory position and to achieve economic benefits.
DISCRETIONARY CAPITAL AND SOLVENCY LEVELSantam’s board of directors targets an economic capital coverage
ratio of between 130% and 170%. In addition, the regulatory capital
coverage ratio must exceed predefined threshold levels.
The group economic capital requirement at 31 December 2016 based
on the internal model amounted to R5.8 billion or an economic
capital coverage ratio of 155%. Excess capital is maintained for the
following reasons:
− to make an allowance for model risk based on the complexity
of the underlying business;
− to maintain a margin over the current regulatory capital
requirements;
− to maintain Santam’s insurer financial strength credit
ratings; and
− to fund business growth and allow for any corporate actions.
In 2016, a review of optimal capital levels and the targeted solvency
range was performed. This review took into account the current and
future regulatory solvency requirements, the impact of the delayed
implementation of SAM as well as the structural change to the
statement of financial position following strategic investments made
and further potential acquisitions. Following this review, the board
of directors decided to reduce the Santam group’s capital level by
R880 million through the payment of an R8 per share special
dividend in September 2016.
We remain committed to efficient capital management.
REGULATORY SOLVENCY AND CAPITALREQUIREMENTSOne of the most important regulatory developments is the SAM that
the FSB is in the process of developing for the South African long-
term and general insurance industries to be in line with international
standards. SAM will adopt the principles of the Solvency II, adapted to
South African circumstances specifically, where necessary. The target
date for implementation of the final requirements under the new
regime, including the internal model approach for general insurers,
is expected to be early 2018.
As previously reported, Santam operates an internal capital model
in line with best practice to assist management with capital
management, risk quantification and decision-making.
Santam is in the process of applying to the FSB to use this internal
model for determining its capital requirements once SAM is enacted.
DIVIDENDSThe company paid an interim dividend of 311 cents per share, which
was 8% higher than the 288 cents per share in 2015. Santam declared
a final dividend of 570 cents per share for 2016 (2015: 528 cents per
share), resulting in a total dividend of 881 cents per share for the year
(2015: 816 cents per share). This represents an increase of 8%.
A special dividend of 800 cents per share was furthermore declared
in 2016 (2015: zero)
Santam’s dividend policy aims for stable dividend growth in line
with the company’s long-term sustainable business growth. When
special dividends are being considered, we take into account capital
levels, regulatory capital requirements and potential investment
opportunities.

SA
NT
AM
INT
EG
RA
TE
D R
EP
OR
T 2
016
65
CH
IEF
FIN
AN
CIA
L O
FF
ICE
R’S
RE
PO
RT
OTHER CORPORATE ACTIONSDuring February 2016, Santam acquired a 49% stake in PST for
R55 million. PST is an independent short-term insurer focusing on
providing short-term insurance solutions exclusively to Graduate
Professionals including the PPS Group’s client base of more than
200 000 professionals. A pro rata recapitalisation in line with the
business plan took place during the last quarter of 2016, in terms
of which Santam injected a further R10 million into PST.
In August 2016, Santam announced the acquisition of RMB-SI
Investments (Pty) Ltd (RMB-SI). The transaction, which is still
subject to the fulfilment of certain conditions precedent, will entail
Santam acquiring 100% of RMB-SI’s specialist insurance structuring
business. RMB-SI offers insurance structuring solutions across
jurisdictions including local and offshore insurance licences in
Mauritius and Ireland.
In November 2016, Santam purchased the Absa Intermediated
Commercial Lines Business from Absa Insurance Company Ltd
for R13.2 million in cash, including contingent payments estimated
at R28 million.
Full details of the company’s holdings in subsidiaries, associated
companies and joint ventures are contained in notes 10.1 and 12.1 to
the annual financial statements.
Hennie NelChief financial officer

Specialist insurance offers unparalleled technical expertise across a vast variety of industries, from engineering and corporate property to travel and tourism. That is because we understand that some businesses require insurance solutions with the highest level of expertise.
IT TAKES A SPECIALIST TO COVER ONE.


68
CORPORATE GOVERNANCE REPORT
Standing (from left): Bruce Campbell (66), Machiel Reyneke (59), Heinie Werth (53),Hennie Nel (48), Tantaswa Nyoka (née Fubu) (45), Grant Gelink (67)Seated (from left): Dawn Marole (56), Themba Gamedze (58), Lizé Lambrechts (53), Ian Kirk (59)Absent: Monwabisi Fandeso (58), Yegs Ramiah (49)
BOARD OF DIRECTORSAS AT 31 DECEMBER 2016

69

SA
NT
AM
INT
EG
RA
TE
D R
EP
OR
T 2
016
70
CO
RP
OR
AT
E G
OV
ER
NA
NC
E R
EP
OR
T
BOARD PROFILESAT 1 MARCH 2017
GG GELINK (67)Independent non-executive chairman
CA(SA), HED, BAcc (Hons)
Appointed 1 June 2012
Director of FirstRand Ltd, Grindrod Ltd, Allied Electronics
Corporation Ltd (Altron) and MTN Zakhele. Chief executive officer
of Deloitte Southern Africa from 2006 to 2012.
B CAMPBELL (66)Independent non-executive director
BA, MBL, ACII & FCII (UK)
Appointed 4 October 2010
Previous managing director of Mutual & Federal Insurance Holdings
Ltd and previous group chief executive officer of Alexander Forbes.
MP FANDESO (58)Independent non-executive director
BSc (Hons), MBA
Appointed 10 October 2011
Director of South African Breweries (Pty) Ltd and SABSA
Holdings Ltd. Previous chief executive officer of the Land
and Agricultural Development Bank of South Africa.
T NYOKA (NÉE FUBU) (45)Independent non-executive director
BAdmin (Hons), HDip in Banking Law, CA(SA)
Appointed 1 January 2015
Director of Grindrod Ltd, Grindrod Bank Ltd, Public Investment
Corporation Ltd and former executive partner at KPMG.
BTPKM GAMEDZE (58)Non-executive director
BA (Hons), MSc, FASSA
Appointed 16 October 2006
Director of Sanlam Emerging Markets (Pty) Ltd and Sanlam
Investment Management (Pty) Ltd. Immediate past president
of the Actuarial Society of South Africa and trustee of the
Government Employees Pension Fund.
IM KIRK (59)Non-executive director
FCA (Ireland), CA(SA), HDip BDP (Wits)
Appointed 14 June 2007
Chief executive officer of Sanlam Ltd and Sanlam Life Insurance Ltd.
Previous chief executive officer of Santam Ltd from 2007 to 2014.
Director of Channel Life Ltd, Genbel Securities Ltd, Sanlam Capital
Markets Ltd, Sanlam Developing Markets Ltd, Sanlam Emerging
Markets (Pty) Ltd, Sanlam Investment Holdings Ltd, Sanlam UK Ltd,
Shriram Capital, Sanlam Netherlands Holding BV and WWF South
Africa. Chairman of Association of Savings and Investment
South Africa and Vumelana Advisory Fund NPC.
L LAMBRECHTS (53)Chief executive officer
BSc (Hons), FIA (1992), EDP (Manchester)
Appointed 1 January 2015
Director of Stalker Hutchison Admiral (Pty) Ltd, Centriq group
of companies, MiWay group of companies, Emerald Risk Transfer
(Pty) Ltd and chairperson of SAIA. Non-executive director of
Saham Finances SA.
MLD MAROLE (56)Independent non-executive director
BComm, Dip Tertiary Education, MBA
Appointed 13 December 2011
Director of MTN Group Ltd, Mobile Telephone Networks Holdings
(Pty) Ltd, MTN International (Pty) Ltd, South African Post Office
SOC Ltd, Richards Bay Minerals (Pty) Ltd and Development Bank
of Southern Africa.

SA
NT
AM
INT
EG
RA
TE
D R
EP
OR
T 2
016
71
CO
RP
OR
AT
E G
OV
ER
NA
NC
E R
EP
OR
T
NV MTETWA (37)Independent non-executive director
CA(SA)
Appointed 8 February 2017
Previous managing executive of finance at Vodacom
South Africa. Served as managing committee member and partner
at PricewaterhouseCoopers. Independent non-executive director
and audit committee chair of the Development Bank of
Southern Africa. Independent non-executive director
of Aviation Co-ordination Services (Pty) Ltd.
HD NEL (48)Chief financial officer, executive director
CA(SA)
Appointed 17 September 2012
Director of Centriq group of companies, Emerald Risk
Transfer (Pty) Ltd, MiWay group of companies, Stalker Hutchison
Admiral (Pty) Ltd, Central Plaza Investments 112 (Pty) Ltd,
Swanvest 120 (Pty) Ltd, Brolink (Pty) Ltd, Sanlam Emerging Markets
(Pty) Ltd, Mirabilis Engineering Underwriting Managers (Pty) Ltd,
First Bank Nigeria Insurance Ltd, Guardian National Insurance
Company Ltd and Indwe Broker Holdings Ltd.
Y RAMIAH (49)Non-executive director
BA LLB, MBA, AMP (Harvard), HDip Tax (Admitted Attorney)
Appointed 13 December 2011
Director of Sanlam Ltd, Sanlam Life Insurance Ltd, Sanlam
Investment Management (Pty) Ltd, Sanlam Investment Holdings Ltd
and Adopt a School Foundation.
MJ REYNEKE (59)Independent non-executive director
CA(SA)
Appointed 26 August 2003
Director of African Rainbow Capital (Pty) Ltd, Indwe Broker
Holdings (Pty) Ltd, Central Plaza Investments 112 (Pty) Ltd,
Santam International Ltd, Uyanda STI Careers (Pty) Ltd,
Indwe Risk Services (Pty) Ltd
PE SPECKMANN (60)Independent non-executive director
CA(SA)
Appointed 8 February 2017
Previous Group Financial Director of MMI Holdings group. Former
roles include senior finance positions at Old Mutual, Pepkor Group
and Seagram SA and audit partner at PricewaterhouseCoopers.
HC WERTH (53)Non-executive director
CA(SA), MBA, EDP (Manchester)
Appointed 13 September 2016
Director of Sanlam Ltd and Sanlam Life Insurance Ltd, Sanlam
Emerging Markets (Pty) Ltd, Genbel Securities Ltd, Sanlam Capital
Markets Ltd and Sanlam Investment Holdings Ltd. Former
chief executive officer of Sanlam Emerging Markets (Pty) Ltd
from 2005 to 2016.
M ALLIE (41)Company secretary
BA, LLB
Appointed as company secretary on 1 February 2011
Admitted attorney with experience in corporate and commercial law,
litigation and corporate governance. Former roles include company
secretary of Oceana Group Ltd and Group Legal and Regulatory
Affairs Manager of Parmalat SA (Pty) Ltd.
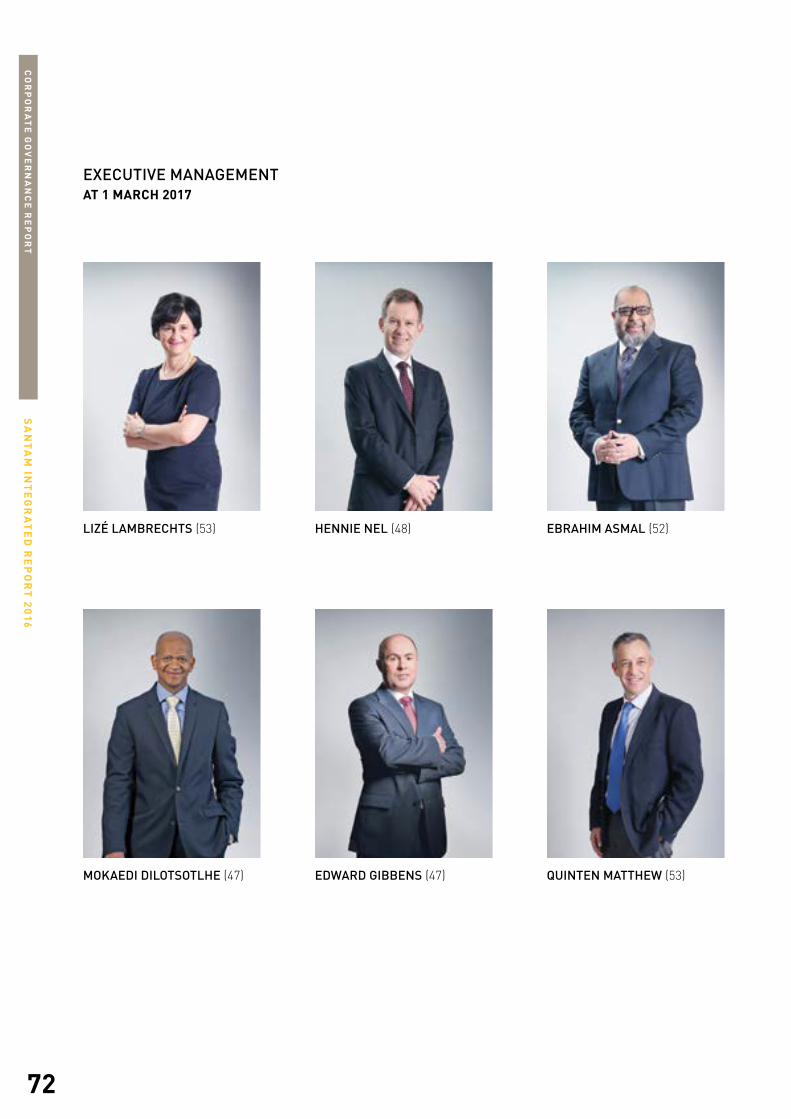
SA
NT
AM
INT
EG
RA
TE
D R
EP
OR
T 2
016
72
CO
RP
OR
AT
E G
OV
ER
NA
NC
E R
EP
OR
T
EXECUTIVE MANAGEMENTAT 1 MARCH 2017
EDWARD GIBBENS (47) QUINTEN MATTHEW (53)
LIZÉ LAMBRECHTS (53)
MOKAEDI DILOTSOTLHE (47)
HENNIE NEL (48) EBRAHIM ASMAL (52)

SA
NT
AM
INT
EG
RA
TE
D R
EP
OR
T 2
016
73
CO
RP
OR
AT
E G
OV
ER
NA
NC
E R
EP
OR
T
JOHN MELVILLE (51)
KEVIN WRIGHT (51)RENÉ OTTO (58)
JEANETT MODISE (53) TEMBA MVUSI (61)
SA
NT
AM
INT
EG
RA
TE
D R
EP
OR
T 2
016
74
CO
RP
OR
AT
E G
OV
ER
NA
NC
E R
EP
OR
T
LIZÉ LAMBRECHTS (53)Chief executive officer
BSc (Hons), FIA (1992), EDP (Manchester)
Appointed January 2015
Responsible for executing strategic plans and policies approved by
the board of directors; provides leadership and direction in realising
the company’s philosophy and achieving its mission, strategy, annual
goals and objectives; and ensures the group meets or exceeds its
targets, thereby growing profitability and sustainability over the
medium to long term.
HENNIE NEL (48)Chief financial officer
CA(SA)
Appointed 2012
Responsible for financial reporting, corporate finance, investments
(including SEM partnership investments), internal audit, enterprise
risk management and corporate legal services.
EBRAHIM ASMAL (52)Claims and group sourcing
Appointed 2009 (appointed to executive management in 2012)
Responsible for the management of the claims value chain, including
assessments services and quality assurance. Also responsible for
group sourcing and facilities, leveraging the group’s procurement
spending power to manage efficiency in the supply chain and drive
opportunities related to new initiatives.
MOKAEDI DILOTSOTLHE (47)Brand and marketing
BComm (Hons), MBA
Appointed 2016
Responsible for the management of the Santam Brand, corporate
communication, developing and implementing strategic brand
initiatives relating to change in distribution channels and ensuring
that the Santam brand is well positioned across all of the target
market segments.
EDWARD GIBBENS (47)Santam Commercial and Personal
AIISA, BComm, MBA, AMP (Insead)
Appointed 1992 (appointed to executive management in 2005)
Responsible for growing gross premium income and underwriting
profit through the company’s commercial and personal lines
distribution channels under the Santam brand; manages the efforts
of business partners and distribution employees, analyses the
competitive environment and develops future strategies to strengthen
the company’s competitive position.
QUINTEN MATTHEW (53)Santam Specialist
FIISA
Appointed 2003 (appointed to executive management in 2010)
Responsible for developing and expanding the underwriting manager
model, niche segments, affinity markets and specialist insurance
(including Centriq); provides strategic input to each business;
promotes growth and profit objectives; focuses on growing individual
businesses by advancing entrepreneurship and specialist skills
through partnerships, building on the synergy and support of Santam;
and expands SEM partner business specialist capabilities.
EXECUTIVE PROFILESAT 1 MARCH 2017

SA
NT
AM
INT
EG
RA
TE
D R
EP
OR
T 2
016
75
CO
RP
OR
AT
E G
OV
ER
NA
NC
E R
EP
OR
T
JOHN MELVILLE (51)Risk services
BBusSc (Hons), FIA, FASSA, MCR (IMD)
Appointed 2010
Responsible for the underwriting function (including strategy and
pricing); product solutions; actuarial services (including rating, capital
modelling and solvency management); developing and implementing
reinsurance strategy; and developing Santam re into a growth and
profit contributor for the group. Oversees the development and
maintenance of systems and processes to support the operation of
these functions and technical support to SEM partner businesses.
JEANETT MODISE (53)People and transformation
BComm, MDP, MBL, SEP (Harvard), AMP (Insead)
Appointed 2014 (appointed to executive management in 2015)
Responsible for human resources and transformation; leads
and manages people strategy in line with best practice to enable
successful execution of the Santam business objectives through
engaged and competent people in an enabling work environment.
TEMBA MVUSI (61)Market development – CSI
BA, ELP (Wharton School of Business), MAP (Wits), PDP (UCT)
Appointed 2008
Responsible for strategic stakeholder relations; provides strategic
input into developing and growing the company in new markets and
explores new intermediary opportunities in unserviced markets;
drives group-wide transformation to ensure company sustainability,
setting targets and ensuring the company meets its BBBEE
responsibilities; and corporate social investment.
RENÉ OTTO (58)Chief executive officer of MiWay
BLC LLB, LLM, Admitted Advocate of the Supreme Court
Appointed 2007 (appointed to executive management in 2012)
Responsible for executing strategic plans and financial performance
of MiWay as founding head and current chief executive officer.
KEVIN WRIGHT (51)Operations and IT
BComm, Fellow of the South African Institute of Chartered
Secretaries and Administrators, FCIS
Appointed 2014
Responsible for client services, ensuring efficient policy
administration, operation of sales and administration contact
centres. Also responsible for information technology and business
change to bolster the business strategy by leveraging information
and technology; overseeing the building of systems capabilities to
enhance Santam’s agility and operational effectiveness.

SA
NT
AM
INT
EG
RA
TE
D R
EP
OR
T 2
016
76
CO
RP
OR
AT
E G
OV
ER
NA
NC
E R
EP
OR
T
The recently launched King IV Report on Corporate Governance™
for South Africa, 2016 (King IV™) highlights the changed world of
business in terms of financial instability, technological disruptions,
stakeholder activism and climate risk.
As we reflect on our role and responsibilities as board members,
we consider lessons learnt in the past, and we look towards future
opportunities and challenges. Santam is a leader in South Africa’s
insurance industry, and is expanding its footprint in Africa, India and
Southeast Asia. Therefore, we are in a position to influence ethical
and governance practices broadly and directly, in a way that will
create value sustainably.
We remain committed to good governance practices, which includes
effective leadership, clarity of roles and independent judgement.
As chairman of the nominations committee, I am involved in the
evaluation of each board member, the board as a whole and every
committee. This ensures that we improve continuously and ensure
the board composition is appropriate for the nature, complexity and
insight of decision-making that is required.
CHANGES TO THE BOARD − 2 March 2016: Yegs Ramiah’s designation changed from
executive to non-executive director
− 30 May 2016: Clement Booth resigned as an independent
non-executive director
− 1 June 2016: Malcolm Dunn retired as an independent
non-executive director, having reached retirement age in terms
of the company’s memorandum of incorporation (MOI)
− 13 September 2016: Kobus Möller resigned as a non-executive
director upon retiring from his executive role at Sanlam Ltd and
was replaced by Heinie Werth, his successor at Sanlam Ltd, as
a non-executive director
– 8 February 2017: Gugu Mtetwa and Preston Speckmann joined
the board as independent non-executive directors
We would like to extend our heartfelt appreciation to Clement Booth,
Malcolm Dunn and Kobus Möller, who served on the board for one,
six and 10 years respectively. Their contributions and commitment
were valued by all.
A GOVERNANCE LANDSCAPE SHAPED BY REGULATORY CHANGESThe global and local markets for general insurance continue to face
increasing regulatory requirements. These are a priority for the
board and its committees, as we acknowledge the importance of
compliance with all regulatory frameworks affecting operations,
and our accountability to all stakeholders.
The compliance resources across the group were reviewed,
taking into account the growing scale of the group, the nature and
complexity of the licensed entities’ businesses within the group,
and the additional expansion of the compliance obligations under
the newly proposed twin peaks model of supervision. This resulted
in additional capacity being created.
Although Santam welcomed government’s adoption of the twin peaks
regulatory supervision approach, the ensuing period of uncertainty
regarding the implementation, enforcement and consistent
application of regulations remains. Santam ultimately believes that
the current suite of regulatory reforms is necessary and in the best
interest of policyholders, shareholders and the regulator. While
the effort of meeting these regulatory changes is high in terms of
financial costs and human resources, the group has managed the
process to date in an appropriate and effective manner.
Legislation that is in process and will potentially affect
Santam includes:
− Amendments to the FAIS fit and proper requirements
− Financial Intelligence Centre Act (FICA), 38 of 2001: Schedule 1
− Twin Peaks Financial Sector Regulation Bill
− Reinsurance Regulatory Review Position Paper
− Insurance Bill 2015
− Draft Market Conduct Policy Framework for South Africa
− Retail Distribution Review (RDR)
− Proposed amendment to the binder regulations under the
Short-term Insurance Act, 53 of 1998, and Long-term Insurance
Act, 52 of 1998
− Protection of Personal Information (POPI) Act, 4 of 2013
In 2017, the board will continue to ensure that there is holistic
oversight of risks facing the group, that the strategy remains
appropriate and that we attract, upskill and reward the right people
to sustain business growth. We are also cognisant of South Africa’s
unique challenges, and recognise that Santam has a responsibility in
supporting its stakeholders towards a healthy, prosperous, safe and
empowered society.
Grant GelinkChairman
MESSAGE FROM THE CHAIRMAN

SA
NT
AM
INT
EG
RA
TE
D R
EP
OR
T 2
016
77
CO
RP
OR
AT
E G
OV
ER
NA
NC
E R
EP
OR
T
GOVERNANCE STATEMENT OF COMMITMENTSantam’s board of directors aims to achieve high standards of
effective corporate governance, integrity and ethics. The board
is assisted by senior management in ensuring that the business
complies with the regulatory landscape to ensure the sustainability
of the business. Governance processes are reviewed on a regular
basis in order to reflect best practice.
The board endorses the principles contained in King III and applied
the principles contained in chapter 2 of King III during 2016. In
instances where the company has elected not to apply certain
recommendations, the rationale is explained in the relevant sections
of this report. The board has welcomed the shift in King IV™
towards integrated thinking.
FIND THE REGISTER DETAILING SANTAM’S APPLICATION OF ALL THE KING III PRINCIPLES ON THE WEBSITE.
In terms of King III, the integrated report should disclose the terms
of reference of all the board committees. Only a summary of these
terms of reference have been included in this report.
FIND THE COMPLETE TERMS OF REFERENCE OF ALL THE BOARD COMMITTEES ON THE WEBSITE.
The board is of the opinion that Santam applied the significant
governance principles in King III and complied with the JSE Listings
Requirements and Companies Act, 71 of 2008, as amended,
during 2016.
During the year, Santam further reviewed its governance processes
to enhance alignment with legislative and regulatory changes and
to reflect best industry practice. The board gender diversity policy
was approved by the board, in accordance with the JSE Listings
Requirements. The board and board committee charters were all
also subjected to annual reviews as recommended by King III.
Santam’s commitment to good governance is formalised in its
charters, policies and operating procedures. Governance processes
are regularly reviewed to take the evolving regulatory environment
and best practice into account. The board’s committees all fulfil key
roles to ensure good corporate governance is applied at Santam.
Santam is responsible for conducting its affairs with prudence and
safeguarding the interests of all its stakeholders.
The board is, inter alia, accountable for:
− approving strategic plans, monitoring operational performance,
ensuring effective risk management and internal controls, and
monitoring legislative, regulatory and governance requirements;
− allocating major roles and responsibilities according to the
company’s delegation of authority framework;
− ensuring there are clear and formal procedures in key areas
so that regulators and auditors can readily review decisions and
actions, both internally and externally; and
− conducting business in accordance with the company’s
code of ethics.
Santam’s response to increasing levels of economic crime is
entrenched in its enterprise risk management (ERM) and is based on
King III requirements and codified in its business ethics and economic
crime (BEEC) policy. The group has expanded its efforts to curb the
problem by engaging with stakeholders and creating appropriate
structures and forums to help govern the management of ethics
and fraud.
Santam’s code of ethics prescribes that all employees must comply
strictly with all relevant legal requirements and regulations that apply
to their area of work. The code of ethics also regulates conflict of
interest and key ethical risks in the company.
FIND SANTAM’S POLICY ON BUSINESS ETHICS ON THE WEBSITE.
Santam advocates zero tolerance towards fraud and corruption.
Employees are kept apprised of the latest trends in fraud and crime,
locally and internationally, through its Integrity publication.
READ MORE ABOUT SANTAM’S FRAUD REPORTING DETAILS UNDER THE ADMINISTRATION SECTION ON PAGE 134.
CORPORATE GOVERNANCE REPORT

SA
NT
AM
INT
EG
RA
TE
D R
EP
OR
T 2
016
78
CO
RP
OR
AT
E G
OV
ER
NA
NC
E R
EP
OR
T
DISPUTE RESOLUTIONAt this stage, the board does not intend to institute a formal dispute
resolution process as recommended by King III. The existing
processes operate satisfactorily and do not require a more formal
mechanism. In the event that disputes with shareholders should
arise, shareholders have remedies in terms of the Companies Act
at their disposal.
BOARD AND COMMITTEESThe board is responsible for directing, administering and controlling
the affairs of the company in a transparent, fair and responsible
manner. The board recognises its responsibility to shareholders,
employees and the community to uphold high standards in managing
economic, social, environmental and ethical matters and ensuring the
company conducts its activities according to best practice.
The board has delegated specific functions to committees to assist
it in meeting its oversight responsibilities. This ensures that the
activities of the company are managed in a manner that is consistent
with the ethical leadership and values of Santam. The roles and
responsibilities of each board committee are set out in terms of
references that are reviewed annually by the board. The directors
confirm that the committees have functioned in accordance with
these terms of reference during the year.
All committees are chaired by independent non-executive directors,
except for the human resources and remuneration committee,
which is chaired by a non-executive director who is not independent,
Ian Kirk. Although he is not independent, the board is supportive
of his chairmanship of this committee given his knowledge of the
business, his commercial experience and the necessity to align the
company’s remuneration approach with the corporate strategy.
There are well-entrenched governance structures within Santam that
ensure proper assurance is given to materially significant strategic
and operational matters.
Directors have unrestricted access to all company information, and
access to the advice and services of the group company secretary.
Directors are entitled to seek independent professional advice, at
the company’s expense (after consultation with the chairman of the
board), as and when required, in fulfilling their duties. No directors
exercised this right during the period under review.
As at 31 December 2016, the board comprised 12 directors, of whom
two are executive directors. Of the 10 non-executive directors,
six are independent. On 8 February 2017, Gugu Mtetwa and
Preston Speckmann, both independent directors, were appointed
to the board. There is a formal, transparent board nomination
process in terms of a policy detailing procedures for appointment
to the board. This policy is reviewed annually. Appointments to the
board are formal and transparent and are a matter for the board
of directors as a whole, assisted by the nominations committee, as
required by section 3.84 of the JSE Listings Requirements. Directors
are appointed, subject to re-election by the shareholders at the
company’s annual general meeting (AGM) and to the Companies Act
provisions relating to their removal. The board charter depicts a clear
division of responsibilities and authority at board level to ensure that
no individual director has unfettered powers of decision-making or
influence over the board.
The chairman, who is an independent non-executive director, is
principally responsible for the effective operation of the board. There
is a clear division of authority between the various roles within the
company’s corporate governance structure. The responsibilities of the
chairman and chief executive officer have been clearly defined and
are separate.
The non-executive directors on the Santam board can all influence
decision-making. The non-executive directors bring a diverse range
of skills and experience to the board and have the integrity, skills
and experience to provide insight and to add value to board meetings.
READ MORE ABOUT BOARD MEMBERS IN THE PROFILES FROM PAGE 70.
SANTAM BOARD COMMITTEES
INVESTMENTCOMMITTEE
HUMANRESOURCES ANDREMUNERATIONCOMMITTEE
AUDITCOMMITTEE
NOMINATIONSCOMMITTEE
SOCIAL, ETHICS ANDSUSTAINABILITYCOMMITTEE
RISKCOMMITTEE

SA
NT
AM
INT
EG
RA
TE
D R
EP
OR
T 2
016
79
CO
RP
OR
AT
E G
OV
ER
NA
NC
E R
EP
OR
T
C O R P O R AT E G O V E R N A N C E R E P O R T
It is their responsibility to ensure their judgement is exercised
freely and independently. In the board’s opinion, there is no business
or other relationship within the current structure that could
materially interfere with the impartial judgement of any of the
non-executive directors.
When appointing directors, the board takes cognisance of its needs in
terms of different skills, experience, diversity, size and demographics.
The effectiveness of the board composition and the performance of all
its directors are assessed annually.
BOARD CHARTERThe board’s responsibility to ensure best practice in company conduct
is entrenched in the board charter, which is reviewed annually to
ensure alignment with the principles of good governance. The charter
delineates the powers of the board, which ensures an appropriate
balance of power and authority.
The board charter sets out, inter alia, the composition, meeting
frequency and the specific responsibilities to be discharged by
the board as a whole and by the directors, executives and officers
individually. These responsibilities are determined in terms of:
− the company’s MOI;
− the Companies Act, 71 of 2008, as amended;
− the JSE Listings Requirements;
− King III Report on Corporate Governance for
South Africa, 2009; and
− the Short-term Insurance Act, 53 of 1998.
These documents are a reference point for directors, executives and
officers on how to conduct their affairs and dealings with respect to,
and on behalf of, the company.
DIRECTORS
2 EXECUTIVE
8 MALE
3 BLACK MALE
3 BLACK FEMALE
1 WHITE FEMALE
4 FEMALE
4 NON-EXECUTIVE
6INDEPENDENT NON-EXECUTIVE
5 WHITE MALE
The board charter prescribes that directors should conduct
themselves in the best interest of the company and take special care
to ensure that there is no conflict between their own interest and the
company’s interest. All board members are required to declare any
potential conflict of interest between their obligations to the company
and their personal interests. In the event that a potential conflict
of interest arises, an affected director is required to recuse him or
herself accordingly from the part of the meeting where the matter
in which he/she has an interest is discussed.
Through its charter, the board has reserved matters specifically
for its attention to ensure it exercises full control over significant
matters, including strategy, finance and compliance. The board
is regularly advised and updated on the activities of the company.
An ongoing director development programme focuses on existing
board members and aims to create an evolving understanding of the
business, governance and the compliance environment in which it
operates. The director development programme includes regular
training updates and information sessions. New directors complete
a formal induction programme and receive appropriate training,
reading material and guidance on their duties, responsibilities,
Santam’s business environment and sustainability issues relevant
to the business. The induction programmes are tailored to the needs
of individual appointees.
FIND A COPY OF THE BOARD CHARTER ON THE COMPANY’S WEBSITE.
THE SANTAM BOARD AT 31 DECEMBER 2016
Name ExecutiveNon-
executiveIndependent
non-executiveB Campbell *
MP Fandeso *
BTPKM Gamedze *
GG Gelink (chairman) *
IM Kirk *
L Lambrechts *
MLD Marole *
HD Nel *
T Nyoka (née Fubu) *
Y Ramiah *
MJ Reyneke *
HC Werth *
READ MORE ABOUT BOARD MEMBERS IN THE PROFILES FROM PAGE 70.
SA
NT
AM
INT
EG
RA
TE
D R
EP
OR
T 2
016
80
CO
RP
OR
AT
E G
OV
ER
NA
NC
E R
EP
OR
T
SALIENT FEATURES OF THE BOARD CHARTERThe board’s key purpose is to ensure the company’s prosperity by
collectively directing its affairs, while acting in the best interests
of its stakeholders.
The MOI sets out the powers of the board of directors, while the
Companies Act and the delegation of authority document govern
the exercise of these powers.
The matters reserved for the board include:
− Approval of:
• the company’s vision and values;
• the company’s strategic objectives, business plans, annual
budget, dividend policy and the monitoring of the company’s
performance against set objectives;
• all dividends;
• the integrated report and annual financial statements;
• circulars to shareowners, including notices of
shareholder meetings;
• financial risk management and capital policies, including
funding and the issue of ordinary shares and loan capital;
• capital expenditure, acquisitions, joint ventures and disposals
in excess of the limits set out in the delegation of authority
document and the MOI; and
• significant changes in accounting policy.
− Recommending changes to the MOI of the company,
remuneration of directors, and remuneration policy to
shareholders for approval
− Composition of the board committees, electing a chairman of the
board, approval of the appointment of the chief executive officer,
executive directors and the company secretary
− Monitoring of and reporting on sustainability management
− Ultimate responsibility for IT governance
− Commencing business rescue proceedings as soon as the
company is financially distressed
During 2016, the board approved the strategy and budget for 2017.
Material issues relating to the execution of strategy were considered.
The board approved the interim and year-end financial results and
the 2016 integrated report. The board also approved the appointment
of the new directors. The board is satisfied that it has discharged its
duties and obligations as contained in its charter.
RESPONSIBILITY AND ACCOUNTABILITYDELEGATION OF AUTHORITYThe company’s delegation of authority provides an approval
framework to ensure the company is optimally managed within
a decentralised management environment. The board delegates
the power to run the day-to-day affairs of the company to the chief
executive officer, who may delegate some of these powers. The
delegation of authority document codifies and regulates any such
delegation of authority within the company. The board reviews its
delegated authorities annually. There are a number of governance
policies which complement the delegation of authority, and are
reviewed on a regular basis by the board.
CHAIRMANThe chairman provides overall objective leadership of the board
of directors. The chairman’s primary function is to preside over
meetings of directors and shareholders, and to ensure the smooth
functioning of the board and that it receives timely and accurate
information for the directors to perform effectively.
CHIEF EXECUTIVE OFFICERThe chief executive officer reports to the board and is responsible for
managing the execution of the strategic direction of the company as
approved by the board. Board authority conferred on management
is delegated through the chief executive officer in terms of approved
authority levels.
EXECUTIVE AND NON-EXECUTIVE DIRECTORSThe directors have a fiduciary duty to exercise due care and skill
in carrying out their mandate as directors of the company. In doing
so, the directors will ensure that they act in the best interest of the
company at all times, and do not derive any profit as a result of their
fiduciary relationship with the company.
BOARD COMMITTEESThe committees assist the board in discharging its duties and
responsibilities. Ultimate responsibility rests with the board and the
board does not abdicate its responsibility to the committees. The
committees report to the board quarterly as to how they have carried
out their responsibilities and the minutes of the committee meetings
are provided to all board members. Notwithstanding the delegation
of functions to the committees, the board remains ultimately
accountable for the proper fulfilment of such functions, except
for the statutory functions of the audit committee relating to the
appointment, fees and terms of engagement of the external auditor.
COMPANY SECRETARYThe company secretary provides guidance to the board collectively
and to individual directors on how to discharge their responsibilities
properly in terms of applicable legislation and regulations, and in the
best interests of the company. The directors have unlimited access
to the advice and services of the company secretary. The company
secretary plays a pivotal role in the company’s corporate governance
and ensures that, in accordance with the pertinent regulations,
the proceedings and affairs of the board, the company itself and,
where appropriate, shareholders, are administrated properly. The
company secretary monitors directors’ dealings in securities to
ensure adherence to the directors’ dealings in securities policy. The
company secretary attends all board and committee meetings and is
responsible for director training and induction, as well as the annual
board evaluation process. The company secretary is not a director of
the company.
SA
NT
AM
INT
EG
RA
TE
D R
EP
OR
T 2
016
81
CO
RP
OR
AT
E G
OV
ER
NA
NC
E R
EP
OR
T
C O R P O R AT E G O V E R N A N C E R E P O R T
In terms of the JSE Listings Requirements, the board is required
to consider and satisfy itself, on an annual basis, of the competence,
qualifications and experience of the company secretary. The board
conducted a formal evaluation of the company secretary during
the year and is satisfied that he has the necessary competence,
qualifications and experience to carry out the required responsibilities
of a secretary of a public company. The board is further satisfied
that an arm’s-length relationship exists between the company
secretary and the board. The directors are satisfied that the company
secretary provides a central source of guidance and advice to the
board and within the company on matters of good governance.
The company secretary also acts as secretary for the committees
of the board.
READ MORE ABOUT THE COMPANY SECRETARY’S QUALIFICATIONS ON PAGE 71.
BOARD COMPOSITION AND MIX The efficacy of the board depends on its composition. There is an
appropriate balance of skills, power and authority on the board. The
independent non-executive directors have a standing closed-session
agenda item at every board meeting to deliberate on any issues that
they may want to discuss with the chairman or the chief executive
officer and/or any other directors.
Ongoing director development includes regular updates and
information sessions on legislature and regulatory change.
BOARD EVALUATIONThe board reviews the range of skills, experience and effectiveness
of its directors annually. This is done using a formal evaluation
process developed according to the recommendations of King III.
The nominations committee considers the results of the evaluation
and makes recommendations to the board as appropriate.
The evaluation for 2016 included an effectiveness assessment of the
board itself collectively, and an appraisal of the board committees and
the chairman. The evaluation was conducted by an external service
provider. The evaluation found no significant matters or material
concerns in respect of the board and board committee performance.
The results indicated that the board was functioning effectively and
that the core board processes were working well and that the board
was well balanced. Specific training needs for individual directors
were identified. The directors believe that board meetings were well
organised and efficiently run and that all relevant aspects of the
company’s business were dealt with by the board and its committees.
The nominations committee conducted a review on the individual
directors during February 2017. The results of the evaluation were
shared and discussed with the board. The board is satisfied with
the performance of its members. The performance of all directors
standing for election at the AGM in June 2017 has been considered
by the board, and their re-election is supported.
DEALING IN SECURITIESIn accordance with the JSE Listings Requirements, Santam
has adopted a policy that sets out the procedure directors have
to follow before they, or any of their associates, deal in the
company’s securities.
Directors and the company secretary must obtain prior written
authorisation from the chairman to deal in company securities. The
company secretary retains a record of all such share dealings and
approvals. Senior management and designated employees that are
exposed to unpublished, price-sensitive information in relation to
the company’s shares by virtue of their positions, are prohibited from
trading in Santam securities during the company’s closed periods
and require written approval from the CEO to deal in Santam shares
at all times.
SUSTAINABILITY MATTERSThe board recognises that there are qualitative issues that influence
the company’s ability to create value in the future. These relate to
investment in human and other intellectual capital, the extent of
the company’s social transformation, ethical, safety, health and
environmental policies and practices.
The social, ethics and sustainability committee convenes regularly
and reports directly to the board on, inter alia, the issues listed above.
LEGAL COMPLIANCESantam acknowledges the importance of compliance with the
regulatory framework affecting its operations, and its accountability
to all its stakeholders in this regard. The company has given
substantial focus to legislative compliance during the year.
Santam’s legal compliance philosophy encapsulates integrity, fair
dealing, accountability, objectivity, independence, good governance,
transparency and collaboration.
Due to the regulatory environment within which it operates,
Santam has a dedicated legal compliance function in place, which
is responsible for implementing the legal compliance framework.
The compliance function identifies legislation applicable to the
group, informs business of pertinent regulatory requirements (and
amendments thereto), analyses their impact on business operations,
facilitates the introduction of controls aimed at ensuring compliance
and monitors compliance. For increased efficiency and effectiveness,
the legal compliance function collaborates with other risk assurance
providers on certain matters, and works closely with other entities
within the group. In implementing the compliance framework,
a risk-based approach is adopted. In addition, Santam complies
with mandatory industry codes.
READ MORE ABOUT RISK MANAGEMENT IN THE REPORT ON PAGE 88.

SA
NT
AM
INT
EG
RA
TE
D R
EP
OR
T 2
016
82
CO
RP
OR
AT
E G
OV
ER
NA
NC
E R
EP
OR
T
Santam has a legal compliance framework that involves preparing
and maintaining inventories of material laws and regulations,
implementing policies based on these laws and establishing
procedures to supervise compliance and mitigate risks.
Given the resources that strict compliance with non-mandatory
industry codes would require, Santam adopts such codes,
to the extent that they enhance good governance, efficiency
and effectiveness.
BOARD AND COMMITTEE MEETINGSThe board met five times at scheduled meetings in 2016. One ad hoc
board meeting was also held during the year. The board meets at
least once every quarter and holds a strategy meeting annually in
August to approve the strategic direction of the company.
Details of attendance at board and committee meetings were
as follows:
BoardAudit
committeeRisk
committee
Human resources and remuneration
committeeNominations
committeeInvestment committee
Social, ethics and
sustainability committee
NUMBER OF MEETINGS HELD DURING 2016 6 4 4 4 4 4 3
CB Booth 1 (100%) – – – – – –
B Campbell 6 (100%) 4 (100%) 4 (100%) – – – 3 (100%)
MD Dunn 2 (100%) 2 (100%) 2 (100%) – – – –
MP Fandeso 0 (0%) 3 (75%) 3 (75%) – – – –
BTPKM Gamedze 6 (100%) – 4 (100%) – – – 2 (67%)
GG Gelink 6 (100%) 4 (100%) 4 (100%) 4 (100%) 4 (100%) 4 (100%) –
IM Kirk 6 (100%) – – 4 (100%) 4 (100%) – –
L Lambrechts 6 (100%) – 4 (100%) – – 4 (100%) –
MLD Marole 6 (100%) – – 4 (100%) 4 (100%) – 3 (100%)
JP Möller 4 (100%) – 3 (100%) – – 3 (100%) –
HD Nel 6 (100%) – 4 (100%) – – 4 (100%) –
T Nyoka (née Fubu) 6 (100%) 4 (100%) 4 (100%) – – – –
Y Ramiah 3 (50%) – – – – – 3 (100%)
MJ Reyneke 6 (100%) 2 (100%) 4 (100%) – – 4 (100%) –
HC Werth 1 (100%) – 1 (100%) – – 1 (100%) –
Key: – Not a member of the committee.Clement Booth retired as a director effective 30 May 2016.Machiel Reyneke was appointed as the chairperson of the audit committee and risk committee on 1 June 2016. Malcolm Dunn retired from the board on 1 June 2016.Kobus Möller retired from the board on 13 September 2016.Heinie Werth was appointed as a director on 13 September 2016.

SA
NT
AM
INT
EG
RA
TE
D R
EP
OR
T 2
016
83
CO
RP
OR
AT
E G
OV
ER
NA
NC
E R
EP
OR
T
C O R P O R AT E G O V E R N A N C E R E P O R T
APPOINTMENT AND RE-ELECTION OF DIRECTORSThe nominations committee ensures that the board’s composition
reflects demographic and gender diversity, and the appropriate mix
of skills and experience.
Based on the recommendation from the remuneration and
nominations committee, the board considers the nomination of
new directors for appointment – or re-appointment in the case of
existing directors – and makes recommendations to shareholders.
Directors do not have a fixed term of appointment. In accordance
with the company’s MOI, one-third of the non-executive directors
must retire at the AGM annually. Non-executive directors are subject
to retirement, by rotation, every three years. In line with company
policy, executive directors retire on the third anniversary of their
appointment or re-election to the board. Directors appointed by the
board after the AGM are required to retire at the following AGM and
stand for election by shareholders. Shareholders have the opportunity
to nominate a director and five other shareholders must second the
nomination. An abridged CV of the nominated director is sent with
the notice of AGM. Therefore, the company’s shareholders have the
opportunity to participate continually in the election and re-election
process of directors.
At the AGM, shareholders vote by a single resolution to determine
whether the director will be appointed. The appointment of
non-executive directors is formalised by a letter of appointment
between the company and the non-executive director.
BOARD COMMITTEESRISK COMMITTEEThe risk committee is chaired by Machiel Reyneke. The committee
assists the board in fulfilling its governance (from a risk and control
perspective), compliance and risk management responsibilities.
The committee is chaired by an independent non-executive director
and is responsible for ensuring that all significant risks are identified,
evaluated and effectively managed, and that there is adequate
oversight of Santam’s own risk and solvency assessment and internal
model processes. Compliance with relevant laws and regulations
is integral to Santam’s risk management process and is monitored
on a continuous basis. The committee operates in terms of a formal
charter approved by the Santam board.
The functions of the risk committee include assisting the board
in ensuring that:
− the company has implemented an effective policy and plan for
risk management that will enhance the company’s ability to
achieve its strategic objectives;
− the maturity and effectiveness of the risk management processes
and activities are continuously monitored, maintained and
improved as required;
− the overall risk profile, including significant risks Santam
faces, are monitored and reviewed and the response to address
these key risks is appropriately defined and resolved by
management; and
− the disclosure regarding risk is comprehensive, timely
and relevant.
The committee met four times during the year. Details of attendance
at meetings are provided on page 82. The risk committee is satisfied
that it has fulfilled its responsibility in terms of its charter. The
committee is satisfied with the adequacy of governance, compliance
and risk management structures and processes in place at Santam.
AUDIT COMMITTEEThe audit committee is chaired by Machiel Reyneke. The committee
is constituted as a statutory committee of Santam with respect to
its duties in terms of the Companies Act and a committee of the
Santam board with respect to all other duties assigned to it by the
board. During 2016, the committee consisted of five independent
non-executive directors. The committee ensures, inter alia, that the
company’s financial standing is sound and that the internal financial
controls and processes are effective. The committee reviews the
overall quality and integrity of financial reporting and integrated
and sustainability reporting disclosures.
The Santam audit committee also acts as the audit committee of the
MiWay group of companies and the Centriq group of companies.
The audit committee is appointed by shareholders at the AGM. Its
primary function, in addition to those required by the Companies
Act, is to help the board oversee financial matters. The committee
operates in terms of a formal charter and annual work plan approved
by the board. The audit committee is chaired by an independent
non-executive director. The independent chairman of the board,
Grant Gelink, is a member of the audit committee. Although this
is not in line with the recommendation contained in chapter 3
of King III, the board is supportive of his membership, given his
substantial experience in audit process, international financial
reporting standards and internal financial controls. Mr Gelink
does not chair the audit committee. The committee also consisted
of four other independent non-executive directors during 2016,
exceeding the minimum recommended number of members.

SA
NT
AM
INT
EG
RA
TE
D R
EP
OR
T 2
016
84
CO
RP
OR
AT
E G
OV
ER
NA
NC
E R
EP
OR
T
The functions of the audit committee include:
− Overseeing integrated reporting
− Reviewing and recommending for approval by the board the
annual financial statements, the interim reports, preliminary or
provisional result announcements, integrated report, any other
intended release of price-sensitive information and prospectuses,
trading statements and similar documents
− Reviewing and recommending the disclosure of sustainability
issues in the integrated report for approval by the board to ensure
that it is reliable, does not conflict with the financial information,
and provides a balanced view
− Recommending to the board whether or not to engage an
external assurance provider on material sustainability issues
− Reviewing accounting policies and practices and considering
any significant changes to or departure from accounting policies
and practices
− Reviewing the basis on which the company has been determined
a going concern
− Considering changes to the dividend policy and recommending
dividend declarations to the board
− Nominating the external auditor of the Santam group and its
subsidiaries (who, in the opinion of the committee, is independent
of the company) for appointment by the shareholders
− Approving the terms of engagement and remuneration for the
external audit and ensuring that the appointment of the auditor
complies with the provisions of the Companies Act and any other
legislation relating to the appointment of auditors
− Defining a policy for non-audit services to be rendered by the
external auditor to the company or a related company and
pre-approving the contracts for non-audit services to be rendered
by the external auditor
− Assisting the board in carrying out its IT responsibilities
During the year, the audit committee reviewed communication from
the external auditors and, after conducting its own review, confirmed
the independence of the auditors. The committee also considered and
determined the external auditors’ fees and terms of engagement.
As required by JSE Listings Requirement 3.84, the audit committee
considered the expertise and experience of the executive financial
director during November 2016. The committee is satisfied that
the appropriate level of expertise and experience to manage the
responsibilities of that position have been met, as required by the
JSE. The audit committee is also satisfied with the finance function’s
expertise and adequacy of resources.
The external and internal auditors attend committee meetings and
have unrestricted access to the committee and its chairman, ensuring
that their independence is in no way impaired. Both the external and
internal auditors have the opportunity to address the audit committee
at each meeting without the presence of management.
Audit committee members are encouraged to keep up to date with
developments that affect their required skill set. The audit committee
has considered factors and risks that may affect the integrity
of the Santam integrated report and has reviewed the disclosure
of sustainability issues in the report to ensure that it is reliable and
does not conflict with the financial information. The audit committee
has not recommended the engagement of an external assurance
provider on material sustainability issues to the board as it is of the
view that the assurance provided is adequate, given the maturity of
the processes in place.
The committee met four times during the financial year. Details
of attendance at meetings are provided on page 82. The audit
committee is satisfied that it has fulfilled its responsibility during
the year in terms of its charter. The committee believes that it
has complied with its legal and regulatory responsibilities for the
year. The committee reviewed the company’s integrated report and
recommended it to the board for approval.
HUMAN RESOURCES AND REMUNERATION COMMITTEEThe human resources and remuneration committee (HRRC) is chaired
by Ian Kirk. The committee comprises only non-executive directors.
The chief executive officer and certain members of management
attend committee meetings by invitation, but excuse themselves
at the appropriate times.
The HRRC is responsible for, inter alia, the development and
implementation of the group’s remuneration philosophy. The total
reward of executives is designed to ensure that a substantial
portion is dependent on performance – both company performance
and individual performance. The attainment of appropriate individual
and group targets governs the eligibility of executives for annual
performance bonuses and the vesting of their long-term
incentive awards.
The HRRC is responsible for and has the authority to consider and
make recommendations on the following, among others:
− Determining and approving the general remuneration policy
that must be tabled at each AGM for a non-binding advisory vote
by shareholders.
− Preparing an annual remuneration report for inclusion in the
company’s integrated report.
− Developing the remuneration strategy for executive directors and
members of the executive committee.
− Developing short-term incentive plans for board approval. It sets
annual targets, monitors progress towards targets and reviews
the incentive plans regularly to ensure that a strong link with
performance is maintained.

SA
NT
AM
INT
EG
RA
TE
D R
EP
OR
T 2
016
85
CO
RP
OR
AT
E G
OV
ER
NA
NC
E R
EP
OR
T
C O R P O R AT E G O V E R N A N C E R E P O R T
− Developing long-term incentive schemes for board approval.
It sets individual and group performance hurdles, as well as
guidelines for annual allocations. It performs regular reviews
of the structure of the schemes.
− Developing, monitoring and testing of appropriate performance
drivers for both short-term and long-term incentives.
− Managing the contracts of employment of executive directors
and executive committee members, ensuring that their terms
are compliant with good practice principles.
− Considering the individual remuneration packages for executive
directors and executive committee members, including incentive
schemes and increases to ensure they are appropriate.
− Considering the remuneration of non-executive directors of the
board and its committees. Proposals are made to the board for
final approval by shareholders at the annual general meeting.
− Succession planning.
− Human capital imperatives.
The HRRC met four times during the financial year. Details of
attendance at meetings are provided on page 82. The HRRC is
satisfied that it has fulfilled its responsibilities in accordance with
its terms of reference for the year. In accordance with King III
recommendations, the company’s remuneration policy is to be
tabled for shareholders to make a non-binding advisory vote at
the AGM in 2017.
This vote enables the shareholders to express their views on the
remuneration policies adopted and their implementation.
During 2016, the HRRC considered the following matters:
− Benchmarking of remuneration levels and practices with
local comparator groups for employees, executives as well
as non-executive directors.
− Monitoring of people-related metrics, such as head count,
employee turnover and transformation.
− Recruitment and appointment of executive employees.
− Contracted deliverables of the executive directors.
− Talent management strategy and succession planning.
− People-related risks identified and the measures taken
to mitigate them.
− Review of Santam’s STI plan.
− Monitoring of actions taken with regard to fit and
proper requirements.
− Monitoring and approval of STIs (performance bonuses) and LTIs.
− BBBEE transformation scorecard progress.
NOMINATIONS COMMITTEEThe nominations committee is chaired by Grant Gelink. The
committee considers board succession and recommends candidates
for board vacancies based on skill, experience and the need to ensure
diversity and balance in the composition of the board. The committee
comprises only non-executive directors and is chaired by the
chairman of the board. The chief executive officer attends committee
meetings by invitation. The committee met four times during the
financial year. Details of attendance at meetings are provided on
page 82. The committee has considered and applied the policy
on board gender diversity in the nomination of new directors to
the board. As part of the process of reviewing the composition of
the board, the committee considered the benefits of all aspects
of diversity, including gender diversity. The board’s aim is to ensure
that at least 33% of the board is made up of women by the end of
2016, and for that position to have exceeded 40% by the end of 2019.
As at 31 December 2016, four of the 12 directors were women.
The committee is satisfied that it has fulfilled its responsibilities in
accordance with its terms of reference for the period under review.
SOCIAL, ETHICS AND SUSTAINABILITY COMMITTEE REPORTThe group’s social, ethics and sustainability committee is chaired
by Dawn Marole. The committee is constituted in terms of the
Companies Act and has an independent role. The committee
assists the board in monitoring the group’s activities in terms of
legislation, regulation and codes of best practices relating to ethics,
empowerment and stakeholder engagement. The committee also
assists the board in ensuring that the sustainability strategy and
objectives are effectively integrated into the business. The committee,
in addition to performing the function for Santam Ltd, accepted the
role of the social and ethics committee for all Santam’s South African
subsidiaries who have the requisite public interest score.
The responsibilities of the committee are as follows:
− Monitoring Santam’s activities relating to social and economic
development, BBBEE, and employment equity.
− Monitoring good corporate citizenship, including the promotion
of equality, corporate social responsibility, ethical behaviour, and
managing environmental impact.
− Monitoring changes in empowerment charters and codes.
− Monitoring functions required in terms of the Companies Act
and its regulations.
− Actively managing the material matters that affect the
sustainability of the company, including:
• Minimising the risk associated with social, economic
and environmental impact, including stakeholder activism
and government regulation.
• Ensuring that the business aligns with legislative
requirements, such as King III, the JSE Listings
Requirements, BBBEE, and other applicable legislation.

SA
NT
AM
INT
EG
RA
TE
D R
EP
OR
T 2
016
86
CO
RP
OR
AT
E G
OV
ER
NA
NC
E R
EP
OR
T
− Adding value by monitoring and guiding management on:
• Developing and retaining a sustained client base.
• Developing solutions to accommodate change – inclusive
of societal and environmental change.
• Developing and retaining a sustained supplier base.
• Having appropriate human capital processes and systems
in place.
• Having a transformed business.
• Cultivating an ethical culture and combating/curbing
economic crime effectively.
• Applying environmental impact management and practices.
• Having a sustained intermediary base.
• Extending influence to the benefit of society.
• Applying responsible investment practices.
– The mandate of the committee also includes monitoring the
impact the conduct of the group has on its customers since the
conduct of the organisation has both a direct and an indirect
relationship to the group’s sustainability. The committee is,
therefore, responsible for reviewing and monitoring strategic
decisions impacting clients and ensuring that the conduct of the
organisation results in fair outcomes to customers.
The committee reviewed the strategy, plans and progress made
towards achieving Santam’s transformation targets. The committee
further reviewed the report compiled by the company’s appointed
BBBEE verification agency. The committee also monitored Santam’s
sustainability performance regarding the FTSE/JSE Responsible
Investment Index.
The committee comprises four suitably skilled and experienced
directors, and is chaired by an independent non-executive director.
At 31 December 2016, all members of the committee are
non-executive directors. The committee is supported in its tasks
by members of the executive committee and senior management.
According to its terms of reference, the committee meets formally
at least twice per annum, or as required for the effective performance
of its duties. The committee met three times during 2016. Details
of attendance at meetings are provided on page 82. The social,
ethics and sustainability committee is satisfied that it has fulfilled
its responsibilities in accordance with its charter for the year. In the
execution of its duties, the committee reviewed, inter alia, ethics,
compliance, stakeholder relations, HR and CSI reports submitted
by management. The committee members believe that the group
addresses the issues the committee is required to monitor in terms
of the Companies Act.
The committee, together with the audit committee, reviewed the
sustainability disclosures contained in the integrated report and
recommended it for approval to the board.
INVESTMENT COMMITTEEThe investment committee is chaired by Grant Gelink. The committee
meets to evaluate and monitor the investment portfolio and the
performance of investment managers. These meetings comprise
quarterly feedback sessions with investment analysts and four formal
investment committee meetings a year. The investment committee
guides the board on the mandates of investment managers, and
makes recommendations regarding the company’s investment
philosophy. The committee reviewed the Santam group investment
policy during 2016, which was approved by the board.
The committee is chaired by an independent non-executive director.
The committee met four times during the financial year. Details of
attendance at meetings are provided on page 82. The committee is
satisfied that it has fulfilled its responsibilities in accordance with its
terms of reference for the year.
AD HOC SUBCOMMITTEESThe board has the right to appoint and authorise special ad hoc board
committees to perform specific tasks from time to time. The relevant
board members make up these committees.
OTHER COMMITTEESEXECUTIVE COMMITTEEExecutive management and the board work closely in determining
the strategic objectives of the group. The board delegates authority
to the chief executive officer and the group executive committee for
the implementation of the strategy and the ongoing management of
the business. The chief executive officer, assisted by the executive
committee, is mandated by the board, through the company’s
delegation of authority, to deal with the day-to-day running of the
company’s affairs. The chief executive officer chairs the committee,
which comprises the executive management of all the significant
business units of the company. It meets and deals with all matters
relating to:
− the implementation of agreed strategy;
− the monitoring of performance; and
− the consideration of the company’s policies.
The board regularly reviews the levels of delegated authority to the
chief executive officer.
SA
NT
AM
INT
EG
RA
TE
D R
EP
OR
T 2
016
87
CO
RP
OR
AT
E G
OV
ER
NA
NC
E R
EP
OR
T
STAKEHOLDER RELATIONSVarious methods of communication are used to keep employees,
and other stakeholders, informed of company and group activities.
READ MORE ABOUT SANTAM’S STAKEHOLDERS ON PAGE 98.
The board encourages shareholders to attend the AGM and provides
a full explanation of the implications of the proposed resolutions.
IT GOVERNANCEThe Santam board is responsible for the governance of IT, as
recommended by King III. The board has mandated the executive
team to implement the Santam IT governance framework and
reporting system to monitor the risks and effective control of IT within
the group. Internal audit also provides assurance to management and
the audit committee of the effectiveness of IT governance.
The IT governance framework is directed by the Santam IT charter,
which describes the IT governance mechanisms, principles and
responsibilities within the group. Santam IT reviewed and aligned
a number of IT policies with the Sanlam Group policy standards.
The Santam information security charter expands on the IT charter
by describing the governance of information security. This charter
sets out the information security principles, governing bodies and
role players to enable the implementation of an information security
management system with the core purpose of protecting Santam’s
information assets.
The group IT strategy aims to develop and implement business
application platforms that will enable the overall Santam strategy
to deliver products more speedily, reduce Santam’s exposure due to
incorrect risk calculations, move closer to our partners and clients
through different user experience platforms, and reduce the overall
operational cost of contact centres. Furthermore, from a group
perspective, there is a significant focus from the business to increase
operating profit and reduce operational expenses. The IT strategy
is also aligned with this strategic focus by reducing the complexity
and number of applications within Santam, which should ultimately
reduce the total cost of ownership of IT by 2018.
The major IT investments for 2017 will be developing and delivering
further strategic solutions.
C O R P O R AT E G O V E R N A N C E R E P O R T

SA
NT
AM
INT
EG
RA
TE
D R
EP
OR
T 2
016
88
CO
RP
OR
AT
E G
OV
ER
NA
NC
E R
EP
OR
T
Santam’s board recognises and acknowledges that it is accountable for the establishment and maintenance of an effective risk management system, including the system of internal control.
The board is of the opinion that the risk processes at Santam are
effective in continuously identifying and evaluating risks and ensuring
that these risks are managed in line with the business strategy and
within the board-approved risk appetite.
RISK MANAGEMENT, INTERNAL CONTROL AND COMPLIANCE PROCESSESINTERNAL CONTROLAs part of the overall management of risk, management has
implemented a system of internal control. The internal control system
provides the board with reasonable assurance that the business is
operated consistently with:
− the strategy as determined by the board;
− the business objectives;
− the policies and processes; and
− the laws and regulations that apply to the group.
The system aims to detect and prevent any significant risk from
materialising and to mitigate any adverse consequences thereof.
The board is supported by the control functions within Santam, which
include the internal audit, enterprise and financial risk management
and compliance functions. The functions are reviewed regularly, as
agreed with the board of directors. A number of business units have
quality assurance functions in place. This is a management control
to continuously identify specific control weaknesses that need to be
addressed. Both the risk and audit departments work closely with
these functions to ensure appropriate controls are in place.
SYSTEM OF INTERNAL CONTROLThe board is ultimately responsible for and reviews the effectiveness
of the group’s system of internal control, which includes internal
financial controls. However, such a system is designed to manage
rather than eliminate the risk of failure to achieve business
objectives, and can provide only reasonable and not absolute
assurance against material misstatement or loss.
The board confirms that the process for identifying, evaluating and
managing the significant risks faced by the group is ongoing. This
process has been in place for the year under review and up to the
date of approval of the integrated report, and this process is regularly
reviewed by the board.
The board reviewed and approved the Group Internal Control Policy
in the year under review.
Management is responsible for the identification and evaluation of
significant risks applicable to their areas of business, in addition to
the design and operation of suitable internal controls. These risks
are assessed continually.
A control process of self-assessment and hierarchical reporting has
been established, which generates for a documented and auditable
trail of accountability. These procedures are relevant across group
operations, and provide for successive assurances to be given at
increasingly higher levels of management and, finally, to the board.
This process is facilitated by Enterprise Risk Management and
Group Internal Audit that, together, also provides a degree of
assurance as to the operationality and validity of the system
of internal control. Planned corrective actions are monitored
independently for timely completion.
INTERNAL FINANCIAL CONTROLSThe board has confirmed that effective systems of internal control
and risk management are being maintained. There were no
breakdowns in the functioning of the internal financial control
systems during the year, which had a material impact on the Santam
Ltd Group annual financial statements. The board is satisfied that
the annual financial statements fairly present the financial position,
changes in equity, results of operations and cash flows for the group
in accordance with International Financial Reporting Standards and
are supported by reasonable and prudent judgements that has been
consistently applied.
INTERNAL ASSURANCE PROVIDERSThe main internal independent assurance provider in Santam is the
internal audit unit. Internal audit provides objective and independent
assurance to management and the board of Santam through the
audit committee about risk management, control and governance
processes. Internal audit is governed by an internal audit charter,
approved by Santam’s audit committee and reviewed annually.
The charter defines the purpose, authority and responsibility
of the function.
The head of internal audit provides a report at each audit committee
meeting; including an annual written assessment of their scope and
findings; and reports to the chairman of the audit committee, with
RISK MANAGEMENT REPORT

SA
NT
AM
INT
EG
RA
TE
D R
EP
OR
T 2
016
89
CO
RP
OR
AT
E G
OV
ER
NA
NC
E R
EP
OR
T
administrative reporting to the chief financial officer and unrestricted
access to the chief executive officer and/or any other member
of executive management.
The Santam group’s approach to the governance of its group
operations is detailed in the board-approved Santam group
governance framework (framework). In the framework, it is
acknowledged that the Santam group at any time holds material
equity investments (in terms of the level of shareholding and/or
the value of the investment) in a number of entities, either through
statutory (legal) entities or other corporate/business arrangements.
Internal audit has developed an audit strategy for each category
of entities.
Internal audit plans ensure that all entities are adequately considered
in the audit plan based on their size, complexity and risk profile, as
well as specific legal entity governance requirements.
The annual internal audit plan is reviewed regularly to ensure
it remains relevant and responsive to changes in the operating
environment. The Santam audit committee approves the internal
audit plan for the group. Detailed audit plans for subsidiaries with
separate licences are approved by their respective finance and
risk committees.
Internal audit proactively reviews its practices and resources for
adequacy and appropriateness, to meet the ever-increasingly
demanding corporate governance and regulatory environment,
including the requirements of King III and the FSB’s SAM project.
Board Notice 158 has been implemented and the relevant
notifications and applications were submitted and approved by
the regulator during 2015. The head of the internal audit control
function was appointed at a group level and was outsourced to
MiWay Insurance Ltd, Centriq Insurance and Centriq Life.
EXTERNAL AUDITThe external auditors, PricewaterhouseCoopers Inc, are engaged to
provide stakeholders with an independent opinion on whether the
annual financial statements fairly present, in all material respects,
the financial position of the company and the group.
To ensure that there is no duplication of effort, there is regular
communication with internal audit to understand the scope of their
work and the results of their audits.
Santam has a formal pre-approval policy on the use of external
auditors for non-audit services. The policy provides guidelines on
dealing with audit, audit-related, tax and other non-audit services
that may be provided by the independent auditor to Santam and its
entities. It also sets out the services that may not be performed by
the auditor. The services rendered by the auditors are monitored
by the audit committee on a quarterly basis. Non-audit services
rendered by the group’s external auditors amounted to R3.8 million.
This includes R0.2 million for assurance-related services,
R1.1 million for regulatory-related services and R2.5 million
for other services. The external and internal auditors attend
committee meetings and have unrestricted access to the committee
and its chairman at all times, ensuring that their independence is
in no way impaired. Both the external and internal auditors have
the opportunity of addressing the audit committee at each of the
meetings without management being present.
OTHER ASSURANCEThere is regular interaction and consultation between internal audit
and other internal assurance providers and control functions, for
example the quality assurance functions in the distribution, claims
and underwriting business units, and the heads of risk management
and compliance control functions.
RISK MANAGEMENTThe objective of risk management is to create and protect value for
legitimate stakeholders, improve decision-making and contribute
to retaining and building Santam’s leadership position in terms
of financial performance, reputation/brand, market share and the
protection of policyholders.
The board also ensures that the risk management, internal control
and compliance systems are reviewed regularly for effectiveness.
While the board is responsible for the overall governance of risk,
it is assisted by the risk committee in discharging this responsibility.
Risk management is an important component of operational
governance due to the risks that the group is exposed to through
its business model.
The Santam board adopted the three lines of defence model for
managing these risks. This model defines the roles, responsibilities
and accountabilities for managing, reporting and escalating risks
and other matters throughout the group. The model incorporates
the oversight, management and assurance of risk management,
essentially giving three independent views of risk. This approach
ensures that risk management is embedded in the culture and daily
activities of business units and provides assurance to the board and
executive committee that risks are managed effectively.
The group operates within a decentralised business model
environment. In terms of this philosophy, the Santam board sets the
group ERM policies and frameworks and the individual businesses

SA
NT
AM
INT
EG
RA
TE
D R
EP
OR
T 2
016
90
CO
RP
OR
AT
E G
OV
ER
NA
NC
E R
EP
OR
T
take responsibility for all operational and risk-related matters
on a business level, within the limits set by these policies and
frameworks. The above diagram generically depicts the flow
of risk management information from the individual businesses
to the Santam Ltd board.
In compliance with the FSB’s Board Notice 158, the heads of all the
required control functions remain intact at a group level, and these
roles are outsourced to MiWay and Centriq. The heads of risk and
compliance control functions are supported by relevant functional
teams at both MiWay and Centriq and via various “risk custodians”
within the business units to ensure adequate on-the-ground
expertise and knowledge of the business. The risk management and
compliance policies form part of the group’s governance framework
and encompasses the totality of strategies, policies and procedures
for identifying, measuring, monitoring, managing and reporting all
material risks to which the group may be exposed.
Alignment between risk management and other assurance
providers, including internal and external audit, compliance and
quality assurance functions, remains a key part of the ERM plan.
The combined assurance framework brings role players together
to review and update significant risks and establish potential
assurance/oversight gaps that are escalated to the audit committee.
ERM conducts a quarterly analysis of the executive committee’s
top strategic risks, and operational risk work provides a bottom-up
perspective to inform the relevant risk profiles. Research, one-on-one
interviews, risk indicators, surveys, loss event management as well
as group workshops and interviews with the executive committee and
selected management are techniques applied to assist in gathering
the necessary information. The process includes “deep dives” and
discussion of new and emerging risks.
This year, an assessment was performed across the business and
with key stakeholders to assess key risks for the group. A survey
was conducted in collaboration with the Corporate Executive Board
(CEB) Risk Management Leadership Council to obtain input on
various stakeholders’ views of Santam’s top residual risks, specifically
looking into the future. The survey highlighted the compliance and
ethics risks assessed as the lowest risks. Strategic risks, in general,
were rated the highest. These risks aligned well with the current top
strategic risk view with most of the identified risks being risk drivers/
causes for growth and earnings challenges. These remain the top
risks for the Santam group from a strategic perspective. The top
residual risk themes identified included financial health/economic
uncertainty (including risk of sovereign downgrade), extreme weather
events (e.g. floods, drought), attraction and retention of skills,
competition and sovereign/political.
READ MORE ABOUT THE STRATEGIC RISKS ON PAGE 43.
Business-level management committees
Additional committees that may be established by a business to assist their executive committee in certain areas of risk management (e.g. Santam information security committee)
Business-level risk and/or audit committees/forums
Assist the business-level board in fulfilling its responsibilities to the Santam group (e.g. MiWay and Centriq finance and risk committees)
Business-level (and sub-businesses)
Risk management identifies and manages risks faced by the business (e.g. operations/risk services/ underwriting managers)
Group risk management
Develops group risk management framework, policy and guidelines for approval by the Santam board; coordinates reporting responsibilities and improves risk management across the group
Santam board
Responsible for the group’s risk management strategy, framework and policy, as well as monitoring the effectiveness and disclosure thereof, in accordance with best practice
Santam board committees (including risk, human resources, social, ethics and sustainability, investment and audit)
Assist the Santam board to fulfil its responsibilities
Santam executive risk forum (ERF)
A forum for executive management and control functions to discuss and review risk

SA
NT
AM
INT
EG
RA
TE
D R
EP
OR
T 2
016
91
CO
RP
OR
AT
E G
OV
ER
NA
NC
E R
EP
OR
T
RI SK M A N AGEMEN T REP OR T
The relevant board committees and forums monitor specific risks
with overall oversight and review provided by the risk committee. The
risk appetite remains a key tool to review and measure to what extent
risks are managed within risk appetite. Risk appetites are in place for
the main strategic business units, which are reviewed at a board level.
Risk reports are discussed quarterly by the various committees and
boards, ultimately feeding into the overall group risk appetite, which
is discussed and reviewed by the Santam risk committee.
RISK DISCLOSUREThe integrated ERM process is mature and is applied consistently
throughout the group. Based on independent reviews and maturity
assessments presented to the risk committee, the board is confident
that the integrated ERM programme is adequate in identifying
current and emerging risks and ensuring that these risks are
managed appropriately.
COMPLIANCEThe group operates in a highly regulated environment due to
the nature of its financial services operations. Long-term
sustainability is inextricably linked to compliance with all applicable
regulations and maintaining a productive relationship with regulators,
who grant operating licences to the group’s businesses. Regulatory
compliance is therefore a particularly important operational
governance focus area:
− The Sanlam board is ultimately responsible for regulatory
compliance. The responsibilities of the risk committees
at the various business units include monitoring of
regulatory compliance.
− Quarterly reports to these committees and the Santam board
include updates on regulatory developments, augmented by
regular training sessions to ensure that members of the board
and these committees stay abreast of all legislation applicable
to the group.
− Quarterly reporting also includes compliance reports that provide
information on the group’s overall regulatory compliance, any
significant breaches detected by the group, and business unit
compliance functions. The terms of reference of cluster and
business unit level boards and risk forums similarly include
monitoring of regulatory compliance.
− Compliance functions with dedicated compliance officers
are established at both group and licensed entity level. The
terms of reference for these functions focus specifically on
regulatory compliance.
− Changes in South African regulations are monitored by the group
compliance function within the group risk management function.
− These functions are actively involved in commenting on proposed
regulatory changes directly and through industry bodies, and
are also responsible to coordinate the implementation of new
regulations across affected businesses. Similar functions operate
within the group’s operations outside South Africa. The scope of
the centralised regulatory unit will be extended over time
to include non-South African businesses.
− Regulatory compliance remains the responsibilities of
business management.
The insurance industry faces major regulatory changes, which
currently require more diligent attention.
READ MORE ABOUT THE REGULATORY ENVIRONMENT IN WHICH THE GROUP OPERATES ON PAGE 81.
BUSINESS CONTINUITYA key operational risk, which spans Santam’s business, is the
potential impact of a major disaster and/or disruption. The group
has responded to this threat by continually improving the group-wide
business continuity framework to ensure that people are prepared,
crisis infrastructure is tested, and meaningful recovery plans are in
place. A steering committee is responsible for overseeing, reviewing
and monitoring Santam’s business continuity capability, specifically
the prioritisation of business recovery plans. This year saw the first
integrated disaster recovery and business recovery tests conducted
at Santam’s off-site premises. The test was successful and learnings
have been incorporated into business recovery plans.
A cyber crisis learning intervention session was also held at Sanlam
with the various business unit heads taking part in a simulated
cyber incident. The objective was to display how a cyber crisis is
handled differently to a “normal” crisis which previous scenarios
used. Outputs from the event will be used to update the Santam’s
crisis management guide to cater for cyber events. The exercise
involved the Santam group recovery director (and chief information
officer), the chief financial officer and ERM. The exercise provided
participants with practical insight and a cyber-specific crisis
management capability.
READ MORE ABOUT THE HACKATHON IN THE REAL-LIFE STORIES ON PAGE 37.
SA
NT
AM
INT
EG
RA
TE
D R
EP
OR
T 2
016
92
CO
RP
OR
AT
E G
OV
ER
NA
NC
E R
EP
OR
T
INTRODUCTIONSantam’s remuneration philosophy and policy support the business
strategy by aligning agreed strategic goals with the behaviour
required to meet and exceed these goals. The policy is reviewed
annually to ensure alignment with changes in the remuneration-
related legislative and regulatory requirements. Short- and long-term
strategic objectives are measured and rewarded and this approach
mitigates excessive risk-taking and balances longer-term strategic
objectives with short-term gains.
In setting up the reward structures, prevailing economic conditions
and local governance principles are taken into account – specifically
to correctly position the nature and the scale of remuneration
at all levels of the organisation relative to relevant benchmarks
and best practice.
Alignment with applicable regulatory and governance requirements
is ensured, while also conforming to the principles contained in
the codes of good practice which support Employment Equity
legislation, and notably for purposes of this policy, those that deal
with remuneration.
Santam is the sole or part owner of a number of businesses.
Although compliance with Santam’s remuneration strategy and policy
is primarily targeted at Santam group companies or subsidiaries,
Santam encourages the application of sound remuneration practices
in those businesses where it does not hold a controlling interest.
REMUNERATION PHILOSOPHY AND STRATEGYThe board recognises that appropriate remuneration for executive
directors, members of its executive committee and other employees
is inextricably linked to the development and retention of top-level
talent and intellectual capital within the group. Given the current
economic climate, changes in the regulatory requirements and the
ongoing skills shortage, it is essential that adequate measures are
implemented to attract and retain the required talent.
Santam’s reward philosophy and strategy support the business
strategy by implementing processes that align agreed strategic
objectives with the behaviour required to meet and exceed these
objectives. These processes include performance contracting,
performance measurement and the linking of rewards to
performance. Reward structures are created taking into account
prevailing economic conditions, national and international governance
principles and the management of risk in the context of both short
and long-term incentive awards.
The Santam board recognises certain industry-specific and
other relevant differences between group businesses and, where
appropriate, allows the business units relative autonomy in
positioning themselves to attract, retain and reward their employees
appropriately within an overarching framework. In this regard, there
are some areas where the dictates of good corporate governance,
the protection of shareholder interests and those of the Santam brand
or corporate identity require full disclosure, motivation and approval
by the HRRC, either at group or business unit level.
The principle of management discretion, with regard to individual
employees, is central to the remuneration philosophy on the basis
that all rewards are based on merit. However, the overarching
principles and design of the remuneration structure are consistent,
to support a common philosophy and to ensure good corporate
governance, with differentiation where appropriate. In other
instances, the Santam remuneration philosophy implies that the
businesses are mandated to apply their own discretion, given the role
that their own remuneration/human resources committees will play
in ensuring good governance.
REMUNERATION REPORT

SA
NT
AM
INT
EG
RA
TE
D R
EP
OR
T 2
016
93
CO
RP
OR
AT
E G
OV
ER
NA
NC
E R
EP
OR
T
The group has continued to apply a total reward strategy for its
employees. This offering comprises remuneration (which includes
cash remuneration, short-term incentives and long-term incentives),
benefits (retirement funds, group life, etc.), learning and development,
an attractive working environment and a range of lifestyle benefits.
In applying the remuneration philosophy and implementing the total
reward strategy, a number of principles are followed:
− Pay for performance – Performance is the cornerstone of
the remuneration philosophy. On this basis, all remuneration
practices are structured in such a way as to provide for clear
differentiation between individuals with regard to performance.
− Leverage and alignment – The reward consequences for all
levels of employees are, as far as possible, aligned with, linked
to and influenced by:
• the interests of Santam’s shareholders;
• sustainable performance of the group;
• the performance of the business unit or function; and
• the employee’s own contribution.
Excessive risk-taking is mitigated against in the design of
incentive plans, for instance through the inclusion of hurdles
and vesting periods.
− Consistency and fairness – The remuneration philosophy
strives to be both consistent and transparent. Where there is
differentiation between employees performing similar work,
the differentiation is required to be fair and rational. Market
comparison methodology makes provision for benchmarking
specialist skills groups as well as roles of a more general
nature on all levels.
− Competitiveness, attraction and retention – A key objective
of the remuneration philosophy is that total reward should
enable the group and its business units to attract and retain
talented individuals in order to ensure the sustainability of the
organisation. Reward in this regard is viewed in a holistic manner,
comprising a range of monetary (fixed and variable) and
non-monetary components of the employee value proposition.
Pay practices are underpinned by globally recognised
job evaluation processes, enabling Santam to draw valid
comparisons to reputable surveys. In line with market
practice, the variable pay component of total reward increases
with seniority (organisational level), as the ability to impact
business results increases. This is reflected in higher-incentive
opportunities (both short- and long-term) offered on more senior
levels compared to junior employees.
− Share participation – High-performing employees are
encouraged to identify with the success of the business through
share participation, establishing a clear link between their
individual efforts and the group’s long-term success. For
employees of the unlisted entities of the group, deferred bonus
plans are used. Net insurance result (NIR) is used as the key
performance driver and vesting is partially dependent on the
achievement of a minimum performance hurdle. Vesting in all
cases occurs over a five-year period.
− Communication – The remuneration philosophy, policy and
processes to determine individual pay levels strive to be both
consistent and transparent and are communicated effectively
to all employees. A range of channels is used to increase
employees’ understanding of pay practices and appreciation
of the total rewards offering.
− Regular review – Current market information and trend
information is used on an annual basis to determine individual
remuneration packages of all levels of employees.
− Clawback – Where performance achievements are subsequently
found to have been significantly misstated so that the bonuses
and other incentives should not have been paid, provision is made
for redress in appropriate instances.
REMUNERATION STRUCTUREThe various components of reward are summarised in the table on
page 94. A detailed description of each component follows in the
next section.
Where applicable, the quantum of the different components of the
package is determined as follows:
− The guaranteed component is based on market relatedness
in conjunction with the individual’s performance, competence
and potential.
− The short-term incentive component of remuneration is based
on individual performance, after taking into account business
performance in determining the quantum of the bonus pool.
− The long-term incentive component is based on the individual’s
performance, potential and overall value to the group.

SA
NT
AM
INT
EG
RA
TE
D R
EP
OR
T 2
016
94
CO
RP
OR
AT
E G
OV
ER
NA
NC
E R
EP
OR
T
REMUNERATION COMPONENTSElement Purpose Performance period and measures Operation and delivery
Total guaranteed package Core element that reflects market value of role and individual performance.
Reviewed annually based on performance against contracted output and market surveys. Benchmarked against comparator group and positioned on average on the median.
Guaranteed package is delivered to the employee as a cash salary and a mix of compulsory and discretionary benefits.
Short-term incentives (STI) (performance bonus)
To drive achievement of sustainable results and encourage behaviours that are consistent with the Santam values and aligned with the best interests of our stakeholders.
To create a high-performance culture through an annual cash bonus linked to performance against contracted deliverables, with due regard to preventing excessive risk-taking. The STI scheme supports collaboration and teamwork across business units and various businesses.
To attract, retain and motivate key talent. The criteria and quantum of the STI are benchmarked to the market.
Based on short-term performance measured over a 12-month period with the aim to remunerate outstanding performance in excess of market mean.
Performance is measured at company, business unit and individual level against predetermined performance targets. The bonuses of all employees are funded from bonus pools that are based on financial targets agreed at board level.
Long-term incentives (LTI)
To increase employee motivation and create alignment between employee interests and shareholder interests.
To attract and retain the services of valuable and highly skilled individuals who are performing exceptionally.
Annual grants vesting over either five or six years. Part early vesting is allowed from the third year provided that all the vesting conditions have been met.
Awards are made annually based on key eligibility criteria, including leadership and those individuals key to driving the business strategy, talent management and succession planning, retention of critical talent and contribution.
The quantum of awards aims to maintain an appropriate level of employee retention value. Vesting occurs upon satisfaction of performance hurdles and individual performance targets.
Outperformance Plan (OPP)
To incentivise exceptional performance of senior leaders in the business, over a three-to-five-year measurement period.
For payment to occur, expected growth in net insurance results must exceed the hurdle for the period. Full payment is only made if the stretch performance targets are met. The maximum payment is a multiple of six times annual total guaranteed package over the measurement period.
Awards are made on an ad hoc basis based on role, performance and contribution. The size of awards aims to maintain an appropriate level of incentive towards attaining strategic objectives.
SA
NT
AM
INT
EG
RA
TE
D R
EP
OR
T 2
016
95
CO
RP
OR
AT
E G
OV
ER
NA
NC
E R
EP
OR
T
REMUNER AT ION REP OR T
DESCRIPTION OF REMUNERATION COMPONENTSTOTAL GUARANTEED PACKAGE (TGP) TGP is a guaranteed component of the remuneration offering. It forms
the basis of the organisation’s ability to attract and retain the required
skills. In order to create a high-performance culture, the emphasis
is placed on the variable/performance component of remuneration
rather than the guaranteed component. For this reason, TGP is
normally positioned on the median of the market. As an integral
part of TGP, Santam provides a flexible structure of benefits that
can be tailored, within certain limits, to individual requirements.
These include retirement plans, group life cover and medical aid.
Process and benchmarking Average TGP is normally set by reference to the median paid by
comparative local companies. The comparator group is made up of
a sizeable and representative sample of companies that have similar
characteristics to Santam in terms of being in the financial services
sector (but not limited only to this sector) and market capitalisation.
In terms of the process followed in benchmarking TGP, Santam
obtains data from a number of salary surveys. The data is then
analysed using Towers Watson’s Global Grading Calculator. In addition
to this benchmarking process, Santam also takes into account the
skills, potential and performance of the individual concerned, as well
as the current consumer price index of the country.
Levels TGP levels are positioned around the median of the comparator
market. Where specific skills dictate, TGP levels may be set in
excess of the median.
GovernanceThe HRRC is responsible for remuneration governance as mandated
by the board, with its responsibilities defined in the charter. Feedback
from the HRRC meetings are presented to the board. The HRRC
applies the principles outlined in the remuneration policy with the
right to apply discretion in exceptional circumstances should there
be a need. Upon conclusion of the benchmarking process, the
HRRC is provided with market-related remuneration information
and proposals regarding the annual remuneration review for
consideration and approval. The HRRC also reviews and approves the
adjustments to the total guaranteed package for each of the Santam
executive directors and members of the Santam executive committee.
SHORT-TERM INCENTIVESThe purpose of the performance bonus plan is to align the
performance of employees with the goals of the organisation
and to motivate and reward employees who outperform the agreed
performance hurdles. No part of the executives’ performance
bonuses is guaranteed – the full bonus depends on individual
and company performance. At executive level, the maximum bonus
that can potentially be earned is 160% of annual TGP for the chief
executive officer, 120% for the chief financial officer and 100% for
the other executives.
Vesting levelsThe performance bonus plan is a cash-settled plan. Where the
annual business and individual bonus targets are achieved in full,
the on-target bonus percentage will be paid, which is equal to 50% to
70% of the maximum bonus (bonus cap). In instances where expected
target goals have been exceeded, the cash component is capped at
a percentage of TGP, but in exceptional cases, the total value of the
bonus awarded can exceed the capped cash bonus (refer to ex gratia
performance bonus rewards below).
Where the bonus targets are not achieved in full, a reduced bonus
will be paid only if a minimum threshold performance level has been
achieved. Where the annual business bonus targets are not achieved,
an amount may be set aside to reward exceptional individual
performance at the discretion of the chief executive officer. The
annual bonus targets at a group and business unit level incorporate
a number of financial and non-financial performance measures
that are directly linked to the group strategy and KPIs, including
net insurance result, GWP, skills development and employment
equity. The specific performance targets and relative weighting are
determined per business unit based on the unit’s strategic initiatives.
The targets of the corporate support functions reflect the overall
performance of the group.
Ex gratia performance bonus rewards Where it is determined that an individual has demonstrated
exceptional performance within his or her area of expertise that
justifies a bonus payment in excess of the maximum cash bonus
percentage of TGP, the HRRC may award an additional bonus
amount to acknowledge such outperformance. The rationale of this
mechanism is to encourage retention of high-performing individuals
and ensure the sustainability of performance-driven behaviour.
GovernanceThe HRRC’s role with regard to the annual bonus plan is to determine
the overall design of the performance bonus plan, to ensure that it
provides a clear link to performance, fosters sustainable business
performance and is aligned with the group’s business strategy. It
also sets the overall principle with respect to thresholds, targets and
stretch levels for the annual bonus plan and the percentage of total
guaranteed package that can be earned at each level by each group
of employees.
LONG-TERM INCENTIVESLTIs are an integral part of the company’s approach to competitive
performance-based pay, and are aligned with shareholder returns to
ensure a clear line of sight between pay and long-term value creation
for shareholders.
Santam currently grants awards under the Deferred Share Plan
(DSP), the Performance Deferred Share Plan (PDSP) and Santam
Outperformance Plan (OPP). With the exception of the OPP, these
LTI plans are equity-settled plans. The OPP is a cash-based plan,
which rewards long-term performance.

SA
NT
AM
INT
EG
RA
TE
D R
EP
OR
T 2
016
96
CO
RP
OR
AT
E G
OV
ER
NA
NC
E R
EP
OR
T
With respect to the DSP and the PDSP, Santam’s practice is to make
awards annually to ensure that the total face value of outstanding
awards (calculated on their face value at date of grant) is equal to a
set multiple of the individual’s TGP. The set multiples are determined
by reference to the individual’s level in the organisation. In addition,
transformation considerations and the role and performance of an
individual and the need to attract and/or retain key talent are taken
into account when determining the final multiple.
In general, the targeted award level ranges from 70% to 245%
of annual TGP, but may exceed this in the specific circumstances
referred to above. The vesting of LTI awards granted under the DSP
is subject to individual performance hurdles. Under the PDSP, it is
dependent on business hurdles being achieved.
Appropriate LTI plans are designed for Santam’s unlisted
subsidiaries. The plans currently in use are share appreciation rights
schemes or Deferred Cash Bonus Plans. The vesting principles and
period are aligned to those of the DSP.
Participation The LTIs are aimed at attracting and retaining key employees. The
practice is to target allocations to employees in management or key
functional roles. Non-executive directors do not participate in any of
the LTIs.
Deferred Share Plan (DSP) Awards granted under the DSP are conditional rights to acquire
shares for no consideration, subject to vesting conditions being
satisfied. The award has individual performance hurdles attached
to it. The vesting conditions are that the individual remains employed
by the group throughout the vesting period and maintains agreed
individual performance hurdles. The measurement period is five years
and early vesting may occur as follows, provided that all the vesting
conditions have been met:
– After three years – 40%;
– After four years – 70% less any portion vested earlier; and
– After five years – 100% less any portion that vested earlier.
The award granted under the DSP is not subject to the satisfaction
of the group performance conditions, but does require meeting
individually contracted performance hurdles. Typically, the award
granted under the DSP has a face value of up to 105% of TGP. To the
extent that this percentage falls, whether through vesting or due to a
promotion or salary increase, an additional award may be granted on
an annual basis to maintain the level of participation under the DSP.
Performance Deferred Share Plan (PDSP) To the extent that the face value of the awards granted under the
DSP does not satisfy the specified multiple of TGP to be granted as
LTI awards, the individual will be granted an award under the PDSP.
Awards granted under the PDSP are conditional rights to acquire
Santam and Sanlam shares for no consideration, subject to various
vesting conditions being satisfied.
In addition to the individual remaining employed by the group
throughout the measurement period and maintaining the agreed-
upon individual performance hurdles, the vesting of the award is also
subject to the following performance conditions:
− Santam shares: that the group achieves an implied fair value
to Net Asset Value (NAV) ratio of 1.25 times. For the purposes
of calculating the implied fair value to NAV ratio, the return on
capital in excess of the cost of capital will be expressed as a
ratio on the following basis: (Return on Capital – g) / (Cost of
Capital – g) = implied fair value to NAV ratio.
− Sanlam shares: that the group’s adjusted Return on Group Equity
Value (RoGEV) exceeds the Sanlam Group’s cost of capital for the
relevant measurement period (group performance hurdle). Cost
of capital is defined as the nine-year government bond rate in
South Africa plus 300 basis points.
The exact condition varies by reference to the value of the
performance award as a proportion of the individual’s TGP.
The higher the award allocated, the more stretching the vesting
conditions thereof.
The use of relevant performance conditions is considered appropriate
as these are the key drivers of the Santam and Sanlam groups’
strategies. The use of these measures creates a direct link between
the LTI reward, group strategy and shareholders’ interests. To
the extent that they are not met at the end of this period, the
performance-related awards will lapse. However, awards under
the PDSP can vest prior to the end of the six-year performance
measurement period on a proportional basis to the extent that all
the vesting conditions are met earlier, as follows:
– After three years from the date of grant – 40% of the award;
– After four years – 70% less any portion that vested earlier; and
– After five years – 100% less any portion that vested earlier.
This arrangement is aimed at encouraging performance that will
result in targets being met earlier within the agreed performance
measurement period. To the extent that the value of performance
awards falls below the specified multiple of TGP, whether through
vesting or due to a promotion or salary increase, an additional
award may be granted on an annual basis to maintain the level of
performance awards and encourage ongoing long-term performance.
OUT-PERFORMANCE PLAN (OPP) From time to time, at the discretion of the HRRC, participation in an
OPP may be offered to senior leaders in the group. The OPP rewards
superior performance over a three-to-five-year measurement period.
No payment is made under the OPP unless the agreed growth target
over the period is exceeded and full payment is only made if the
stretched performance target is met. The maximum payment that
can be made under the OPP is a multiple of six times the annual TGP
in the final measurement year.
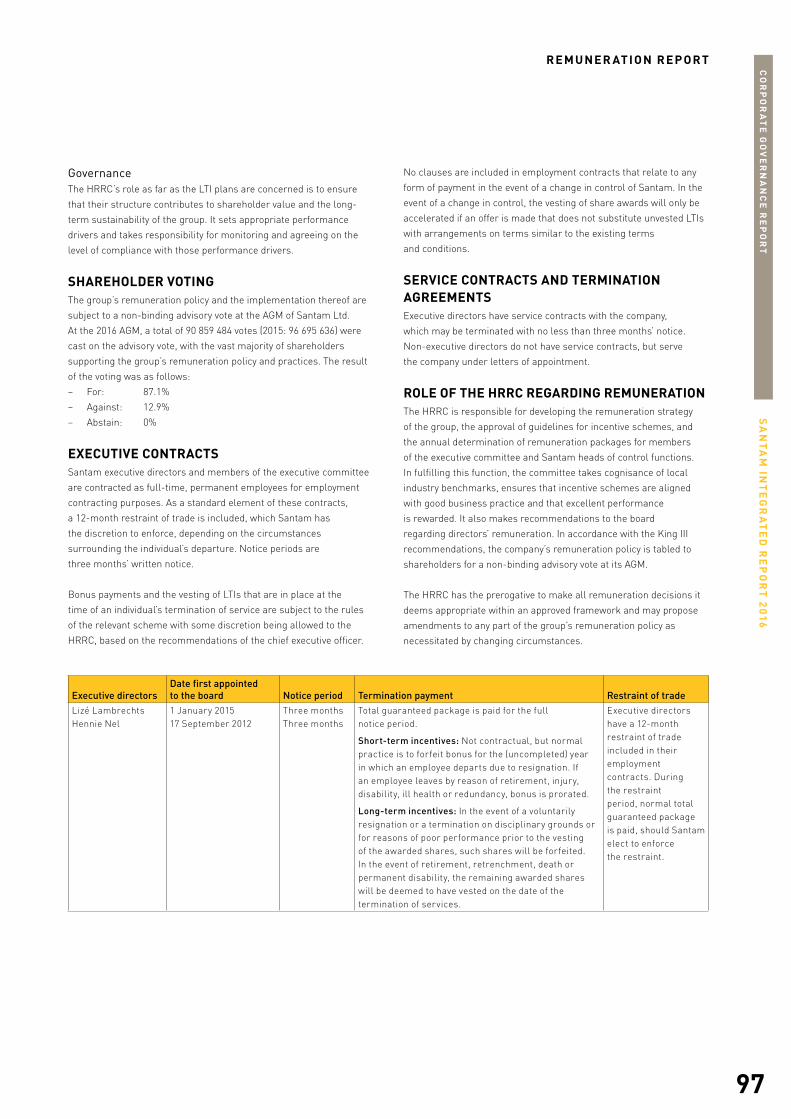
SA
NT
AM
INT
EG
RA
TE
D R
EP
OR
T 2
016
97
CO
RP
OR
AT
E G
OV
ER
NA
NC
E R
EP
OR
T
REMUNER AT ION REP OR T
GovernanceThe HRRC’s role as far as the LTI plans are concerned is to ensure
that their structure contributes to shareholder value and the long-
term sustainability of the group. It sets appropriate performance
drivers and takes responsibility for monitoring and agreeing on the
level of compliance with those performance drivers.
SHAREHOLDER VOTING The group’s remuneration policy and the implementation thereof are
subject to a non-binding advisory vote at the AGM of Santam Ltd.
At the 2016 AGM, a total of 90 859 484 votes (2015: 96 695 636) were
cast on the advisory vote, with the vast majority of shareholders
supporting the group’s remuneration policy and practices. The result
of the voting was as follows:
– For: 87.1%
– Against: 12.9%
– Abstain: 0%
EXECUTIVE CONTRACTSSantam executive directors and members of the executive committee
are contracted as full-time, permanent employees for employment
contracting purposes. As a standard element of these contracts,
a 12-month restraint of trade is included, which Santam has
the discretion to enforce, depending on the circumstances
surrounding the individual’s departure. Notice periods are
three months’ written notice.
Bonus payments and the vesting of LTIs that are in place at the
time of an individual’s termination of service are subject to the rules
of the relevant scheme with some discretion being allowed to the
HRRC, based on the recommendations of the chief executive officer.
No clauses are included in employment contracts that relate to any
form of payment in the event of a change in control of Santam. In the
event of a change in control, the vesting of share awards will only be
accelerated if an offer is made that does not substitute unvested LTIs
with arrangements on terms similar to the existing terms
and conditions.
SERVICE CONTRACTS AND TERMINATION AGREEMENTSExecutive directors have service contracts with the company,
which may be terminated with no less than three months’ notice.
Non-executive directors do not have service contracts, but serve
the company under letters of appointment.
ROLE OF THE HRRC REGARDING REMUNERATION The HRRC is responsible for developing the remuneration strategy
of the group, the approval of guidelines for incentive schemes, and
the annual determination of remuneration packages for members
of the executive committee and Santam heads of control functions.
In fulfilling this function, the committee takes cognisance of local
industry benchmarks, ensures that incentive schemes are aligned
with good business practice and that excellent performance
is rewarded. It also makes recommendations to the board
regarding directors’ remuneration. In accordance with the King III
recommendations, the company’s remuneration policy is tabled to
shareholders for a non-binding advisory vote at its AGM.
The HRRC has the prerogative to make all remuneration decisions it
deems appropriate within an approved framework and may propose
amendments to any part of the group’s remuneration policy as
necessitated by changing circumstances.
Executive directorsDate first appointed to the board Notice period Termination payment Restraint of trade
Lizé LambrechtsHennie Nel
1 January 201517 September 2012
Three monthsThree months
Total guaranteed package is paid for the full notice period.
Short-term incentives: Not contractual, but normal practice is to forfeit bonus for the (uncompleted) year in which an employee departs due to resignation. If an employee leaves by reason of retirement, injury, disability, ill health or redundancy, bonus is prorated.
Long-term incentives: In the event of a voluntarily resignation or a termination on disciplinary grounds or for reasons of poor performance prior to the vesting of the awarded shares, such shares will be forfeited. In the event of retirement, retrenchment, death or permanent disability, the remaining awarded shares will be deemed to have vested on the date of the termination of services.
Executive directors have a 12-month restraint of trade included in their employment contracts. During the restraint period, normal total guaranteed package is paid, should Santam elect to enforce the restraint.
SA
NT
AM
INT
EG
RA
TE
D R
EP
OR
T 2
016
98
CO
RP
OR
AT
E G
OV
ER
NA
NC
E R
EP
OR
T
BACKGROUNDThe private sector is a key player in the acceleration of economic
transformation of a country, and Santam takes its role seriously in
supporting this. The group follows a holistic and integrated approach
in applying transformation. This is focused on creating a diverse
workforce, intermediary and supplier base, creating access for
non-traditional markets to products and services, and investment
into communities.
Santam continues to drive this approach across all stakeholder
networks – including business partners, clients and employees. This
encourages the sustainable evolution of the business, while building
competitive advantage and enabling successful execution of the
strategy and vision.
TRANSFORMATION DEFINEDSantam defines transformation as a dynamic process through which
it creates a sustainable culture of diversity and inclusion, with a focus
on its workforce, the workplace and the marketplace.
This is activated through the group’s product/service offering to
diverse markets, the creation of diverse distribution channels,
employee profiles, ideas, race, gender, experience and other
perspectives. In so doing, the business ensures economic inclusion
and creates value for its key stakeholders across the markets
in which it operates, locally and internationally. The Santam
transformation journey will continue to focus primarily on the
South African market.
KEY STAKEHOLDERS IMPACTEDThe stakeholders impacted and affected by Santam’s transformation
strategy are diverse and representative of the entire value chain. For
the purpose of this strategy, the key stakeholders are:
− Employees
− Suppliers
− Clients
− Intermediaries
− Associated companies
− Business partners
− Subsidiaries
− Relevant government departments (dti, Small Business
Development Department and National Treasury)
APPROACH Santam’s approach to transformation is directly aligned to its vision
and reinforces the brand promise of Insurance good and proper.
Through the transformation mission, the group aims to leverage
off diversity and inclusion to drive superior and sustainable
business results to provide competitive advantage and create
value for all stakeholders.
This will be achieved by focusing on Santam’s workforce, workplace
and marketplace, underpinned by the values of the Santam Way.
Transformation mission: To leverage the value of diversity and
inclusion to drive superior and sustainable business results,
competitive advantage and value for stakeholders.
We aim to achieve this by focusing on:
− Our workforce: We build a capable, high-performing and
diverse workforce that is reflective of the marketplace in which
we operate (skills, generation, race, gender, ideas).
− Our workplace: We create a culture that values our differences
and drives innovation to achieve growth, reduce our risks and
create efficiencies.
− Our marketplace: We work with our stakeholders (clients,
employees, intermediaries, suppliers, business partners,
shareholders and communities) to create value and to enable
business success in our diverse marketplace.
TRANSFORMATION REPORT

SA
NT
AM
INT
EG
RA
TE
D R
EP
OR
T 2
016
99
CO
RP
OR
AT
E G
OV
ER
NA
NC
E R
EP
OR
T
IMPLEMENTATION OF THE TRANSFORMATION STRATEGYThe organisation has created a framework which will be its focus in 2017 and beyond. This focus will ensure that its efforts in achieving the
transformation mission are directed where it can add the most value.
Objectives Initiatives Outcomes
Drive high-impact transformation initiatives for business and societal value
– Integrated supplier development programme – Diverse investment partnerships – Diverse distribution channel programme – Growth through a diverse SMME approach – Partnership for Risk and Resilience – Transformation at community and municipal level
1. A shared Santam transformation story
2. A purpose-driven and integrated approach
3. A better connection to and engagement with all stakeholdersDrive a diverse and
inclusive culture – Establishment of holistic diversity programmes and platforms
to support an inclusive culture throughout the workplace, workforce and marketplace
– Progressive and inclusive products and services – Development of our people
Drive transformation through innovation
– Solutions innovation for gaining access to changing markets – Investment mandate to drive innovation – Innovation in risk management
Lead transformation compliance
– Compliance leadership in the industry (FSC) – Diverse employee base
Accountability is driven by the respective executives
TRANSFORMATION GOVERNANCE AND MANAGEMENT The governance of the transformation strategy at board level is
driven mainly by the HRRC and reported to the social, ethics and
sustainability committee.
The transformation strategy is being fully integrated into current
business, functions and responsibilities, thus it leverages off the
embedded reporting and management mechanisms. These reporting
mechanisms include, among others, the National Employment Equity
Forum that looks at employment equity and skills development based
on plans and targets.
The Santam executive committee serves as the overall transformation
management committee. In fulfilling this objective, the committee
focuses on the implementation, monitoring and evaluation of and
reporting on the transformation strategy for the group.

SA
NT
AM
INT
EG
RA
TE
D R
EP
OR
T 2
016
100
CO
RP
OR
AT
E G
OV
ER
NA
NC
E R
EP
OR
T
Transformation governance elements include the following:
The chief executive officer takes key accountability for implementation
of the transformation strategy. Each executive’s transformation
accountabilities are included in his or her respective annual key
performance areas. The head of transformation and executive heads
are responsible for integration, monitoring and evaluating
the progress made.
TRANSFORMATION PRIORITIESThe Santam transformation journey will continue to focus primarily
on the South African market and will later be transitioned to the rest
of the chosen geographies in emerging markets. This strategy will
be activated through the group’s product/service offering to diverse
markets, diverse distribution channels created, employee profiles,
ideas, race, gender, experience and other perspectives. In so doing,
the business ensures economic inclusion and creates value for its
key stakeholders across the markets in which it operates, both locally
and internationally.
TRANSFORMATION HIGHLIGHTS FOR 2016Santam’s transformation highlights continue to strengthen the
group’s drive to transform the business across its entire value chain.
There are improvements year on year and deeper commitment for
2017 and beyond.
KEY HIGHLIGHTS*:− Employee black representation improved by 5% to 68%
(2015: 63%)
− R114 million (2015: R79 million) invested in learning and
development for black employees across the group
− R40 million (2015: R10 million) invested in supplier development
through the Sanlam/Santam ASISA Supplier Development
Programme
− R21 million (2015: R16 million) invested in CSI and CFE
− Socio-economic development strategy expanded to support risk
management work, focusing on vulnerable communities
(Partnerships for Risk and Resilience, see page 50)
− R8.3 million (2015: R9.3 million) invested in consumer financial
education programmes
− Expanded consumer financial education focus on the
development of small businesses (inclusive of emerging
farmers). This will remain a focus going into 2017
− R3.3 million (2015: R3 million) invested in the Black Broker
Development programme, with 166 participants in 2015 and 2016
and 12% placed in jobs
− An improved product offering to the emerging markets by
increasing the group’s product base of from 10 to 12 options
for this market
− Just over 129 000 policies sold as access products in South Africa
(2015: 66 000)
− Transformation agenda expanded across a further
six subsidiaries, with a total of nine subsidiaries now aligned
to the group transformation agenda
− BBBEE rating improved with the achievement of a level 2
(2015: level 3)
* The key highlights cover Santam Ltd and its South African subsidiaries.
READ MORE ABOUT THE PARTNERSHIP FOR RISK AND RESILIENCE ON PAGE 50.
SANTAM BOARD OF DIRECTORS
SANTAM EXECUTIVE COMMITTEE
NATIONAL EMPLOYMENT EQUITY FORUM
HUMAN RESOURCES ANDREMUNERATION COMMITTEE
SOCIAL, ETHICS ANDSUSTAINABILITY COMMITTEE
SANTAM TRANSFORMATION STRATEGY
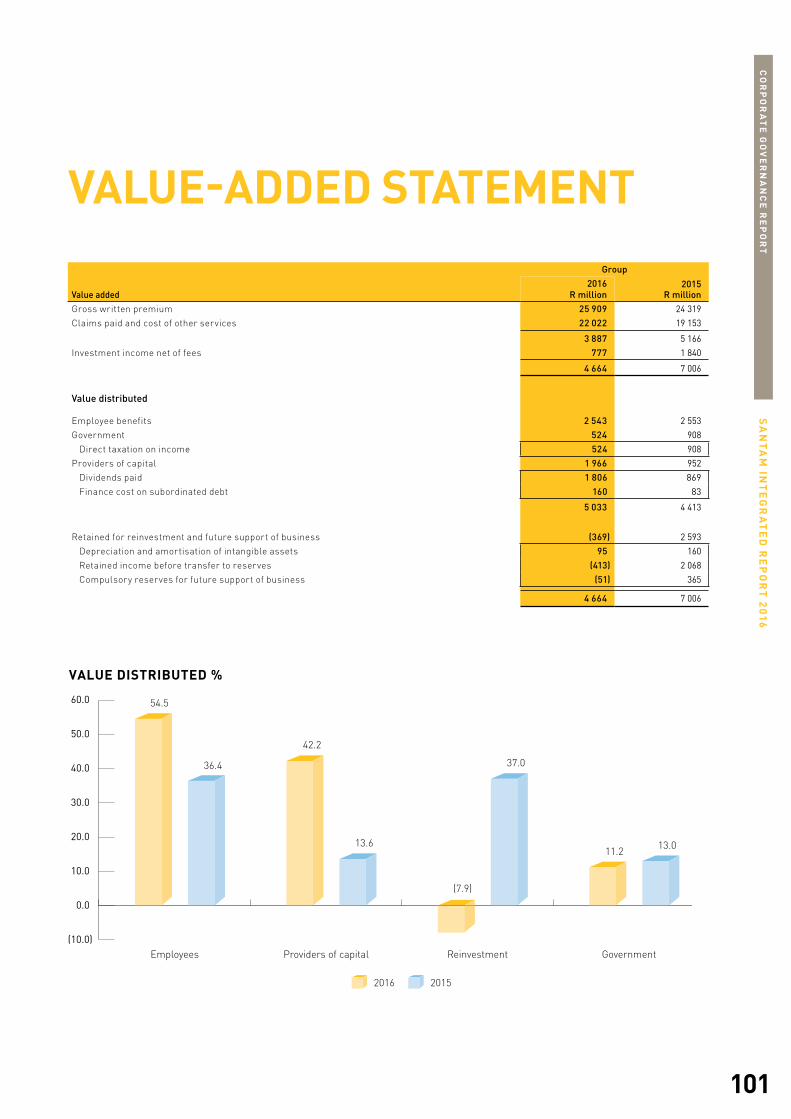
SA
NT
AM
INT
EG
RA
TE
D R
EP
OR
T 2
016
101
CO
RP
OR
AT
E G
OV
ER
NA
NC
E R
EP
OR
T
VALUE-ADDED STATEMENTGroup
Value added2016
R million2015
R millionGross written premium 25 909 24 319
Claims paid and cost of other services 22 022 19 153
3 887 5 166
Investment income net of fees 777 1 840
4 664 7 006
Value distributed
Employee benefits 2 543 2 553
Government 524 908
Direct taxation on income 524 908
Providers of capital 1 966 952
Dividends paid 1 806 869
Finance cost on subordinated debt 160 83
5 033 4 413
Retained for reinvestment and future support of business (369) 2 593
Depreciation and amortisation of intangible assets 95 160
Retained income before transfer to reserves (413) 2 068
Compulsory reserves for future support of business (51) 365
4 664 7 006
(10.0)
0.0
10.0
20.0
30.0
40.0
50.0
60.0
GovernmentReinvestmentProviders of capitalEmployees
54.5
36.4
42.2
13.6
(7.9)
37.0
11.2 13.0
2016 2015
VALUE DISTRIBUTED %

WE REDUCE RISK THROUGH COLLABORATION.Through our Risk and Resilience Programme we work in partnership with municipalities to identify risks such as fire and flooding. This initiative has enabled us to provide 53 local municipalities with disaster management tools. It is a reflection of our enduring commitment to creating better lives for all South Africans.

104
SA
NT
AM
INT
EG
RA
TE
D R
EP
OR
T 2
016
SU
MM
AR
Y C
ON
SO
LID
AT
ED
FIN
AN
CIA
L S
TA
TE
ME
NT
S
105 APPROVAL OF SUMMARY CONSOLIDATED FINANCIAL STATEMENTS
106 PREPARATION AND PRESENTATION OF SUMMARY CONSOLIDATED FINANCIAL STATEMENTS
106 SECRETARIAL CERTIFICATION
107 INDEPENDENT AUDITOR’S REPORT
108 SUMMARY CONSOLIDATED STATEMENT OF FINANCIAL POSITION
109 SUMMARY CONSOLIDATED STATEMENT OF COMPREHENSIVE INCOME
110 SUMMARY CONSOLIDATED STATEMENT OF CHANGES IN EQUITY
111 SUMMARY CONSOLIDATED STATEMENT OF CASH FLOWS
112 NOTES TO THE SUMMARY CONSOLIDATED FINANCIAL STATEMENTS
126 (I) ANALYSIS OF SHAREHOLDERS
127 (II) ANALYSIS OF DEBT SECURITY HOLDERS
SUMMARY CONSOLIDATED FINANCIAL STATEMENTS

105
SA
NT
AM
INT
EG
RA
TE
D R
EP
OR
T 2
016
SU
MM
AR
Y C
ON
SO
LID
AT
ED
FIN
AN
CIA
L S
TA
TE
ME
NT
S
APPROVAL OF SUMMARY CONSOLIDATED FINANCIAL STATEMENTS
TO THE SHAREHOLDERS OF SANTAM LTD RESPONSIBILITY FOR AND APPROVAL OF THE SUMMARY CONSOLIDATED FINANCIAL STATEMENTSThe board of Santam Ltd accepts responsibility for the integrity, objectivity and reliability of the group and company financial statements of
Santam Ltd. Adequate accounting records have been maintained. The board endorses the principle of transparency in financial reporting.
The responsibility for the preparation and presentation of the financial statements has been delegated to management.
The responsibility of the external auditors is to express an independent opinion on the fair presentation of the financial statements based on their
audit of Santam Ltd and its subsidiaries.
The board has confirmed that adequate internal financial control systems are being maintained. There were no breakdowns in the functioning
of the internal control systems during the year that had a material impact on the financial results. The board is satisfied that the summary
consolidated financial statements fairly present the financial position, the results of the operations and cash flows in accordance with
IAS 34 Interim Financial Reporting.
The board is of the opinion that Santam Ltd is financially sound and operates as a going concern. The financial statements have accordingly been
prepared on this basis.
The financial statements were authorised for issue and publication by the board and signed on their behalf by:
Grant Gelink Lizé LambrechtsChairman Chief executive officer
1 March 2017

106
SA
NT
AM
INT
EG
RA
TE
D R
EP
OR
T 2
016
SU
MM
AR
Y C
ON
SO
LID
AT
ED
FIN
AN
CIA
L S
TA
TE
ME
NT
S
PREPARATION AND PRESENTATION OF SUMMARY CONSOLIDATED FINANCIAL STATEMENTS
SECRETARIAL CERTIFICATION
The preparation of the summary consolidated financial statements was supervised by the chief financial officer of Santam Ltd,
Hennie Nel. The full set of annual financial statements are published on our website, or can be requested from the company secretary.
In accordance with section 88(2)(e) of the Companies Act, 71 of 2008 (the Act), it is hereby certified that the company has lodged with the Registrar
of Companies all such returns as are required of a public company in terms of the Act and that such returns are true, correct and up to date.
Masood AllieCompany secretary
1 March 2017

107
SA
NT
AM
INT
EG
RA
TE
D R
EP
OR
T 2
016
SU
MM
AR
Y C
ON
SO
LID
AT
ED
FIN
AN
CIA
L S
TA
TE
ME
NT
S
INDEPENDENT AUDITOR’S REPORT
TO THE SHAREHOLDERS OF SANTAM LTDOPINIONThe summary consolidated financial statements of Santam Ltd, set out on pages 108 to 125, which comprise the summary consolidated statement
of financial position as at 31 December 2016, the summary consolidated statements of comprehensive income, changes in equity and cash flows
for the year then ended, and related notes, are derived from the audited consolidated financial statements of Santam Ltd for the year ended
31 December 2016.
In our opinion, the accompanying summary consolidated financial statements are consistent, in all material respects, with the audited
consolidated financial statements, in accordance with the JSE Limited’s (JSE) requirements for summary financial statements, as set out
in note 1 to the summary consolidated financial statements, and the requirements of the Companies Act of South Africa as applicable to
summary financial statements.
SUMMARY CONSOLIDATED FINANCIAL STATEMENTS The summary consolidated financial statements do not contain all the disclosures required by International Financial Reporting Standards (IFRS)
and the requirements of the Companies Act of South Africa as applicable to annual financial statements. Reading the summary consolidated
financial statements and the auditor’s report thereon, therefore, is not a substitute for reading the audited consolidated financial statements
and the auditor’s report thereon.
THE AUDITED CONSOLIDATED FINANCIAL STATEMENTS AND OUR REPORT THEREONWe expressed an unmodified audit opinion on the audited consolidated financial statements in our report dated 1 March 2017. That report
also includes communication of key audit matters. Key audit matters are those matters that, in our professional judgement, were of most
significance in our audit of the consolidated financial statements of the current period.
DIRECTORS’ RESPONSIBILITY FOR THE SUMMARY CONSOLIDATED FINANCIAL STATEMENTSThe directors are responsible for the preparation of the summary consolidated financial statements in accordance with the requirements
of the JSE’s requirements for summary financial statements, set out in note 1 to the summary consolidated financial statements, and the
requirements of the Companies Act of South Africa as applicable to summary financial statements.
AUDITOR’S RESPONSIBILITYOur responsibility is to express an opinion on whether the summary consolidated financial statements are consistent, in all material respects,
with the audited consolidated financial statements based on our procedures, which were conducted in accordance with International Standard
on Auditing (ISA) 810 (Revised) – Engagements to Report on Summary Financial Statements.
PricewaterhouseCoopers IncDirector: Zuhdi Abrahams
Registered auditor
Cape Town
1 March 2017

108
SA
NT
AM
INT
EG
RA
TE
D R
EP
OR
T 2
016
SU
MM
AR
Y C
ON
SO
LID
AT
ED
FIN
AN
CIA
L S
TA
TE
ME
NT
S
SUMMARY CONSOLIDATED STATEMENT OF FINANCIAL POSITIONAudited at Audited at
31 December 2016 31 December 2015Notes R million R million
ASSETSNon-current assets
Property and equipment 106 90 Intangible assets 885 827 Deferred income tax 105 140 Investment in associates and joint ventures 1 536 252 Financial assets at fair value through income
Equity securities 6 2 581 2 730 Debt securities 6 10 849 9 721
Reinsurance assets 7 140 164 Deposit with cell owner 163 187Total non-current assets 16 365 14 111
Current assetsCell owners’ interest 7 6 Financial assets at fair value through income
Derivatives 6 1 2 Short-term money market instruments 6 1 361 2 281
Reinsurance assets 7 4 349 3 514 Deposit with cell owner 56 67Deferred acquisition costs 469 525 Loans and receivables including insurance receivables 6 3 754 3 449Income tax assets 19 13 Cash and cash equivalents 2 887 3 349Non-current assets held for sale 8 8 541 Total current assets 12 911 13 747
Total assets 29 276 27 858
EQUITY AND LIABILITIESCapital and reserves attributable to the company’s equity holders
Share capital 103 103 Treasury shares (472) (450) Other reserves (41) 548Distributable reserves 7 286 7 880
6 876 8 081Non-controlling interest 469 466 Total equity 7 345 8 547
Non-current liabilitiesDeferred income tax 101 107Financial liabilities at fair value through income
Debt securities 6 2 005 974 Derivatives 6 – 1
Cell owners’ interest 1 153 980 Insurance liabilities 7 1 312 1 525 Reinsurance liability relating to cell owners 163 187Total non-current liabilities 4 734 3 774
Current liabilitiesFinancial liabilities at fair value through income
Debt securities 6 48 24 Investment contracts 6 101 70
Financial liabilities at amortised costCollateral guarantee contracts 123 105
Insurance liabilities 7 12 284 11 139 Reinsurance liability relating to cell owners 56 67Deferred reinsurance acquisition revenue 273 280 Provisions for other liabilities and charges 71 122 Trade and other payables including insurance payables 4 093 3 412Current income tax liabilities 148 318 Total current liabilities 17 197 15 537
Total liabilities 21 931 19 311
Total shareholders’ equity and liabilities 29 276 27 858

109
SA
NT
AM
INT
EG
RA
TE
D R
EP
OR
T 2
016
SU
MM
AR
Y C
ON
SO
LID
AT
ED
FIN
AN
CIA
L S
TA
TE
ME
NT
S
SUMMARY CONSOLIDATED STATEMENT OF COMPREHENSIVE INCOMEAudited Audited
Year ended Year ended31 December 2016 31 December 2015
Notes R million R million Change
Gross written premium 25 909 24 319 7%Less: reinsurance written premium 6 137 5 435 Net written premium 19 772 18 884 5%Less: change in unearned premium
Gross amount 137 528Reinsurers’ share (191) (167)
Net insurance premium revenue 19 826 18 523 7%
Investment income 9 777 1 210 (36%)Income from reinsurance contracts ceded 1 337 1 236 Net gains on financial assets and liabilities at fair value through income 9 42 235 Investment income and fair value losses on financial assets held for sale 9 13 –Net income 21 995 21 204 4%
Insurance claims and loss adjustment expenses 17 100 13 980 Insurance claims and loss adjustment expenses recovered from reinsurers (4 189) (2 470) Net insurance benefits and claims 12 911 11 510 12%
Expenses for the acquisition of insurance contracts 3 716 3 240 Expenses for marketing and administration 3 247 3 277 Expenses for investment-related activities 70 53 Amortisation and impairment of intangible assets 51 117 Total expenses 19 995 18 197 10%
Results of operating activities 2 000 3 007 (33%)Finance costs (212) (116) Net income from associates and joint ventures 67 53 Profit on sale of associated companies 11 – 413 Profit on sale of subsidiary 11 – 15 Profit before tax 1 855 3 372 (45%)Income tax expense 10 (524) (908) Profit for the year 1 331 2 464 (46%)
Other comprehensive income, net of taxItems that may subsequently be reclassified to income:
Currency translation differences (197) 163 Share of associates’ currency translation differences (255) –Hedging reserve movement (140) 134 Tax on hedging reserve movement – (37)
Total comprehensive income for the year 739 2 724 (73%)
Profit attributable to:– equity holders of the company 1 212 2 348 (48%)– non-controlling interest 119 116
1 331 2 464
Total comprehensive income attributable to:– equity holders of the company 620 2 608 (76%)– non-controlling interest 119 116
739 2 724
Earnings attributable to equity shareholders
Earnings per share (cents) 12Basic earnings per share 1 100 2 090 (47%)Diluted earnings per share 1 088 2 065 (47%)
Weighted average number of ordinary shares (millions) 110.21 112.34 Weighted average number of ordinary shares for diluted earnings per share (millions) 111.37 113.72
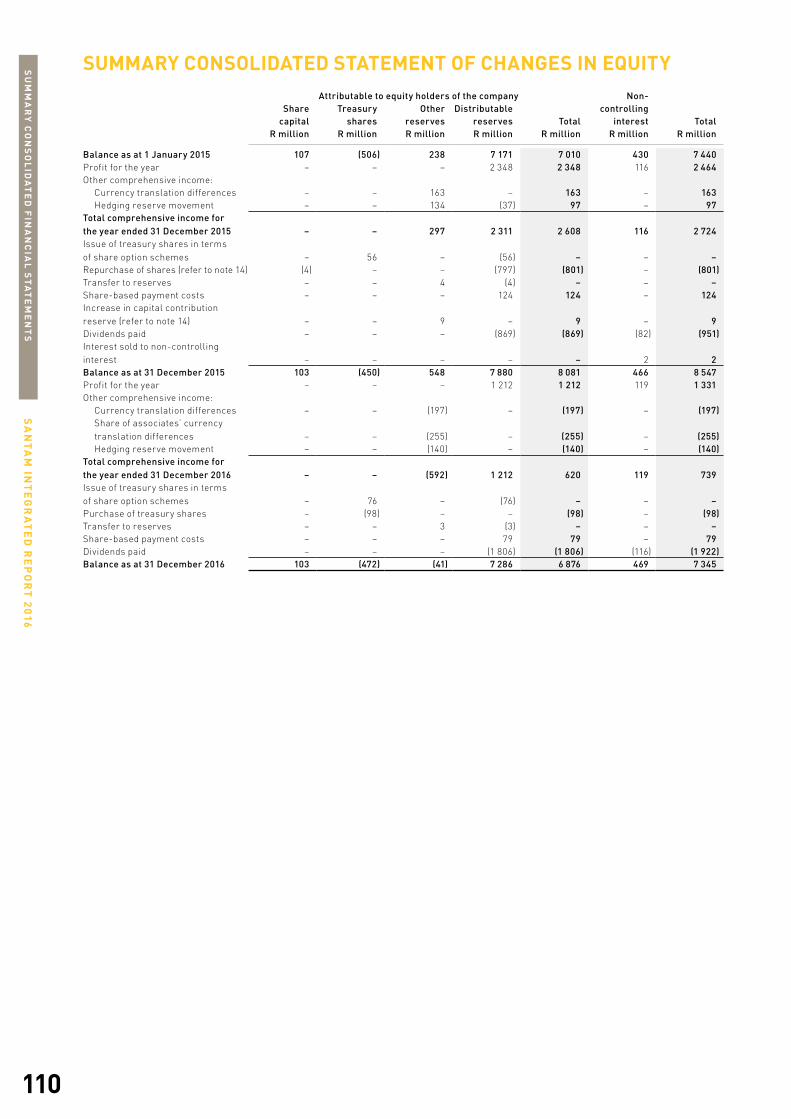
110
SA
NT
AM
INT
EG
RA
TE
D R
EP
OR
T 2
016
SU
MM
AR
Y C
ON
SO
LID
AT
ED
FIN
AN
CIA
L S
TA
TE
ME
NT
S
SUMMARY CONSOLIDATED STATEMENT OF CHANGES IN EQUITYAttributable to equity holders of the company Non-
Share Treasury Other Distributable controllingcapital shares reserves reserves Total interest Total
R million R million R million R million R million R million R million
Balance as at 1 January 2015 107 (506) 238 7 171 7 010 430 7 440 Profit for the year – – – 2 348 2 348 116 2 464 Other comprehensive income:
Currency translation differences – – 163 – 163 – 163 Hedging reserve movement – – 134 (37) 97 – 97
Total comprehensive income for the year ended 31 December 2015 – – 297 2 311 2 608 116 2 724 Issue of treasury shares in terms of share option schemes – 56 – (56) – – – Repurchase of shares (refer to note 14) (4) – – (797) (801) – (801)Transfer to reserves – – 4 (4) – – – Share-based payment costs – – – 124 124 – 124 Increase in capital contribution reserve (refer to note 14) – – 9 – 9 – 9 Dividends paid – – – (869) (869) (82) (951)Interest sold to non-controlling interest – – – – – 2 2 Balance as at 31 December 2015 103 (450) 548 7 880 8 081 466 8 547 Profit for the year – – – 1 212 1 212 119 1 331 Other comprehensive income:
Currency translation differences – – (197) – (197) – (197)Share of associates’ currency translation differences – – (255) – (255) – (255)Hedging reserve movement – – (140) – (140) – (140)
Total comprehensive income for the year ended 31 December 2016 – – (592) 1 212 620 119 739 Issue of treasury shares in terms of share option schemes – 76 – (76) – – – Purchase of treasury shares – (98) – – (98) – (98)Transfer to reserves – – 3 (3) – – – Share-based payment costs – – – 79 79 – 79Dividends paid – – – (1 806) (1 806) (116) (1 922)Balance as at 31 December 2016 103 (472) (41) 7 286 6 876 469 7 345
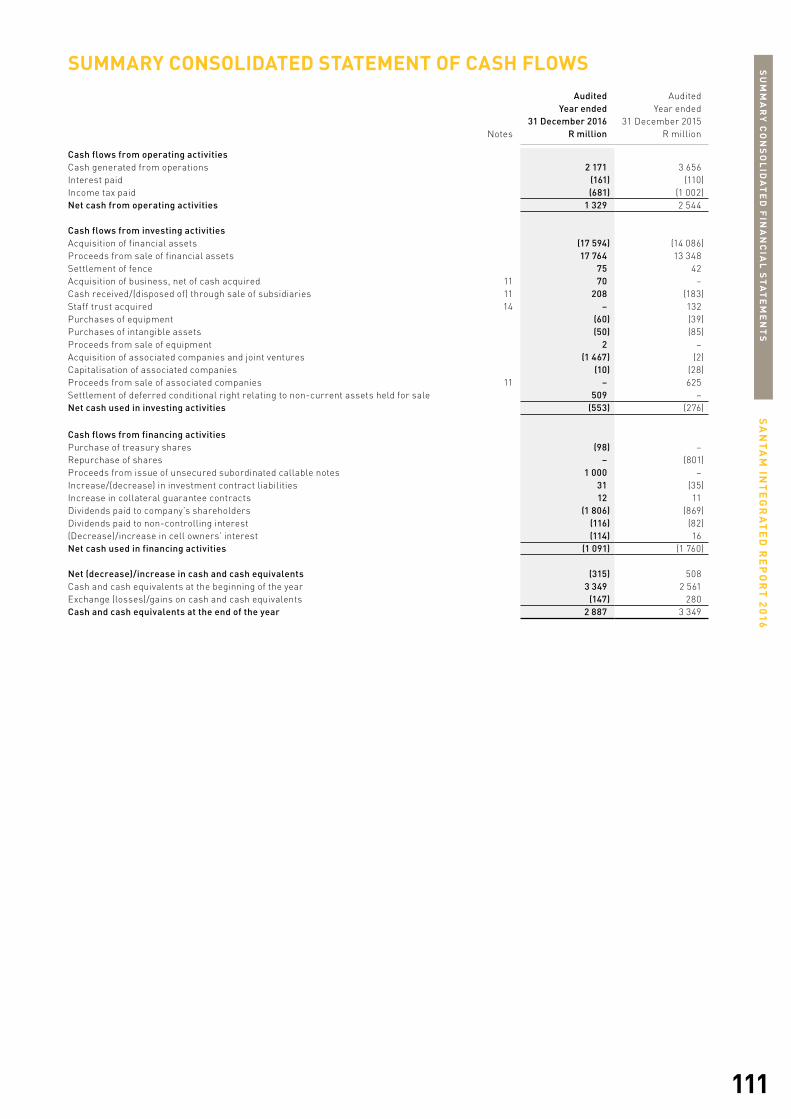
111
SA
NT
AM
INT
EG
RA
TE
D R
EP
OR
T 2
016
SU
MM
AR
Y C
ON
SO
LID
AT
ED
FIN
AN
CIA
L S
TA
TE
ME
NT
S
SUMMARY CONSOLIDATED STATEMENT OF CASH FLOWSAudited Audited
Year ended Year ended31 December 2016 31 December 2015
Notes R million R million
Cash flows from operating activitiesCash generated from operations 2 171 3 656 Interest paid (161) (110)Income tax paid (681) (1 002)Net cash from operating activities 1 329 2 544
Cash flows from investing activitiesAcquisition of financial assets (17 594) (14 086)Proceeds from sale of financial assets 17 764 13 348 Settlement of fence 75 42 Acquisition of business, net of cash acquired 11 70 –Cash received/(disposed of) through sale of subsidiaries 11 208 (183)Staff trust acquired 14 – 132 Purchases of equipment (60) (39)Purchases of intangible assets (50) (85)Proceeds from sale of equipment 2 – Acquisition of associated companies and joint ventures (1 467) (2)Capitalisation of associated companies (10) (28)Proceeds from sale of associated companies 11 – 625 Settlement of deferred conditional right relating to non-current assets held for sale 509 – Net cash used in investing activities (553) (276)
Cash flows from financing activitiesPurchase of treasury shares (98) – Repurchase of shares – (801)Proceeds from issue of unsecured subordinated callable notes 1 000 – Increase/(decrease) in investment contract liabilities 31 (35)Increase in collateral guarantee contracts 12 11 Dividends paid to company’s shareholders (1 806) (869)Dividends paid to non-controlling interest (116) (82)(Decrease)/increase in cell owners’ interest (114) 16 Net cash used in financing activities (1 091) (1 760)
Net (decrease)/increase in cash and cash equivalents (315) 508 Cash and cash equivalents at the beginning of the year 3 349 2 561 Exchange (losses)/gains on cash and cash equivalents (147) 280 Cash and cash equivalents at the end of the year 2 887 3 349

112
SA
NT
AM
INT
EG
RA
TE
D R
EP
OR
T 2
016
SU
MM
AR
Y C
ON
SO
LID
AT
ED
FIN
AN
CIA
L S
TA
TE
ME
NT
S
NOTES TO THE SUMMARY CONSOLIDATED FINANCIAL STATEMENTS1. Basis of preparation
The summary consolidated financial statements are prepared in accordance with the requirements of the JSE for summary financial statements, and the requirements of the Companies Act applicable to summary financial statements. The JSE requires summary financial statements to be prepared in accordance with the framework concepts and the measurement and recognition requirements of IFRS and the SAICA Financial Reporting Guides as issued by the Accounting Practices Committee and Financial Pronouncements as issued by the Financial Reporting Standards Council and to also, as a minimum, contain the information required by IAS 34 – Interim Financial Reporting.
2. Accounting policiesThe accounting policies applied in the preparation of the consolidated financial statements from which the summary consolidated financial statements were derived are in terms of IFRS and are consistent with those accounting policies applied in the preparation of the previous consolidated annual financial statements, except for:
The following new IFRSs and/or IFRICs were effective for the first time from 1 January 2016: – Amendments to IFRS 10 and IAS 28 – Investment entities: Applying the consolidation exemption – Amendments to IFRS 11 – Joint arrangements – IFRS 14 – Regulatory deferral accounts – Amendments to IAS 1 – Disclosure initiative – Amendments to IAS 16 and IAS 38 – Clarification of acceptable methods of depreciation and amortisation – Amendments to IAS 16 and IAS 41 – Agriculture: Bearer plants – Amendment to IAS 27 – Equity method in separate financial statements – Annual Improvements 2012 –14 cycle
There was no material impact on the summary consolidated financial statements identified.
3. EstimatesThe preparation of summary consolidated financial statements requires management to make judgements, estimates and assumptions that affect the application of accounting policies and the reported amounts of assets and liabilities, income and expenses. Actual results may differ from these estimates.
In preparing this summary consolidated financial statements, the significant judgements made by management in applying the group’s accounting policies and the key sources of estimation uncertainty are the same as those that applied to the consolidated annual financial statements for the year ended 31 December 2016. There have been no changes since 31 December 2015.
4. Risk managementThe group’s activities expose it to a variety of financial risks: market risk (including price risk, interest rate risk, foreign currency risk and derivatives risk), credit risk and liquidity risk. Insurance activities expose the group to insurance risk (including pricing risk, reserving risk, accumulation risk and reinsurance risk). The group is also exposed to operational risk and legal risk.
The capital risk management philosophy is to maximise the return on shareholders’ capital within an appropriate risk framework.
The summary consolidated financial statements do not include all risk management information and disclosure required in the annual financial statements and should be read in conjunction with the group’s annual financial statements as at 31 December 2016.
There have been no material changes in the risk management policies since 31 December 2015.

113
SA
NT
AM
INT
EG
RA
TE
D R
EP
OR
T 2
016
SU
MM
AR
Y C
ON
SO
LID
AT
ED
FIN
AN
CIA
L S
TA
TE
ME
NT
S
5. Segment informationOperating segments are reported in a manner consistent with the internal reporting provided to the chief operating decision-maker. The chief operating decision-maker, who is responsible for allocating resources and assessing performance of the operating segments, has been identified as the chief executive officer, supported by the group executive committee.
The group conducts mainly insurance, investment and strategic diversification activities.
Insurance activities are all core general insurance and reinsurance underwriting activities undertaken by the group and are analysed by insurance class. Operating segments are aggregated based on quantitative and/or qualitative significance. The performance of insurance activities is based on gross written premium as a measure of growth, with net underwriting result as measure of profitability.
Investment activities are all investment-related activities undertaken by the group. Due to the nature of the activities conducted, investment activities are considered to be one operating segment. Investment activities are measured based on net investment income (excluding net investment income generated by strategic activities).
Strategic diversification activities relate to all strategic investing activities where the purpose of the activities is to obtain certain diversification benefits. The investments in SEM target shares, associates and joint ventures are included in this segment. This segment was included in 2016, subsequent to the acquisition of the shareholding in SAN JV. The segment report was amended to also provide the comparative information relating to SEM. Strategic diversification activities are measured based on net investment income from SEM target share investments and net income from associated companies and joint ventures.
Growth is measured based on the gross written premium generated by the underlying businesses. The underwriting and investment return on insurance funds are provided for each of the underlying components included in the strategic diversification segment for consideration by the chief operating decision-maker. As this information is considered to be a reallocation of fair value movements recognised on the SEM target shares as well as equity-accounted earnings on the investments in associated companies and joint ventures, it is also included as reconciling items in order to reconcile to the consolidated statement of comprehensive income. Overall profitability is measured based on net investment income and fair value movements from SEM target share investments and net income from associated companies and joint ventures.
Given the nature of the operations, there is no single external client that provides 10% or more of the group’s revenues.
The investment return on insurance funds is calculated based on the day-weighted effective return realised by the group on the assets held to cover the group’s net insurance working capital requirements.
Insurance business denominated in foreign currencies is covered by foreign denominated bank accounts and investment portfolios. Foreign exchange movements on underwriting activities are therefore offset against the foreign exchange movements recognised on the bank accounts and investment portfolios.
The Santam BEE transaction costs are unrelated to the core underwriting, investment or strategic diversification performance of the group. Therefore, these costs are disclosed as unallocated activities.
Santam Ltd is domiciled in South Africa. Geographical analysis of the gross written premium and non-current assets and liabilities is based on the countries in which the business is underwritten or managed. Non-current assets comprise goodwill and intangible assets, property and equipment, investments in associates and joint ventures and SEM target shares (included in financial instruments).

114
SA
NT
AM
INT
EG
RA
TE
D R
EP
OR
T 2
016
SU
MM
AR
Y C
ON
SO
LID
AT
ED
FIN
AN
CIA
L S
TA
TE
ME
NT
S
5. Segment information (continued)5.1 For the year ended 31 December 2016
Business activity
Insurance InvestmentStrategic
diversification TotalReconciling and
unallocated IFRS total
R million R million R million R million R million R million
Revenue 25 909 418 1 939 28 266 (2 357) 25 909Gross written premium 25 909 – 1 939 27 848 (1 939) 25 909 Net written premium 19 772 – 1 477 21 249 (1 477) 19 772 Net earned premium 19 826 – 1 414 21 240 (1 414) 19 826 Net claims incurred 12 911 – 982 13 893 (982) 12 911 Net commission 2 379 – 121 2 500 (121) 2 379 Management expenses (excluding BEE costs)2 3 268 – 347 3 615 (347) 3 268 Underwriting result 1 268 – (36) 1 232 36 1 268 Investment return on insurance funds 619 – 180 799 (180) 619 Net insurance result 1 887 – 144 2 031 (144) 1 887 Reallocation of net insurance results1 – – (144) (144) 144 – Investment income/(losses) net of investment-related fees and finance costs – 136 (205) (69) – (69)Income from associates and joint ventures – – 67 67 – 67 Santam BEE costs – – – – (9) (9)Amortisation and impairment of intangible assets2 (21) – – (21) – (21)Income before taxation 1 866 136 (138) 1 864 (9) 1 855
1 Reconciling items consist of the reallocation of net insurance results relating to the underlying investments included in strategic diversification activities for management reporting purposes.
2 Amortisation of computer software included as part of management expenses.
Gross written Underwriting premium result R million R million
Insurance activitiesThe group’s insurance activities are spread over various classes of general insurance.
Accident and health 374 49 Alternative risk 2 406 16 Crop 984 69 Engineering 1 196 196 Guarantee 86 (31)Liability 1 202 301 Miscellaneous 9 (3)Motor 11 004 622 Property 7 972 22 Transportation 676 27 Total 25 909 1 268
Comprising:Commercial insurance 13 330 735 Personal insurance 10 173 517 Alternative risk 2 406 16 Total 25 909 1 268
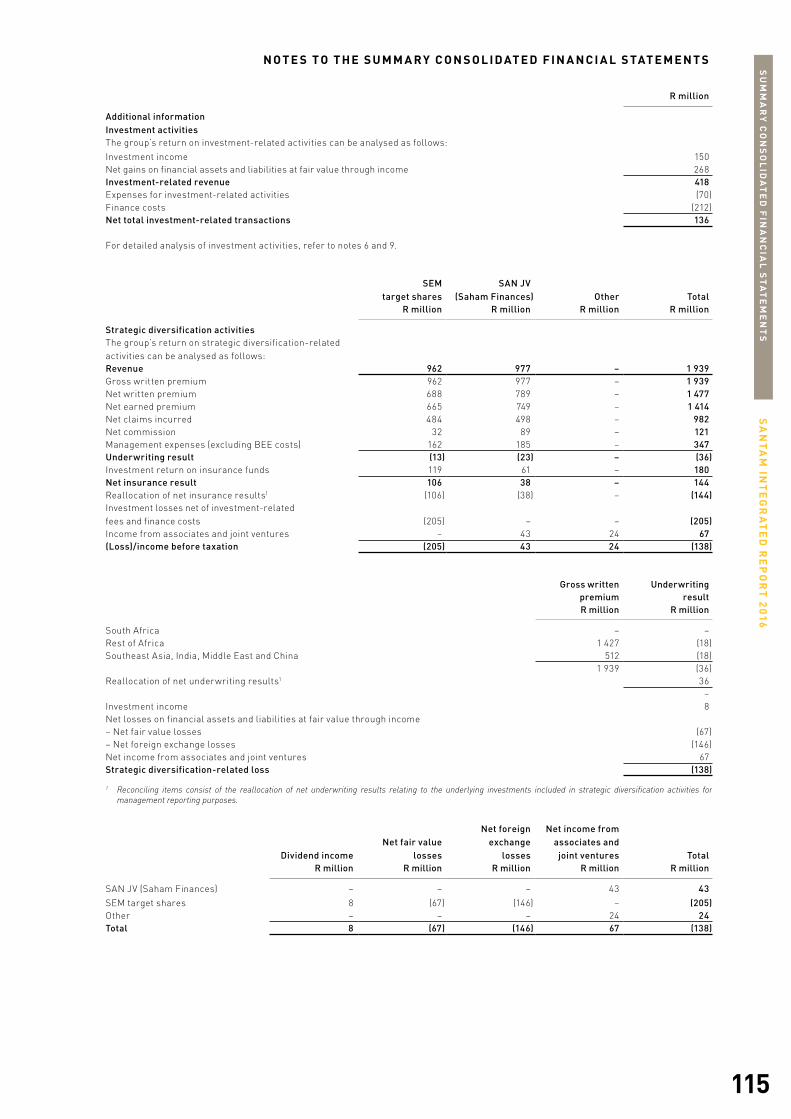
115
SA
NT
AM
INT
EG
RA
TE
D R
EP
OR
T 2
016
SU
MM
AR
Y C
ON
SO
LID
AT
ED
FIN
AN
CIA
L S
TA
TE
ME
NT
S
N O T E S T O T H E S U M M A RY C O N S O L I D AT E D F I N A N C I A L S TAT E M E N T S
R million
Additional informationInvestment activitiesThe group’s return on investment-related activities can be analysed as follows:
Investment income 150 Net gains on financial assets and liabilities at fair value through income 268Investment-related revenue 418 Expenses for investment-related activities (70)Finance costs (212)Net total investment-related transactions 136
For detailed analysis of investment activities, refer to notes 6 and 9.
SEMtarget shares
SAN JV (Saham Finances) Other Total
R million R million R million R million
Strategic diversification activitiesThe group’s return on strategic diversification-related activities can be analysed as follows:Revenue 962 977 – 1 939 Gross written premium 962 977 – 1 939 Net written premium 688 789 – 1 477 Net earned premium 665 749 – 1 414 Net claims incurred 484 498 – 982 Net commission 32 89 – 121 Management expenses (excluding BEE costs) 162 185 – 347 Underwriting result (13) (23) – (36)Investment return on insurance funds 119 61 – 180 Net insurance result 106 38 – 144 Reallocation of net insurance results1 (106) (38) – (144)Investment losses net of investment-related fees and finance costs (205) – – (205)Income from associates and joint ventures – 43 24 67 (Loss)/income before taxation (205) 43 24 (138)
Gross written Underwriting premium result R million R million
South Africa – – Rest of Africa 1 427 (18)Southeast Asia, India, Middle East and China 512 (18)
1 939 (36)Reallocation of net underwriting results1 36
– Investment income 8 Net losses on financial assets and liabilities at fair value through income– Net fair value losses (67)– Net foreign exchange losses (146)Net income from associates and joint ventures 67 Strategic diversification-related loss (138)
1 Reconciling items consist of the reallocation of net underwriting results relating to the underlying investments included in strategic diversification activities for management reporting purposes.
Dividend income Net fair value
losses
Net foreignexchange
losses
Net income fromassociates and joint ventures Total
R million R million R million R million R million
SAN JV (Saham Finances) – – – 43 43 SEM target shares 8 (67) (146) – (205)Other – – – 24 24 Total 8 (67) (146) 67 (138)

116
SA
NT
AM
INT
EG
RA
TE
D R
EP
OR
T 2
016
SU
MM
AR
Y C
ON
SO
LID
AT
ED
FIN
AN
CIA
L S
TA
TE
ME
NT
S
5. Segment information (continued)5.2 For the year ended 31 December 2015 (restated)
Business activityInsurance Investment
Strategicdiversification Total
Reconciling andunallocated IFRS total
R million R million R million R million R million R million
Revenue 24 319 772 675 25 766 (1 447) 24 319Gross written premium 24 319 – 675 24 994 (675) 24 319 Net written premium 18 884 – 494 19 378 (494) 18 884 Net earned premium 18 523 – 499 19 022 (499) 18 523 Net claims incurred 11 510 – 397 11 907 (397) 11 510 Net commission 2 004 – 19 2 023 (19) 2 004 Management expenses (excluding BEE costs)2 3 230 – 103 3 333 (103) 3 230 Underwriting result 1 779 – (20) 1 759 20 1 779 Investment return on insurance funds 499 – 79 578 (79) 499 Net insurance result 2 278 – 59 2 337 (59) 2 278 Reallocation of net insurance results1 – – (59) (59) 59 – Investment income net of investment-related fees and finance costs – 603 174 777 – 777 Income from associates including profit on sale – – 466 466 – 466 Profit on sale of subsidiary – – 15 15 – 15 Santam BEE costs – – – – (71) (71)Amortisation and impairment of intangible assets2 (93) – – (93) – (93)Income before taxation 2 185 603 655 3 443 (71) 3 372
1 Reconciling items consist of the reallocation of net insurance results relating to the underlying investments included in strategic diversification activities for management reporting purposes.
2 Amortisation of computer software included as part of management expenses.
Gross written Underwriting premium1 result1
R million R million
Insurance activitiesThe group’s insurance activities are spread over various classes of general insurance.
Accident and health 371 60 Alternative risk 2 248 20 Crop 840 131 Engineering 1 176 216 Guarantee 149 13 Liability 1 327 234 Miscellaneous 62 11 Motor 10 247 673 Property 7 213 330 Transportation 686 91 Total 24 319 1 779
Comprising:Commercial insurance 12 665 1 195 Personal insurance 9 406 564
Alternative risk 2 248 20 Total 24 319 1 779
1 The following reclassifications between insurance classes were made as a result of more granular information becoming available: a decrease of R477 million in gross written premium for commercial lines and a corresponding increase of R477 million in gross written premium for personal lines; a decrease of R36 million in underwriting result for commercial lines and a corresponding increase of R36 million in underwriting result for personal lines.

117
SA
NT
AM
INT
EG
RA
TE
D R
EP
OR
T 2
016
SU
MM
AR
Y C
ON
SO
LID
AT
ED
FIN
AN
CIA
L S
TA
TE
ME
NT
S
N O T E S T O T H E S U M M A RY C O N S O L I D AT E D F I N A N C I A L S TAT E M E N T S
R million
Additional informationInvestment activitiesThe group’s return on investment-related activities can be analysed as follows:
Investment income 689Net gains on financial assets and liabilities at fair value through income 83 Investment-related revenue 772Expenses for investment-related activities (53)Finance costs (116)Net total investment-related transactions 603
For detailed analysis of investment activities, refer to notes 6 and 9.
SEMtarget shares Other Total
R million R million R million
Strategic diversification activitiesThe group’s return on strategic diversification-related activities can be analysed as follows:
Revenue 675 – 675 Gross written premium 675 – 675 Net written premium 494 – 494 Net earned premium 499 – 499 Net claims incurred 397 – 397 Net commission 19 – 19 Management expenses (excluding BEE costs) 103 – 103 Underwriting result (20) – (20)Investment return on insurance funds 79 – 79 Net insurance result 59 – 59 Reallocation of net insurance results1 (59) – (59)Investment income net of investment-related fees and finance costs 174 – 174Income from associates and joint ventures including profit on sale – 466 466 Profit on sale of subsidiary – 15 15 Income before taxation 174 481 655
Gross written Underwriting premium result R million R million
South Africa – – Rest of Africa 272 (3)Southeast Asia, India, Middle East and China 403 (17)
675 (20)Reallocation of net underwriting results1 20
– Investment income 22 Net gains on financial assets and liabilities at fair value through income – Net fair value gains 47– Net foreign exchange gains 105Net income from associates and joint ventures 53 Profit on sale of associates 413 Profit on sale of subsidiary 15 Strategic diversification-related revenue 655
1 Reconciling items consist of the reallocation of net underwriting results relating to the underlying investments included in strategic diversification activities for management reporting purposes.
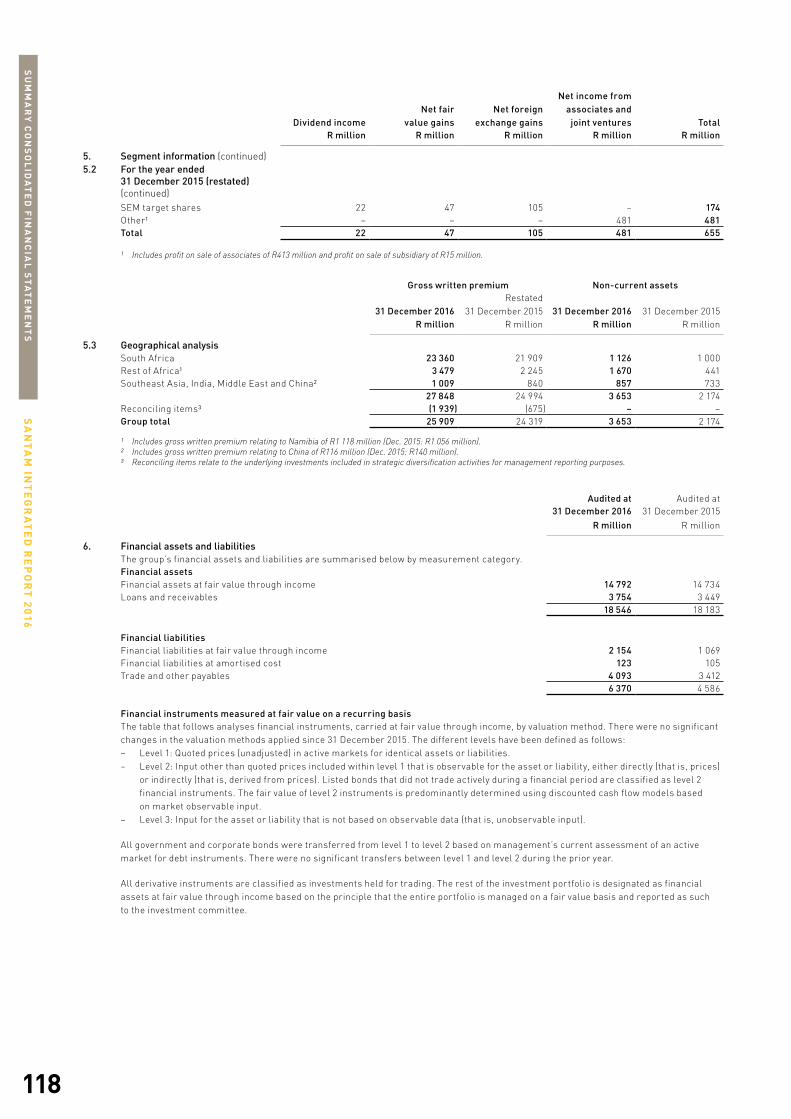
118
SA
NT
AM
INT
EG
RA
TE
D R
EP
OR
T 2
016
SU
MM
AR
Y C
ON
SO
LID
AT
ED
FIN
AN
CIA
L S
TA
TE
ME
NT
S
Dividend income Net fair
value gains Net foreign
exchange gains
Net income fromassociates and joint ventures Total
R million R million R million R million R million
5. Segment information (continued)5.2 For the year ended
31 December 2015 (restated) (continued)SEM target shares 22 47 105 – 174Other1 – – – 481 481Total 22 47 105 481 655
1 Includes profit on sale of associates of R413 million and profit on sale of subsidiary of R15 million.
Gross written premium Non-current assets
31 December 2016 Restated
31 December 2015 31 December 2016 31 December 2015 R million R million R million R million
5.3 Geographical analysisSouth Africa 23 360 21 909 1 126 1 000 Rest of Africa1 3 479 2 245 1 670 441 Southeast Asia, India, Middle East and China2 1 009 840 857 733
27 848 24 994 3 653 2 174 Reconciling items3 (1 939) (675) – –Group total 25 909 24 319 3 653 2 174
1 Includes gross written premium relating to Namibia of R1 118 million (Dec. 2015: R1 056 million).2 Includes gross written premium relating to China of R116 million (Dec. 2015: R140 million).3 Reconciling items relate to the underlying investments included in strategic diversification activities for management reporting purposes.
Audited at Audited at31 December 2016 31 December 2015
R million R million
6. Financial assets and liabilitiesThe group’s financial assets and liabilities are summarised below by measurement category.Financial assetsFinancial assets at fair value through income 14 792 14 734 Loans and receivables 3 754 3 449
18 546 18 183
Financial liabilities Financial liabilities at fair value through income 2 154 1 069Financial liabilities at amortised cost 123 105Trade and other payables 4 093 3 412
6 370 4 586
Financial instruments measured at fair value on a recurring basisThe table that follows analyses financial instruments, carried at fair value through income, by valuation method. There were no significant changes in the valuation methods applied since 31 December 2015. The different levels have been defined as follows:
– Level 1: Quoted prices (unadjusted) in active markets for identical assets or liabilities. – Level 2: Input other than quoted prices included within level 1 that is observable for the asset or liability, either directly (that is, prices)
or indirectly (that is, derived from prices). Listed bonds that did not trade actively during a financial period are classified as level 2 financial instruments. The fair value of level 2 instruments is predominantly determined using discounted cash flow models based on market observable input.
– Level 3: Input for the asset or liability that is not based on observable data (that is, unobservable input).
All government and corporate bonds were transferred from level 1 to level 2 based on management’s current assessment of an active market for debt instruments. There were no significant transfers between level 1 and level 2 during the prior year.
All derivative instruments are classified as investments held for trading. The rest of the investment portfolio is designated as financial assets at fair value through income based on the principle that the entire portfolio is managed on a fair value basis and reported as such to the investment committee.
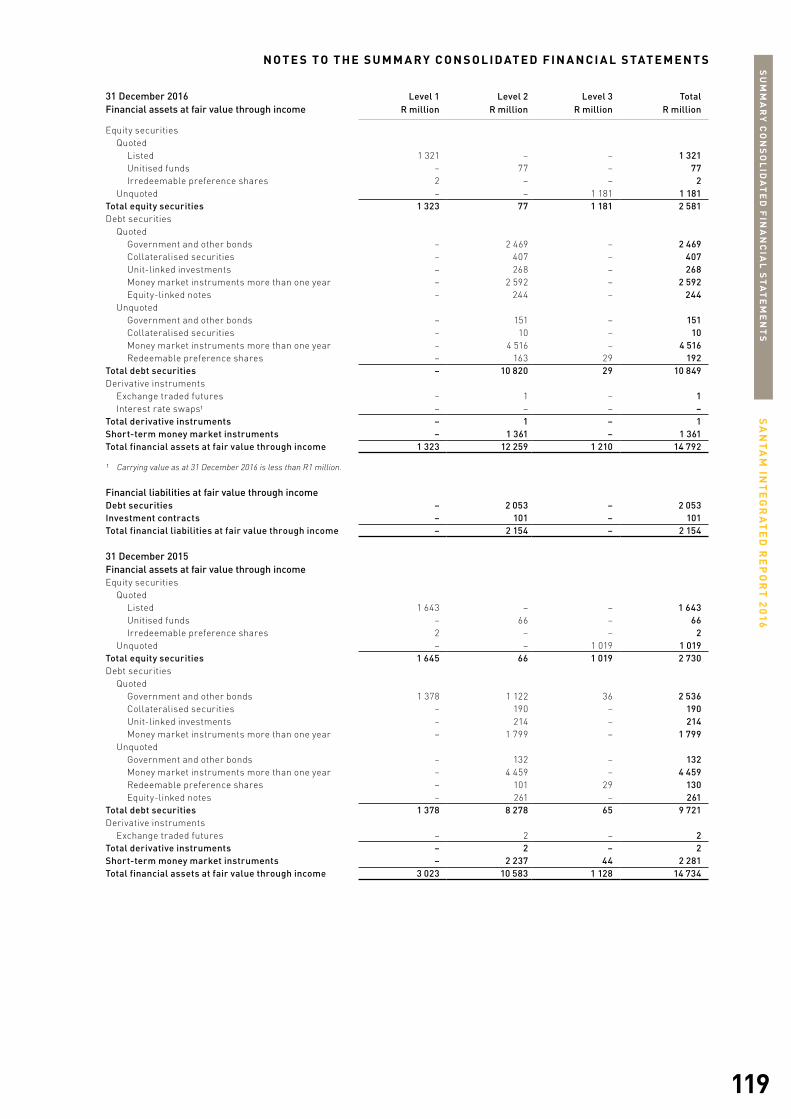
119
SA
NT
AM
INT
EG
RA
TE
D R
EP
OR
T 2
016
SU
MM
AR
Y C
ON
SO
LID
AT
ED
FIN
AN
CIA
L S
TA
TE
ME
NT
S
N O T E S T O T H E S U M M A RY C O N S O L I D AT E D F I N A N C I A L S TAT E M E N T S
31 December 2016 Level 1 Level 2 Level 3 TotalFinancial assets at fair value through income R million R million R million R million
Equity securitiesQuoted
Listed 1 321 – – 1 321 Unitised funds – 77 – 77Irredeemable preference shares 2 – – 2
Unquoted – – 1 181 1 181Total equity securities 1 323 77 1 181 2 581 Debt securities
QuotedGovernment and other bonds – 2 469 – 2 469 Collateralised securities – 407 – 407 Unit-linked investments – 268 – 268 Money market instruments more than one year – 2 592 – 2 592 Equity-linked notes – 244 – 244
UnquotedGovernment and other bonds – 151 – 151 Collateralised securities – 10 – 10 Money market instruments more than one year – 4 516 – 4 516 Redeemable preference shares – 163 29 192
Total debt securities – 10 820 29 10 849 Derivative instruments
Exchange traded futures – 1 – 1 Interest rate swaps1 – – – –
Total derivative instruments – 1 – 1 Short-term money market instruments – 1 361 – 1 361 Total financial assets at fair value through income 1 323 12 259 1 210 14 792
1 Carrying value as at 31 December 2016 is less than R1 million.
Financial liabilities at fair value through incomeDebt securities – 2 053 – 2 053 Investment contracts – 101 – 101 Total financial liabilities at fair value through income – 2 154 – 2 154
31 December 2015Financial assets at fair value through incomeEquity securities
QuotedListed 1 643 – – 1 643 Unitised funds – 66 – 66 Irredeemable preference shares 2 – – 2
Unquoted – – 1 019 1 019 Total equity securities 1 645 66 1 019 2 730 Debt securities
QuotedGovernment and other bonds 1 378 1 122 36 2 536 Collateralised securities – 190 – 190 Unit-linked investments – 214 – 214 Money market instruments more than one year – 1 799 – 1 799
UnquotedGovernment and other bonds – 132 – 132 Money market instruments more than one year – 4 459 – 4 459 Redeemable preference shares – 101 29 130 Equity-linked notes – 261 – 261
Total debt securities 1 378 8 278 65 9 721 Derivative instruments
Exchange traded futures – 2 – 2 Total derivative instruments – 2 – 2 Short-term money market instruments – 2 237 44 2 281 Total financial assets at fair value through income 3 023 10 583 1 128 14 734

120
SA
NT
AM
INT
EG
RA
TE
D R
EP
OR
T 2
016
SU
MM
AR
Y C
ON
SO
LID
AT
ED
FIN
AN
CIA
L S
TA
TE
ME
NT
S
Level 1 Level 2 Level 3 TotalR million R million R million R million
6. Financial assets and liabilities (continued)31 December 2015Financial liabilities at fair value through incomeDebt securities 998 – – 998 Investment contracts – 70 – 70 Derivative instruments
Interest rate swaps1 – – 1 1 Total derivative instruments – – 1 1 Total financial liabilities at fair value through income 998 70 1 1 069
1 Carrying value as at 31 December 2016 is less than R1 million.
The following tables present the changes in level 3 instruments:
Short-term Equity Debt money market
securities securities instruments Derivatives Total 31 December 2016 R million R million R million R million R million
Opening balance 1 019 65 44 (1) 1 127 Acquisitions 376 – – – 376 Disposals/settlements (2) – – (75) (77)Transfers between asset classes – 44 (44) – – Transfers to level 1 and/or 2 – (90) – – (90)(Losses)/gains recognised in profit or loss (212) 10 – 76 (126)Closing balance 1 181 29 – – 1 210
31 December 2015Opening balance 820 56 38 – 914 Acquisitions 51 – 1 – 52 Disposals/settlements (5) – (2) – (7)Transfers between asset classes – (4) 4 – – Gains/(losses) recognised in profit or loss 153 13 3 (1) 168 Closing balance 1 019 65 44 (1) 1 127
The unquoted equity instruments recognised as level 3 instruments consist mainly of the participation target shares issued by Sanlam Emerging Markets (Pty) Ltd (SEM). Santam increased its participatory interest in SGI during the second half of 2016 by 8% to 15% at a cost of R251 million. Of the R212 million loss (Dec 2015: R153 million gain) recognised on equity securities, R212 million (Dec 2015: R152 million) relates to the SEM target shares, of which R145 million (Dec 2015: R105 million) relates to foreign exchange losses (Dec 2015: gains), and R67 million (Dec 2015: R47 million) to a decrease (Dec 2015: increase) in fair value in local currency terms. Key drivers of the fair value movements of Santam’s share of the SEM investment portfolio were: – A downward adjustment to the value of the P&O business in Malaysia of R88 million due to lower premium growth in competitive market
conditions. There is a significant focus on expanding the current P&O product offering, and growth reported on non-motor business lines was positive.
– A reduction in the value of the investment in SORAS Assurances Générales Ltd (SORAS) in Rwanda of R47 million following financial irregularities identified during 2016 relating to prior years. Corrective measures were taken to address these irregularities, and the business was recapitalised during the second half of 2016.
– An increase in the value of SGI of R51 million was mainly attributed to good growth achieved in the Indian insurance market.
The fair value of the SEM target shares is determined using predominantly discounted cash flow models. The most significant assumptions used in these models are the discount rate, exchange rate and net insurance margin expectations. Should the discount rates increase or decrease by 10%, the cumulative value of the most significant target shares would decrease by R140 million (Dec. 2015: R114 million) or increase by R213 million (Dec. 2015: R172 million), respectively. If the relative foreign exchange rates increase or decrease by 10%, the cumulative fair values will increase or decrease by R85 million (Dec. 2015: R73 million). Should the net insurance margin profile (projected over a period of 10 years) increase or decrease by 10%, the cumulative fair values will increase by R91 million (Dec. 2015: R79 million) or decrease by R90 million (Dec. 2015: R78 million), respectively.
At 31 December 2016, the group had exchange traded futures with an exposure value of R345 million (Dec. 2015: R585 million). The group also had interest rate derivative assets as part of the international bond portfolio with a gross exposure asset and liability at 31 December 2016 of R27 million (Dec. 2015: R31 million) and R27 million (Dec. 2015: R31 million).
The interest rate derivative liabilities represent the fair value of interest rate swaps effected on a total of R100 million (Dec. 2015: R100 million) of fixed interest securities held in the investment portfolio underlining the subordinated callable notes. The interest rate swaps have the effect of swapping a variable interest rate for a fixed interest rate on these assets to eliminate interest rate risk on assets supporting the bond liability. The derivatives mature on 12 June 2017. The gross exposure asset and liability at year-end amounted to R3 million (Dec. 2015: R10 million) and R3 million (Dec. 2015: R11 million) respectively.
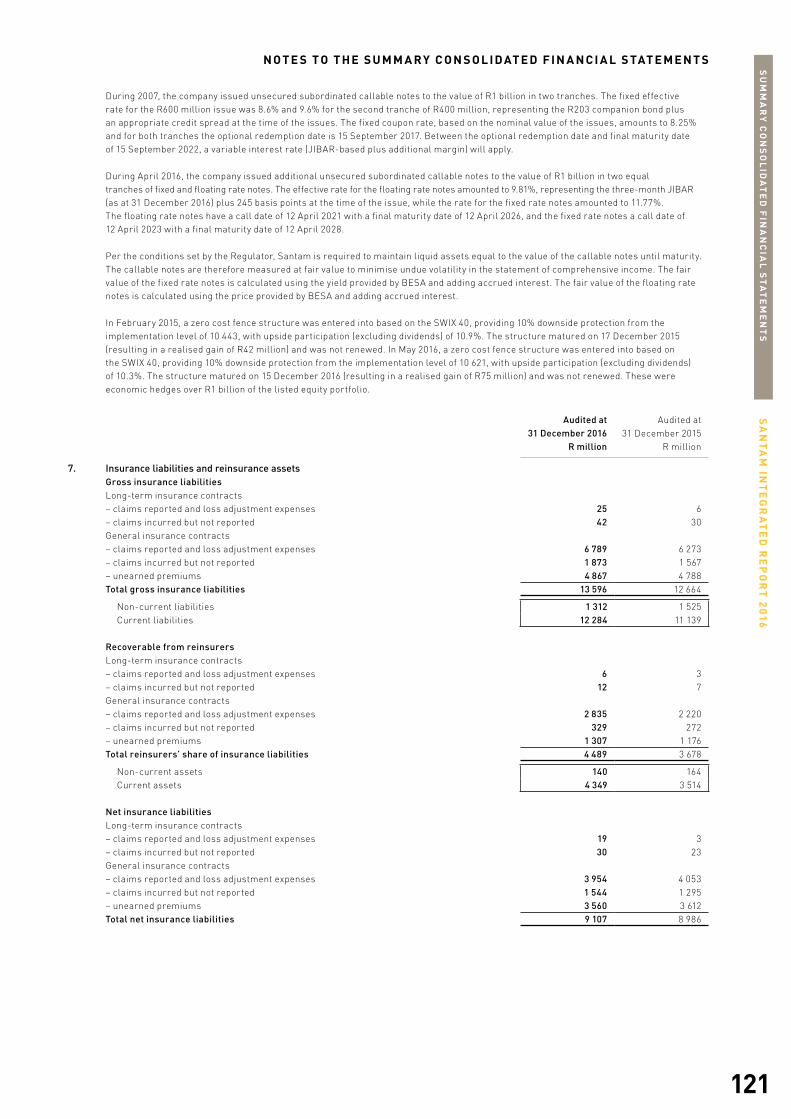
121
SA
NT
AM
INT
EG
RA
TE
D R
EP
OR
T 2
016
SU
MM
AR
Y C
ON
SO
LID
AT
ED
FIN
AN
CIA
L S
TA
TE
ME
NT
S
N O T E S T O T H E S U M M A RY C O N S O L I D AT E D F I N A N C I A L S TAT E M E N T S
During 2007, the company issued unsecured subordinated callable notes to the value of R1 billion in two tranches. The fixed effective rate for the R600 million issue was 8.6% and 9.6% for the second tranche of R400 million, representing the R203 companion bond plus an appropriate credit spread at the time of the issues. The fixed coupon rate, based on the nominal value of the issues, amounts to 8.25% and for both tranches the optional redemption date is 15 September 2017. Between the optional redemption date and final maturity date of 15 September 2022, a variable interest rate (JIBAR-based plus additional margin) will apply.
During April 2016, the company issued additional unsecured subordinated callable notes to the value of R1 billion in two equal tranches of fixed and floating rate notes. The effective rate for the floating rate notes amounted to 9.81%, representing the three-month JIBAR (as at 31 December 2016) plus 245 basis points at the time of the issue, while the rate for the fixed rate notes amounted to 11.77%. The floating rate notes have a call date of 12 April 2021 with a final maturity date of 12 April 2026, and the fixed rate notes a call date of 12 April 2023 with a final maturity date of 12 April 2028.
Per the conditions set by the Regulator, Santam is required to maintain liquid assets equal to the value of the callable notes until maturity. The callable notes are therefore measured at fair value to minimise undue volatility in the statement of comprehensive income. The fair value of the fixed rate notes is calculated using the yield provided by BESA and adding accrued interest. The fair value of the floating rate notes is calculated using the price provided by BESA and adding accrued interest.
In February 2015, a zero cost fence structure was entered into based on the SWIX 40, providing 10% downside protection from the implementation level of 10 443, with upside participation (excluding dividends) of 10.9%. The structure matured on 17 December 2015 (resulting in a realised gain of R42 million) and was not renewed. In May 2016, a zero cost fence structure was entered into based on the SWIX 40, providing 10% downside protection from the implementation level of 10 621, with upside participation (excluding dividends) of 10.3%. The structure matured on 15 December 2016 (resulting in a realised gain of R75 million) and was not renewed. These were economic hedges over R1 billion of the listed equity portfolio.
Audited at Audited at31 December 2016 31 December 2015
R million R million
7. Insurance liabilities and reinsurance assetsGross insurance liabilitiesLong-term insurance contracts– claims reported and loss adjustment expenses 25 6 – claims incurred but not reported 42 30 General insurance contracts– claims reported and loss adjustment expenses 6 789 6 273 – claims incurred but not reported 1 873 1 567 – unearned premiums 4 867 4 788 Total gross insurance liabilities 13 596 12 664
Non-current liabilities 1 312 1 525Current liabilities 12 284 11 139
Recoverable from reinsurersLong-term insurance contracts– claims reported and loss adjustment expenses 6 3 – claims incurred but not reported 12 7 General insurance contracts– claims reported and loss adjustment expenses 2 835 2 220 – claims incurred but not reported 329 272 – unearned premiums 1 307 1 176 Total reinsurers’ share of insurance liabilities 4 489 3 678
Non-current assets 140 164Current assets 4 349 3 514
Net insurance liabilitiesLong-term insurance contracts– claims reported and loss adjustment expenses 19 3 – claims incurred but not reported 30 23 General insurance contracts– claims reported and loss adjustment expenses 3 954 4 053 – claims incurred but not reported 1 544 1 295 – unearned premiums 3 560 3 612 Total net insurance liabilities 9 107 8 986
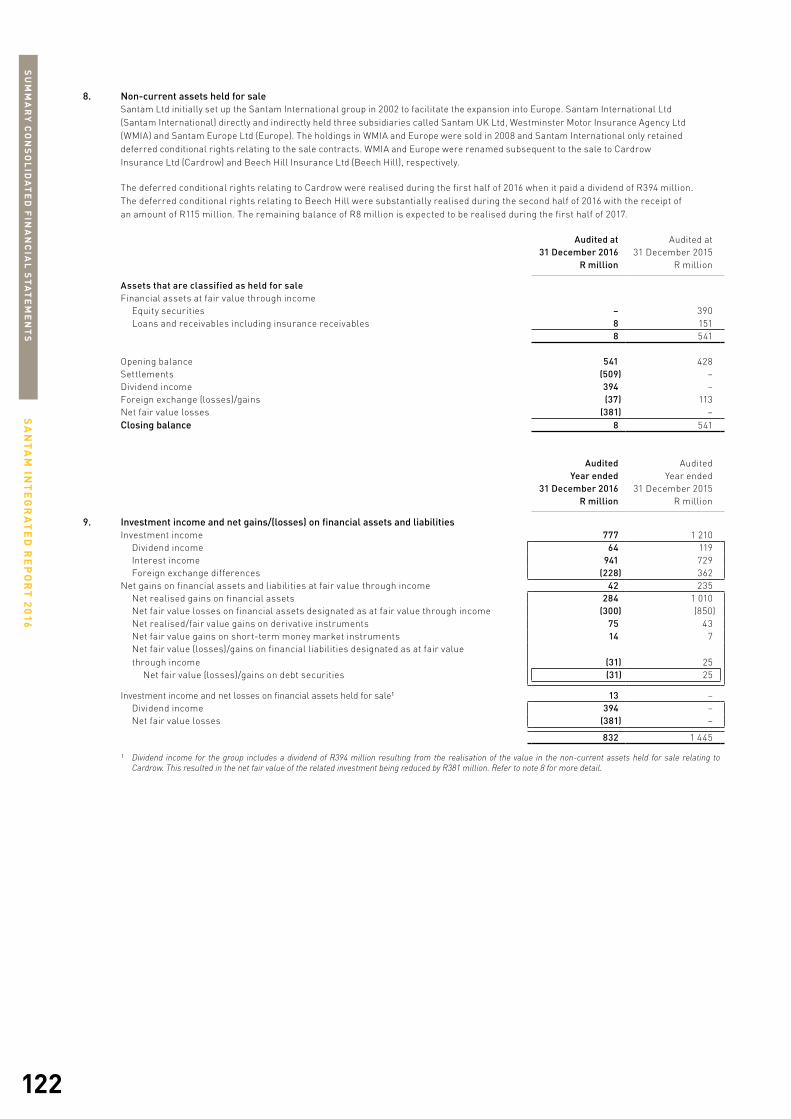
122
SA
NT
AM
INT
EG
RA
TE
D R
EP
OR
T 2
016
SU
MM
AR
Y C
ON
SO
LID
AT
ED
FIN
AN
CIA
L S
TA
TE
ME
NT
S
8. Non-current assets held for saleSantam Ltd initially set up the Santam International group in 2002 to facilitate the expansion into Europe. Santam International Ltd (Santam International) directly and indirectly held three subsidiaries called Santam UK Ltd, Westminster Motor Insurance Agency Ltd (WMIA) and Santam Europe Ltd (Europe). The holdings in WMIA and Europe were sold in 2008 and Santam International only retained deferred conditional rights relating to the sale contracts. WMIA and Europe were renamed subsequent to the sale to Cardrow Insurance Ltd (Cardrow) and Beech Hill Insurance Ltd (Beech Hill), respectively.
The deferred conditional rights relating to Cardrow were realised during the first half of 2016 when it paid a dividend of R394 million. The deferred conditional rights relating to Beech Hill were substantially realised during the second half of 2016 with the receipt of an amount of R115 million. The remaining balance of R8 million is expected to be realised during the first half of 2017.
Audited at Audited at31 December 2016 31 December 2015
R million R million
Assets that are classified as held for saleFinancial assets at fair value through income
Equity securities – 390Loans and receivables including insurance receivables 8 151
8 541
Opening balance 541 428Settlements (509) –Dividend income 394 –Foreign exchange (losses)/gains (37) 113Net fair value losses (381) –Closing balance 8 541
Audited AuditedYear ended Year ended
31 December 2016 31 December 2015R million R million
9. Investment income and net gains/(losses) on financial assets and liabilitiesInvestment income 777 1 210
Dividend income 64 119 Interest income 941 729 Foreign exchange differences (228) 362
Net gains on financial assets and liabilities at fair value through income 42 235Net realised gains on financial assets 284 1 010 Net fair value losses on financial assets designated as at fair value through income (300) (850)Net realised/fair value gains on derivative instruments 75 43 Net fair value gains on short-term money market instruments 14 7 Net fair value (losses)/gains on financial liabilities designated as at fair value through income (31) 25
Net fair value (losses)/gains on debt securities (31) 25
Investment income and net losses on financial assets held for sale1 13 –Dividend income 394 – Net fair value losses (381) –
832 1 445
1 Dividend income for the group includes a dividend of R394 million resulting from the realisation of the value in the non-current assets held for sale relating to Cardrow. This resulted in the net fair value of the related investment being reduced by R381 million. Refer to note 8 for more detail.

123
SA
NT
AM
INT
EG
RA
TE
D R
EP
OR
T 2
016
SU
MM
AR
Y C
ON
SO
LID
AT
ED
FIN
AN
CIA
L S
TA
TE
ME
NT
S
N O T E S T O T H E S U M M A RY C O N S O L I D AT E D F I N A N C I A L S TAT E M E N T S
Audited AuditedYear ended Year ended
31 December 2016 31 December 2015R million R million
10. Income taxNormal taxation
Current year 553 1 077 Prior year (8) 24 Recovered from cell owners (89) (67)
Foreign taxation – current year 56 57 Total income taxation for the year 512 1 091
Deferred taxationCurrent year 12 (170)Prior year – (13)
Total deferred taxation for the year 12 (183)
Total taxation as per statement of comprehensive income 524 908
Reconciliation of taxation rate (%)Normal South African taxation rate 28.0 28.0Adjusted for:
Disallowable expenses 0.6 0.7 Foreign tax differential 0.4 0.2 Exempt income (1.4) (1.2)Investment results (0.5) (0.9)Change in CGT inclusion rate1 2.4 – Income from associates and joint ventures (1.1) (1.0)Previous years’ (over)/underprovision (0.4) 0.3
Other permanent differences 0.1 0.7
Other taxes 0.1 0.1 Net increase/(reduction) 0.2 (1.1)Effective rate (%) 28.2 26.9
1 The increase in the CGT inclusion rate resulted in an increase in the deferred tax provision on fair value movements of R45 million.
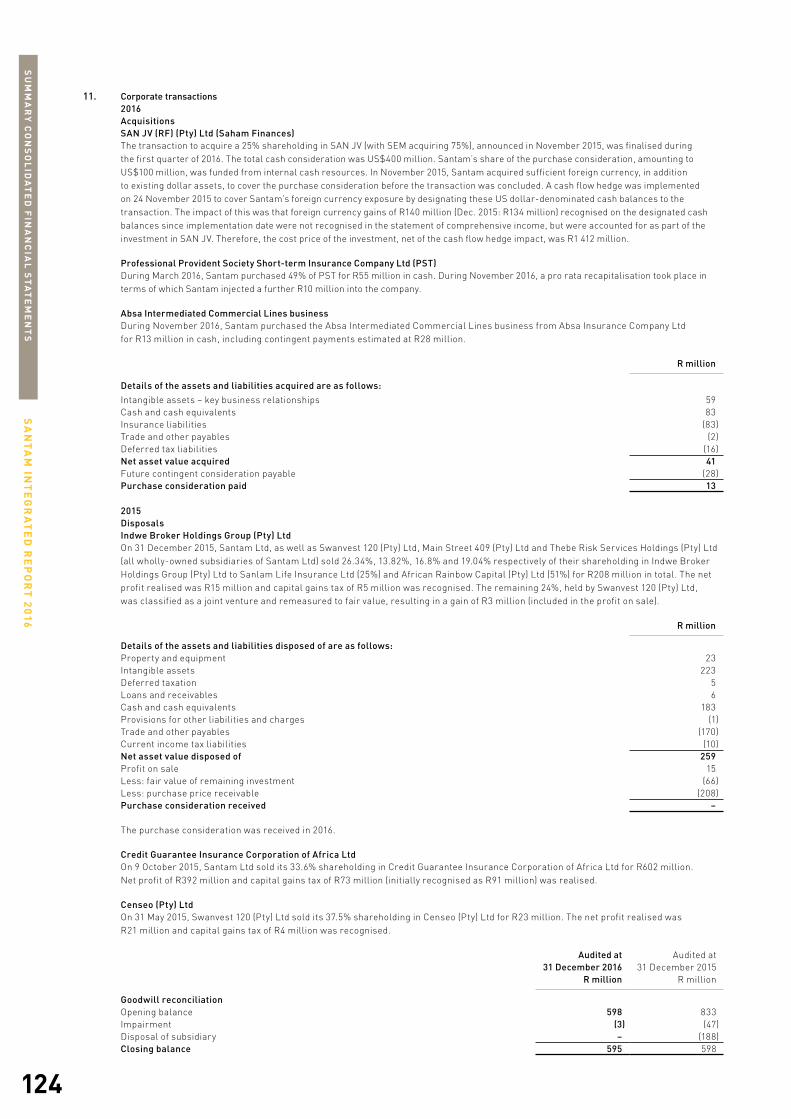
124
SA
NT
AM
INT
EG
RA
TE
D R
EP
OR
T 2
016
SU
MM
AR
Y C
ON
SO
LID
AT
ED
FIN
AN
CIA
L S
TA
TE
ME
NT
S
11. Corporate transactions2016AcquisitionsSAN JV (RF) (Pty) Ltd (Saham Finances)The transaction to acquire a 25% shareholding in SAN JV (with SEM acquiring 75%), announced in November 2015, was finalised during the first quarter of 2016. The total cash consideration was US$400 million. Santam’s share of the purchase consideration, amounting to US$100 million, was funded from internal cash resources. In November 2015, Santam acquired sufficient foreign currency, in addition to existing dollar assets, to cover the purchase consideration before the transaction was concluded. A cash flow hedge was implemented on 24 November 2015 to cover Santam’s foreign currency exposure by designating these US dollar-denominated cash balances to the transaction. The impact of this was that foreign currency gains of R140 million (Dec. 2015: R134 million) recognised on the designated cash balances since implementation date were not recognised in the statement of comprehensive income, but were accounted for as part of the investment in SAN JV. Therefore, the cost price of the investment, net of the cash flow hedge impact, was R1 412 million.
Professional Provident Society Short-term Insurance Company Ltd (PST)During March 2016, Santam purchased 49% of PST for R55 million in cash. During November 2016, a pro rata recapitalisation took place in terms of which Santam injected a further R10 million into the company.
Absa Intermediated Commercial Lines businessDuring November 2016, Santam purchased the Absa Intermediated Commercial Lines business from Absa Insurance Company Ltd for R13 million in cash, including contingent payments estimated at R28 million.
R million
Details of the assets and liabilities acquired are as follows:Intangible assets – key business relationships 59 Cash and cash equivalents 83 Insurance liabilities (83)Trade and other payables (2)Deferred tax liabilities (16)Net asset value acquired 41 Future contingent consideration payable (28)Purchase consideration paid 13
2015DisposalsIndwe Broker Holdings Group (Pty) LtdOn 31 December 2015, Santam Ltd, as well as Swanvest 120 (Pty) Ltd, Main Street 409 (Pty) Ltd and Thebe Risk Services Holdings (Pty) Ltd (all wholly-owned subsidiaries of Santam Ltd) sold 26.34%, 13.82%, 16.8% and 19.04% respectively of their shareholding in Indwe Broker Holdings Group (Pty) Ltd to Sanlam Life Insurance Ltd (25%) and African Rainbow Capital (Pty) Ltd (51%) for R208 million in total. The net profit realised was R15 million and capital gains tax of R5 million was recognised. The remaining 24%, held by Swanvest 120 (Pty) Ltd, was classified as a joint venture and remeasured to fair value, resulting in a gain of R3 million (included in the profit on sale).
R million
Details of the assets and liabilities disposed of are as follows:Property and equipment 23 Intangible assets 223 Deferred taxation 5 Loans and receivables 6 Cash and cash equivalents 183 Provisions for other liabilities and charges (1)Trade and other payables (170)Current income tax liabilities (10)Net asset value disposed of 259 Profit on sale 15 Less: fair value of remaining investment (66)Less: purchase price receivable (208)Purchase consideration received –
The purchase consideration was received in 2016.
Credit Guarantee Insurance Corporation of Africa LtdOn 9 October 2015, Santam Ltd sold its 33.6% shareholding in Credit Guarantee Insurance Corporation of Africa Ltd for R602 million. Net profit of R392 million and capital gains tax of R73 million (initially recognised as R91 million) was realised.
Censeo (Pty) LtdOn 31 May 2015, Swanvest 120 (Pty) Ltd sold its 37.5% shareholding in Censeo (Pty) Ltd for R23 million. The net profit realised was R21 million and capital gains tax of R4 million was recognised.
Audited at Audited at31 December 2016 31 December 2015
R million R million
Goodwill reconciliationOpening balance 598 833 Impairment (3) (47)Disposal of subsidiary – (188)Closing balance 595 598

125
SA
NT
AM
INT
EG
RA
TE
D R
EP
OR
T 2
016
SU
MM
AR
Y C
ON
SO
LID
AT
ED
FIN
AN
CIA
L S
TA
TE
ME
NT
S
N O T E S T O T H E S U M M A RY C O N S O L I D AT E D F I N A N C I A L S TAT E M E N T S
Audited AuditedYear ended Year ended
31 December 2016 31 December 2015
12. Earnings per shareBasic earnings per shareProfit attributable to the company’s equity holders (R million) 1 212 2 348 Weighted average number of ordinary shares in issue (million) 110.21 112.34 Earnings per share (cents) 1 100 2 090
Diluted earnings per shareProfit attributable to the company’s equity holders (R million) 1 212 2 348 Weighted average number of ordinary shares in issue (million) 110.21 112.34 Adjusted for share options 1.16 1.38 Weighted average number of ordinary shares for diluted earnings per share (million) 111.37 113.72
Diluted basic earnings per share (cents) 1 088 2 065
Headline earnings per shareProfit attributable to the company’s equity holders (R million) 1 212 2 348 Adjusted for:
Impairment of goodwill and other intangible assets 3 52 Profit on sale of subsidiary – (15)Tax charge on profit on sale of subsidiary – 5 Profit on sale of associated companies – (413)Tax charge on profit on sale of associated companies – 95 Capital gains tax overprovision on sale of associated companies (18) –
Headline earnings (R million) 1 197 2 072
Weighted average number of ordinary shares in issue (million) 110.21 112.34 Headline earnings per share (cents) 1 086 1 844
Diluted headline earnings per shareHeadline earnings (R million) 1 197 2 072 Weighted average number of ordinary shares for diluted headline earnings per share (million) 111.37 113.72 Diluted headline earnings per share (cents) 1 075 1 822
13. Dividend per shareDividend per share (cents) 881 816Special dividend per share (cents) 800 –
14. Broad-based black economic empowerment (BBBEE)In May 2007, Central Plaza Investments 112 (Pty) Ltd (Central Plaza) acquired 10% of Santam’s shares with the following beneficiaries:
– Emthunzini Black Economic Empowerment Staff Trust – Emthunzini Black Economic Empowerment Business Partners Trust – Emthunzini Broad-based Black Economic Empowerment Community Trust
The scheme matured in February 2015. Of the shares held by Central Plaza Investments 112 (Pty) Ltd, Santam repurchased 38% of the shares (4 215 000 shares at a price of R190 per share for a total consideration of R801 million) and 24% were sold in the market through a successful bookbuild during the unwinding process, and the balance was distributed to participants.
The consequent distribution of Santam shares and cash valued at R1.1 billion to the beneficiaries started in September 2015 with R530 million allocated to close to 2 400 Santam and Sanlam employees. Santam shares and cash to the value of R330 million were distributed to 68 black business partners, while the Emthunzini Broad-Based Black Economic Empowerment Community Trust received Santam shares and cash to the value of R275 million. The unwinding of the scheme had a minimal impact on Santam’s black ownership status.
The Emthunzini Black Economic Empowerment Staff Trust (staff trust) is also under the control of Santam Ltd since the unwinding of Central Plaza and is therefore consolidated as at 31 December 2015 and 2016. The net impact of the inclusion of the staff trust at 31 December 2015 was an increase in cash of R132 million, the recognition of the capital contribution reserve of R9 million and an increase of 684 482 in treasury shares.
15. Events after the reporting periodThere have been no material changes in the affairs or financial position of the company and its subsidiaries since the statement of financial position date.
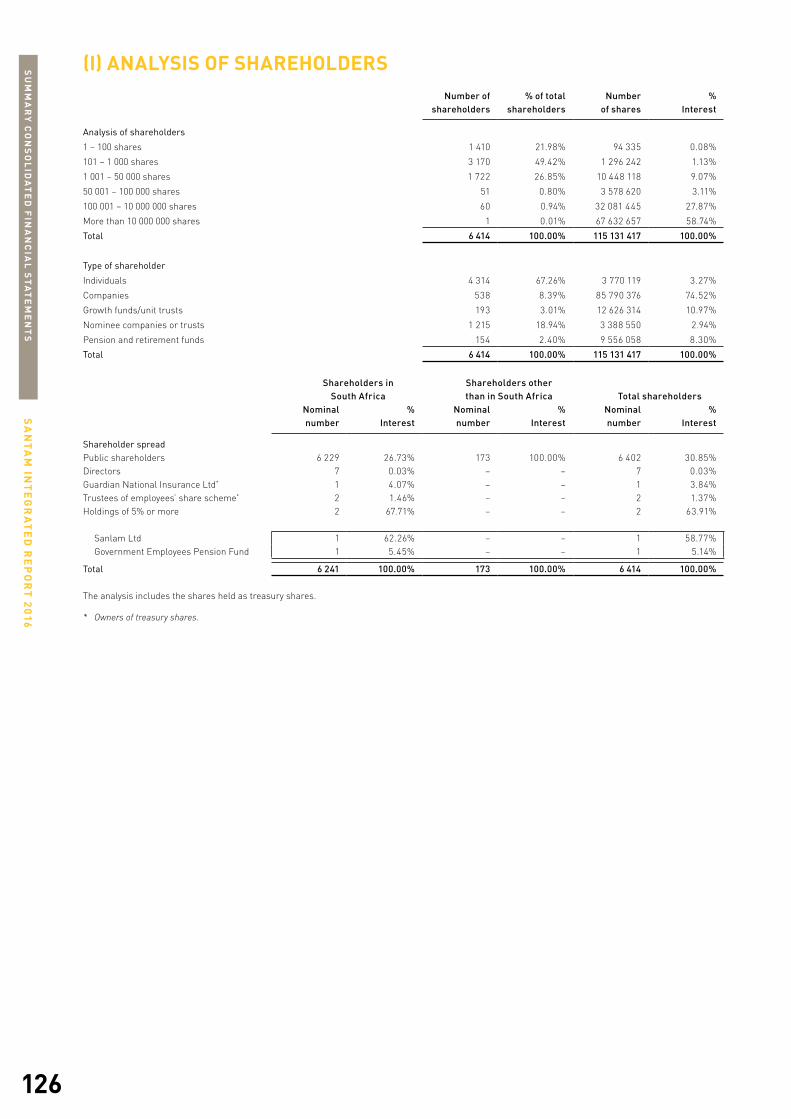
126
SA
NT
AM
INT
EG
RA
TE
D R
EP
OR
T 2
016
SU
MM
AR
Y C
ON
SO
LID
AT
ED
FIN
AN
CIA
L S
TA
TE
ME
NT
S
Number ofshareholders
% of totalshareholders
Number of shares
% Interest
Analysis of shareholders
1 – 100 shares 1 410 21.98% 94 335 0.08%
101 – 1 000 shares 3 170 49.42% 1 296 242 1.13%
1 001 – 50 000 shares 1 722 26.85% 10 448 118 9.07%
50 001 – 100 000 shares 51 0.80% 3 578 620 3.11%
100 001 – 10 000 000 shares 60 0.94% 32 081 445 27.87%
More than 10 000 000 shares 1 0.01% 67 632 657 58.74%
Total 6 414 100.00% 115 131 417 100.00%
Type of shareholder
Individuals 4 314 67.26% 3 770 119 3.27%
Companies 538 8.39% 85 790 376 74.52%
Growth funds/unit trusts 193 3.01% 12 626 314 10.97%
Nominee companies or trusts 1 215 18.94% 3 388 550 2.94%
Pension and retirement funds 154 2.40% 9 556 058 8.30%
Total 6 414 100.00% 115 131 417 100.00%
Shareholders in South Africa
Shareholders otherthan in South Africa Total shareholders
Nominalnumber
%Interest
Nominal number
%Interest
Nominal number
%Interest
Shareholder spreadPublic shareholders 6 229 26.73% 173 100.00% 6 402 30.85%Directors 7 0.03% – – 7 0.03%Guardian National Insurance Ltd* 1 4.07% – – 1 3.84%Trustees of employees’ share scheme* 2 1.46% – – 2 1.37%Holdings of 5% or more 2 67.71% – – 2 63.91%
Sanlam Ltd 1 62.26% – – 1 58.77%Government Employees Pension Fund 1 5.45% – – 1 5.14%
Total 6 241 100.00% 173 100.00% 6 414 100.00%
The analysis includes the shares held as treasury shares.
* Owners of treasury shares.
(I) ANALYSIS OF SHAREHOLDERS

127
SA
NT
AM
INT
EG
RA
TE
D R
EP
OR
T 2
016
SU
MM
AR
Y C
ON
SO
LID
AT
ED
FIN
AN
CIA
L S
TA
TE
ME
NT
S
(II) ANALYSIS OF DEBT SECURITY HOLDERSNumber of
debt securityholders
% of totaldebt security
holdersNumberof units
%Interest
Analysis of debt security holders1 – 50 000 units 24 11.65% 166 622 0.01%50 001 – 100 000 units 9 4.37% 841 656 0.04%100 001 – 1 000 000 units 57 27.67% 30 065 378 1.50%1 000 001 – 10 000 000 units 78 37.86% 342 149 448 17.11%More than 10 000 000 units 38 18.45% 1 626 776 896 81.34%Total 206 100.00% 2 000 000 000 100.00%
Type of debt security holderBanks 4 1.94% 74 300 000 3.72%Brokers 2 0.97% 53 566 656 2.68%Endowment funds 6 2.91% 14 909 830 0.75%Insurance companies 15 7.28% 196 318 583 9.82%Investment companies 6 2.91% 164 873 400 8.24%Medical aid schemes 9 4.37% 36 684 000 1.83%Mutual funds 101 49.04% 802 611 038 40.13%Nominees and trusts 2 0.97% 1 490 000 0.07%Pension funds 55 26.70% 581 442 493 29.07%Private companies 4 1.94% 64 442 000 3.22%Public companies 2 0.97% 9 362 000 0.47%Total 206 100.00% 2 000 000 000 100.00%
Nominalnumber
%Interest
Debt security holder spreadGovernment Employees Pension Fund 365 996 877 18.30%MMI Group Ltd 158 663 400 7.93%Investec Cautious Managed Fund 107 400 000 5.37%Other 1 367 939 723 68.40%Total 2 000 000 000 100.00%

IT IS WHAT INSURANCE GOOD AND PROPER DOES.
Having an in-depth understanding of what is important to our clients makes us the insurer of choice for millions of South Africans. We believe in the simple principle that insurance should add value, not questions and uncertainty, across a wide range of market segments. We have the size, experience, expertise, data, technology, infrastructure and partnerships to deliver insurance that is meaningful.


130
SA
NT
AM
INT
EG
RA
TE
D R
EP
OR
T 2
016
AP
PE
ND
ICE
S
SEVEN-YEAR REVIEWSEVEN-YEAR
COMPOUND GROWTH
%/AVERAGE 2016 2015 2014 2013 2012 2011 2010PERFORMANCE PER ORDINARY SHARECents per shareHeadline earnings (3.8) 1 086 1 844 1 446 1 033 995 1 216 1 367 Dividends 9.5 881 816 742 675 640 555 510 Special dividends 800 – – – – 850 500 Net asset value 6 237 7 338 6 115 5 360 4 840 5 329 4 535
INSURANCE ACTIVITIES Net claims paid and provided (%) Avg 65.2 65.1 62.1 63.1 69.3 68.3 64.2 64.1Cost of acquisition (%) Avg 28.0 28.5 28.3 28.2 27.9 27.7 28.1 27.3
Net commission paid (%) Avg 12.6 12.0 10.8 10.9 12.7 13.0 13.7 15.3Management expenses (%) Avg 15.4 16.5 17.5 17.3 15.2 14.7 14.4 12.0
Combined ratio (%) Avg 93.2 93.6 90.4 91.3 97.2 96.0 92.3 91.4Underwriting result (%) Avg 6.8 6.4 9.6 8.7 2.8 4.0 7.7 8.6Earned premium (%) 100.0 100.0 100.0 100.0 100.0 100.0 100.0
INVESTMENT ACTIVITIES Interest and dividends net of asset management fees 889 1 041 683 635 722 554 484 Net gain on financial assets and liabilities at fair value through income 42 235 286 449 480 189 537
RETURN AND PRODUCTIVITYEarnings expressed as % of average shareholders’ funds (%) Avg 24.9 15.9 32.5 24.7 20.0 19.3 25.0 37.1Pre-tax return on total assets (%) Avg 9.5 6.3 12.1 9.0 6.5 8.6 10.1 13.7Effective tax rate (%) Avg 27.5 28.2 26.9 28.4 20.4 36.7 25.7 26.3Gross premium per employee (R000)* 4 088 4 154 4 020 3 913 3 680 3 608 5 116* Alternative Risk Transfer premiums excluded.
SOLVENCY AND LIQUIDITYDividend cover (times) Avg 2.4 1.4 2.9 2.1 1.5 3.9 2.2 3.1Economic capital coverage ratio (%) 155 177 – – – – –
OTHER STATISTICSNumber of permanent employees 5 749 5 313 5 163 4 779 4 696 4 375 2 757Employee composition (% of black employees) 67.6 62.9 60.8 59.9 59.8 56.8 54.4Number of shareholders 6 414 5 859 5 268 5 530 5 565 5 169 4 616Corporate social investment spend (% of NPAT)** 0.9 0.8 0.8 1.2 1.5 0.8 0.7** dti codes from 2010 to 2012; Financial Services
Sector Charter 2013.
SANTAM SHARE PERFORMANCEAND RELATED INDICATORSMarket price per share (cents)
Closing 23 400 18 950 21 500 18 628 19 025 14 231 13 050Highest 24 997 24 500 22 000 19 074 20 112 15 500 13 547Lowest 17 350 16 750 19 700 18 291 13 950 11 707 9 710
Market capitalisation (R million) 25 799 20 868 24 647 21 306 21 651 17 555 14 750Santam share price index*** 3 020 2 427 2 767 2 384 2 437 1 967 1 640FTSE – JSE financial index*** 1 193 1 183 1 184 953 821 597 578Closing price/earnings (times) 21.5 10.3 14.9 18.0 19.1 12.7 9.5Closing price/equity per share (times) 3.8 2.6 3.5 3.5 3.9 2.9 2.9Closing dividend yield (%) 3.8 4.3 3.5 3.6 5.5 3.6 3.9Number of shares issued (million) 110.3 110.1 114.6 114.4 113.8 113.3 113.0Number of shares traded (million) 19.6 25.8 8.6 13.4 12.1 12.6 18.5Number of shares traded as a % of total number of shares in issue 17.7 23.4 7.5 11.7 10.6 11.1 16.3Value of shares traded (R million) 4 325.4 5 597.4 1 651.2 2 538.8 2 018.6 1 674.4 2 039.5*** Base year 1992.
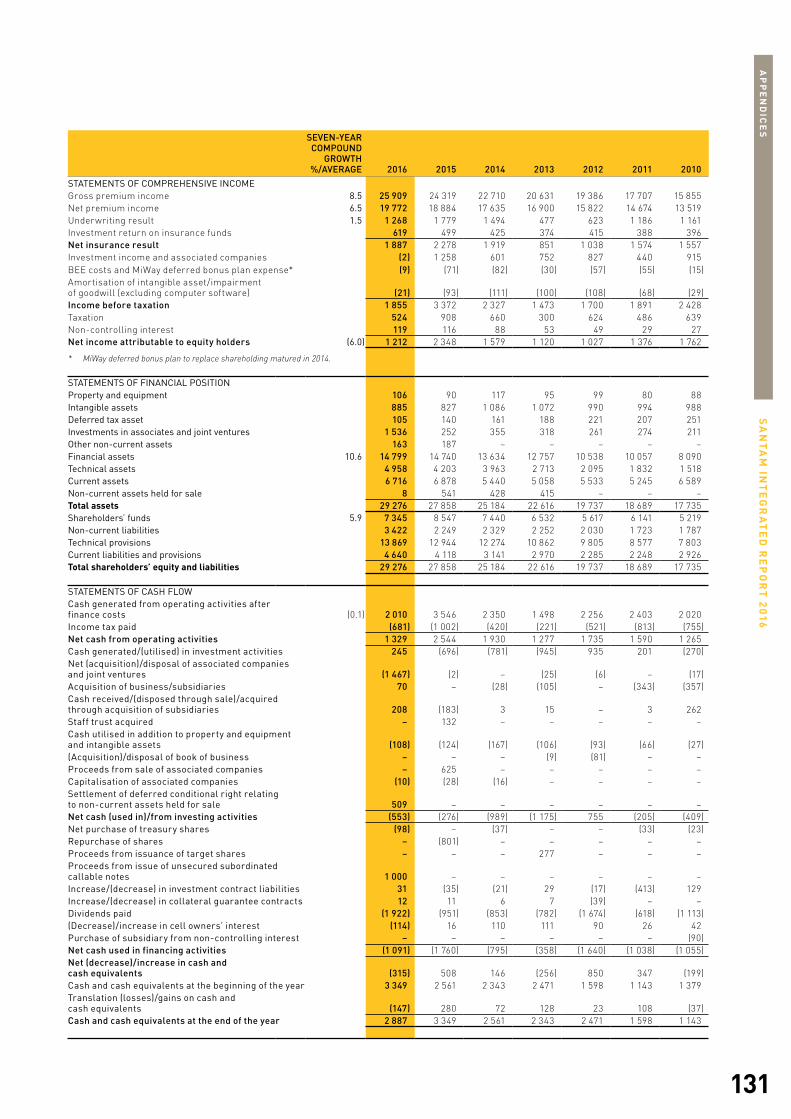
131
SA
NT
AM
INT
EG
RA
TE
D R
EP
OR
T 2
016
AP
PE
ND
ICE
S
SEVEN-YEARCOMPOUND
GROWTH%/AVERAGE 2016 2015 2014 2013 2012 2011 2010
STATEMENTS OF COMPREHENSIVE INCOMEGross premium income 8.5 25 909 24 319 22 710 20 631 19 386 17 707 15 855 Net premium income 6.5 19 772 18 884 17 635 16 900 15 822 14 674 13 519 Underwriting result 1.5 1 268 1 779 1 494 477 623 1 186 1 161 Investment return on insurance funds 619 499 425 374 415 388 396 Net insurance result 1 887 2 278 1 919 851 1 038 1 574 1 557 Investment income and associated companies (2) 1 258 601 752 827 440 915 BEE costs and MiWay deferred bonus plan expense* (9) (71) (82) (30) (57) (55) (15)Amortisation of intangible asset/impairment of goodwill (excluding computer software) (21) (93) (111) (100) (108) (68) (29)Income before taxation 1 855 3 372 2 327 1 473 1 700 1 891 2 428 Taxation 524 908 660 300 624 486 639 Non-controlling interest 119 116 88 53 49 29 27 Net income attributable to equity holders (6.0) 1 212 2 348 1 579 1 120 1 027 1 376 1 762
* MiWay deferred bonus plan to replace shareholding matured in 2014.
STATEMENTS OF FINANCIAL POSITIONProperty and equipment 106 90 117 95 99 80 88 Intangible assets 885 827 1 086 1 072 990 994 988 Deferred tax asset 105 140 161 188 221 207 251 Investments in associates and joint ventures 1 536 252 355 318 261 274 211 Other non-current assets 163 187 – – – – – Financial assets 10.6 14 799 14 740 13 634 12 757 10 538 10 057 8 090 Technical assets 4 958 4 203 3 963 2 713 2 095 1 832 1 518 Current assets 6 716 6 878 5 440 5 058 5 533 5 245 6 589 Non-current assets held for sale 8 541 428 415 – – – Total assets 29 276 27 858 25 184 22 616 19 737 18 689 17 735 Shareholders’ funds 5.9 7 345 8 547 7 440 6 532 5 617 6 141 5 219 Non-current liabilities 3 422 2 249 2 329 2 252 2 030 1 723 1 787 Technical provisions 13 869 12 944 12 274 10 862 9 805 8 577 7 803 Current liabilities and provisions 4 640 4 118 3 141 2 970 2 285 2 248 2 926 Total shareholders’ equity and liabilities 29 276 27 858 25 184 22 616 19 737 18 689 17 735
STATEMENTS OF CASH FLOWCash generated from operating activities after finance costs (0.1) 2 010 3 546 2 350 1 498 2 256 2 403 2 020 Income tax paid (681) (1 002) (420) (221) (521) (813) (755)Net cash from operating activities 1 329 2 544 1 930 1 277 1 735 1 590 1 265 Cash generated/(utilised) in investment activities 245 (696) (781) (945) 935 201 (270)Net (acquisition)/disposal of associated companies and joint ventures (1 467) (2) – (25) (6) – (17)Acquisition of business/subsidiaries 70 – (28) (105) – (343) (357)Cash received/(disposed through sale)/acquired through acquisition of subsidiaries 208 (183) 3 15 – 3 262 Staff trust acquired – 132 – – – – – Cash utilised in addition to property and equipment and intangible assets (108) (124) (167) (106) (93) (66) (27)(Acquisition)/disposal of book of business – – – (9) (81) – – Proceeds from sale of associated companies – 625 – – – – – Capitalisation of associated companies (10) (28) (16) – – – – Settlement of deferred conditional right relating to non-current assets held for sale 509 – – – – – – Net cash (used in)/from investing activities (553) (276) (989) (1 175) 755 (205) (409)Net purchase of treasury shares (98) – (37) – – (33) (23)Repurchase of shares – (801) – – – – – Proceeds from issuance of target shares – – – 277 – – – Proceeds from issue of unsecured subordinated callable notes 1 000 – – – – – – Increase/(decrease) in investment contract liabilities 31 (35) (21) 29 (17) (413) 129 Increase/(decrease) in collateral guarantee contracts 12 11 6 7 (39) – – Dividends paid (1 922) (951) (853) (782) (1 674) (618) (1 113)(Decrease)/increase in cell owners’ interest (114) 16 110 111 90 26 42 Purchase of subsidiary from non-controlling interest – – – – – – (90)Net cash used in financing activities (1 091) (1 760) (795) (358) (1 640) (1 038) (1 055)Net (decrease)/increase in cash and cash equivalents (315) 508 146 (256) 850 347 (199)Cash and cash equivalents at the beginning of the year 3 349 2 561 2 343 2 471 1 598 1 143 1 379 Translation (losses)/gains on cash and cash equivalents (147) 280 72 128 23 108 (37)Cash and cash equivalents at the end of the year 2 887 3 349 2 561 2 343 2 471 1 598 1 143

132
SA
NT
AM
INT
EG
RA
TE
D R
EP
OR
T 2
016
AP
PE
ND
ICE
S
Acquisition costs Those costs that are primarily related to the acquisition of new or renewal of insurance contracts,
e.g. commissions and management expenses. Acquisition costs are often expressed as a percentage
of earned premiums and referred to as the acquisition cost ratio.
Alternative risk transfer (ART) The use of techniques other than traditional insurance and reinsurance to provide risk-bearing entities with
coverage or protection.
Binder An authority issued by an insurer to another party to: enter into, vary or renew a short-term policy on behalf
of that insurer; determine the wording of a short-term policy; determine premiums under a short-term policy;
determine the value of policy benefits under a short-term policy; or settle claims under a short-term policy.
Catastrophe Fire, earthquake, windstorm, explosion and other similar events that result in substantial losses.
Cell captive insurer An insurer that is structured with separate independent cells. The assets and liabilities of the cells are
ring-fenced. Profits and losses from business introduced by the cell owner to the insurer are attributable
to the cell owner.
Churn rate The proportion of policyholders who leave a supplier during a given time period.
Claim A demand to the insurer for indemnification for a loss incurred from an insured peril.
Claims incurred Claims cost for an accounting period are made up of:
– claims paid for the period, including claims handling expenses; and
– outstanding claims at the end of the current accounting period, including IBNR less outstanding claims
at the end of the preceding accounting period, including IBNR.
Claims incurred but not
reported (IBNR)
Claims resulting from events that have taken place, but of which the insurer has not received notices
or reports of loss. An estimate is made of the amount of these claims based on previous experience.
Claims ratios Ratios expressing the relationship between claims and premiums. The net claims ratio expresses claims net
of recoveries from reinsurers as a percentage of premiums net of premiums ceded to reinsurance. The gross
claims ratio reflects the position before reinsurance is taken into account. Also referred to as loss ratios.
Deferred acquisition costs Acquisition costs relating to unearned premiums, disclosed as a separate asset on an insurer’s statement
of financial position.
Earned premium The proportions of premium attributable to the periods of risk that relate to the current accounting period.
It represents written premium adjusted by the unearned premium provision at the beginning and end of the
accounting period.
Economic capital
coverage ratio
The economic capital coverage ratio is equal to the available capital resources, comprising shareholder’s
funds and subordinated debt, divided by the solvency capital requirement as determined by Santam’s
internal model.
Financial Sector Charter (FSC) The FSC is a transformation policy based on the terms of the Broad-Based Black Economic Empowerment
Act, 53 of 2003, to promote social and economic integration and access to the financial services sector.
General/short-term insurance Defined in the Short-term Insurance Act as providing benefits under short-term policies, which means
engineering policies, guarantee policies, liability policies, miscellaneous policies, motor policies, accident
and health policies, property policies or transportation policies or a contract comprising a combination
of any of those policies.
GLOSSARY
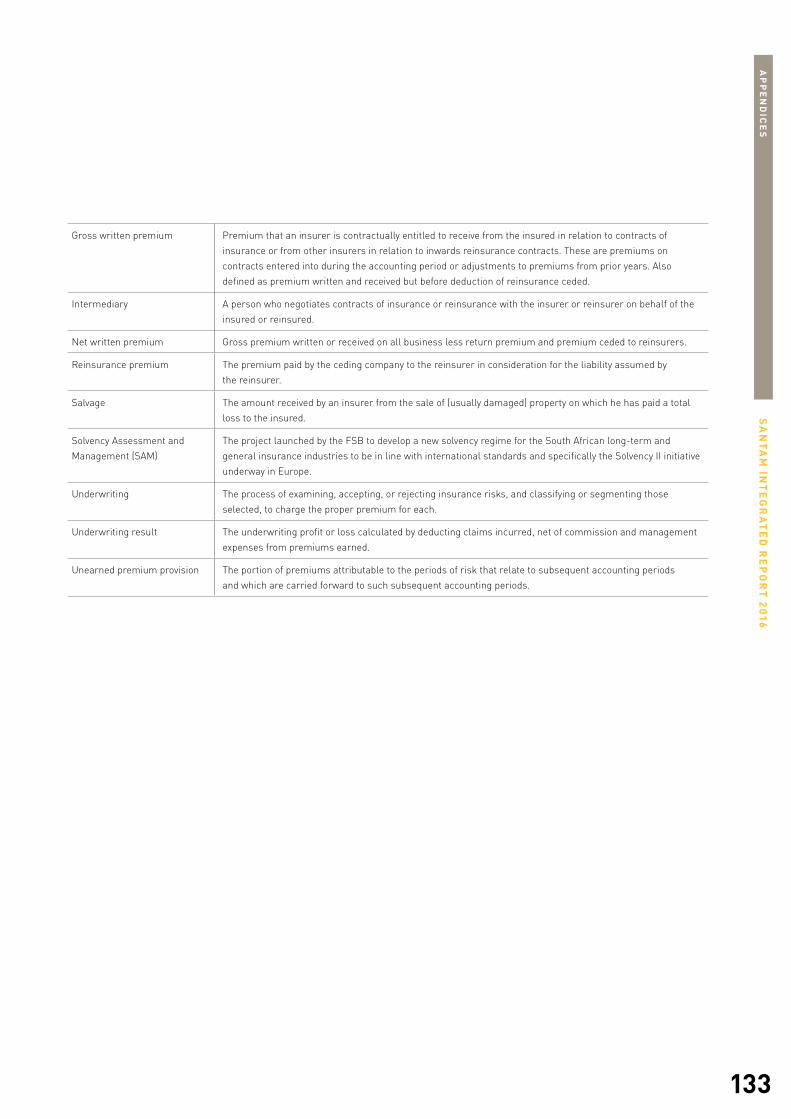
133
SA
NT
AM
INT
EG
RA
TE
D R
EP
OR
T 2
016
AP
PE
ND
ICE
S
Gross written premium Premium that an insurer is contractually entitled to receive from the insured in relation to contracts of
insurance or from other insurers in relation to inwards reinsurance contracts. These are premiums on
contracts entered into during the accounting period or adjustments to premiums from prior years. Also
defined as premium written and received but before deduction of reinsurance ceded.
Intermediary A person who negotiates contracts of insurance or reinsurance with the insurer or reinsurer on behalf of the
insured or reinsured.
Net written premium Gross premium written or received on all business less return premium and premium ceded to reinsurers.
Reinsurance premium The premium paid by the ceding company to the reinsurer in consideration for the liability assumed by
the reinsurer.
Salvage The amount received by an insurer from the sale of (usually damaged) property on which he has paid a total
loss to the insured.
Solvency Assessment and
Management (SAM)
The project launched by the FSB to develop a new solvency regime for the South African long-term and
general insurance industries to be in line with international standards and specifically the Solvency II initiative
underway in Europe.
Underwriting The process of examining, accepting, or rejecting insurance risks, and classifying or segmenting those
selected, to charge the proper premium for each.
Underwriting result The underwriting profit or loss calculated by deducting claims incurred, net of commission and management
expenses from premiums earned.
Unearned premium provision The portion of premiums attributable to the periods of risk that relate to subsequent accounting periods
and which are carried forward to such subsequent accounting periods.

134
SA
NT
AM
INT
EG
RA
TE
D R
EP
OR
T 2
016
AP
PE
ND
ICE
S
NON-EXECUTIVE DIRECTORSB Campbell, MP Fandeso, BTPKM Gamedze, GG Gelink (chairman),
IM Kirk, MLD Marole, NV Mtetwa, T Nyoka (née Fubu), Y Ramiah,
MJ Reyneke, PE Speckmann, HC Werth
EXECUTIVE DIRECTORSL Lambrechts (chief executive officer), HD Nel (chief financial officer)
SPONSORInvestec Bank Ltd
TRANSFER SECRETARIESComputershare Investor Services (Pty) Ltd, 70 Marshall Street,
Rosebank Towers, 15 Biermann Avenue, Rosebank, 2196 South Africa
Tel: 011 370 5000
Fax: 011 688 7721
www.computershare.com
COMPANY SECRETARYM Allie
SANTAM HEAD OFFICE REGISTERED ADDRESS1 Sportica Crescent, Tyger Valley, Bellville 7530
PO Box 3881, Tyger Valley 7536
Tel: 021 915 7000
Fax: 021 914 0700
www.santam.co.za
Registration number 1918/001680/06
ISIN ZAE000093779
JSE share code: SNT
NSX share code: SNM
REPORT FRAUDFraudline (South Africa): 0860 600 767
Fraudline (Namibia): 0800 002 020
Fraudline SMS: 31640
BBM PIN: 25CAFCE7
WhatsApp: 076 921 3347
Email: [email protected]
ADMINISTRATIONAT 1 MARCH 2017
Santam is an authorised financial services provider (licence number 3416).


GREYMATTER & FINCH # 10736

138
INSURANCE GOOD AND PROPERwww.santam.co.za