Embed Size (px)
Citation preview

TS 5C - The Quality of Measurements
Simon Fuller, Eldar Rubinov, Philip Collier, and James Seager
Integrated Quality Indicators and Stochastic Modelling for Real-Time Positioning: Overview and Implementation
FIG Congress 2010
Facing the Challenges – Building the Capacity
Sydney, Australia, 11-16 April 2010
1/16
Integrated Quality Indicators and Stochastic Modelling for Real-Time
Positioning: Overview and Implementation
Simon FULLER, Eldar RUBINOV, Philip COLLIER and James SEAGER, Australia
Keywords: Real-Time, Quality Control, Integrated Indicator, Stochastic Modelling.
SUMMARY
In the last decade the use of high precision Global Navigational Satellite Systems (GNSS) has
increased markedly and the range of user applications has grown well beyond the traditional
domain of surveying and engineering. This growth has been facilitated by the establishment of
Continuously Operating Reference Station (CORS) networks and a new form of positioning
known as Network Real-Time Kinematic (NRTK). However, the growth in the range of user
applications has brought with it some interesting challenges for equipment manufacturers,
software developers, and providers of NRTK services. One such challenge is ensuring that the
quality of positioning consistently satisfies the demands of the customer. Currently there is nor
reliable, nor readily available, quality indicator that can inform users as to the quality of their
positioning. A further shortcoming in NRTK positioning is that the stochastic models employed
are generally simplistic and overly optimistic. The consequence is that often the precision of
NRTK coordinates is incorrectly estimated, leading to a false sense of user confidence. There is a
considerable scope to improve the stochastic model and its ability to accurately reflect the quality
of the raw GNSS observables.
The research summarised here is concerned with the development of the Real-Time Quality
Control (RTQC) system which aims to inform both users and providers of NRTK services of the
quality, dependability, and fitness-for-purpose of their positioning in real time. This paper will
present an overview of the system, concentrating on current research into the integration of
mobile user’s and CORS network data and the development of real-time stochastic models.

TS 5C - The Quality of Measurements
Simon Fuller, Eldar Rubinov, Philip Collier, and James Seager
Integrated Quality Indicators and Stochastic Modelling for Real-Time Positioning: Overview and Implementation
FIG Congress 2010
Facing the Challenges – Building the Capacity
Sydney, Australia, 11-16 April 2010
2/16
Integrated Quality Indicators and Stochastic Modelling for Real-Time
Positioning: Overview and Implementation
Simon FULLER, Eldar RUBINOV, Philip COLLIER and James SEAGER, Australia
1. INTRODUCTION
The use of real time, high accuracy Global Navigational Satellite Systems (GNSS) has increased
markedly in the last decade and the range of user applications has become increasingly diverse.
This increase has been made possible by the rapid growth of Continuously Operating Reference
Station (CORS) networks and a new form of positioning known as Network Real-Time
Kinematic (NRTK), with achievable accuracies of 2-3cm. When utilising NRTK positioning,
GNSS errors (such as ionospheric and tropospheric delay) are estimated at CORS sites and
interpolated (in real time) for any location within the network (IAG, 2009). The availability of
instantaneous, high accuracy positioning has driven the range of GNSS applications well beyond
the traditional domain of surveying and engineering into fields such as precision agriculture, asset
mapping, construction, mining, and so on.
With an increasing level of high accuracy positioning applications, the number of critical
decisions being made on the basis of positions derived from GNSS has also increased. Hence it is
of growing importance to know that these derived positions are of high quality, dependable, and
fit for purpose. For the purposes of this research quality refers to both the accuracy and precision
of a computed position. A position is considered to be of high quality when it is both accurate
and precise. GNSS position quality is dependent on two factors: the presence and magnitude of
errors (both systematic and random) in the observations from which the position was derived, and
the suitability of the functional model relating the observations to the computed position.
The requirement for high quality, dependable positioning has placed an added responsibility on
the suppliers of NRTK services to ensure that they can consistently satisfy user requirements.
Currently there is no reliable, or readily available, quality indicator that can inform users and
providers of NRTK services in real-time of the quality of their positioning. In most cases, the
only information available is the quality indicator displayed by the GNSS receiver itself, usually
in the form of a graphical error ellipse or a numerical figure comparable to a standard deviation.
Such indicators are unreliable as they generally convey a measure of precision (e.g. standard
deviation of the positioning solution), rather than a measure of absolute accuracy or quality. In
practice, situations arise where the accuracy of the positioning solution is degraded, but the
precision is unaffected. In such circumstances internal precision-based indicators fail to identify
the problem. Hence, what is needed is an independent quality assessment procedure that will
inform users as well CORS network operators of the quality of their positioning.
It is in light of this growing need for an independent quality control system that the Cooperative
Research Centre for Spatial Information (CRC-SI) has facilitated a project called Implementation

TS 5C - The Quality of Measurements
Simon Fuller, Eldar Rubinov, Philip Collier, and James Seager
Integrated Quality Indicators and Stochastic Modelling for Real-Time Positioning: Overview and Implementation
FIG Congress 2010
Facing the Challenges – Building the Capacity
Sydney, Australia, 11-16 April 2010
3/16
and Validation of Real-Time Quality Control for CORS Networks and Mobile Users (CRC-SI,
2009). The primary goal of the project is to develop and implement a robust, independent, real-
time system that will inform users and CORS operators of the quality, dependability, and fitness-
for-purpose of NRTK positioning results. The system, dubbed the Real-Time Quality Control
(RTQC) system is unique in that the quality control computations are performed and reported in
real-time and the quality control process integrates CORS and mobile data. Although options
exist to perform quality control analysis in a post-processed mode, no such options are available
in real-time nor are they independent of proprietary algorithms.
Several key factors influenced the development of the RTQC system. One of these factors was
that the quality control computations should be based on raw observations rather than derived
products such as positions, variance/covariance matrices, residuals, and so on. This approach is
flexible, powerful, and independent of manufacturer-specific algorithms and applications.
Another key driver behind the RTQC software was the objective to replace the plethora of quality
indicators currently available with a single all-encompassing quality indicator. This quality
indicator is derived from raw observation data for each satellite/receiver combination and is
indicative of the level of noise present in the observations. A single, receiver-based, quality
indicator is then derived from a combination of the individual satellite/receiver indicators. For
stationary receivers (e.g. CORS receivers) this receiver-based indicator is used to test the quality
of positioning data. For mobile users (e.g. NRTK rovers), an integrated quality indicator is used,
which takes into account the quality of the user’s data as well as the quality of the reference
stations upon which the user’s positioning is based.
The basic design of the RTQC system is shown in Figure 1. The system is composed of three
modules: RTQC CORS, RTQC Mobile, and RTQC Premium. Raw observations are streamed
from both the CORS network and mobile users into the RTQC Hub where the quality of the
observations is assessed using the RTQC CORS and RTQC Mobile modules respectively. Two
separate modules are necessary due to the fact that the CORS stations are stationary and
significant volumes of historical data exist to aid in the quality assessment process. The same will
not generally be true of mobile users, making the quality assessment process somewhat different
and more technically challenging.

TS 5C - The Quality of Measurements
Simon Fuller, Eldar Rubinov, Philip Collier, and James Seager
Integrated Quality Indicators and Stochastic Modelling for Real-Time Positioning: Overview and Implementation
FIG Congress 2010
Facing the Challenges – Building the Capacity
Sydney, Australia, 11-16 April 2010
4/16
Figure 1: The RTQC System
For a complete overview of the RTQC system see Fuller et al (2007). This paper will focus on
providing an insight into some of the unique aspects of the RTQC system. Firstly, the
computation of quality control indicators that integrate CORS and mobile user quality
information (integrated quality indicators) will be examined. Secondly, the real time delivery of
quality information, including integrated quality indicators and stochastic models, will be
discussed. Finally, the potential use of RTQC quality indicators as the basis of a new real time
stochastic model will be explored.
2. INTEGRATED QUALITY INDICATORS
One of the unique aspects of the RTQC system is the integration of CORS and mobile user
quality information to provide more realistic and reliable indicators of position quality. To obtain
high accuracy real time GNSS positions NRTK users rely upon data from several CORS stations.
Thus the mobile user's position quality is intrinsically linked to the quality of the external data.
Therefore, when utilising data from external sources, mobile users must be able to assess its
quality and determine its fitness for use. At the same time it follows that providers of NRTK
services must be able to deliver this information to mobile users in real-time. The challenge faced
by the research team was to develop a methodology to integrate the two sets of quality
information and deliver it to the mobile user.
The approach taken in the RTQC system to this problem is shown in Figures 1 and 2. Raw
observation data from the CORS sites and mobile users is streamed to the RTQC Hub, where
quality indicators are calculated satellite-by-satellite for each CORS site and each mobile user
(RTQC CORS and RTQC Mobile in Figure 1). These individual indicators are aggregated to
provide a single quality indicator for each receiver (CORS and Mobile), at which point they are

TS 5C - The Quality of Measurements
Simon Fuller, Eldar Rubinov, Philip Collier, and James Seager
Integrated Quality Indicators and Stochastic Modelling for Real-Time Positioning: Overview and Implementation
FIG Congress 2010
Facing the Challenges – Building the Capacity
Sydney, Australia, 11-16 April 2010
5/16
submitted to the RTQC Premium module for the computation of an integrated quality indicator
(Figure 2).
Figure 2: Integrated Quality Indicator Hierarchy
Computation of the integrated quality indicator (within RTQC Premium) begins with the
individual satellite-by-satellite quality indicators, denoted by q. Whilst the derivation of q is
outside the scope of this paper it is worthwhile stating that q is representative of the level of noise
in the raw observation data. A single quality indicator for each receiver is determined from the
individual quality indicators as follows:
(1)
Where w is the receiver-based indicator, is the satellite-by-satellite quality indicator for
satellite i, and are the mean and the standard deviation of respectively, and n is the
number of satellites.
It can be seen from Equation (1) that the receiver-based indicator is the average of the individual
satellite-by-satellite quality indicators. Thus, w is akin to the global test statistic used in least
squares analysis to test the overall validity of an adjustment. Here it is used to describe the
validity of all the data observed at a single receiver. In fact, both q and w are the subject of
epoch-by-epoch statistical testing within the RTQC system to determine if they are significantly

TS 5C - The Quality of Measurements
Simon Fuller, Eldar Rubinov, Philip Collier, and James Seager
Integrated Quality Indicators and Stochastic Modelling for Real-Time Positioning: Overview and Implementation
FIG Congress 2010
Facing the Challenges – Building the Capacity
Sydney, Australia, 11-16 April 2010
6/16
different from previous epochs of data, this testing forms the basis of the RTQC alerting system
detailed in Fuller et al (2008).
The approach taken to determine w is identical for both CORS and mobile receivers, however the
data used to calculate the statistical information ( and ) is different. Significant amounts of
historical data are collected by the RTQC system for CORS receivers and these data are utilised
in the calculation of and . A detailed discussion on the use of historical data for quality
control purposes can be found in Fuller et al (2008). In the case of the mobile receiver only the
recent history (e.g. the previous fifteen minutes of data) is available for the calculation of and
.
The final step in the computation of the integrated quality indicator ( is to combine the
receiver-based indicators (w) from the CORS and mobile receivers (Figure 2). The basic logic of
network positioning (e.g. NRTK) dictates that CORS sites close to the mobile receiver have the
greatest influence on the positioning solution. It follows that similar logic should be applied in
the computation of , as it is primarily intended for use with network positioning. To reflect
this concept the calculation of is carried out in two parts:
(2)
(3)
(4)
Where is the distance between the mobile user and the ith
CORS site, is an inverse distance
dependent weighting factor for the ith
CORS site, is the receiver-based quality indicator for
the ith
CORS site, is the weighted mean of all CORS quality indicators, and is the
receiver-based quality indicator for the mobile user. Note that, whilst in theory could be zero
this is avoided in the practical implementation through appropriate checks.
Equation (2) combines the quality indicator at each CORS site using a distance-dependent
weighted mean. Only those CORS sites used to compute the mobile user’s position are included
in the calculation. If information on which CORS sites have been used in the network solution is
not available, the four closest stations are used by default. Distance-dependent weighting was
chosen in the first instance as it is a simple, easy to implement, technique that is used in network
solutions (Gao et al, 1997; Fotopoulus and Cannon, 2001; Dai et al, 2004).
is merged with to produce the integrated quality indicator ( ). Currently, this
integration step (Equation 3) is quite simplistic and the relative weightings of the mobile and

TS 5C - The Quality of Measurements
Simon Fuller, Eldar Rubinov, Philip Collier, and James Seager
Integrated Quality Indicators and Stochastic Modelling for Real-Time Positioning: Overview and Implementation
FIG Congress 2010
Facing the Challenges – Building the Capacity
Sydney, Australia, 11-16 April 2010
7/16
CORS components require further investigation. The initial weightings were chosen to reflect the
perception that CORS data is generally of a higher quality than mobile user data. It is anticipated
that the larger contribution from will help to smooth the more volatile mobile user data
without diminishing the ability of the integrated quality indicator to detect poor quality data.
Figure 3 shows an example integrated quality indicator for a rover receiver and 3 CORS sites.
Once is computed it needs to be delivered to the mobile user in real-time. The procedure for
delivering this information to mobile users in real-time is described in Section 3.
Figure 3: RTQC Quality Indicator
3. DELIVERING INTEGRATED QUALITY INDICATORS IN REAL-TIME
Early in the development of the RTQC system a choice had to be made as to which format to use
for all real time communications between users and the RTQC Hub. An incorrect choice of
format could potentially limit the information that could be transferred and have a negative
impact on the efficiency of the system. The format had to be open (freely available for
implementation), supported by all GNSS manufacturers, and contain all the raw data messages
needed for RTQC quality computations. It was determined that the most appropriate format was
the Radio Technical Commission for Maritime Services (RTCM) Version 3.x. RTCM Version
3.0 was released in 2004 with an emphasis on supporting GNSS RTK operations, which made it
an ideal choice to use with RTQC. The latest version of the standard, RTCM Version 3.1, was
released in 2006 to incorporate the messages for GNSS Network corrections (RTCM, 2006).
RTCM 3.1 contains a set of standard messages as well as a reserved set of messages for
proprietary vendor data. In RTCM 3.1 message identifiers 4001 through 4095 have been
reserved for vendor use, and vendors are able to apply for a specific RTCM 3.1 message
identifier. A vendor can obtain only one message identifier, but is free to define sub messages
within the assigned message. CRC-SI made an application to the RTCM and was granted
message identifier 4082 for the purposes of RTQC research.

TS 5C - The Quality of Measurements
Simon Fuller, Eldar Rubinov, Philip Collier, and James Seager
Integrated Quality Indicators and Stochastic Modelling for Real-Time Positioning: Overview and Implementation
FIG Congress 2010
Facing the Challenges – Building the Capacity
Sydney, Australia, 11-16 April 2010
8/16
The purpose of the RTCM 4082 message is to transmit the receiver-based quality indicators
(CORS) and the integrated quality indicator for network position solutions. To achieve this
several sub messages within the RTCM4082 message have been defined. The use of sub
messages provides flexibility to further develop and refine messages as required, as well as the
flexibility to introduce new messages in the future. Currently, the following RTCM4082 sub
messages have been defined:
Sub Message 0 – Stream ID
The Stream ID sub message is used to provide a text name and type (rover or base) for a data
stream. It is intended to be transmitted at a lower frequency (e.g. every 10 seconds) than the
quality messages in order to conserve bandwidth.
Table 1: Stream ID Message Structure
Field description Data size and type
Message number (4082) 12 bit unsigned integer
Sub message number (0) 8 bit unsigned integer
Sub message version (0) 4 bit unsigned integer
Stream type 1 bit, base = 0, rover = 1
Stream identifier 8 bit unsigned integer
Name size 7 bit unsigned integer
Stream name ‘Name size’ characters (128 maximum)
Sub Message 1 – Receiver-based Quality Indicator
The receiver-based quality indicator sub message is used to provide data quality information for a
single data stream. This message is transmitted every second.
Table 2: Receiver-Based Indicator Message Structure
Field description Data size and type
Message number (4082) 12 bit unsigned integer
Sub message number (1) 8 bit unsigned integer
Sub message version (0) 4 bit unsigned integer
Stream identifier (from sub message 0) 8 bit unsigned integer
GPS second of week, milliseconds 30 bit unsigned integer
Quality indicator 16 bit unsigned integer
Sub Message 2 - Integrated Quality Indicator

TS 5C - The Quality of Measurements
Simon Fuller, Eldar Rubinov, Philip Collier, and James Seager
Integrated Quality Indicators and Stochastic Modelling for Real-Time Positioning: Overview and Implementation
FIG Congress 2010
Facing the Challenges – Building the Capacity
Sydney, Australia, 11-16 April 2010
9/16
This sub message is used to provide integrated quality information for a mobile user based on a
combination of receiver-based indicators from CORS sites and the mobile user’s quality
indicator. The process used to compute the integrated indicator is detailed in Section 2. This
message is also transmitted every second.
Table 3: Integrated Quality Message Structure
Field description Data size and type
Message number (4082) 12 bit unsigned integer
Sub message number (2) 8 bit unsigned integer
Sub message version (0) 4 bit unsigned integer
No. streams used 8 bit unsigned integer
Stream identifier ‘No. streams used’ x 8 bit unsigned integer
GPS second of week, milliseconds 30 bit unsigned integer
Integrated quality indicator 16 bit unsigned integer
In future the RTCM 4082 message will be expanded to include sub messages for the coefficients
for a real-time stochastic model to assist with computing the final coordinates of the mobile
receiver. Real-time stochastic model generation is a separate part of the project and will be
discussed in the next section of the paper.
4. REAL-TIME STOCHASTIC MODEL GENERATION
In addition to providing mobile users with a measure of positioning quality via the RTCM 4082
message, individual RTQC quality indicators (detailed in Section 2) are also being investigated
for their potential application in the development of a real-time stochastic model. GNSS
processing is based around the least squares algorithm and as such functional and stochastic
models are required. The functional model describes the relationship between the observations
and the unknown parameters, whilst the stochastic model describes the noise of the observations.
The objective of the stochastic model is to further improve the precision of GNSS results and to
provide a more reliable picture of the positioning quality. This is achieved by utilising the correct
variance-covariance matrix of the observations in the least squares algorithm. The variances
(diagonal components of the variance-covariance matrix) describe the statistical properties of
individual observations, while the covariances (off-diagonal elements) describe the correlations
between them (Tiberius et al, 1999).
The covariance terms in the stochastic model are based on the physical correlations between
measurements. The types of correlations that have been identified include spatial correlations
(correlations between observations to different satellites for one observation type), temporal or
time correlations (correlations between epochs for one satellite and one observation type) and
cross-correlations (correlations between different observation types for a single satellite). Barnes

TS 5C - The Quality of Measurements
Simon Fuller, Eldar Rubinov, Philip Collier, and James Seager
Integrated Quality Indicators and Stochastic Modelling for Real-Time Positioning: Overview and Implementation
FIG Congress 2010
Facing the Challenges – Building the Capacity
Sydney, Australia, 11-16 April 2010
10/16
et al (1998) has shown that a fully populated variance-covariance matrix that accounts for spatial
correlations significantly improves positioning results. Numerous researchers have concentrated
on detecting and modeling temporal correlations (El-Rabbany 1994; Schwieger 2001; Tiberius et
al 1999; Tiberius and Kenselaar 2003) whilst Bona (2000) investigated cross correlations by
means of variance component estimation. Finally, Leandro and Santos (2007) have proposed an
empirical approach to building a variance covariance matrix by means of a stochastic analysis of
raw observation data.
Another approach which offers a more rigorous solution to the problem of stochastic model
generation is a least squares estimation technique known as Minimum Norm Quadratic Unbiased
Estimation (MINQUE) developed by Rao (1971) and utilised for static baseline processing by
Wang (1998). The basis of this approach is the estimation of every element in the a priori
variance-covariance matrix from the a posteriori observation residuals. Due to the recursive
nature of this technique it can be incorporated into a Kalman filter or a sequential least squares
adjustment (Kim and Langley, 2001). The problem with MINQUE and similar approaches is that
they are computationally intensive and dependent upon the understanding of the functional
model, which is generally proprietary. As such, these techniques are difficult to implement and
not suited for real-time use.
Despite the research conducted in this area, the stochastic model is not sufficiently understood
and as a result simplistic stochastic models are still being used by the GNSS community. Models
that are primarily used in practice are the elevation angle dependent model where the variances
are assigned on the basis of satellite elevation, (Euler and Goad, 1991; Jin, 1996) and the Carrier-
to-Noise (C/N0) ratio model where the variances are determined based on the C/N0 values
measured directly by most geodetic grade receivers (Langley, 1997; Hartinger and Brunner,
1999). The problem with such models is that only the variances of individual measurements are
considered, the covariance terms are largely ignored, leading to overly optimistic estimates of
positioning quality.
The RTQC research team is attempting to address the shortcomings of current approaches
through the development of a new real-time stochastic model. The basis for the new model is the
individual satellite-by-satellite RTQC quality indicator. As noted previously, individual quality
indicators represent the level of noise in the observations and as such contain stochastic
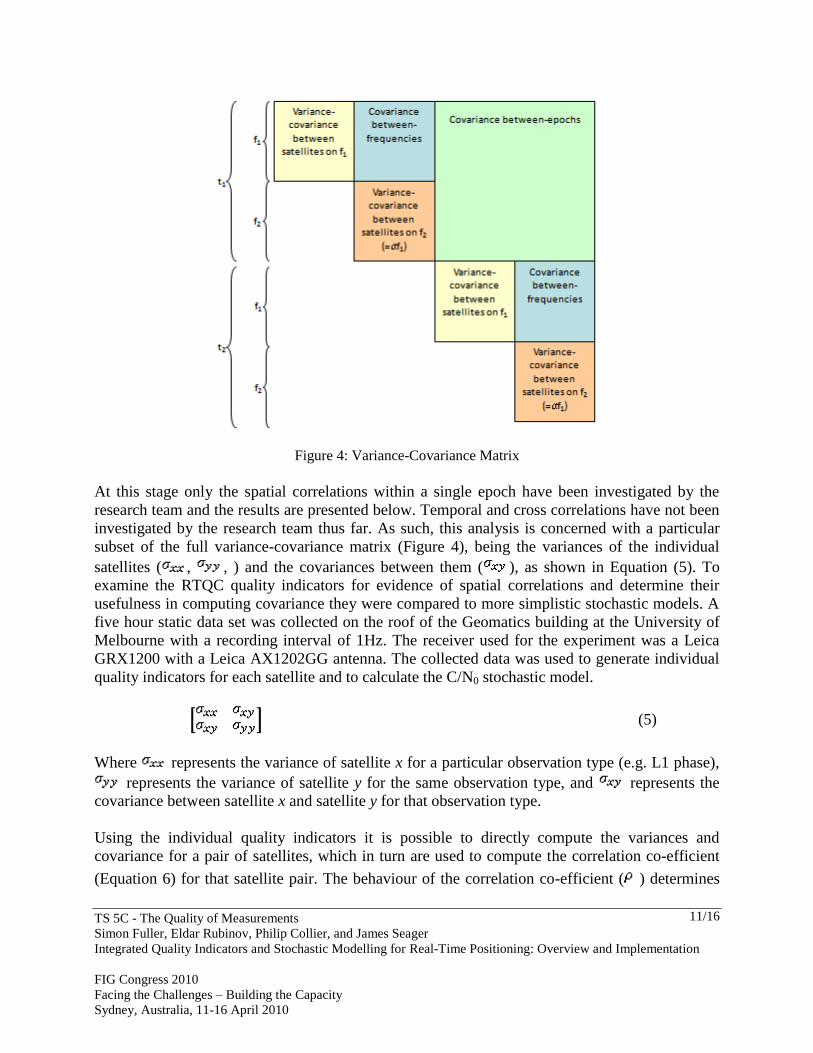
properties which can be used in the development of a stochastic model. Particular emphasis is
placed on generating a fully populated variance-covariance matrix, which is illustrated in Figure
4. It is obvious from Figure 4 that the temporal correlations have a significant impact on the
overall size of the variance-covariance matrix. Thus the size of the time correlation window (1, 2,
3, …, n epochs) emerges as an important consideration because if the size of the matrix becomes
too large, it will be difficult to compute in real-time.
TS 5C - The Quality of Measurements
Simon Fuller, Eldar Rubinov, Philip Collier, and James Seager
Integrated Quality Indicators and Stochastic Modelling for Real-Time Positioning: Overview and Implementation
FIG Congress 2010
Facing the Challenges – Building the Capacity
Sydney, Australia, 11-16 April 2010
11/16
Figure 4: Variance-Covariance Matrix
At this stage only the spatial correlations within a single epoch have been investigated by the
research team and the results are presented below. Temporal and cross correlations have not been
investigated by the research team thus far. As such, this analysis is concerned with a particular
subset of the full variance-covariance matrix (Figure 4), being the variances of the individual
satellites ( , , ) and the covariances between them ( ), as shown in Equation (5). To
examine the RTQC quality indicators for evidence of spatial correlations and determine their
usefulness in computing covariance they were compared to more simplistic stochastic models. A
five hour static data set was collected on the roof of the Geomatics building at the University of
Melbourne with a recording interval of 1Hz. The receiver used for the experiment was a Leica
GRX1200 with a Leica AX1202GG antenna. The collected data was used to generate individual
quality indicators for each satellite and to calculate the C/N0 stochastic model.
(5)
Where represents the variance of satellite x for a particular observation type (e.g. L1 phase),
represents the variance of satellite y for the same observation type, and represents the
covariance between satellite x and satellite y for that observation type.
Using the individual quality indicators it is possible to directly compute the variances and
covariance for a pair of satellites, which in turn are used to compute the correlation co-efficient
(Equation 6) for that satellite pair. The behaviour of the correlation co-efficient ( ) determines

TS 5C - The Quality of Measurements
Simon Fuller, Eldar Rubinov, Philip Collier, and James Seager
Integrated Quality Indicators and Stochastic Modelling for Real-Time Positioning: Overview and Implementation
FIG Congress 2010
Facing the Challenges – Building the Capacity
Sydney, Australia, 11-16 April 2010
12/16
the presence (or absence) of correlation in the observations for the satellite pair. Values of -1 or 1
indicate perfect correlation whilst no correlation would be indicated by .
(6)
Where represents the correlation coefficient between x and y.
Unfortunately, whilst the other stochastic models (elevation, C/N0) provide a mechanism for
computing the variances they ignore the covariance term. This would not be a problem if the
objective was simply to compare the variances generated by the different models. However, the
objective here is to determine if the quality indicators are spatially correlated and if they are
useful in the calculation of covariances, through a comparison with existing stochastic models.
This problem was resolved by examining the correlation between the observation noise
(quantified by the variance terms and in Equation 6 – available from all models), rather
than the correlation between the observations themselves (only available in the RTQC model).
This assumes that any correlation in the observation noise reflects correlation in the observations.
The basis for this assumption is the knowledge that GNSS signals travelling along similar paths
to the receiver experience similar effects with respect to systematic errors and noise. Thus, the
observation noise for one satellite will behave in a similar fashion to that of a nearby satellite.
When stated in this fashion the assumption seems counter-intuitive (how can one set of random
noise behave similarly to another) but it is in fact the basis of many of the stochastic models used
in practice, for example the elevation and C/N0 models.
Having established that examining the correlation between the observation noise of each satellite
pair would provide an acceptable means to determine if there was correlation between the
observation themselves the appropriate covariance and correlation co-efficient calculations were
performed. The results of this analysis are shown in Figure 5 for four different pairs of satellites.

TS 5C - The Quality of Measurements
Simon Fuller, Eldar Rubinov, Philip Collier, and James Seager
Integrated Quality Indicators and Stochastic Modelling for Real-Time Positioning: Overview and Implementation
FIG Congress 2010
Facing the Challenges – Building the Capacity
Sydney, Australia, 11-16 April 2010
13/16
Figure 5: Correlation Coefficients with Azimuths and Elevations

TS 5C - The Quality of Measurements
Simon Fuller, Eldar Rubinov, Philip Collier, and James Seager
Integrated Quality Indicators and Stochastic Modelling for Real-Time Positioning: Overview and Implementation
FIG Congress 2010
Facing the Challenges – Building the Capacity
Sydney, Australia, 11-16 April 2010
14/16
It is immediately apparent from Figure 5 that, according to the elevation dependent stochastic
model, there is significant correlation between the observation noise (and by association the
observations themselves) for each pair of satellites. However, the results are misleading, as they
show strong correlation ( ) in instances where the satellites are clearly in
disparate regions of the sky (e.g. PRN 28 and PRN 26, PRN 8 and PRN 17). Whilst misleading
this result is not unexpected, as the elevation dependent model relies solely on satellite elevation
when calculating variances and therefore ignores any azimuthal effects. Furthermore, the
simplistic modeling function utilised in the elevation dependent model produces variances that
change smoothly over time, hence satellites that may not have same elevation, but are descending
or ascending at similar rates will also show strong correlations. Overall the results from the
elevation dependent model serve to highlight the need for a more realistic stochastic model.
The results from the C/N0 and RTQC models are more in line with expectations of how the
correlation coefficients would behave, tending to reflect a lack of correlation ( )
when the satellites are in disparate regions of the sky. However, the influence of the satellite
elevations, as opposed to azimuthal effects, is apparent in both models. Each satellite pair
recorded an increase in correlation as the satellites descended, irrespective of azimuth (Figure 5),
although the impact of this trend on the correlation coefficient depends on the respective
elevations of the satellites (e.g. SV8 and SV17 show an increase, but the correlation remains
small). The RTQC model appears more resilient to the effects of the elevation than the C/N0
model as in all satellite pairs other than SV8 and SV11 the RTQC correlations rose slower and
were of a smaller magnitude than those of the C/N0 model (the exception being a short period at
the end of SV28 and SV26). In this respect the RTQC model appears to provide a better
representation of how we would expect the correlation to behave in reality.
The correlations present in the observation noise when using the RTQC model (Figure 5) indicate
that there will be correlation present in the individual quality indicators from which the model
was generated. Given that there is correlation between the quality indicators it follows that they
will be useful in the determination of covariance terms in a stochastic model. However, a number
of issues are raised in this analysis that will require further investigation, firstly the effect of
lower elevations on the RTQC correlations, for example the increase in the correlation seen in the
SV8 and SV11 pair, an increase that appears to be driven by the low elevations of the satellites
rather than their azimuths (it is also the only instance where the RTQC fails to outperform the
C/N0 model). Secondly, the sharp rise and fall of the correlation coefficient in the SV26 and
SV28 pair around epoch 272000 remains unexplained.
Ultimately, the stochastic model generated from RTQC will be implemented and tested within a
Reverse RTK (RRTK) algorithm under development as part of CRC-SI Project 1.04 - Delivering
Precise Positioning Services to Regional Areas. It is envisaged that the testing will be carried out
in two stages, the initial stage will involve real-time network positioning using the RTQC
stochastic model and the results (coordinates, precisions, quality indicators) compared to results
obtained using current models. Secondly, the ability of the RTQC stochastic model to aid in
ambiguity resolution will be examined, by comparing the performance of standard ambiguity
resolution algorithms with the RTQC model and with existing models.
TS 5C - The Quality of Measurements
Simon Fuller, Eldar Rubinov, Philip Collier, and James Seager
Integrated Quality Indicators and Stochastic Modelling for Real-Time Positioning: Overview and Implementation
FIG Congress 2010
Facing the Challenges – Building the Capacity
Sydney, Australia, 11-16 April 2010
15/16
5. CONCLUSION
The RTQC system was designed to quality control positioning results for CORS and mobile
receivers in NRTK environments. An overview of the RTQC research with some current
developments has been presented in this paper. Firstly an outline of the system was presented,
followed by an explanation of how the RTQC system currently combines CORS and mobile user
data to provide an integrated quality indicator and deliver this quality information to mobile users
in real-time via the RTCM 4082 message. Finally the potential for using RTQC quality indicators
in the development of a real-time stochastic model was explored.
ACKNOWLEDGMENTS
This work was conducted within the CRC for Spatial Information, established and supported
under the Australian Government’s Cooperative Research Centres Programme. The authors
would like to thank the CRC for Spatial Information as well as the industry and government
sponsors of the project for their on-going support.
REFERENCES
Barnes, J., Ackroyd, N. and Cross, P. (1998). Stochastic Modelling for Very High Precision Real-
Time Kinematic GNSS in an Engineering Environment. In FIG XXI International Congress.
Commission 6, Engineering Surveys, Brighton, UK.
CRC-SI (2009). Cooperative Research Centre for Spatial Information, Project 1.12,
http://www.crcsi.com.au/pages/project.aspx?projectid=99 (Assessed, December 2009)
Dai, L., Han, S., Wang, J., Rizos, C. (2004). Comparison of Interpolation Techniques in
Network-Based GPS Techniques. Navigation, 50(4): 277-293
Euler, H. and Goad C. (1991). On Optimal Filtering of GPS Dual Frequency Observations
without using Orbit Information. Bulletin Geodesique 65(2), 130-143.
Fotopoulus, G. and Cannon, M.E. (2001). An Overview of Multi-Reference Station Methods for
cm-Level Positioning. GPS Solutions, 4(3):1-10
Fuller S., Collier P.A., Seager J. (2007). Real-Time Quality Control for CORS Networks and
Mobile Users, Proceedings of IGNSS Symposium 2007, Sydney, Australia.
Fuller S., Collier P.A., Seager J. (2008). Assessing and Reporting Real-Time Data Quality for
GNSS Reference Stations, Journal of Spatial Science, 53(2): 149-159.
Gao, Y., Li, Z., and McLellan, J. (1997). Carrier Phase Based Regional Area Di?erential GPS for
Decimeter-Level Positioning and Navigation. Proceedings ION GPS 1997, pp. 1305-1313,
Kansas City, USA.

TS 5C - The Quality of Measurements
Simon Fuller, Eldar Rubinov, Philip Collier, and James Seager
Integrated Quality Indicators and Stochastic Modelling for Real-Time Positioning: Overview and Implementation
FIG Congress 2010
Facing the Challenges – Building the Capacity
Sydney, Australia, 11-16 April 2010
16/16
Hartinger, H. and Brunner, F.K. (1999). Variances of GPS Phase Observations: The SIGMA-ε
Model. GPS Solutions 2(4), 35-43.
IAG (2009). International Association of Geodesy, Working Group 4.5.1 – Network RTK,
http://www.wasoft.de/e/iagwg451 (Assessed, June 2009).
Jin, X.X. and de Jonge, C.D. (1996). Relationship Between Satellite Elevation and Precision of
GPS Code Observations. Journal of Navigation 49(2), 253-265.
Kim, D. and Langley, R. B. (2001). Quality Control Techniques and Issues in GNSS
Applications: Stochastic Modeling and Reliability Test. In International Symposium on
GNSS/GNSS, Jeju Island, Korea.
Langley, R. B. (1997). GPS Receiver System Noise. GPS World, 8, 40-45.
Rao, C. (1971). Estimation of Variance and Covariance Components – MINQUE Theory.
Journal of Multivariate Analysis 1, 257-275.
RTCM Standard 10403.1 for Differential GNSS Services – Version 3 (2006). www.rtcm.org
(Assessed, June 2009).
Satirapod, C. and Wang, J. (2000). Comparing Quality Indicators of GNSS Carrier Phase
Observations. Geomatics Research Australasia 73, 75-92.
Tiberius, C., Jonkman, N., and Kenselaar, F. (1999). The Stochastics of GPS observables. GPS
World 10(2), 49-54.
Wang, J., Stewart, M. P. and Tsakiri M. (1998). Stochastic Modeling for Static GPS Baseline
Data Processing. Journal of Surveying Engineering 124(4), 171-181.
CONTACTS
Mr Simon Fuller ([email protected])
Cooperative Research Centre for Spatial Information, Melbourne, Australia
Mr Eldar Rubinov ([email protected])
Cooperative Research Centre for Spatial Information, Melbourne, Australia
Dr Philip Collier ([email protected])
Cooperative Research Centre for Spatial Information, Melbourne, Australia
Dr James Seager ([email protected])
SeaGIS Pty Ltd, Melbourne, Australia


![New Approach for Stochastic Modelling of Microgrid ... · involves various stochastic modelling and simulation methods [4, 6, 7]. The survey of stochastic modelling of microgrid is](https://img.pdfslide.us/doc/110x75/5f4190048356da16412b2f00/new-approach-for-stochastic-modelling-of-microgrid-involves-various-stochastic.jpg)