Embed Size (px)
Citation preview

Integrated Modelling of European
Migration: Background,
specification and results
James Raymer, Jonathan J. Forster, Peter W.F. Smith, Jakub Bijak and Arkadiusz Wisniowski
NORFACE MIGRATION Discussion Paper No. 2012-04
www.norface-migration.org

Integrated Modelling of European Migration:
Background, speci�cation and results
James Raymer∗, Jonathan J. Forster, Peter W.F. Smith, Jakub Bijak
and Arkadiusz Wi±niowski
Southampton Statistical Sciences Research Institute
University of Southampton
May 22, 2011
Paper prepared for IMEM Workshop, Chilworth, 25-27 May
Abstract
The aims of this paper are to present the background and speci�cation of the
Integrated Modelling of European Migration (IMEM) model. Currently, in-
ternational migration data are collected by individual countries with separate
collection systems and designs. This creates problems when attempting to un-
derstand or predict population movements between countries as the reported
data are inconsistent in terms of their availability, de�nitions and quality.
Rather than wait for countries to harmonise their migration data collection
and reporting systems, we propose a model to overcome the limitations of the
various data sources. In particular, we propose a Bayesian model for harmon-
ising and correcting the inadequacies in the available data and for estimating
the completely missing �ows. The focus is on estimating recent international
migration �ows amongst countries in the European Union (EU) and Euro-
pean Free Trade Association (EFTA) from 2002 to 2008, using data collected
by Eurostat and other national and international institutions. We also in-
clude additional information provided by experts on the e�ects of undercount,
measurement and accuracy. The methodology is integrated and capable of
providing a synthetic data base with measures of uncertainty for international
migration �ows and other model parameters.
1 Introduction
In order to fully understand the causes and consequences of international popu-lation movements in Europe, researchers and policy makers need to overcome thelimitations of the various data sources, including inconsistencies in the availability,de�nitions and quality (Kelly 1987; Zlotnik 1987; Willekens 1994; Bilsborrow et al.1997; Poulain et al. 2006; Kupiszewska and Nowok 2008). In this paper, we propose aBayesian model for harmonising and correcting the inadequacies in the available data
∗Contact email at [email protected]
1

and for estimating the completely missing �ows. The focus is on estimating recentinternational migration �ows amongst countries in the European Union (EU) andEuropean Free Trade Association (EFTA) from 2002 to 2008, using data collected byEurostat and other national and international institutions. The methodology is inte-grated and capable of providing a synthetic data base with measures of uncertaintyfor international migration �ows and other model parameters.
The advantages in having a consistent and reliable set of migration �ows arenumerous. Estimates of migration �ows are needed so that governments have themeans to improve their planning policies directed at supplying particular social ser-vices or at in�uencing levels of migration. This is important because migration iscurrently (and increasingly) the major factor contributing to population change.Furthermore, our understanding of how or why populations change requires reli-able information about migrants. Without this, our ability to predict, control orunderstand that change is limited. Finally, countries are now required to provideharmonised migration �ow statistics to Eurostat as part of a new regulation passedby the European Parliament in 2007. Recognising the many obstacles with existingdata, Article 9 of the Regulation states that 'As part of the statistics process, scien-ti�cally based and well documented statistical estimation methods may be used.'1
Our proposed framework helps countries achieve this aim and provides measures ofaccuracy required for understanding the estimated parameters and �ows.
This paper is structured as follows. First, we provide some background and con-text to this work. Second, in Section 3, we specify the IMEM model, which includesa model for measurement error and a spatial interaction-type model for estimatingmissing migration �ows. In Section 4, we describe the main sources of the data usedin this paper. The construction of the priors for our model is then presented inSection 5, followed a presentation of the results. Finally, the paper concludes witha summary and a discussion.
2 Background
The reasons for international migration are many. People move for employment,family reunion or amenity reasons. Reported statistics on these �ows, on the otherhand, are relatively confusing or nonexistent. There are two main reasons. First, noconsensus exists on what exactly is a �migration�. Therefore, comparative analysessu�er from di�ering national views concerning who is a migrant. Second, the event ofmigration is rarely measured directly. Often it is inferred by a comparison of places ofresidence at two points in time or as a change in residence recorded by a populationregistration system. The challenge is compounded because countries use di�erentmethods of data collection. Migration statistics may come from administrative data,decennial population censuses or surveys.
The timing criterion used to identify international migrants varies considerablybetween countries. For population register data, international migration may refer topersons who plan to live or have lived in a di�erent country for no minimum period,three months, six months, one year, or even more. Research is needed to reconcilethe di�erent timings used to collect or analyse migration data, as well as betweendi�erent collection systems (see, e.g., de Beer et al. 2010; Nowok 2010; Nowok andWillekens forthcoming).
International migration statistics also su�er from unreliability, mainly due to
1http://www.europarl.europa.eu/sides/getDoc.do?objRefId=140109&language=EN.
2

under-registration of migrants and data coverage (Nowok et al. 2006). This is oftencaused by the collection method or by non-participation of the migrants themselves.In general, migration data may be unreliable because they are often based on in-tentions. Emigration data are particularly problematic because migrants may notnotify the population register of their movement because it is not in their interest todo so. Surveys, such as the United Kingdom's International Passenger Survey, oftendo not have large enough sample sizes to adequately capture the needed details foranalysing migration. Without a relatively large sample size, irregularities in the dataare likely to appear, such as in the country-to-country-speci�c �ows (Raymer andBijak 2009). Furthermore, �ows for certain countries may be missing for particularyears or entirely. Finally, migration data may be available only for the total popu-lation, not for more detailed demographic, socioeconomic or spatial characteristicsrequired for a particular study.
Because of all the problems associated with inconsistency and missing data, therehas been a limited amount of work carried out in the area of estimating interna-tional migration matrices. Most of the estimation work has been focused on indirectmethods for particular countries, independent of others (e.g., Warren and Peck 1980;Jasso and Rosenzweig 1982; Hill 1985; Zaba 1987; van der Gaag and van Wissen2002). There are, however, several (mostly recent) e�orts on estimating migration�ow matrices from which we can draw experiences. First, Poulain (1993, 1999) de-veloped a correction factor approach, using optimisation techniques, to reconciledi�erences between �ows reported by receiving and sending countries in Europe.The calculated correction factors provided both a means for harmonising migration�ows and a basis for understanding the reasons for the di�erences. Second, Raymer(2007, 2008) developed a hierarchical multiplicative component approach for esti-mating international migration �ows in Europe by age and sex. The multiplicativecomponent approach showed how log-linear models could be applied to model inter-national migration �ows in a systematic and hierarchical manner. Third, Brierleyet al. (2008) extended this approach in a Bayesian context and demonstrated theusefulness and �exibility of incorporating various forms of prior information and theimportance of distributions quantifying uncertainty in the estimated values. Fourth,Cohen et al. (2008) developed a gravity model to project international migration�ows for all countries in the world (see also Kim and Cohen 2010). Fifth, Abel(2010) extended Poulain's optimisation methods and applied statistical methods formissing data (i.e., expectation-maximisation) to estimate �ows amongst 15 Euro-pean Union countries.
Finally, and most recently, researchers at the Netherlands Interdisciplinary De-mographic Institute (NIDI, The Hague), the Central European Forum for Migrationand Population Research (CEFMR, Warsaw), the Southampton Statistical SciencesResearch Institute (S3RI) and the Université Catholique de Louvain (Charleroi) col-laborated on a Eurostat-funded project to estimate international migration stocksand �ows in Europe. The methodology adopted by the MIMOSA (MIgration MOd-elling for Statistical Analyses) team represented a two-stage hierarchical procedure.The �rst stage, described in de Beer et al. (2010), harmonises the �ows amongst 19EU/EFTA countries providing both sending and receiving data by applying an ex-tension of Poulain's (1999; see also Abel 2010) optimisation procedure benchmarkedto Sweden's migration �ow data, which were assumed to be measured more or lesswithout error. The second stage, described in Raymer et al. (2011), estimates themissing marginal data and associations between countries by using the harmonised�ows and covariate information. Both stages are set within a multiplicative frame-
3

work for analysing migration �ows. No measures of uncertainty are provided andthe approach is sensitive to the model assumptions and the hierarchical estimationprocedure. However, the estimates produced are considered reasonable and currentlyrepresent the most extensive and comprehensive set of harmonised migration �owestimates in Europe. These estimates may be downloaded from NIDI's website. 2
The above research has led us to the conclusion that a Bayesian approach o�ersthe best opportunity for integrating all the di�erent types of data, covariate infor-mation and expert judgements. There are two important advantages of adoptinga Bayesian approach in the context of the proposed research. First, the method-ology o�ers a coherent and probabilistic mechanism for describing various sourcesof uncertainty contained in the various levels of modelling. These include the mi-gration processes, models, model parameters and expert judgements. Second, themethodology provides a formal mechanism for the inclusion of expert judgement tosupplement the de�cient migration data. As noted by Willekens (1994), a Bayesianapproach for modelling international migration is particularly well-suited for incor-porating expert judgement to substitute for data shortages.
Applications of Bayesian methods in migration and population analyses includepredictions of international migration from time series models (Gorbey et al. 1999;Bijak and Wi±niowski 2010; Bijak 2011; Mitchell et al. 2011). They have also beenused to model non-migratory spatial movements (Congdon 2001), produce forecastsof fertility (Tuljapurkar and Boe 1999) and mortality (Czado et al. 2005; Girosi andKing 2008; Chunn et al. 2010), and to estimate population sizes under situationsof very limited information (Daponte et al. 1999). A thorough overview of appli-cations of Bayesian methods in social sciences, including demographic modelling inthe multistate framework, is o�ered by Lynch (2007).
3 Methodology
There are two key design aspects of our methodology: (1) the development of theunderlying statistical framework and (2) the speci�cation of prior information. Weaddress each of these in turn below.
3.1 The Statistical Modelling Framework
The data of interest can be conveniently expressed in a two-way contingency tableor matrix showing the origin-to-destination �ows with the cell counts correspondingto the number of migrants in a speci�ed period. We observe counts (�ows) zkijt fromcountry i to country j during year t reported by either the sending S or receiving Rcountry, where k ∈ {S,R}. These �ows can be represented by matrices ZS
t and ZRt :
ZSt =
0 zS12t zS13t . . . zS1ntzS21t 0 zS23t . . . zS2ntzS31t zS32t 0 . . . zS3nt...
......
. . ....
zSn1t zSn2t zSn3t . . . 0
ZRt =
0 zR12t zR13t . . . zR1ntzR21t 0 zR23t . . . zR2ntzR31t zR32t 0 . . . zR3nt...
......
. . ....
zRn1t zRn2t zRn3t . . . 0
.
2http://www.nidi.nl/Pages/NID/24/928.bGFuZz1VSw.html.
4
The interest of this research is to estimate a matrix Yt of true migration �ows withunknown entries:
Yt =
0 y12t y13t . . . y1nty21t 0 y23t . . . y2nty31t y32t 0 . . . y3nt...
......
. . ....
yn1t yn2t yn3t . . . 0
.
For all i, j and t, we assume that zkijt follows a Poisson distribution
zSijt ∼ Po(µSijt), (1)
zRijt ∼ Po(µRijt). (2)
3.2 Measurement error model
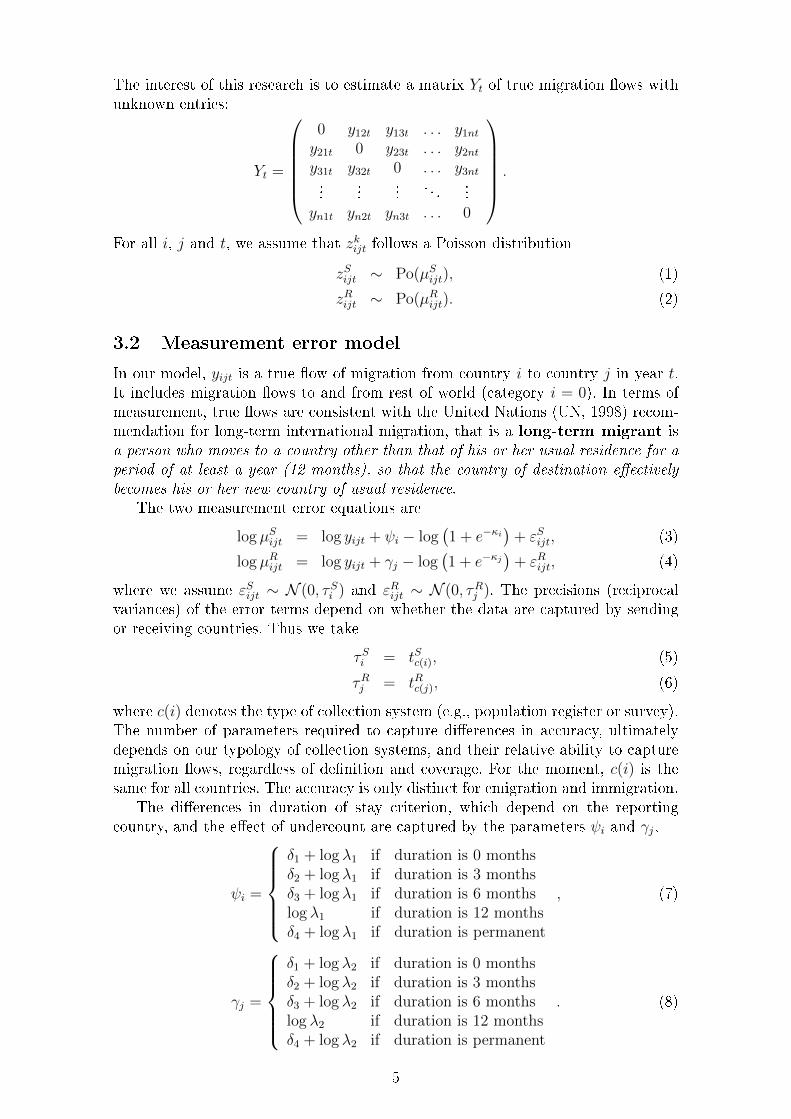
In our model, yijt is a true �ow of migration from country i to country j in year t.It includes migration �ows to and from rest of world (category i = 0). In terms ofmeasurement, true �ows are consistent with the United Nations (UN, 1998) recom-mendation for long-term international migration, that is a long-term migrant isa person who moves to a country other than that of his or her usual residence for aperiod of at least a year (12 months), so that the country of destination e�ectivelybecomes his or her new country of usual residence.
The two measurement error equations are
log µSijt = log yijt + ψi − log(1 + e−κi
)+ εSijt, (3)
log µRijt = log yijt + γj − log(1 + e−κj
)+ εRijt, (4)
where we assume εSijt ∼ N (0, τSi ) and εRijt ∼ N (0, τRj ). The precisions (reciprocalvariances) of the error terms depend on whether the data are captured by sendingor receiving countries. Thus we take
τSi = tSc(i), (5)
τRj = tRc(j), (6)
where c(i) denotes the type of collection system (e.g., population register or survey).The number of parameters required to capture di�erences in accuracy, ultimatelydepends on our typology of collection systems, and their relative ability to capturemigration �ows, regardless of de�nition and coverage. For the moment, c(i) is thesame for all countries. The accuracy is only distinct for emigration and immigration.
The di�erences in duration of stay criterion, which depend on the reportingcountry, and the e�ect of undercount are captured by the parameters ψi and γj,
ψi =
δ1 + log λ1 if duration is 0 monthsδ2 + log λ1 if duration is 3 monthsδ3 + log λ1 if duration is 6 monthslog λ1 if duration is 12 monthsδ4 + log λ1 if duration is permanent
, (7)
γj =
δ1 + log λ2 if duration is 0 monthsδ2 + log λ2 if duration is 3 monthsδ3 + log λ2 if duration is 6 monthslog λ2 if duration is 12 monthsδ4 + log λ2 if duration is permanent
. (8)
5

The δm parameter measures the e�ect of a particular duration of stay de�nition usedby country i. The parameters are constrained so that δ1 > δ2 > δ3 > 0 and δ4 < 0in the following way,
δ1 = d1 + d2 + d3,
δ2 = d2 + d3,
δ3 = d3,
δ4 = −d4,
where dk > 0 are auxiliary parameters. The λr parameters measure the e�ect of theundercount with the assumption that λr ∈ (0, 1).
Finally, the κi parameter is a normally distributed country-speci�c random e�ect
κi ∼ N (νi, ζi),
where νi = νm(i) is a group-speci�c mean and ζi = ζm(i) is a group-speci�c precisionand m(i) denotes a type of coverage assumed for country i. For the time being,there are two coverage types, that is, m(i) ∈ {standard, excellent}. The logistictransformation of κ in Equations 3 and 4 ensures that the function is bounded withina range (0, 1) on the linear scale. It can be interpreted in terms of the di�erences incoverage with respect to the UN de�nition of migration.
For the migration to and from the rest of world there is only one equation perout�ow and in�ow, respectively, i.e.,
log µSi0t = log yi0t + ψi + εSi0t, for all i and t (9)
log µR0jt = log y0jt + γj + εR0jt, for all j and t, (10)
All other parameters remain same as described above, except for ψi and γj, which arede�ned as in Equations 7 and 8 with λ1 and λ2 replaced with λ3 and λ4, respectively.Note, that in the measurement of the �ows to and from the rest of world we assumea perfect coverage for all countries, i.e., there are no country-speci�c random e�ects.
3.3 Migration model
The true �ows of migration may be modelled according to a set of covariate in-formation. Here, we rely on migration theory and empirical evidence to drive thedevelopment of the model (see, e.g., Jennissen 2004; Abel 2010; Raymer et al. 2011).The explanatory variables can be grouped into economic, demographic and geo-graphic ones. Consider the following model of migration:
log yijt = α1 + α2 log(Pit) + α3 log(Pjt) + α4Cij + α5 log(Tijt)+
α6 log(Git/Gjt) + α7Aijt + α8(Sij) + ξijt, (11)
where α = (α1, . . . , α8)′ is a vector of parameters. The random term ξ is assumed to
be normally distributed with 0 mean and constant precision τy, following Brierleyet al. (2008).
The following set of covariates is used:
1. The mid-year populations (averages of 1 January populations of subsequentyears) in sending and receiving country, denoted as Pit and Pjt; source: NewCronosdatabase of Eurostat.
6

2. Dummy variable indicating contiguity (or neighbouring countries) with 1 ifcountries i and j have a common border and 0 otherwise, Cij; source: Mayerand Zignago (2006). Contiguity between all Scandinavian countries are as-sumed.
3. The ratio of the Gross National Income per capita in sending and receivingcountries, Git/Gjt; source: World Development Indicators (2010).
4. International trade between origin and destination countries expressed as im-port in current USD, Tijt; source: UN Commodity Statistics Database 3.
5. Dummy variable for accession Aijt. It is equal to 1 for the �ows between tencountries which joined the EU in 2004 and Ireland, the United Kingdom andSweden, i.e., the countries that did not restrict their labour to these movementsduring the years 2004-2008.
6. Origin-destination migrant stocks based on the 2000 population censuses round,Sij; source: Parsons et al. (2005).
All non-indicator variables were divided by their means and then logged (migrantstocks are in levels due to zero entries in the data).4
For modelling �ows to the rest of world, we use a model with additional covariatesbased on Raymer et al. (2011).
log yi0t = β1 + β2 log(Pit) + β3 log(Git) + β4Hi + β5 log(S0i)+
β6 log(Eit) + β7 log(Lit) + ξi0t, (12)
and for �ows from the rest of world
log y0jt = β8 + β9 log(Pjt) + β10 log(Gjt) + β11Hj + β12 log(S0j)+
β13 log(Ejt) + β14 log(Ljt) + ξ0jt. (13)
The errors, ξi0t and ξ0jt, are normally distributed with mean zero and precisions τ0Sand τ0R, respectively. The additional covariates are
1. A dummy indicating if the country was a member of the Schengen agreementas of 1 January 2007, Hi.
2. Stocks of migrants born outside the EU and the EFTA countries, S0i and S0j;source: Parsons et al. (2005).
3. Share of the population older than 65 years, Eit; source: Population ReferenceBureau's World Population Data Sheet 2002-20085.
4. Life expectancy at birth of women in years, Ljt; source: Population ReferenceBureau's World Population Data Sheet 2002-20086.
3http://comtrade.un.org, accessed July 20104For Liechtenstein the following imputations were carried out: (1) GNIs per capita were assumed
the same as in Switzerland (CH); (2) Trade �ows are taken from the statistical o�ce's website,http://www.llv.li, accessed July 2010, and converted from CHF to USD. Exports from Liechtensteinto other countries was approximated. Trade between LI and CH is calculated using ratios aspresented in `Liechtenstein - Industrial location', http://www.liechtenstein.li/en/, accessed July2010, with the result that exports from LI to CH was estimated to be 11% of the total and theimports from CH to LI to be 33% of the total.
5http://www.prb.org, accessed February 20106http://www.prb.org, accessed February 2010
7

4 Data Collection
For this study, we collected as much data as we could on on the migration �owsamongst the 31 countries in the EU and EFTA from 2002 to 2008.7 Our modelincludes �ows to and from rest of world, which is needed to obtain the total immi-gration and emigration �ows for each country. In the future, we hope to extend themodelling to include age, sex and the year 2009, for which some data are startingto become available (at the time of this writing).
The migration �ow data used in the project comes primarily from the Eurostatdata base, which relies on the annual Joint Questionnaire on Migration Statisticssent to all national statistical agencies in the European Union. This questionnaireis coordinated by the Council of Europe, the United Nations Statistical Division,the United Nations Economic Commission for Europe and the International LabourOrganization. In some cases, we obtained additional information from websites or-ganised and maintained by national statistical agencies. Furthermore, as describedin the previous section, we collected covariate information for use in the migrationmodel to estimate missing �ows.
Before constructing the model, we spent a lot of time trying to understand thecountry-speci�c measurements underlying the reported statistics. Here, we reliedheavily on Poulain et al. (2006), two MIMOSA reports (Kupiszewska andWi±niowski2009; van der Erf 2009) and our own analyses (van der Erf 2010). We found that notwo countries used the same collection system and often di�erent conceptualisationsof migration are utilised. In many cases, these conceptualisations di�ered withincountries, depending on whether the migrant was a foreigner, EU/EFTA memberor national of the sending or receiving country.
5 Constructing the priors
In order to produce realistic and meaningful estimates of migration �ows, expertopinions are required. The Bayesian approach permits expert opinion to be com-bined with the data to strengthen the inference. For this study, we sought expertinformation on undercount, e�ects of duration and accuracy of migration data col-lection systems for the purpose of informing our priors for the measurement model.The Bayesian approach also facilitates the combination of multiple data sources,with their di�ering levels of error, as well as prior information about the structuresof the migration processes, into a single prediction with an associated measure ofuncertainty.
The priors for duration of stay, undercount and precision are elicited from theexperts by means of a Delphi survey (see Wi±niowski et al. 2011). For the duration ofstay parameters, δ1, δ2 and δ3, we assume a mixture of log-normal priors for auxiliaryparameters dk, which were obtained from the experts. The resulting interquartileranges and medians for the mixtures are presented in Table 1. The interpretationof these priors is straightforward. For example, consider the median of six monthsduration parameter, δ3, which is equal to 1.22. This value implies that �ows measuredby using a six-month duration are expected to be 22% larger than the correspondingtrue �ows measured with a 12 month duration criterion. Note that the prior for δ4
7The following assumptions with respect to the data have been made: (1) For the Netherlands -category `Unknown' in the data on emigration was distributed proportionally to all the countries;(2) Category `ex-Czechoslovakia' in the migration from and to Denmark was distributed to theCzech Republic and Slovakia proportionally for each year.
8
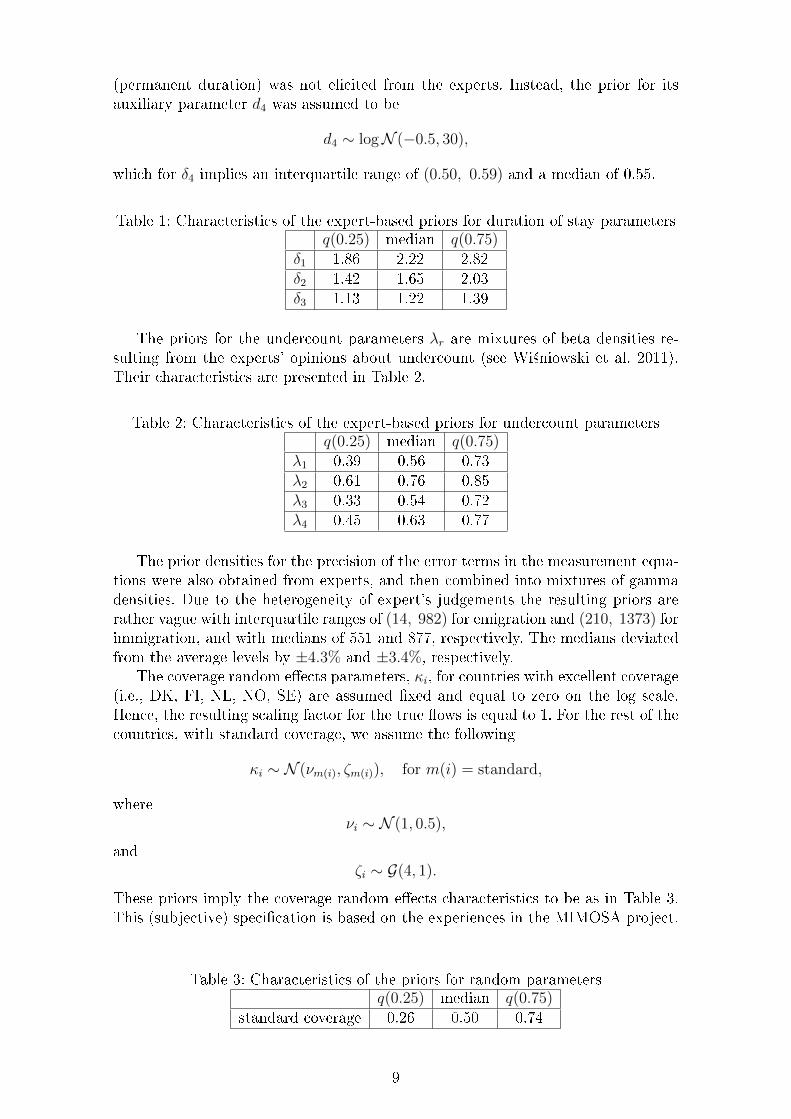
(permanent duration) was not elicited from the experts. Instead, the prior for itsauxiliary parameter d4 was assumed to be
d4 ∼ logN (−0.5, 30),
which for δ4 implies an interquartile range of (0.50, 0.59) and a median of 0.55.
Table 1: Characteristics of the expert-based priors for duration of stay parametersq(0.25) median q(0.75)
δ1 1.86 2.22 2.82δ2 1.42 1.65 2.03δ3 1.13 1.22 1.39
The priors for the undercount parameters λr are mixtures of beta densities re-sulting from the experts' opinions about undercount (see Wi±niowski et al. 2011).Their characteristics are presented in Table 2.
Table 2: Characteristics of the expert-based priors for undercount parametersq(0.25) median q(0.75)
λ1 0.39 0.56 0.73λ2 0.61 0.76 0.85λ3 0.33 0.54 0.72λ4 0.45 0.63 0.77
The prior densities for the precision of the error terms in the measurement equa-tions were also obtained from experts, and then combined into mixtures of gammadensities. Due to the heterogeneity of expert's judgements the resulting priors arerather vague with interquartile ranges of (14, 982) for emigration and (210, 1373) forimmigration, and with medians of 551 and 877, respectively. The medians deviatedfrom the average levels by ±4.3% and ±3.4%, respectively.
The coverage random e�ects parameters, κi, for countries with excellent coverage(i.e., DK, FI, NL, NO, SE) are assumed �xed and equal to zero on the log scale.Hence, the resulting scaling factor for the true �ows is equal to 1. For the rest of thecountries, with standard coverage, we assume the following
κi ∼ N (νm(i), ζm(i)), for m(i) = standard,
whereνi ∼ N (1, 0.5),
andζi ∼ G(4, 1).
These priors imply the coverage random e�ects characteristics to be as in Table 3.This (subjective) speci�cation is based on the experiences in the MIMOSA project.
Table 3: Characteristics of the priors for random parametersq(0.25) median q(0.75)
standard coverage 0.26 0.50 0.74
9
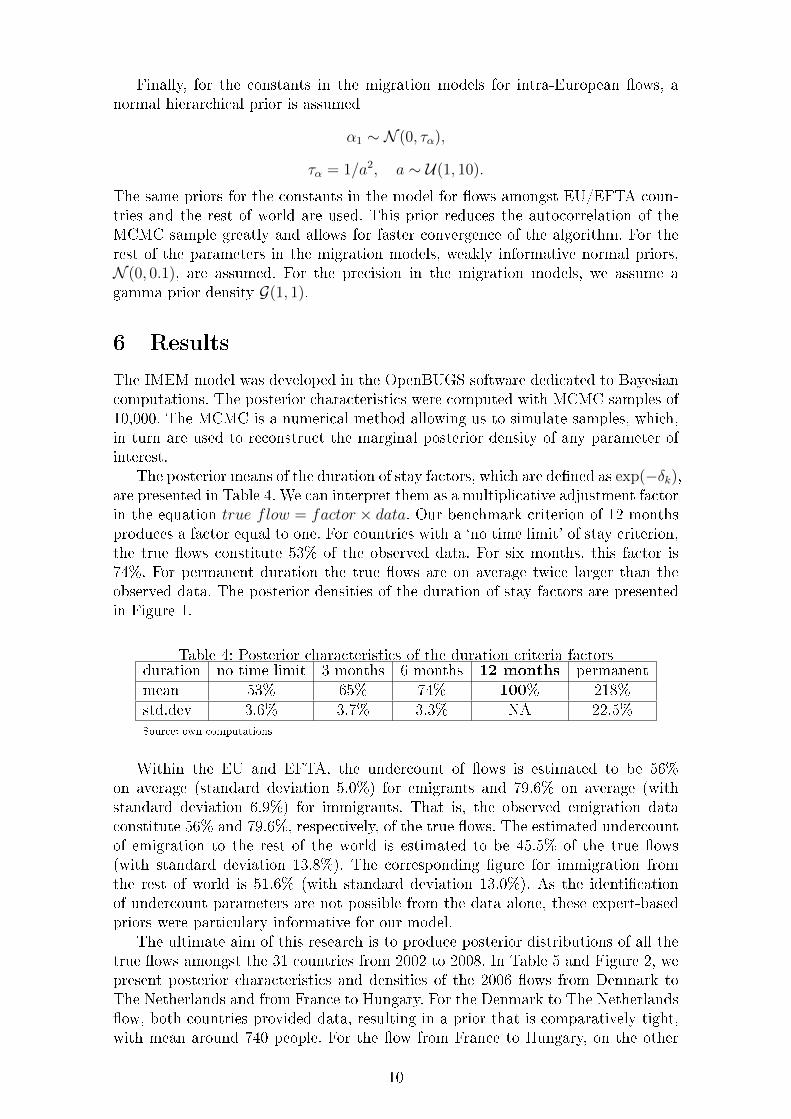
Finally, for the constants in the migration models for intra-European �ows, anormal hierarchical prior is assumed
α1 ∼ N (0, τα),
τα = 1/a2, a ∼ U(1, 10).The same priors for the constants in the model for �ows amongst EU/EFTA coun-tries and the rest of world are used. This prior reduces the autocorrelation of theMCMC sample greatly and allows for faster convergence of the algorithm. For therest of the parameters in the migration models, weakly informative normal priors,N (0, 0.1), are assumed. For the precision in the migration models, we assume agamma prior density G(1, 1).
6 Results
The IMEM model was developed in the OpenBUGS software dedicated to Bayesiancomputations. The posterior characteristics were computed with MCMC samples of10,000. The MCMC is a numerical method allowing us to simulate samples, which,in turn are used to reconstruct the marginal posterior density of any parameter ofinterest.
The posterior means of the duration of stay factors, which are de�ned as exp(−δk),are presented in Table 4. We can interpret them as a multiplicative adjustment factorin the equation true flow = factor × data. Our benchmark criterion of 12 monthsproduces a factor equal to one. For countries with a `no time limit' of stay criterion,the true �ows constitute 53% of the observed data. For six months, this factor is74%. For permanent duration the true �ows are on average twice larger than theobserved data. The posterior densities of the duration of stay factors are presentedin Figure 1.
Table 4: Posterior characteristics of the duration criteria factorsduration no time limit 3 months 6 months 12 months permanentmean 53% 65% 74% 100% 218%std.dev 3.6% 3.7% 3.3% NA 22.5%Source: own computations
Within the EU and EFTA, the undercount of �ows is estimated to be 56%on average (standard deviation 5.0%) for emigrants and 79.6% on average (withstandard deviation 6.9%) for immigrants. That is, the observed emigration dataconstitute 56% and 79.6%, respectively, of the true �ows. The estimated undercountof emigration to the rest of the world is estimated to be 45.5% of the true �ows(with standard deviation 13.8%). The corresponding �gure for immigration fromthe rest of world is 51.6% (with standard deviation 13.0%). As the identi�cationof undercount parameters are not possible from the data alone, these expert-basedpriors were particulary informative for our model.
The ultimate aim of this research is to produce posterior distributions of all thetrue �ows amongst the 31 countries from 2002 to 2008. In Table 5 and Figure 2, wepresent posterior characteristics and densities of the 2006 �ows from Denmark toThe Netherlands and from France to Hungary. For the Denmark to The Netherlands�ow, both countries provided data, resulting in a prior that is comparatively tight,with mean around 740 people. For the �ow from France to Hungary, on the other
10
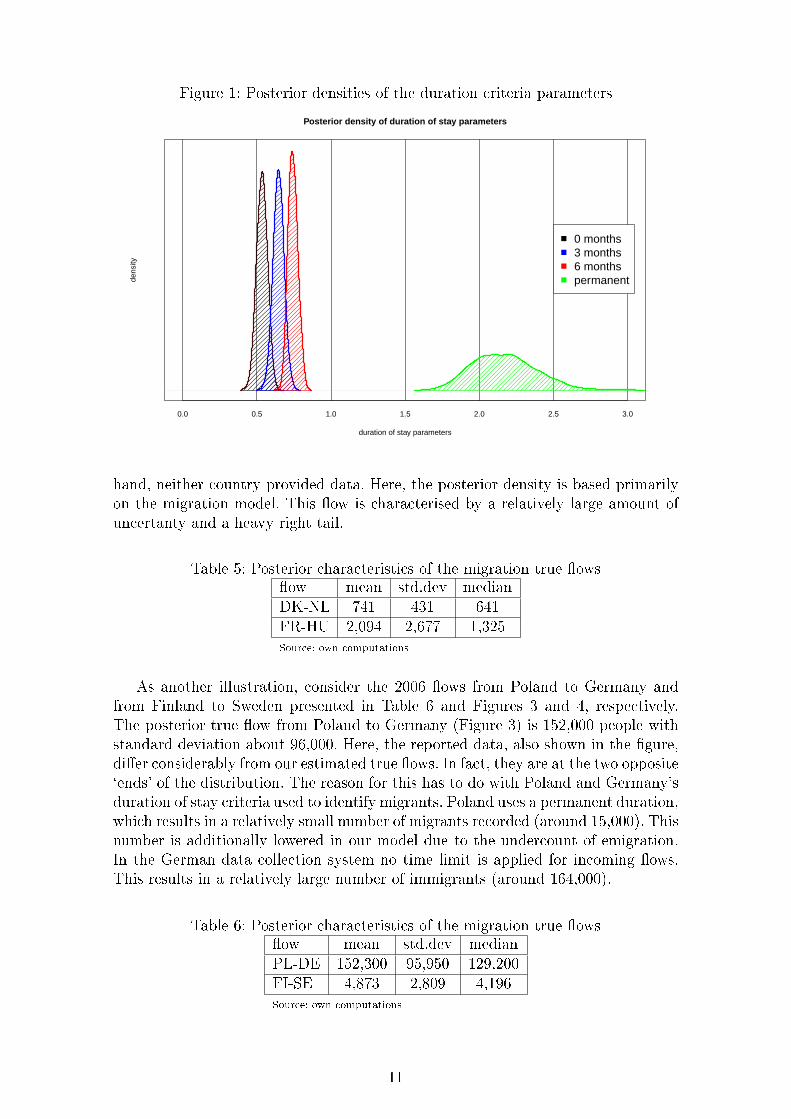
Figure 1: Posterior densities of the duration criteria parameters
0.0 0.5 1.0 1.5 2.0 2.5 3.0
Posterior density of duration of stay parameters
duration of stay parameters
dens
ity
0 months3 months6 monthspermanent
hand, neither country provided data. Here, the posterior density is based primarilyon the migration model. This �ow is characterised by a relatively large amount ofuncertanty and a heavy right tail.
Table 5: Posterior characteristics of the migration true �ows�ow mean std.dev medianDK-NL 741 431 641FR-HU 2,094 2,677 1,325Source: own computations
As another illustration, consider the 2006 �ows from Poland to Germany andfrom Finland to Sweden presented in Table 6 and Figures 3 and 4, respectively.The posterior true �ow from Poland to Germany (Figure 3) is 152,000 people withstandard deviation about 96,000. Here, the reported data, also shown in the �gure,di�er considerably from our estimated true �ows. In fact, they are at the two opposite`ends' of the distribution. The reason for this has to do with Poland and Germany'sduration of stay criteria used to identify migrants. Poland uses a permanent duration,which results in a relatively small number of migrants recorded (around 15,000). Thisnumber is additionally lowered in our model due to the undercount of emigration.In the German data collection system no time limit is applied for incoming �ows.This results in a relatively large number of immigrants (around 164,000).
Table 6: Posterior characteristics of the migration true �ows�ow mean std.dev medianPL-DE 152,300 95,950 129,200FI-SE 4,873 2,809 4,196Source: own computations
11

Figure 2: Posterior densities of the migration true �ows
0 1000 2000 3000 4000 5000 6000
Posterior density of true flows in 2006
flows of migrants
dens
ity
DK−NLDK−NLFR−HU
Figure 3: Posterior densities of the migration true �ows
0e+00 1e+05 2e+05 3e+05 4e+05 5e+05
Posterior density of true flows PL.DE in 2006
flows of migrants
dens
ity
EMI = 14950IMMI = 163643mean = 152321median = 129200q10% = 64440q90% = 266200
EM
I
IMM
Im
ean
med
ian
q10%
q90%
In Figure 4, a posterior density of the 2006 migration �ow from Finland toSweden is presented. The mean is around 4,900 migrants with standard deviation ofaround 2,800. We also observe that the data reported by both sending and receivingcountries are very close to each other (around 3,000). Both reported �ows lie withina range of the highest posterior density but they seem to be signi�cantly lower thanthe mean or median of the posterior true �ow. The reason for this is due to ourinclusion of expert information on the undercount of immigration and emigration.In the MIMOSA project, Sweden's immigration data represented the benchmark
12
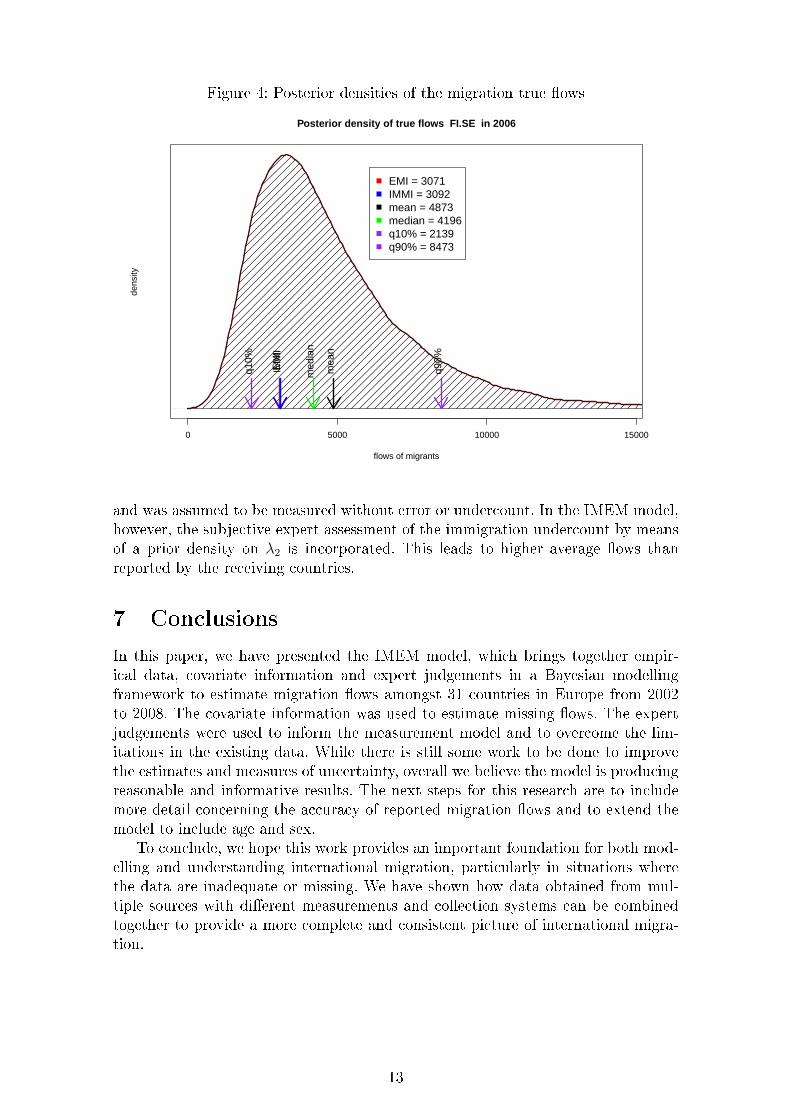
Figure 4: Posterior densities of the migration true �ows
0 5000 10000 15000
Posterior density of true flows FI.SE in 2006
flows of migrants
dens
ity
EMI = 3071IMMI = 3092mean = 4873median = 4196q10% = 2139q90% = 8473
EM
IIM
MI
mea
n
med
ian
q10%
q90%
and was assumed to be measured without error or undercount. In the IMEM model,however, the subjective expert assessment of the immigration undercount by meansof a prior density on λ2 is incorporated. This leads to higher average �ows thanreported by the receiving countries.
7 Conclusions
In this paper, we have presented the IMEM model, which brings together empir-ical data, covariate information and expert judgements in a Bayesian modellingframework to estimate migration �ows amongst 31 countries in Europe from 2002to 2008. The covariate information was used to estimate missing �ows. The expertjudgements were used to inform the measurement model and to overcome the lim-itations in the existing data. While there is still some work to be done to improvethe estimates and measures of uncertainty, overall we believe the model is producingreasonable and informative results. The next steps for this research are to includemore detail concerning the accuracy of reported migration �ows and to extend themodel to include age and sex.
To conclude, we hope this work provides an important foundation for both mod-elling and understanding international migration, particularly in situations wherethe data are inadequate or missing. We have shown how data obtained from mul-tiple sources with di�erent measurements and collection systems can be combinedtogether to provide a more complete and consistent picture of international migra-tion.
13
Acknowledgements
This research is part of the Integrated Modelling of European Migration (IMEM)project funded by the New Opportunities for Research Funding Agency Co-operationin Europe (NORFACE). The authors would like to thank the migration data expertsfor providing their judgements, as well as the other IMEM team members, Guy J.Abel, Solveig Christiansen, Nico Keilman and Rob van der Erf, for their commentsand suggestions on this work.
References
[1] Abel GJ (2010) Estimation of international migration �ow tables in Eu-rope. Journal of the Royal Statistical Society, Series A (Statistics in Society)173(4):797-825.
[2] Bijak J (2011) Forecasting international migration in Europe: A Bayesian view.Dordrecht: Springer.
[3] Bijak J and Wi±niowski A (2010) Bayesian forecasting of immigration to se-lected European countries by using expert knowledge. Journal of the RoyalStatistical Society, Series A (Statistics in Society) 173(4):775-796.
[4] Bilsborrow RE, Graeme H, Amarjit SO, and Zlotnik H (1997) Internationalmigration statistics: Guidelines for improving data collection systems. Geneva:International Labour O�ce.
[5] Brierley MJ, Forster JJ, McDonald JW and Smith PWF (2008) Bayesian esti-mation of migration �ows. In International migration in Europe: Data, modelsand estimates, pp. 149-174. Wiley: Chichester.
[6] Chunn JL, Raftery AE and Gerland P (2010) Bayesian probabilistic projectionsof life expectancy for all countries. Working Paper no. 105, Center for Statisticsand the Social Sciences, University of Washington.
[7] Cohen JE, Roig M, Reuman DC and GoGwilt C (2008) International migrationbeyond gravity: A statistical model for use in population projections. Proceed-ings of the National Academy of Sciences 105(40):15269-15274.
[8] Congdon P (2001) The development of gravity models for hospital patient �owsunder system change: A Bayesian modelling approach. Health Care Manage-ment Science 4(4):289-304.
[9] Council of Europe (2002) Recent demographic developments in Europe. Stras-bourg: Council of Europe.
[10] Czado C, Delwarde A and Denuit M (2005) Bayesian Poisson log-bilinear mor-tality projections. Insurance: Mathematics and Economics 36(3):260-284.
[11] Daponte BO, Kadane JB andWolfson LJ (1997) Bayesian demography: Project-ing the Iraqi Kurdish population, 1977-1990. Journal of the American StatisticalAssociation 92:1256-1267.
14

[12] de Beer J, Raymer J, van der Erf R and van Wissen L (2010) Overcoming theproblems of inconsistent international migration data: A new method appliedto �ows in Europe. European Journal of Population 26:459-481.
[13] Girosi F and King G (2008) Demographic forecasting. Princeton: PrincetonUniversity Press.
[14] Gorbey S, James D and Poot J (1999) Population forecasting with endogenousmigration: An application to trans-Tasman migration. International RegionalScience Review 22(1):69-101.
[15] Hill K (1985) Indirect approaches to assessing stocks and �ows of migrants. InImmigration statistics: A story of neglect, Levine DB, Hill K and Warren R,eds., pp. 205-224. Washington, DC: National Academy Press.
[16] Jasso G and Rosenzweig MR (1982) Estimating the emigration rates of legal im-migrants using administrative and survey data: The 1971 cohort of immigrantsto the United States. Demography 19:279-290.
[17] Jennissen R (2004) Macro-economic determinants of international migration inEurope. PhD Thesis, Rijksuniversiteit Groningen.
[18] Kelly JJ (1987) Improving the comparability of international migration statis-tics: Contributions by the Conference of European Statisticians from 1971 todate. International Migration Review 21:1017-1037.
[19] Kim K and Cohen JE (2010) Determinants of international migration �owsto and from industrialized countries: A panel data approach beyond gravity.International Migration Review 44(4):899-932.
[20] Kupiszewska D and Nowok B (2008) Comparability of statistics on internationalmigration �ows in the European Union. In International migration in Europe:Data, models and estimates, Raymer J and Willekens F, eds., pp. 41-71. Chich-ester: Wiley.
[21] Kupiszewska D and Wi±niowski A (2009) Availability of statistical data onmigration and migrant population and potential supplementary sources for dataestimation. MIMOSA Deliverable 9.1 A Report, Netherlands InterdisciplinaryDemographic Institute, The Hague.
[22] Lynch SM (2007) Introduction to applied Bayesian statistics and estimation forsocial scientists. New York: Springer.
[23] Mayer T and S Zignago (2006) Notes on CEPIIs distances measures. Centre�dEtudes Prospectives �dInformations Internationales (CEPII), Paris.
[24] Mitchell J, Pain N and Riley R (2011) The drivers of international migration tothe UK: A panel-based Bayesian model averaging approach. Paper presentedat the Migration: Economic Change, Social Challenge Conference, UniversityCollege London.
[25] Nowok B (2010) Harmonization by simulation: A contribution to comparableinternational migration statistics in Europe. Amsterdam: Rozenberg Publishers.
15

[26] Nowok B, Kupiszewska D and Poulain M (2006) Statistics on internationalmigration �ows. In THESIM: Towards Harmonised European Statistics on In-ternational Migration, Poulain M, Perrin N and Singleton A, eds., pp. 203-231.Louvain-la-Neuve: UCL Presses Universitaires de Louvain.
[27] Nowok B and Willekens F (forthcoming) A probabilistic framework forharmonisation of migration statistics. Population, Space and Place DOI:10.1002/psp.624.
[28] Parsons CR, R Skeldon, TL Walmsley, and LA Winters (2005) Quantifyingthe International Bilateral Movements of Migrants. 8th Annual Conference onGlobal Economic Analysis, Lübeck, Germany, June 9-11.
[29] Poulain M (1993) Confrontation des statistiques de migrationintra-europ¤»�ennes: vers une matrice complète? European Journal ofPopulation 9(4):353-381.
[30] Poulain M (1999) International migration within Europe: Towards more com-plete and reliable data? Working Paper No. 37, Conference of European Statis-ticians, Statistical O�ce of the European Communities (Eurostat), Perugia,Italy.
[31] Poulain M, Perrin N and Singleton A, eds. (2006) THESIM: Towards Har-monised European Statistics on International Migration. Louvain: UCL Presses.
[32] Raymer J (2007) The estimation of international migration �ows: A generaltechnique focused on the origin-destination association structure. Environmentand Planning A 12:371-388.
[33] Raymer J (2008) Obtaining an overall picture of population movement in theEuropean Union. In International migration in Europe: Data, models and esti-mates, Raymer J and Willekens F, eds., pp. 209-234. Chichester: Wiley.
[34] Raymer J and Bijak J (2009) Report of the technical consultancy in the UnitedKingdom. MIMOSA Deliverable 10.1A, Modelling of Statistical Data on Migra-tion and Migrant Populations, Eurostat Project 2006/S 100-10667/EN LOT 2,Eurostat, Luxembourg.
[35] Raymer J, de Beer J, van der Erf R (2011) Putting the pieces of the puzzletogether: Age and sex-speci�c estimates of migration amongst countries in theEU/EFTA, 2002-2007. European Journal of Population 27(2):185-215.
[36] Tuljapurkar S and Boe C (1999) Validation, probability-weighted priorsand information in stochastic forecasts. International Journal of Forecasting15(3):259-271.
[37] United Nations (1998) Recommendations on statistics of international migra-tion. Statistical Papers Series M, No. 58, Rev.1, Department of Economic andSocial A�airs, Statistics Division, United Nations, New York.
[38] van der Erf R (2009) Typology of Data and Feasibility study. MIMOSA Deliv-erable 9.1 B Report, Netherlands Interdisciplinary Demographic Institute, TheHague.
16

[39] van der Erf R (2010) Initial assessment of th quality of international migrationdata. IMEM Report, Netherlands Interdisciplinary Demographic Institute, TheHague.
[40] van der Gaag N and van Wissen L (2002) Modelling regional immigration: Usingstocks to predict �ows. European Journal of Population 18:387-409.
[41] Warren R and Peck JM (1980) Foreign-born emigration from the United States:1960 to 1970. Demography 17(1):71-84.
[42] Willekens F (1994) Monitoring international migration �ows in Europe. To-wards a statistical data base combining data from di�erent sources. EuropeanJournal of Population 10(1):1-42.
[43] Wi±niowski A, Keilman N, Bijak J, Forster JJ, Smith PWF, Christiansen Sand Raymer J (2011) Augmenting migration statistics with expert knowledge.Paper prepared for IMEM Workshop, Chilworth, 25-27 May.
[44] World Bank (2010) World development indicators. Accessed athttp://data.worldbank.org/data-catalog/world-development-indicators, TheWorld Bank, Washington.
[45] Zaba B (1987) The indirect estimation of migration: A critical review. Interna-tional Migration Review 21(4):1395-1445.
[46] Zlotnik H (1987) The concept of international migration as re�ected in datacollection systems. International Migration Review 21(4):925-946.
17