Embed Size (px)
Citation preview
Integrated Membrane System for Low Fouling RO
Desalting of Municipal Wastewater Craig Bartels, Ph.D., Hydranautics, Oceanside, CA
Rich Franks, Hydranautics, Oceanside, CA Ryan Furukawa, Hydranautics, Oceanside, CA Pravin Murkute, Hydranautics, Oceanside, CA Uri Papukchiev, Hydranautics, Oceanside, CA
August, 2004
2
Legal Notice
This report was prepared as a result of work sponsored by the California Energy Commission (Commission, Energy Commission). It does not necessarily represent the views of the Commission, its employees, or the State of California. The Commission, the State of California, its employees, contractors, and subcontractors make no warranty, express or implied, and assume no legal liability for the information in this report; nor does any party represent that the use of this information will not infringe upon privately owned rights. This report has not been approved or disapproved by the Commission nor has the Commission passed upon the accuracy or adequacy of this information in this report.

3
Acknowledgement Hydranautics would like to express its appreciation to the City of Oceanside for their cooperation and support in providing space, supplies and personnel to assist in the successful completion of this project.
4
Table of Contents
Preface................................................................................................................................. 6 Executive Summary ............................................................................................................ 7 Abstract ............................................................................................................................... 8 Introduction......................................................................................................................... 9
Background and Overview ......................................................................................... 9 Project Objectives ..................................................................................................... 10 Report Organization.................................................................................................. 10
Project Approach .............................................................................................................. 11 Source Water................................................................................................................. 11 Ultrafiltration Pilot Unit................................................................................................ 12
Pretreatment .............................................................................................................. 13 Performance Assessment .......................................................................................... 13 Backwashing ............................................................................................................. 14 Cleaning .................................................................................................................... 14
Microfiltration Pilot Unit .............................................................................................. 15 Pretreatment .............................................................................................................. 17 Performance Assessment .......................................................................................... 18 Backwashing ............................................................................................................. 18 Aeration..................................................................................................................... 19 Cleaning .................................................................................................................... 19
Reverse Osmosis Pilot Unit .......................................................................................... 19 Pretreatment .............................................................................................................. 21 Performance Assessment .......................................................................................... 21 Cleaning .................................................................................................................... 21
Project Outcomes .............................................................................................................. 23 Ultrafiltration ................................................................................................................ 23
Performance .............................................................................................................. 23 Backwash Frequency ................................................................................................ 24 Cleaning Optimization .............................................................................................. 24 Chemical Pretreatment.............................................................................................. 25 Feed/Filtrate Quality ................................................................................................. 26
Microfiltration............................................................................................................... 28 Performance .............................................................................................................. 28 System Process Optimization ................................................................................... 32 Chemical Pretreatment.............................................................................................. 33 Feed/Filtrate Water Quality ...................................................................................... 34 Off-line Chemical Cleaning Results. ........................................................................ 38
Reverse Osmosis........................................................................................................... 41 UF pretreatment ........................................................................................................ 41 MF Pretreatment ....................................................................................................... 44 Cleaning .................................................................................................................... 47 UF vs MF pretreatment............................................................................................. 48
Conclusions and Recommendations ................................................................................. 52
5
Ultrafiltration ................................................................................................................ 52 Microfiltration............................................................................................................... 52 Reverse Osmosis........................................................................................................... 53 Commercialization Potential......................................................................................... 54 Recommendations......................................................................................................... 54 Benefits to California.................................................................................................... 55
References......................................................................................................................... 56
6
Preface
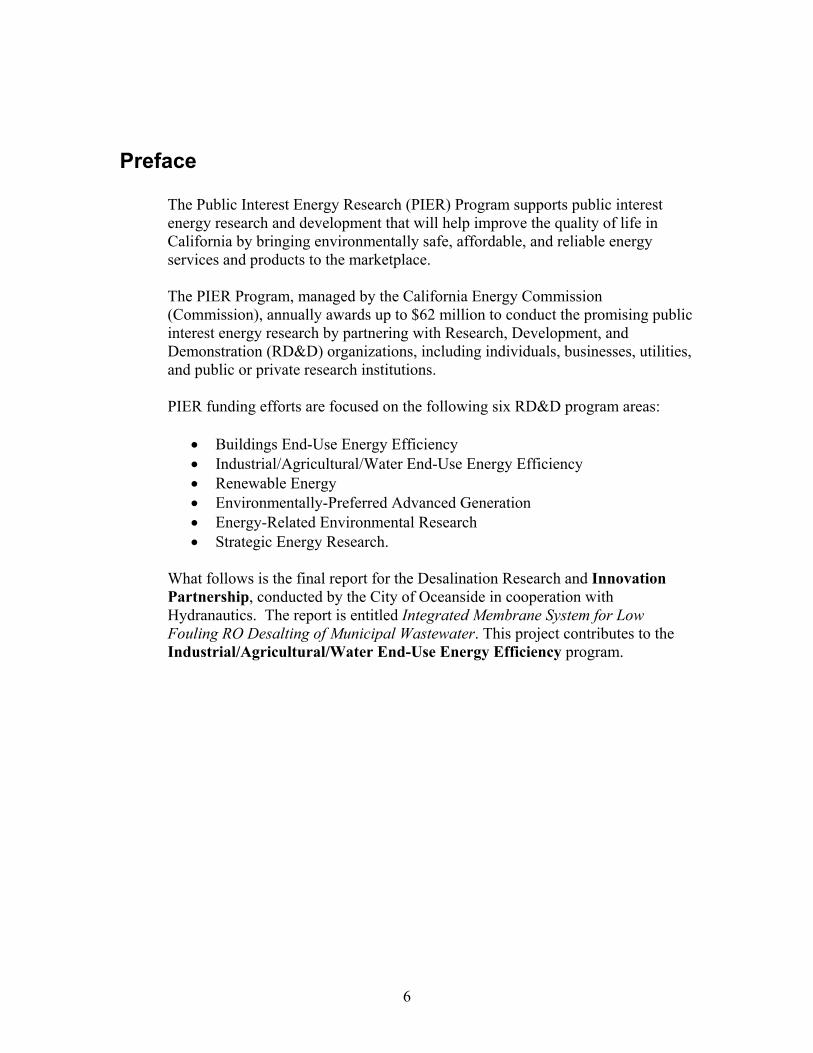
The Public Interest Energy Research (PIER) Program supports public interest energy research and development that will help improve the quality of life in California by bringing environmentally safe, affordable, and reliable energy services and products to the marketplace. The PIER Program, managed by the California Energy Commission (Commission), annually awards up to $62 million to conduct the promising public interest energy research by partnering with Research, Development, and Demonstration (RD&D) organizations, including individuals, businesses, utilities, and public or private research institutions. PIER funding efforts are focused on the following six RD&D program areas:
• Buildings End-Use Energy Efficiency • Industrial/Agricultural/Water End-Use Energy Efficiency • Renewable Energy • Environmentally-Preferred Advanced Generation • Energy-Related Environmental Research • Strategic Energy Research.
What follows is the final report for the Desalination Research and Innovation Partnership, conducted by the City of Oceanside in cooperation with Hydranautics. The report is entitled Integrated Membrane System for Low Fouling RO Desalting of Municipal Wastewater. This project contributes to the Industrial/Agricultural/Water End-Use Energy Efficiency program.
7
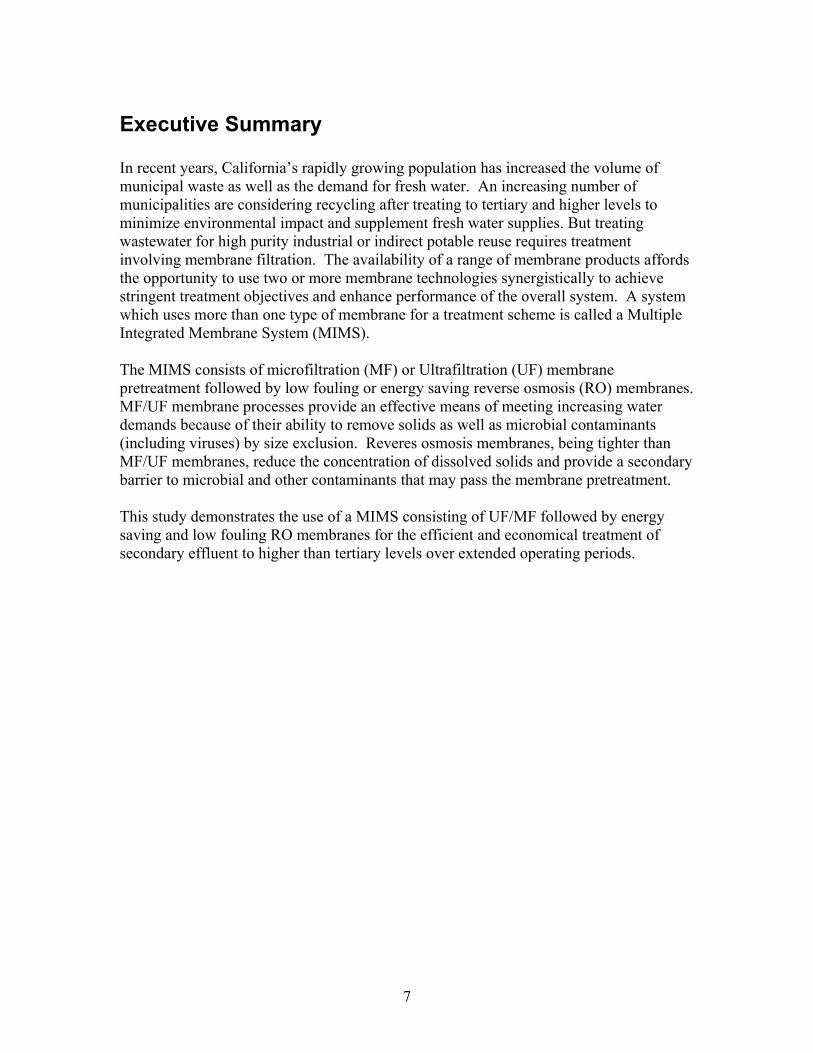
Executive Summary In recent years, California’s rapidly growing population has increased the volume of municipal waste as well as the demand for fresh water. An increasing number of municipalities are considering recycling after treating to tertiary and higher levels to minimize environmental impact and supplement fresh water supplies. But treating wastewater for high purity industrial or indirect potable reuse requires treatment involving membrane filtration. The availability of a range of membrane products affords the opportunity to use two or more membrane technologies synergistically to achieve stringent treatment objectives and enhance performance of the overall system. A system which uses more than one type of membrane for a treatment scheme is called a Multiple Integrated Membrane System (MIMS). The MIMS consists of microfiltration (MF) or Ultrafiltration (UF) membrane pretreatment followed by low fouling or energy saving reverse osmosis (RO) membranes. MF/UF membrane processes provide an effective means of meeting increasing water demands because of their ability to remove solids as well as microbial contaminants (including viruses) by size exclusion. Reveres osmosis membranes, being tighter than MF/UF membranes, reduce the concentration of dissolved solids and provide a secondary barrier to microbial and other contaminants that may pass the membrane pretreatment. This study demonstrates the use of a MIMS consisting of UF/MF followed by energy saving and low fouling RO membranes for the efficient and economical treatment of secondary effluent to higher than tertiary levels over extended operating periods.
8
Abstract This study uses a Multiple Integrated Membrane System (MIMS) consisting of UF/MF followed by energy saving or low fouling RO membranes to demonstrate the efficient and economical treatment of secondary effluent under on-site operating conditions over extended operating periods. The MIMS ran from September 2002 to September 2004 at La Salina WWTP in Oceanside CA. The UF membrane as pretreatment to the RO successfully ran at 32 gfd and 87% recovery with a period of 30 days between cleanings. The MF as pretreatment to the RO ran at 12 gfd and 95% recovery with a period of 60 days between cleanings. Both UF and MF produced high quality filtrate that allowed the RO to run at 11 gfd and 75% recovery. The RO successfully reduced the level of dissolved solids from 1100 ppm in the feed to 20 ppm in the permeate. Energy saving membranes operated in parallel with low fouling membrane showed no greater propensity to fouling. Elements constructed with 26 mil brine spacer were run in parallel with elements constructed of 31 mil brine spacer. The smaller brine spacer elements showed no greater propensity to fouling than the thicker brine spacer elements.
9
Introduction Background and Overview Secondary treated municipal effluents in Southern California have historically been discharged to large water bodies with manageable environmental impact. At the same time, a majority of the region’s potable water supply has been imported from Northern California and the Colorado River. In recent years, a rapidly growing population has increased the volume of municipal waste as well as the demand for fresh water. An increasing number of municipalities within California are considering recycling after treating to tertiary and higher levels to minimize environmental impact and supplement fresh water supplies (Alexander 2003). Tertiary treated secondary effluents, involving media filters to remove particulate matter followed by disinfection by chlorination, have been used for agricultural and industrial purposes. But treating wastewater for high purity industrial or indirect potable reuse requires further treatment involving membrane filtration. The availability of a range of membrane products affords the opportunity to use two or more membrane technologies synergistically to achieve stringent treatment objectives and enhance performance of the overall system. A system which uses more than one type of membrane for a treatment scheme is called a Multiple Integrated Membrane System (MIMS). The MIMS consists of MF or UF membrane pretreatment followed by low fouling or energy saving RO membranes. MF/UF membrane processes provide an effective means of meeting increasing water demands because of their ability to remove solids as well as microbial contaminants, including viruses by size exclusion (DeCarolis, 2001). For example, some tests on MF membranes treating secondary effluent demonstrate at least a five log removal rate on of all coliform bacteria (Schimmoller 2001, Alonso 2001). The removal rate depends largely on the actual concentration of viable bacteria on the feed side of the membrane, along with some processing factors such as: degree of fouling, vacuum pressure, pretreatment chemicals used, and actual moment of sampling. Removal of total suspended solids is complete for UF/MF membranes. With typical feed solids concentrations below 100ppm, the filtrate TSS is always below detectable limits (Schimmoller 2001, Alonso 2001). Reveres Osmosis membranes, being tighter than even MF/UF membranes, have been successfully used to reduce the dissolved solids concentration in municipal effluents (Abi-Samra, 2002). The RO membranes also act as a secondary barrier to viruses and bacteria. Presently, two large scale sites in Southern California employ MIMS to reclaim municipal waste water for industrial and indirect potable reuse. The West Basin Municipal Water District operates the West Basin Recycling Center in El Segundo where MIMS are used to treat 12.5 MGD of municipal waste water from the City of Los Angeles’ Hyperion WWTP for industrial reuse. Nearby, the Orange County Water District’s Ground Water Replenishment System (GWRS) is currently using MIMS to treat 5 MGD of municipal waste to recharge its groundwater supply which has been taxed
10
by years of drought and a growing population. The GWRS is expected to reach its full capacity of 70 MGD by 2007.
Project Objectives This study uses a MIMS consisting of UF/MF followed by energy saving or low fouling RO membranes. The MIMS ran from September 2002 to September 2004 at La Salina WWTP in Oceanside CA. The primary purpose of this study is to demonstrate a MIMS for the efficient and economical treatment of secondary effluent under on-site operating conditions over extended operating periods and assess the effect of different operating parameters. Specifically, this study will: 1) Evaluate the performance of a capillary ultrafiltration membrane as pretreatment to
reverse osmosis by monitoring the effect of variables such as pretreatment, feed quality/composition, feed temperature, and operating flux and determining the optimum operating conditions, cleaning frequency, cleaning conditions, and compatibility of the feed and membrane material;
2) Evaluate the performance of a submersible microfiltration membrane as pretreatment to reverse osmosis by monitoring the effect of variables such as pretreatment, feed quality/composition, feed temperature, and operating flux and determining the optimum operating conditions, cleaning frequency, cleaning conditions, and compatibility of the feed and membrane material;
3) Evaluate the performance of a reverse osmosis system treating secondary effluent by monitoring the effect of variables such as MF vs UF pretreatment, feed quality/composition, feed temperature, and operating flux and determining the optimum operating conditions, cleaning frequency, cleaning conditions, membrane material (low fouling vs energy saving) and element’s brine spacer thickness on propensity to fouling;
4) Determine the ability of an integrated membrane system consisting of capillary ultrafiltration membrane pretreatment or submersible microfiltration membrane pretreatment followed by reverse osmosis to treat municipal secondary effluent and produce treated water of a quality to meet the pertinent regulations for discharge or reuse;
5) Use the data collected from the MIMS pilot to evaluate the design and economics of a large-scale treatment system.
Report Organization Throughout the “Project Approach” and “Project Outcomes” section of the paper, each of the three pilots will be discussed separately. The UF will be presented first followed by the MF, then the RO. Because the RO treated UF and MF filtrate in two different tests, the discussion of the RO will itself be divided into two sections. The conclusion of the paper will include a discussion of the whole system as a multiple integrated membrane system.
11
Project Approach
Source Water The MIMS treated secondary effluent from the LaSalina Waste Water Treatment Plant in Oceanside, California. LaSalina WWTP treats approximately 3.5 million gallons per day of municipal waste from the city of Oceanside using: bar screen, grit chambers, load equalization, primary clarification, and secondary aeration/clarification. Effluent from the secondary clarifiers was supplied as feed to the MIMS. Feed water characteristics for the secondary effluent, including individual ion composition, are found in Table 1.
12
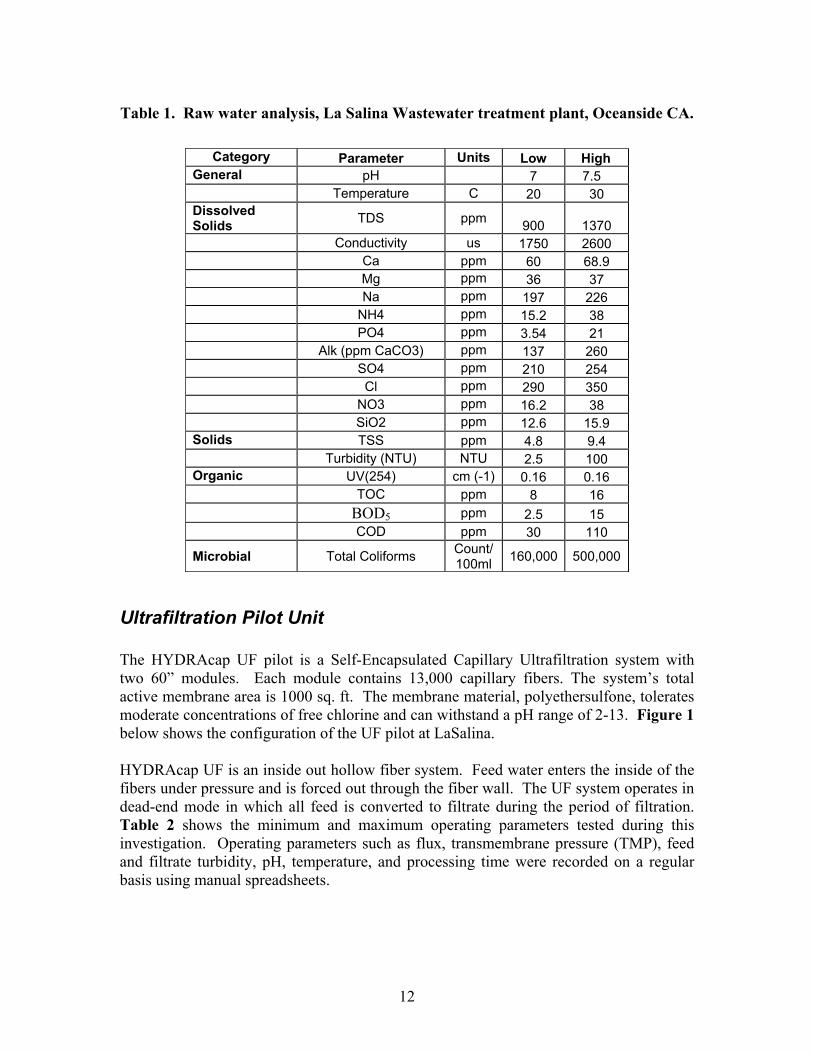
Table 1. Raw water analysis, La Salina Wastewater treatment plant, Oceanside CA.
Category Parameter Units Low High General pH 7 7.5 Temperature C 20 30 Dissolved Solids TDS ppm 900 1370 Conductivity us 1750 2600 Ca ppm 60 68.9 Mg ppm 36 37 Na ppm 197 226 NH4 ppm 15.2 38 PO4 ppm 3.54 21 Alk (ppm CaCO3) ppm 137 260 SO4 ppm 210 254 Cl ppm 290 350 NO3 ppm 16.2 38 SiO2 ppm 12.6 15.9 Solids TSS ppm 4.8 9.4 Turbidity (NTU) NTU 2.5 100 Organic UV(254) cm (-1) 0.16 0.16 TOC ppm 8 16 BOD5 ppm 2.5 15 COD ppm 30 110
Microbial Total Coliforms Count/ 100ml 160,000 500,000
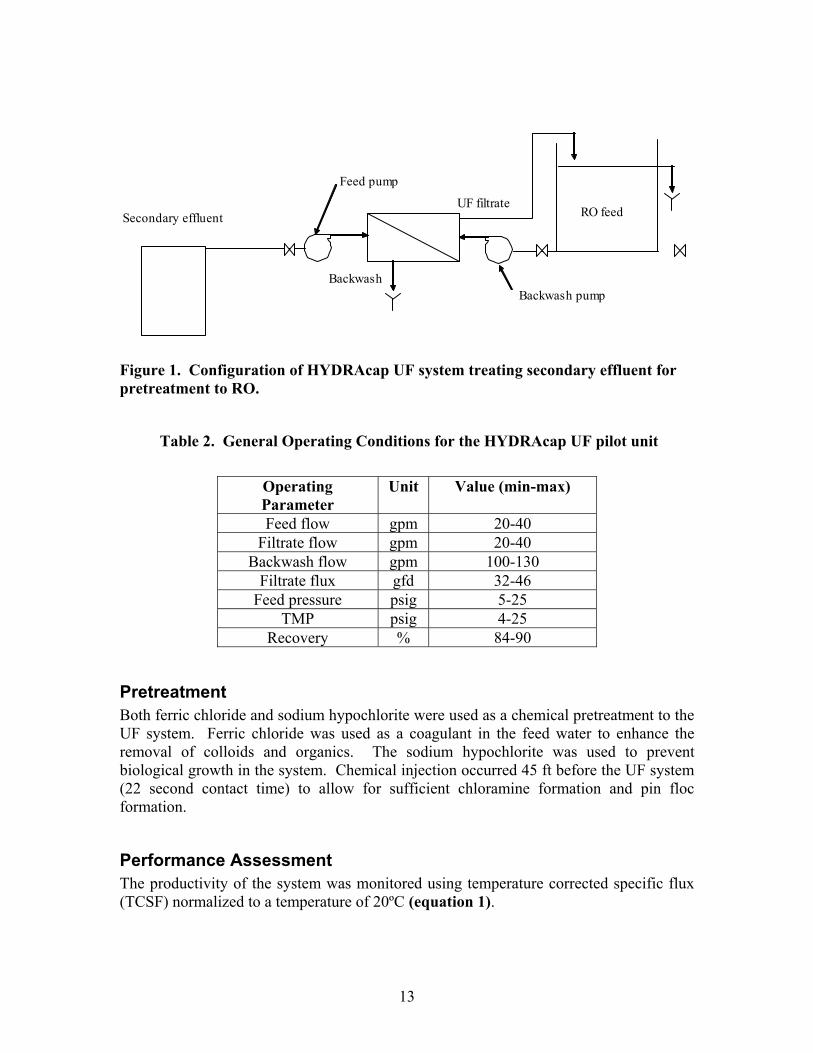
Ultrafiltration Pilot Unit The HYDRAcap UF pilot is a Self-Encapsulated Capillary Ultrafiltration system with two 60” modules. Each module contains 13,000 capillary fibers. The system’s total active membrane area is 1000 sq. ft. The membrane material, polyethersulfone, tolerates moderate concentrations of free chlorine and can withstand a pH range of 2-13. Figure 1 below shows the configuration of the UF pilot at LaSalina. HYDRAcap UF is an inside out hollow fiber system. Feed water enters the inside of the fibers under pressure and is forced out through the fiber wall. The UF system operates in dead-end mode in which all feed is converted to filtrate during the period of filtration. Table 2 shows the minimum and maximum operating parameters tested during this investigation. Operating parameters such as flux, transmembrane pressure (TMP), feed and filtrate turbidity, pH, temperature, and processing time were recorded on a regular basis using manual spreadsheets.
13
Figure 1. Configuration of HYDRAcap UF system treating secondary effluent for pretreatment to RO.
Table 2. General Operating Conditions for the HYDRAcap UF pilot unit
Operating Parameter
Unit Value (min-max)
Feed flow gpm 20-40 Filtrate flow gpm 20-40
Backwash flow gpm 100-130 Filtrate flux gfd 32-46
Feed pressure psig 5-25 TMP psig 4-25
Recovery % 84-90
Pretreatment Both ferric chloride and sodium hypochlorite were used as a chemical pretreatment to the UF system. Ferric chloride was used as a coagulant in the feed water to enhance the removal of colloids and organics. The sodium hypochlorite was used to prevent biological growth in the system. Chemical injection occurred 45 ft before the UF system (22 second contact time) to allow for sufficient chloramine formation and pin floc formation.
Performance Assessment The productivity of the system was monitored using temperature corrected specific flux (TCSF) normalized to a temperature of 20ºC (equation 1).
Secondary effluent
Backwash
RO feed
Feed pump
Backwash pump
UF filtrate
14
( )( ) ( )( )20exp032.0 −⋅−⋅= TpsiTMPgfdFluxTCSF (1)
Flux, TMP and temperature all play important roles in determining the value of the TCSF. The flux is the amount of water flowing through each square foot of membrane area per day (gfd). The formula for flux is given in equation 2.
)(1440)(
2fteaMembraneArgpmFlowFlux
⋅= (2)
The TMP in equation 1 is equal to the amount of pressure required to push water through the membrane, or the pressure difference across the membrane. The formula for TMP appears in equation 3 where: Pf, Pc, and Pp are feed, concentrate, and filtrate stream pressures, respectively.
pcf P
PPTMP −
+=
2 (3)
As the membrane fouls over time, the transmembrane pressure (TMP) begins to rise. As TMP rises, TCSF decreases. All parameters needed to calculate TCSF were collected twice daily. The data was collected two minutes after a backwash cycle to ensure consistency. The turbidity of the feed and filtrate water was recorded twice daily and used to estimate the removal of Total Suspended Solids (TSS). TOC, UV254, and total coliforms were also tested to determine removal of organics and microorganisms.
Backwashing Backwashing is a regularly scheduled event intended to remove the foulant layer that accumulates on the membrane surface during filtration. The frequency of backwashing was adjusted between 25 and 35 minutes to optimize the performance of the system. The multiple step backwash parameters were controlled by the programmable logic controller (PLC). The backwashing sequence consisted of 5 steps: Air Enhanced Backwash (AEB), backwash bottom, backwash top, backwash screen filter, and final rinse. The AEB is a patented technique which pressurizes the inner fibers using air. When pressurized, the fibers expand slightly to dislodge the foulant layer which accumulates during the filtration process. Following the AEB, the backwash steps remove the foulants from the system by pumping filtrate water from the filtrate side to the feed side of the fiber. The five steps of the backwash sequence last a total of 60 to 90 seconds after which the filtration process is resumed.
Cleaning Over time, the foulant layer accumulates on the outer surface of the membrane to a point where the backwashing sequence is no longer effective. A cleaning is then required to
15
fully restore membrane permeability. Cleanings involved recirculation of a high or low pH solution through the system. The effects of each cleaning were studied to determine the optimal cleaning procedure for this application.
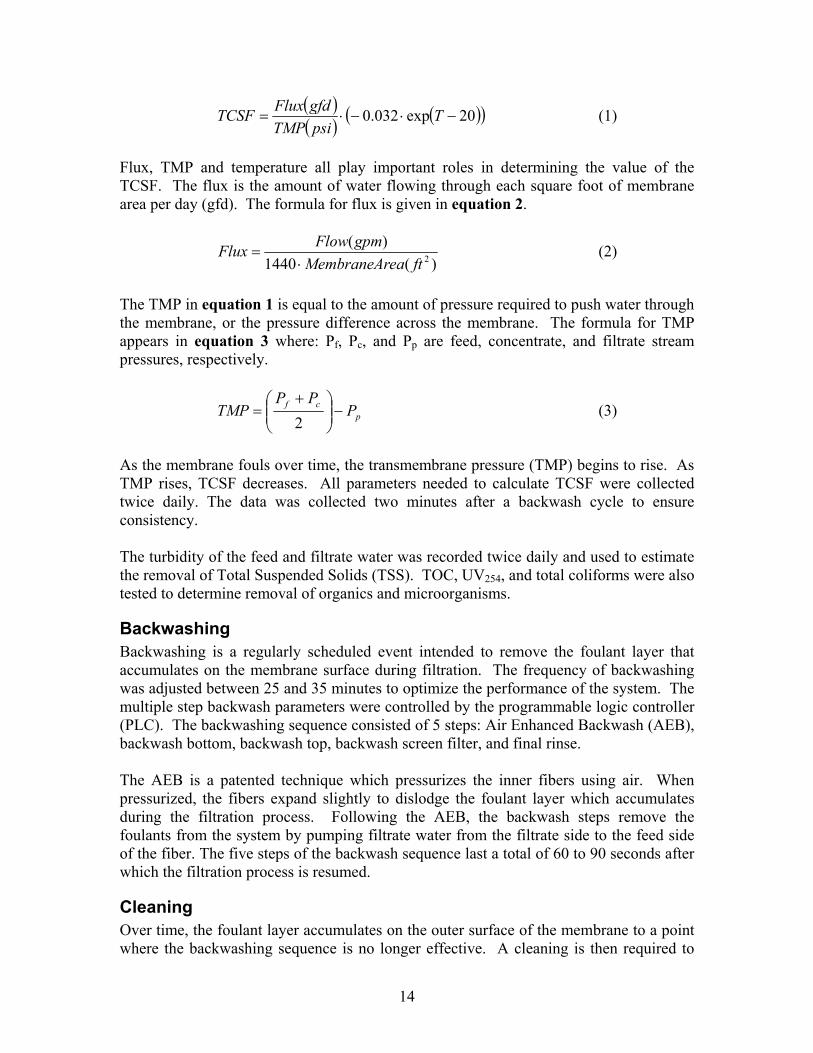
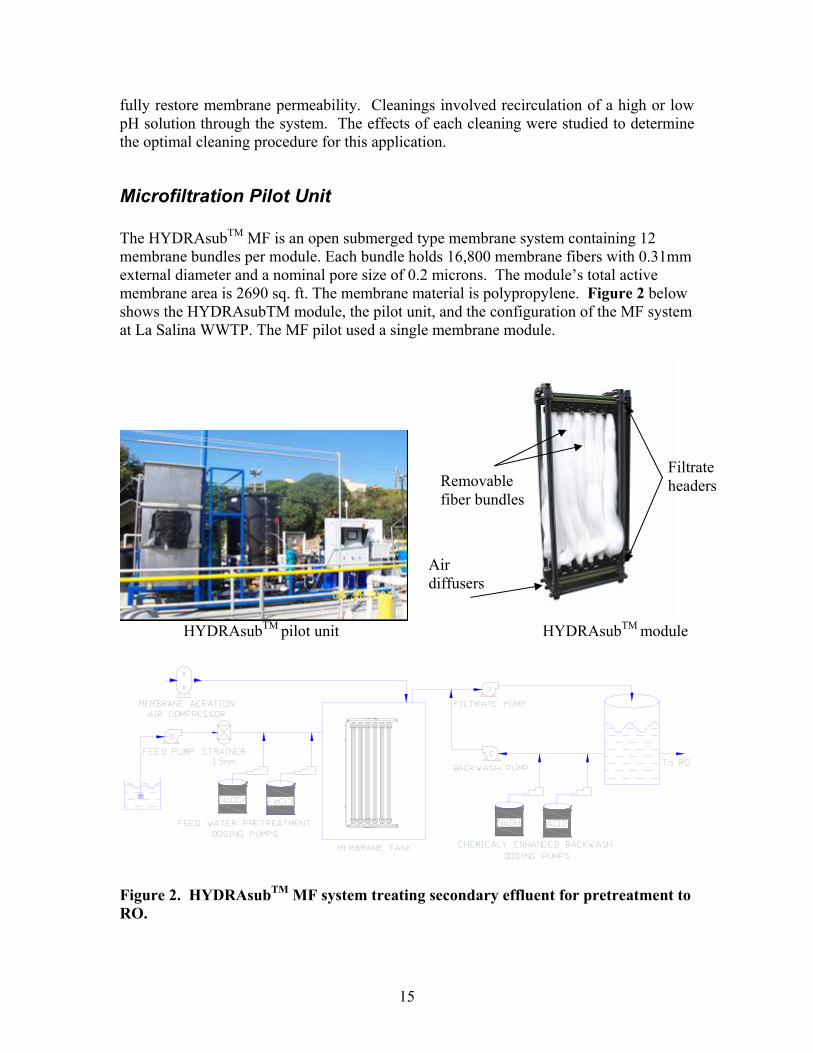
Microfiltration Pilot Unit The HYDRAsubTM MF is an open submerged type membrane system containing 12 membrane bundles per module. Each bundle holds 16,800 membrane fibers with 0.31mm external diameter and a nominal pore size of 0.2 microns. The module’s total active membrane area is 2690 sq. ft. The membrane material is polypropylene. Figure 2 below shows the HYDRAsubTM module, the pilot unit, and the configuration of the MF system at La Salina WWTP. The MF pilot used a single membrane module.
HYDRAsubTM pilot unit HYDRAsubTM module
Figure 2. HYDRAsubTM MF system treating secondary effluent for pretreatment to RO.
Filtrate headers Removable
fiber bundles
Air diffusers
16
The HYDRAsubTM MF is an outside-in hollow fiber system. A vacuum draws feed water from the outside of the fiber to the inside lumen of the fiber. A filtrate flow of 22gpm was selected to provide sufficient feed flow for the downstream RO. A system recovery of 89-95% was maintained by creating a periodic bleed stream of 10.5 gpm during the filtration cycle. When bleeding was utilized the volume of the bleed stream was close to 75% of the total waste stream. The other 25% of the total waste stream was released during the backwash cycle in several short pulses with a high instantaneous flow of 55 gpm. A summary of the specific process parameters for the MF operation are listed in Table 3.
17
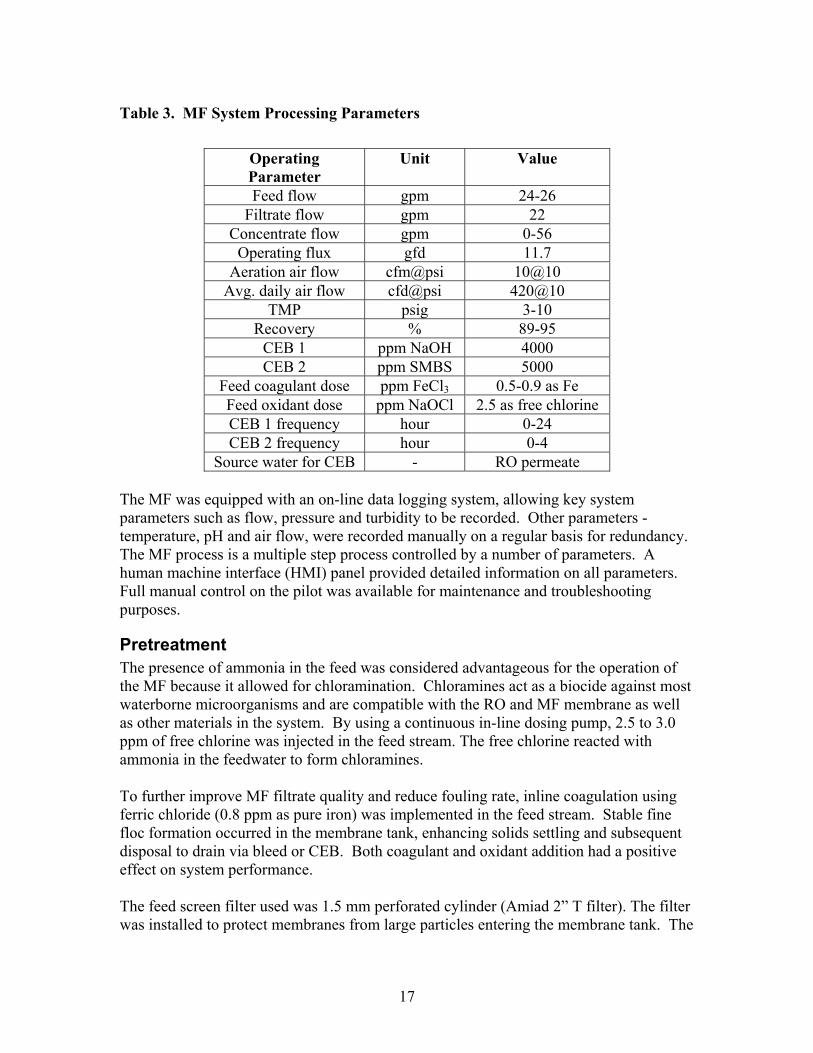
Table 3. MF System Processing Parameters
Operating Parameter
Unit Value
Feed flow gpm 24-26 Filtrate flow gpm 22
Concentrate flow gpm 0-56 Operating flux gfd 11.7
Aeration air flow cfm@psi 10@10 Avg. daily air flow cfd@psi 420@10
TMP psig 3-10 Recovery % 89-95
CEB 1 ppm NaOH 4000 CEB 2 ppm SMBS 5000
Feed coagulant dose ppm FeCl3 0.5-0.9 as Fe Feed oxidant dose ppm NaOCl 2.5 as free chlorine CEB 1 frequency hour 0-24 CEB 2 frequency hour 0-4
Source water for CEB - RO permeate The MF was equipped with an on-line data logging system, allowing key system parameters such as flow, pressure and turbidity to be recorded. Other parameters - temperature, pH and air flow, were recorded manually on a regular basis for redundancy. The MF process is a multiple step process controlled by a number of parameters. A human machine interface (HMI) panel provided detailed information on all parameters. Full manual control on the pilot was available for maintenance and troubleshooting purposes.
Pretreatment The presence of ammonia in the feed was considered advantageous for the operation of the MF because it allowed for chloramination. Chloramines act as a biocide against most waterborne microorganisms and are compatible with the RO and MF membrane as well as other materials in the system. By using a continuous in-line dosing pump, 2.5 to 3.0 ppm of free chlorine was injected in the feed stream. The free chlorine reacted with ammonia in the feedwater to form chloramines. To further improve MF filtrate quality and reduce fouling rate, inline coagulation using ferric chloride (0.8 ppm as pure iron) was implemented in the feed stream. Stable fine floc formation occurred in the membrane tank, enhancing solids settling and subsequent disposal to drain via bleed or CEB. Both coagulant and oxidant addition had a positive effect on system performance. The feed screen filter used was 1.5 mm perforated cylinder (Amiad 2” T filter). The filter was installed to protect membranes from large particles entering the membrane tank. The
18
filter was backwashed every 7.5 hours for 10 seconds. The pressure drop across the filter was always less then 1.5 psi and averaged 0.5 psi.
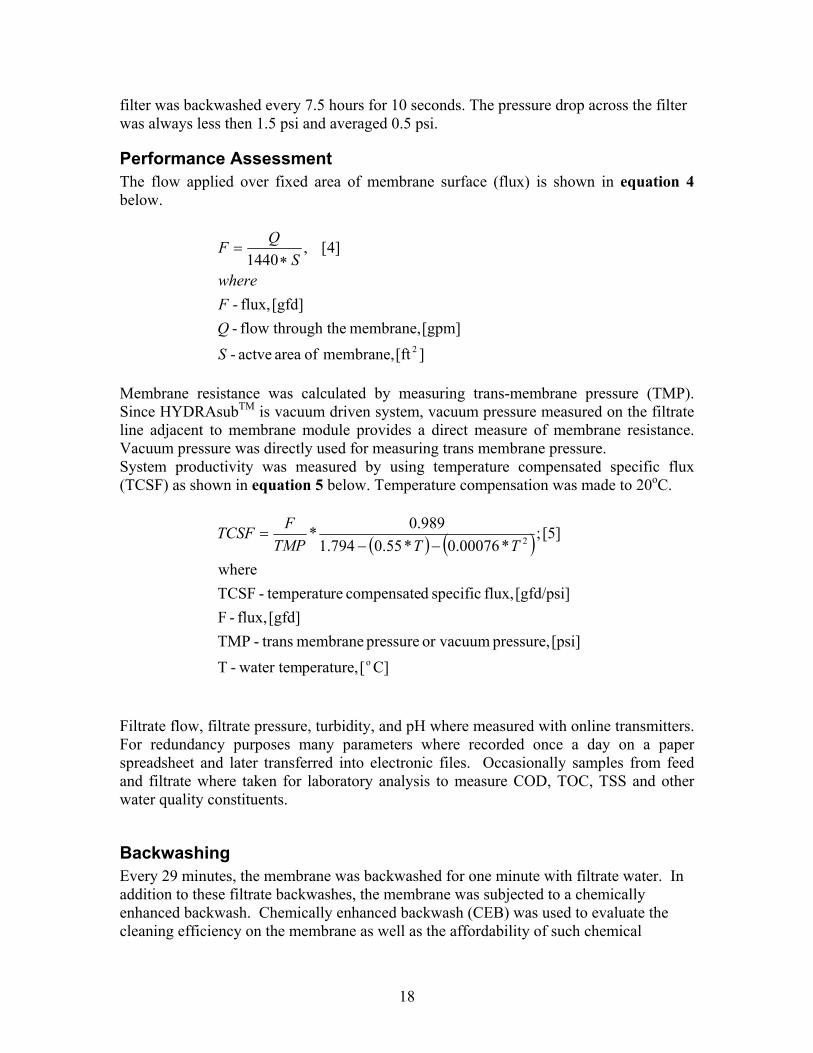
Performance Assessment The flow applied over fixed area of membrane surface (flux) is shown in equation 4 below.
][ft membrane, of area actve - [gpm] membrane, he through tflow -
[gfd] flux, -
]4[ ,1440
2SQFwhere
SQF∗
=
Membrane resistance was calculated by measuring trans-membrane pressure (TMP). Since HYDRAsubTM is vacuum driven system, vacuum pressure measured on the filtrate line adjacent to membrane module provides a direct measure of membrane resistance. Vacuum pressure was directly used for measuring trans membrane pressure. System productivity was measured by using temperature compensated specific flux (TCSF) as shown in equation 5 below. Temperature compensation was made to 20oC.
( ) ( )
C][ perature, water tem- T[psi] pressure, or vacuum pressure membrane trans- TMP
[gfd] flux, - F[gfd/psi] flux, specific dcompensate re temperatu- TCSF
where
[5] ;*00076.0*55.0794.1
989.0*
o
2TTTMPFTCSF
−−=
Filtrate flow, filtrate pressure, turbidity, and pH where measured with online transmitters. For redundancy purposes many parameters where recorded once a day on a paper spreadsheet and later transferred into electronic files. Occasionally samples from feed and filtrate where taken for laboratory analysis to measure COD, TOC, TSS and other water quality constituents.
Backwashing Every 29 minutes, the membrane was backwashed for one minute with filtrate water. In addition to these filtrate backwashes, the membrane was subjected to a chemically enhanced backwash. Chemically enhanced backwash (CEB) was used to evaluate the cleaning efficiency on the membrane as well as the affordability of such chemical
19
cleaning regimes compared to conducting more frequent CIP cleanings. The CEB could be conducted with caustic or acid or a reducing agent such as sodium metabisulfite. The reducing agent would help in removing the coagulant (iron) deposited on the membrane surface. During the high pH CEBs, RO permeate was used as the source water to avoid dissolved solids precipitation. A CEB consists of following steps:
• Partial or complete initial tank drain (optional); • Rinse; • Chemical dosing; • Soak; • Rinse; • Final tank drain (optional);
Backwash and rinse flux was set to 27 gfd, while chemical dosing flux was set to 6gfd.
Aeration To further enhance mechanical cleaning, the membranes were aerated with short air pulses at fixed intervals from multiple coarse bubble air diffusers located beneath the membrane bundles. The air flow was set at 10 cfm with 10 psi pressure. Two types of air pulsation modes were used – intermittent and rapid. Intermittent aeration was used only during filtration. Rapid air pulsation was used during filtration, backwash and rinse routines. Later during the test, rapid aeration was also used during a portion of the soak time. In the intermittent air pulsation, a single pulse of air is released after a long pause. A typical setting for intermittent air pulsation is 4 seconds for the air pulse with an interval of 135 seconds between pulses. Rapid air pulsation consists of air pulses occurring in rapid succession. A typical setting for rapid pulsation is 4 sec pulse followed by 4 second pause with a total of 10 pulses occurring in succession. Air diffusers were backwashed with water once a month to prevent clogging of the diffuser pores with solids.
Cleaning When the TMP or vacuum reaches 8-9 psi, cleaning is required to restore the membrane permeability and remove the deposited foulants. Before cleaning, the feed tank was first drained to remove the concentrated feed. Tap water was added to the feed tank. Cleaning chemicals were then added to the feed tank and the membranes were allowed to soak for 90 minutes. After cleaning with one chemical, the feed tank was drained and filled again. Then cleaning with second chemical was conducted. The first cleaning step used sodium hydroxide (NaOH) with 0.25-0.40% (w) at pH 12.5. The second cleaning step used a mix of two chemicals – citric acid (C6H8O7) 0.2% (w) and sulfuric acid (H2SO4) 0.05% (w) at pH=2.0.
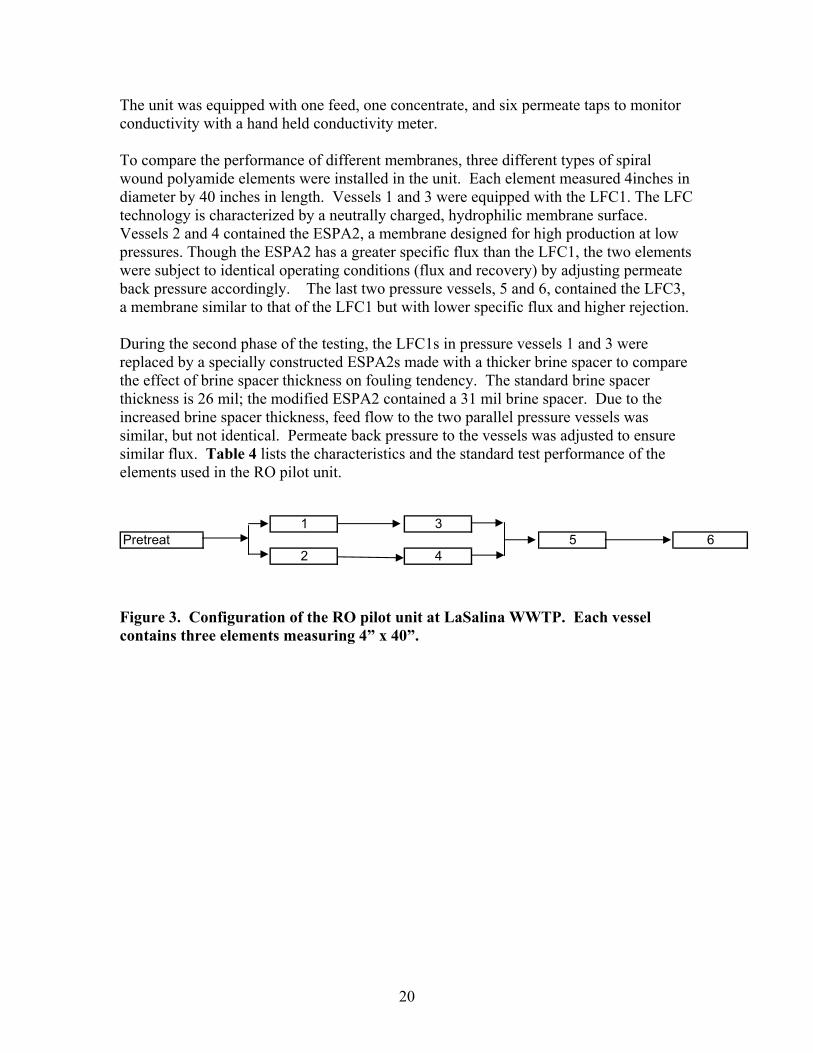
Reverse Osmosis Pilot Unit The RO pilot unit consisted of a four stage (2:2:1:1) configuration with three elements per vessel (Figure 3). The pilot was equipped with flowmeters, pressure gauges, and collection ports so that the performance of the six vessels could be monitored separately.
20
The unit was equipped with one feed, one concentrate, and six permeate taps to monitor conductivity with a hand held conductivity meter. To compare the performance of different membranes, three different types of spiral wound polyamide elements were installed in the unit. Each element measured 4inches in diameter by 40 inches in length. Vessels 1 and 3 were equipped with the LFC1. The LFC technology is characterized by a neutrally charged, hydrophilic membrane surface. Vessels 2 and 4 contained the ESPA2, a membrane designed for high production at low pressures. Though the ESPA2 has a greater specific flux than the LFC1, the two elements were subject to identical operating conditions (flux and recovery) by adjusting permeate back pressure accordingly. The last two pressure vessels, 5 and 6, contained the LFC3, a membrane similar to that of the LFC1 but with lower specific flux and higher rejection. During the second phase of the testing, the LFC1s in pressure vessels 1 and 3 were replaced by a specially constructed ESPA2s made with a thicker brine spacer to compare the effect of brine spacer thickness on fouling tendency. The standard brine spacer thickness is 26 mil; the modified ESPA2 contained a 31 mil brine spacer. Due to the increased brine spacer thickness, feed flow to the two parallel pressure vessels was similar, but not identical. Permeate back pressure to the vessels was adjusted to ensure similar flux. Table 4 lists the characteristics and the standard test performance of the elements used in the RO pilot unit.
1 3Pretreat 5 6
2 4
Figure 3. Configuration of the RO pilot unit at LaSalina WWTP. Each vessel contains three elements measuring 4” x 40”.
21
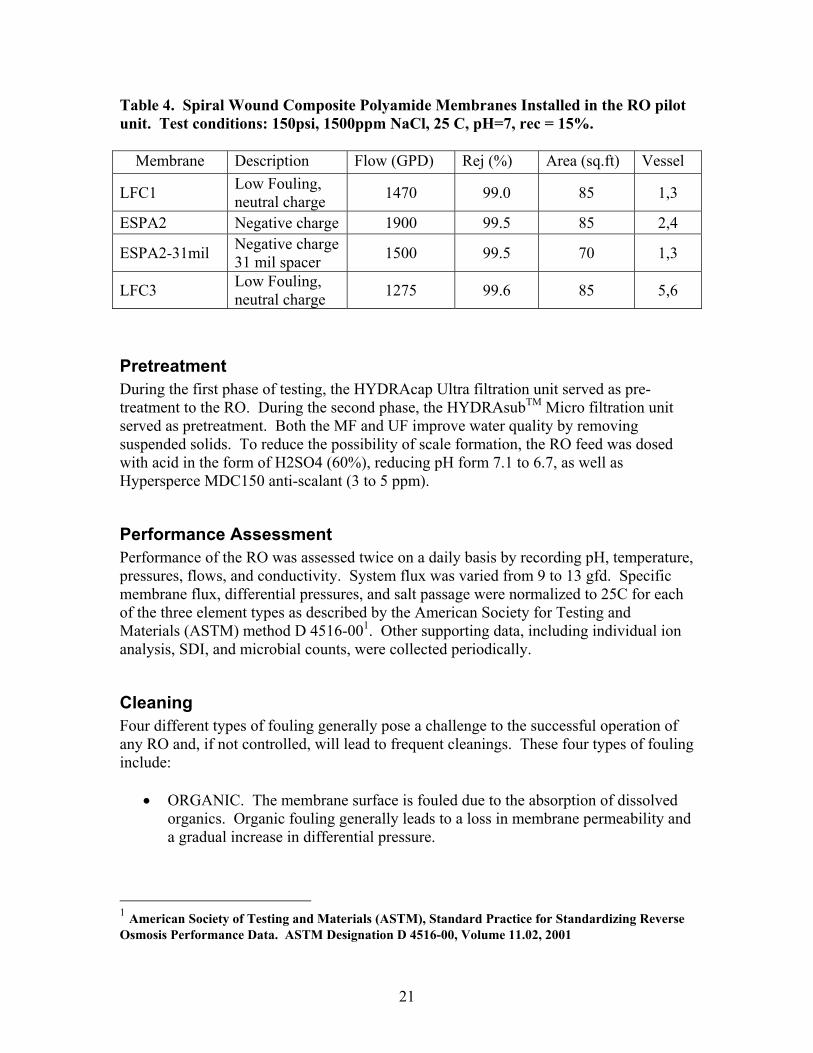
Table 4. Spiral Wound Composite Polyamide Membranes Installed in the RO pilot unit. Test conditions: 150psi, 1500ppm NaCl, 25 C, pH=7, rec = 15%.
Membrane Description Flow (GPD) Rej (%) Area (sq.ft) Vessel
LFC1 Low Fouling, neutral charge 1470 99.0 85 1,3
ESPA2 Negative charge 1900 99.5 85 2,4
ESPA2-31mil Negative charge 31 mil spacer 1500 99.5 70 1,3
LFC3 Low Fouling, neutral charge 1275 99.6 85 5,6
Pretreatment During the first phase of testing, the HYDRAcap Ultra filtration unit served as pre-treatment to the RO. During the second phase, the HYDRAsubTM Micro filtration unit served as pretreatment. Both the MF and UF improve water quality by removing suspended solids. To reduce the possibility of scale formation, the RO feed was dosed with acid in the form of H2SO4 (60%), reducing pH form 7.1 to 6.7, as well as Hypersperce MDC150 anti-scalant (3 to 5 ppm).
Performance Assessment Performance of the RO was assessed twice on a daily basis by recording pH, temperature, pressures, flows, and conductivity. System flux was varied from 9 to 13 gfd. Specific membrane flux, differential pressures, and salt passage were normalized to 25C for each of the three element types as described by the American Society for Testing and Materials (ASTM) method D 4516-001. Other supporting data, including individual ion analysis, SDI, and microbial counts, were collected periodically.
Cleaning Four different types of fouling generally pose a challenge to the successful operation of any RO and, if not controlled, will lead to frequent cleanings. These four types of fouling include:
• ORGANIC. The membrane surface is fouled due to the absorption of dissolved organics. Organic fouling generally leads to a loss in membrane permeability and a gradual increase in differential pressure.
1 American Society of Testing and Materials (ASTM), Standard Practice for Standardizing Reverse Osmosis Performance Data. ASTM Designation D 4516-00, Volume 11.02, 2001
22
• BIOLOGICAL. Blockage of the brine spacers may occur due to the growth of bacterial colonies. Biological fouling leads to a marked increase in differential pressure and a decrease in permeability. A slimy film can be detected on the membrane and on the inside of the pressure vessel. The presence of chloramines in the feed to the RO serves to hinder biological fouling.
• COLLOIDAL. Blockage of the brine spacers and membrane surface is caused by
colloidal matter present in the feed water. Colloidal fouling generally occurs in the lead elements of the first stage and will lead to a gradual increase in differential pressure as well as a gradual decrease in permeability. The presence of membrane pretreatment to the RO serves to control colloidal fouling.
• SCALING. Sparingly soluble salts reach their saturation limits in the concentrate
stream and precipitate out of solution onto the membrane surface. Scaling generally occurs in the tail elements of the last stage and leads to a slight decrease in permeability and rejection. The RO in this study was run at a conservative 75% recovery to avoid the possibility of scaling. Acid and anti scalant were also dosed in the feed stream to further reduce the chances of scaling.
The RO was considered fouled when normalized performance deviated at least 10% from startup reference performance. After fouling, high and low pH cleanings were performed on individual elements as well as the whole system to determine cleaning effectiveness and the nature of foulant. Low pH cleanings of pH 2 to 4 used 2.0% (w) citric acid (C6H8O7) to target inorganic scale (e.g. calcium carbonate, calcium sulfate, barium sulfate, strontium sulfate) and metal oxides/hydroxides (e.g. iron, manganese, nickel, copper, zinc), and inorganic-based colloidal material. The high pH (pH = 10-11) cleaning of 2.0% (w) of STPP (sodium tripolyphosphate) (Na5P3O10) and 0.8% (w) Na-EDTA (sodium salt of ethylaminediaminetetraacetic acid) was used to target calcium sulfate scale and light to moderate levels of organic foulants of natural origin. STPP functions as an inorganic-based chelating agent and detergent. Na-EDTA is an organic-based chelating cleaning agent that aids in the sequestering and removal of divalent and trivalent cations and metal ions. Cleanings were done in recirculation mode for at least one hour at temperatures between 30 and 40 C.
23
Project Outcomes
Ultrafiltration
• The successful performance of the capillary ultrafiltration membrane treating secondary municipal wastewater as pretreatment to reverse osmosis was demonstrated. The optimum operating flux was found to be 32 gfd while the optimum backwash frequency was set at 25 minute intervals. Based on these settings, the recovery was calculated to be 87%. At these optimal settings, chemical cleanings could be performed every 30 days (high pH) to 60 days (low pH).Variables such as pretreatment and operating flux where shown to have a significant impact on performance while variations in feed water quality as measured by turbidity were shown to have little effect on filtrate quality. SDI as a measurement of filtrate quality varied widely.
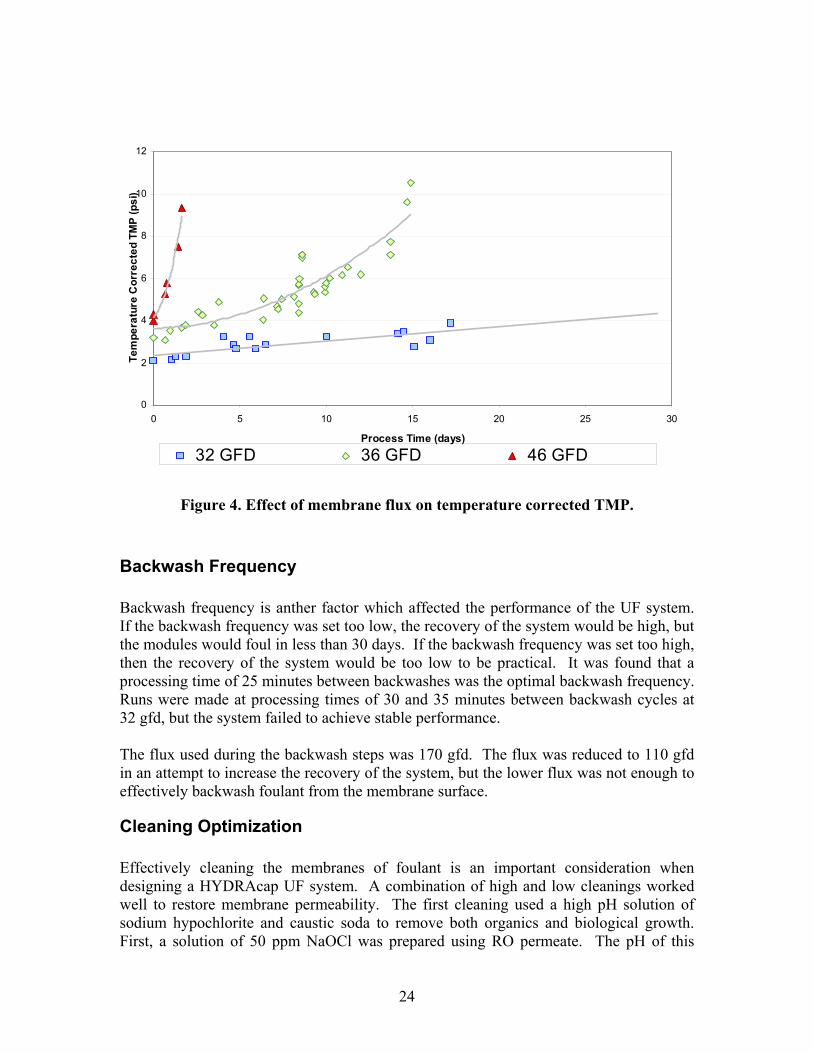
Performance An important factor affecting the performance of an ultrafiltration system is operating flux. One of the main objectives of this study was to determine the optimal operating flux which would allow the system to run continuously for 30 days without chemical cleaning. The effect of operating flux on UF membrane performance was investigated by conducting test runs at 32, 36, and 46 gfd. All runs were done with a 25 minute processing time between backwash cycles and used chemical pre-dosing of 3-5 ppm total chlorine and 3 ppm FeCl3 (as 1 ppm pure iron) . During these runs, the TMP was monitored to ascertain when significant fouling had occurred and a cleaning was required. The membrane was considered fouled when TMP reached 10 psi. Figure 4 displays temperature corrected TMP at the three different fluxes. At 32 gfd, the TMP remained stable through 17 days of operation when a system failure ended the test. The trend after 17 days suggests the goal of 30 days could easily be achieved before the membranes became fouled. At higher fluxes, the membrane fouled more rapidly. At 46 gfd, fouling occurred in less than two days of operation. When run at 36 gfd, the system reached 14 days before fouling. Though an improvement over the 46 gfd run, the 36 gfd run could not be deemed a stable run. Fouling occurred primarily due to the build up of particulate matter on the membrane surface. Another possible source of fouling was the high content of organics in the feed water (as seen in the feed water analysis). It has been observed that the presence of organic constituents in source water can cause significant productivity loss by plugging membrane pores, adsorbing to the internal matrix of the membrane, and forming a cohesive gel on the cake layer. In addition, the organic matter can also enhance biological activities in the membrane system, which may increase biofouling. (DeCarolis, 2001).
24
0
2
4
6
8
10
12
0 5 10 15 20 25 30
Process Time (days)
Tem
pera
ture
Cor
rect
ed T
MP
(psi
)
32 GFD 36 GFD 46 GFD
Figure 4. Effect of membrane flux on temperature corrected TMP.
Backwash Frequency Backwash frequency is anther factor which affected the performance of the UF system. If the backwash frequency was set too low, the recovery of the system would be high, but the modules would foul in less than 30 days. If the backwash frequency was set too high, then the recovery of the system would be too low to be practical. It was found that a processing time of 25 minutes between backwashes was the optimal backwash frequency. Runs were made at processing times of 30 and 35 minutes between backwash cycles at 32 gfd, but the system failed to achieve stable performance. The flux used during the backwash steps was 170 gfd. The flux was reduced to 110 gfd in an attempt to increase the recovery of the system, but the lower flux was not enough to effectively backwash foulant from the membrane surface.
Cleaning Optimization Effectively cleaning the membranes of foulant is an important consideration when designing a HYDRAcap UF system. A combination of high and low cleanings worked well to restore membrane permeability. The first cleaning used a high pH solution of sodium hypochlorite and caustic soda to remove both organics and biological growth. First, a solution of 50 ppm NaOCl was prepared using RO permeate. The pH of this
25
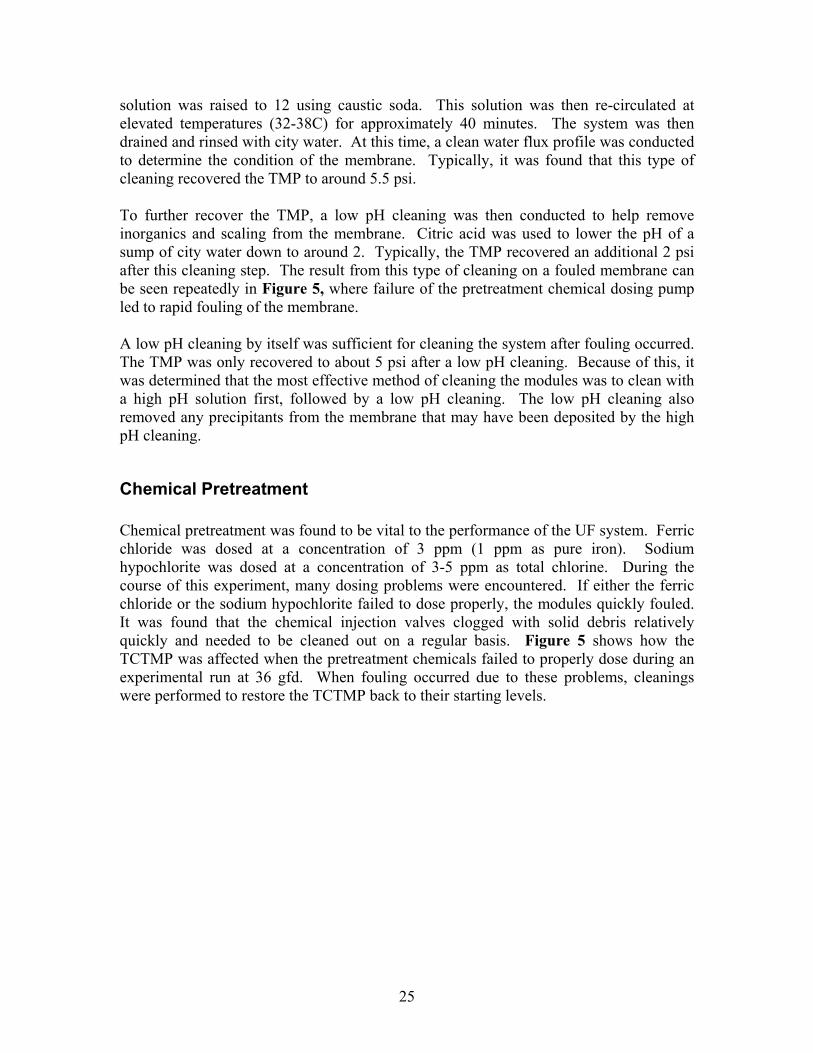
solution was raised to 12 using caustic soda. This solution was then re-circulated at elevated temperatures (32-38C) for approximately 40 minutes. The system was then drained and rinsed with city water. At this time, a clean water flux profile was conducted to determine the condition of the membrane. Typically, it was found that this type of cleaning recovered the TMP to around 5.5 psi. To further recover the TMP, a low pH cleaning was then conducted to help remove inorganics and scaling from the membrane. Citric acid was used to lower the pH of a sump of city water down to around 2. Typically, the TMP recovered an additional 2 psi after this cleaning step. The result from this type of cleaning on a fouled membrane can be seen repeatedly in Figure 5, where failure of the pretreatment chemical dosing pump led to rapid fouling of the membrane. A low pH cleaning by itself was sufficient for cleaning the system after fouling occurred. The TMP was only recovered to about 5 psi after a low pH cleaning. Because of this, it was determined that the most effective method of cleaning the modules was to clean with a high pH solution first, followed by a low pH cleaning. The low pH cleaning also removed any precipitants from the membrane that may have been deposited by the high pH cleaning.
Chemical Pretreatment Chemical pretreatment was found to be vital to the performance of the UF system. Ferric chloride was dosed at a concentration of 3 ppm (1 ppm as pure iron). Sodium hypochlorite was dosed at a concentration of 3-5 ppm as total chlorine. During the course of this experiment, many dosing problems were encountered. If either the ferric chloride or the sodium hypochlorite failed to dose properly, the modules quickly fouled. It was found that the chemical injection valves clogged with solid debris relatively quickly and needed to be cleaned out on a regular basis. Figure 5 shows how the TCTMP was affected when the pretreatment chemicals failed to properly dose during an experimental run at 36 gfd. When fouling occurred due to these problems, cleanings were performed to restore the TCTMP back to their starting levels.
26
TCTMP vs. Process Hours 36 gfd @ 84% Recovery
0.00
2.00
4.00
6.00
8.00
10.00
12.00
14.00
0.0 100.0 200.0 300.0 400.0 500.0 600.0 700.0 800.0 900.0 1000.0
Process Hours (hrs)
TCTM
P (p
si)
Cl2 and FeCl3 dosing pumps experienced repeated problems.
Figure 5. Modules quickly fouled without the presence of either pretreatment
chemical.
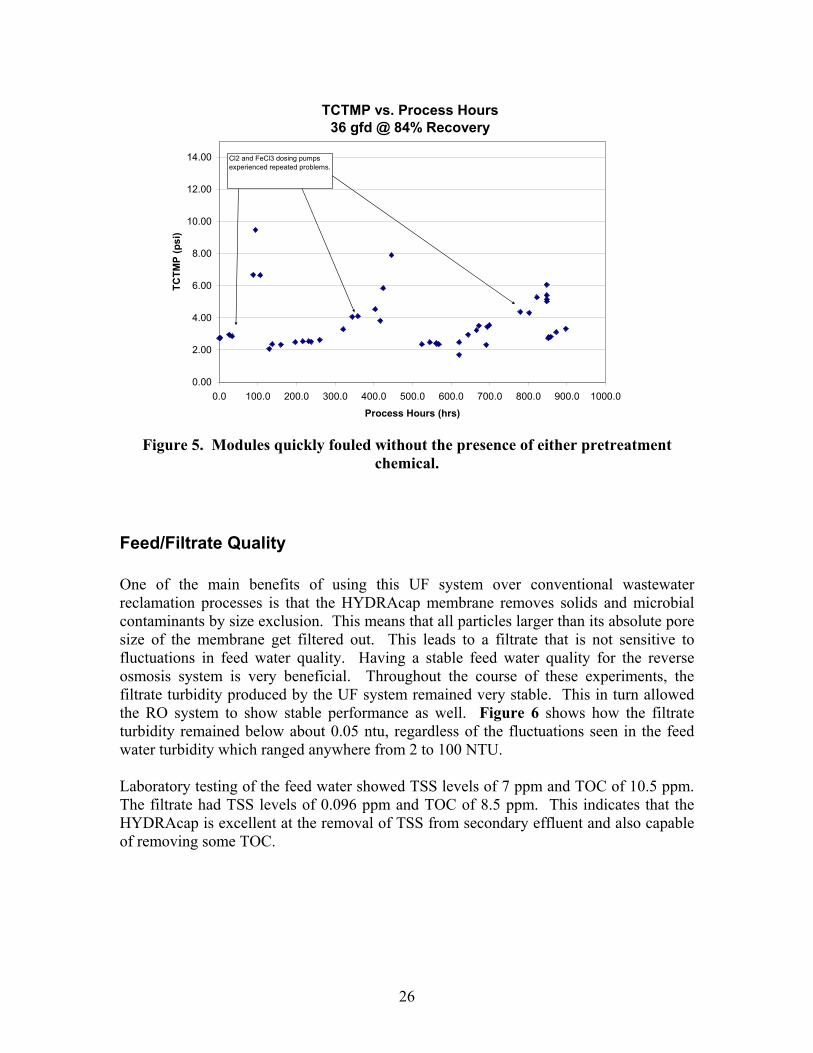
Feed/Filtrate Quality One of the main benefits of using this UF system over conventional wastewater reclamation processes is that the HYDRAcap membrane removes solids and microbial contaminants by size exclusion. This means that all particles larger than its absolute pore size of the membrane get filtered out. This leads to a filtrate that is not sensitive to fluctuations in feed water quality. Having a stable feed water quality for the reverse osmosis system is very beneficial. Throughout the course of these experiments, the filtrate turbidity produced by the UF system remained very stable. This in turn allowed the RO system to show stable performance as well. Figure 6 shows how the filtrate turbidity remained below about 0.05 ntu, regardless of the fluctuations seen in the feed water turbidity which ranged anywhere from 2 to 100 NTU. Laboratory testing of the feed water showed TSS levels of 7 ppm and TOC of 10.5 ppm. The filtrate had TSS levels of 0.096 ppm and TOC of 8.5 ppm. This indicates that the HYDRAcap is excellent at the removal of TSS from secondary effluent and also capable of removing some TOC.
27
Turbidity vs. Process Hours
0
5
10
15
20
25
30
35
40
0 1000 2000 3000 4000 5000Process Hours (hrs)
Feed
Tur
bidi
ty (N
TU)
0.00
0.01
0.02
0.03
0.04
0.05
0.06
0.07
0.08
0.09
Filtr
ate
Turb
idity
(NTU
)
Feed NTU Filtrate NTU Figure 6. Filtrate turbidity remained stable through fluctuations in feed water turbidity.
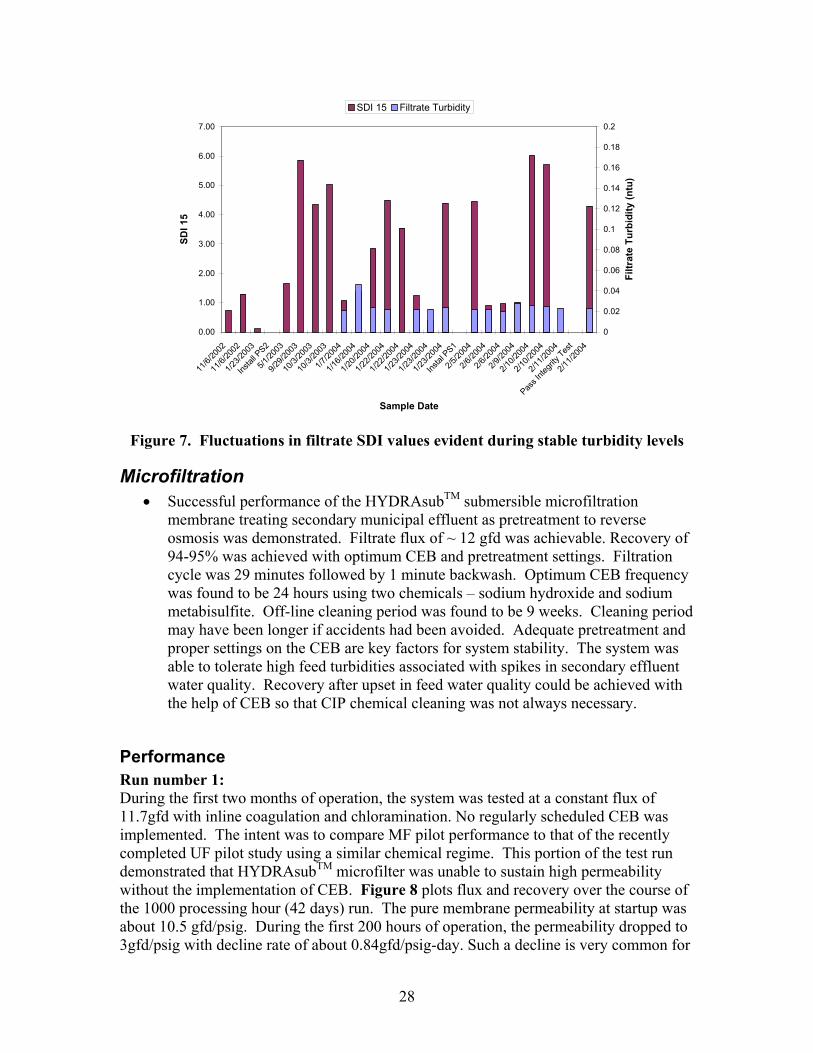
Another portion of this experiment involved laboratory testing of the feed and filtrate water to determine the log removal of bacteria for this HYDRAcap system. A coliform group bacteria test was performed on both the feed and filtrate water in order to calculate this value. It was found that the feed water contained over 160,000 mpn/100 mL, while the filtrate contained only 2 mpn/100 mL. From this information, it was found that the log removal for this HYDRAcap system was 4.9. Another aspect of the testing was the fluctuations in the SDI values found on the UF filtrate. Figure 7 shows a number of 15 minute SDI values taken during the course of this experiment. The SDI values ranged anywhere from 0.5 to 5 while the filtrate turbidity remained fairly stable at around 0.03 ntu during the testing. In some cases, it was found that the SDI varied from hour to hour. The reason for these fluctuations is unknown, but it is important to note that despite these fluctuations in SDI values, the RO system continued to operate quite stably.
28
0.00
1.00
2.00
3.00
4.00
5.00
6.00
7.00
11/6/
2002
11/6/
2002
1/23/2
003
Instal
l PS2
5/1/20
03
9/29/2
003
10/3/
2003
10/3/
2003
1/7/20
04
1/16/2
004
1/20/2
004
1/22/2
004
1/22/2
004
1/23/2
004
1/23/2
004
1/23/2
004
Instal
PS1
2/5/20
04
2/6/20
04
2/6/20
04
2/9/20
04
2/10/2
004
2/10/2
004
2/11/2
004
Pass I
ntegri
ty Tes
t
2/11/2
004
Sample Date
SDI 1
5
0
0.02
0.04
0.06
0.08
0.1
0.12
0.14
0.16
0.18
0.2
Filtr
ate
Turb
idity
(ntu
)
SDI 15 Filtrate Turbidity
Figure 7. Fluctuations in filtrate SDI values evident during stable turbidity levels
Microfiltration • Successful performance of the HYDRAsubTM submersible microfiltration
membrane treating secondary municipal effluent as pretreatment to reverse osmosis was demonstrated. Filtrate flux of ~ 12 gfd was achievable. Recovery of 94-95% was achieved with optimum CEB and pretreatment settings. Filtration cycle was 29 minutes followed by 1 minute backwash. Optimum CEB frequency was found to be 24 hours using two chemicals – sodium hydroxide and sodium metabisulfite. Off-line cleaning period was found to be 9 weeks. Cleaning period may have been longer if accidents had been avoided. Adequate pretreatment and proper settings on the CEB are key factors for system stability. The system was able to tolerate high feed turbidities associated with spikes in secondary effluent water quality. Recovery after upset in feed water quality could be achieved with the help of CEB so that CIP chemical cleaning was not always necessary.
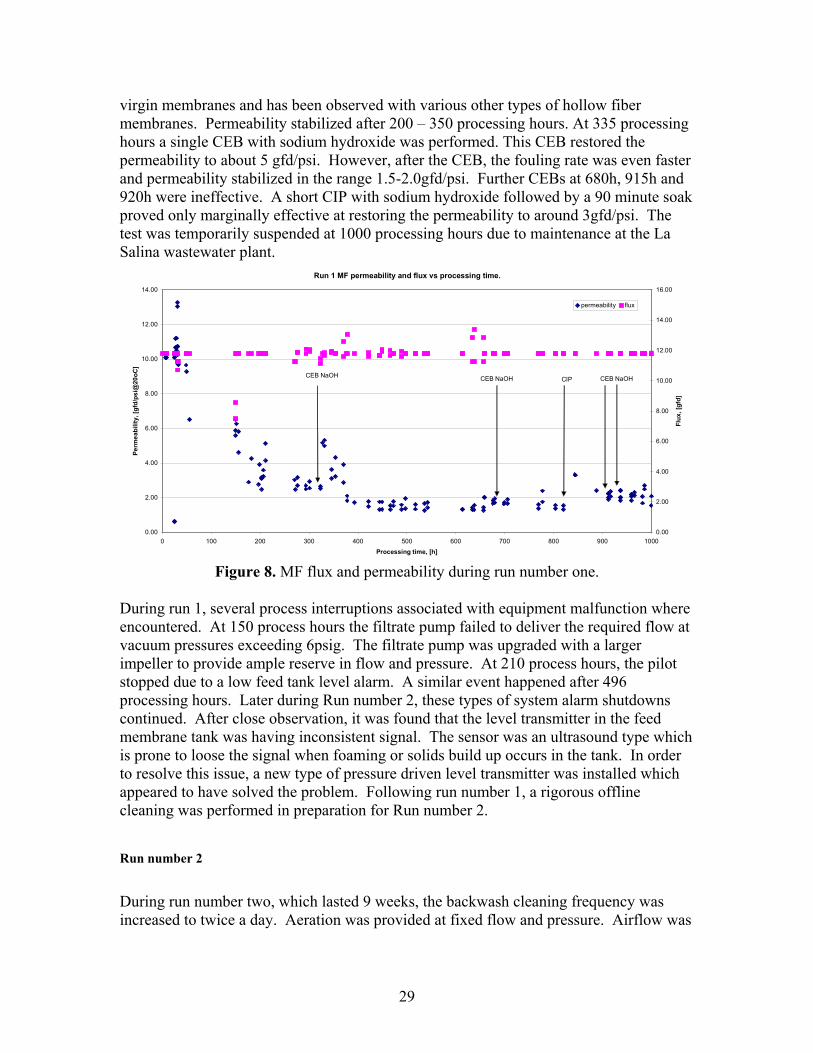
Performance Run number 1: During the first two months of operation, the system was tested at a constant flux of 11.7gfd with inline coagulation and chloramination. No regularly scheduled CEB was implemented. The intent was to compare MF pilot performance to that of the recently completed UF pilot study using a similar chemical regime. This portion of the test run demonstrated that HYDRAsubTM microfilter was unable to sustain high permeability without the implementation of CEB. Figure 8 plots flux and recovery over the course of the 1000 processing hour (42 days) run. The pure membrane permeability at startup was about 10.5 gfd/psig. During the first 200 hours of operation, the permeability dropped to 3gfd/psig with decline rate of about 0.84gfd/psig-day. Such a decline is very common for
29
virgin membranes and has been observed with various other types of hollow fiber membranes. Permeability stabilized after 200 – 350 processing hours. At 335 processing hours a single CEB with sodium hydroxide was performed. This CEB restored the permeability to about 5 gfd/psi. However, after the CEB, the fouling rate was even faster and permeability stabilized in the range 1.5-2.0gfd/psi. Further CEBs at 680h, 915h and 920h were ineffective. A short CIP with sodium hydroxide followed by a 90 minute soak proved only marginally effective at restoring the permeability to around 3gfd/psi. The test was temporarily suspended at 1000 processing hours due to maintenance at the La Salina wastewater plant.
Run 1 MF permeability and flux vs processing time.
0.00
2.00
4.00
6.00
8.00
10.00
12.00
14.00
0 100 200 300 400 500 600 700 800 900 1000Processing time, [h]
Perm
eabi
lity,
[gfd
/psi
@20
oC]
0.00
2.00
4.00
6.00
8.00
10.00
12.00
14.00
16.00
Flux
, [gf
d]
permeability flux
CIPCEB NaOH CEB NaOH CEB NaOH
Figure 8. MF flux and permeability during run number one.
During run 1, several process interruptions associated with equipment malfunction where encountered. At 150 process hours the filtrate pump failed to deliver the required flow at vacuum pressures exceeding 6psig. The filtrate pump was upgraded with a larger impeller to provide ample reserve in flow and pressure. At 210 process hours, the pilot stopped due to a low feed tank level alarm. A similar event happened after 496 processing hours. Later during Run number 2, these types of system alarm shutdowns continued. After close observation, it was found that the level transmitter in the feed membrane tank was having inconsistent signal. The sensor was an ultrasound type which is prone to loose the signal when foaming or solids build up occurs in the tank. In order to resolve this issue, a new type of pressure driven level transmitter was installed which appeared to have solved the problem. Following run number 1, a rigorous offline cleaning was performed in preparation for Run number 2.
Run number 2
During run number two, which lasted 9 weeks, the backwash cleaning frequency was increased to twice a day. Aeration was provided at fixed flow and pressure. Airflow was
30
kept at around 13-14 scfm. The actual air pressure to the diffuser outlet was always 10-11psig.
Run number two was designed with two main objectives:
• finding efficient processing conditions to meet desired flux by sustaining high permeability;
• optimize operating cost while at the same time keeping system performance stable;
Initially the system was started without implementation of regular CEB to confirm that feed water quality and system settings were the cause of the increased rate of fouling on the system. After 180 processing hours, it became clear that permeability decline was steeper than anticipated and the intended period between off-line cleaning would not be achieved. At 184 processing hours, an automated CEB procedure was introduced. Initially the CEB helped to stabilize permeability in the range 1.2 – 1.9gfd/psig. However, permeability decline following CEB was large enough to exceed the maximum recommended filtrate vacuum pressure of 8psig. Restoration of permeability following CEB was still far from what was desired. To resolve this issue, the CEB procedure was modified at 380 hrs. After modification of the CEB, the effect on membrane cleaning improved significantly. Visual observations of the membrane fibers revealed less solids residual after completion of the CEB. During the course of next week, permeability continued to improve-confirming the improved cleaning efficiency of the new CEB. At this condition, the system continued to operate stably for 300 processing hours. Then one of the two activated sludge reactors at the wastewater treatment plant experienced wash-out conditions due to an error in laboratory analysis. This caused a dramatic change in secondary effluent quality. Poorly treated wastewater blended with the secondary effluent. Feed COD almost doubled and reached values of 120 ppm. The feed suspended solids in the membrane tank increased correspondingly. Membrane feed turbidity exceeded 50 NTU and peaked at 100NTU in the hours before CEB. Pilot operation was continued to test the system’s ability to deal with spikes in feed water quality.
31
Run 2 - MF permeability and flux vs processing time. FLUX = 11.8 GFD.
0.00
0.50
1.00
1.50
2.00
2.50
3.00
3.50
4.00
4.50
5.00
0 100 200 300 400 500 600 700 800 900 1000 1100 1200 1300 1400
Processing time, [h]
Perm
abili
ty, [
gfd/
psi@
20oC
]
0.00
2.00
4.00
6.00
8.00
10.00
12.00
14.00
Flux
, [gf
d]
Perm Flux
MODIFIED CEB PROCEDURE STOP BLEEDRECOVERY=93.2%
LESS DRAINRECOVERY=95%
BAD FEED WQ
Start daily CEB
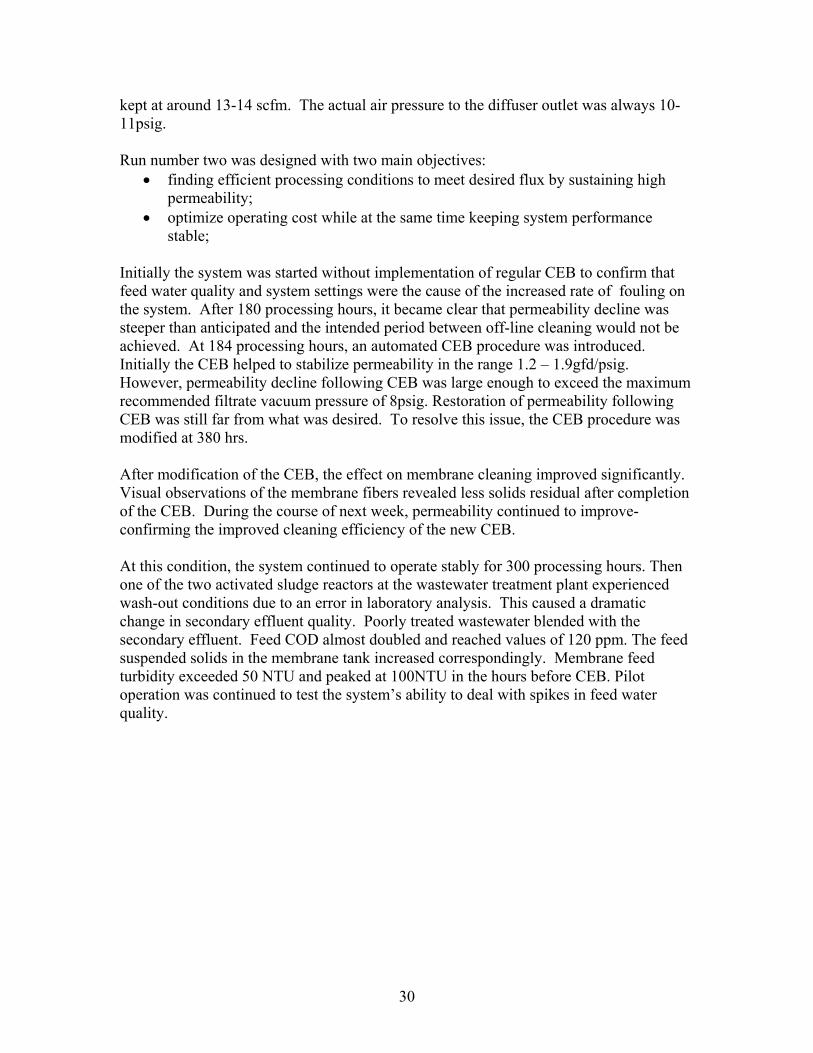
Figure 9. MF run number two. Membrane flux and permeability.
As seen in Figure 9 & 10, permeability restoration after CEB remained unchanged. However, the performance between CEBs changed substantially. Permeability decline was steeper and reached values previously seen when no CEB was used (1.2gfd/psig). In order to compensate for the higher organic loading on the membrane, the dosage of sodium metabisulfite (SMBS) was increased temporary from 5.0g/l to 7.5g/l during this period. This helped clean the membrane, providing slightly higher permeability just after CEB compared to normal conditions. After 6 days of transition, the wastewater treatment plant reestablished normal operation and feed water to MF pilot returned to normal values. At that time SMBS dosage for CEB was returned to normal values of 5 g/l. At the end of this period membrane permeability remained equal to what it was before the feed water quality spiked (3-4gfd/psig).
32
Run 2 - MF filtrate vacuum pressure vs processing time.
-12.00
-10.00
-8.00
-6.00
-4.00
-2.00
0.00
23-M
ay2-J
un
12-Ju
n
22-Ju
n2-J
ul
12-Ju
l
22-Ju
l
1-Aug
CALENDAR TIME, [mm/dd]
FILT
RA
TE P
RES
SUR
E, [P
SI]
FEED W.Q. UPSET NO CEB for 72 HOURSNEW CEB PROCEDURESTARTCEB
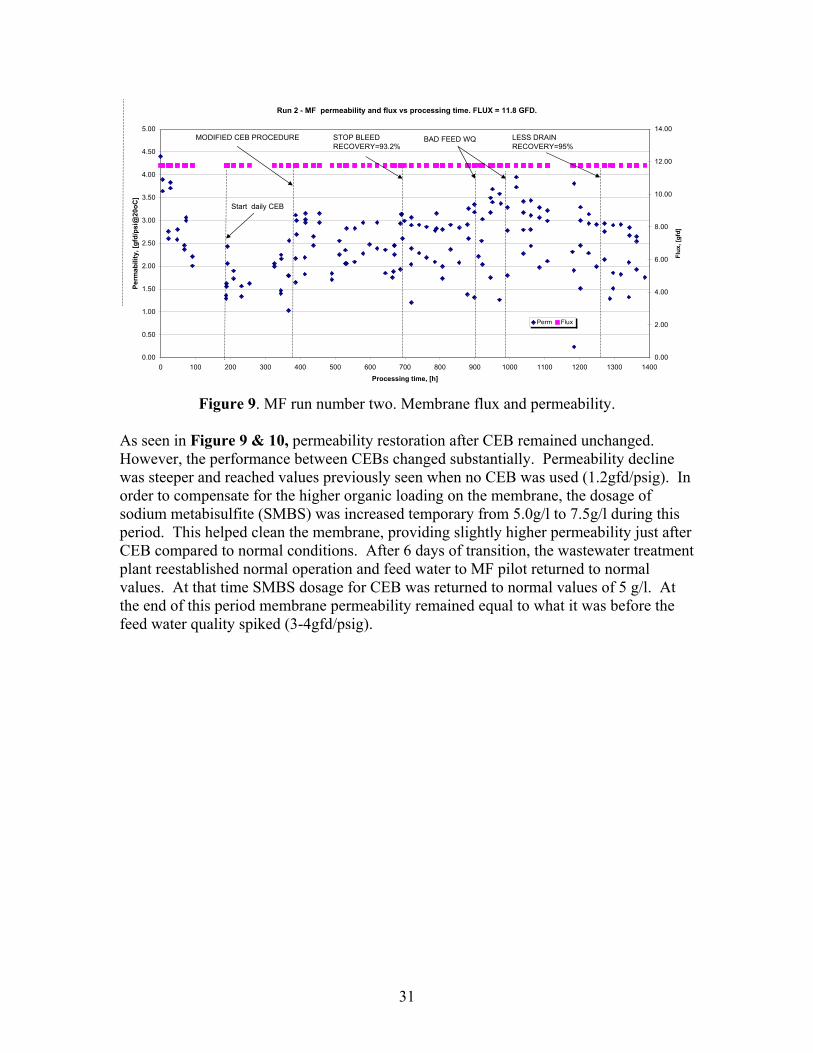
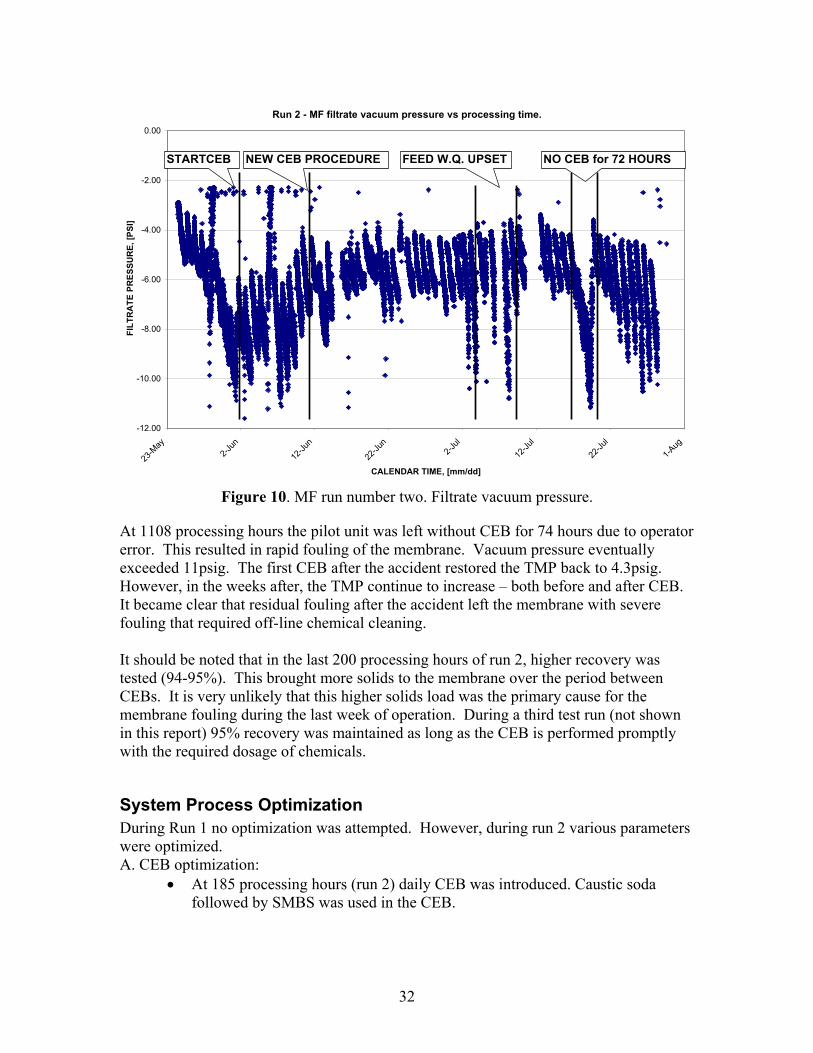
Figure 10. MF run number two. Filtrate vacuum pressure.
At 1108 processing hours the pilot unit was left without CEB for 74 hours due to operator error. This resulted in rapid fouling of the membrane. Vacuum pressure eventually exceeded 11psig. The first CEB after the accident restored the TMP back to 4.3psig. However, in the weeks after, the TMP continue to increase – both before and after CEB. It became clear that residual fouling after the accident left the membrane with severe fouling that required off-line chemical cleaning. It should be noted that in the last 200 processing hours of run 2, higher recovery was tested (94-95%). This brought more solids to the membrane over the period between CEBs. It is very unlikely that this higher solids load was the primary cause for the membrane fouling during the last week of operation. During a third test run (not shown in this report) 95% recovery was maintained as long as the CEB is performed promptly with the required dosage of chemicals.
System Process Optimization During Run 1 no optimization was attempted. However, during run 2 various parameters were optimized. A. CEB optimization:
• At 185 processing hours (run 2) daily CEB was introduced. Caustic soda followed by SMBS was used in the CEB.
33
• At 380 processing hours the CEB procedure was modified to allow membrane tank aeration during soak step. Partial chemicals neutralization was achieved inside the membrane tank.
• At 438 processing hours (run 2) the CEB was performed with NaOH only. The second portion of the CEB (with SMBS) was not executed. The purpose of this test was to examine the degree of importance of the SMBS CEB on the overall TMP restoration. TMP was restored only 50% with NaOH CEB. Further both NaOH and SMBS CEB were conducted so that the interval between successive CEBs of the same type was the same but the occurrence of the two types of CEBs was staggered by 12 hours. It was found that the effect of CEB decreases dramatically if both CEBs are not performed consecutively.
• At 1184 processing hours (run 2) the chemical for CEB2 was changed to evaluate efficiency of alternative chemical. Sodium metabisulfite was substituted with citric acid. Backwash concentration of citric acid was adjusted to 9 g/l. The effect of citric acid was similar to what was seen with SMBS. Reversing the order of chemicals for CEB (first SMBS followed to NaOH) proved to be less effective.
B. Recovery optimization • At 686 processing hours (run 2) the bleed flow was discontinued. This
increased the recovery from 88.5% to 92%. • At 1260 processing hours (run 2) the dump volume per single backwash was
decreased from 43 gallons/BW to 28gall/BW. This increased the recovery even further to about 94%.
C. Feed chemical optimization. • At 970 processing hours (run 2) the feed coagulant dosage was lowered from
0.9ppm to 0.55ppm (as pure iron). This change did not affect the membrane performance until end of the test.
• At 550 processing hours (run 2) the feed oxidant dosage was lowered from 3.0ppm to 2.5ppm. There was no visible detrimental effect on the MF pilot performance until end of the test after that change.
Chemical Pretreatment Run number 1 Concentration of pretreatment chemicals in the feed stream was closely monitored using field test kits. The chlorine dosing pump was adjusted accordingly to produce the required dosage of 3.0 ppm chlorine in the feed. Due to a large excess of free ammonia in the feed (15-30ppm) all of the chlorine was converted into chloramines. Total chlorine corresponds to concentration of free chlorine dosed in the system. Feed iron concentration was maintained around 0.9ppm with maximum value not exceeding 1.0ppm as iron.
34
Run number 2 During run number two, feed chemicals dosage initially was similar to that used during run number one. Later both feed chemicals where optimized. Chlorine and iron where lowered to 2.5 ppm and 0.45 ppm respectively.
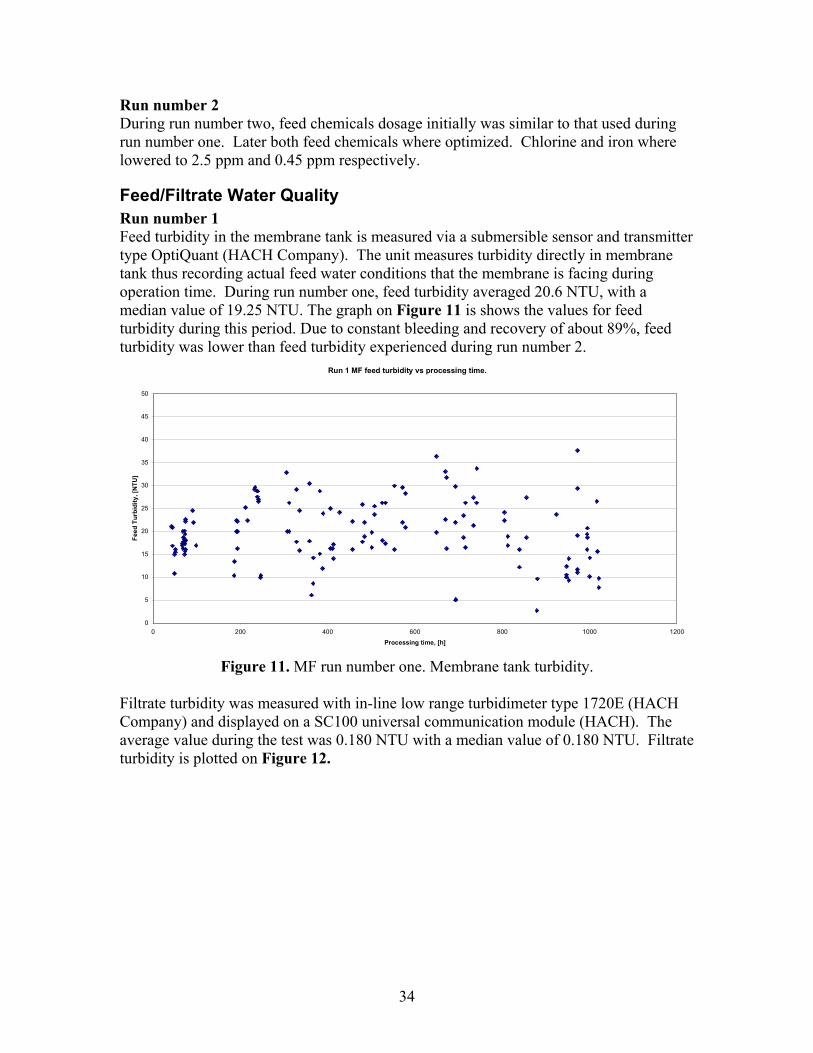
Feed/Filtrate Water Quality Run number 1 Feed turbidity in the membrane tank is measured via a submersible sensor and transmitter type OptiQuant (HACH Company). The unit measures turbidity directly in membrane tank thus recording actual feed water conditions that the membrane is facing during operation time. During run number one, feed turbidity averaged 20.6 NTU, with a median value of 19.25 NTU. The graph on Figure 11 is shows the values for feed turbidity during this period. Due to constant bleeding and recovery of about 89%, feed turbidity was lower than feed turbidity experienced during run number 2.
Run 1 MF feed turbidity vs processing time.
0
5
10
15
20
25
30
35
40
45
50
0 200 400 600 800 1000 1200
Processing time, [h]
Feed
Tur
bidi
ty, [
NTU
]
Figure 11. MF run number one. Membrane tank turbidity.
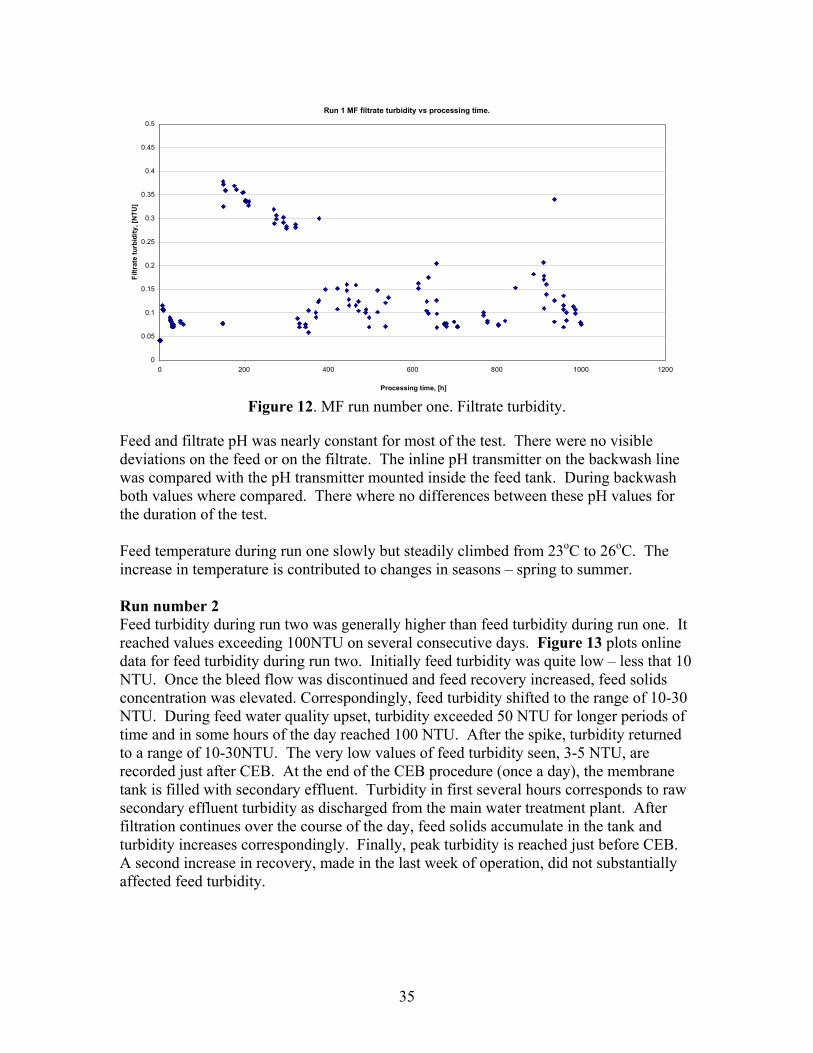
Filtrate turbidity was measured with in-line low range turbidimeter type 1720E (HACH Company) and displayed on a SC100 universal communication module (HACH). The average value during the test was 0.180 NTU with a median value of 0.180 NTU. Filtrate turbidity is plotted on Figure 12.
35
Run 1 MF filtrate turbidity vs processing time.
0
0.05
0.1
0.15
0.2
0.25
0.3
0.35
0.4
0.45
0.5
0 200 400 600 800 1000 1200
Processing time, [h]
Filtr
ate
turb
idity
, [N
TU]
Figure 12. MF run number one. Filtrate turbidity.
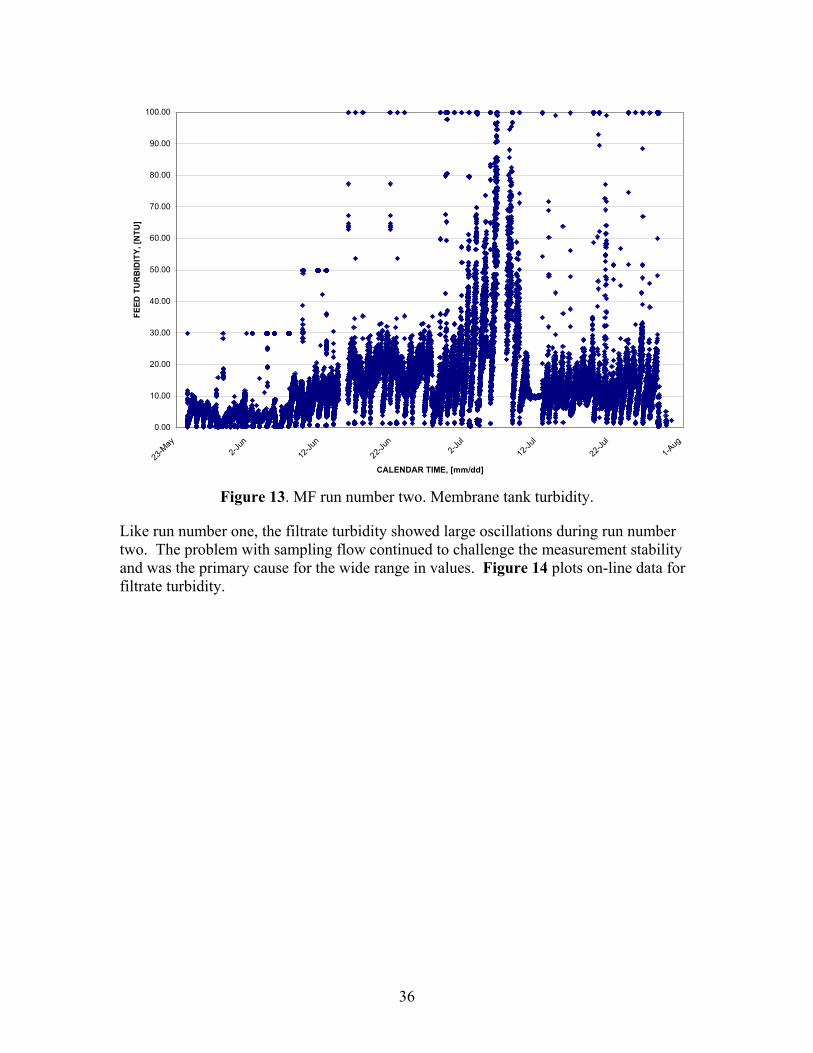
Feed and filtrate pH was nearly constant for most of the test. There were no visible deviations on the feed or on the filtrate. The inline pH transmitter on the backwash line was compared with the pH transmitter mounted inside the feed tank. During backwash both values where compared. There where no differences between these pH values for the duration of the test. Feed temperature during run one slowly but steadily climbed from 23oC to 26oC. The increase in temperature is contributed to changes in seasons – spring to summer. Run number 2 Feed turbidity during run two was generally higher than feed turbidity during run one. It reached values exceeding 100NTU on several consecutive days. Figure 13 plots online data for feed turbidity during run two. Initially feed turbidity was quite low – less that 10 NTU. Once the bleed flow was discontinued and feed recovery increased, feed solids concentration was elevated. Correspondingly, feed turbidity shifted to the range of 10-30 NTU. During feed water quality upset, turbidity exceeded 50 NTU for longer periods of time and in some hours of the day reached 100 NTU. After the spike, turbidity returned to a range of 10-30NTU. The very low values of feed turbidity seen, 3-5 NTU, are recorded just after CEB. At the end of the CEB procedure (once a day), the membrane tank is filled with secondary effluent. Turbidity in first several hours corresponds to raw secondary effluent turbidity as discharged from the main water treatment plant. After filtration continues over the course of the day, feed solids accumulate in the tank and turbidity increases correspondingly. Finally, peak turbidity is reached just before CEB. A second increase in recovery, made in the last week of operation, did not substantially affected feed turbidity.
36
0.00
10.00
20.00
30.00
40.00
50.00
60.00
70.00
80.00
90.00
100.00
23-M
ay2-J
un
12-Ju
n
22-Ju
n2-J
ul
12-Ju
l
22-Ju
l
1-Aug
CALENDAR TIME, [mm/dd]
FEED
TU
RB
IDIT
Y, [N
TU]
Figure 13. MF run number two. Membrane tank turbidity.
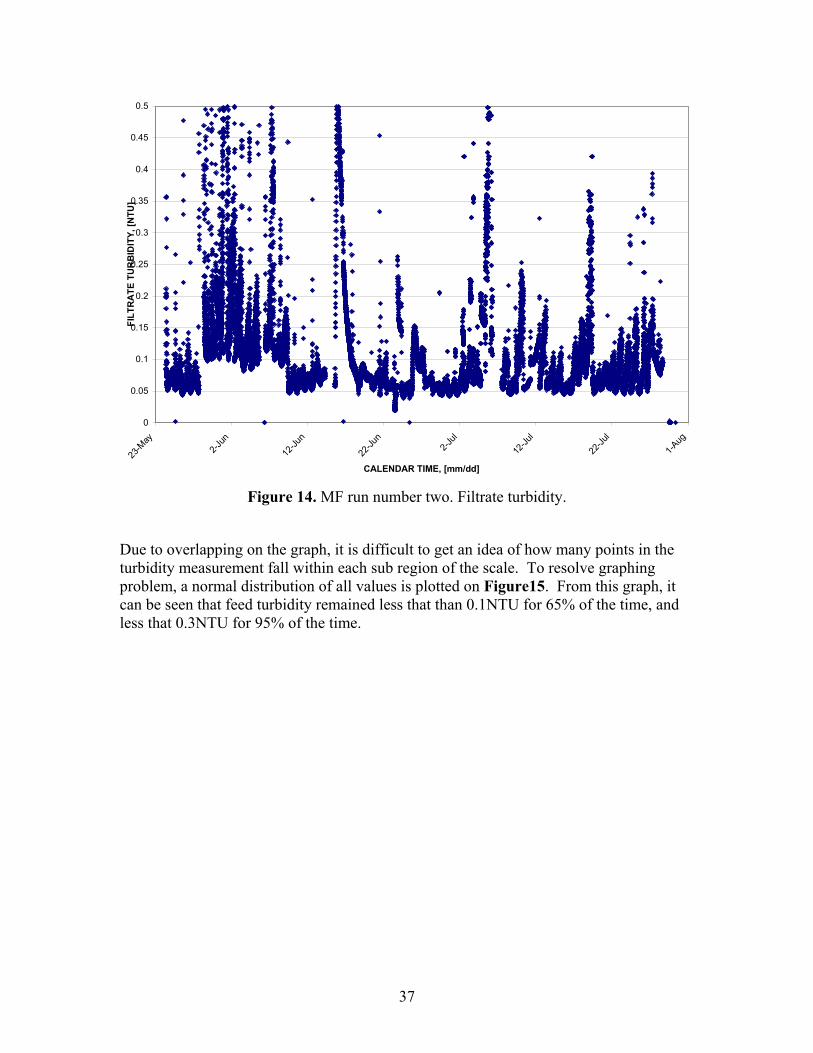
Like run number one, the filtrate turbidity showed large oscillations during run number two. The problem with sampling flow continued to challenge the measurement stability and was the primary cause for the wide range in values. Figure 14 plots on-line data for filtrate turbidity.
37
0
0.05
0.1
0.15
0.2
0.25
0.3
0.35
0.4
0.45
0.5
23-M
ay
2-Jun
12-Ju
n
22-Ju
n
2-Jul
12-Ju
l
22-Ju
l
1-Aug
CALENDAR TIME, [mm/dd]
FILT
RA
TE T
UR
BID
ITY,
[NTU
]
Figure 14. MF run number two. Filtrate turbidity.
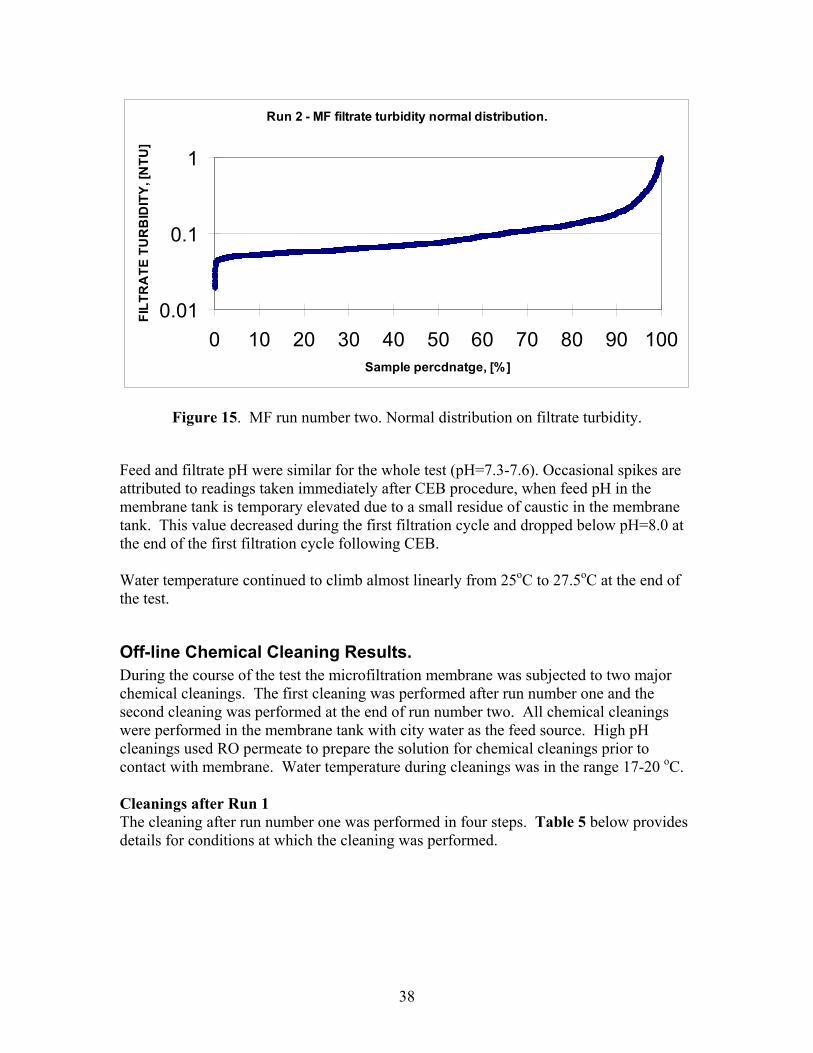
Due to overlapping on the graph, it is difficult to get an idea of how many points in the turbidity measurement fall within each sub region of the scale. To resolve graphing problem, a normal distribution of all values is plotted on Figure15. From this graph, it can be seen that feed turbidity remained less that than 0.1NTU for 65% of the time, and less that 0.3NTU for 95% of the time.
38
Run 2 - MF filtrate turbidity normal distribution.
0.01
0.1
1
0 10 20 30 40 50 60 70 80 90 100Sample percdnatge, [%]
FILT
RA
TE T
UR
BID
ITY,
[NTU
]
Figure 15. MF run number two. Normal distribution on filtrate turbidity.
Feed and filtrate pH were similar for the whole test (pH=7.3-7.6). Occasional spikes are attributed to readings taken immediately after CEB procedure, when feed pH in the membrane tank is temporary elevated due to a small residue of caustic in the membrane tank. This value decreased during the first filtration cycle and dropped below pH=8.0 at the end of the first filtration cycle following CEB. Water temperature continued to climb almost linearly from 25oC to 27.5oC at the end of the test.
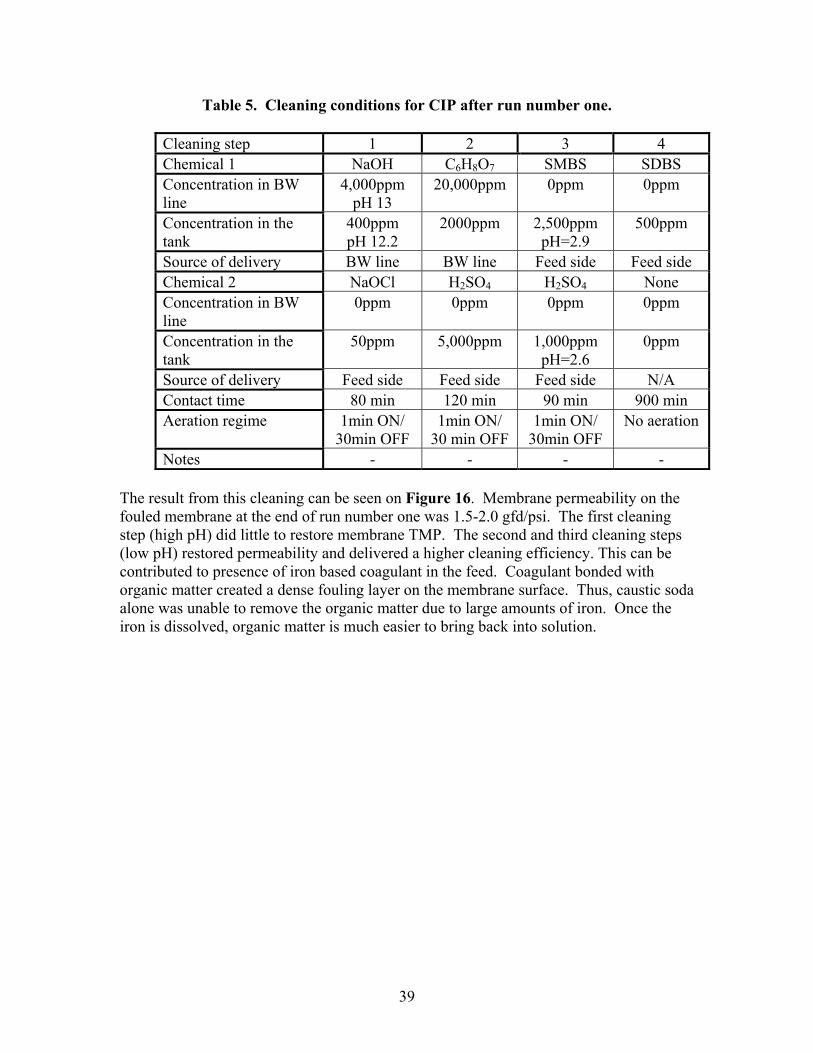
Off-line Chemical Cleaning Results. During the course of the test the microfiltration membrane was subjected to two major chemical cleanings. The first cleaning was performed after run number one and the second cleaning was performed at the end of run number two. All chemical cleanings were performed in the membrane tank with city water as the feed source. High pH cleanings used RO permeate to prepare the solution for chemical cleanings prior to contact with membrane. Water temperature during cleanings was in the range 17-20 oC. Cleanings after Run 1 The cleaning after run number one was performed in four steps. Table 5 below provides details for conditions at which the cleaning was performed.
39
Table 5. Cleaning conditions for CIP after run number one.
Cleaning step 1 2 3 4 Chemical 1 NaOH C6H8O7 SMBS SDBS Concentration in BW line
4,000ppm pH 13
20,000ppm 0ppm 0ppm
Concentration in the tank
400ppm pH 12.2
2000ppm 2,500ppm pH=2.9
500ppm
Source of delivery BW line BW line Feed side Feed side Chemical 2 NaOCl H2SO4 H2SO4 None Concentration in BW line
0ppm 0ppm 0ppm 0ppm
Concentration in the tank
50ppm 5,000ppm 1,000ppm pH=2.6
0ppm
Source of delivery Feed side Feed side Feed side N/A Contact time 80 min 120 min 90 min 900 min Aeration regime 1min ON/
30min OFF 1min ON/
30 min OFF 1min ON/
30min OFF No aeration
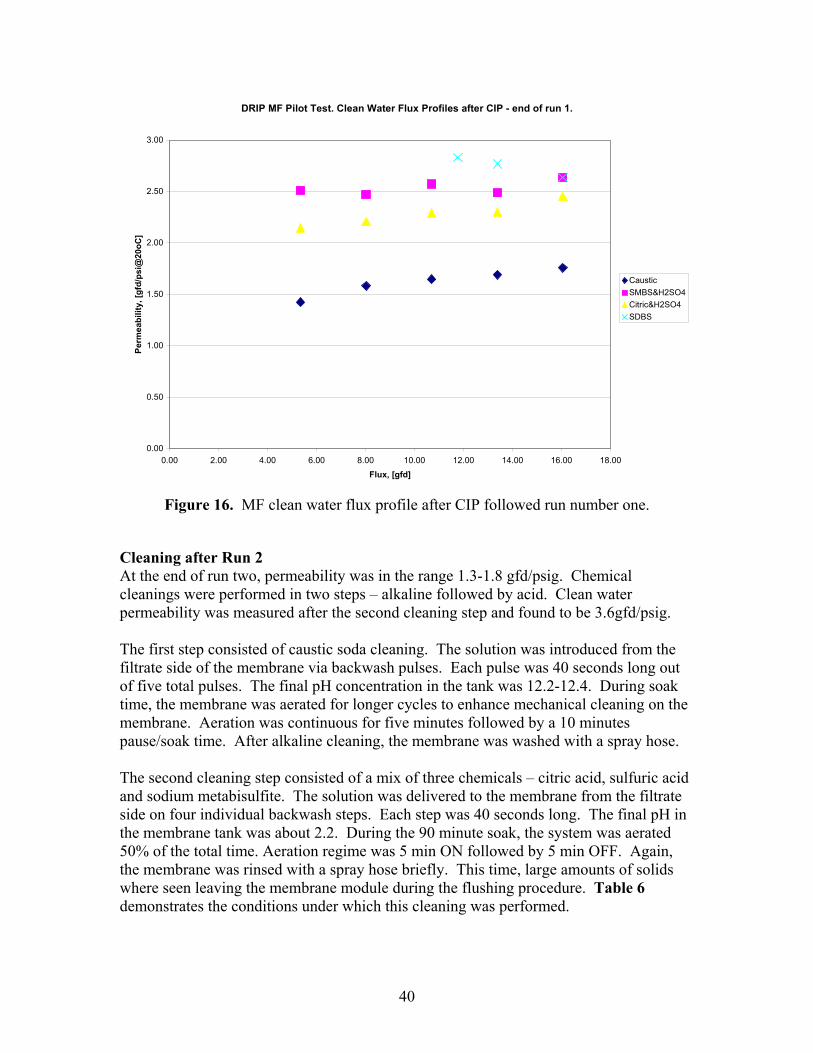
Notes - - - - The result from this cleaning can be seen on Figure 16. Membrane permeability on the fouled membrane at the end of run number one was 1.5-2.0 gfd/psi. The first cleaning step (high pH) did little to restore membrane TMP. The second and third cleaning steps (low pH) restored permeability and delivered a higher cleaning efficiency. This can be contributed to presence of iron based coagulant in the feed. Coagulant bonded with organic matter created a dense fouling layer on the membrane surface. Thus, caustic soda alone was unable to remove the organic matter due to large amounts of iron. Once the iron is dissolved, organic matter is much easier to bring back into solution.
40
DRIP MF Pilot Test. Clean Water Flux Profiles after CIP - end of run 1.
0.00
0.50
1.00
1.50
2.00
2.50
3.00
0.00 2.00 4.00 6.00 8.00 10.00 12.00 14.00 16.00 18.00
Flux, [gfd]
Perm
eabi
lity,
[gfd
/psi
@20
oC]
CausticSMBS&H2SO4Citric&H2SO4SDBS
Figure 16. MF clean water flux profile after CIP followed run number one.
Cleaning after Run 2 At the end of run two, permeability was in the range 1.3-1.8 gfd/psig. Chemical cleanings were performed in two steps – alkaline followed by acid. Clean water permeability was measured after the second cleaning step and found to be 3.6gfd/psig. The first step consisted of caustic soda cleaning. The solution was introduced from the filtrate side of the membrane via backwash pulses. Each pulse was 40 seconds long out of five total pulses. The final pH concentration in the tank was 12.2-12.4. During soak time, the membrane was aerated for longer cycles to enhance mechanical cleaning on the membrane. Aeration was continuous for five minutes followed by a 10 minutes pause/soak time. After alkaline cleaning, the membrane was washed with a spray hose. The second cleaning step consisted of a mix of three chemicals – citric acid, sulfuric acid and sodium metabisulfite. The solution was delivered to the membrane from the filtrate side on four individual backwash steps. Each step was 40 seconds long. The final pH in the membrane tank was about 2.2. During the 90 minute soak, the system was aerated 50% of the total time. Aeration regime was 5 min ON followed by 5 min OFF. Again, the membrane was rinsed with a spray hose briefly. This time, large amounts of solids where seen leaving the membrane module during the flushing procedure. Table 6 demonstrates the conditions under which this cleaning was performed.
41
Table 6. CIP after Run 2. Detailed cleaning conditions.
Number cleaning step 1 2 Chemical 1 NaOH C6H8O7 Concentration in BW line
6,000ppm pH 13
20,000ppm
Concentration in the tank
600ppm pH 12.2
2,000ppm
Source of delivery BW line BW line Chemical 2 None SMBS Concentration in BW line
0ppm 0ppm
Concentration in the tank
0ppm 5,000ppm
Source of delivery Feed side Contact time 90 min 90 min Aeration regime 5min ON/
5min OFF 5min ON/ 5min OFF
Notes - Add 1000ppm H2SO4 for pH adjustment down to 2.0
It can be speculated that implementation of a daily CEB helped not only to sustain long periods between off-line cleaning, but also to restore membrane TMP back to the original values with only two regular cleaning steps. Long soaks were no longer needed.
Reverse Osmosis • Both UF and MF provided adequate pretreatment to the RO when operating at a
flux of 11 gfd. The standard energy saving membrane performed as well as the low fouling membrane and the use of the smaller (26 mil) brine spacer showed no greater tendency to foul than elements using larger (31 mil) brine spacer. When fouling did occur, the high pH cleaning proved more effective than the low pH cleaning; suggesting the presence of colloidal and organic fouling.
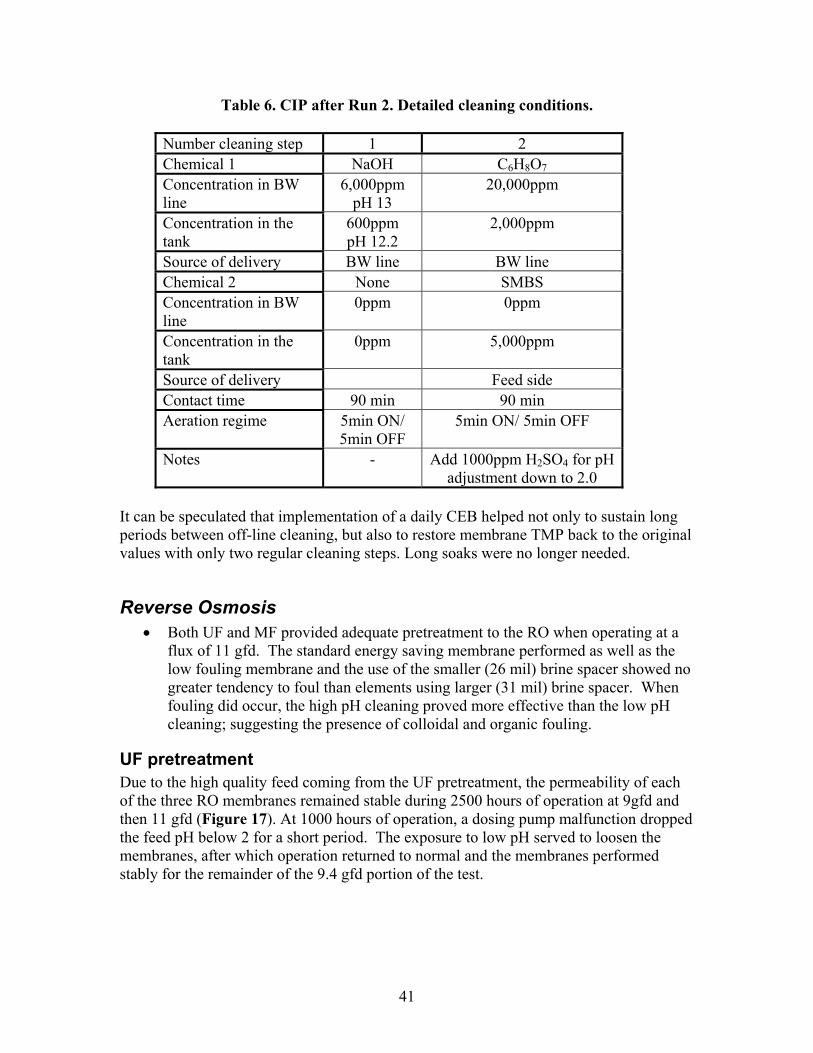
UF pretreatment Due to the high quality feed coming from the UF pretreatment, the permeability of each of the three RO membranes remained stable during 2500 hours of operation at 9gfd and then 11 gfd (Figure 17). At 1000 hours of operation, a dosing pump malfunction dropped the feed pH below 2 for a short period. The exposure to low pH served to loosen the membranes, after which operation returned to normal and the membranes performed stably for the remainder of the 9.4 gfd portion of the test.
42
9 gfd to 11 gfd
0.00
0.02
0.04
0.06
0.08
0.10
0.12
0.14
0.16
0.18
0.20
0 500
1000
1500
2000
2500
Operating Time, hours
Spec
ific
Flux
, gfd
/ p
si
LFC1
ESPA2
LFC3
Figure 17. Normalized permeability of three RO membranes treating UF filtrate. ESPA2 and LFC1 were located in parallel in the first stage. LFC3 was located in the second stage.
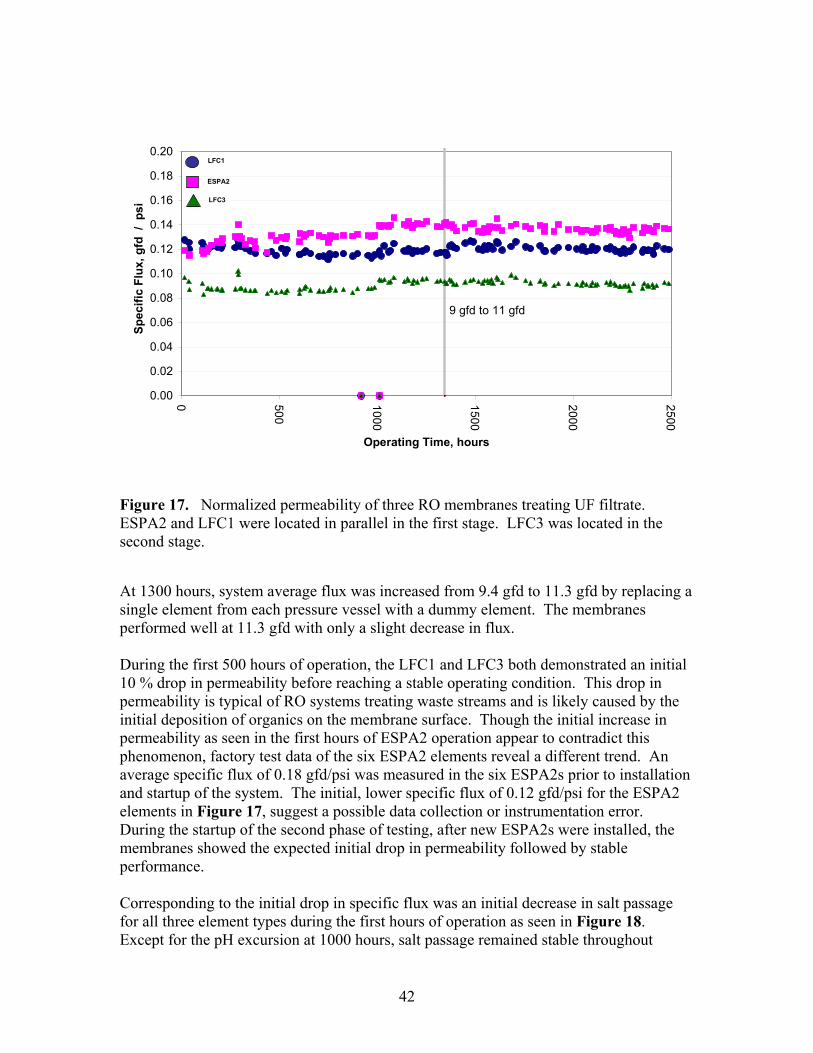
At 1300 hours, system average flux was increased from 9.4 gfd to 11.3 gfd by replacing a single element from each pressure vessel with a dummy element. The membranes performed well at 11.3 gfd with only a slight decrease in flux. During the first 500 hours of operation, the LFC1 and LFC3 both demonstrated an initial 10 % drop in permeability before reaching a stable operating condition. This drop in permeability is typical of RO systems treating waste streams and is likely caused by the initial deposition of organics on the membrane surface. Though the initial increase in permeability as seen in the first hours of ESPA2 operation appear to contradict this phenomenon, factory test data of the six ESPA2 elements reveal a different trend. An average specific flux of 0.18 gfd/psi was measured in the six ESPA2s prior to installation and startup of the system. The initial, lower specific flux of 0.12 gfd/psi for the ESPA2 elements in Figure 17, suggest a possible data collection or instrumentation error. During the startup of the second phase of testing, after new ESPA2s were installed, the membranes showed the expected initial drop in permeability followed by stable performance. Corresponding to the initial drop in specific flux was an initial decrease in salt passage for all three element types during the first hours of operation as seen in Figure 18. Except for the pH excursion at 1000 hours, salt passage remained stable throughout
43
operation at 9.4 gfd. The dilution effect led to a drop in salt passage as system flux was increased from 9.4 gfd to 11.3 gfd. Salt passage remained stable throughout 11.3 gfd operation.
9 gfd to 11 gfd
0.00
0.50
1.00
1.50
2.00
2.50
0 500
1000
1500
2000
2500
Operating Time, hours
Nor
mal
ized
Sal
t Pas
sage
, %
LFC1
ESPA2
LFC3
Figure 18. Normalized salt passage of three membranes treating UF filtrate. ESPA2 and LFC1 were located in parallel in the first stage. LFC3 was located in the second stage.
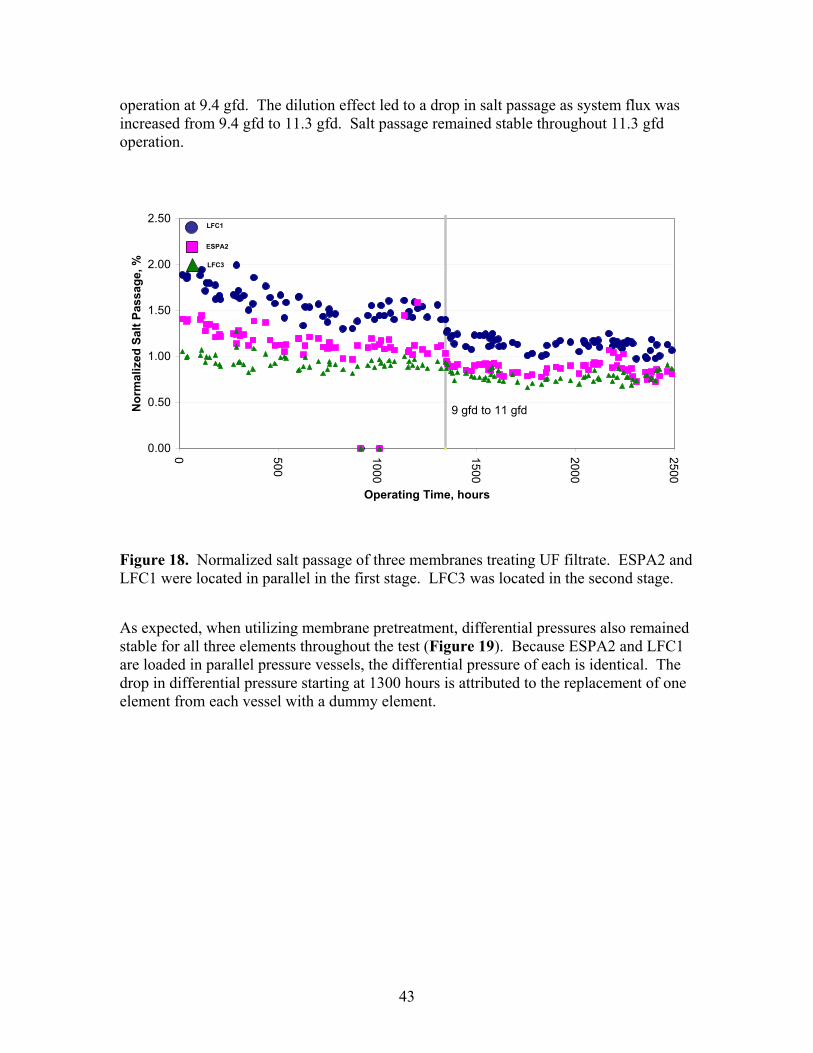
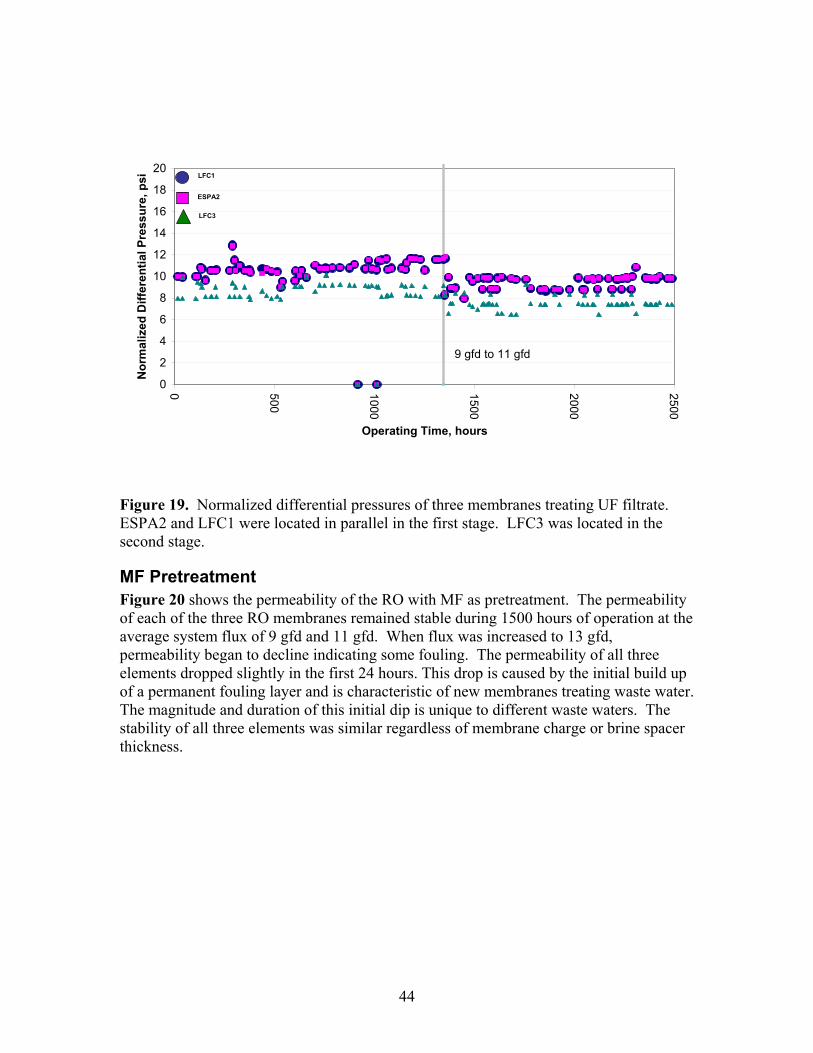
As expected, when utilizing membrane pretreatment, differential pressures also remained stable for all three elements throughout the test (Figure 19). Because ESPA2 and LFC1 are loaded in parallel pressure vessels, the differential pressure of each is identical. The drop in differential pressure starting at 1300 hours is attributed to the replacement of one element from each vessel with a dummy element.
44
9 gfd to 11 gfd
0
2
4
6
8
10
12
14
16
18
20
0 500
1000
1500
2000
2500
Operating Time, hours
Nor
mal
ized
Diff
eren
tial P
ress
ure,
psi LFC1
ESPA2
LFC3
Figure 19. Normalized differential pressures of three membranes treating UF filtrate. ESPA2 and LFC1 were located in parallel in the first stage. LFC3 was located in the second stage.
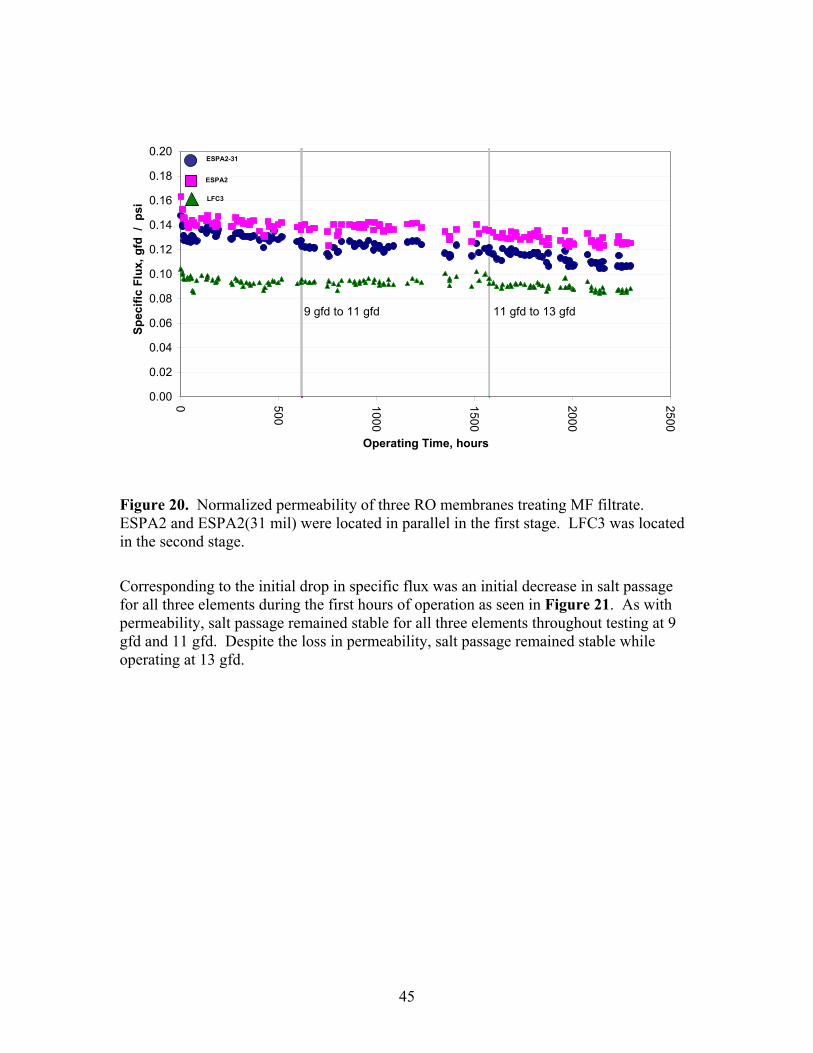
MF Pretreatment Figure 20 shows the permeability of the RO with MF as pretreatment. The permeability of each of the three RO membranes remained stable during 1500 hours of operation at the average system flux of 9 gfd and 11 gfd. When flux was increased to 13 gfd, permeability began to decline indicating some fouling. The permeability of all three elements dropped slightly in the first 24 hours. This drop is caused by the initial build up of a permanent fouling layer and is characteristic of new membranes treating waste water. The magnitude and duration of this initial dip is unique to different waste waters. The stability of all three elements was similar regardless of membrane charge or brine spacer thickness.
45
9 gfd to 11 gfd 11 gfd to 13 gfd
0.00
0.02
0.04
0.06
0.08
0.10
0.12
0.14
0.16
0.18
0.20
0 500
1000
1500
2000
2500
Operating Time, hours
Spec
ific
Flux
, gfd
/ p
siESPA2-31
ESPA2
LFC3
Figure 20. Normalized permeability of three RO membranes treating MF filtrate. ESPA2 and ESPA2(31 mil) were located in parallel in the first stage. LFC3 was located in the second stage.
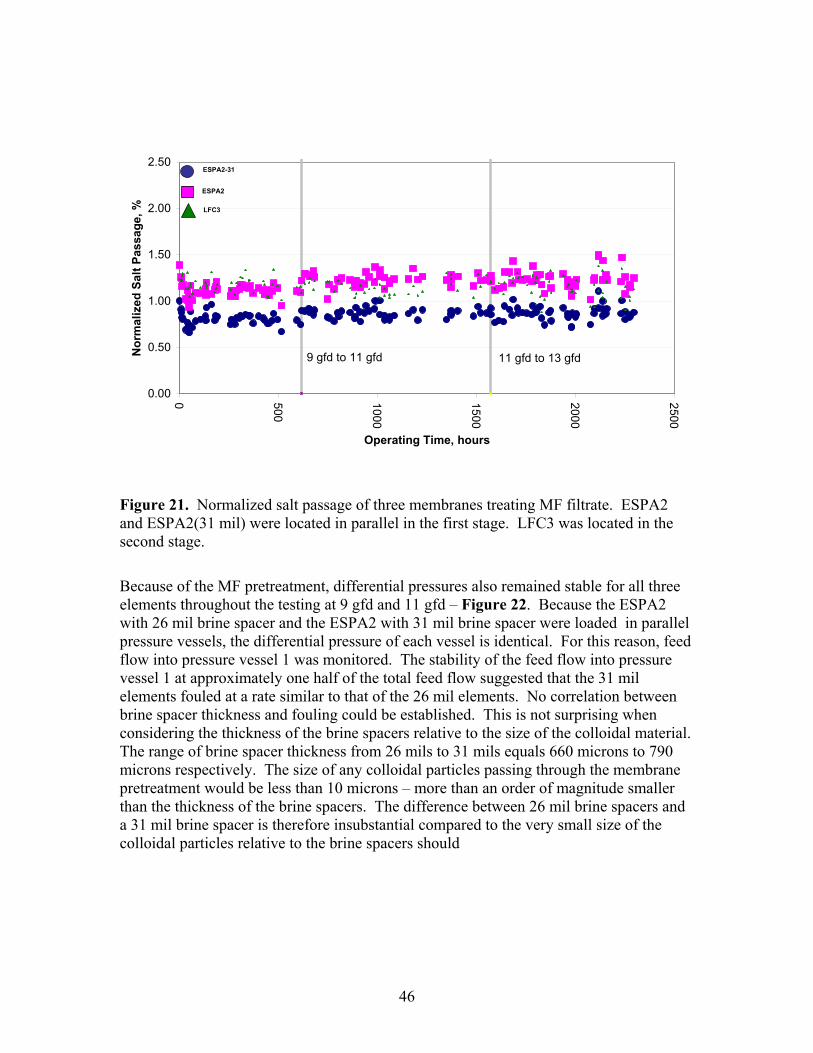
Corresponding to the initial drop in specific flux was an initial decrease in salt passage for all three elements during the first hours of operation as seen in Figure 21. As with permeability, salt passage remained stable for all three elements throughout testing at 9 gfd and 11 gfd. Despite the loss in permeability, salt passage remained stable while operating at 13 gfd.
46
9 gfd to 11 gfd 11 gfd to 13 gfd
0.00
0.50
1.00
1.50
2.00
2.50
0 500
1000
1500
2000
2500
Operating Time, hours
Nor
mal
ized
Sal
t Pas
sage
, %
ESPA2-31
ESPA2
LFC3
Figure 21. Normalized salt passage of three membranes treating MF filtrate. ESPA2 and ESPA2(31 mil) were located in parallel in the first stage. LFC3 was located in the second stage.
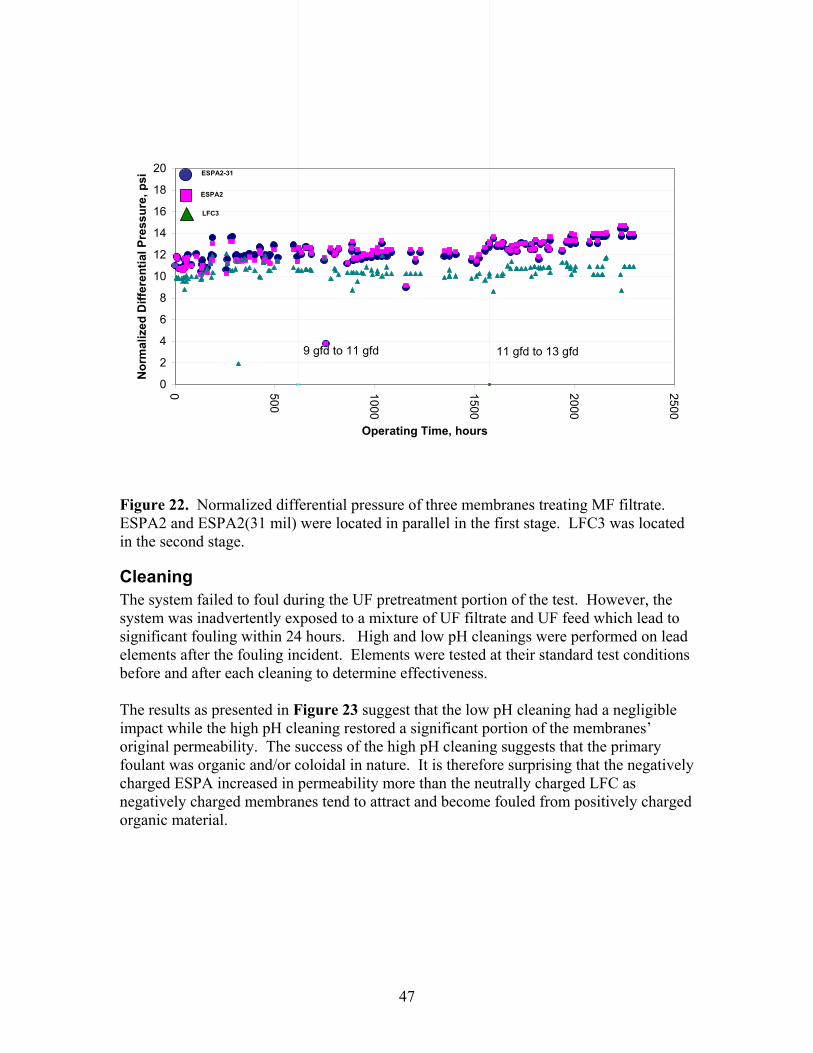
Because of the MF pretreatment, differential pressures also remained stable for all three elements throughout the testing at 9 gfd and 11 gfd – Figure 22. Because the ESPA2 with 26 mil brine spacer and the ESPA2 with 31 mil brine spacer were loaded in parallel pressure vessels, the differential pressure of each vessel is identical. For this reason, feed flow into pressure vessel 1 was monitored. The stability of the feed flow into pressure vessel 1 at approximately one half of the total feed flow suggested that the 31 mil elements fouled at a rate similar to that of the 26 mil elements. No correlation between brine spacer thickness and fouling could be established. This is not surprising when considering the thickness of the brine spacers relative to the size of the colloidal material. The range of brine spacer thickness from 26 mils to 31 mils equals 660 microns to 790 microns respectively. The size of any colloidal particles passing through the membrane pretreatment would be less than 10 microns – more than an order of magnitude smaller than the thickness of the brine spacers. The difference between 26 mil brine spacers and a 31 mil brine spacer is therefore insubstantial compared to the very small size of the colloidal particles relative to the brine spacers should
47
11 gfd to 13 gfd9 gfd to 11 gfd
0
2
4
6
8
10
12
14
16
18
20
0 500
1000
1500
2000
2500
Operating Time, hours
Nor
mal
ized
Diff
eren
tial P
ress
ure,
psi ESPA2-31
ESPA2
LFC3
Figure 22. Normalized differential pressure of three membranes treating MF filtrate. ESPA2 and ESPA2(31 mil) were located in parallel in the first stage. LFC3 was located in the second stage.
Cleaning The system failed to foul during the UF pretreatment portion of the test. However, the system was inadvertently exposed to a mixture of UF filtrate and UF feed which lead to significant fouling within 24 hours. High and low pH cleanings were performed on lead elements after the fouling incident. Elements were tested at their standard test conditions before and after each cleaning to determine effectiveness. The results as presented in Figure 23 suggest that the low pH cleaning had a negligible impact while the high pH cleaning restored a significant portion of the membranes’ original permeability. The success of the high pH cleaning suggests that the primary foulant was organic and/or coloidal in nature. It is therefore surprising that the negatively charged ESPA increased in permeability more than the neutrally charged LFC as negatively charged membranes tend to attract and become fouled from positively charged organic material.
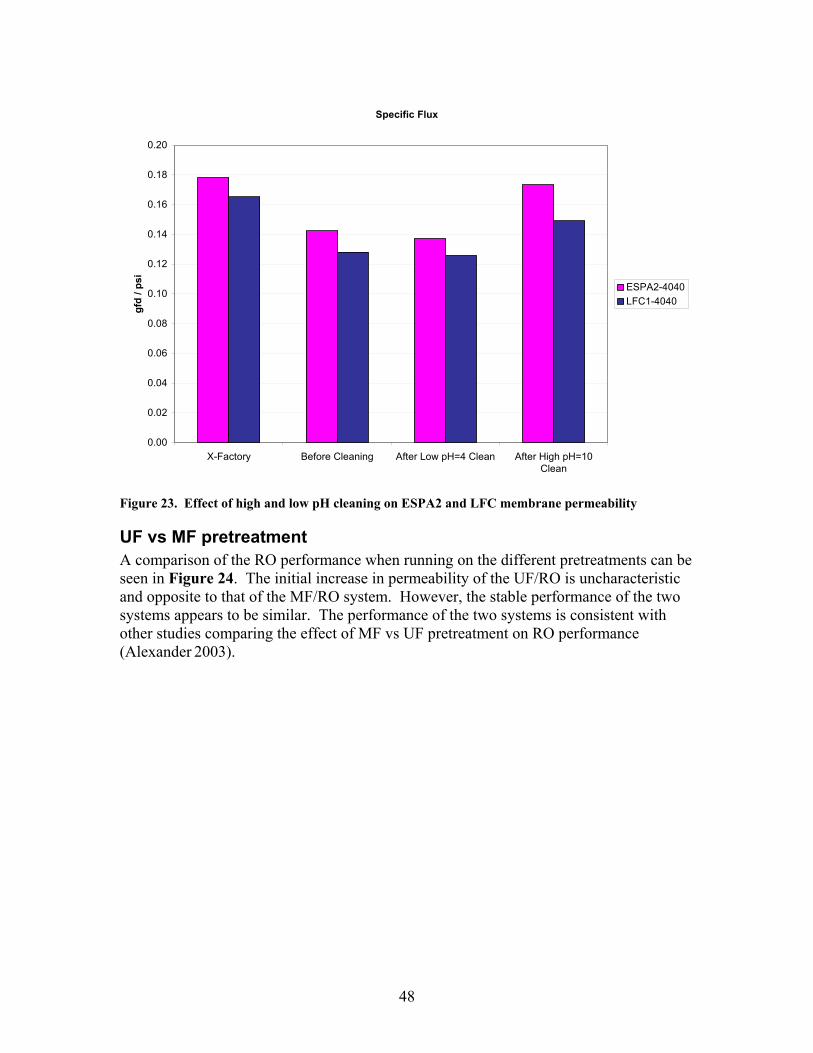
48
Specific Flux
0.00
0.02
0.04
0.06
0.08
0.10
0.12
0.14
0.16
0.18
0.20
X-Factory Before Cleaning After Low pH=4 Clean After High pH=10Clean
gfd
/ psi
ESPA2-4040LFC1-4040
Figure 23. Effect of high and low pH cleaning on ESPA2 and LFC membrane permeability
UF vs MF pretreatment A comparison of the RO performance when running on the different pretreatments can be seen in Figure 24. The initial increase in permeability of the UF/RO is uncharacteristic and opposite to that of the MF/RO system. However, the stable performance of the two systems appears to be similar. The performance of the two systems is consistent with other studies comparing the effect of MF vs UF pretreatment on RO performance (Alexander 2003).
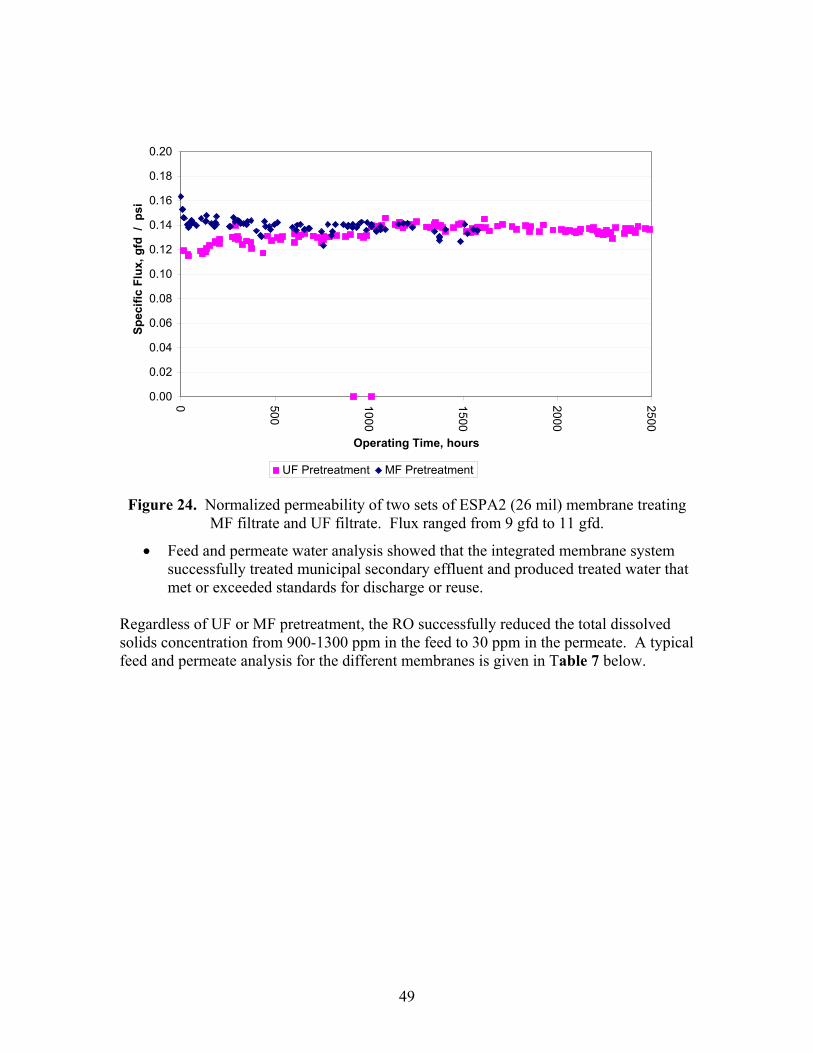
49
0.00
0.02
0.04
0.06
0.08
0.10
0.12
0.14
0.16
0.18
0.20
0 500
1000
1500
2000
2500
Operating Time, hours
Spec
ific
Flux
, gfd
/ p
si
UF Pretreatment MF Pretreatment
Figure 24. Normalized permeability of two sets of ESPA2 (26 mil) membrane treating MF filtrate and UF filtrate. Flux ranged from 9 gfd to 11 gfd.
• Feed and permeate water analysis showed that the integrated membrane system successfully treated municipal secondary effluent and produced treated water that met or exceeded standards for discharge or reuse.
Regardless of UF or MF pretreatment, the RO successfully reduced the total dissolved solids concentration from 900-1300 ppm in the feed to 30 ppm in the permeate. A typical feed and permeate analysis for the different membranes is given in Table 7 below.
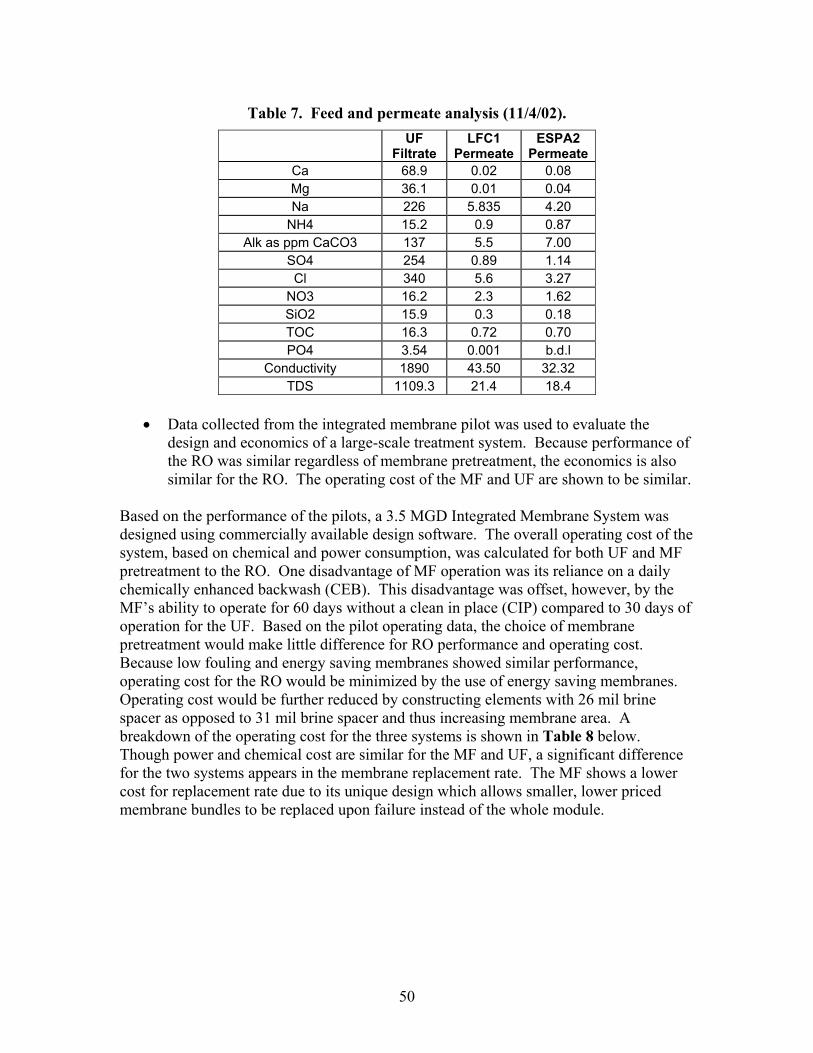
50
Table 7. Feed and permeate analysis (11/4/02).
UF Filtrate
LFC1 Permeate
ESPA2 Permeate
Ca 68.9 0.02 0.08 Mg 36.1 0.01 0.04 Na 226 5.835 4.20
NH4 15.2 0.9 0.87 Alk as ppm CaCO3 137 5.5 7.00
SO4 254 0.89 1.14 Cl 340 5.6 3.27
NO3 16.2 2.3 1.62 SiO2 15.9 0.3 0.18 TOC 16.3 0.72 0.70 PO4 3.54 0.001 b.d.l
Conductivity 1890 43.50 32.32 TDS 1109.3 21.4 18.4
• Data collected from the integrated membrane pilot was used to evaluate the
design and economics of a large-scale treatment system. Because performance of the RO was similar regardless of membrane pretreatment, the economics is also similar for the RO. The operating cost of the MF and UF are shown to be similar.
Based on the performance of the pilots, a 3.5 MGD Integrated Membrane System was designed using commercially available design software. The overall operating cost of the system, based on chemical and power consumption, was calculated for both UF and MF pretreatment to the RO. One disadvantage of MF operation was its reliance on a daily chemically enhanced backwash (CEB). This disadvantage was offset, however, by the MF’s ability to operate for 60 days without a clean in place (CIP) compared to 30 days of operation for the UF. Based on the pilot operating data, the choice of membrane pretreatment would make little difference for RO performance and operating cost. Because low fouling and energy saving membranes showed similar performance, operating cost for the RO would be minimized by the use of energy saving membranes. Operating cost would be further reduced by constructing elements with 26 mil brine spacer as opposed to 31 mil brine spacer and thus increasing membrane area. A breakdown of the operating cost for the three systems is shown in Table 8 below. Though power and chemical cost are similar for the MF and UF, a significant difference for the two systems appears in the membrane replacement rate. The MF shows a lower cost for replacement rate due to its unique design which allows smaller, lower priced membrane bundles to be replaced upon failure instead of the whole module.
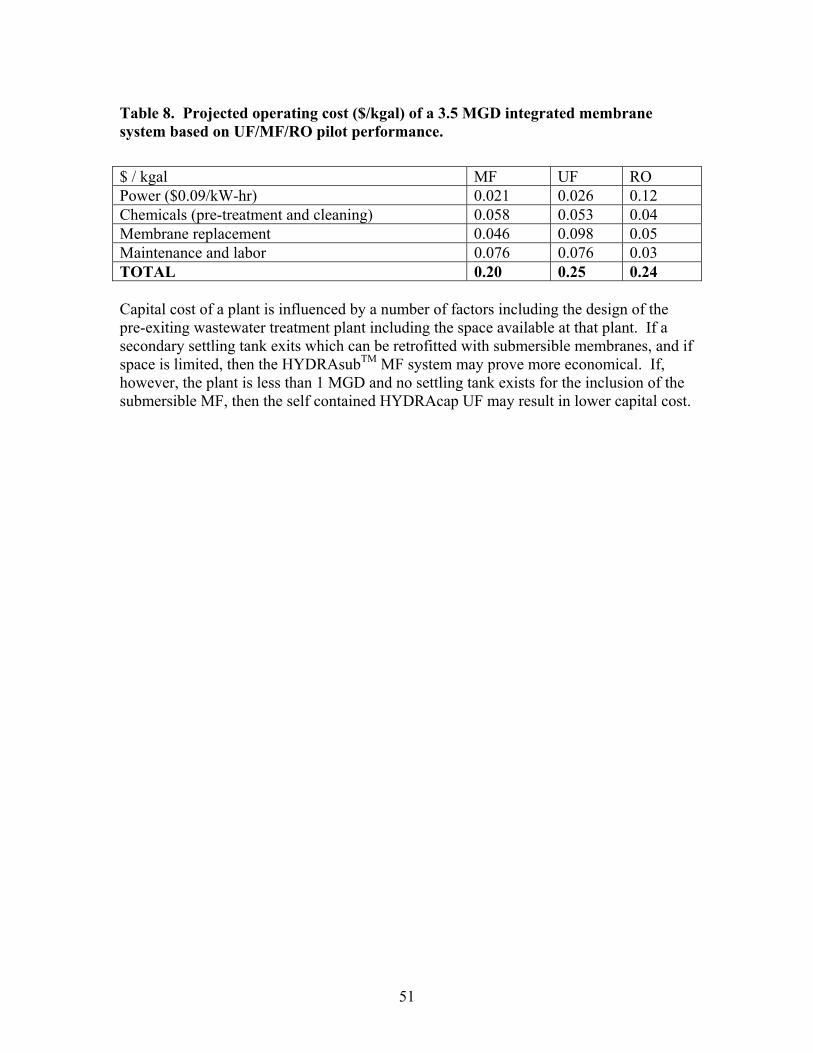
51
Table 8. Projected operating cost ($/kgal) of a 3.5 MGD integrated membrane system based on UF/MF/RO pilot performance.
$ / kgal MF UF RO Power ($0.09/kW-hr) 0.021 0.026 0.12 Chemicals (pre-treatment and cleaning) 0.058 0.053 0.04 Membrane replacement 0.046 0.098 0.05 Maintenance and labor 0.076 0.076 0.03 TOTAL 0.20 0.25 0.24 Capital cost of a plant is influenced by a number of factors including the design of the pre-exiting wastewater treatment plant including the space available at that plant. If a secondary settling tank exits which can be retrofitted with submersible membranes, and if space is limited, then the HYDRAsubTM MF system may prove more economical. If, however, the plant is less than 1 MGD and no settling tank exists for the inclusion of the submersible MF, then the self contained HYDRAcap UF may result in lower capital cost.
52
Conclusions and Recommendations
Ultrafiltration This study showed that a HYDRAcap UF system may be successfully operated on secondary effluent as a pretreatment to reverse osmosis when proper operating parameters are implemented. The pilot system successfully produced filtrate with low turbidity, regardless of feedwater turbidity levels which was essential for the successful operation of the reverse osmosis system. It was demonstrated that the system would operate continuously for 30 days before chemical cleaning. Testing also demonstrated the optimal cleaning procedures needed to restore membrane performance. The optimal flux was found to be 32 gfd and recovery was found to be 88%.
Microfiltration Pilot test with HYDRAsubTM membrane successfully demonstrated the use of microfiltration as pretreatment to reverse osmosis. There is no apparent difference between UF and MF pretreatment on the performance of the RO. The larger pore size of the microfiltration membrane provides adequate pretreatment to the RO when secondary wastewater effluent is treated. Feed water pretreatment to the MF using coagulant and oxidant appears to be the main factor for system stability. The failure of either one of the two pretreatment chemicals leads to rapid fouling. Of similar importance is the implementation of daily CEB. The proper selection of CEB chemicals, dosages, and process sequence is critical for system stability. The CEB can significantly reduce the CIP cleaning frequency so that the interval between CIP cleanings is 9 weeks or longer. Using CEB once a day was sufficient to restore membrane TMP to levels close to the original TMP. A stable pattern of TMP increase and complete restoration after CEB was seen on the pilot unit. The period of these repetitive cycles is equal to the period between two CEBs. Small changes in feed water quality do not affects TMP restoration after CEB. The best chemicals for CEB where found to be sodium hydroxide and sodium metabisulfite. Pretreatment with coagulant and introduction of chloramination in the MIMS significantly improved performance and substantially suppressed biogrowth. Minimum dosage of 0.5ppm iron and 2.5ppm chlorine where found sufficient to deliver required result. Off-line chemical cleaning was found successful to restore membrane TMP close to initial values. For high pH cleaning, the most useful chemical was caustic soda. For low pH cleaning, a mix of three acids – citric acid, sulfuric acid and sodium metabisulfite, was the most economical and efficient cleaning composition. The order of chemicals should first be a high pH cleaning followed by low pH cleaning.
53
System recovery of 94-95% was achieved. Elimination of system bleed flow and reduction on backwash drain flow helped to reduce overall waste flow from the system. It appears that the system can run for more than two months at these settings. A filtrate flux of 12 gfd is applicable for the feed water treated in this study. Aeration during filtration and backwash was found to be very economical. The total fraction of daily time used for aeration with intermittent and rapid air pulsation was only 3% of the total 24h operational period each day. Continuous aeration during part of the soak time was also found to be helpful for cleaning the membrane.
Reverse Osmosis The reverse osmosis unit successfully treated secondary effluent while operating at 11 gfd and 75% recovery using both MF and UF as pretreatment. The RO reduced salinity from 1100 ppm in the feed to 20 ppm in the permeate. The side by side operation of the neutrally charged LFC and negatively charged ESPA membranes gave similar results. Both membranes showed a similar restoration in flux after high pH cleaning. Though previous side by side testing of the two elements treating waste water have demonstrated the superior resistance to fouling of the LFC (Wilf, 2000), other testing has shown the ESPA to resist fouling as well as or better than the LFC (Alexander 2003). This study and previous studies lead to the conclusion that the ability of the membrane to resist fouling when treating secondary effluent is dependent not just on the membrane charge, but on a combination of membrane chemistry and specific wastewater composition. The ability of the ESPA2 to resist fouling as well as the LFC is advantageous for the end user due to the higher permeability, and therefore lower pressure requirement, of the ESPA2. The side by side operation of the ESPA2 with 26 mil brine spacer and the ESPA2 with 31 mil brine spacer demonstrated similar performance. Due to the high quality of the feed water, both elements operated successfully at an average system flux of 11 gfd. Increasing flux to 13 gfd resulted in a loss of flux and an increase in differential pressure which was similar for both elements. For this reason, no correlation between brine spacer thickness and propensity to fouling could be established. The 26 mil brine spacer provides a significant advantage over the 31 mil brine spacer since more membrane can be rolled into an element with a smaller brine spacer. More membrane area per element results in savings for the end user. Either fewer elements can be used in a system to achieve the same flux and thus reduce capital cost or the same number of elements can be used to lower the flux and thus reduce operating cost. The RO pilot was shown to have similar performance regardless of membrane pre treatment. Whether using MF as pretreatment or UF as pretreatment, the RO was stable at a flux of 11 gfd. This flux is typical of existing RO systems treating secondary wastewater with membrane pretreatment (Alexander 2003). Because the RO performs well with either MF or UF pretreatment, any advantages of one pretreatment type are primarily economic and a function of the size of the proposed treatment plant. Furthermore, because the operation costs of the two pretreatments are similar, the
54
economic advantage of either pretreatment option is based on capital cost. As a general rule, treatment plants with a capacity of less than 1 MGD in which a settling tank is not already present, should use the self contained UF to save on capital costs. Other plants with a capacity greater than 1 MGD should consider MF; especially if the existing settling tanks can easily be retrofitted with the submerged MF modules. The successful operation of the UF, MF, and RO demonstrate the ability of the overall multiple integrated membrane system to treat municipal secondary effluent and produce treated water of a quality that meets the pertinent regulations for discharge or reuse. Both the UF and MF served to remove suspended solids and greatly reduce turbidity to a level acceptable for RO feed. The RO served to reduce dissolved solids and act as a secondary barrier to any microbial or colloidal mater that passed through the UF or MF membrane pretreatment.
Commercialization Potential In terms of commercialization potential, this study should be considered at Stage 5, Product Development and Field Testing, of the Stages and Gates Process as defined by the Public Interest Energy Research (PIER) Program. This study used a sub-scale MIMS pilot unit to demonstrate the systems feasibility, reliability, availability, maintainability, and durability in the field. The UF and RO membranes used in this study are currently in production and readily available. These membranes have been used to treat a variety of water sources including wastewater. The study successfully demonstrated the use of an MIMS to reclaim secondary effluent for reuse, thereby reducing the demand for other water sources such as imported water. The MIMS successfully treated water to a quality exceeding that of Title 22 of the California Code of Regulations.
Recommendations Law makers and the people of California have shown themselves to be proactive in supporting this MIMS studies and others like it. The use of membranes to reclaim wastewater can greatly reduce the negative impact of an ever diminishing water supply coupled with a rapidly increasing population. The next step is to go from pilot studies to full scale systems. Large scale reclamation plants using membranes to treat wastewater are currently in operation or under construction. One such site, the Ground Water Replenishment System in Orange County, will use a MIMS consisting of MF followed by RO to treat 57 million gallons of wastewater per day. The permeate from this MIMS will be returned to the county’s depleted aquifers. Despite the increasing water challenges Californians will continue to face in the coming years and despite the proven success of MIMS pilots and systems to reclaim and treat wastewater, most wastewater treatment plants throughout the state continue to send their
55
effluent to drain. It is essential for California to go beyond the study of MIMS and to move quickly to implement the findings of such studies for large scale systems. The findings of this particular study can be used for the design of a full scale MIMS using UF or MF as membrane pretreatment to an RO. The choice of UF or MF depends on the size of the plant as discussed previously above. Another option to be considered is the piloting of a MIMS consisting of a Membrane Bioreactor (MBR) as pretreatment to RO. In many cases the MBR is a better alternative to MF or UF. The piloting of an MBR as pretreatment to the RO was beyond the scope of this study.
Benefits to California Within a few miles of the LaSalina Waste Water Treatment Plant, where this study was conducted, lie several sites that could potentially benefit from reclaimed wastewater treated by a membrane system. These sites include wetlands, agricultural areas, industrial parks, highway irrigation, and golf courses. These sites are representative of the numerous environmental, agricultural, commercial, and industrial water users throughout the entire state of California that require water for non-potable uses and would benefit from a dependable source of reclaimed wastewater. This study demonstrates how an integrated membrane system can reclaim and treat wastewater to a level that would benefit such users. This study demonstrates how an integrated membrane system can successfully be used to address California’s water shortage problems in the coming decades.
56
References Abi-Samra, B.C., Cook, P., Lange, P., Zepeda, J., Design and Operation of a Microfiltration and Reverse Osmosis System Treating Secondary Effluent and Providing High Quality Reclaimed Water. American Membrane Technology Association Biannual Conference, Tampa Bay, 2002. Adham, S., Gabliardo, P., Merlo, R., Trussell, R., Evaluation of Three Pretreatment Processes on RO Membrane Performance on Reclaimed Water., AWWA Membrane Conference, San Antonio, TX, March 2001. Alexander, K., Guendert, D., Pankratz, T., Comparing MF/RO Performance on Secondary and Tertiary Effluents in Reclamation/Reuse Applications. International Desalination Association Annual Conference, Bahamas, 2003. Alexander, K., Alt, S., Owens, E., Patel, M., McGovern, L., Low Fouling Reverse Osmosis Membranes: Evidence to the Contrary on Microfiltered Secondary Effluent. American Water Works Association Membrane Technology Conference, 2003. Alonso E., Santos A., Solis G., Riesco P., On the feasibility of urban wastewater tertiary treatment by membranes: a comparative assessment, Desalination 141, (2001), 39-51. Andes, K., Bartels C., Iong, J., Wilf, M., Design Considerations for Wastewater Treatment by Reverese Osmosis., International Desalination Association Annual Conference, Bahamas, 2003. DeCarolis, J., Hong, S., Taylor, J., Naser, S., Effect of Operating Conditions on Flux Decline and Removal Efficiency of Solid, Organic and Microbial Contaminants During Ultrafiltration of Tertiary Wastewater for Water Reuse. American Water Works Association Membrane Conference Proceedings. San Antonio, TX, March 2001. Schimmoller L., McEwen B., Ferric chloride pretreatment improves membrane performance: pilot result for Denver’s new 30 MGD water reclamation plant, AWWA Membrane Technology Conference Proceedings, 2001. Wilf M., Alt S., Application of Low Fouling RO Membrane Elements for Reclamation of Municipal Wastewater. Desalination 132 (2000), pp 11-19.


![Preparation of hydrophilic nanofiltration membranes for …...ing nanofiltration (NF) and reverse osmosis (RO) membranes [6, 7]. Membrane fouling reduces membrane performance, increases](https://img.pdfslide.us/doc/110x75/611b4ef3f07ac85c23709bed/preparation-of-hydrophilic-nanofiltration-membranes-for-ing-nanofiltration-nf.jpg)