Embed Size (px)
Citation preview

Integrated Master in Chemical Engineering
Study of lactic acid polycondensation and lactide production
Master Thesis of
Ana Marta Moniz Xavier
Developed for the Dissertation Project
realized in
Eidgenössische Technische Hochschule Zürich
Supervisor in ETH: Prof. Dr. Massimo Morbidelli
Prof. Dr. Giuseppe Storti
Fabio Codari
Chemical Engineering Department
July 2010
ii
Abstract
Poly(lactic acid) is a biodegradable polyester which, due to its physical and
chemical properties is the best candidate to replace on the market petroleum-based
polymers. The most interesting route to produce PLA involves three steps, the
polycondensation of lactic acid until low molecular weight, depolymerisation of the
prepolymer into the cyclic dimer of lactic acid, lactide, and ring opening polymerization
of lactide to achieve high molecular weight. In the literature there are several papers
concerning the polycondensation of lactic acid and the ring opening polymerization of
lactide but the same does not happens with the production of lactide. Moreover,
discrepancies exist in the published literature. In order to fully characterize the two
first steps of this process, reactions at different temperatures, pressures, with or
without catalyst were carried out in a semi-batch reactor. Special efforts have been
devoted to achieve full characterization of both polymer melt and gas phases.
Different analytical techniques have been adopted, and comparatively used, in order
to evaluate polymer average properties. On the base of these detailed experimental
data, which were not accessible so far in the literature, a more comprehensive
description of the system has been obtained. At the same time, a comprehensive
model accounting for both PC reaction and LT formation is developed.
Key Words: Poly(lactic acid), Lactide, Polycondensation, Depolymerization
iii
Index
Abstract ............................................................................................................................. ii
1 Introduction............................................................................................................... 1
1.1 PLA Production ................................................................................................. 2
1.1.1 Polycondensation of Lactic acid ................................................................... 2
1.1.2 Production of HMW PLA ............................................................................... 4
1.2 PLA properties, degradation and recycling ...................................................... 6
1.3 Lactide properties and production ................................................................... 9
1.4 Aim of the work .............................................................................................. 13
References .................................................................................................................. 14
2 Experimental Work.................................................................................................. 16
2.1 Experimental plan ........................................................................................... 16
2.2 Reaction setup ................................................................................................ 17
2.3 Characterization Techniques .......................................................................... 19
2.3.1 High performance liquid chromatography (HPLC) ..................................... 19
2.3.2 Size Exclusion Chromatography ................................................................. 22
2.3.3 Gas Chromatography .................................................................................. 23
2.3.4 Karl Fischer ................................................................................................. 24
References .................................................................................................................. 26
3 Lactic Acid Polycondensation .................................................................................. 27
3.1 Experimental results ....................................................................................... 27
3.1.1 Bulk Phase ................................................................................................... 27
3.1.2 Gas Phase .................................................................................................... 32
4 Lactide Production .................................................................................................. 34
4.1 Experimental results ....................................................................................... 34

iv
4.1.1 Temperature effect .................................................................................... 34
4.1.2 Pressure effect ............................................................................................ 39
4.1.3 Industrial Conditions .................................................................................. 44
References .................................................................................................................. 50
5 Model development .................................................... Erro! Marcador não definido.
5.1 General background ........................................... Erro! Marcador não definido.
5.2 Model assumptions and equations .................... Erro! Marcador não definido.
5.2.1 Vacuum stream flow rate evaluation ............. Erro! Marcador não definido.
5.2.2 Mass transport evaluation ............................. Erro! Marcador não definido.
References ...................................................................... Erro! Marcador não definido.
6 Conclusions.............................................................................................................. 63

v
Index of Figures
Figure 1.1 – Lactic acid isomers [5]. ........................................................... 1
Figure 1.2 – Lactic acid polycondensation scheme [9]. ..................................... 3
Figure 1.3- Synthesis methods for high - molecular - weight PLA. (Adapted from
Garlotta et al.[1]) ................................................................................ 6
Figure 1.4 – Fossil energy used for preparation of different petroleum based polymers
and PLA produced from ROP of lactide [17]. ................................................. 8
Figure 1.5 – Contributions to global climate change for petrol based polymers and PLA
[17]. ................................................................................................ 8
Figure 1.6 - The three possible forms of lactide [1]. ....................................... 9
Figure 1.7 - Detail of the back-biting reaction of the –OH group in a general chain of
poly(lactic acid) [19]. .......................................................................... 10
Figure 1.8 – Two points where the ester bond can break: alkyl-oxygen bond (a) and
carbonyl-oxigen bond (b) [10]. ................................................................ 11
Figure 2.1 - Reaction set up. (TI-temperature indicator; TCI-temperature controller
and indicator). ................................................................................... 18
Figure 2.2 - Chromatogram of a LMW-PLA. The separation is well succeeded in HPLC.
..................................................................................................... 21
Figure 2.3 - Chromatogram of an HMW-PLA sample. For higher oligomers the
separation is not well succeeded in HPLC. .................................................. 21
Figure 2.4 - Molecular weight as a function of reaction time determined by: □ HPLC
and ◊ GPC. ....................................................................................... 23
Figure 3.1 - Bulk volume as a function of reaction time: 130 ºC; 150 ºC; 170 ºC; o
190 ºC. ............................................................................................ 27
Figure 3.2 - Water concentration in bulk phase as a function of time: 130 ºC; 150
ºC; 170 ºC; o 190 ºC. .......................................................................... 28
Figure 3.3 - Polymer molecular weight as a function of time for different reaction
conditions: 130 ºC; 150 ºC; 170 ºC; o 190 ºC. ......................................... 29
Figure 3.4 – PDI as a function of the extent of reaction for all the reactions: 130 ºC;
150 ºC; 170 ºC; o 190 ºC. .................................................................. 30

vi
Figure 3.5 - Oligomers mole fraction as a function of time, bulk phase: 130 ºC;
150 ºC; 170 ºC; o 190 ºC. ..................................................................... 31
Figure 3.6 - Lactide concentration in bulk as a function of reaction time: 130 ºC;
150 ºC; 170 ºC; o 190 ºC. ..................................................................... 32
Figure 3.7 – Cumulative mass of the condenser species as a function of reaction time:
150 ºC; 170 ºC; o 190 ºC. .................................................................. 33
Figure 4.1 - Bulk volume as a function of reaction time: 190 ºC; 200 ºC; o 210 ºC.
..................................................................................................... 35
Figure 4.2 - Polymer molecular weight as a function of time for different reaction
temperatures: 190 ºC; 200 ºC; o 210 ºC. ................................................. 36
4.4 - Oligomers weight fraction as a function of time, bulk phase: 190 ºC; 200 ºC;
o 210 ºC. .......................................................................................... 37
Figure 4.5 – Lactide mass fraction as a function of time: 190 ºC; 200 ºC; o 210 ºC.
..................................................................................................... 38
Figure 4.6 – Cumulative mass of water, monomer, dimer and lactide in condensed gas
phase: 190 ºC; 200 ºC; o 210 ºC. .......................................................... 39
Figure 4.7 – Change in bulk volume for reactions at different pressures: 25 mmHg;
10 mmHg. ........................................................................................ 40
Figure 4.9 – Water concentration in the bulk as a function of time: 25 mmHg; 10
mmHg. ............................................................................................ 41
Figure 4.10 – Oligomers weight fraction versus reaction time: 25 mmHg; 10
mmHg. ............................................................................................ 42
Figure 4.11 – Lactide weight fraction over time for the reaction performed at 25
mmHg () and 10 mmHg () .................................................................... 43
Figure 4.12 – Cumulative mass of water, monomer, dimer and lactide in condensed
gas phase: 25 mmHg; 10 mmHg. .......................................................... 44
Figure 4.13 – Volume change for the reaction performed at industrial conditions. ... 45
Figure 4.14 – Number average molecular weight over time for the reaction performed
at industrial conditions. ........................................................................ 45
Figure 4.15 – Water concentration in bulk as a function of reaction time for the last
reaction performed. ............................................................................ 46
vii
Figure 4.16 – Oligomers weight fraction as a function of reaction time for the
reaction performed at industrial conditions. ............................................... 47
Figure 4.17 - Lactide weight fraction over reaction time for the reaction performed
at industrial conditions. ........................................................................ 48
Figure 4.18 – Cumulative mass in the condenser for the reaction performed at
“extreme” conditions. .......................................................................... 49
Figure 5.1 - Wx distribution as a function of p (p=0.25 ―, p=0.45 – –, p=0.75 ∙∙∙, p=0.9
-∙-). ................................................................................................ 52
Figure 5.2 - Px distribution as a function of p (p=0.25 ―, p=0.45 – –, p=0.75 ∙∙∙, p=0.9
-∙-). ................................................................................................ 52
Figure 5.3 - Concentration based equilibrium constants. ................................. 55
Figure 5.4 - Interchange reactions occurring in PC (from Kotliar[14]). ................. 55
Figure 5.5 - Interface concentration profile. ............................................... 59

viii
Index of Tables
Table 1.1- Physical Properties of Lactic Acid [6] ............................................................... 2
Table 1.2 – Polycondensation literature review. ............................................................. 4
Table 2.1 - Experimental conditions used in the first set of experiments. .................... 16
Table 2.2 - Experimental conditions used in the depolymerization reactions. .............. 17
Table 2.3 - Analytical techniques used. .......................................................................... 19
Table 2.4 - HPLC parameters. ......................................................................................... 20
Table 2.5 - GPC parameters. ........................................................................................... 22
Table 5.1 - Antoine’s parameters. ...................................... Erro! Marcador não definido.

Chapter 1 - Introduction
1
1 Introduction
Polylactic acid (PLA) is a biodegradable aliphatic polyester produced from
renewable sources which, due to its excellent physical-chemical properties and
environment compatibility, is considered the best candidate to replace on the market
petroleum-based plastics. It has a wide range of applications ranging from medical
devices, such as suture treads and scaffolds, to commodity products like bottles and
films for food packaging [1-3].
The monomer, lactic acid (LA), is the smallest optical active organic compound
present in nature. Due to the presence of a chiral carbon, LA exists in the two optical
isomers, L (+) and D (-) (Figure 1). It was first isolated in 1780 from sour milk and first
commercially produced around 1880. It can be obtained by petrochemical synthesis or
fermentation process. Nowadays, due to the improvements in bacterial fermentation
of D-glucose, optically preferentially pure lactic acid is produced through the batch
fermentation process of corn and other carbohydrates [4] which involve key steps as
cell mass and protein removal and, LA recovery, purification and concentration [3]. In
the United States, LA is largely used in food applications such as acidic flavouring agent
or buffering agent [1]. Some of its physical properties are shown in Table 1.1.
Figure 1.1 – Lactic acid isomers [5].

Chapter 1 - Introduction
2
Table 1.1- Physical Properties of Lactic Acid [6]
Properties Value
Molecular Weight (Da) 90.098
Melting Point (D(-) or L(+))
(DL)
52.8 – 54 ºC
16.8 – 33 ºC
Boiling Point DL (0.5 mmHg)
(14 mmHg)
82 ºC
122 ºC
Dissociation constant (Ka at 25ºC) 1.37 x 10⁻⁴
Heat of combustion ( Hc) 1361 KJ.mol-1
Specific heat (Cp at 20 ºC) 190 J.mol-1ºC-1
In next part of the chapter, a brief review on PLA properties and production
processes is summarized as long as the main contributions reported in the literature
regarding LA polycondensation and lactide production.
1.1 PLA Production
The production of PLA with low molecular weight (LMW) is known since 1932
[7]. It is characterized by substandard properties and is useless for the majority of PLA
applications. Due to this, new techniques were developed to produce a high molecular
weight (HMW) polymer, of larger industrial and commercial interest. In the next
sections a description of the main routes used to produce PLA is reported.
1.1.1 Polycondensation of Lactic acid
Polycondensation of lactic acid is the simple process used to produce PLA. LA is a
bifunctional monomer that undergoes self-esterification through a reversible step-
growth mechanism in which polymer chains react together leading to longer chains
with the production of water [8]. The reaction scheme is represented in Figure 1.2.

Chapter 1 - Introduction
3
Figure 1.2 – Lactic acid polycondensation scheme [9].
Water can be considered as the side product of the reaction and has to be
removed from the reacting mixture in order to shift the chemical equilibrium to the
right side and enhance the polycondensation reaction. Water removal is a key aspect
which limits the extent of reaction and thus the polymer molecular weight. Due to
increase in viscosity during polymerization, water removal efficiency decreases and
only LMW polymer can be produce by PC [9].
The polycondensation of LA is studied in several papers, many from a
qualitative point of view, and discrepancies are reported. A summary of the major
works in polycondensation is listed in Table 1.2. Moreover, a systematic study of the
parameters affecting the process is missing. Many aspects have to be taken into
account such as: reaction temperature and pressure, nature, concentration and
addition of catalyst and role of water mass transport. A wide variety of metal based
catalyst such as Tin and Zn compounds were found to be effective in enhancing the
polycondensation of lactic acid [10]. An additional aspect regards the possible
discoloration of the final polymer. During the polycondensation PLA undergoes side
reactions leading to colour changes from yellow to brown and finally to black. These
side reactions occur mainly at high reaction temperature and time but are still not well
known [3].The addition of co-catalysts, as p-toluenesulfonic acid (TSA) is reported to
be more effective that single metal catalysts, in terms of molecular weight achieved
and in the effectively prevention of the polymer discoloration [9, 11].

Chapter 1 - Introduction
4
Table 1.2 – Polycondensation literature review.
Ref. P (bar) T (ºC) Mn (Da) tr (h)
Ajioca et al. (1995) 1.013 130 115,000 24
Miyoshi et al. (1996) 0.013 230 75,000 24
Moon et al. (2000) 0.013 180 22,000 5
Moon et al. (2001) 0.00066 150 335,000 37
Quain et al. (2003) 0.013 150 100,000 73
Yoda et al. (2004) 240 80 13,500 24
Zhao et al. (2004) 0.0007 180 2,000 10
Chen et al. (2006) 0.0013 170 65,000 13
Nagahata et al. (2007) 0.04 200 8,000 0.5
Lei et al. (2007) 0.15 180 25,000 16
Another concern in polycondensation of lactic acid is the occurrence of
cyclization and transesterification side reactions which are detailed in section 1.3.
Impact of ring formation and intermolecular transesterification for PC reactions has
been extensively studied in the literature [12-15]. Out of all the possible reaction, as
fully addressed in chapter 3, describing the model assumptions, only depolymerization
reactions leading to small ring is reported. It is worth to mention that, as reported by
Kotliar (1981) [12], among the possible transesterification reactions, alcoholisis is the
most favourable. Anyway, due to the small extent of reactions investigated, it was not
considered.
1.1.2 Production of HMW PLA
HMW PLA can be produced mainly by three different processes, schematically
reported in Figure 1.3. The less attractive process is based on azeotropic dehydrative
condensation of LA in the presence of organic solvents, such as toluene, xylene and
diphenyl ether [1]. This method was first patented in collaboration with the Japanese
company Mitsui Toatsu Chemicals in 1994 [12]. Due to the use of those
environmentally non-friendly solvents, even if the process leads to HMW PLA, it does
not present large attention from the industrial point of view. The other two processes

Chapter 1 - Introduction
5
are based on chain coupling agent (CCA) and ring opening polymerization (ROP)
reactions and pass through a common initial step of LA polycondensation [1]. In the
CCA process, chain coupling agents are added to the mixture in order to link different
chains producing HMW polymer. The drawback of the process is that the use of those
linkers leads to a lower polymer purity in terms of chemical composition. Depending
on the nature of the coupling agents used, PLA based polymers with different
structures and properties are produced [1].
The ROP process is the most attractive route to obtain HMW PLA with high
degree of crystallinity [1]. Instead of adding linkers, as it is done in the CCA process,
the strategy is to produce by pre-polymer degradation an intermediate product, cyclic
dimer of LA called lactide (LT), which then reacts by ROP leading to HMW PLA. The
process consists mainly of three steps: LA polycondensation, lactide (LT) production by
degradation of the LMW PLA, and ring-opening polymerization (ROP) of LT which leads
to HMW PLA [1]. ROP reaction is not revised since it is not part of the present work. For
some information and general aspect regarding ROP of LT the reader is referred for
example to(2009) that made a review about this topic [13].

Chapter 1 - Introduction
6
Figure 1.3- Synthesis methods for high - molecular - weight PLA. (Adapted from Garlotta et
al.[1])
1.2 PLA properties, degradation and recycling
PLA has attracted large attention due to its biodegradability and mechanical
properties similar to the ones of polyethylene terephthalate (PET), polypropylene (PP)
and other common petrol-based plastics [3]. It is a thermoplastic polymer with high
mechanical strength and flexural modulus higher than the one of polystyrene (PS) [14].
It can be stress crystallized, thermally crystallized, copolymerized, and processed in a
variety of existing processing equipment. It has also good organoleptic characteristics
[3], resistance to fatty foods and dairy products and presents excellent flavour and
aroma barrier [14]. Due to these features, it is one of the polymers with the wider
range of applications on the market [3]. As introduced previously, PLA can be produced
with different enantiomeric compositions, depending upon the L and D content in the
polymer chains also referred as polymer optical purity. Due to this aspect, PLA shows
properties varying in a range of values as a function of the enatiomeric composition.
Depending upon the application, polymers ranging from fully amorphous (50 % D

Chapter 1 - Introduction
7
content) to high crystalline (> 99% L content) behaviour can be selected. PLA glass
transition temperature (Tg) ranging from 50ºC to 80ºC and melt temperature (Tm)
ranging from 130ºC to 180ºC are reported in the literature [15].
In general, regarding PLA degradation and recycling, polymers undergo different
types of degradation such as chemical, thermal, photo and mechanical degradation
[16]. Since biopolymers contain hydrolysable bonds, the most important degradation
mechanism is chemical degradation via hydrolysis. It is reported that LMW PLA can be
totally degraded by microorganism in aerobic or anaerobic environments in a time
range from two to five years, and early chain fragmentation can be obtained at higher
humidity and temperature in composting facilities in fifteen days. On the other hand
microbial degradation occurs only with LMW PLA, which represents an advantage of
PLA use in food related applications [15]. Thermal degradation of PLA is reported to
occur only at high temperatures (temperatures larger than 200 ºC). It occurs by
specific scission (after called biting) and random scissions (radical pyrolitic elimination
that occurs at higher temperatures and produces a chain with a vinyl end group) [17].
In the frame of sustainability and sustainable development, PLA shows, once
more, advantages compared to other synthetic polymers. As introduced previously,
PLA is produced from renewable sources, such as starch and other carbohydrates.
Besides that it uses less energy to be produced, in comparison with petroleum based
plastics. In Figure 1.4 it is represented the amount of fossil energy required to produce
one Kg of different petroleum based polymers and of PLA produced by ROP of lactide.
The crossed lines represent the fossil energy used as a chemical feedstock while the
black part represents the fossil energy used for fuels and operations supplies during
the process. “PLA 1” is the polymer produced nowadays and as it is possible to see it
takes less 25 to 55 % of energy to be produced than petroleum based polymers such as
polypropylene (PP) and (PET). “PLA Bio/WP” represents the PLA produced by an
improved process that is being developed by the company Cargill Dow, using biomass
and wind power. This future PLA can reduce the use of fossil energy in more than 90%
[17].

Chapter 1 - Introduction
8
Figure 1.4 – Fossil energy used for preparation of different petroleum based polymers and
PLA produced from ROP of lactide [17].
After use, PLA can be recycled or degraded into soil and humus, basic nutrients
for plants growth [26]. Moreover, in contrast with the volatile organic compounds (VOC)
and CO2 generated during the incineration of petrol-based polymers, the CO2
generated during the biodegradation of PLA is balanced with CO2 from the atmosphere
consumed during the growth of plant feedstocks. In addition, in a long term
consideration, PLA could be used as CO2 sink and contribute the reduction of the
greenhouse gases [12]. This consideration is clearly explained by Figure 1.5 where for
different polymers it is reported the amount of equivalent CO2 produced per Kg of
polymer. Among all polymers PLA1 present the smallest impact and PLA Bio/WP has
even a favourable balance [17].
Figure 1.5 – Contributions to global climate change for petrol based polymers and PLA [17].

Chapter 1 - Introduction
9
1.3 Lactide properties and production
Lactide is the cyclic dimer of lactic acid and, as previously introduced, it is the
monomer in the ROP reaction leading to HMW PLA. Due to the stereo-isomeric nature
of lactic acid, lactide exists in three different forms, L-lactide, D-lactide and meso-
lactide, which are depicted in Figure 1.6. D- and L-Lactide have a melting point of 97ºC
whereas meso-lactide has a melting point of 52ºC [1]. Depending on the composition
of the lactide mixture, PLA with different D unit content is obtained. In particular pure
L-lactide and pure D-lactide will produce high crystalline PLA whereas meso-lactide will
give mainly an amorphous polymer [3]. Lactide purity is function of the reaction
conditions in the lactide production step and of the prepolymer composition obtained
in the polycondensation step. Thus both steps have to be taken into account in
optimizing the reaction conditions.
Figure 1.6 - The three possible forms of lactide [1].
Lactide is produced through the depolymerization of oligomeric PLA in which
back-biting and end-biting reactions are involved [1, 18-19]. In particular back-biting
reaction refers to the formation of cyclic compounds through intra-molecular reactions
between the carboxylic end group of the chain and the ester bond of the chain back-
bone (Figure 1.7) [18]. These reactions are equilibrium reactions which depend upon
temperature and ring size mainly, as described in section 3.2. Instead, end-biting refers
to the ring closure reaction of a linear chain. The main difference between back-biting
and ring-closure is that end-biting reaction produces a cyclic compound and water
whereas back-biting produces a cyclic and a linear compound.

Chapter 1 - Introduction
10
Figure 1.7 - Detail of the back-biting reaction of the –OH group in a general chain of
poly(lactic acid) [19].
Regarding LT production, no many works are reported in the literature.
Moreover, lactide purification is a crucial step which can increase the price of PLA
products, turning PLA into a specialty chemical and thus preventing its introduction in
the market of commodity plastics [3]. Regarding LT purity, PLA racemisation is one of
the major problems in PLA production and it is reported that it occurs mainly in both
the LT production step and PC step. Thus, it is necessary to understand the influence of
the operating parameters on the process in order to optimize the lactide production
and minimize side reactions leading to racemisation.
In this frame the production of lactide with high purity is a key step of the
entire process.
Hiltunen et al. (1996) [10] studied the effect of different catalysts and
polymerization conditions on the preparation of low molecular weight PLA focusing on
final molecular weight achieved, amount of lactide produced and degree of
crystallinity. Reactions were carried out at different temperatures in the range of 180
to 220 ºC. For all the catalysts studied (apart of sulphuric acid), as long as for the non
catalyzed system, it was found that the higher the reaction temperature, the higher
the racemisation. In particular, it was found that sulphuric acid was the best catalyst,
leading to the highest molecular weight (30 kDa) and crystallinity (over 50%), whereas
Sn(II)oct produced amorphous HMW PLA (26 kDa). The authors stated that during PC,
ester interchange reactions are causing racemisation. These reactions occur through

Chapter 1 - Introduction
11
the cleavage of an ester group which can take place in two points, as depicted in Figure
1.8, the carbonyl-oxygen bond and the alkyl-oxygen bond. Only the breakage of an
alkyl-oxygen bond, enhanced at high temperature, leads to racemisation. In particular,
it was found that Lewis acid catalysts catalyze the breakage of the alkyl-oxygen bond
while strong proton acids, like sulphuric acid, catalyze the carbonyl-oxygen bond.
Figure 1.8 – Two points where the ester bond can break: alkyl-oxygen bond (a) and carbonyl-
oxigen bond (b) [10].
Achmad et al. (2009) [20] studied the synthesis of PLA by direct
polycondensation under vacuum with no use of catalysts, solvents and initiators, in an
effort to reduce the PLA production cost. The reaction temperatures were in the range
of 150-250 ºC. The maximum molecular weight achieved in their experiments was of
90 kDa at 200 ºC and 10 mmHg, during 89 h. They detected degradation of PLA above
200 ºC under reduced pressure and, from their results, they claim that it just occurred
by specific scission (biting reaction) and did not yield vinyl compounds.
Noda and Okuyama (1999) [21] studied the effects of different metal catalysts
in the thermal catalytic depolymerization of Poly(L-Lactic Acid) oligomers into L-lactide.
The depolymerization was performed in temperatures between 190 and 245ºC under
4 to 5 mmHg vacuum, for a maximum distillation time of 3h. The molecular weight of
the prepolymer was of about 1170 Da for all the experiments. The catalysts studied
were Al, Ti, Zn, Zr based, in comparison to the conventional used Sn(II)oct. These
catalysts were chosen for their less toxicity compared to the one of Sn based. In their
results, Ti and Al based catalysts gave the lowest yields with maximums between 40 to
50% of lactide produced in 2h, with purities ranging from 80 to 90%. Zn and Zr
compounds provided higher yields of lactide, in the range of 70 to 90% with high L-
Chapter 1 - Introduction
12
lactide purities, between 90 and 97%. They concluded that aluminium compounds are
the least reactive catalysts in intra-molecular transesterification. Ti based catalysts
produced lactide with a low catalyst concentration (0.2 mol %), but an acceleration of
the polymerization reaction occurred. Zinc and zirconium catalysts provided good
yields. With the same catalyst concentration (1 mol %), Zn compounds produced
slightly higher quantities of lactide and smaller racemisation was obtained. However,
neither of these catalyst achieved the yield of lactide obtained by the use of 0.2 mol %
of Sn(II)oct. This catalyst yielded 89% of lactide, 98% pure, in only 1 h. The authors
concluded that the optical and chemical yields of the lactide are dependent on the
coordination activity of the catalysts. In the specific case of intra-molecular
transesterification, the best catalyst was tin octoate, followed by zinc and zirconium
based compounds.
Yoo et al. (2006) [18] studied the effects of temperature, pressure and different
Sn based catalysts (SnO, Sn(II)oct and SnCl2) on the lactide synthesis starting from
oligomeric PLA. Reactions were carried out at temperatures ranging from 200 to 240
oC, and pressure between 10 and 100 Torr. It was observed that at higher reaction
temperature and pressure, LT with lower yield and higher purity was produced. No
large differences were found for the different catalysts tested. Moreover, for SnO
catalyst, it was found that the conversion of PLA into lactide was maximized for a
molecular weight of 1380 Da and it is independent upon catalyst concentration for SnO
concentration above 0.1 % w/w.
Sinclair et al. (1993) [19] patented an innovative method to produce lactide
from LMW lactic acid. They found that a maximum of lactide is obtained during the
polycondensation of lactic acid for a degree of polymerization equal to 2. They claimed
that LT is formed by ring-closure reaction of linear dimer and they suggested
recovering LT directly from the LMW PLA mixture bypassing the step where back-biting
reaction are involved (discussed in the literature work previously reported). They also
state that higher temperatures are needed to distill LT as the molecular weight and
melt viscosity increases. Obviously, if their findings are verified, this process represents
a breakthrough in the lactide production since ring-closure reactions occur at lower
temperature than back-biting reactions and LT racemisation is minimized.
Chapter 1 - Introduction
13
1.4 Aim of the work
Following the literature works introduced previously, it can be conclude that LT
production and LA polycondensation are reactions strictly linked. PC reaction
temperature and pressure, as well as catalyst addition and prepolymer degree of
polymerization, represent key parameters in the LT production process. Those
parameters have to be optimized in order to achieve high LT conversion minimizing
racemization.
In this frame, in the present work, two main goals have been identified:
i) detailed investigation of LA polycondensation
ii) study of LT production reactions
In particular, reactions in semi-batch have been carried out in two steps, a
prepolymerization step, in which a LMW prepolymer is produced under nitrogen flow
and low temperature (130-190OC) in order to limit possible side reactions, and a LT
formation step, in which by increasing temperature (190-210OC) and decreasing
pressure (5-25 mbar), conditions suitable for LT production were accessed. In the last
step, the use of Sn(Oct)2 as catalyst has been investigated.
Special efforts have been devoted to achieve full characterization of both
polymer melt and gas phases. Different analytical techniques have been adopted, and
comparatively used, in order to evaluate polymer average properties as well as chain
length distribution. On the base of these detailed experimental data, which were not
accessible so far in the literature, a more comprehensive description of the system has
been obtained.
At the same time, a comprehensive model accounting for both PC reaction and
LT formation is developed to simulate the polymerization process. In a future work the
model will be applied for parameters evaluation.
Chapter 1 - Introduction
14
References
1. Garlotta, D., A literature review of poly(lactic acid). Journal of Polymers and the Environment, 2001. 9(2): p. 63-84.
2. Codari, F., et al., Characterization of Low-Molecular-Weight PLA using HPLC. Macromolecular Materials and Engineering, 2010. 295(1): p. 58-66.
3. Henton, D.E., et al., Polylactic acid technology. Natural Fibers, Biopolymers, and Biocomposites. 2005, Boca Raton: Crc Press-Taylor & Francis Group. 527-577.
4. Stevens, C., Renewable Bioresources: Scope and Modification for Non-Food Applications. 2004: Wiley. 328.
5. Tsuji, H., et al., Poly(L-lactide) - XI. Lactide formation by thermal depolymerisation of poly(L-lactide) in a closed system. Polymer Degradation and Stability, 2003. 81(3): p. 501-509.
6. Murray Moo - Young, H.W.B., Stephen Drew, Daniel I.C.Wang, Vickroy, Lactic Acid, in Comprehensive Biotechnology: The Practice of Biotechnology, P. Press, Editor. 1985.
7. Yu, Y.C., G. Storti, and M. Morbidelli, Ring-Opening Polymerization of L,L-Lactide: Kinetic and Modeling Study. Macromolecules, 2009. 42(21): p. 8187-8197.
8. Odian, G., Principle of Polymerization. 2004, New York: J. Wiley & Sons.
9. Maharana, T., B. Mohanty, and Y.S. Negi, Melt-solid polycondensation of lactic acid and its biodegradability. Progress in Polymer Science, 2009. 34(1): p. 99-124.
10. Hiltunen, K., J.V. Seppala, and M. Harkonen, Effect of catalyst and polymerization conditions on the preparation of low molecular weight lactic acid polymers. Macromolecules, 1997. 30(3): p. 373-379.
11. Moon, S.I., et al., Melt polycondensation of L-lactic acid with Sn(II) catalysts activated by various proton acids: A direct manufacturing route to high molecular weight poly(L-lactic acid). Journal of Polymer Science Part a-Polymer Chemistry, 2000. 38(9): p. 1673-1679.
12. Kotliar, A.M., INTERCHANGE REACTIONS INVOLVING CONDENSATION POLYMERS. Macromolecular Reviews Part D-Journal of Polymer Science, 1981. 16: p. 367-395.
13. Stanford, M.J. and A.P. Dove, Stereocontrolled ring-opening polymerisation of lactide. Chemical Society Reviews, 2010. 39(2): p. 486-494.
14. Fang, Q. and M.A. Hanna, Rheological properties of amorphous and semicrystalline polylactic acid polymers. Industrial Crops and Products, 1999. 10(1): p. 47-53.
15. Lunt, J., Large-scale production, properties and commercial applications of polylactic acid polymers. Polymer Degradation and Stability, 1998. 59(1-3): p. 145-152.
16. Goepferich, A., Mechanisms of polymer degradation and erosion. Biomaterials, 1996. 17(2): p. 103-114.

Chapter 1 - Introduction
15
17. Vink, E.T.H., Applications of life cycle assessment to NatureWorksTM polylactide (PLA) production. Polymer Degradation and Stability, 2003(80): p. 403-419.
18. Yoo, D.K., D. Kim, and D.S. Lee, Synthesis of lactide from oligomeric PLA: Effects of temperature, pressure, and catalyst. Macromolecular Research, 2006. 14(5): p. 510-516.
19. Sinclair, R., Lactide production from dehydration of aqueous lactic acid feed. 1993, BioPak Technology, Ltd., Golden, Colo: U.S.
20. Achmad, F., et al., Synthesis of polylactic acid by direct polycondensation under vacuum without catalysts, solvents and initiators. Chemical Engineering Journal, 2009. 151(1-3): p. 342-350.
21. Noda, M. and H. Okuyama, Thermal catalytic depolymerization of poly(L-Lactic acid) oligomer into LL-lactide: Effects of Al, Ti, Zn and Zr compounds as catalysts. Chemical & Pharmaceutical Bulletin, 1999. 47(4): p. 467-471.
Chapter 2 – Experimental Part
16
2 Experimental Work
In this chapter, reaction setup and procedures, as well as analytical techniques used,
are described.
2.1 Experimental plan
As Introduced previously in chapter 1, the production of lactide involves mainly two
reactions, the LA polycondensation reaction, leading to a prepolymer and the prepolymer
depolymerization, which leads to the production of LT. In this frame, the experimental work
was differentiated into two main classes of experiments focused on lactic acid
polycondensation and lactide production. Both experiments were performed by means of
the same reaction setup, under different reaction conditions.
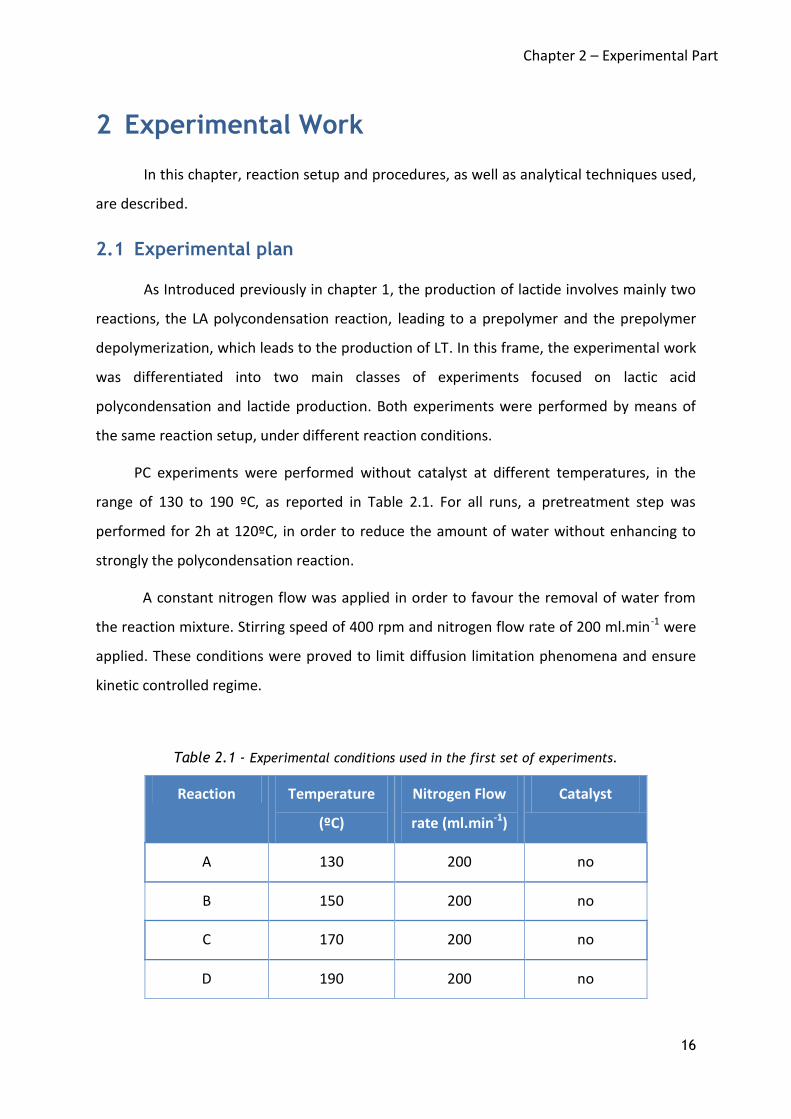
PC experiments were performed without catalyst at different temperatures, in the
range of 130 to 190 ºC, as reported in Table 2.1. For all runs, a pretreatment step was
performed for 2h at 120ºC, in order to reduce the amount of water without enhancing to
strongly the polycondensation reaction.
A constant nitrogen flow was applied in order to favour the removal of water from
the reaction mixture. Stirring speed of 400 rpm and nitrogen flow rate of 200 ml.min-1 were
applied. These conditions were proved to limit diffusion limitation phenomena and ensure
kinetic controlled regime.
Table 2.1 - Experimental conditions used in the first set of experiments.
Reaction Temperature
(ºC)
Nitrogen Flow
rate (ml.min-1)
Catalyst
A 130 200 no
B 150 200 no
C 170 200 no
D 190 200 no
Chapter 2 – Experimental Part
17
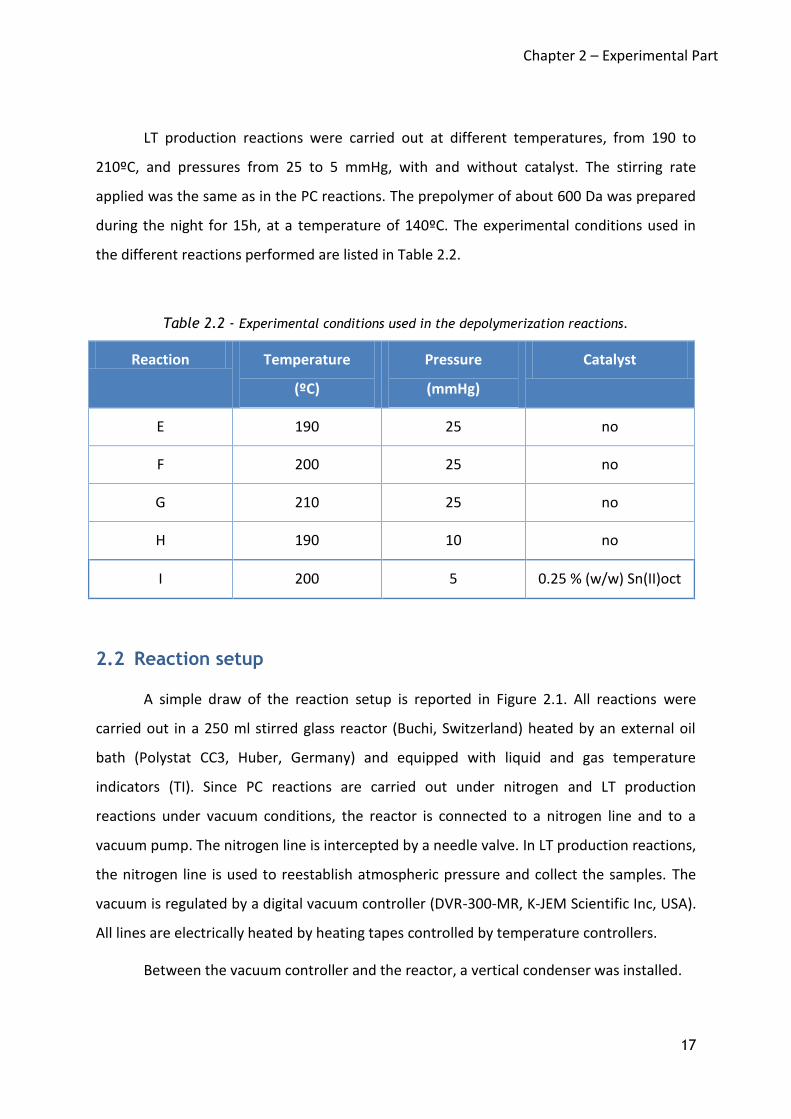
LT production reactions were carried out at different temperatures, from 190 to
210ºC, and pressures from 25 to 5 mmHg, with and without catalyst. The stirring rate
applied was the same as in the PC reactions. The prepolymer of about 600 Da was prepared
during the night for 15h, at a temperature of 140ºC. The experimental conditions used in
the different reactions performed are listed in Table 2.2.
Table 2.2 - Experimental conditions used in the depolymerization reactions.
Reaction Temperature
(ºC)
Pressure
(mmHg)
Catalyst
E 190 25 no
F 200 25 no
G 210 25 no
H 190 10 no
I 200 5 0.25 % (w/w) Sn(II)oct
2.2 Reaction setup
A simple draw of the reaction setup is reported in Figure 2.1. All reactions were
carried out in a 250 ml stirred glass reactor (Buchi, Switzerland) heated by an external oil
bath (Polystat CC3, Huber, Germany) and equipped with liquid and gas temperature
indicators (TI). Since PC reactions are carried out under nitrogen and LT production
reactions under vacuum conditions, the reactor is connected to a nitrogen line and to a
vacuum pump. The nitrogen line is intercepted by a needle valve. In LT production reactions,
the nitrogen line is used to reestablish atmospheric pressure and collect the samples. The
vacuum is regulated by a digital vacuum controller (DVR-300-MR, K-JEM Scientific Inc, USA).
All lines are electrically heated by heating tapes controlled by temperature controllers.
Between the vacuum controller and the reactor, a vertical condenser was installed.

Chapter 2 – Experimental Part
18
Depending on the reaction performed, different condenser temperature conditions
were set. For PC reactions the condenser temperature was regulated by means of an
aqueous solution of ethylenglycol (0.3 % w/w) circulating in a cryostat system (RK20 Lauda).
Since some volatile compounds accumulate in the condenser, the system is equipped with
an opening cap placed at the top of the condenser. During the sampling, acetonitrile is
flushed through the condenser in order to wash out all the condensed products.
For LT production reactions, due to the large amount of LT produced, in order to
avoid clogging of the condenser, the cryostatic bath was substituted with an heating bath
and the temperature in the condenser was set at 90ºC. In these conditions, LT in gas phase
is liquefy and collected. In both cases, in order to ensure that all volatiles are collected in the
condenser, a cold trap was placed at the condenser outlet. For all run, no condensate was
found in the trap.
Figure 2.1 - Reaction set up. (TI-temperature indicator; TCI-temperature controller and
indicator).
Chapter 2 – Experimental Part
19
2.3 Characterization Techniques
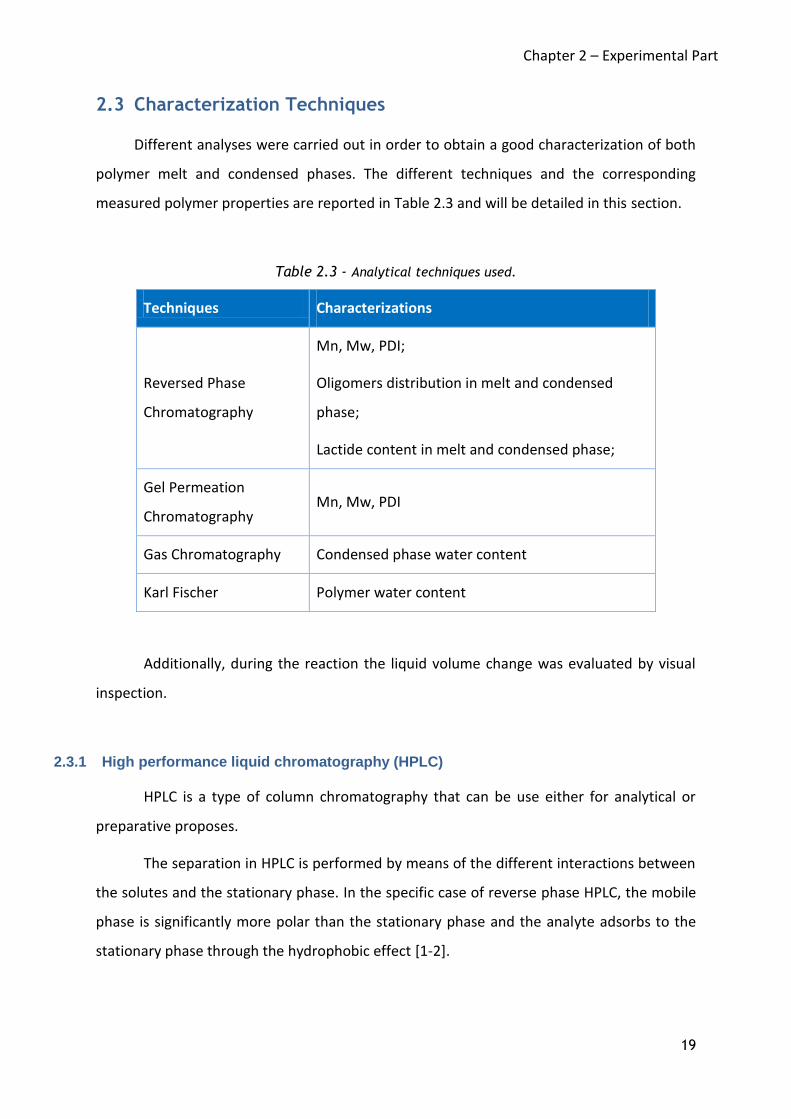
Different analyses were carried out in order to obtain a good characterization of both
polymer melt and condensed phases. The different techniques and the corresponding
measured polymer properties are reported in Table 2.3 and will be detailed in this section.
Table 2.3 - Analytical techniques used.
Techniques Characterizations
Reversed Phase
Chromatography
Mn, Mw, PDI;
Oligomers distribution in melt and condensed
phase;
Lactide content in melt and condensed phase;
Gel Permeation
Chromatography Mn, Mw, PDI
Gas Chromatography Condensed phase water content
Karl Fischer Polymer water content
Additionally, during the reaction the liquid volume change was evaluated by visual
inspection.
2.3.1 High performance liquid chromatography (HPLC)
HPLC is a type of column chromatography that can be use either for analytical or
preparative proposes.
The separation in HPLC is performed by means of the different interactions between
the solutes and the stationary phase. In the specific case of reverse phase HPLC, the mobile
phase is significantly more polar than the stationary phase and the analyte adsorbs to the
stationary phase through the hydrophobic effect [1-2].

Chapter 2 – Experimental Part
20
Being the area of the peak proportional to the number of moles of a single
component, through a constant named calibration factor, a calibration has to be performed
in order to obtain quantitative information of the system composition [3].
During the analysis, the composition of the mobile phase can be either constant or
changed in a specific gradient. The gradient elution is a way of improving the separations
and obtaining best resolutions in complex solute mixtures, without affecting the calibration
factors [3].
In the frame of this work, reverse HPLC was used to determine both oligomers
composition and polymer molecular weight. Two Agilent Eclips XDB C18 columns were used,
with an Agilent 1200 series apparatus (Agilent, USA). The mobile phase was a
water/acetronitrile (Acros Organics) mixture in gradient concentration, both acidified with
phosphoric acid 0.1 vol.-% (Merck). This acid pH was chosen in order to preserve the
efficiency of the column. The following gradient profile was selected: starting with a mobile
phase of 98 vol.-% water, after 2 minutes the acetronitrile concentration was ramped
linearly to 100 vol.-% in 120 min, maintained constant at 100 vol.-% for 30 min and finally
returned back to 98 vol.-% water. The main parameters used are listed in Table 2.4.
Table 2.4 - HPLC parameters.
Parameter Value
Particle Size 5 µm
Column Area 4.6 x 150 mm2
Temperature 40 ºC
Flow rate 1 ml.min-1
UV wavelength 240 nm
Injection Volume 10 µl
Chapter 2 – Experimental Part
21
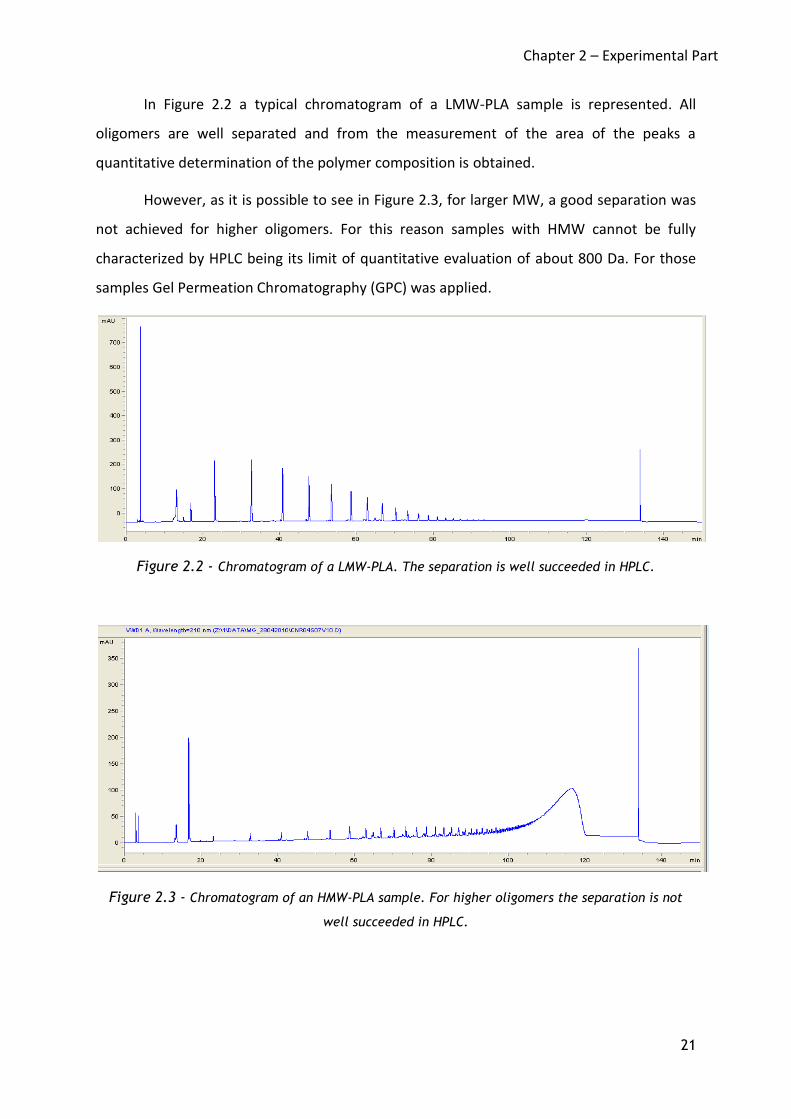
In Figure 2.2 a typical chromatogram of a LMW-PLA sample is represented. All
oligomers are well separated and from the measurement of the area of the peaks a
quantitative determination of the polymer composition is obtained.
However, as it is possible to see in Figure 2.3, for larger MW, a good separation was
not achieved for higher oligomers. For this reason samples with HMW cannot be fully
characterized by HPLC being its limit of quantitative evaluation of about 800 Da. For those
samples Gel Permeation Chromatography (GPC) was applied.
Figure 2.2 - Chromatogram of a LMW-PLA. The separation is well succeeded in HPLC.
Figure 2.3 - Chromatogram of an HMW-PLA sample. For higher oligomers the separation is not
well succeeded in HPLC.

Chapter 2 – Experimental Part
22
2.3.2 Size Exclusion Chromatography
Size Exclusion chromatography (SEC), also known as Gel Permeation Chromatography
(GPC), is the most used method for determining the average molecular weight and the
molecular weight distribution of polymers. The main difference compared to HPLC is that
the separation is based on the hydrodynamic volume of the sample rather than by its
interactions with the stationary phase. Big molecules will not diffuse into the pores and will
be eluted first, whereas small molecules will penetrate into the pores, eluting at longer
elution time. Since SEC is a relative method, a chromatogram calibration is needed. The
calibration is performed by analysing a series of samples with a known molecular weight
and then relating the sample MW with the retention time determined.
The polymer is dissolved in a solvent (for example chloroform in the case of PLA), and
injected into a column with fairly defined pore size. The mobile phase is usually the same as
the solvent used to dissolve the sample [4-5].
The detection in GPC can be done by several kinds of detectors such as refractive index
(RI), viscometer and ultraviolet (UV) detectors [5]. In this special case it was performed by
means of an RI detector.
The GPC conditions used in this work are listed in Table 2.5.
Table 2.5 - GPC parameters.
Parameter Value
Temperature 30 ºC
Flow rate 1 ml.min-1
UV wavelength 240 nm
Injection Volume 25 µl
Max elution time 45 min
Sample concentration 5 mg.l-1

Chapter 2 – Experimental Part
23
In Figure 2.3, the time evolution of the molecular weight for a LT production reaction
performed at 200 ºC and under a 25 mmHg is shown and the blue and the green markers
represent the MW as determined by HPLC and GPC respectively. A significant difference
between the two measurements is observed. Moreover, the profiles are different. Through
HPLC analysis the molecular weight seems to reach a plateau or even decrease while by GPC
the molecular weight is always increasing.
These significant differences have strong influence in the data analysis, and wrong
values can lead to wrong interpretations of components behaviour during the reaction. In
the specific case of the depolymerisation of low molecular weight PLA to lactide, the results
obtained through HPLC may lead one to think that the rate of depolymerisation was higher
than the one of polymerization, while by the results of GPC, the reverse conclusion is
obtained.
Figure 2.4 - Molecular weight as a function of reaction time determined by: □ HPLC and ◊ GPC.
2.3.3 Gas Chromatography
Gas Chromatography is, together with HPLC, the most used technique in analytical
chemistry. It is very accurate and precise. It differs from liquid chromatography for the
nature of the mobile phase which is a carrier gas [6].
After injection the sample is vaporized and transported through the column. The
separation is performed by means of the different affinities between the compounds of a
sample and the stationary phase. Depending upon these interactions and column
Chapter 2 – Experimental Part
24
temperature, the solute will split between the mobile and the stationary phase. The longer
the components spend in the stationary phase the more likely it is to be separated from
components of similar volatility. In gas chromatography, the retention factor can be altered
by changing the stationary phase or the temperature of the column. When the solutes enter
the gas phase, they are swept to the detector by the carrier gas [7].
Therefore, the flow of the carrier gas has strong influence in the retention times of
the samples components, with the retention time decreasing in the same rate as the flow of
the gas increases [7].
One concern is that the gases used in GC must be of very high purity and all traces of
moisture, oxygen and hydrocarbons must be removed before the gas enters the instrument
[7]
In this work Gas Chromatography was used to determine the water content of the
condensed samples, as well as the one of acetonitrile used to wash the condenser before
each sampling. The equipment used was a GC system HP 6890 using helium as a carrier gas.
In Table 2.3 are listed the main parameters of the method used.
Table 2.3 – Parameters of GC.
Parameter Value
Oven Temperature 60 ºC
Inlet Temperature 250 ºC
Inlet Pressure 11 Bar
Detector Temperature 250 ºC
Injection Volume 0.5 l
2.3.4 Karl Fischer
Karl Fischer is a quick and simple method designed to determine small contents of
water in substances, up to an extent which depends upon the equipment specifications. It is
based in the quantitative reaction of water with iodine and sulphur dioxide as depicted in

Chapter 2 – Experimental Part
25
eq(1). Pyridine is added to the system in order to shift the reaction to the formation of the
strong acid and an alcohol is used to dissolve all the before referred compounds [8].
(1)
That are two types of titration: coulometric or volumetric. The main difference
between the two is that with the volumetric method, the titrant is added directly to the
sample while in the coulometric method, the titrant is generated electrochemically in the
titration cell. The coulometric method measures water levels much lower than the
volumetric method [9-10]. In the frame of this master work, coulometric titration was
performed to analyse the water content of the polymer samples, using an 831 KF
Coulometer (Metrohm, Switzerland). The PLA samples were dissolved in acetonitrile (water
content < 10 ppm; Acros Organics), and analysed in the liquid phase. Since acetonitrile is
hygroscopic, its initial water content was accounted when treating the data.
Chapter 2 – Experimental Part
26
References
1. Handbook of HPLC. Chromatographic Science ed. R.E. Elena Eksteen (Katz), Peter Schoenmakers, Neil Miller 1998, New York: Library of Congress Cataloging-in-Publication Data.
2. Swadesh, J., HPLC: practical and industrial applications. 2nd ed. 2001, New York: CRC Press. 461.
3. Codari, F., et al., Characterization of Low-Molecular-Weight PLA using HPLC. Macromolecular Materials and Engineering, 2010. 295(1): p. 58-66.
4. Sadao Mori, H.G.B., Size Exclusion Chromatography. 1999, New York: Springer Laboratory.
5. Handbook of Size Exclusion Chromatography and Related Techniques: Revised And Expanded 2nd ed. Chromatographic science series, ed. C.-s. Wu. Vol. 91. 2003, New Jersey: CRC Press. 716.
6. Singh, R., Gas Chromatography. 1st ed. 2002, New Delhi: Mittal Publications.
7. Brian Stuart, E.P., Gas chromatography. Practical Laboratory Skills Training Guides, ed. E. Prichard. 2003, Cambridge: Royal Society of Chemistry.
8. Pungor, E., A Practical Guide to Instrumental Analysis 1994: CRC Press. 400.
9. Francis Rouessac, A.R., Chemical Analysis: Modern Instrumentation Methods and Techniques. 2nd ed. 2007: Wiley & Sons. 600.
10. Gershon Shugar, J.B., Chemical Technicians' Ready Reference Handbook 4th ed. 1996, New York: McGraw-Hill, Inc. 935.

Chapter 3 – Lactic Acid Polycondensation
27
3 Lactic Acid Polycondensation
As anticipated in Chapter 2, semi-batch reactions at 130 – 190 ºC under nitrogen flow
and without catalyst were performed to fully characterize the polycondensation of LA. For
each reaction, bulk and condenser samples were collected at different reaction times and
analysed using the techniques previously described.
In the next sections, experimental results are reported in a qualitative point of view.
3.1 Experimental results
3.1.1 Bulk Phase
The evolution in time of the liquid volume for the four reactions performed is
presented in Figure 3.1. In all cases a decrease in volume around 15% was observed. This
suggests that the variation of reaction volume has to be accounted for when modeling the
system.
Figure 3.1 - Bulk volume as a function of reaction time: 130 ºC; 150 ºC; 170 ºC; o 190 ºC.

Chapter 3 – Lactic Acid Polycondensation
28
The concentration of water in the bulk phase for all the reactions is reported in
Figure 3.2; all profiles show similar time evolutions. The water content decreases in the
beginning of the reaction and approaches a plateau at longer reaction times. For the
reactions at lower temperature (130 and 150 ºC), the plateau value was not established
during the reaction time since the decreasing of the water concentration is slower
compared to the reactions carried out at higher temperature. It is possible to observe that
the decreasing of the water concentration is faster the higher the reaction temperature.
Moreover, for the reactions carried out at 170 and 190 ºC, the same final plateau value of
water concentration is reached.
Figure 3.2 - Water concentration in bulk phase as a function of time: 130 ºC; 150 ºC; 170 ºC;
o 190 ºC.
For all reactions, the number average molecular weight as a function of reaction time
is reported in Figure 3.3. The linearity of these profiles confirms that chemical regime
conditions are achieved. As expected [1], the higher the reaction temperature, the faster
the molecular weight growth is.

Chapter 3 – Lactic Acid Polycondensation
29
Figure 3.3 - Polymer molecular weight as a function of time for different reaction conditions:
130 ºC; 150 ºC; 170 ºC; o 190 ºC.
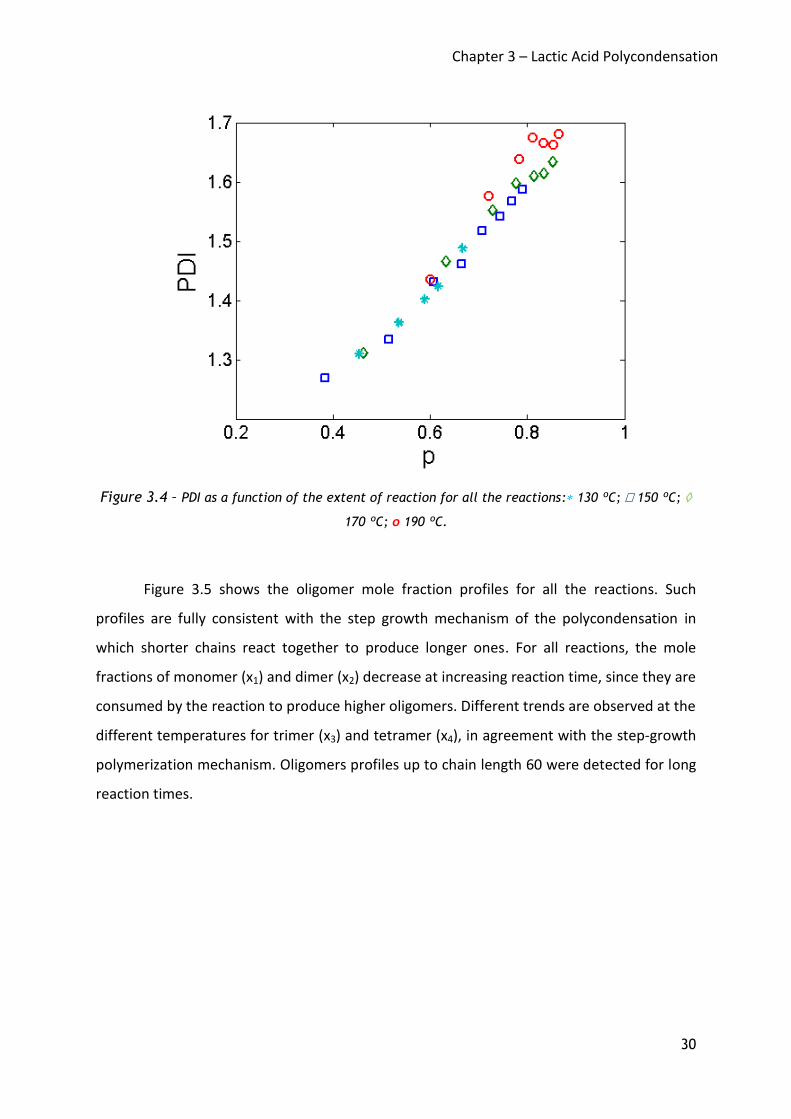
Polydispersity index (PDI) is a parameter representing the broadness of the
molecular mass distribution of a polymer. According to Flory, the maximum value of PDI is 2
for step-growth polymerization, achieved at 100% conversion (p equal to 1 in Equation 8 –
Chapter 5). In our reactions the maximum value of PDI was around 1.7, as depicted in Figure
3.4; PDI increases during the reaction reaching a plateau at long reaction times. Moreover, it
was observed that for a given reaction time, the higher the temperature, the larger the
polymer PDI. However, the higher the temperature the larger the degree of polymerization
obtained; therefore, for a fair data analysis, the PDI values have to be plotted at same
extent of reaction, as shown in Figure 3.4. For all reactions, a unique PDI vs. p curve was
found: therefore, it can be concluded that temperature is not affecting the polymer PDI.
Chapter 3 – Lactic Acid Polycondensation
30
Figure 3.4 – PDI as a function of the extent of reaction for all the reactions: 130 ºC; 150 ºC;
170 ºC; o 190 ºC.
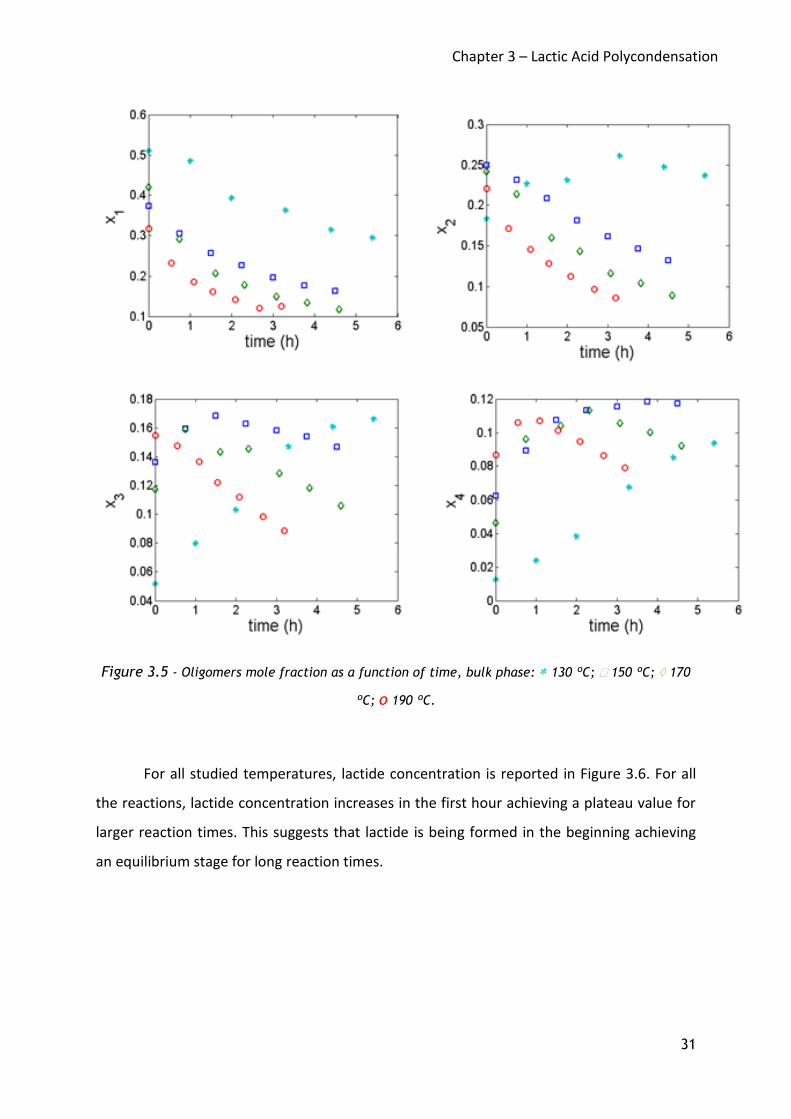
Figure 3.5 shows the oligomer mole fraction profiles for all the reactions. Such
profiles are fully consistent with the step growth mechanism of the polycondensation in
which shorter chains react together to produce longer ones. For all reactions, the mole
fractions of monomer (x1) and dimer (x2) decrease at increasing reaction time, since they are
consumed by the reaction to produce higher oligomers. Different trends are observed at the
different temperatures for trimer (x3) and tetramer (x4), in agreement with the step-growth
polymerization mechanism. Oligomers profiles up to chain length 60 were detected for long
reaction times.
Chapter 3 – Lactic Acid Polycondensation
31
Figure 3.5 - Oligomers mole fraction as a function of time, bulk phase: 130 ºC; 150 ºC; 170
ºC; o 190 ºC.
For all studied temperatures, lactide concentration is reported in Figure 3.6. For all
the reactions, lactide concentration increases in the first hour achieving a plateau value for
larger reaction times. This suggests that lactide is being formed in the beginning achieving
an equilibrium stage for long reaction times.

Chapter 3 – Lactic Acid Polycondensation
32
Figure 3.6 - Lactide concentration in bulk as a function of reaction time: 130 ºC; 150 ºC; 170
ºC; o 190 ºC.
3.1.2 Gas Phase
The cumulative masses of the species in the condensed gas phase are plotted in
Figure 3.7. For the reaction performed at the lowest temperature this data is not available.
Only water, monomer, dimer and lactide were detected and, as expected, the main
component was water, being monomer, dimer and lactide present only in small traces.
These findings prove that, under these operating conditions, apart from water, the
volatilization of other species can be neglected in the development of a model for
polycondensation.

Chapter 3 – Lactic Acid Polycondensation
33
Figure 3.7 – Cumulative mass of the condenser species as a function of reaction time:
150 ºC; 170 ºC; o 190 ºC.

Chapter 4 – Lactide Production
34
4 Lactide Production
In this chapter, the results concerning lactide production reactions are reported. As
previously discussed (Chapter 2), these reactions involve two steps, a lactic acid
polycondensation step performed at 130 ºC over the night (15 h) under nitrogen flow, and a
second step aimed to lactide production carried out at higher temperatures (190 – 210 ºC)
and low pressures (25 – 5 mmHg), with and without catalyst. Due to the difficulties in
obtaining complete oligomer separation by HPLC, GPC was used to determine the molecular
weight of the polymer samples and, moreover, components mass fractions are used instead
of mole fraction. In the next sections, the effect of temperature, pressure and catalyst
addition on the lactide production step is discussed from a qualitative point of view.
4.1 Experimental results
4.1.1 Temperature effect
Three reactions at different temperatures (190, 200 and 210 ºC, at 25 mmHg without
catalyst), were performed in order to evaluate the effect of temperature on lactide
production.
The time evolutions of the liquid volume are shown in Figure 4.1; as expected, higher
temperatures lead to larger volume change.
Chapter 4 – Lactide Production
35
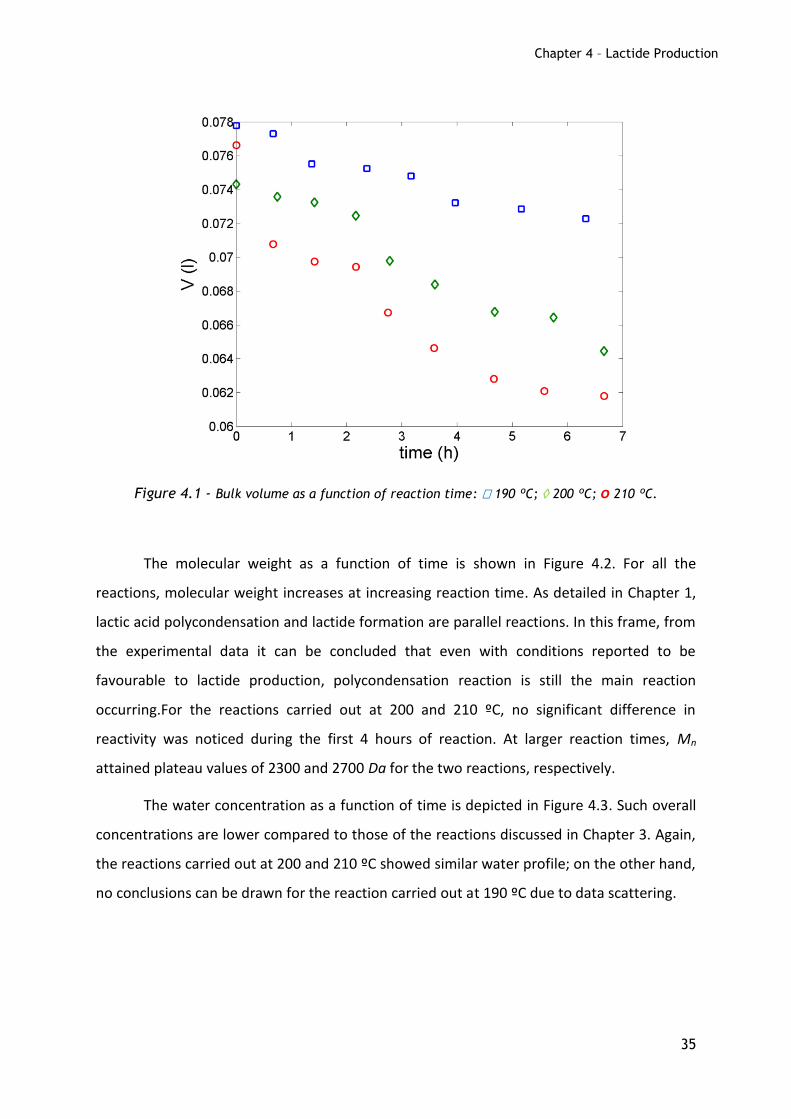
Figure 4.1 - Bulk volume as a function of reaction time: 190 ºC; 200 ºC; o 210 ºC.
The molecular weight as a function of time is shown in Figure 4.2. For all the
reactions, molecular weight increases at increasing reaction time. As detailed in Chapter 1,
lactic acid polycondensation and lactide formation are parallel reactions. In this frame, from
the experimental data it can be concluded that even with conditions reported to be
favourable to lactide production, polycondensation reaction is still the main reaction
occurring.For the reactions carried out at 200 and 210 ºC, no significant difference in
reactivity was noticed during the first 4 hours of reaction. At larger reaction times, Mn
attained plateau values of 2300 and 2700 Da for the two reactions, respectively.
The water concentration as a function of time is depicted in Figure 4.3. Such overall
concentrations are lower compared to those of the reactions discussed in Chapter 3. Again,
the reactions carried out at 200 and 210 ºC showed similar water profile; on the other hand,
no conclusions can be drawn for the reaction carried out at 190 ºC due to data scattering.

Chapter 4 – Lactide Production
36
Figure 4.2 - Polymer molecular weight as a function of time for different reaction
temperatures: 190 ºC; 200 ºC; o 210 ºC.
Figure 4.3 - Water concentration in bulk phase as a function of time: 150 ºC; 170 ºC; o 190
ºC.

Chapter 4 – Lactide Production
37
The concentration profiles for monomer, dimer, trimer and tetramer are shown in
Figure 4.4 for all the temperatures and all the components. In all cases, very similar
behaviours are exhibited, with weight fraction decreasing during all the reaction and
achieving plateau values at long reaction times. Compared to the reactions in Chapter 3, the
major difference is that all the short oligomers are “consumed” to produce longer chains,
thus producing higher molecular weight polymer.
4.4 - Oligomers weight fraction as a function of time, bulk phase: 190 ºC; 200 ºC; o 210 ºC.
The lactide mass fraction for the different reaction temperatures is shown in Figure
4.5. Surprisingly, the weight fraction of lactide is constant at all studied temperatures, with
values ranging from 0.04 to 0.055 % (w/w). However, compared to the reactions in Chapter

Chapter 4 – Lactide Production
38
3, lactide was found in the condenser in much large amount. The cumulative weight of
water, monomer, dimer and lactide collected in the condenser is plotted in Figure 4.6: the
most abundant component in the collected mixture is lactide. The plateaus of liquid phase
composition and accumulation in the condenser for lactide suggest that the reactions
leading to lactide production exhibit fast kinetics and equilibrium conditions are quickly
established. Thus, lactide removal is the limiting step of the process.
Figure 4.5 – Lactide mass fraction as a function of time: 190 ºC; 200 ºC; o 210 ºC.

Chapter 4 – Lactide Production
39
Figure 4.6 – Cumulative mass of water, monomer, dimer and lactide in condensed gas phase:
190 ºC; 200 ºC; o 210 ºC.
4.1.2 Pressure effect
In order to evaluate the effect of pressure, two reactions were performed at
190º C without catalyst, at 25 mmHg and 10 mmHg.
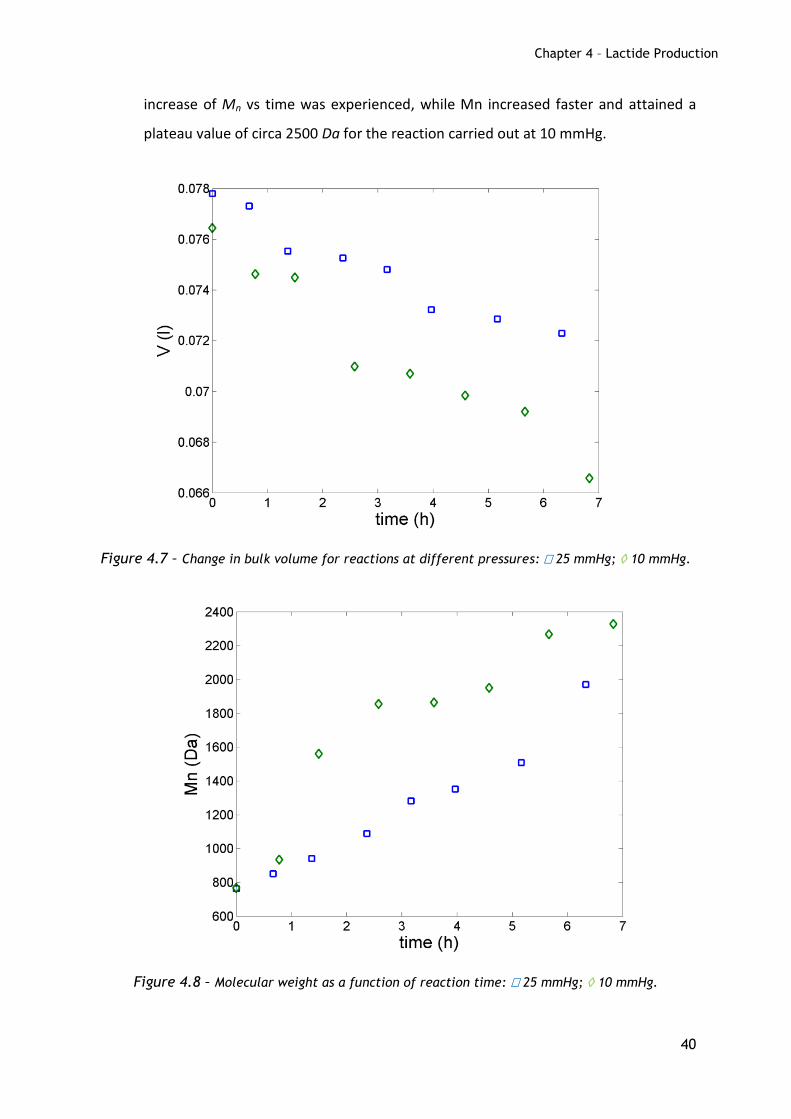
The time evolution of the bulk volume is shown in Figure 4.7, while Mn is
reported in Figure 4.8. As expected, the change in volume was higher for the
reaction at lower pressure. For the reaction carried out at 25 mmHg, a linear
Chapter 4 – Lactide Production
40
increase of Mn vs time was experienced, while Mn increased faster and attained a
plateau value of circa 2500 Da for the reaction carried out at 10 mmHg.
Figure 4.7 – Change in bulk volume for reactions at different pressures: 25 mmHg; 10 mmHg.
Figure 4.8 – Molecular weight as a function of reaction time: 25 mmHg; 10 mmHg.
Chapter 4 – Lactide Production
41
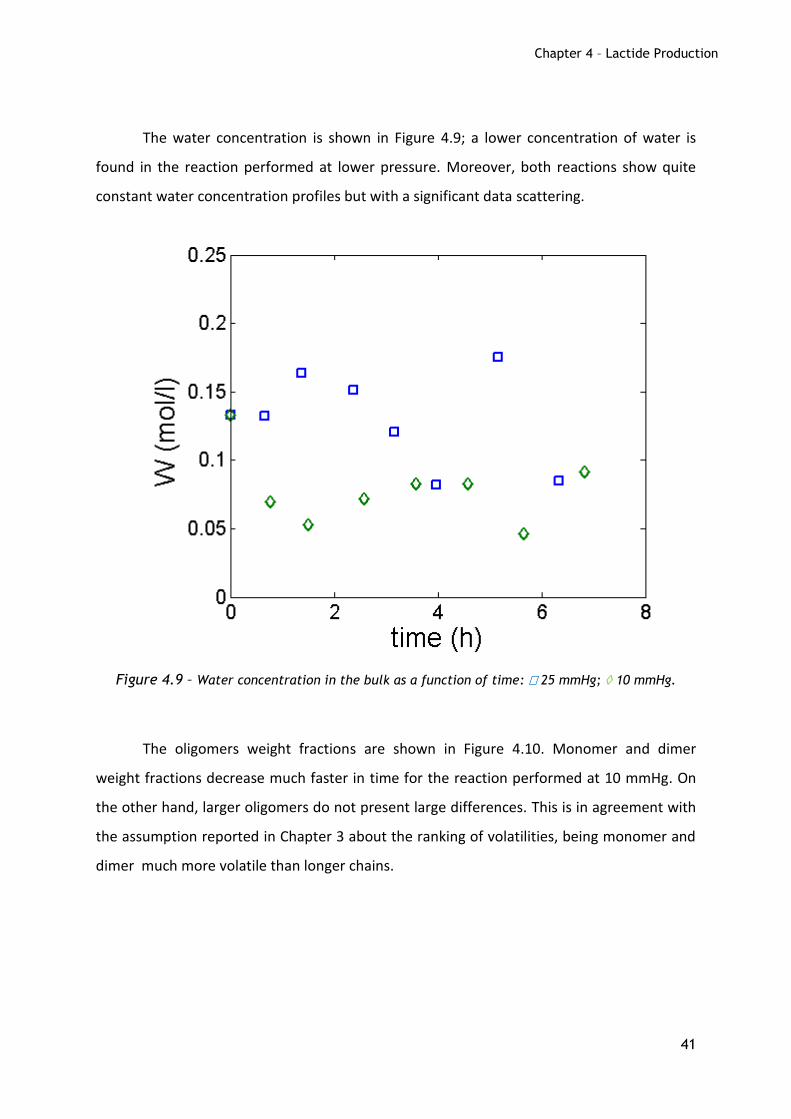
The water concentration is shown in Figure 4.9; a lower concentration of water is
found in the reaction performed at lower pressure. Moreover, both reactions show quite
constant water concentration profiles but with a significant data scattering.
Figure 4.9 – Water concentration in the bulk as a function of time: 25 mmHg; 10 mmHg.
The oligomers weight fractions are shown in Figure 4.10. Monomer and dimer
weight fractions decrease much faster in time for the reaction performed at 10 mmHg. On
the other hand, larger oligomers do not present large differences. This is in agreement with
the assumption reported in Chapter 3 about the ranking of volatilities, being monomer and
dimer much more volatile than longer chains.

Chapter 4 – Lactide Production
42
Figure 4.10 – Oligomers weight fraction versus reaction time: 25 mmHg; 10 mmHg.
About the lactide weight fraction, again a plateau value is found. This value is shown
in Figure 4.11. In particular it can be noticed that lactide weight fractions of 0.035 and 0.045
% (w/w) were obtained for the reaction carried out at 25 mmHg and 10 mmHg, respectively.
This is apparently not in agreement with what proposed previously regarding the fast kinetic
of lactide reactions and attendance of equilibrium conditions, since pressure should not
affect the equilibrium constants. On the other hand the lower the pressure the larger the
volatility of lactide.

Chapter 4 – Lactide Production
43
Figure 4.11 – Lactide weight fraction over time for the reaction performed at 25 mmHg () and
10 mmHg ()
Finally, the cumulative mass of lactide and lower oligomers collected in the
condenser is shown in Figure 4.12. The amount of collected species was much higher
compared to the reaction performed at higher pressure, as expected from the analysis of
the change in bulk volume (Figure 4.7).

Chapter 4 – Lactide Production
44
Figure 4.12 – Cumulative mass of water, monomer, dimer and lactide in condensed gas phase:
25 mmHg; 10 mmHg.
4.1.3 Industrial Conditions
In order to enhance the volatility of lactide, a reaction was performed at 200 ºC, 5
mmHg and 0.25 % (w/w) of Sn(II)oct catalyst. These conditions are the ones used in industry
and moreover, tin octoate is also reported in literature to enhance the lactide production
[1]. The results for the bulk samples are reported bellow. In the end of the 3 hours of
reaction, 40 grams of crude lactide were collected. Crude lactide is the lactide collected
which is not pure and contains traces of monomer, water and linear dimer.
The change in the bulk volume (Figure 4.13) was more than the double compared to
the previous reactions, and in half the reaction time.

Chapter 4 – Lactide Production
45
The molecular weight over time for this reaction is reported in Figure 4.14. The
maximum value of all the reactions performed in this thesis was achieved in this reaction, in
only 3 h. This fact proves once again that polycondensation and lactide formation are
parallel reactions and the selectivity of the lactide reaction over the polycondensation is
difficult to achieve.
Figure 4.13 – Volume change for the reaction performed at industrial conditions.
Figure 4.14 – Number average molecular weight over time for the reaction performed at
industrial conditions.
Chapter 4 – Lactide Production
46
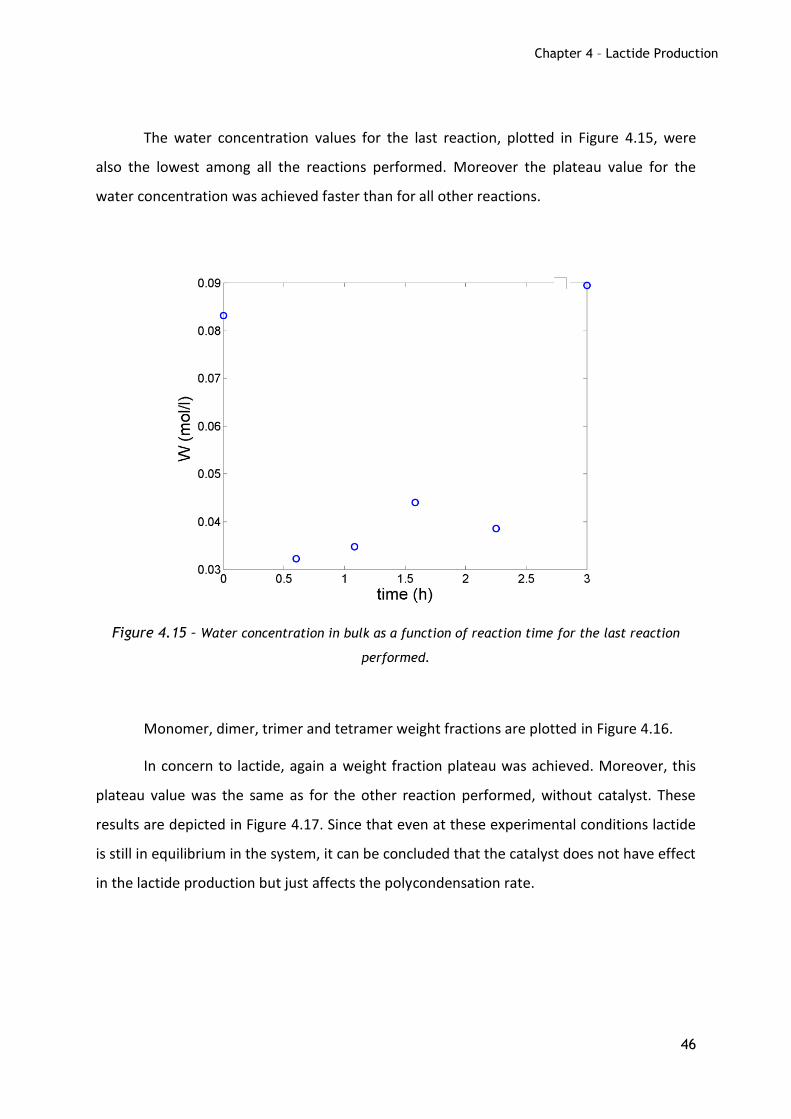
The water concentration values for the last reaction, plotted in Figure 4.15, were
also the lowest among all the reactions performed. Moreover the plateau value for the
water concentration was achieved faster than for all other reactions.
Figure 4.15 – Water concentration in bulk as a function of reaction time for the last reaction
performed.
Monomer, dimer, trimer and tetramer weight fractions are plotted in Figure 4.16.
In concern to lactide, again a weight fraction plateau was achieved. Moreover, this
plateau value was the same as for the other reaction performed, without catalyst. These
results are depicted in Figure 4.17. Since that even at these experimental conditions lactide
is still in equilibrium in the system, it can be concluded that the catalyst does not have effect
in the lactide production but just affects the polycondensation rate.

Chapter 4 – Lactide Production
47
Figure 4.16 – Oligomers weight fraction as a function of reaction time for the reaction performed
at industrial conditions.
Chapter 4 – Lactide Production
48
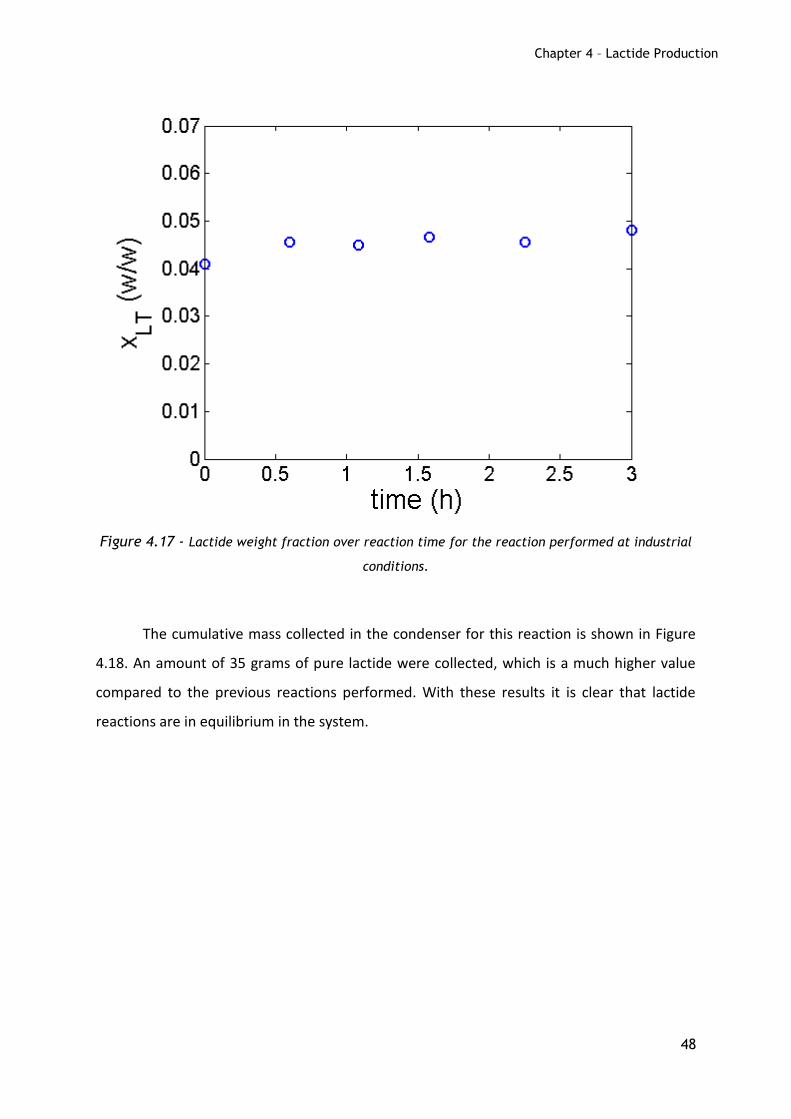
Figure 4.17 - Lactide weight fraction over reaction time for the reaction performed at industrial
conditions.
The cumulative mass collected in the condenser for this reaction is shown in Figure
4.18. An amount of 35 grams of pure lactide were collected, which is a much higher value
compared to the previous reactions performed. With these results it is clear that lactide
reactions are in equilibrium in the system.

Chapter 4 – Lactide Production
49
Figure 4.18 – Cumulative mass in the condenser for the reaction performed at “extreme”
conditions.
References
1. Yoo, D.K., D. Kim, and D.S. Lee, Synthesis of lactide from oligomeric PLA: Effects of temperature, pressure, and catalyst. Macromolecular Research, 2006. 14(5): p. 510-516.

Chapter 5 – Model development
50
5 Model development
In this chapter the developed model accounting for both lactic acid polycondensation
and lactide production is reported. As a future work the model will be used to evaluate the
parameters involved in the process.
5.1 General background
As already mentioned in Chapter 1, polycondensation (PC) is a reversible
polymerization reaction which follows a step growth mechanism. It involves a carboxylic
acid (COOH) and an alcoholic (OH) group of two polymer chains of length n and m,
respectively, which react together to produce a polymer chain of length n+m with the
formation of an ester bond (E) and the release of water (W). The produced water may react
with polymer, thus introducing reversibility in the system. PC is described by the general
scheme:
(1)
It is worth to mention that, due to the lack of experimental data, PC systems are
often modelled focusing on functional groups rather than on all the species at different
chain lengths [1-2]. In this frame, the previous scheme reduces to:
(2)
In the present work, due to the highly detailed experimental data obtained (see
Chapter 2), PC is modelled distinguishing all the different chain lengths.
Two main approaches were used in the literature to model PC reaction, the
probabilistic approach, based on the randomness feature of the stepwise mechanism, and
the deterministic approach, based on kinetic rate equations.
Fundamental studies of PC were carried out mainly by Carothers[3] and Flory[4]. In
particular, using the probabilistic approach, Flory described the molar and weight mole
fraction distributions, Px and Wx respectively, as well as the polymer average properties,
such as number average molecular weight (Mn), weight average molecular weight (Mw) and
polydispersity index (PDI), as a function of the extent of reaction, p, as:

Chapter 5 – Model development
51
(3)
(4)
(5)
(6)
(7)
(8)
where N and N0 represent the total number of non reacted repeating units at the generic
reaction time and the initial number of repeating units, respectively. The previous equations
were obtained under the following assumptions:
a) equal reactivity of functional groups independently upon polymer chain length;
b) equal reactivity of all linkages (degradation kinetic independent upon ester
groups);
c) negligible side reactions, such as cyclization and transesterification.
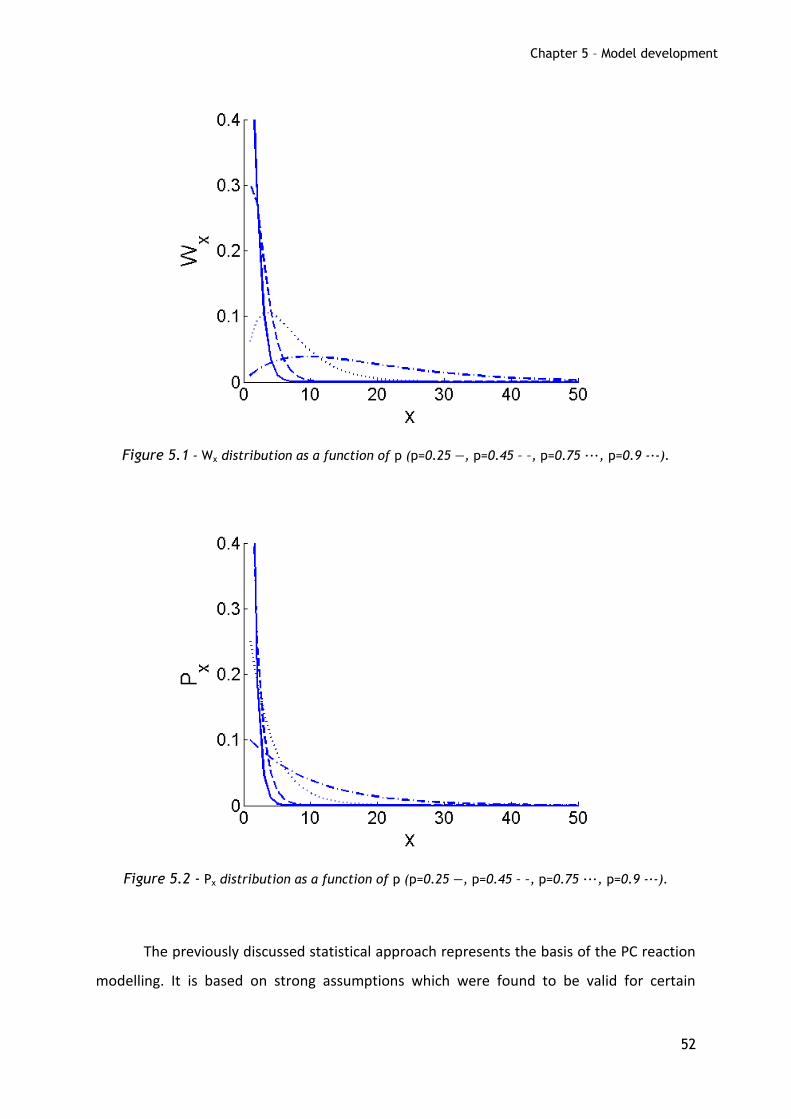
In Figures 5.1 and 5.2, weight and mole fraction distributions, as described in
Formulas 4 and 5, are plotted as a function of the extent of reaction. About Wx, it is worth to
notice that the monomer is the most abundant specie at reaction extents smaller than 0.5,
while at larger p a maximum in the distribution is found and increases at increasing p. On
the other hand, the mole fraction distribution does not present a maximum for any p and
the monomer is always the component present in larger amount. Moreover, from equation
6, the maximum theoretical PDI which can be obtained is 2 for p equal to unity.
Chapter 5 – Model development
52
Figure 5.1 - Wx distribution as a function of p (p=0.25 ―, p=0.45 – –, p=0.75 ∙∙∙, p=0.9 -∙-).
Figure 5.2 - Px distribution as a function of p (p=0.25 ―, p=0.45 – –, p=0.75 ∙∙∙, p=0.9 -∙-).
The previously discussed statistical approach represents the basis of the PC reaction
modelling. It is based on strong assumptions which were found to be valid for certain

Chapter 5 – Model development
53
polymers and conditions, such as large extent of reaction and no influence of diffusion
limitations [5].
More recently, a kinetic approach was adopted and various models, differing mainly
in terms of model assumptions and kinetic scheme, were proposed. A comprehensive
description of the basic equations involved, as long as the different solution methods
applied, has been reported by Dotson et al. [6]. In particular, moment discrete method and
direct sequential solution are commonly used. By means of the first method, the polymer
molecular weight distribution (MWD) is described through the definition of specific
moments and the average polymer properties (Mn, Mw and PDI) can be readily evaluated.
Using the second method, the mass balance equations (MBEs) of all the species and
involving all the reactions, are solved leading to a more complex and computationally
demanding solution but with the major advantage of the direct evaluation of the entire
MWD.
In the present work, kinetic approach and direct sequential solution of population
balance equations (PBE) and MBEs have been adopted. In the next section, kinetic scheme
as well as model assumptions and equations, are reported.
5.2 Model assumptions and equations
In order to define a comprehensive kinetic scheme, accounting for both PC and LT
formation reactions, the model assumptions already discussed are revised and extended
including all observations and information found in the literature.
The following assumptions are introduced:
- monomer has different reactivity than larger oligomers
From chemical equilibrium studies (performed in this research group but not yet
published [7]) it was noticed that LA presents different reactivity compared to larger
oligomers. This finding is in agreement with literature data on both PLA [8] and other
polycondensation systems [5]. On the other hand, it was shown that the assumption of
reactivity independent upon chain length is reasonable and does not introduce large errors
in the modelling of lactic acid polycondensation [7, 9]. In this frame, the model equations

Chapter 5 – Model development
54
are derived accounting for the different reactivity of LA and this assumption will be further
discussed in the next chapters.
- ideal system behavior
It is reported in the literature that PC processes, such as Nylon 6,6 [2, 10-11] and PET [1]
productions, exhibit non ideal behaviour. In particular, it was reported that kinetic and
equilibrium constants, defined in terms of concentrations, show composition dependence
especially at high degree of polymerization. Since non ideal behaviour affects both kinetic
and transport phenomena, the assumption of ideal system can lead to large error in the
model prediction. However, while Nylon and PET are polymers produced by PC until high
molecular weight (HMW), LA polycondensation is applied only up to low conversion and low
degree of polymerization: under such conditions, the extent of non-ideality is limited and
the assumption of ideal system is considered reasonable.
- negligible formation of large cyclic compounds by intramolecular reactions
It is reported in the literature that the formation of cyclic species is a function of the
reaction temperature and the size of the ring formed. Cycles formation and equilibrium
between linear and cyclic chains can be described by the Jacobson-Stockmayer theory [12].
In their original study, the authors have investigated the equilibrium molecular size
distribution of different polycondensation systems. For cycles larger than 15 units, short
range steric effects do not play any role and thus the probability of ring closure can be
expressed as a function of ring size. At such conditions, the formation of cycles with size
larger than 4 was found negligible. In the frame of this work, it is assumed that LT is the only
cyclic compound formed at a significant extent.
For PLA, Kèki et al. [13] have recently investigated the formation of cycles occurring
in PLA polycondensation through MALDI-TOF investigations. The monomer used was D,L
lactic acid and cycles were formed at large extent only for reaction temperature larger than
180°C. Moreover, the ring-chain equilibrium constants have been reported for different
temperature and different chain length (data are shown in Figure 5.3).

Chapter 5 – Model development
55
Figure 5.3 - Concentration based equilibrium constants.
- Interchange reactions are negligible
Kotliar reported the different kind of interchange reactions occurring in polyesters and
their mechanisms [14]. Mainly three reactions are distinguished and are intermolecular
alcoholysis, intermolecular acidolysis and transesterification (see Figure 3.4).
Figure 5.4 - Interchange reactions occurring in PC (from Kotliar[14]).
Out of all the reactions involved, alcoholysis is the most favorable in PC of lactic acid. It
consists in the attack of a hydroxyl group to an ester group of a different polymer chain
which results in a size reduction of the attacked chain and size elongation of the chain
Chapter 5 – Model development
56
inducing the reaction. Many works reported in the literature for polycondensation systems
are focused on the estimation of the interchange reaction kinetic parameters but large
discrepancies in the values are present. For this reason and since no evidence was
previously reported about the occurrence of interchange reactions in the PLA case, such
reactions are not considered in the present work.
- molecular diffusion does not affect the reaction kinetic
In general, the kinetic of polymerization can be influenced by the diffusion of
macromolecular chains in the reaction mixture [15-16]. However, due to the limited extent
of reaction achieved in the present work, it is reasonable to assume that the diffusion of the
oligomers is fast enough to have a negligible effect, or no effect at all, on the reaction
kinetics.
- water, LA and LT only are considered volatile
In a recent publication by Achmad et al. [17], it is reported that under vacuum condition
(10 mmHg) mainly water, LA and LT are detected in gas phase. This is reasonable since
larger oligomers exhibit smaller vapour pressures and thus scarce volatilities. Moreover, this
assumption is in agreement with the data detailed in Chapters 3 and 4 concerning the
condensed species collected.
- completely mixed system
The system is mechanically stirred and does not present concentration and temperature
gradients.
From the first assumption, three main polycondensation reactions have to be
distinguished:
/
a
a a
k
k K
(11)
/
b
b b
k
k K
(12)
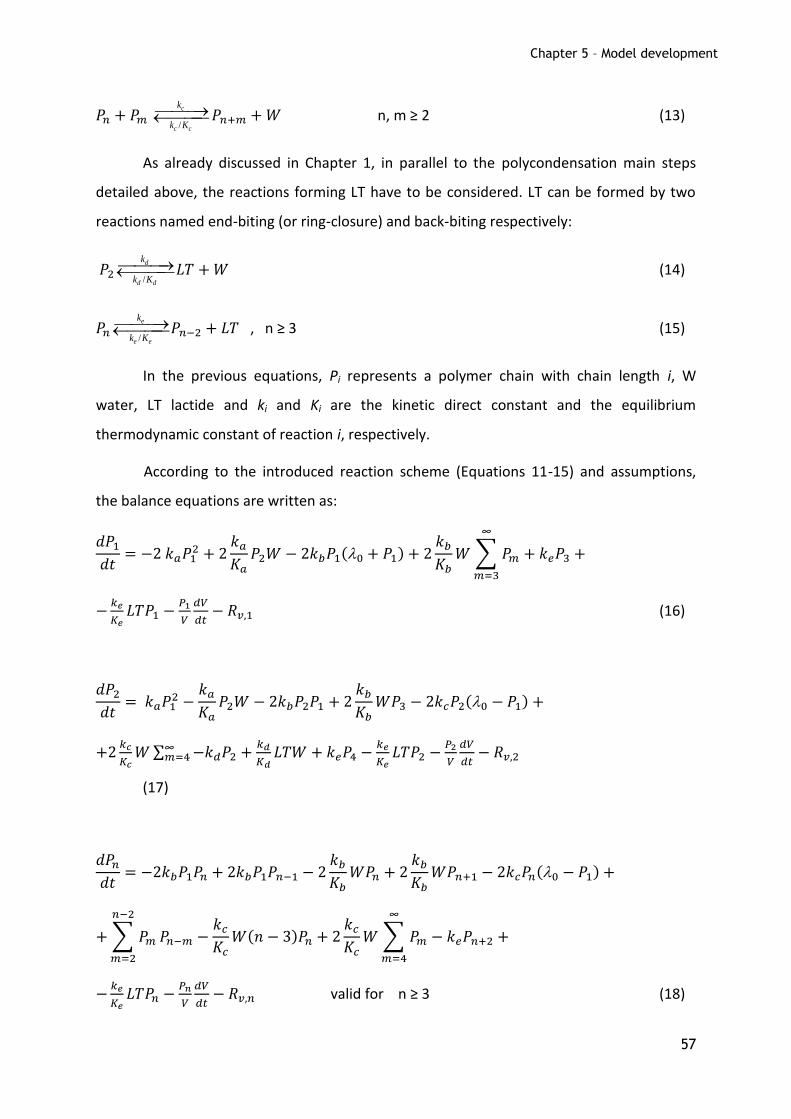
Chapter 5 – Model development
57
/
c
c c
k
k K
n, m ≥ 2 (13)
As already discussed in Chapter 1, in parallel to the polycondensation main steps
detailed above, the reactions forming LT have to be considered. LT can be formed by two
reactions named end-biting (or ring-closure) and back-biting respectively:
/
d
d d
k
k K
(14)
/
e
e e
k
k K
, n ≥ 3 (15)
In the previous equations, Pi represents a polymer chain with chain length i, W
water, LT lactide and ki and Ki are the kinetic direct constant and the equilibrium
thermodynamic constant of reaction i, respectively.
According to the introduced reaction scheme (Equations 11-15) and assumptions,
the balance equations are written as:
(16)
(17)
valid for n ≥ 3 (18)
Chapter 5 – Model development
58
(19)
(20)
(21)
where Pi, W and LT represent the mole concentration of polymer chains of length i, water
and lactide in the melt liquid phase, Gi the concentration of component i in gas phase, Qg
the total flow rate removed by the vacuum pump, V and Vg the volumes of the liquid and
gas phases and Rvi the transport terms due to vaporization. The expression for Rvi and Qg, as
well as the involved assumptions, are reported in the next section.
All previous equations account for volume changes. Defining as Vtot the total reaction
volume, Vg is given by:
(22)
and the gas volume change is expressed as
(23)
The volume change has been calculated taking advantage of the volume additivity
rule:
=
(24)
Taking the differential form of equation 24, the following equation is obtained:
=
(25)
Plugging in equations 16-20, a direct expression for dV/dt could be obtained;
however, in order to simplify the model, the volume change was not predicted but directly
given as a known functional by fitting the volume change experimental data by a suitable
polynomial function. In other terms, V and dV/dt are considered as input variables.
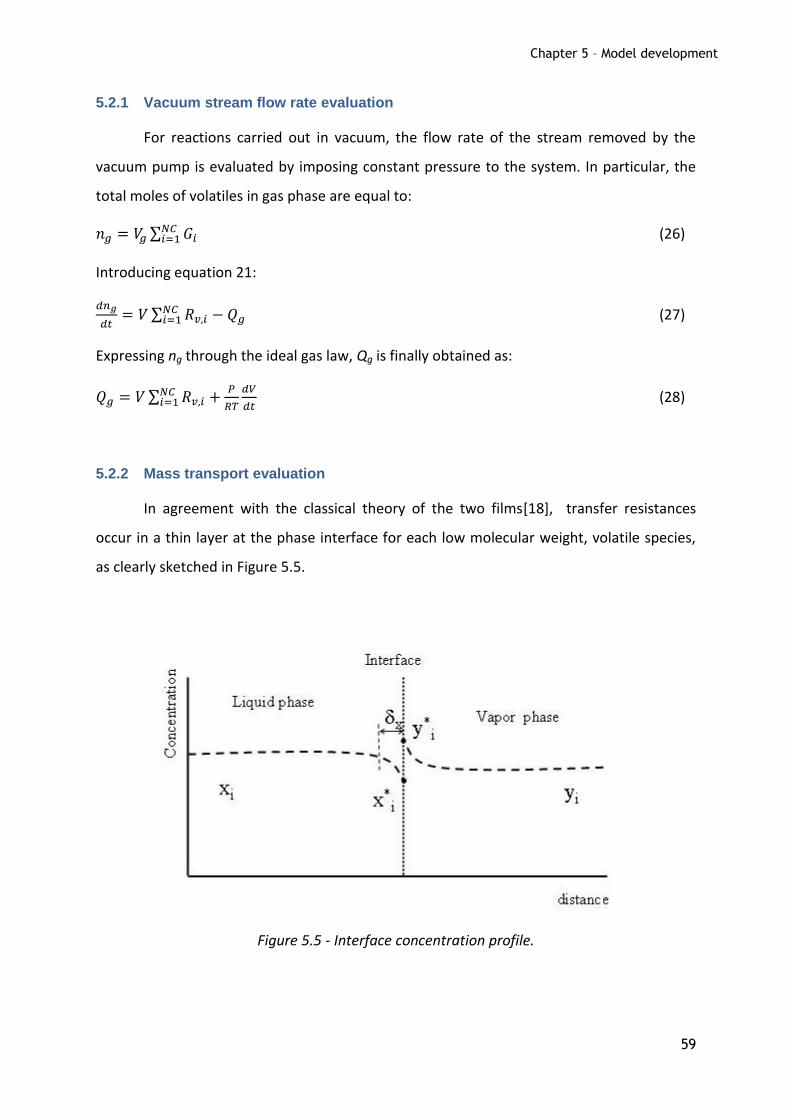
Chapter 5 – Model development
59
5.2.1 Vacuum stream flow rate evaluation
For reactions carried out in vacuum, the flow rate of the stream removed by the
vacuum pump is evaluated by imposing constant pressure to the system. In particular, the
total moles of volatiles in gas phase are equal to:
(26)
Introducing equation 21:
(27)
Expressing ng through the ideal gas law, Qg is finally obtained as:
(28)
5.2.2 Mass transport evaluation
In agreement with the classical theory of the two films[18], transfer resistances
occur in a thin layer at the phase interface for each low molecular weight, volatile species,
as clearly sketched in Figure 5.5.
Figure 5.5 - Interface concentration profile.

Chapter 5 – Model development
60
For each volatile component i, assuming steady state conditions, the removal rate
can be defined as:
(29)
where and
are defined as the mass transport coefficients of the liquid and gas phase,
respectively, and
the mole fractions in equilibrium with the bulk concentration in
liquid and gas phase, a is the specific area of transport and p the density of the system. The
specific area is defined per unit of liquid volume as:
(30)
where A represent the total interfacial area. When the evaluation of the interfacial area is
especially difficult, for example for boiling mixtures, a modified mass transport coefficient,
lumping together area and transport coefficient,
, is often used.
- reactions carried out in vacuum
For reactions carried out in vacuum, the partial pressure of the volatile components in
the gas phase is very low and the resistances, and therefore the concentration gradients, in
gas phase can be neglected. Thus,
(32)
Assuming VLE conditions at the interface, the modified Raoult’s law can be applied in
order to evaluate the liquid mole fraction of the volatile component at the interface. The
final expression for Rvi is:
(33)
where P is the total pressure of the system and the vapor pressure of i at the reaction
temperature. For each volatile component i, the vapor pressure can be evaluated, given the
interfacial temperature, by means of the Antoine’s equation:
(34)
The Antoine parameters for all volatile species are listed in Table 5.1.

Chapter 5 – Model development
61
Table 5.1 - Antoine’s parameters.
A B C T range (K)
water 7.0436 1636.909 -48.23 373.15 - 23.15
LA 7.51107 1965.7 -91.021 273.15 - 500.15
L2 7.534 2289.99 -136.0 300.15 - 600.15
LT 5.798 1605.4 -122.68 398.15 - 463.15
- reactions carried out under nitrogen flow
For reactions carried out under nitrogen flow, assuming that the flow is large enough to
ensure negligible partial pressure of the volatile components, the mole fraction of i at the
liquid interface can be neglected and equation (27) reduces to:
(39)
In this case, the evaluation of γi and is not required.
Finally, it is worth to observe that the mass transport coefficient is considered
constant all over the reaction. In the literature, studies on polycondensation systems
proposed that the mass transport coefficients are function of several variables, such as
molecular weight of the polymer, density of the mixture and stirring rate. However, due to
the low extent of reaction examined in all experiments, the mass transport coefficients were
considered constant in this work.

Chapter 5 – Model development
62
References
1. Duh, B., Reaction kinetics for solid-state polymerization of poly(ethylene terephthalate). Journal of Applied Polymer Science, 2001. 81(7): p. 1748-1761.
2. Ramteke, M. and S.K. Gupta, Polymerizations in the Presence of Vaporization: Experimental Results on Nylon-6. Industrial & Engineering Chemistry Research, 2008. 47(23): p. 9061-9071.
3. Carothers, W.H., Polymerization. Chemical Reviews, 1931. 8(3): p. 353-426.
4. Flory, P.J., Molecular size distribution in linear condensation polymers. Journal of the American Chemical Society, 1936. 58: p. 1877-1885.
5. Odian, G., ed. Principles of polymerization. Fourth Edition ed. 2004, John Wiley and Sons: New Jersey. 47-50.
6. N. A. Dotson, R.G., R. L. Laurence, M. Tirrell ed. Polymerization Process Modeling. 1995, VCH Publishers.
7. Codari F., S.G., Morbidelli M., Equilibrium study of LA polycondensation.
8. S. Bezzi, L.R.a.C.S., Mem. cl. sci. fis. mat., 1937. 52(8): p. 181-200.
9. Vu, D.T., et al., Oligomer distribution in concentrated lactic acid solutions. Fluid Phase Equilibria, 2005. 236(1-2): p. 125-135.
10. Schaffer, M.A., et al., Experimental study and modeling of nylon polycondensation in the melt phase. Industrial & Engineering Chemistry Research, 2003. 42(13): p. 2946-2959.
11. Seavey, K.C., et al., New mass-transfer model for simulating industrial nylon-6 production trains. Industrial & Engineering Chemistry Research, 2004. 43(17): p. 5063-5076.
12. Jacobson, H. and W.H. Stockmayer, INTRAMOLECULAR REACTION IN POLYCONDENSATIONS .1. THE THEORY OF LINEAR SYSTEMS. Journal of Chemical Physics, 1950. 18(12): p. 1600-1606.
13. Keki, S., et al., Melt polycondensation of D,L-lactic acid: MALDI-TOF MS investigation of the ring-chain equilibrium. Journal of Physical Chemistry B, 2001. 105(14): p. 2833-2836.
14. Kotliar, A.M., INTERCHANGE REACTIONS INVOLVING CONDENSATION POLYMERS. Macromolecular Reviews Part D-Journal of Polymer Science, 1981. 16: p. 367-395.
15. Guzman, J.D., R. Pollard, and J.D. Schieber, Modeling of diffusion effects on step-growth polymerizations. Macromolecules, 2005. 38(1): p. 188-195.
16. Achilias, D.S., A review of modeling of diffusion controlled polymerization reactions. Macromolecular Theory and Simulations, 2007. 16(4): p. 319-347.
17. Achmad, F., et al., Synthesis of polylactic acid by direct polycondensation under vacuum without catalysts, solvents and initiators. Chemical Engineering Journal, 2009. 151(1-3): p. 342-350.
18. Perry, R.H.G., D.W., ed. Perry's Chemical Engineers' Handbook. seventh ed. 1997, McGraw-Hill New York.

Chapter 6 - Conclusions
63
6 Conclusions
It is known from literature that lactide production and lactic acid polycondensation are
reactions strictly linked. In this frame, in the present work, two main goals were identified:
i) detailed investigation of LA polycondensation
ii) study of LT production reactions
Two sets of semi-batch reactions were carried out. A first set was performed under
nitrogen flow at different temperatures (130-190OC) aiming to study the influence of this
parameter in lactide polycondensation, at the same time limiting possible side reactions.
The second set of reactions was performed at higher temperatures (190-210OC) and low
pressures (5-25 mbar), conditions suitable for LT production. In this last step, the use of
Sn(Oct)2 as catalyst was investigated.
Detailed data for both liquid and gas phases was obtained applying different
analytical techniques such as reverse phase high performance chromatography (HPLC), size
exclusion chromatography (SEC) and Karl Fischer water titration. The complete distribution
of species during time is something there is not reported in the literature so far.
Regarding the polycondensation of lactic acid, it was found that the polymerization is
enhanced with temperature, and that within the studied experimental conditions water can
be considered the only volatile specie. Lactide was detected even at 130 ºC and for all the
reactions it achieved equilibrium conditions for long reaction times.
In concern to the reactions aiming lactide production it was found that temperature
and pressure play important roles in the process, since that the larger amount of lactide
collected in the gas phase was obtained at the higher temperature and lower pressure
studied. In fact, in these conditions lactide was the main component in the gas phase.
Moreover the lactide content in the liquid phase was always constant for all the studied
reactions which means that lactide reaches equilibrium conditions very quickly.
Finally a general mathematical model accounting for both lactic acid
polycondensation and lactide formation was developed. Due to time limitations, the
comparison between the experimental data and the model was not performed. As a future
work the model developed will be used to estimate the parameters involved in the process.