Embed Size (px)
Citation preview

Government of The Gambia
INTEGRATED HOUSEHOLD SURVEY
INCOME AND EXPENDITURE
POVERTY ASSESSMENT-2010
Gambia Bureau of Statistics
December 2011
PART TWO

Integrated Household Survey Income and Expenditure Poverty Assessment, 2010 Page I
TABLE OF CONTENTS
Acronyms and Abbreviations .......................................................................................................... V
Concepts and Definitions ................................................................................................................ VI
Preface............................................................................................................................................. IX
Executive Summary ........................................................................................................................ XI
Key Findings ............................................................................................................................... XI
Recommendations .................................................................................................................... XIV
Chapter 1: Methodology of the analysis of The Gambia IHS 2010 ............................................. 1
Introduction ................................................................................................................................... 1
Objectives of the survey ................................................................................................................ 1
Sampling methodology ................................................................................................................. 2
The survey and the data files ......................................................................................................... 3
Data analysis ................................................................................................................................. 5
Methods for Poverty Analysis ....................................................................................................... 8
Chapter 2: Demographic and household characteristics ............................................................. 10
Chapter 3: Household and per capita income ............................................................................ 17
Chapter 4: Household consumption............................................................................................ 23
Chapter 5: Poverty Analysis ....................................................................................................... 36
Determinants of poverty .............................................................................................................. 36
Chapter 6: Miscellaneous Income And Expenditure .................................................................. 53
Miscellaneous Income and Expenditure ..................................................................................... 54
Chapter 7: Remittances .............................................................................................................. 56
7.1 Remittances sent .............................................................................................................. 57
7.2 Remittance received ........................................................................................................ 59
ANNEXES ...................................................................................................................................... 62
Annex 1: References ................................................................................................................. 62
Annex 2: National Urban Households Consumption based on IHS2010. ................................ 63
Annex 3: National Rural Households Consumption based on IHS2010. ................................... 72

Integrated Household Survey Income and Expenditure Poverty Assessment, 2010 Page II
LIST OF TABLE
Table 2. 1: Population, number of households, average household size and sample EAs and
Households selected by Local Government Area ........................................................................... 10
Table 2. 2: Population by LGA and place of residence .................................................................. 10
Table 2. 3: Population by LGA/sub division and place of residence ............................................. 11
Table 2. 4 : Population Estimate for midyear 2010 and Sampling Weights for the 2010 HIS ....... 12
Table 2. 5 : Percentage distribution of the 2010 IHS sample population by age group and gender
......................................................................................................................................................... 13
Table 2. 6: Percentage distribution of the listed household members by LGA/Subdivision and
gender ............................................................................................................................................. 15
Table 2. 7: Percentage distribution of head of households by LGA and gender ............................ 16
Table 3. 1: Annual Household Income by Income category and LGA/Sub division ....................... 18
Table 3. 2 : Mean Per Capita Household Income by LGA/Subdivision and gender ...................... 19
Table 3. 3 : Annual per capita by income category by LGA/Sub division ...................................... 21
Table 4. 1: Consumption of selected Foods over the ‘Past Three Days’, which was not purchased
......................................................................................................................................................... 23
Table 4. 2: National: Urban & Rural Households Consumption Report Combined...................... 28
Table 5. 1: Poverty Measures, 2010 ............................................................................................... 38
Table 5. 2: Percentage distribution of the Employed population living below USD1.25 per day by
age group and gender ..................................................................................................................... 39
Table 5. 3 : Total Household Consumption by Quintile, 1998 – 2010 ........................................... 40
Table 5. 4: Average Household Consumption 2010 ....................................................................... 40
Table 5. 5: Mean Per Capita Expenditure in Dalasi by LGA and residence ................................. 41
Table 5. 6 : Inequality in Per Capita Expenditure Distribution by place of residence in 2003 and
2010................................................................................................................................................. 41
Table 5. 7 : Poverty Rate from less than $1 - $2 and above per person per day consumption by
residence ......................................................................................................................................... 43
Table 5. 8: Poverty rates by Local Government Area less than $1 to $2 and above per day ........ 43
Table 5. 9 : Poverty Rate by Gender of the household head less than $1 to $2 and above per day
......................................................................................................................................................... 44
Table 5. 10: Mean per capita household consumption by gender of the household head and
residence ......................................................................................................................................... 45
Table 5. 11: Poverty Rate by the Household head highest level of education completed .............. 47
Table 5. 12: Poverty Rate by Sector of Employment of the Household Head ................................ 48
Table 5. 13: Poverty Rate by Status in Employment of the Household Head ................................. 49
Table 5. 14: Poverty Rate by Status in Employment of the Household Head ................................. 50
Table 5. 15: Poverty rates by Age Group, less than $1 per day poverty line ................................. 51
Table 5. 16: Poverty rates by Age Group, less than $1.25 per day poverty line ............................ 52
Table 6. 1: Table 6.1 : Receipt from sale of used items (Module G) .............................................. 53

Integrated Household Survey Income and Expenditure Poverty Assessment, 2010 Page III
Table 6. 2: Miscellaneous income in past 12 months by households ............................................. 54
Table 6. 3: Expenditure in past 12 months by households in cash and kind .................................. 54
Table 7. 1: Value of Remittance Sent by type, background Characteristics of recipient and period.
......................................................................................................................................................... 57
Table 7. 2 : Value remittances Sent by region and type ................................................................. 58
Table 7. 3: Value of Remittance received by type, background Characteristics of remitter and
period. ............................................................................................................................................. 59
Table 7. 4: Value of remittances received by region and type ........................................................ 60

Integrated Household Survey Income and Expenditure Poverty Assessment, 2010 Page IV
LIST OF FIGURES
Figure 1: Population Pyramid of the IHS 2010 Sampled Population ............................................ 14
Figure 2: Poverty Rates by place of residence for less $1 and $1.25 per day ............................... 39
Figure 3: Lorenz Curve .................................................................................................................. 42
Figure 4: Mean per capita household consumption for male headed households ......................... 45
Figure 5: Mean per capita household consumption for male headed households ......................... 46
Figure 6: Poverty Rate by Household Size using the poverty line less $1 and $1.25 per day ....... 51
Figure 7: Percentage of Remittances in 2010 by Quarter .............................................................. 56
Figure 8: Frequency of Remittance received by households .......................................................... 60
Currency Unit = Dalasi (GMD)
US$1 = 28 GMD (average rate for 2010)
Fiscal Year January 1 – December 31

Integrated Household Survey Income and Expenditure Poverty Assessment, 2010 Page V
Acronyms and Abbreviations
AEU Adult Equivalent Unit
COICOP Classification Of Individual Consumption according to Purpose
CPI Consumer Price Index
EA Enumeration Area
GBoS Gambia Bureau of Statistics
GDP Gross Domestic Product
GMD Gambian Dalasi
HH Household
IHS Integrated Household Survey
LGA Local Government Area
LRR Lower River Region
MDG Millennium Development Goal
NEC Not Elsewhere Classified
NBR North Bank Region
PAGE Programme for Accelerated Growth and Employment
PPA Participatory Poverty Assessment
PPP Purchasing Power Parity
PPS Probability Proportional to Size
PRSP Poverty Reduction Strategy Paper
SPSS Statistical Package for Social Sciences
SSA Sub-Saharan Africa
URR Upper River Region
WCR West Coast Region

Integrated Household Survey Income and Expenditure Poverty Assessment, 2010 Page VI
Concepts and Definitions
Average Household Consumption
This is the mean income/expenditure per household.
Bottom Half of the Distribution
This is the comparison of the mean per capita consumption of the 25th
percentile of the population
against the 10th
(lowest) percentile and that of the 50th
percentile against the 25th
percentile.
Gini Coefficient
The Gini coefficient varies between 0, which reflects complete equality, and 1, which indicates
complete inequality. Graphically, the Gini coefficient is represented by the area between the
Lorenz curve, which maps the cumulative income shares against the distribution of the
population, and a straight line of equality.
The Head Count Index
This is the percentage of the population living below the poverty line.
Household
This consists of a person or group of persons who live together in the same house or compound,
share the same house-keeping arrangements and are catered for as one. It is important to
remember that members of a household may not necessarily be related (by blood or marriage) as
for instance, maid-servants may form part of a household.
Inter Quartile Range
This is the comparison of the mean per capita consumption of the 75th
percentile of the
population against the 25th
percentile.
Lorenz curve
If all individuals are the same income/consumption, the Lorenz curve is a straight diagonal line,
called the line of equality. If there is any inequality in income/consumption, then the Lorenz curve
falls below the line of equality
Mean Per Capita Consumption:
This is the average household consumption per person.
Osusu
Periodic contributions of individuals or groups that are periodically given to the contributors on a
rotational basis

Integrated Household Survey Income and Expenditure Poverty Assessment, 2010 Page VII
Percentile
This is the value of a variable below which a certain percent of observations or population fall.
Predominantly rural areas
These are LGAs in which the number of rural settlements is more than the population of the urban
settlements. They are Mansakonko, Kerwan, Janjabureh, Kuntaur, and Basse.
Rural
Settlements that do not meet the criteria of an urban settlement described below are considered
rural.
Urban
According to the 2003 Population and Housing Census, a settlement is considered urban if it
satisfies most of the following:
Has commercial importance
Has institutional importance
Majority of the population should be non-agricultural in occupation
Population should be 5,000 and above
Density should be high
Some degree of infrastructure should be available
Sub division
During the data analysis stage it was felt that, where possible, the results of the IHS has to be
broken down into sub divisions to reflect the diversity of the regions in terms of spatial variations
and crucial social inequalities such as population size, prevalence of poverty, social services as
well as the infrastructural development in order to provide better estimates. Sub divisions data
would show the more disaggregated information of the district and therefore expose significant
gaps in disparities between subdivisions. With such data more precise targeting of development
activities can be followed to address the needs of the districts.
Such disparities were more pronounced in Brikama, Kerewan and Basse Local Government
Areas. As a result, the following disaggregations were made:
Brikama LGA was sub divided into
Kombo North i.e. Kombo North district only
Other Kombos i.e. Kombo South, Kombo Central and Kombo East
Fonis i.e. all the 5 Foni districts

Integrated Household Survey Income and Expenditure Poverty Assessment, 2010 Page VIII
Kerewan LGA was sub divided into
NBR West i.e. Lower Niumi, Upper Niumi and Jokadu districts
NBR East i.e. Lower Baddibu, Central Baddibu, Upper Baddibu and Sabakh/Sanjal districts
Basse LGA was sub divided into
URR South ie Fulladu East and Kantora districts
URR North i.e. Wuli and Sandu districts
Tails
This is the comparison of the mean per capita consumption of the richest segment (90th
percentile)
of the population against the poorest segment (10th
percentile) of the population.
Upper Half of the Distribution
This is the comparison of the mean per capita consumption of the 75th
percentile of the population
against the 50th
percentile and that of the 90th
percentile against the 50th
percentile.

Integrated Household Survey Income and Expenditure Poverty Assessment, 2010 Page IX
Preface
This is volume two of The Gambia 2010 Integrated Household Survey (IHS) report. The IHS was
carried out in collaboration with government and partner stakeholder institutions, to study both
social as well as economic status of households. The data collection for the survey lasted for a
period of one year and covered 4800 households randomly selected on a Probability Proportional
to Size (PPS) basis across Local Government Areas (LGAs).
This report provides important data on household income, consumption expenditure and pattern at
national and urban/rural level. Information on the environment, health, education, employment
and governance were also collected in the study and the analysis is presented in Part 1 of the IHS
report. The report is a solid foundation upon which to formulate or redirect national development
programmes and poverty reduction strategy efforts.
The first IHS was conducted in 2003. However, the reports on that survey did not analyze all of
the modules covered in the study. This report thus attempts to discuss all the topics for which data
was collected. The datasets from the survey can also be used for further analysis. It is hoped that
with adequate funding, The Gambia Bureau of Statistics (GBoS) will continue to use these new
datasets for research or other studies.
I also hope that the IHS will continue to be conducted on regular intervals preferably every five
years, with light poverty studies at less frequent intervals, in view of current developments taking
place in The Gambia.
I would like to take the opportunity here to express my gratitude to The Gambia government, the
United Nations Development Programme (UNDP) for providing technical and financial support
for the conduct of the 2010 Integrated Household Survey.
I take this opportunity to sincerely commend and thank Prof. Rameshwar P. Srivastava, the TA
provided by UNDP for the analysis aspect of the survey data. He provided guidance and on-the-
job training to Mohammed L. Janneh (GBoS staff) who ably assisted him in the analysis.
Together, they have worked tirelessly to produce this invaluable document that will be
indispensible for national programme development, monitoring and evaluation especially the
Programme fo Accelerated Growth and Employment (PAGE) and the Millennium Development
Goals (MDGs).
My special thanks to Mr. Abu Camara for his role in overseeing the process leading to the
inception of the IHS and the support he continued to provide throughout. I commend the efforts of
Messrs. Ousman Dibba, Director, Prices and his staff, Lamin Fadia, Director, IT and his staff and

Integrated Household Survey Income and Expenditure Poverty Assessment, 2010 Page X
Mr.Alieu Bahoum, Senior Statistician, IHS for their support to the successful completion of
Volume 2 of the HIS 2010. I would like to thank Mr Alieu Saho for leading the editing and
finalization of the report.
Finally, I am grateful not only to all staff who participated in the different phases of the survey
but more so the respondents who generously gave their time to provide the needed information.
Alieu S.M Ndow
Statistician General
Gambia Bureau of Statistics

Integrated Household Survey Income and Expenditure Poverty Assessment, 2010 Page XI
Executive Summary
This report presents the final results of the income, expenditure, consumption and poverty
analysis of the Integrated Household Survey 2010 in The Gambia. The results correspond to the
collection period that covers four quarters in 2010. The poverty assessment is consumption-based.
The consumption data were captured in Part 2: Consumption and Expenditure Questionnaire (a
copy attached in Annex) which consisted of 106 food items and 199 non-food items.
Key Findings
Annual Household Income: 35 per cent of the sampled households annual income was less
than GMD10,000, 11.2 per cent of the households income GMD100,000 and more ( as
per Economist, December 3, 2011, 6 per cent of the households in Africa had income
more than US$ 3,000, average exchange rate for 2010 ($1= GMD 28).
Mean per capita household income GMD15,930, male-headed households-GMD16,015
and female-headed households-GMD15,582.
The sampled households estimated annual consumption of food items which they did not
purchase, GMD 30.1 million , out of which „Own production‟ constituted
GMD24.1million , and Gift- GMD 5.6 million.
The sampled households „Yearly Expenditure Per Household‟ was: National-Urban and
Rural combined GMD 111,480 (US$ 3,981). The „Per Capita‟ was GMD 13,720
(US$490).
The sampled Urban households „Yearly Expenditure Per Household‟ was: GMD
121,696(US$ 4,346). The „Per Capita‟ was GMD 18,236 (US$651).
The sampled Rural households „Yearly Expenditure Per Household‟ was: GMD 87,077
(US$ 3,110). The „Per Capita‟ was GMD 8,684 (US$ 310).
The head-count index estimated with the US$1.25 poverty line is 48.4 per cent. Using the
lower poverty line of $1, the overall poverty rate is 36.7 per cent. The poverty gap with
the upper line is estimated at 27.9 per cent (respectively 21.8 % with the lower line).

Integrated Household Survey Income and Expenditure Poverty Assessment, 2010 Page XII
The incidence of poverty incidence (the distribution of the poor) is lower in Banjul and
Kanifing which are entirely urban settlements compared to the other Local Government
Areas which are all characterized by a large proportion of poor persons.
Urban areas have a much lower poverty rate (32.7 %) compared to rural areas (73.9%)
using $1.25 poverty line (P$1.25). Using the less than $1 (P$1) threshold, poverty is also
lower in the urban areas with 21.0 per cent compared to the rural areas (62.1 %). This is
an indication that poverty is a rural phenomenon as has been the case in most developing
countries.
Female headed households have lower poverty rates using the poverty line $1.25(P$1.25)
with 38.3 per cent compared to their male counterparts (50.9%). Using the poverty line
$1 (P$1), female headed households also have lower poverty rates compared to male
headed households (28.2% vs 38.8%). The reasons for this disparity in overall poverty
levels is attributable to the fact that, female headed households live in smaller households
on average of 6.6 persons compared to male headed households of 8.4 persons per
household. The second factor being remittances: about 6 out of 10 female headed
households received cash remittances amounting to GMD 23, 886 (those in urban area)
and GMD 9,580 (those in rural area) during the past 12 months and this was higher for
female headed households compared to male-headed households.
Larger households (i.e. with more number of persons) have higher poverty rates. Using
the poverty line $1, overall poverty ranges from 5.6 per cent from single person
households to about 66 per cent for households with 10 members and above. A similar
pattern has been observed using the poverty line $1.25 but poverty has increased for all
households. The poverty rates for single person households is about 11 per cent and for
households with 10 or more members, the overall poverty rate is 76.8 per cent.
Household heads employed in the agricultural and fishing sector having higher poverty
rates using both thresholds (P$1.25 = 79.0 %, P$1 = 68.8%) compared to other household
heads employed in the other sectors. This is followed by household heads working in the
transport and communication sector (P$1.25 = 51.2 %, P$1 = 37.7%). By contrast,
households whose head works in financial management (32.8 % and 20.7% respectively),
in the sector „Trade, Hotels and Restaurants‟ (36.2 % and 24.2% respectively), and in
social and personal service (40.4 % and 28.1% respectively) have lower poverty rates. It
is also observed that 40 per cent of the employed population are living below $1.25 per
day and the proportion was highest for females (42%) compared to males (37%).
Integrated Household Survey Income and Expenditure Poverty Assessment, 2010 Page XIII
Households heads with no education had the highest poverty rates (P$1 = 46.2% and P$1.25
= 58.4%). It is observed that as the educational attainment of the household head
increases, the poverty level goes down. Poverty is lowest for households with higher
education (P$1 = 10.9% and P$1.25 = 17.8%)
Although poverty has declined, inequality still persists. The lowest quintile (poorest 20%
of the population) is consuming only 5.6 per cent compared to 8.8 per cent in 2003
showing a drop of 3.2 percentage points. Where as the 5th
quintile (richest- top 20%) are
consuming 46.5 per cent compared to 38.0 per cent in 2003 showing an increase of 8.5
percentage points. This shows that the gap between the richest and the poorest is
widening.
The poverty is highest in Kuntaur (P$1 = 74.1% and P$1.25 = 79.0%) , Janjabureh (P$1 =
65.9% and P$1.25 = 73.2%) and Basse (P$1 = 56.7% and P$1.25 = 65.6%) LGAs and lowest
in Banjul (P$1 = 7.1% and P$1.25 = 16.4%) and Kanifing (P$1 = 15.0% and P$1.25 = 26.0%)
. The mean per capita expenditure is also lowest in Kuntaur and highest in Banjul and
Kanifing.
The Gini coefficient for the urban area is 42.11 or (0.42), rural area is 40.03 or (0.40) and
the national average is 45.78 (0.4578).
Evidence from IHS underscores the importance that remittances can play in poverty
alleviation for many households in The Gambia. On the whole, transfer received by
households is four times larger than the transfers made. Out of about GMD43.52 million
of total remittance, GMD8.18 million (18.8%) was sent by interviewed households and
GMD35.34 million (81.2%) was received.

Integrated Household Survey Income and Expenditure Poverty Assessment, 2010 Page XIV
Recommendations
Consumer Price Index (CPI): Since the analysis of detailed consumption data has been
done by urban and rural areas and weights provided as per COICOP, an updated CPI series
should be constructed using the 2010 as base year. In addition to national, urban and rural
CPI should also be constructed.
Extension of the analysis with new dimensions: There are many possibilities to
complement the poverty statistics based on consumption value with a range of social
indicators extracted from the survey data. The poverty can be estimated that reflect the
multidimensional nature of poverty. The poor could be studied in terms of their patterns of
consumption, sectors of employment, participation in key markets, income sources, access to
health and education services and infrastructural services. In absence of national nutritional
data, we could not analyze this dimension but analysis should be done by Adult Equivalent
Units (AEU) in future. The national food-poverty lines could also be developed.
Future Integrated Household Survey: Since level of achievements of MDG targets has
to be reported to the UN General Assembly in April 2015, the stakeholders could plan for the
next round of IHS to start after the 2013 Population and Housing Census. The Population and
Housing Census enumeration is expected to last for a month beginning April 15th
2013. IHS is
a one-year survey, so data collection will be completed in June 2014, and data analysis
finished by December 2014.

Chapter 1: Methodology of the analysis of The Gambia IHS
2010
Introduction
This is the fourth poverty studies to be conducted in The Gambia and is the second series of the
Integrated Household Survey to be conducted in The Gambia as well. The first poverty study was
conducted in 1992 followed by the 1998 Household Poverty survey and the 2003 and 2010
Integrated Household surveys. In 2008, poverty assessment was conducted which take into
account economic growth, remittances and internal migration since 2003.
This report looks at the detailed information on household consumption expenditures that has
been collected in the 2010 Integrated Household survey. It helps derive a welfare indicator for
households that capture the economic dimensions of wellbeing through consumption data.
Arguably, consumption expenditures provide a better picture of a household‟s standard of living
than a measure of current income.
The data in this report was mainly derived from consumption of selected food items, non food
items durable goods, sale of used items as well as transfers and miscellaneous income and
expenditure over the period of the study.
Objectives of the survey
The primary aims of the Integrated Household Survey (IHS) were:
to provide identification of policy target groups;
to provide a mechanism whereby key poverty indicators can easily and regularly be
produced in order to describe and monitor the well-being of different categories of
households;
to provide some key data on how the economic policies affect the availability and quality
of social and economic services to households, both as producers and consumers of
products;
to collect data relating to such topics as health, education, employment, environment,
agriculture, governance, etc;
to derive consumption patterns of households;
to identify individual items which should be included in the consumption basket.
A few priorities of this report are:
1) Analysis of household consumption at aggregate level and for urban and rural areas.
2) Poverty analysis including determinants of poverty.
3) Remittances.

Integrated Household Survey Income and Expenditure Poverty Assessment, 2010 Page 2
Sampling methodology
Coverage
The whole country was covered concurrently during the entire survey period, spreading over
twelve months and divided into four sub-samples representing seasonal/ quarterly periods.
Sampling plan
A two-stage probability proportional to size (PPS) stratified random sampling (size being number
of households per EA) without replacement was adopted. At each stage, sub-samples of equal size
were independently drawn without replacement. Sampling units were selected for each sub-
sample with simple random sampling without replacement. Each survey period (a quarter – 3
months) was allocated one sub-sample.
Local Government Area by place of residence (i.e. Urban or Rural) corresponds to the survey
Stratum.
Enumeration Areas (EAs) were taken as the first stage units whilst 20 households within EAs
were selected as the second stage units.
Sampling Frame
For the first stage selection, the 2003 updated Census EA list was used as the frame.
The available information about the EAs are the EA boundaries with the number of household
size.
In the second stage, all the EAs selected were combed by a listing of households exercise by an
individual enumerator for subsequent household selection.
First Stage Stratification
Except for Banjul and Kanifing LGAs which are all urban areas, EAs were stratified according to
urban and rural areas for the other six LGAs.
A total of 12 first stage strata plus 2 representing Banjul and Kanifing were determined.
First Stage Sample
Taking into consideration the available resources and manpower, 240 EAs consisting of four sub-
samples of 60 EAs each was covered during the entire survey period of twelve months. Thus,
each phase (a quarter – 3 months) of the survey was allocated 60 EAs.

Integrated Household Survey Income and Expenditure Poverty Assessment, 2010 Page 3
Second Stage Sample
Again, the available resources dictated a sample size of 4,800 households. It required six teams
constituting six (6) supervisors and thirty (30) enumerators each were assigned to different
geographical locations, taking into account social and cultural considerations amongst others.
Each enumerator covered a total of 40 households in each phase of a three-month period
corresponding to 2 EAs. Twenty (20) households per EA were selected with simple random
sampling without replacement - all of which part one and part two questionnaires were
administered.
The survey and the data files The collection started in January 2010 and ended in January/February 2011. The sample size was
4,800 households. In previous IHS 2003/2004, about one third of the surveyed households were in
urban areas and two third in rural areas.
It should be noted that the 2010 IHS followed the same sampling technique as the 2003 selecting
the same EAs some of which were rural in 2003 but considered urban in 2010 based on
developments in terms of population, infrastructure and social services.
Three questionnaires (Part 1: Household questionnaire; Part 2: Consumption and Expenditure
questionnaire; Part 3: Settlement information form) were administered. The daily record form
which is used for recording of daily household expenditure that was administered to half of the
sample in 2003/04 was not used in 2010 because of low literacy level of some of the sampled
households.
The basic organization of the database of the entered data is a set of SPSS files for Part 1, Part 2,
and Part 3. The elementary data have been aggregated at individual level, household level, and
EA level to provide characteristics that can be used for micro and macro-economic level analysis.
The list of the section files by parts is as follows:
Part 1: Household Questionnaire
Section 0: Household particulars;
Section 1: Household roster;
Section 2a: Health for all household members;
Section 2b: Health expenditure;
Section 2c: Fertility;
Section 3a: Education and literacy;
Section 3b: Non-formal training and literacy;
Section 3c: Education expenditure;
Integrated Household Survey Income and Expenditure Poverty Assessment, 2010 Page 4
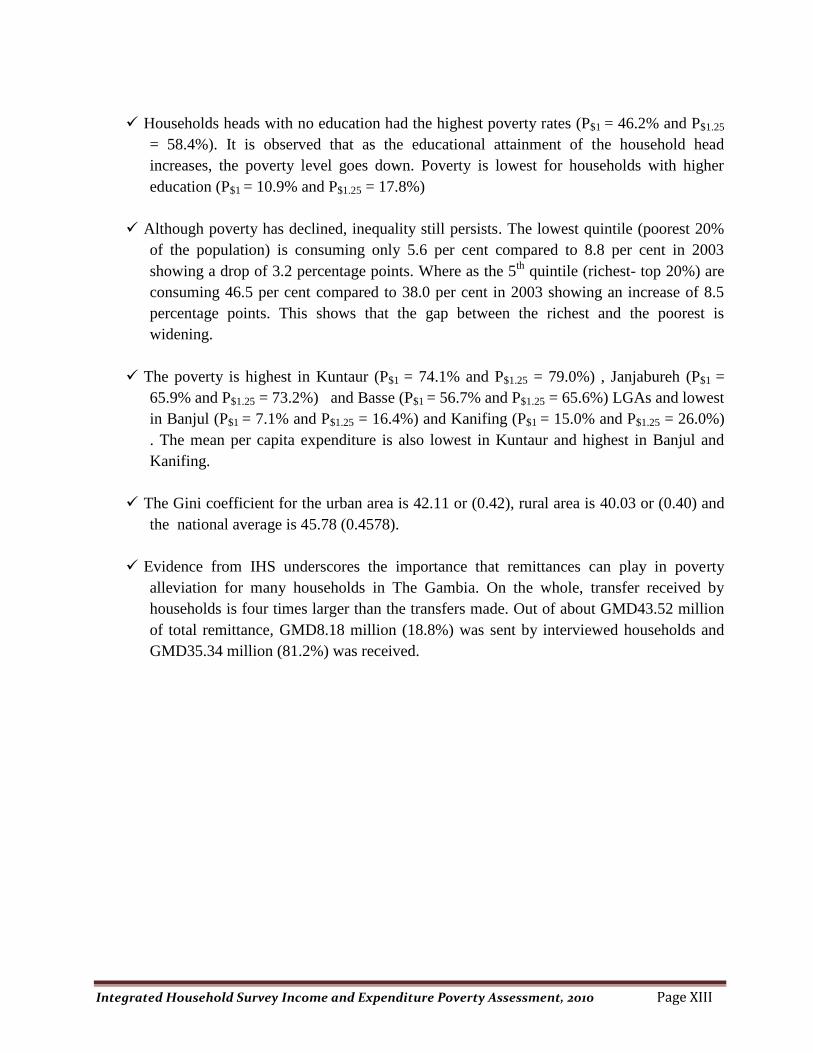
Section 4: Employment;
Section 5a: Crop production;
Section 5b: Livestock;
Section 6: Household Income
Section 7.1: Household Expenditure
Section 7.2: Rent Paid by the Household
Section 8: Housing Amenities
Section 9: Ownership of Assets
Section 10: Environment
Section 11: Perception about Poverty
Section 12: Governance;
Section 13: Anthropometry;
Part 2: Household Consumption and Expenditure
Module A: Consumption of selected foods over the past three days
Module B: Consumption of selected foods over the past one week
Module C: Non-food expenditures – past one week and one month
Module D: Non-food expenditures – past three months
Module E: Non-food expenditures – past twelve months
Module F: Durable goods
Module G: Receipt from sale of used items
Module H: Miscellaneous income and expenditure
Module I: Transfer payments made by household
Module J: Transfer payments received by household
Part 3: Settlement Information
Section i: Village demographic information;
Section ii: Socio-economic institutions/facilities.

Integrated Household Survey Income and Expenditure Poverty Assessment, 2010 Page 5
Data analysis Basic checks
After thoroughly cleaning the data, the analysis was done using the following softwares: SPSS,
Stata, and Excel.
The household characteristics database
The household characteristics database includes the number of household members by age and
gender. Other characteristics of household members in the database include educational
attainment, ethnicity of household members for Gambian nationals only, relationship to the head
of the household, nationality, place of residence and marital status of household members aged 12
years and above.
Aggregation of files incorporating consumption information
The aggregation of the consumption data
The consumption data were captured in Part 2: Consumption and Expenditure Questionnaire-
Modules A to F.
Module A was „Consumption of selected foods over the past three days‟, which the household
did not purchase, but produced themselves, received as a gift or as wages, or received it in some
other manner without purchase. Fifty seven food and non-alcoholic beverages items were
covered.
Module B collected data on „Consumption of selected foods over the past one week‟ which
consisted of the following items:
COICOP* Food subgroups Number of items listed
01.1.1 Bread , Cereals and Cereal products 14
01.1.2 Meat 5
01.1.3 Fish and seafood 14
01.1.4 Milk, cheese and eggs 9
01.1.5 Oils and fats 8
01.1.6 Fruits 17
01.1.7 Vegetables and other tuber vegetables 23
01.1.8 Sugar, jam, honey, chocolate and confectionery 8
01.1.9 Food products, not elsewhere classified 8
Total food items 106
*Classification Of Individual Consumption according to Purpose
Module C consisted of „Non-Food Expenditures‟; there were 16 items for which expenditures in
past one week was reported, and there were 33 items for whom expenditures in past one month

Integrated Household Survey Income and Expenditure Poverty Assessment, 2010 Page 6
was to be recalled and reported. These items did not follow COICOP sequence and had to be
rearranged for analysis.
Module D again consisted of 90 „Non-Food Expenditures‟, for which recall period was “Past
Three Months”. These items are not as frequently purchased as items in Module C.
Item code as per
IHS 2010
Group/ subgroup Number of items
listed
501-520 Clothing 20
521-524 Footwear 4
525-552 Mixed 28
553-561 Medical and Pharmaceutical Products 9
562-565 Non-Hospital Medical, Paramedical, Dental services 4
566-568 Hospital services
569-571 Sickness and Accident Insurance Services 3
572-576 Transport Services 5
577-578 Personal services 2
579-583 Personal Effects n.e.c*. 5
584-593 Educational Expenses 10
*n.e.c. is not elsewhere classified
Module E comprised of 17 items for which over the past one year (twelve months) purchase or
the estimated total value consumed was recorded. These items consisted for example carpet, rugs,
linen, mat, mosquito net, mattress, sports/hobby equipment, and instrument etc.
In Module F, households were asked “ If they want to sell one of this items today how much will
you receive?”. Mini bus and lorry were dropped because they are mainly use for commercial
purposes not for the household consumption and the value attached to them are too high. This will
affect the mean household expenditure.
The database is rectangular with the following typical record:
Household identifiers (incorporating location information), quarter, product, item code, quantity,
unit and value in Dalasi. The units used were 1= Kilogram, 2= 50 Kg Bag, 3=100 Kg bag, 4= 500
gram, 5=piece, 6=bunch, 7=heap, 8=bale, 9=big tomato cup, 10=medium tomato cup, 11=small
tomato cup, 12=litre, 13=cup (standard rice cup), 14=tin, 15=set, 16=scoop.
Each record of the database aggregates all records for the same households and products. In a
second stage, these elementary transaction records are aggregated for all the levels of the
nomenclature of products for the analysis. To ensure that transactions not related to consumption
were not used in the calculation of the consumption aggregate, the ones that did not correspond to
consumption (e.g. construction expenditure) were eliminated.
Nomenclature of products
There was an improvement in 2010 compared to 2003 as far as nomenclature of items was
concerned because in 2003 the nomenclature was not included in the questionnaire, instead it was
recorded by the enumerators during data collection. In 2010, nomenclature was in the
questionnaire with item names and codes listed and some rows were left blank to add additional
items if needed
.

Integrated Household Survey Income and Expenditure Poverty Assessment, 2010 Page 7
The extrapolation for the year 2010
The sums of consumption records inversely proportionally to the observation period which is
specific to each household was inflated. This led to the production of household consumption for
the year. For example, for the calculation of household consumption based on the Module B over
the past one-week (7 days), the consumption value obtained for a given household is multiplied
by 365/7 i.e. 52 to produce a yearly consumption for the household.
There are two ways to calculate mean annual per household consumption of items. For example,
the mean for Bread was 87.96 Dalasi reported by 3,949 households in The Gambia, summing to
Dalasi 347,342 for a week. If multiplied 347,342 by 52, we arrive at an annual consumption of
GMD18,061,773 and when divided by 4,791 households reporting consumption, we get 3,770
Dalasi. The second way will be (87.96 x 52 x 3949)/4,791 = Dalasi 3,770. The results are the
same. The mean annual consumption per household for each item in Module B has been
calculated this way. The figures in the Table 4.2 have been rounded to nearest Dalasi.
The Module C consisted of some items for which it was one week recall, and they have been
estimated as above. For those where it was „one month recall‟, the multiplier is 12.
Module D was „Past Three Months‟ recall and hence the multiplier to estimate annual household
consumption is 4.
Module E recall period was „Past Twelve Months‟, no need for extrapolation.
The own-consumption and gifts
Module A contains food items that were consumed in the last three days and were not purchase by
the household but received as a gift or produce by the households. Therefore, module A does not
contain the total consumption of households but module B contains items consumed in the last
seven days by the households which were purchased, received as a gift or were own produced.
Comparison of the Part 1 summary data with Part 2 detailed consumption data
Section 7.1 of Part 1 collected summary data for 19 groups. For some groups, for example food,
consumption of own produce-food, communications, transport, housing, fuel, energy & water;
expenditure data was collected for the previous month. For clothing and footwear, health,
entertainment, cultural, social and religious services, the same was collected for the period last 3
months. For remaining groups, it was collected for last 12 months. In Part 2, detailed consumption
data on over 300 items were collected as explained earlier.

Integrated Household Survey Income and Expenditure Poverty Assessment, 2010 Page 8
Methods for Poverty Analysis
The past poverty lines and the inflated poverty lines
Three poverty studies have already been carried out in The Gambia, namely 1992, 1998 and 2003.
An ILO study (“Poverty in The Gambia”, 1992) established the first poverty line in The Gambia.
It was based on a minimum food basket to reach energy requirements per age-gender adult
equivalent.
According to the 1992 poverty report, “The ILO study selected households with a food
consumption per adult-equivalent unit corresponding roughly to the food poverty line. Rural
households spending GMD75 to GMD125 per month per adult-equivalent unit were selected and
the food poverty line for rural households was GMD100 per month per adult-equivalent unit.
These households spend GMD25 per month per adult-equivalent unit on non-food items.”
Therefore, the poverty line for rural household was established at GMD125. The same procedure
for urban households led to a poverty line of GMD186.50.
In the 1998 survey, the 1992 poverty line was updated using the price index for the food basket
(some cost is calculated for this food basket which has seven categories). Therefore, the 1992 and
1998 poverty lines were obtained by updating an ad hoc price index for the poor.
In 2003, the national price index of The Gambia (in practice a Banjul price index) was used to
convert the poverty lines used in the past surveys in the different domains (Banjul and Kanifing,
Other urban, rural).
The exchange rate used to convert the poverty line for 2003: (for 3 February 2003) GMD24.29 for
1 US$.

Integrated Household Survey Income and Expenditure Poverty Assessment, 2010 Page 9
The estimates of the poverty lines
Finally the following values were obtained for the poverty lines:
ZF = D 4488 in domain Banjul and Kanifing;
ZF = D 4337 in domain Other Urban;
ZF = D 4615 in domain Rural.
ZL = D 5636 in domain Banjul and Kanifing;
ZL = D 5835 in domain Other Urban;
ZL = D 6145 in domain Rural.
ZU = D 6388 in domain Banjul and Kanifing;
ZU = D 6771 in domain Other Urban;
ZU = D 7009 in domain Rural.
Domain ZF ZL ZU ZF ZL ZU
Banjul and Kanifing D4488 D5636 D6388 $183 $232 $263
Other Urban D4337 D5835 D6771 $179 $240 $279
Rural D4615 D6145 D7009 $190 $253 $289
The exchange rate of GMD24.29 for 1 US$ (February 2003) was used for conversion.
The inflation between 2003 and 2010 has been in the range of 30-35 per cent, so applying the
same on the 2003 lower and upper poverty lines, it is justified the use of $1 and $1.25 per person
per day as lower and upper poverty lines.

Integrated Household Survey Income and Expenditure Poverty Assessment, 2010 Page 10
Chapter 2: Demographic and household characteristics
Table 2. 1: Population, number of households, average household size and sample EAs and
Households selected by Local Government Area
The Average Household (HH) size declined from 8.9 persons in 1993 Census to 8.5 persons in
2003 Census. It is also observed that average household size further decreases to 8.1 in the 2010
Integrated Household Survey (IHS). The decrease in average household size in 2010 was
observed in all Local Government Areas (LGAs) except in Janjanbureh. The average household
size in The Gambia is similar to Senegal but much higher compared to other African countries.
Basse had the highest average household size of 12.4 persons among all the Local Government
Areas, whilst Banjul had the lowest average household size of 5 persons, followed by Kanifing
with 6.4 persons. The predominantly rural areas had the highest average number of persons per
household compared to the urban areas.
Table 2. 2: Population by LGA and place of residence LGA Urban Rural Total Percent
Banjul 35,061 0 35,061 2.58
Kanifing 322,735 0 322,735 23.72
Brikama (WCR) 234,925 154,669 389,594 28.63
Mansakonko (LRR) 13,279 58,888 72,167 5.30
Kerewan (NBR) 34,740 138,095 172,835 12.70
Kuntaur (CRR North) 5,023 73,468 78,491 5.77
Janjanbureh (CRR South) 16,618 90,594 107,212 7.88
Basse (URR) 23,736 158,850 182,586 13.42
Total 686,117 674,564 1,360,681 100.00
Percent 50.4 49.6 100
Source: 2003 Population and Housing Census
NB: Banjul and Kanifing are entirely urban settlements
LGA Population
2003
Census
No of
HHs
2003
Average
HH size
2003
Sample
Percent
Sample
EA‟s
Sample
HHs
No. of
Persons
Average
HH size
2010 IHS
Banjul 35,061 6,853 5.1 3.41 12 239 1,196 5.0
Kanifing 322,735 49,016 6.6 2.67 68 1,358 8,622 6.4
Brikama (WCR) 389,594 45,139 8.6 2.86 68 1,354 11,125 8.2
Mansakonko (LRR) 72,167 8,432 8.6 2.22 12 240 1,605 6.7
Kerewan (NBR) 172,835 18,242 9.5 3.19 32 645 5,518 8.6
Kuntaur (CRR North) 78,491 7,104 11.1 3.31 12 240 2,598 10.8
Janjanbureh (CRR South) 107,212 10,115 10.6 3.20 16 320 3,430 10.7
Basse (URR) 182,586 12,593 14.2 2.68 20 396 4,901 12.4
Total 1,360,681 157,494 8.5 2.67 240 4,792 38,995 8.1

Integrated Household Survey Income and Expenditure Poverty Assessment, 2010 Page 11
Table 2. 3: Population by LGA/sub division and place of residence LGA/Sub -Division Urban Rural Total Percent
Banjul 1,196 0 1,196 3.07
Kanifing 8,622 0 8,622 22.11
Brikama (WCR) 6,100 5,025 11,125 28.52
Kombo North 3,811 1,220 5,031 12.90
Other Kombos 2,289 2,656 4,945 12.68
Fonis 0 1,149 1,149 2.95
Mansakonko (LRR) 443 1,162 1,605 4.12
Kiangs 8 604 612 1.57
Jarras 435 558 993 2.55
Kerewan (NBR) 1,023 4,495 5,518 14.16
NBR West 264 1,709 1,973 5.06
NBR East 759 2,786 3,545 9.09
Kuntaur (CRR North) 620 1,978 2,598 6.66
Janjanbureh (CRR South) 718 2,712 3,430 8.80
Basse (URR) 1,111 3,790 4,901 12.57
URR South 1,016 2,210 3,226 8.27
URR North 95 1,580 1,675 4.30
Total 19,833 19,162 38,995 100.00
Percent 50.9 49.1 100.00
Source: 2010 Integrated Household Survey
In the IHS 2010 sample, the proportion of urban and rural population was 50.9 and 49.1 per cent
respectively which was very close to 2003 Census of 50.4 and 49.6 per cent respectively (Table
2.2). Brikama constituted more than a quarter of the 2010 IHS sample as is the most populous
region and the sampling was based on Probability to Proportional to Size (PPS) of the regions.

Integrated Household Survey Income and Expenditure Poverty Assessment, 2010 Page 12
Table 2. 4 : Population Estimate for midyear 2010 and Sampling Weights for the 2010 HIS
LGA/Sub Division 2010 Population
Estimate Percent
2010 IHS
weights
Banjul 29,779 1.8 0.59
Kanifing 397,244 24.2 1.08
Brikama (WCR) 540,171 32.9 1.15
Kombo North 251,457 15.3 1.17
Other Kombos 228,412 13.9 1.08
Fonis 60,302 3.7 1.23
Mansa Konko (LRR) 77,879 4.7 1.14
Kiangs 30,483 1.8 1.18
Jarras 47,396 2.9 1.13
Kerewan (NBR) 184,404 11.2 0.79
NBR West 101,567 6.2 1.21
NBR East 82,837 5.0 0.54
CRR 210,859 12.8 0.83
Kuntaur (CRR North) 87,455 5.3 0.79
Janjanbureh (CRR South) 123,404 7.5 0.84
Basse (URR) 204,056 12.5 0.98
URR South 140,660 8.6 1.00
URR North 63,396 3.9 0.89
Total 1,644,391 100.0 1.00
The 2010 population estimates above are from the GBoS and the Ministry of Basic and Secondary
Education population projections from 2003 – 2020.
As a result of the weights, the number of households allocated by subdivision/LGA relative to the
estimated 2010 midyear population is known. The weights in Table 2.4 were used to adjust the
data in order to achieve reliable findings of the population and for accurate projections.
Banjul has been over sampled as was the case of the 2010 Multiple Indicator Cluster Survey
(MICS). Banjul is over sampled because the small size of the population and if sampling is based
on PPS, the estimates for the region will be very small.

Integrated Household Survey Income and Expenditure Poverty Assessment, 2010 Page 13
Table 2. 5 : Percentage distribution of the 2010 IHS sample population by age group and
gender Age Group Male Female Total
0-4 Count 3074 2985 6059
Percent 16.4 14.8 15.6
5-9 Count
Percent
2910 2969 5879
Percent 15.6 14.7 15.1
10-14 Count 2227 2311 4538
Percent 11.9 11.5 11.7
15-19 Count 2251 2572 4823
Percent 12.0 12.7 12.4
20-24 Count 1675 2036 3711
Percent 9.0 10.1 9.5
25-29 Count 1482 1926 3408
Percent 7.9 9.5 8.8
30-34 Count 1038 1271 2309
Percent 5.5 6.3 5.9
35-39 Count 979 1049 2028
Percent 5.2 5.2 5.2
40-44 Count 734 764 1498
Percent 3.9 3.8 3.9
45-49 Count 629 610 1239
Percent 3.4 3.0 3.2
50-54 Count 481 499 980
Percent 2.6 2.5 2.5
55-59 Count 321 276 597
Percent 1.7 1.4 1.5
60-64 Count 332 280 612
Percent 1.8 1.4 1.6
65-69 Count 214 193 407
Percent 1.1 1.0 1.0
70 and above Count 357 441 798
Percent 1.9 2.2 2.1
Total Count 18704 20182 38886
Percent 100.0 100.0 100.0

Integrated Household Survey Income and Expenditure Poverty Assessment, 2010 Page 14
Figure 1: Population Pyramid of the IHS 2010 Sampled Population
Table 2.5 shows that more than 50 percent of the sampled population is less than 20 years old. It
also shows that the sampled female population (20,182) is larger than that of the male (18,704).
With reference to the population pyramid, the age distributions of the sampled male and female
population are similar, with women having a slightly higher count in some of the age categories.
This could be as a result of the larger female population than male population. The pyramid also
shows a decrease in the number of both sexes as age increases.

Integrated Household Survey Income and Expenditure Poverty Assessment, 2010 Page 15
Table 2. 6: Percentage distribution of the listed household members by LGA/Subdivision and
gender
LGA/Sub region Male Female Total
Banjul Count 344 339 683
Percent 50.4 49.6 100.0
Kanifing Count 4,567 4,820 9,387
Percent 48.7 51.3 100.0
Kombo North Count 2,975 3,005 5,980
Percent 49.7 50.3 100.0
Other Kombos Count 2,639 2,796 5,435
Percent 48.6 51.4 100.0
Fonis Count 707 718 1,425
Percent 49.6 50.4 100.0
Mansakonko Count 865 979 1,844
Percent 46.9 53.1 100.0
NBR West Count 1,170 1,229 2,399
Percent 48.8 51.2 100.0
NBR East Count 910 1,038 1,948
Percent 46.7 53.3 100.0
Kuntaur Count 954 1,122 2,076
Percent 46.0 54.0 100.0
Janjanbureh Count 1,335 1,578 2,913
Percent 45.8 54.2 100.0
URR South Count 1,563 1,760 3,323
Percent 47.0 53.0 100.0
URR North Count 694 812 1,506
Percent 46.1 53.9 100.0
Total Count 18,723 20,196 38,919
Percent 48.1 51.9 100.0
Table 2.6 shows that the proportion of females (51.9%) is higher than that of the males (48.1%).
Brikama has the largest population of 12,840 persons followed by Kanifing with 9,387 persons.
Banjul has the smallest population of 683 persons and was the only LGA with a higher male
than female proportion. A similar pattern was observed from the 2003 census results. However,
the difference in male and female proportions is highest in Kuntaur and Janjanbureh, with 54
and 54.2 percent respectively. The proportion of the male population is 46 percent for Kuntaur
and 45.8 percent for Janjanbureh. This reflects migratory patterns as migration is both age and
sex selective

Integrated Household Survey Income and Expenditure Poverty Assessment, 2010 Page 16
Table 2. 7: Percentage distribution of head of households by LGA and gender
LGA Male Female Total
Banjul Count 186 53 239
Percent 77.8 22.2 100.0
Kanifing Count 1,007 350 1,357
Percent 74.2 25.8 100.0
Brikama Count 1,065 289 1,354
Percent 78.7 21.3 100.0
Mansakonko Count 210 30 240
Percent 87.5 12.5 100.0
Kerewan Count 560 85 645
Percent 86.8 13.2 100.0
Kuntaur Count 202 38 240
Percent 84.2 15.8 100.0
Janjanbureh Count 276 44 320
Percent 86.3 13.8 100.0
Basse Count 355 41 396
Percent 89.6 10.4 100.0
Total Count 3,861 930 4,791
Percent 80.6 19.4 100.0
Table 2.7 shows that other than Banjul, Kanifing and Brikama, more than 80 percent of household
in the other LGAs which are predominantly rural areas are headed by males. The highest
proportion of male headed households was in Basse and highest proportion of female headed
household was in Kanifing.
Integrated Household Survey Income and Expenditure Poverty Assessment, 2010 Page 17
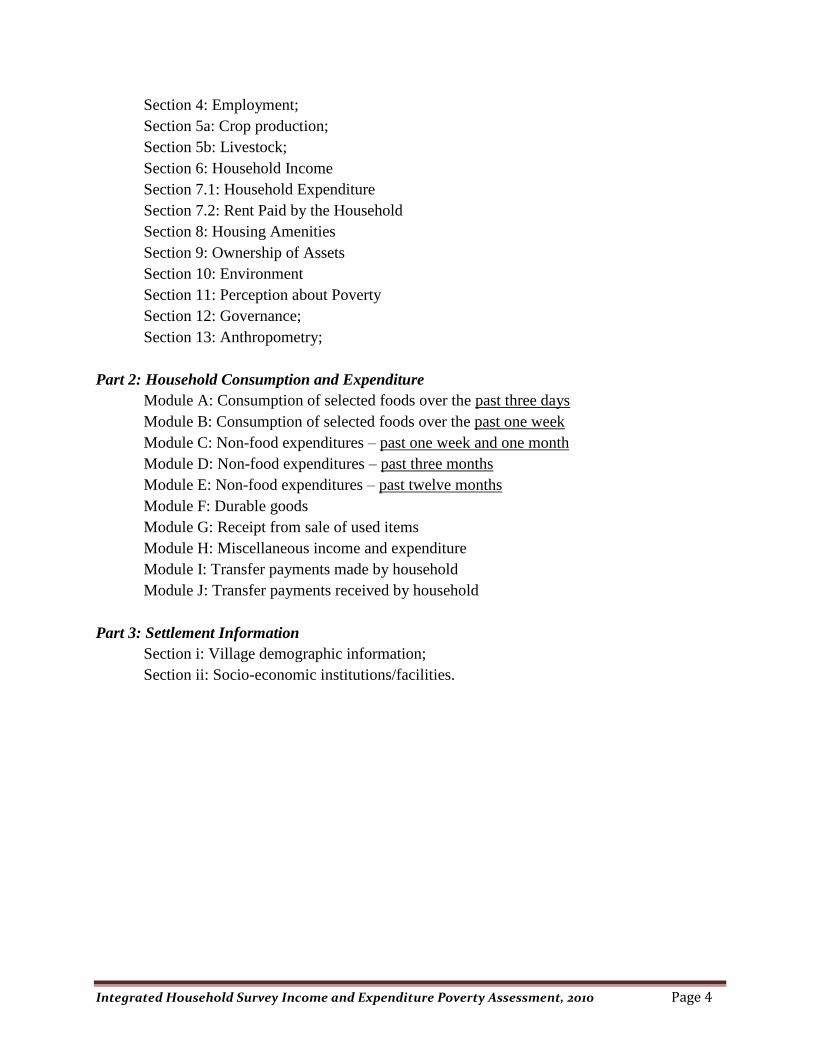
Chapter 3: Household and per capita income
It should be noted that globally in household income and expenditure surveys, households tend to
under report their income compared to their expenditure. The proportion of households earning
less than GMD10, 000 per annum are more than one third. This proportion was highest in the
Fonis with 71 per cent and lowest in Banjul with 10.7 per cent. More than half of the sampled
households‟ annual earnings were less than GMD 20,000.
Kanifing has the highest proportion of households who earns at least GMD100, 000 annually with
19.4 percent followed by Kombo North with 15.9 percent. It is important to note that Kombo
North is a district in Brikama LGA but other than Kanifing which is the second largest LGA in
The Gambia, Kombo North have the highest proportion of households earning at least GMD100,
000 or more per annum.
The predominantly rural areas had the least proportions in the higher income category, with less
than 10 percent of households earning more than GMD100, 000 per year in each of the
LGA/subdivision. It is interesting to know that none of the households in the Kiangs earn more
than GMD100, 000 per annum. Similarly only 1, 1.1 and 2 percent of households in the Jarras, the
Fonis and URR North earns more than GMD100, 000 respectively per annum. Nationally, less
than one fifth of the households earned more than GMD70, 000 annually. Janjanbureh which has
the highest poverty rates also has the highest proportion of households earning between GMD10,
000 to GMD19,999 per year.

Integrated Household Survey Income and Expenditure Poverty Assessment, 2010 Page 18
Table 3. 1: Annual Household Income by Income category and LGA/Sub division
LGA/Sub
Division
Income Category
Total
Less than
10,000
10,000-
19,999
20,000-
29,999
30,000-
39,999
40,000-
49,999
50,000-
59,999
60,000-
69,999
70,000-
79,999
80,000-
89,999
90,000-
99,999
100,000 &
more
Banjul Count 13 23 18 21 6 8 4 12 1 1 14 121
Percent 10.7 19.0 14.9 17.4 5.0 6.6 3.3 9.9 .8 .8 11.6 100.0
Kanifing Count 167 202 145 156 124 77 50 84 26 58 262 1351
Percent 12.4 15.0 10.7 11.5 9.2 5.7 3.7 6.2 1.9 4.3 19.4 100.0
Kombo
North
Count 235 73 53 73 34 35 28 36 23 22 116 728
Percent 32.3 10.0 7.3 10.0 4.7 4.8 3.8 4.9 3.2 3.0 15.9 100.0
Other
Kombos
Count 239 76 39 53 32 27 19 23 9 15 58 590
Percent 40.5 12.9 6.6 9.0 5.4 4.6 3.2 3.9 1.5 2.5 9.8 100.0
Fonis Count 137 22 15 7 2 1 4 2 1 0 2 193
Percent 71.0 11.4 7.8 3.6 1.0 .5 2.1 1.0 .5 .0 1.0 100.0
Kiangs Count 64 13 2 8 1 1 1 0 0 1 0 91
Percent 70.3 14.3 2.2 8.8 1.1 1.1 1.1 .0 .0 1.1 .0 100.0
Jarras Count 95 26 11 19 8 7 6 1 1 2 2 178
Percent 53.4 14.6 6.2 10.7 4.5 3.9 3.4 .6 .6 1.1 1.1 100.0
NBR West Count 166 64 35 21 12 8 15 1 1 1 8 332
Percent 50.0 19.3 10.5 6.3 3.6 2.4 4.5 .3 .3 .3 2.4 100.0
NBR East Count 110 30 15 6 4 6 2 4 3 1 14 195
Percent 56.4 15.4 7.7 3.1 2.1 3.1 1.0 2.1 1.5 .5 7.2 100.0
Kuntaur Count 97 30 11 11 7 7 3 3 1 1 6 177
Percent 54.8 16.9 6.2 6.2 4.0 4.0 1.7 1.7 .6 .6 3.4 100.0
Janjanbureh Count 130 55 24 18 10 8 3 6 2 4 7 267
Percent 48.7 20.6 9.0 6.7 3.7 3.0 1.1 2.2 .7 1.5 2.6 100.0
URR South Count 103 51 27 24 21 16 10 8 3 6 23 292
Percent 35.3 17.5 9.2 8.2 7.2 5.5 3.4 2.7 1.0 2.1 7.9 100.0
URR North Count 55 19 6 2 1 2 1 0 1 1 2 90
Percent 61.1 21.1 6.7 2.2 1.1 2.2 1.1 .0 1.1 1.1 2.2 100.0
Total Count 1611 684 401 419 262 203 146 180 72 113 514 4605
Percent 35.0 14.9 8.7 9.1 5.7 4.4 3.2 3.9 1.6 2.5 11.2 100.0

Integrated Household Survey Income and Expenditure Poverty Assessment, 2010 Page 19
Table 3. 2 : Mean Per Capita Household Income by LGA/Subdivision and gender
LGA/Sub Division Gender Mean N
Std. Error of
Mean
Banjul Male 22,408 101 4,784
Female 14,881 27 3,702
Total 20,847 128 3,872
Kanifing Male 23,027 1,001 982
Female 21,607 350 1,687
Total 22,659 1,351 848
Kombo North Male 22,161 559 1,349
Female 16,558 145 1,156
Total 21,007 704 1,100
Other Kombos Male 16,198 465 1,940
Female 9,415 148 684
Total 14,562 613 1,485
Fonis Male 8,003 166 760
Female 5,595 27 808
Total 7,666 193 665
Kiangs Male 5,896 80 847
Female 3,048 12 761
Total 5,530 92 751
Jarras Male 10,711 156 1,334
Female 7,991 21 1,490
Total 10,382 177 1,187
NBR West Male 8,147 292 708
Female 10,994 42 2,114
Total 8,508 334 674
NBR East Male 9,562 168 1,656
Female 10,918 26 6,124
Total 9,746 195 1,648
Kuntaur Male 7,447 150 1,354
Female 14,049 28 4,077
Total 8,499 179 1,318
Janjanbureh Male 8,500 231 789
Female 10,949 37 2,013
Total 8,838 268 735
URR South Male 12,622 260 1,071
Female 11,840 33 1,674
Total 12,534 293 968
URR North Male 4,566 82 594
Female 2,511 6 695
Total 4,420 88 556
Total Male 16,015 3,713 473
Female 15,582 903 766
Total 15,930 4,616 409

Integrated Household Survey Income and Expenditure Poverty Assessment, 2010 Page 20
Mean Per Capita Household
Table 3.2 shows the average per capita household income in the various LGAs/subdivisions. Households
in the urban areas like Banjul, Kanifing and Kombo North and other Kombos had the highest means of
GMD20,847, GMD22,659, GMD21,007 and GMD14,562 respectively. URR North households had the
lowest mean income of GMD4,420, whereas households in URR South had the highest mean per capita
of GMD12,534 among all the subdivisions in the predominantly rural areas.
Analysis of the data by gender shows that, overall, the average per capita household income by male-
headed households (GMD16,015) is higher compared to female headed households (GMD15,582). In
four out of the 11 LGA/sub-divisions namely NBR East, Kuntaur, Janjanbureh and URR South, the
average per capita household income is higher for female-headed households. In Kuntaur in particular,
the average per capita household income of female-headed households (GMD14,049) doubles that of
male-headed households (GMD7,447).

Integrated Household Survey Income and Expenditure Poverty Assessment, 2010 Page 21
Table 3. 3 : Annual per capita by income category by LGA/Sub division
LGA/Sub Division
Income Category Per Capita
Total
Less than
10,000
10,000-
19,999
20,000-
29,999
30,000-
39,999
40,000-
49,999
50,000-
59,999
60,000-
69,999
70,000-
79,999
80,000-
89,999
90,000-
99,999
100,000 &
more
Banjul Count 106 47 30 13 5 2 2 6 0 1 5 217 Percent 48.8 21.7 13.8 6.0 2.3 .9 .9 2.8 .0 .5 2.3 100.0
Kanifing Count 433 382 182 92 52 22 19 20 11 8 31 1252
Percent 34.6 30.5 14.5 7.3 4.2 1.8 1.5 1.6 .9 .6 2.5 100.0
Kombo North Count 218 199 74 50 17 11 8 5 1 4 15 602 Percent 36.2 33.1 12.3 8.3 2.8 1.8 1.3 .8 .2 .7 2.5 100.0
Other
Kombos
Count 350 137 33 22 8 3 0 6 0 1 8 568
Percent 61.6 24.1 5.8 3.9 1.4 .5 .0 1.1 .0 .2 1.4 100.0 Fonis Count 124 20 6 4 2 1 0 0 0 0 0 157
Percent 79.0 12.7 3.8 2.5 1.3 .6 .0 .0 .0 .0 .0 100.0
Mansa Konko Count 169 44 8 8 3 1 1 0 0 0 1 235
Percent 71.9 18.7 3.4 3.4 1.3 .4 .4 .0 .0 .0 .4 100.0 NBR West Count 210 46 11 1 2 1 2 1 1 0 1 276
Percent 76.1 16.7 4.0 .4 .7 .4 .7 .4 .4 .0 .4 100.0 NBR East Count 275 47 22 5 3 1 3 0 0 2 3 361
Percent 76.2 13.0 6.1 1.4 .8 .3 .8 .0 .0 .6 .8 100.0 Kuntaur Count 182 25 7 4 1 2 0 2 0 2 1 226
Percent 80.5 11.1 3.1 1.8 .4 .9 .0 .9 .0 .9 .4 100.0
Janjanbureh Count 241 39 17 10 4 6 0 1 1 0 0 319
Percent 75.5 12.2 5.3 3.1 1.3 1.9 .0 .3 .3 .0 .0 100.0 URR South Count 176 72 18 8 8 4 2 1 0 0 4 293
Percent 60.1 24.6 6.1 2.7 2.7 1.4 .7 .3 .0 .0 1.4 100.0
URR North Count 89 8 1 1 0 0 0 0 0 0 0 99
Percent 89.9 8.1 1.0 1.0 .0 .0 .0 .0 .0 .0 .0 100.0
Urban Count 1,118 818 348 183 94 44 31 36 11 15 63 2,761
Percent 40.5 29.6 12.6 6.6 3.4 1.6 1.1 1.3 .4 .5 2.3 100.0
Rural Count 1,455 248 61 35 11 10 6 6 3 3 6 1,844
Percent 78.9 13.4 3.3 1.9 .6 .5 .3 .3 .2 .2 .3 100.0
Total Count 2,573 1,066 409 218 105 54 37 42 14 18 69 4,605
Percent 55.9 23.1 8.9 4.7 2.3 1.2 .8 .9 .3 .4 1.5 100.0

Integrated Household Survey Income and Expenditure Poverty Assessment, 2010 Page 22
The national average shows that more than 50 percent of the total sampled population earned less than
GMD 10,000 and less than 2 percent earned GMD 100,000 or more. These tables also show that less
than one tenth of the population earned more than GMD 40,000 annually. In Banjul, Kanifing and
Kombo North which are entirely urban settlements more than one third of the sampled population
earned less than GMD 10,000 per annum. On the other hand, more than two thirds of the sampled
population of the predominantly rural settlements earned less than GMD 10,000 per annum except for
the URR South population.

Integrated Household Survey - Income and Expenditure Poverty Assessment, 2010 Page 23
Chapter 4: Household consumption
Table 4. 1: Consumption of selected Foods over the ‘Past Three Days’, which was not purchased
Item code
What was the main
source of the food? Sum Mean N
Std. Error
of Mean
Estimated
Annual
Consumption
Long-grained rice
(Imported)
Gift 1,168 64.9 18 11 142,107
Total 1,168 64.9 18 11 142,107
Paddy rice long grain
(Local)
Own production 44,537 118.8 375 5 5,418,668
Barter 159 79.5 2 56 19,345
Gift 2,727 66.5 41 24 331,785
Total 47,423 113.5 418 5 5,769,798
Medium-grained rice
(imported)
Wage-in-kind 162 162.0 1 . 19,710
Gift 690 49.3 14 11 83,950
Total 852 54.6 15 12 103,660
Small grained rice
(imported)
Barter 86 43.0 2 13 10,463
Wage-in-kind 30 30.0 1 . 3,650
Gift 6,692 223.1 30 110 814,193
Total 6,808 202.9 34 98 828,307
Basmati Rice
(imported)
Gift 860 430.0 2 370 104,633
Other 300 300.0 1 . 36,500
Total 1,160 386.7 3 95 141,133
Millet (Coos) Own production 56,073 91.5 613 4 6,822,215
Barter 315 105.0 3 53 38,325
Gift 2,565 51.3 50 6 312,075
Total 58,953 88.4 667 3 7,172,615
Maize Own production 15,616 83.5 187 8 1,899,947
Barter 10 10.0 1 . 1,217
Gift 1,045 45.4 23 11 127,142
Total 16,743 79.0 212 7 2,037,065
Sorghum Own production 9,250 126.7 73 20 1,125,417
Gift 659 109.8 6 36 80,178
Total 9,909 125.4 79 18 1,205,595
Bread Own production 1,449 65.9 22 14 176,295
Wage-in-kind 58 29.0 2 11 7,057
Gift 1,177 19.6 60 2 143,202
Total 2,684 32.0 84 4 326,553
Chicken Own production 5,975 145.7 41 14 726,958
Barter 70 70.0 1 . 8,517
Gift 1,352 122.9 11 32 164,493
Total 7,397 139.6 53 13 899,968
Fresh Bonga
Own production 962 60.1 16 15 117,043
Barter 10 10.0 1 . 1,217
Wage-in-kind 115 57.5 2 33 13,992
Gift 622 12.7 49 2 75,677
Total 2,759 40.0 69 16 335,678
Smoked Bonga Own production 45 22.5 2 3 5,475
Barter 10 10.0 1 . 1,217
Gift 167 7.3 23 1 20,318
Total 222 8.5 26 1 27,010
Cat Fish
Own production 845 65.0 13 11 102,808
Gift 220 44.0 5 15 26,767

Integrated Household Survey - Income and Expenditure Poverty Assessment, 2010 Page 24
Item code
What was the main
source of the food? Sum Mean N
Std. Error
of Mean
Estimated
Annual
Consumption Total 1,065 59.2 18 9 129,575
Dried fish Own production 158 79.0 2 71 19,223
Gift 146 9.1 16 3 17,763
Total 304 16.9 18 8 36,987
Eggs Own production 176 19.6 9 3 21,413
Gift 234 26.0 9 16 28,470
Total 410 22.8 18 8 49,883
Fresh Milk Own production 3,284 57.6 57 8 399,553
Barter 30 30.0 1 . 3,650
Wage-in-kind 15 15.0 1 . 1,825
Gift 824 35.8 23 6 100,253
Total 4,153 50.6 82 6 505,282
Sour Milk
Own production 986 34.0 29 3 119,963
Wage-in-kind 30 30.0 1 . 3,650
Gift 908 50.4 18 18 110,473
Total 1,924 40.1 48 7 234,087
Powdered Milk Gift 25 8.3 3 2 3,042
Total 25 8.3 3 2 3,042
Palm oil Own production 40 20.0 2 10 4,867
Wage-in-kind 24 24.0 1 . 2,920
Gift 147 21.0 7 3 17,885
Total 211 21.1 10 3 25,672
Margarine Gift 25 25.0 1 . 3,042
Total 25 25.0 1 . 3,042
Vegetable oil Own production 166 83.0 2 67 20,197
Wage-in-kind 45 45.0 1 . 5,475
Gift 684 36.0 19 12 83,220
Total 895 40.7 22 12 108,892
Mayonnaise Own production 95 31.7 3 7 11,558
Gift 623 155.8 4 148 75,798
Total 718 102.6 7 83 87,357
Peanut butter Own production 20,879 41.0 509 2 2,540,278
Barter 370 92.5 4 35 45,017
Gift 1,351 34.6 39 13 164,372
Other 80 20.0 4 4 9,733
Total 22,680 40.8 556 2 2,759,400
Groundnuts-
Unshelled
Own production 9,475 32.9 288 2 1,152,792
Wage-in-kind 90 45.0 2 15 10,950
Gift 1,986 45.1 44 17 241,630
Other 56 56.0 1 . 6,813
Total 11,607 34.6 335 3 1,412,185
Groundnuts-Shelled Own production 8,534 33.6 254 3 1,038,303
Wage-in-kind 22 11.0 2 1 2,677
Gift 1,033 26.5 39 5 125,682
Other 35 8.8 4 2 4,258
Total 9,624 32.2 299 2 1,170,920
Kola Nuts Own production 36 9.0 4 3 4,380
Gift 1,141 9.8 116 1 138,822
Total 1,177 9.8 120 1 143,202
Oranges Own production 305 30.5 10 11 37,108

Integrated Household Survey - Income and Expenditure Poverty Assessment, 2010 Page 25
Item code
What was the main
source of the food? Sum Mean N
Std. Error
of Mean
Estimated
Annual
Consumption
Potatoes (Irish)
Wage-in-kind 30 30.0 1 . 3,650
Gift 333 11.1 30 3 40,515
Total 668 16.3 41 4 81,273
Gift 77 19.3 4 4 9,368
Total 77 19.3 4 4 9,368
Potatoes(sweet) Own production 467 46.7 10 18 56,818
Wage-in-kind 30 30.0 1 . 3,650
Gift 174 21.8 8 8 21,170
Total 671 35.3 19 10 81,638
Cassava Own production 1,076 32.6 33 5 130,913
Gift 1,069 34.5 31 16 130,062
Total 2,145 33.5 64 8 260,975
Tomatoes-fresh Own production 1,461 25.6 57 3 177,755
Wage-in-kind 6 6.0 1 . 730
Gift 343 14.3 24 3 41,732
Total 1,810 22.1 82 2 220,217
Bitter Tomato Own production 2,725 22.0 124 2 331,542
Wage-in-kind 18 18.0 1 . 2,190
Gift 3,637 71.3 51 61 442,502
Total 6,380 36.3 176 18 776,233
Garden eggs Own production 1,997 18.2 110 3 242,968
Barter 6 6.0 1 . 730
Wage-in-kind 12 12.0 1 . 1,460
Gift 254 7.9 32 1 30,903
Total 2,269 15.8 144 2 276,062
Okra Own production 3,915 26.6 147 4 476,325
Gift 254 11.5 22 2 30,903
Total 4,169 24.7 169 4 507,228
Onion Own production 1,774 20.9 85 2 215,837
Wage-in-kind 20 20.0 1 . 2,433
Gift 654 15.2 43 2 79,570
Total 2,448 19.0 129 1 297,840
Pumpkin Own production 583 34.3 17 10 70,932
Gift 235 26.1 9 14 28,592
Total 818 31.5 26 8 99,523
Big Red Pepper Own production 613 11.1 55 1 74,582
Wage-in-kind 3 3.0 1 . 365
Gift 181 5.7 32 1 22,022
Total 797 9.1 88 1 96,968
Kren-Kren Own production 329 10.6 31 2 40,028
Gift 31 6.2 5 2 3,772
Other 10 10.0 1 . 1,217
Total 370 10.0 37 1 45,017
Bisap Own production 977 7.2 136 1 118,868
Gift 90 5.3 17 1 10,950
Other 139 5.3 26 1 16,912
Total 1,206 6.7 179 0 146,730
Cabbage Own production 306 11.8 26 1 37,230
Gift 182 14.0 13 7 22,143
Total 493 12.3 40 2 59,982

Integrated Household Survey - Income and Expenditure Poverty Assessment, 2010 Page 26
Item code
What was the main
source of the food? Sum Mean N
Std. Error
of Mean
Estimated
Annual
Consumption
Tomato puree(paste) Own production 49 16.3 3 10 5,962
Barter 5 5.0 1 . 608
Wage-in-kind 44 22.0 2 8 5,353
Gift 109 9.1 12 2 13,262
Other 5 5.0 1 . 608
Total 212 11.2 19 2 25,793
Green Leaves Own production 618 13.4 46 2 75,190
Barter 2 2.0 1 . 243
Wage-in-kind 20 20.0 1 . 2,433
Gift 151 11.6 13 2 18,372
Other 4 4.0 1 . 487
Total 795 12.8 62 1 96,725
Sugar Barter 7 7.0 1 . 852
Wage-in-kind 49 24.5 2 4 5,962
Gift 1,900 22.6 84 8 231,167
Other 25 12.5 2 4 3,042
Total 1,981 67 89 15 241,022
Black mint Gift 63 2.4 26 1 7,665
Other 1 1.0 1 . 122
Total 71 2.4 29 0 7,786
Salt Own production 62 2.8 22 0 7,543
Barter 10 2.0 5 0 1,217
Gift 168 3.7 45 1 20,440
Other 50 50.0 1 . 6,083
Total 290 4.0 73 1 35,283
Garlic Gift 17 2.4 7 0 2,068
Total 17 2.4 7 0 2,068
Maggi cube Barter 2 2.0 1 . 243
Gift 123 9.5 13 3 14,965
Other 3 3.0 1 . 365
Total 128 9.3 15 3 15,573
Small dry pepper Own production 410 6.7 61 1 49,883
Gift 61 8.7 7 3 7,422
Total 471 6.9 68 1 57,305
Locust
beans(Neteetu)
Own production 85 17.0 5 10 10,342
Wage-in-kind 30 30.0 1 . 3,650
Gift 35 5.0 7 2 4,258
Total 150 11.5 13 4 18,250
Chilli powder(black
pepper)
Own production 1 1.0 1 . 122
Gift 17 5.7 3 1 2,068
Other 5 5.0 1 . 608
Total 23 4.6 5 1 2,798
Powder Pepper Own production 25 5.0 5 1 3,042
Gift 125 125.0 1 . 15,208
Total 150 25.0 6 20 18,250
Tea bags Barter 15 15.0 1 . 1,825
Wage-in-kind 156 78.0 2 72 18,980
Gift 92 7.7 12 4 11,193
Total 263 16.6 15 9 31,199
Chinese Green Barter 6 3.0 2 0 730

Integrated Household Survey - Income and Expenditure Poverty Assessment, 2010 Page 27
Item code
What was the main
source of the food? Sum Mean N
Std. Error
of Mean
Estimated
Annual
Consumption
Tea(20)(Ataya) Wage-in-kind 3 3.0 1 . 365
Gift 1,271 10.3 123 2 154,638
Total 1,280 10.2 126 2 155,733
Mineral water Wage-in-kind 10 10.0 1 . 1,217
Gift 104 52.0 2 48 12,653
Total 114 38.0 3 31 13,870
Cow meat Own production 1,025 146.4 7 32 124,708
Barter 70 70.0 1 . 8,517
Wage-in-kind 225 112.5 2 88 27,375
Gift 3,376 116.4 29 16 410,747
Total 4,696 120.4 39 14 571,347
Sheep/Goat Meat Own production 1,050 175.0 6 59 127,750
Gift 1,675 119.6 14 27 203,792
Total 2,725 136.3 20 26 331,542
Total Own production 198,434 56.8 3498 1 24,142,803
Barter 1,183 39.4 30 10 143,932
Wage-in-kind 1,247 37.8 33 8 151,718
Gift 45,872 33.0 1389 4 5,581,093
Other 713 15.8 45 7 86,748
Total 247,449 49.8 4995 1 30,106,295
The estimated annual household consumption of selected food items, that the 2010 IHS sampled
households did not purchase but received as a gift or produce by the households was GMD 30.1
million, which on average is GMD6,283 per household. The „own produced‟ items and gifts
constituted 80 and 18.5 percent of the GMD 30.1 million respectively. Barter, wage-in-kind, and
other sources of food accounted for the remaining proportions.
The Module A consumption data was included in Module B reporting of selected foods over the „past
one week‟.

Integrated Household Survey - Income and Expenditure Poverty Assessment, 2010 Page 28
Table 4. 2: National: Urban & Rural Households Consumption Report Combined Item
Code
ITEM NAME N Sum Yearly
Expenditure
Yly Exp Per
Household
1 FOOD AND NON-ALCOHOLIC BEVERAGESa
1.1.1 Rice 4292 963,735 50,114,245 10,460
1.1.1 Maize 298 12,069 627,578 131
1.1.1 Millet 704 28,268 1,469,939 307
1.1.1 Sorghum 96 6,750 351,016 73
1.1.1 Findi 46 4,993 259,652 54
1.1.1 Bread 3949 347,342 18,061,773 3,770
1.1.1 Maize flour 88 3,913 203,480 42
1.1.1 Millet flour 81 2,623 136,416 28
1.1.1 Sorghum flour 64 2,526 131,355 27
1.1.2 Beef 1772 269,199 13,998,368 2,922
1.1.2 Sheep/Goat meat (mutton) 309 54,711 2,844,966 594
1.1.2 Chicken 944 77,566 4,033,421 842
1.1.2 Pork 18 1,128 58,669 12
1.1.2 Canned meat 450 26,393 1,372,432 286
1.1.3 Fresh Bonga 3834 179,335 9,325,412 1,946
1.1.3 Smoked Bonga 2909 52,202 2,714,489 567
1.1.3 Cat Fish 1061 52,856 2,748,492 574
1.1.3 Fresh Grouper/Ladyfish 1508 114,832 5,971,266 1,246
1.1.3 Fresh Baracuda 265 19,131 994,795 208
1.1.3 Dried Couta/Tenny 164 2,714 141,123 29
1.1.3 Oyster 107 4,722 245,567 51
1.1 .3 Dried fish 2183 25,529 1,327,522 277
1.1.3 Shrimps 131 12,381 643,808 134
1.1.3 Snail fish 731 4,530 235,545 49
1.1.3 Saul fish 60 2,350 122,207 26
1.1.3 Tilapia 692 30,585 1,590,403 332
1.1.3 Crab 83 1,885 98,041 20
1.1.3 Tin Fish (Sardines) 631 20,806 1,081,924 226
1.1.4 Eggs 1668 51,542 2,680,193 559
1.1.4 Fresh Milk 558 21,133 1,098,911 229
1.1.4 Sour Milk 1085 40,254 2,093,188 437
1.1.4 Evaporated Milk 1690 62,360 3,242,731 677
1.1.4 Powdered Milk 482 22,142 1,151,407 240
1.1.4 Cream 91 2,743 142,656 30
1.1.4 Cheese 33 1,832 95,265 20
1.1.4 Yoghurt 49 2,258 117,398 25
1.1.4 Vitalait 40,461 2,103,993 439
1.1.5 Groundnut oil 20,183 1,049,534 219
1.1.5 Palm oil 160,632 8,352,839 1,743

Integrated Household Survey - Income and Expenditure Poverty Assessment, 2010 Page 29
Item
Code
ITEM NAME N Sum Yearly
Expenditure
Yly Exp Per
Household
1.1.5 Margarine 6,625 344,525 72
1.1.5 Butter 38,565 2,005,386 419
1.1.5 Vegetable oil 185,664 9,654,512 2,015
1.1.5 Mayonnaise 46,525 2,419,275 505
1.1.5 Palm Kernels oil 2,759 143,445 30
1.1.5 Peanut butter 51,763 2,691,695 562
1.1.6 Coco nuts 6,391 332,351 69
1.1.6 Banana 31,446 1,635,171 341
1.1.6 Oranges 14,598 759,115 158
1.1.6 Mangoes 14,053 730,781 153
1.1.6 Lime 6,815 354,385 74
1.1.6 Apple 9,233 480,122 100
1.1.6 Baobab fruit 7,050 366,579 77
1.1.6 Palm nut (fruit kernels) 1,864 96,932 20
1.1.6 Daharr 6,538 339,954 71
1.1.6 Cashew 444 23,063 5
1.1.6 Paw – paw 2,907 151,161 32
1.1.6 Water melon 5,932 308,442 64
1.1.6 Ananas 375 19,507 4
1.1.6 Grapes 2,217 115,268 24
1.1.6 Cabaa 3,103 161,347 34
1.1.6 Avocado 202 10,488 2
1.1.6 Groundnuts_Unshelled 3677366 3677366 768
1.1.6 Groundnuts_Shelled 2722349 2722349 568
1.1.6 Kolanuts 1,169,073 1,169,073 244
1.1.6 Plum (Saloum Plum) 645 33,526 7
1.1.7 Potatoes(Irish) 64,903 3,374,967 704
1.1.7 Potatoes(sweet) 22,877 1,189,603 248
1.1.7 Cassava 44,214 2,299,128 480
1.1.7 Dry Beans 16,390 852,260 178
1.1.7 Small Pepper-fresh 26,494 1,377,702 288
1.1.7 Tomatoes-fresh 61,439 3,194,851 667
1.1.7 Bitter Tomato 49,882 2,593,883 541
1.1.7 Garden eggs 30,722 1,597,544 333
1.1.7 Okra 41,548 2,160,497 451
1.1.7 Onion 174,075 9,051,911 1,889
1.1.7 Pumpkin 6,525 339,301 71
1.1.7 Big Red Pepper 63,945 3,325,122 694
1.1.7 Kren-Kren 10,694 556,111 116
1.1.7 Bisap 18,531 963,586 201
1.1.7 Cabbage 25,559 1,329,057 277
1.1.7 Lettuce(salad) 8,708 452,824 95

Integrated Household Survey - Income and Expenditure Poverty Assessment, 2010 Page 30
Item
Code
ITEM NAME N Sum Yearly
Expenditure
Yly Exp Per
Household
1.1.7 Tomato puree(paste) 99,118 5,154,137 1,076
1.1.7 Carrot 9,549 496,545 104
1.1.7 Cucumber 5,310 276,097 58
1.1.7 Onion Leaves 9,730 505,983 106
1.1.7 Green peas 1,080 56,167 12
1.1.7 Okra Powder 2,637 137,102 29
1.1.7 Green Leaves 12,545 652,352 136
1.1.8 Sugar 386,503 20,098,134 4,195
1.1.8 Black mint 6,357 330,581 69
1.1.8 Chewing gum 7,026 365,353 76
1.1.8 Honey 8,809 458,092 96
1.1.8 Jam 802 41,679 9
1.1.8 Chocolate 3,453 179,533 37
1.1.8 Ice cream 7,525 391,289 82
1.1.8 Mint stick 11,930 620,369 129
1.1.9 Salt 25,821 1,342,710 280
1.1.9 Garlic 14,317 744,476 155
1.1.9 Maggi tube 86,373 4,491,394 937
1.1.9 Small dry pepper 8,582 446,276 93
1.1.9 Locust beans(Neteetu) 13,880 721,741 151
1.1.9 Chilli powder(black pepper) 24,002 1,248,089 261
1.1.9 Vinegar 6,853 356,336 74
1.1.9 Powder Pepper 2,310 120,136 25
1.2 Non-alcoholic Beverages 8392079 8392079 1,752
Group 1 total 53,447
2
2.1 Alcoholic Beverages 4793 559838 117
2.2.0 Cigarette or other tobaccoa 1135 3,123,918 652
Group 2 total 769
3
3.1.1 Cloth, thread, other sewing material 685 1,212,954 253
3.1.1 Infant Clothing 1089 1,034,263 216
3.1.1 Boy‟s other clothing 1104 1,519,638 317
3.1.1 Men‟s other clothing 874 1,585,157 331
3.1.1 Girl‟s other clothing 1459 2,561,605 535
3.1.1 Uniforms and sports clothes 1150 1,881,442 393
3.1.1 Lady‟s other clothing 2005 5,733,948 1,197
3.1.2 Baby nappies/diapers 844 561,589 117
3.1.2 Boy‟s trousers 1537 1,468,622 307
3.1.2 Boy‟s shirts 1530 1,082,528 226
3.1.2 Boy‟s jackets 96 54,900 11
3.1.2 Boy‟s undergarments 692 164,479 34

Integrated Household Survey - Income and Expenditure Poverty Assessment, 2010 Page 31
Item
Code
ITEM NAME N Sum Yearly
Expenditure
Yly Exp Per
Household
3.1.2 Men‟s trouser 875 806,457 168
3.1.2 Men‟s shirts 801 583,080 122
3.1.2 Men‟s jackets 49 29,622 6
3.1.2 Men‟s undergarments 411 129,668 27
3.1.2 Girl‟s blouse/shirt 891 799,950 167
3.1.2 Girl‟s dress/skirt 1036 1,100,878 230
3.1.2 Girl‟s undergarments 894 251,681 53
3.1.2 Lady‟s blouse/shirt 546 669,909 140
3.1.2 Lady‟s dress/skirt 604 1,011,883 211
3.1.2 Lady‟s undergarments 674 324,473 68
3.1.3 Tailoring charges 1966 12,794,170 2,670
3.1.4 Laundry, dry cleaning, tailoring fees 2408 6,946,152 1,450
3.2.1 Boy‟s shoes 2414 1,724,692 360
3.2.1 Men‟s shoes 1741 1,029,993 215
3.2.1 Girl‟s shoes 2572 1,622,864 339
3.2.1 Lady‟s shoes 2866 1,861,995 389
Group 3 total 10,551
4
4.3.0 Repairs and Maintenance to dwellingb
126 2,364,023 493
4.3.1 Paint, puttyc
93 226,889 47
4.3.1 Building items – cement, bricks,
timber, iron sheets, tools, etc d
528 3,259,970 680
4.3.1 Wood poles d 13 8,175 2
4.3.1 Grass for thatching roof d 36 15,205 3
4.5.1 Electricity (Cash power)a
948 9,624,923 2,009
4.5.2 Paraffin or Kerosene a
50 119,919 25
4.5.4 Charcoal a
2435 7,333,710 1,531
4.5.4 Firewood a
1847 8,873,829 1,852
Rent paid d
4783 12,172,864 2,541
Imputed Rent 4783 6,252,284 1,305
Group 4 total 10,489
5
5.1.1 Light bulbs b
204,237 43
5.1.1 Paraffin lamp (hurricane or pressure) c
6,788 1
5.1.1 Bulbs, Plugs, Wire c
148,566 31
5.1.1 Mattress d
987,177 206
5.1.1 Bed d
4,780,083 998
5.1.1 Table d
572,365 119
5.1.1 Chair d
2,972,716 620
5.1.1 Upholstered chair, sofa set d
105,400 22
5.1.1 Coffee table (for sitting room) d
6,960 1
5.1.1 Cupboard, drawers, bureau d
74,000 15
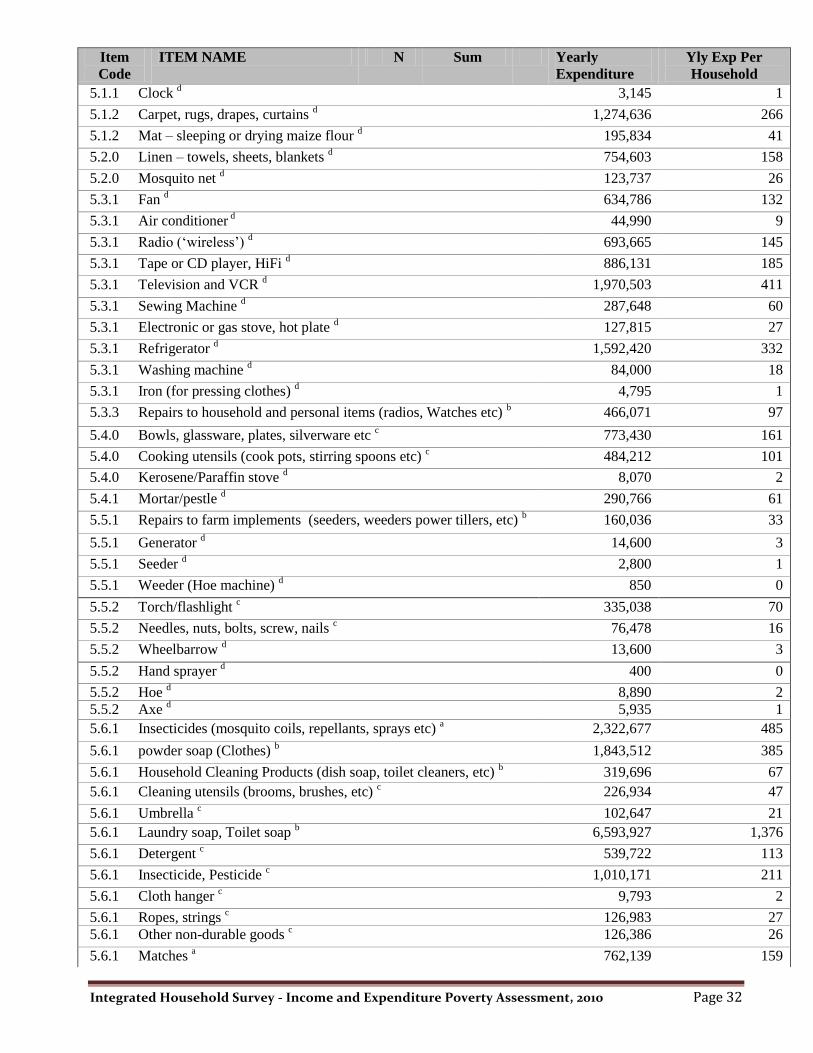
Integrated Household Survey - Income and Expenditure Poverty Assessment, 2010 Page 32
Item
Code
ITEM NAME N Sum Yearly
Expenditure
Yly Exp Per
Household
5.1.1 Clock d
3,145 1
5.1.2 Carpet, rugs, drapes, curtains d
1,274,636 266
5.1.2 Mat – sleeping or drying maize flour d
195,834 41
5.2.0 Linen – towels, sheets, blankets d
754,603 158
5.2.0 Mosquito net d
123,737 26
5.3.1 Fan d
634,786 132
5.3.1 Air conditioner d 44,990 9
5.3.1 Radio („wireless‟) d 693,665 145
5.3.1 Tape or CD player, HiFi d 886,131 185
5.3.1 Television and VCR d 1,970,503 411
5.3.1 Sewing Machine d 287,648 60
5.3.1 Electronic or gas stove, hot plate d
127,815 27
5.3.1 Refrigerator d 1,592,420 332
5.3.1 Washing machine d 84,000 18
5.3.1 Iron (for pressing clothes) d 4,795 1
5.3.3 Repairs to household and personal items (radios, Watches etc) b
466,071 97
5.4.0 Bowls, glassware, plates, silverware etc c
773,430 161
5.4.0 Cooking utensils (cook pots, stirring spoons etc) c 484,212 101
5.4.0 Kerosene/Paraffin stove d 8,070 2
5.4.1 Mortar/pestle d 290,766 61
5.5.1 Repairs to farm implements (seeders, weeders power tillers, etc) b
160,036 33
5.5.1 Generator d 14,600 3
5.5.1 Seeder d 2,800 1
5.5.1 Weeder (Hoe machine) d 850 0
5.5.2 Torch/flashlight c
335,038 70
5.5.2 Needles, nuts, bolts, screw, nails c
76,478 16
5.5.2 Wheelbarrow d
13,600 3
5.5.2 Hand sprayer d
400 0
5.5.2 Hoe d
8,890 2
5.5.2 Axe d 5,935 1
5.6.1 Insecticides (mosquito coils, repellants, sprays etc) a
2,322,677 485
5.6.1 powder soap (Clothes) b
1,843,512 385
5.6.1 Household Cleaning Products (dish soap, toilet cleaners, etc) b
319,696 67
5.6.1 Cleaning utensils (brooms, brushes, etc) c
226,934 47
5.6.1 Umbrella c 102,647 21
5.6.1 Laundry soap, Toilet soap b 6,593,927 1,376
5.6.1 Detergent c 539,722 113
5.6.1 Insecticide, Pesticide c 1,010,171 211
5.6.1 Cloth hanger c 9,793 2
5.6.1 Ropes, strings c 126,983 27
5.6.1 Other non-durable goods c 126,386 26
5.6.1 Matches a 762,139 159

Integrated Household Survey - Income and Expenditure Poverty Assessment, 2010 Page 33
Item
Code
ITEM NAME N Sum Yearly
Expenditure
Yly Exp Per
Household
5.6.2 Wages paid to servants b 2,033,965 425
5.6.2 House decorations c 144,153 30
5.6.2 Maids, Cooks, Cleaners, Gardeners, Security Guards c 1,779,610 371
5.6.2 Plumbing and repairs and other services c 119,565 25
5.6.2 Hire of furniture and furnishings c 328,691 69
5.6.2 Other services c 35,810 7
Group 5 total 8,266
6 HEALTH c
6.1.1 Headache/Pain killer medicine 493,415 103
6.1.1 Cough medicine 305,215 64
6.1.1 Mentholatum 67,346 14
6.1.1 Worm medicine 21,045 4
6.1.1 Laxative 18,340 4
6.1.1 Tetracycline/antibiotics 409,622 85
6.1.1 Malaria pill 190,697 40
6.1.1 Injections 252,698 53
6.1.1 Other medicine 996,644 208
6.1.1 Others 21,081 4
6.2.1 Doctor fees/Druggist fees 812,477 170
6.2.1 Traditional/herbal practitioners 333,119 70
6.2.1 Hospital surgery/accommodation 124,496 26
6.2.1 Out Patient fees 82,346 17
6.2.1 Ambulance fees and others 8,707 2
6.2.2 Dental fees 68,026 14
Group 6 total 878
7 TRANSPORT
7.1.1 Car c 10,854,370 2,266
7.1.1 Public Transport – bus fare and taxi fare a 27,694,979 5,781
7.1.2 Motorcycle/scooter d 1,779,850 371
7.1.3 Bicycle d 975,015 204
7.1.4 Donkey Cart d 11,000 2
7.2.1 Old tyres/tubes/parts c 448,036 94
7.2.2 Petrol or Diesel b 7,212,611 1,505
7.2.3 Motor vehicle service, repair, or parts b 3,945,175 823
7.2.3 Bicycles service, repairs, or parts b 703,278 147
7.3.2 Inland water transport c 259,566 54
7.3.2 Car/motor cycle/bicycle/boat etc. c 1,037,975 217
7.3.2 Transport to and from school c 2,760,886 576
7.3.3 Air transport c 2,678,411 559
7.3.4 Ocean transport c 32,438 7
7.3.4 Boat or cane c 6,900 1
7.3.6 Other transport c 47,525 10
Group 7 total 12,617

Integrated Household Survey - Income and Expenditure Poverty Assessment, 2010 Page 34
Item
Code
ITEM NAME N Sum Yearly
Expenditure
Yly Exp Per
Household
8 COMMUNICATION
8.1.0 Postage stamps or other postal fees b 297,318 62
8.2.0 Mobile telephone d 8,979,720 1,874
8.3.0 Mobile communication a 22,074,332 4,607
8.3.0 Other communication services a 425,911 89
8.3.0 Fixed telephone line d 90,610 19
Group 8 total 6,652
9
9.1.2 Film, film processing, camera d 74,992 74,992 16
9.1.3 Computer d 1,243,330 1,243,330 260
9.1.4 Cassette/DVD rental a 9,037 469,937 98
9.1.4 Music or video cassette or CD c 15,667 62,669 13
9.3.1 Sports and hobby equipment, musical instruments,
toys c
35,915 35,915 7
9.4.1 Football, cinema, video tickets & charges b 11,325 135,900 28
9.4.1 Tickets for sports/entertainment events c 6,872 27,487 6
9.4.2 Tickets for clubs and other entertainments b 5,687 295,733 62
9.4.2 Membership of sports/video societies & other clubs b 6,512 78,143 16
9.5.1 Stationery supplies – writing pad, pens, pencils, etc b 58,042 696,500 145
9.5.1 Books and magazines b 10,686 128,235 27
9.5.1 School books c 258,297 1,033,186 216
9.5.1 School supplies c 131,062 524,249 109
9.5.2 Newspapers b 17,980 215,766 45
9.5.4 Drawing equipment and accessories b 9,901 118,816 25
9.5.4 Other items and repairs (writing and drawing
equipment and supplies) b
3,228 38,731 8
9.5.4 Stationery items (not for school) b 1,271 5,085 1
Group 9 total 1,082
10 EDUCATION c
10 School and registration fees 1,285,754 5,143,017 1,073
10 Examination fees 71,326 285,305 60
10 Private tuition 320,277 1,281,106 267
10 Other expenses, specify; 83,038 332,152 69
10 Contributions to parents association 20,584 82,338 17
10 Lunch and pocket money 2,715,278 10,861,113 2,267
Group 10 total 3,754
12
11.2.0 Night‟s lodging in guest house or hotel 22 7,116 28,466 6
12.1.1 Toothpaste, Toothbrush/cosmetics b 1973 111,588 1,339,051 279
12.1.1 Glycerine, Vaseline, Skin creams b 2866 206,834 2,482,012 518
12.1.1 Other Personal Products (Shampoo, Razor
blades, Cosmetic, Hair Product etc) b
1585 51,814 621,770 130
12.1.1 Barber, beauty saloon b 692 88,325 1,059,906 221

Integrated Household Survey - Income and Expenditure Poverty Assessment, 2010 Page 35
Item
Code
ITEM NAME N Sum Yearly
Expenditure
Yly Exp Per
Household
12.1.3 Shaving equipment/permanent wave set b 260 8,622 103,464 22
12.1.3 Other personal effects b 91 13,967 167,608 35
12.1.3 Toilet paper b 134 10,561 126,732 26
12.3.2 Mortgage – regular payment to purchase
house b
6 2,281 27,372 6
12.3.2 Other personal care services b 124 12,269 147,227 31
12.4.0 Donation – to mosque, church, charity,
beggar, etc b
2749 268,907 3,226,881 674
12.4.0 Council rates d 2266 1,580,58
1
1,580,581 330
12.5.3 Sickness insurance premia d 11 11,717 46,868 10
12.5.3 Accident insurance premia d 7 7,667 30,667 6
12.5.3 Other health related insurance premia d 8 11,682 46,729 10
12.5.3 Insurance – health, auto, home, life, etc d 179 328,527 328,527 69
12.7.0 Milling Fees, Grains b 804 63,251 759,007 158
12.7.0 Fines or legal fees d 5 18,030 18,030 4
12.7.0 Bride wealth or cost d 58 446,800 446,800 93
12.7.0
Marriage ceremony costs d 568 1,202,52
5
1,202,525 251
12.7.0 Funeral d 963 469,758 469,758 98
Group 12 total 2,976
534,102,389 111,480
Per HH
GMD 13,720 534,102,389 111,480
US$ 490 19,075,085 3,981
a: for these items consumption over past ONE WEEK was collected, and hence Sum is multiplied by
52 to get Yearly Expenditure.
b: for these items consumption over past One Month was collected, and hence Sum is multiplied by
12 to get Yearly Expenditure.
c: for these items consumption over past Three Months was collected, and hence Sum is multiplied by
4 to get Yearly Expenditure.
d: for these items consumption over past Twelve Months was collected, and hence Yearly
Expenditure is same as Sum.

Integrated Household Survey - Income and Expenditure Poverty Assessment, 2010 Page 36
Chapter 5: Poverty Analysis
This chapter presents the overall poverty rates using the $1 and $1.25 thresholds per person per day
by Local Government Area. It also deals with the determinants poverty notably average household
size, gender of the head of the household, educational attainment of the household head, sector of
employment of the household head and place of residence which is presented in figure 3.
In this survey, the poverty line used is $1.25 per person per day but analysis has also been done for
the proportion of the population living below $1 per day. The “poor” therefore are defined as the
population living on less than $1.25 per day. The use of consumption rather than income, is because
of the better quality of the consumption data in this survey as the case in most Integrated Household
Surveys. People are considered as poor in the sense that their income is actually close to their
observed consumption.
Results of the 2010 IHS shows that 48.4 percent of the population are living below the poverty line of
$1.25 per day. This is an improvement from the 2003- 2004 IHS which shows that 58 percent of the
population was living below the poverty line. But it is important to note that the threshold for the
headcount index in 2003-2004 was $1 per person per day. Using the $1 per person per day in the
2010 IHS, overall poverty has decreased significantly from 58 percent in 2003 to 39.7 percent in
2010.
Using the $1.25 poverty line, poverty was highest in the rural than in the urban areas (73.9% vs
32.7%). This is an indication that poverty is a rural phenomenon as has been the case in most
developing countries. Analysing the data by LGA shows that only Banjul and Kanifing which are
entirely urban settlements have poverty rates lower than the national average. Kuntaur and
Janjanbureh LGAs, like the 2003 IHS survey, have the highest poverty rates with 79 and 73.2 percent
respectively. It is important to note that these two regions are the most deprived among the regions in
the predominantly rural areas as shown by the Multiple Indicator Cluster Surveys (MICS), Core
Welfare Questionnaire Indicator (CWIQ) survey 2008, Poverty and Social Impact Analysis (PSIA)
2009, Malaria Indicator Survey (MIS) 2010 among other household surveys. Brikama LGA has the
highest proportion of the distribution of the poor with 34.5 percent and Banjul has the lowest
proportion with less than one percent. Looking at the distribution of the poor in Banjul, Kanifing and
Brikama shows that urban poverty is in the increase. This could be attributable to the fact that these
settlements are witnessing a lot of inflow of migrants both internal and external because of the
employment opportunities both formal and informal in these areas.
Determinants of poverty Poverty is multidimensional and there are many factors that could lead to poverty which varies
country to country. It is important to note that in this survey like the 2003 IHS, income is used to
measure poverty. The determinants of poverty discussed below includes the following: Average
household size, gender of the household head, educational attainment of the household head, sector of
employment of the household head and place of residence.

Integrated Household Survey - Income and Expenditure Poverty Assessment, 2010 Page 37
Average household size
It is observed from table 5.1 that the size of the household can determine the poverty status of the
household. The data shows that single person households have the lowest poverty rate of 10.9 percent
and households with10 or more members had the highest poverty rates with 76.8 percent. Meaning
that, poverty increases as the household size increases. The reason why a marked disparity has been
observed in the poverty levels by place of residence could be attributed to large household sizes in the
rural areas.
Gender of household head
Male headed households accounted for about 88 percent of the population living below $1.25 per day,
whilst female headed households accounted for the remaining proportion. Using the $1 and $1.25 per
day female headed households has lower poverty rates. This is contrary to the findings of the 2003
IHS which shows that female headed households had higher poverty rates compared to their male
counterparts. The reason why these changes have been observed could be attributed to the fact that
female headed households tend to be smaller than male headed households in terms of size. Also
female headed households receive more remittances than their counterparts. Another reason is that the
proportion of women in the agricultural sector has decreased significantly compared to 2003.
Analyzing the data by sector of employment of the household head shows that those employed in the
agricultural sector have higher poverty rates among all the employment categories.
Educational attainment of the Household head
About two thirds of household heads did not have formal education, of which 58.4 percent are living
below $1.25 per day which is higher than the national average. The data from table 5.1 shows that the
higher the educational attainment of the household heads, the lower their poverty rates. The poverty
rates range from 58.4 percent for those with no education to 17.8 percent for those with tertiary
education. This could be attributed to the fact that the higher the educational attainment of an
individual, the likelihood of getting a better paid job.
Sector of employment of household head
Household heads in the agriculture and fishing industry accounted for the largest proportion of
persons living below $1.25 per day with 79.0 per cent. This could be attributed to the fact that the
agricultural sector in particular is beset with erratic rainfalls, lack of markets for their produce, lack of
capital among others. Agriculture being the main occupation for most of the population in the rural
areas, could be a reason why poverty is higher in the rural compared to the urban areas. Persons
employed in the electricity and gas industry and financial management sector have the lowest poverty
rates among these sectors.

Integrated Household Survey - Income and Expenditure Poverty Assessment, 2010 Page 38
Table 5. 1: Poverty Measures, 2010
Headcount
Rate (< $1/
person/ day)
Distribution of the
Poor (<
$1/person/day)
Headcount
Rate (< $1.25/
person/day)
Distribution of
the Poor (<
$1.25/
person/day)
Distribution of
the Population
Total 36.7 48.4
Urban 21.0 32.0 32.7 37.8 52.4
Rural 62.1 68.0 73.9 62.2 47.8
LGA
Banjul 7.1 0.2 16.4 0.5 1.8
Kanifing 15.0 10.7 26.0 13.8 23.6
Brikama 39.7 32.8 54.4 34.5 33.1
Mansakonko 45.4 6.0 57.2 5.8 5.1
Kerewan 48.2 13.6 60.3 13.0 11.2
Kuntaur 74.1 8.9 79.0 7.4 5.3
Janjanbureh 65.9 11.5 73.2 10.0 7.6
Basse 56.7 16.4 65.6 15.0 12.3
Household size
1.0 5.6 0.1 10.9 0.2 0.9
2.0 9.6 0.3 12.3 0.3 1.4
3.0 10.7 0.6 20.3 0.8 2.8
4.0 19.0 1.7 30.2 2.2 4.8
5.0 24.1 2.7 37.8 3.5 5.9
6.0 27.5 3.9 38.8 4.4 7.2
7.0 39.0 5.3 51.7 5.8 7.4
8.0 45.1 6.0 64.2 7.0 7.0
9.0 51.4 6.6 66.6 6.9 6.7
10 or more 64.5 72.8 76.8 69.1 55.9
Gender of household head
Male 38.8 88.2 50.9 87.6 84.3
Female 28.2 11.8 38.3 12.4 15.7
Education level of household head
None 46.2 78.3 58.4 75.7 66.1
Primary 31.6 4.9 42.1 5.1 6.1
Secondary 21.4 10.6 33.5 12.4 17.7
Vocational 13.3 0.5 25.0 0.7 1.5
Tertiary 10.9 2.6 17.8 2.9 6.0
Sector of employment of household head
Agriculture and fishing 68.8 43.6 79.0 39.6 33.1
Mining 46.2 0.3 61.6 0.3 0.3
Manufacturing and energy 33.6 5.6 43.6 5.5 7.4
Electricity, gas and water 5.8 0.3 21.2 0.5 1.0
Construction 35.6 5.2 50.2 5.6 7.3
Trade, hotels and
restaurants 24.2 14.3 36.2 16.3 25.2
Transport and
communication 37.7 5.1 51.2 5.1 6.4
Financial management 20.7 0.4 32.8 0.6 1.2
Social and personal service 28.1 12.2 40.4 12.9 18.2

Integrated Household Survey - Income and Expenditure Poverty Assessment, 2010 Page 39
Figure 2: Poverty Rates by place of residence for less $1 and $1.25 per day
Presented in the above figure are the poverty rates using the less than $1 and $1.25 per person per day
thresholds by place of residence. Using both thresholds, poverty was higher in the rural compared to
the urban areas. It is observed that poverty levels in the urban areas were lower than the national
averages for both poverty lines. In the rural areas, poverty rates double the national average for the
poverty line of less than $1 threshold. For the less than $1.25 poverty line, poverty in the rural areas
was higher than the national average by 25.5 percentage points. This is an indication that if poverty is
to be reduced, there is the need to target more the most deprived regions particularly CRR and URR
or else the high poverty rates in the rural areas will have an impact at the national average.
Table 5. 2: Percentage distribution of the Employed population living below USD1.25 per day by
age group and gender Table 5.2 shows percentage distribution of the
employed population living below $1.25 per day
for the age groups 15 -24 to 60 -64 years. The
data shows that, of the employed population, 40
per cent are living below $1.25 per day and the
proportion was highest for females (42%)
compared to males (37%). The difference in
poverty levels for the employed population and
the entire population is 8.4 percentage points
(40% vs 48.4%). It is observed that the age group
15 – 24 has higher poverty rates compared to the
other age groups. It is also observed that poverty
decreases from the age cohort 15 -24 to the age
cohort 40 – 44 and then increases for older age cohorts.
Gender
Male Female Total
Age group
15 - 24 49 48 49
25 - 29 35 43 40
30 - 34 32 37 35
35 - 39 31 41 36
40 - 44 34 45 39
45 - 49 34 38 36
50 - 54 35 45 39
55 - 59 41 40 40
60 - 64 44 44 44
Total 37 42 40

Integrated Household Survey - Income and Expenditure Poverty Assessment, 2010 Page 40
Table 5. 3 : Total Household Consumption by Quintile, 1998 – 2010 Quintile Estimate
(%)
1998 2003 2010
1st Quintile (poorest) 4.0 8.8 5.6
2nd
Quintile 7.6 13.6 10.5
3rd
Quintile 12.1 18.0 15.3
4th
Quintile 20.3 21.6 22.0
5th
Quintile (richest) 56.0 38.0 46.5
Source: 1998 Poverty Study, 2003 IHS and 2010 IHS
The indicators used for the calculation of the wealth index include household assets. The wealth
index is calculated using factor analysis. A standardized score is assigned for each household. These
scores are summed by household and individuals are ranked according to the total score of the
household in which they reside. The sample is then divided into population quintiles (five groups)
with the same number of individuals in each group.
Presented in Table 5.3 is the total household consumption by quintiles. The first quintile is the most
disadvantaged or the poorest and the fifth is the richest or the most advantaged. From the data it can
be seen that the share of the poorest quintile has increased from 4 per cent in 1998 to 8.8 per cent in
2003 and then decreased to 5.6 per cent in 2010. Whilst that of the richest quintiles has dropped from
56 per cent in 1998 to 38 per cent in 2003 and increased again in 2010 to 46.5 percent. From 1998 to
2003 the rest of the quintiles registered some increase in their share of the total consumption in 2003
particularly that of the 2nd
and the 3rd
quintiles. Thus, the 2003 data suggest significant reduction in
disparities in total household consumption by quintiles in The Gambia. However, the 2nd
and 3rd
quintiles registered some decrease in their share of total consumption from 2003 to 2010, while the 4th
quintile registered a slight increase from 21.6 percent to 22 per cent in the same period.
Table 5. 4: Average Household Consumption 2010 Quintile Estimate (Dalasi) Mean SE of Mean Median
1st Quintile (poorest) 29,948 391 30,797
2nd
Quintile 57,648 454 58,955
3rd
Quintile 84,847 659 87,768
4th
Quintile 122,441 913 125,391
5th
Quintile (richest) 260,742 5,465 215,626
Table 5.4 shows household mean consumption by quintiles. From the table it can be seen that the first
(poorest) quintile is further from the top (richest) quintile as the poorest quintile has a mean
consumption of D29,948 per annum whilst the fifth (richest quintile) has a mean consumption of
D122,441 per annum. The same trend has been observed between the second and third quintiles, the
third and the fourth and the fourth and the fifth quintiles. From the table it is observed that the

Integrated Household Survey - Income and Expenditure Poverty Assessment, 2010 Page 41
household median consumption by quintiles is higher than the household mean consumption for all
quintiles except for the richest quintile.
Table 5. 5: Mean Per Capita Expenditure in Dalasi by LGA and residence LGA
Mean
Banjul 29,755
Kanifing 28,021
Brikama 16,462
Mansakonko 15,995
Kerewan 14,185
Kuntaur 9,633
Janjanbureh 11,989
Basse 13,309
Reidence Urban 24,356 Rural 11,068
Total 19,269
It is observed from the above table that the mean capita expenditure is GMD19,269 with huge
regional variations. The mean capita expenditure in the urban area doubles that of the rural areas
(GMD24,356 vs GMD11,068). It is observed that the mean capita expenditure is higher in the urban
settlements of Banjul and kanifing which has lower poverty rates and lowest in Kuntaur and Kuntaur
which have higher poverty rates. Other than Banjul and Kanifing, all the other LGAs mean capita
expenditure is lower than the national average.
Table 5. 6 : Inequality in Per Capita Expenditure Distribution by place of residence in 2003 and
2010
Bottom Half of the
Distribution
Upper Half of the
Distribution
Inter quartile
Range Tails
p25/p10 p50/p25 p75/p50 p90/p50 p75/p25 p90/p10 Gini
Total
2003 1.50 1.68 1.65 2.76 2.78 6.97 46.16
2010 1.61 1.68 1.76 2.91 2.94 7.80 45.78
Urban
2003 1.55 1.78 1.64 2.78 2.92 7.68 44.67
2010 1.46 1.57 1.63 2.66 2.56 6.08 42.11
Rural
2003 1.49 1.59 1.57 2.44 2.49 5.78 44.15
2010 1.41 1.57 1.59 2.54 2.51 5.63 40.03
Source: 2003 IHS and 2010 Integrated Household Survey
The table presents ratios of the mean per capita expenditures of various percentiles of the distribution
of per capita expenditures.

Integrated Household Survey - Income and Expenditure Poverty Assessment, 2010 Page 42
Figure 3: Lorenz Curve
1=Urban, 2=Rural
From Table 5.6, in 2003 urban areas had a Gini coefficient of 42.11 and the rural areas had a Gini
coefficient of 40.03. Nationally in 2010, the Gini coefficient was 45.78 which is an improvement
from 2003, in which the Gini was 46.16. Both Gini coefficients of urban and rural improved in 2010
compared to 2003. From Table 5.4 the 2010 Gini coefficients of urban and rural were 44.67 and
44.15 respectively. The lower the Gini coefficient the better the distribution, it ranges from 0.00 to
1.00 or (0%-100%).
In 2010, people in the 90th
percentile consumed 7.8 times as much as those in the 10th
percentile. The
difference in the two percentile was highest in the urban than in the rural areas, with it being 6.08
times as much in the urban areas and 5.63 times as much in the rural areas. The inter quartile range
was highest in the urban than rural and nationally was 2.94. In the urban, people in the 75th
percentile
consumed 2.56 times more than people in the 25th
percentile; whilst in the rural the difference is 2.51
times more in the 75th
than the 25th
percentile.
The upper half of the distribution shows that in the urban areas, people in the 90th
percentile
consumed 2.66 times than those in the 50th
percentile and those in the 75th
percentile consumed 1.63
times than those in the 50th
percentile. Whilst in the rural areas, people in the 90th
and 75th
percentiles
consumed 2.54 and 1.59 times respectively more than those in the 50th
percentile. The bottom half of
the distribution showed that in both the urban and rural areas, people in the 50th
percentile consumed
1.57 times more than those in the 25th
percentile. However, in the urban areas, people in the 25th
percentile consumed 1.46 times more than those in the 10th
percentile, whilst it is1.41 times in the
rural areas

Integrated Household Survey - Income and Expenditure Poverty Assessment, 2010 Page 43
Table 5. 7 : Poverty Rate from less than $1 - $2 and above per person per day consumption by
residence < $1.00 $1-$1.24 $1.25-$1.99 $2.00 and above Total
Residence Urban Count 615 341 785 1,184 2,925
Percent 21.0 11.7 26.8 40.5 100.0
Rural Count 1,125 214 282 192 1,813
Percent 62.1 11.8 15.6 10.6 100.0
Total Count 1,740 555 1,067 1,376 4,738
Percent 36.7 11.7 22.5 29.0 100.0
Presented in the above table are poverty rates using the poverty lines less than $1 to $2 and above per
day by place of residence. The proportion of the population living less than $1 per person per day is
highest in the rural (62,1%) compared to the urban areas (21.0%). It is also observed that the
proportion of the population living between $1 - $1.24 per day is the same in both place of residence.
As the threshold increases, significant difference is observed between the rural and urban areas.
About 27 per cent of the urban dwellers are living between $1.25-$1.99 per day and in the rural areas,
about 16 per cent of the population is living between $1.25-$1.99 per day. For the population living
from $2 and above per day, the urban population is four times that of the rural population (40.5% vs
10.6%). What can be concluded from this analysis is that income levels are higher in the urban than
in the rural areas as shown in the table.
Table 5. 8: Poverty rates by Local Government Area less than $1 to $2 and above per day
LGA Poverty Rate based on per person per day
consumption Total <$1.00 $1-
1$1.24
$1.25-
$1.99
$2.00 and
above Banjul Count 10 13 30 87 140
Percent 7.1 9.3 21.4 62.1 100.0
Kanifing Count 214 157 367 685 1423
Percent 15.0 11.0 25.8 48.1 100.0
Brikama Count 613 227 367 339 1546
Percent 39.7 14.7 23.7 21.9 100.0
Mansakonko Count 123 32 56 60 271
Percent 45.4 11.8 20.7 22.1 100.0
Kerewan Count 255 64 118 92 529
Percent 48.2 12.1 22.3 17.4 100.0
Kuntaur Count 137 9 20 19 185
Percent 74.1 4.9 10.8 10.3 100.0
Janjanbureh Count 172 19 37 33 261
Percent 65.9 7.3 14.2 12.6 100.0
Basse Count 216 34 72 59 381
Percent 56.7 8.9 18.9 15.5 100.0
Total Count 1740 555 1067 1374 4736
Percent 36.7 11.7 22.5 29.0 100.0

Integrated Household Survey - Income and Expenditure Poverty Assessment, 2010 Page 44
Analysis of the above table has shown that the two urban settlements of Banjul and Kanifing has the
highest proportion of the population living from $2.00 and above per day but highest in Banjul with
62.1 per cent. Kuntaur and Janjabureh have the lowest proportions of the population living fom $2.00
and above per day. Banjul and Kanifing have the lowest proportion of the population living less than
$1 per person per day. The proportion of the population living less than one dollar per day was
highest in the predominantly rural areas and is highest in the poorest regions (Kuntaur and
Janjanbureh). For the threshold of $1-$1.24 was highest in Brikama with 14.7 per cent and lowest in
Kuntaur with about 5 per cent. For $1.25-$1.99, Banjul, Kanifing and Brikama have the highest
proportions and Kuntaur and Janjanbureh (the poorest regions) have the lowest proportions with 10.8
and 14.2 per cent respectively.
Table 5. 9 : Poverty Rate by Gender of the household head less than $1 to $2 and above per day
Gender Poverty Rate based on per person per day consumption
<$1.00 $1-$1.24 $1.25-$1.99 $2.00 and above Total
Male Count 1473 459 869 993 3794
Percent 38.8 12.1 22.9 26.2 100.0
Female Count 259 93 191 374 917
Percent 28.2 10.1 20.8 40.8 100.0
Total Count 1732 552 1060 1367 4711
Percent 36.7 11.7 22.5 29.0 100.0
The number of male headed households is higher than that of the female headed households.
However, the proportion of female headed households spending $2 or more per day is higher
compared to their male counterparts. Two fifths of the female headed households consume $2 or
more per person per day, whereas about one third of the male headed households consume $2 or more
per day.
About 39 percent of male headed households live on less than $1 per person per day and 12.1 percent
live within $1 - $1.24 per day. Twenty eight percent of female headed households live on less than $1
per day and 10.1 percent live between $1 - $1.24 per person per day.
Nationally, 36.7 percent of household live on less than $1 per person per day and 11.7 percent of
households live within $1 - $1.24 per person per day. A combination of these two percentages gives a
total of 48.4 percent of household living below the poverty line of $1.25 per person per day.
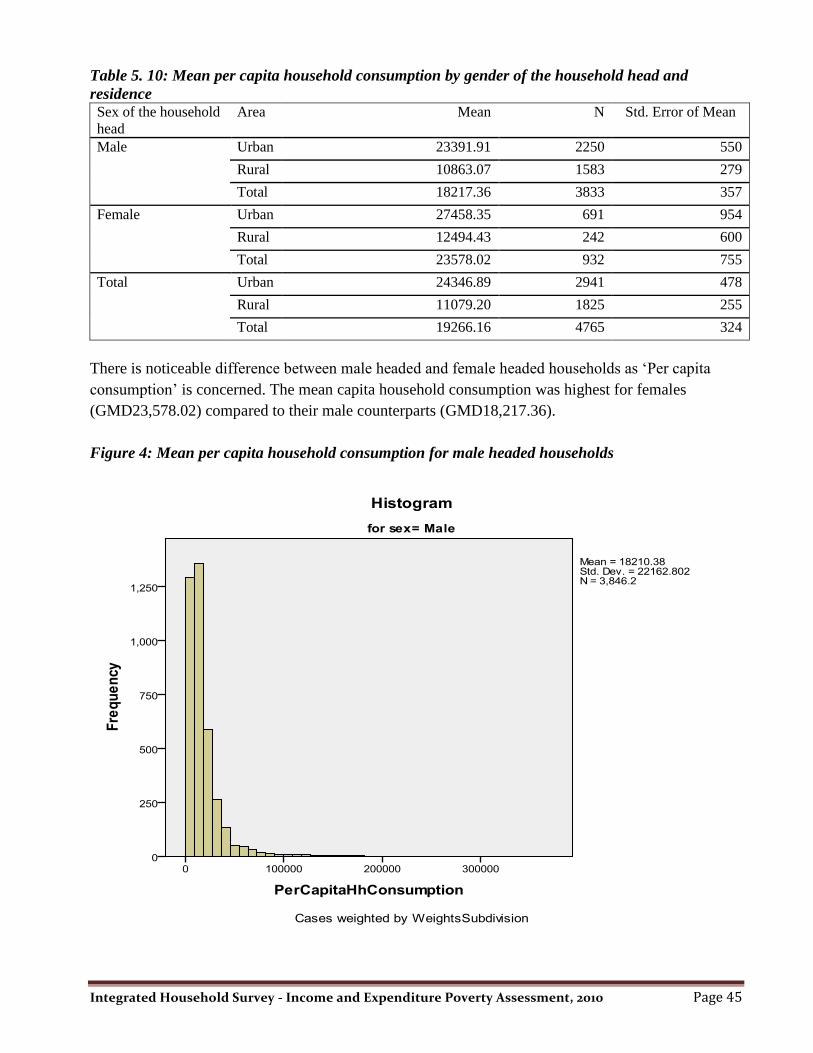
Integrated Household Survey - Income and Expenditure Poverty Assessment, 2010 Page 45
Table 5. 10: Mean per capita household consumption by gender of the household head and
residence Sex of the household
head
Area Mean N Std. Error of Mean
Male Urban 23391.91 2250 550
Rural 10863.07 1583 279
Total 18217.36 3833 357
Female Urban 27458.35 691 954
Rural 12494.43 242 600
Total 23578.02 932 755
Total Urban 24346.89 2941 478
Rural 11079.20 1825 255
Total 19266.16 4765 324
There is noticeable difference between male headed and female headed households as „Per capita
consumption‟ is concerned. The mean capita household consumption was highest for females
(GMD23,578.02) compared to their male counterparts (GMD18,217.36).
Figure 4: Mean per capita household consumption for male headed households
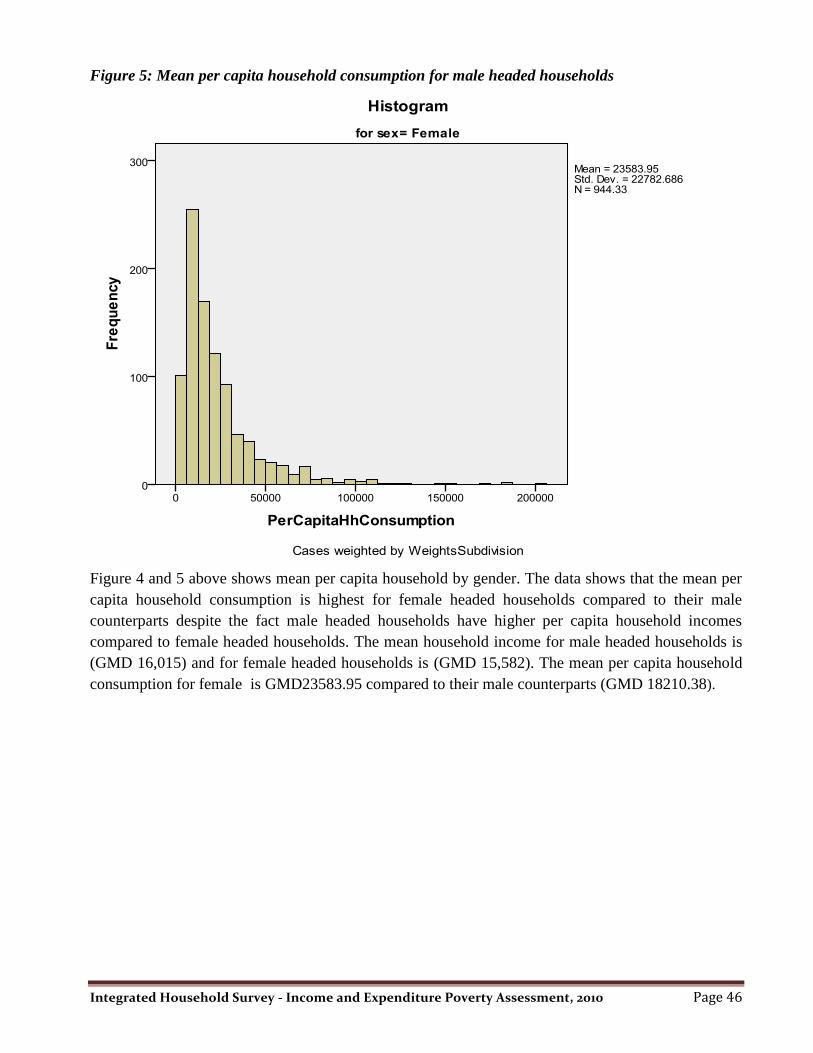
Integrated Household Survey - Income and Expenditure Poverty Assessment, 2010 Page 46
Figure 5: Mean per capita household consumption for male headed households
Figure 4 and 5 above shows mean per capita household by gender. The data shows that the mean per
capita household consumption is highest for female headed households compared to their male
counterparts despite the fact male headed households have higher per capita household incomes
compared to female headed households. The mean household income for male headed households is
(GMD 16,015) and for female headed households is (GMD 15,582). The mean per capita household
consumption for female is GMD23583.95 compared to their male counterparts (GMD 18210.38).

Integrated Household Survey - Income and Expenditure Poverty Assessment, 2010 Page 47
Table 5. 11: Poverty Rate by the Household head highest level of education completed
Educational level Poverty Rate based on per person per day consumption
Total <$1.00 $1-$1.24 $1.25-$1.99 $2.00 and above
None Count 1338 355 635 553 2881
Percent 46.4 12.3 22 19.2 100
Pre-school Count 16 3 5 7 31
Percent 51.6 9.7 16.1 22.6 100.0
Primary Count 108 36 92 106 342
Percent 31.6 10.5 26.9 31.0 100.0
Secondary (Middle/Upper
Basic/Junior/ Senior)
Count 219 124 252 428 1023
Percent 21.4 12.1 24.6 41.8 100.0
HIGHER (tertiary,
University, College)
Count 41 26 60 248 375
Percent 10.9 6.9 16.0 66.1 100.0
Vocational Count 8 7 16 29 60
Percent 13.3 11.7 26.7 48.3 100.0
Don‟t Know Count 4 2 1 3 10
Percent 40.0 20.0 10.0 30.0 100.0
Other Count 6 1 5 1 13
Percent 46.2 7.7 38.5 7.7 100.0
Total Count 1740 554 1066 1375 4735
Percent 36.7 11.7 22.5 29.0 100.0
It is observed from the above table that household heads with no education, pre – school and primary
education accounted for the highest proportion of the population living less than $1 per person per
day. Household heads with secondary, higher and vocational education accounted for the lowest
proportions of the population living less than $1 per day. On the other hand, they accounted for the
highest proportion of household heads living from $2.00 and above per day. The proportion was
highest for those with higher education with 66.1 per cent. Household heads with no education
accounted for the lowest proportion with 19.2 per cent. This means that the educational attainment of
the individual can be a determinant of the poverty status of the person as the higher the educational
attainment of the household head, the higher his or her consumption per day.

Integrated Household Survey - Income and Expenditure Poverty Assessment, 2010 Page 48
Table 5. 12: Poverty Rate by Sector of Employment of the Household Head
Sector of Employment Poverty Rate based on per person per day consumption
Total <$1.00 $1-$1.24 $1.25-$1.99 $2.00 and above
Agriculture and fishing Count 662 98 143 59 962
Percent 68.8 10.2 14.9 6.1 100.0
Mining Count 6 2 4 1 13
Percent 46.2 15.4 30.8 7.7 100.0
Manufacturing and energy Count 114 34 88 103 339
Percent 33.6 10.0 26.0 30.4 100.0
Electricity, gas and water Count 3 8 16 25 52
Percent 5.8 15.4 30.8 48.1 100.0
Construction Count 112 46 89 68 315
Percent 35.6 14.6 28.3 21.6 100.0
Trade, hotels and restaurants Count 286 142 315 440 1183
Percent 24.2 12.0 26.6 37.2 100.0
Transport and
Communications
Count 98 35 59 68 260
Percent 37.7 13.5 22.7 26.2 100.0
Financial Management Count 12 7 10 29 58
Percent 20.7 12.1 17.2 50.0 100.0
Social and Personal Services Count 222 97 169 303 791
Percent 28.1 12.3 21.4 38.3 100.0
Unemployed/Not stated Count 226 85 174 282 767
Percent 29.5 11.1 22.7 36.8 100.0
Total Count 1741 554 1067 1378 4740
Percent 36.7 11.7 22.5 29.1 100.0
The above table shows that the population employed in the agricultural and fishing industry
accounted for the highest proportion living below $1 per day. Those working in the electricity, gas
and water sector have the lowest proportion among the employed population living below a lower a
day with 5.8 per cent. It is observed that the population employed in the mining and electricity, gas
and water sectors have the highest proportion of the population living between $1 - $1.24 per day and
those employed in the agriculture and fishing and manufacturing and energy sectors have the lowest
proportions with 10.2 and 10.0 per cent respectively. Household heads employed in the agriculture
and fishing industry accounted for the lowest proportions of household heads who spends $2.00 and
above per day. Household heads working in the electricity, gas, and water and financial management
accounted for the highest proportion of household heads that spends more than $2.00 per day with
48.1 and 50.0 per cent respectively.

Integrated Household Survey - Income and Expenditure Poverty Assessment, 2010 Page 49
Table 5. 13: Poverty Rate by Status in Employment of the Household Head
Status in Employment Poverty Rate based on per person per day consumption
Total <$1.00 $1-$1.24 $1.25-$1.99 $2.00 and above
Employer Count 34 11 27 37 109
Percent 31.2 10.1 24.8 33.9 100.0
Own account worker Count 1139 300 541 575 2555
Percent 44.6 11.7 21.2 22.5 100.0
Family helper Count 56 28 62 56 202
Percent 27.7 13.9 30.7 27.7 100.0
Salaried employee – public Count 125 64 114 211 514
Percent 24.3 12.5 22.2 41.1 100.0
Salaried employee –
private
Count 159 66 139 207 571
Percent 27.8 11.6 24.3 36.3 100.0
Not reported Count 223 84 177 283 767
Percent 29.1 11.0 23.1 36.9 100.0
Salaried employee – Other Count 4 2 6 6 18
Percent 22.2 11.1 33.3 33.3 100.0
Total Count 1740 555 1066 1375 4736
Percent 36.7 11.7 22.5 29.0 100.0
In Table 5.13, the highest proportion of household heads below the poverty line ($1 and $1.25 per
person per day) were own account workers, followed by family helpers. These household heads are
most likely to be found in the agriculture and fisheries sector, especially in the rural areas.
Of all the status in employment categories, only own account workers and family helpers have less
than one third consuming $2 and above per day. The consumption of the employers, salaried
employee (public, private and others) is above $1.99 per day. Salaried employee public had the
highest proportion of persons consuming $2 and above per person per day with 41.1 percent.

Integrated Household Survey - Income and Expenditure Poverty Assessment, 2010 Page 50
Table 5. 14: Poverty Rate by Status in Employment of the Household Head
Household Size Poverty Rate based on per person per day consumption
Total <$1.00 $1-$1.24 $1.25-$1.99 $2.00 and above
1 Count 19 18 40 263 340
Percent 5.6 5.3 11.8 77.4 100.0
2 Count 25 7 53 176 261
Percent 9.6 2.7 20.3 67.4 100.0
3 Count 39 35 94 195 363
Percent 10.7 9.6 25.9 53.7 100.0
4 Count 88 52 134 190 464
Percent 19.0 11.2 28.9 40.9 100.0
5 Count 109 62 125 157 453
Percent 24.1 13.7 27.6 34.7 100.0
6 Count 129 53 144 143 469
Percent 27.5 11.3 30.7 30.5 100.0
7 Count 157 51 107 88 403
Percent 39.0 12.7 26.6 21.8 100.0
8 Count 156 66 75 49 346
Percent 45.1 19.1 21.7 14.2 100.0
9 Count 149 44 67 30 290
Percent 51.4 15.2 23.1 10.3 100.0
10 and
above
Count 870 166 229 84 1349
Percent 64.5 12.3 17.0 6.2 100.0
Total Count 1741 554 1068 1375 4738
Percent 36.7 11.7 22.5 29.0 100.0
Poverty rate increases as the household size increases, therefore poverty rate was highest at
households with 10 or more members. More than three quarters of households with 10 or more
members were below the poverty line of $1.25 per person per day, and only 6.2 percent consuming
$2 and above per person per day. More than three quarters of single-person households consumed $2
and above per person per day and only 10.9 percent of them live below the poverty line of $1.25. Half
of the households with more than 6 persons were living below the poverty line of $1.25, whereas
households with 3 or less people had more than half of their households consuming more than $1.99
per day.

Integrated Household Survey - Income and Expenditure Poverty Assessment, 2010 Page 51
Figure 6: Poverty Rate by Household Size using the poverty line less $1 and $1.25 per day
The above figure shows that, as the household sizes increases the higher the poverty rate of the
household. Households with 10 members and above have the highest poverty rates for both
thresholds. For the threshold $1.25 per person per day, the poverty rate for households with to
members and above is about 77 per cent. For the threshold $1 per person per day, the poverty rate is
64.5 per cent all higher than the national averages. The rural areas usually have large households and
the urban areas have small household size. This could be one factor that have contributed to the huge
difference in poverty levels between the rural than the urban areas.
Table 5. 15: Poverty rates by Age Group, less than $1 per day poverty line
Age Poverty Headcount Rate Share of the Poor Population Share of the Entire Population
0-5 55.6 20.3 18.8
6-14 55.8 25.6 23.6
15-19 51.5 12.4 12.4
20-24 48.0 8.9 9.5
25-29 44.4 7.6 8.8
30-34 44.4 5.2 5.9
35-39 44.1 4.5 5.2
40-44 46.0 3.4 3.8
45-49 46.1 2.9 3.2
50-54 49.7 2.4 2.5
55-59 53.4 1.6 1.5
60-64 52.2 1.6 1.6
65+ 57.9 3.5 3.1

Integrated Household Survey - Income and Expenditure Poverty Assessment, 2010 Page 52
Table 5.15 above shows higher poverty rates for children between 0 - 5 and, 6 -14 and the population
65 years and above with 55.6, 55.8 and 57.9 per cent respectively. The population aged 65 and above
has the highest poverty rate and constitute 3.1 per cent of the population.
Among these age groups, the productive population- those aged between 20 and 59, had lower
headcount rates. This age group comprises 40 percent of the population of the country. These figures
suggest that younger people (0-19 years) and the elderly are most vulnerable to poverty. This could
be attributed to the fact that the elderly have retired or the younger population are too young to work.
Although the poverty rate is lowest in the middle age groups, it is still over 40 per cent.
Table 5. 16: Poverty rates by Age Group, less than $1.25 per day poverty line
Age Poverty Headcount Ratio Share of the Poor Population Share of the Entire Population
0-5 67.8 20.0 18.8
6-14 68.5 25.3 23.6
15-19 64.0 12.4 12.4
20-24 60.3 9.1 9.5
25-29 57.3 7.9 8.8
30-34 56.0 5.2 5.9
35-39 56.5 4.6 5.2
40-44 58.7 3.5 3.8
45-49 57.5 2.9 3.2
50-54 62.7 2.5 2.5
55-59 65.3 1.6 1.5
60-64 63.3 1.6 1.6
65+ 69.0 3.4 3.1
Presented in the above table are poverty rates for the population 0 – 5 years to 65 years and above
living below $1.25 per day. Compared to the $1 threshold for the same population distribution (table
5.14), the head count ratio has increased for all age groups but the increased was found more for the
population age 6 -14 years. It is observed that the head count ratio is highest for the population 0-5, 6-
14 and 65 years and above.

Integrated Household Survey - Income and Expenditure Poverty Assessment, 2010 Page 53
Chapter 6: Miscellaneous Income And Expenditure
The module G collected data on receipt from sale of used items. Over 90 percent of households
reported sale of used items. The total annual income from sale of these items is presented in the table.
The total annual income of sales of used items amounted to GMD 7.68 million, which on average is
GMD 1,600 per household.
Table 6. 1: Table
6.1 : Receipt from
sale of used items
(Module G)
Receipt from Sale of Used Items Annual Sale of items in GMD
Books, magazines, newspapers 16,174
Drawing equipment 34,080
Clothing & footwear 138,976
Car/motor cycle/bicycle/boat etc. 3,157,538
Old tyres/tubes/parts 500,009
School books 19,532
Furniture/fixtures/floor coverings 12,825
Household textiles and other furnishings 884,438
Cooling, cooking & other appliances 39,376
Glassware, tableware & utensils 1,281,002
Spectacles & other Medical 973
School material 1,282,808
TV/Video/Cassette/Radio 145,697
Musical instruments 5,180
Cameras/typewriter/binoculars/sports
equipment
1,375
Jewelry, watches & clock 2,376
Iron/sewing machines/hair dryer 11,397
Other personal goods 147,277
Total 7,681,034
Per household receipt from sale of selected
items 1,600

Integrated Household Survey - Income and Expenditure Poverty Assessment, 2010 Page 54
Miscellaneous Income and Expenditure
Further analysis on household miscellaneous income and expenditure is done because these
components reported by households which are substantial and were not analyzed earlier.
Table 6. 2: Miscellaneous income in past 12 months by households
FROM CENTRAL AND LOCAL
GOVERNMENT FROM OTHER SOURCES
Residence
Social
security
State
Pension Other
Private
pension/
insurance Osusu Dowry
Sale of
Land Other
Urban Mean 1,371 1,583 2,983 578 5,269 84 1,738 6,913
N 903 887 885 884 949 885 884 911
Sum 1,238,035 1,404,257 2,640,593 510,618 4,998,819 74,546 1,536,431 6,294,081
Rural Mean 447 2,168 4,458 2,119 2,234 341 1,067 10,648
N 543 538 537 535 552 535 534 534
Sum 243,003 1,166,618 2,394,953 1,133,412 1,232,443 182,425 569,983 5,689,413
Total Mean 1,024 1,804 3,540 1,159 4,153 181 1,486 8,294
N 1,447 1,425 1,422 1,419 1,500 1,420 1,418 1,445
Sum 1,481,038 2,570,875 5,035,546 1,644,030 6,231,262 256,971 2,106,414 11,983,494
Presented in the above table is the miscellaneous income from central and local government sources
to households in the twelve months preceding the survey. It is observed state pension accounted for
the highest income compared to social security and both sources of income were highest in the urban
areas. The other category which was mainly transfers accounted for the highest proportions and the
disparity by place of residence was not huge as we observed for the case of social security and state
pension. For the other Sources of Income, the other specify, which was mainly transfers and sale of
agricultural products accounted for the highest source of income followed by sale of land and Osusu.
Dowry was the lowest source of income.
Table 6. 3: Expenditure in past 12 months by households in cash and kind
Area
Contributions
to self-help
projects
Weddings,
dowry,
naming
ceremonies
Religious and
other
ceremonies
(Tobaski,
Koriteh, etc.)
Contributions
to Osusu
Other
miscellaneous
expenditure
(specify)
Required amount
of to cover this
household's basic
needs in a month
Urban Mean 503 1,631 4,940 1,660 76 7,772
N 2,781 2,791 2,929 2,817 2,763 2,926
Sum 1,399,595 4,551,416 14,471,539 4,674,482 209,598 22,745,006
Rural Mean 137 1,532 4,797 665 132 6,182
N 1,770 1,782 1,808 1,780 1,768 1,813
Sum 242,570 2,729,572 8,674,922 1,183,864 233,963 11,205,205
Total Mean 361 1,592 4,886 1,274 98 7,164
N 4,552 4,573 4,738 4,597 4,531 4,739
Sum 1,642,166 7,280,988 23,146,461 5,858,346 443,560 33,950,211
Integrated Household Survey - Income and Expenditure Poverty Assessment, 2010 Page 55
All household heads were asked their expenditure in the past 12 months before the survey in cash and
kind. It is observed from the table that religious and other ceremonies accounted for the highest
expenditure by households followed weddings, dowry and naming ceremonies. Both expenditures
were highest in the urban areas. All the other expenditures was highest in the urban areas compared to
the rural areas except for other miscellaneous expenditure which was highest in the rural areas. These
miscellaneous expenditure includes: funeral arrangements, charity, gifts, health, education etc. During
the survey, all household heads were asked the amount of money they will require to cover needs in a
month. It is observed that in the urban areas the average amount required for the month is GMD7,772
and for the rural areas is GMD6,812. At the national level, GMD 7,164 is required by households to
cover their basic needs in a month.

Integrated Household Survey - Income and Expenditure Poverty Assessment, 2010 Page 56
Chapter 7: Remittances
Remittances are the financial transfers sent to a household from another place. Remittances provide a
lifeline out of poverty for many households in The Gambia as in most developing countries and most
of this money is spent on basic necessities such as food, clothing, shelter, health care, education as
well as occasional expenses such as religious, social and cultural related expenditures. Evidence from
The Gambia Integrated Household Survey, 2010 indicates that remittances could play an important
role in the country‟s quest to meet the United Nations Millennium Development Goal (MDG) of
reducing income poverty by about one half by 2015 given its 1990 levels (31%).
The Gambia 2010 Integrated Household Survey aimed to measure the remittances among households
in The Gambia. For the purpose of the survey, the questions on remittances included the value of food
and goods that were sent or received by households.
During the survey, all household heads were asked if any member of their household received help in
cash or kind from relatives or friends who were resident elsewhere during the past 12 months
preceding the survey. The value and frequency of assistance were also captured and whether the
assistance would be repaid or not. Relationship to the head of the household, and the place of
residence of those relatives were also collected. Data was also collected on transfer payments made
by households to relatives or friends who live elsewhere.
Figure 7: Percentage of Remittances in 2010 by Quarter
It is observed that transfer received by households is four times more than transfers made. Out of
GMD43.52 million of total remittance, GMD35.34 million (81.2%) was received whilst GMD8.18
million (18.8%) was sent by the households covered in the survey. In Figure 10.1 it can be seen that,
generally, there are little differences in the total value of remittances in terms of period of the year the
remittance was made.

Integrated Household Survey - Income and Expenditure Poverty Assessment, 2010 Page 57
7.1 Remittances sent During the reference period remittances in the form of money, food or goods valued at GMD8,
183,182 were sent to absent relatives or friends. On average, each household sent a total of GMD3,
647 worth of remittances; GMD3, 239 in cash, GMD341in food and GMD67 in goods.
Table 7. 1: Value of Remittance Sent by type, background Characteristics of recipient and period.
Type Value Percent
Cash 7,297,515 89.2
Food 741,616 9.1
Goods 144,051 1.8
Relationship to Household Head
Parent 3,092,514 37.8
Spouse 949,587 11.6
Child 988,511 12.1
Brother/sister 2,239,720 27.4
Other relative 764,172 9.3
Non-relative 148,678 1.8
Gender of Recipient
Male 3,794,122 46.4
Female 4,389,060 53.6
Residence of Recipient
Same community 883,208 10.8
Capital city 83,190 1.0
Other urban 2,549,172 31.2
Rural 2,714,319 33.2
Abroad 1,953,293 23.9
Period
First Quarter 1,655,382 20.2
Second Quarter 1,645,326 20.1
Third Quarter 2,267,749 27.7
Fourth Quarter 2,614,725 32.0
Total 8,183,182 100.0
Eighty nine percent of remittances were in the form of cash, 9.1 percent was in food and about 2
percent was in the form of goods. About thirty eight percent of the remittances were sent to parents,
27.4 percent to brothers/sisters and about 12 percent each to children and spouses. Females received
about 54 percent of the remittances whilst males received 46.4 percent of the remittances. According
to the results of the survey, 33.2 percent of the total remittances sent by households was to the rural
areas whilst 32.2 percent was to the urban areas (other urban and capital city combined). Those
residing abroad received about 24 percent of the remittances sent.
Within the same community transfers accounted for about 11 percent. Out of the GMD 8.18 million
sent during the 12 months preceding the survey 32 percent and 27.7 percent were sent in the fourth
and third quarter respectively. Only 20 percent each was sent during the first and second quarters. The
data also shows that out of the total about 60 percent of the remittances sent during the 12 months
preceding the survey were sent in the third and fourth quarters of the year.

Integrated Household Survey - Income and Expenditure Poverty Assessment, 2010 Page 58
Table 7. 2 : Value remittances Sent by region and type
LGA/Sub Division
Cash Food Goods Total
Value Percent Value Percent Value Percent Value Percent
Banjul 448,626 6.1 13,920 1.9 3,958 2.7 466,463 5.7
Kanifing 2,146,521 29.4 42,735 5.8 6,013 4.2 2,195,150 26.8
Kombo North 770,612 10.6 71,500 9.6 38,674 26.8 880,493 10.8
Other Kombos 652,241 8.9 42,775 5.8 3,552 2.5 698,604 8.5
Fonis 162,406 2.2 11,390 1.5 2,791 1.9 176,576 2.2
MansaKonko 503,599 6.9 97,840 13.2 22,133 15.4 623,574 7.6
NBR West 573,147 7.9 122,289 16.5 29,861 20.7 725,280 8.9
NBR East 165,513 2.3 17,950 2.4 863 0.6 184,356 2.3
Kuntaur 42,047 0.6 8,250 1.1 406 0.3 50,720 0.6
Janjanbureh 301,293 4.1 200,102 27.0 8,128 5.6 510,018 6.2
URR South 1,477,145 20.2 106,565 14.4 27,673 19.2 1,611,267 19.7
URR North 54,366 0.7 6,300 0.8 0 0.0 60,681 0.7
Total 7,297,515 100.0 741,616 100.0 144,051 100.0 8,183,182 100.0
Table 7.2 shows the value of remittances sent by households covered during the 2010 IHS by LGA/Sub
division and type. Overall, Kanifing and URR South have the highest proportions of total remittances that were
sent by households during the survey with 26.8 and 19.7 per cent respectively whilst Kuntaur and URR North
has the lowest proportions with less than one per cent each.
Of the GMD7,297,515 of cash remittances sent by the surveyed households, Kanifing has the highest
proportion (29.4%) followed by URR South (20.2%) and then Kombo North (10.6%). Kuntaur and URR
North have the lowest proportions of cash remittances during the period with less than one percent each. In
terms of the value of remittances in food, of the total valued of GMD741,616, Janjanbureh and NBR West has
the highest proportions with 27.0 and 16.5 per cent respectively. The total value of remittances in goods
reported in the 2010 IHS study was GMD144,051 of which 26.8 per cent was sent by households in Kombo
North and 20.7 percent by households in North Bank West. North Bank East, Kuntaur and URR North each
account for less than one per cent.

Integrated Household Survey - Income and Expenditure Poverty Assessment, 2010 Page 59
Table 7. 3: Value of Remittance received by type, background Characteristics of remitter and
period.
Type Value Percent
Cash 32,647,811 92.4
Food 1,613,177 4.6
Goods 1,078,432 3.0
Relationship to Household Head
Parent 956,082 2.7
Spouse 5,180,938 14.7
Child 13,937,875 39.4
Brother/sister 8,648,657 24.5
Other relative 4,697,333 13.3
Non-relative 1,918,536 5.4
Gender of Remitter
Male 28,489,383 80.6
Female 6,850,037 19.4
Residence of Remitter
Same community 1,188,377 3.4
Capital city 598,721 1.7
Other urban 3,966,903 11.2
Rural 1,133,573 3.2
Abroad 28,451,846 80.5
Period
First Quarter 9,230,550 26.1
Second Quarter 6,569,890 18.6
Third Quarter 9,988,276 28.3
Fourth Quarter 9,550,704 27.0
Total 35,339,420 100.0
7.2 Remittance received
Remittances are an integral source of income for many families in The Gambia. Overall, during the
12 months preceding the survey households received about GMD35.34 million in remittances of
which 92.4 percent was in cash, 4.6 percent was food and 3 percent was goods. This shows that on
average each household received a total of GMD11, 280 worth of remittances; GMD10, 382 in cash,
GMD537 in food and GMD361 in goods. Analysis of the data by relationship to the head of the
household shows that, 39.4 percent of the remittances received by households is from their children,
about 25 percent from brothers/sisters and about 15 and 13 percent of the remittances came from
spouses and other relatives respectively.
Significant differences have been observed in terms of gender; 80.6 percent of the support was
remitted by males compared to 19.4 percent by females. The largest source of remittances was
abroad (80.5%) followed by urban areas with 12.9 percent (other urban and capital city combined).
Remittances from the same community and rural areas accounted for 3.4 and 3.2 per cent

Integrated Household Survey - Income and Expenditure Poverty Assessment, 2010 Page 60
respectively. It is observed from the table that apart from the second quarter there has not been
significant differences in the proportions of remittances received during the year.
Figure 8: Frequency of Remittance received by households
In terms of the regularity of the
remittances, the survey result showed
that 33 percent of the beneficiaries
reported that the remittance was not
regular but rather based on the
occasional needs of the households to
help cover expenses during religious
and cultural events as well as paying
the education bills, buying food and
clothing etc. For 28 and 24 percent of
beneficiaries remittance was received
annually and monthly respectively and only 15 percent received support quarterly.
The value of remittances received by households interviewed in the 2010 IHS is presented in Table
7.4 shows by LGA/Sub division and type. Out of the GMD35,339,420 worth of total remittances,
Kanifing received the highest proportion with 33.2 per cent followed by Other Kombos, Kombo
North and URR South with 11.7, 11 and 10.7 per cent respectively. The lowest proportions of total
remittances were recorded in Fonis (1.5%) and Kuntaur (1.9%).
Table 7. 4: Value of remittances received by region and type
LGA/Sub Division
Cash Food Goods Total
Value Percent Value Percent Value Percent Value Percent
Banjul 1,356,263 4.2 15,479 1.0 143,957 13.3 1,516,394 4.3
Kanifing 11,384,441 34.9 135,146 8.4 225,699 20.9 11,744,864 33.2
Kombo North 3,588,263 11.0 68,110 4.2 234,381 21.7 3,891,627 11.0
Other Kombos 3,890,701 11.9 196,168 12.2 49,414 4.6 4,135,775 11.7
Fonis 426,424 1.3 69,897 4.3 29,489 2.7 525,846 1.5
Mansa Konko 1,231,581 3.8 145,455 9.0 81,473 7.6 1,458,662 4.1
NBR West 1,089,706 3.3 123,366 7.6 87,096 8.1 1,300,406 3.7
NBR East 2,184,059 6.7 110,672 6.9 33,623 3.1 2,328,106 6.6
Kuntaur 634,549 1.9 43,817 2.7 2,092 0.2 680,323 1.9
Janjanbureh 2,396,777 7.3 176,599 10.9 38,604 3.6 2,611,650 7.4
URR South 3,274,236 10.0 385,192 23.9 132,680 12.3 3,791,985 10.7
URR North 1,190,810 3.6 143,277 8.9 19,925 1.8 1,353,783 3.8
Total 32,647,811 100.0 1,613,177 100.0 1,078,432 100.0 35,339,420 100.0

Integrated Household Survey - Income and Expenditure Poverty Assessment, 2010 Page 61
The highest proportions of cash remittances were also received by households in Kanifing (34.9%),
Other Kombos (11.9%), Kombo North (11%) and URR South (10%) and the lowest proportions were
observed in Fonis (1.3%) and Kuntaur (1.9%). Regarding remittances in food received by
households, of the total valued of GMD1,613,177, URR South (23.9%), Other Kombos and
Janjanbureh reported the highest proportions with 12.2 and 10.9 per cent respectively. Banjul has the
lowest proportion of remittances received in food with 1 per cent followed by Kuntaur with 2.7 per
cent. The 2010 IHS recorded GMD1,078,432 worth of goods as received by the households
interviewed of which 21.7 and 20.9 per cent were recorded for households in Kombo North and
Kanifing respectively. Kuntaur (0.2%) and URR North (1.8%) have the lowest proportions of
remittances in goods observed during the period.
1World Bank, Migration and Remittances Fact book 2008.

Integrated Household Survey - Income and Expenditure Poverty Assessment, 2010 Page 62
ANNEXES
Annex 1: References
Central Statistics Department, “1992-93 Household Economic Survey Report. The Gambia,” Ministry
of Finance and Economic Affairs, Banjul, The Gambia, 1994.
Central Statistics Department, “1993-94 Household Education and Health Survey Report.
Government of the Gambia, “1998 National Household Poverty Survey Report,” Banjul, The
Gambia, June 2000.
Gambia Bureau of Statistics (GBoS), “Methodology of the Analysis of The Gambia Integrated
Household Survey 2003-2004”, March 2007.
Gambia Bureau of Statistics (GBoS), “The Consumption of Household of The Gambia Integrated
Household Survey 2003-2004”, March 2007.
Gambia Bureau of Statistics (GBoS), “Poverty Analysis of The Gambia Integrated Household Survey
2003-2004”, March 2007.
Gambia Bureau of Statistics (GBoS), “The Gambia Population and Housing Census-2003, Volume 6-
Housing and Household Characteristics.
Integrated Household Survey CSD of The Gambia,” CBEMP, Banjul, 2004.
Jenkins, S.P. Inequality indices, with optional decomposition by subgroup in STATA, May 2008.
Muller,C. “Data Assessment and Analysis of the Integrated Household Survey CSD in The Gambia,”
CBEMP, Banjul, 2004.
Ravallion, M., “Poverty Lines in Theory and Practice,” Living Standards Measurement
Study Working Paper No. 133, July 1998.
The Gambia,” Social Dimensions of Adjustment, 1995.
World Bank, Migration and Remittances Fact book 2008

Integrated Household Survey - Income and Expenditure Poverty Assessment, 2010 Page 63
Annex 2: National Urban Households Consumption based on IHS2010. Item
Code
ITEM CODE N Sum Yearly
Expenditure
Yearly
Exp Per
Hh
1 FOOD AND NON-ALCOHOLIC
BEVERAGES a
1.1.1 Rice 2550 550,279 28,614,487 9,628
1.1.1 Maize 103 5,751 299,069 101
1.1.1 Millet 174 12,341 641,714 216
1.1.1 Sorghum 27 2,886 150,077 50
1.1.1 Findi 35 4,459 231,859 78
1.1.1 Bread 2687 259,537 13,495,948 4,541
1.1.1 Maize flour 61 3,374 175,429 59
1.1.1 Millet flour 61 2,589 134,622 45
1.1.1 Sorghum flour 39 2,219 115,396 39
1.1.2 Beef 1299 195,700 10,176,413 3,424
1.1.2 Sheep/Goat meat (mutton) 183 35,658 1,854,191 624
1.1.2 Chicken 725 63,513 3,302,701 1,111
1.1.2 Pork 14 1,079 56,082 19
1.1.2 Canned meat 409 24,093 1,252,838 422
1.1.3 Fresh Bonga 2314 94,545 4,916,354 1,654
1.1.3 Smoked Bonga 1986 31,135 1,619,034 545
1.1.3 Cat Fish 938 47,958 2,493,828 839
1.1.3 Fresh Grouper/Ladyfish 1226 95,762 4,979,650 1,676
1.1.3 Fresh Baracuda 234 17,174 893,042 300
1.1.3 Dried Couta/Tenny 115 1,933 100,534 34
1.1.3 Oyster 90 4,267 221,878 75
1.1.3 Dried fish 1512 13,407 697,188 235
1.1.3 Shrimps 106 11,655 606,061 204
1.1.3 Snail fish 661 4,017 208,866 70
1.1.3 Saul fish 41 1,391 72,316 24
1.1.3 Tilapia 330 15,923 828,005 279
1.1.3 Crab 70 1,590 82,668 28
1.1.3 Tin Fish (Sardines) 540 17,586 914,459 308
1.1.4 Eggs 1395 44,510 2,314,538 779
1.1.4 Fresh Milk 160 7,564 393,325 132
1.1.4 Sour Milk 679 26,817 1,394,492 469
1.1.4 Evaporated Milk 1250 46,589 2,422,628 815
1.1.4 Powdered Milk 424 19,920 1,035,821 349
1.1.4 Cream 79 2,290 119,055 40
1.1.4 Cheese 33 1,832 95,265 32
1.1.4 Yoghurt 49 2,258 117,398 40

Integrated Household Survey - Income and Expenditure Poverty Assessment, 2010 Page 64
Item
Code
ITEM CODE N Sum Yearly
Expenditure
Yearly
Exp Per
Hh
1.1.4 Vitalait 1028 30,014 1,560,723 525
1.1.5 Groundnut oil 253 15,760 819,523 276
1.1.5 Palm oil 2305 98,251 5,109,064 1,719
1.1.5 Margarine 265 4,176 217,130 73
1.1.5 Butter 1342 32,786 1,704,856 574
1.1.5 Vegetable oil 2270 102,230 5,315,980 1,789
1.1.5 Mayonnaise 1434 39,447 2,051,239 690
1.1.5 Palm Kernels oil 54 1,767 91,902 31
1.1.5 Peanut butter 1673 34,572 1,797,746 605
1.1.6 Coco nuts 275 4,014 208,735 70
1.1.6 Banana 847 23,537 1,223,947 412
1.1.6 Oranges 562 13,222 687,540 231
1.1.6 Mangoes 515 11,886 618,078 208
1.1.6 Lime 544 5,981 310,994 105
1.1.6 Apple 231 8,817 458,459 154
1.1.6 Baobab fruit 176 5,322 276,729 93
1.1.6 Palm nut (fruit kernels) 69 1,573 81,780 28
1.1.6 Daharr 824 5,476 284,745 96
1.1.6 Cashew 53 430 22,376 8
1.1.6 Paw – paw 114 2,601 135,277 46
1.1.6 Water melon 186 5,506 286,324 96
1.1.6 Ananas 15 351 18,274 6
1.1.6 Grapes 28 2,217 115,268 39
1.1.6 Cabaa 160 3,022 157,161 53
1.1.6 Avocado 7 202 10,488 4
1.1.6 Groundnuts_Unshelled 2972 2,543,137 2,543,137 856
1.1.6 Groundnuts_Shelled 2972 1,882,680 1,882,680 633
1.1.6 Kolanuts 2972 808,490 808,490 272
1.1.6 Plum (Saloum Plum) 47 466 24,240 8
1.1.7 Potatoes(Irish) 1719 45,960 2,389,898 804
1.1.7 Potatoes(sweet) 973 14,492 753,582 254
1.1.7 Cassava 1833 32,394 1,684,493 567
1.1.7 Dry Beans 461 10,922 567,943 191
1.1.7 Small Pepper-fresh 1464 16,404 853,033 287
1.1.7 Tomatoes-fresh 2253 44,433 2,310,510 777
1.1.7 Bitter Tomato 1936 31,889 1,658,212 558
1.1.7 Garden eggs 1722 21,019 1,092,980 368
1.1.7 Okra 1660 33,306 1,731,927 583
1.1.7 Onion 2603 109,759 5,707,487 1,920
1.1.7 Pumpkin 415 5,020 261,029 88
1.1.7 Big Red Pepper 2394 48,263 2,509,654 844

Integrated Household Survey - Income and Expenditure Poverty Assessment, 2010 Page 65
Item
Code
ITEM CODE N Sum Yearly
Expenditure
Yearly
Exp Per
Hh
1.1.7 Kren-Kren 843 9,092 472,795 159
1.1.7 Bisap 1619 14,723 765,618 258
1.1.7 Cabbage 1348 21,474 1,116,648 376
1.1.7 Lettuce(salad) 410 7,577 394,012 133
1.1.7 Tomato puree(paste) 2472 59,393 3,088,444 1,039
1.1.7 Carrot 497 8,926 464,159 156
1.1.7 Cucumber 294 5,001 260,034 87
1.1.7 Onion Leaves 1180 7,569 393,594 132
1.1.7 Green peas 71 1,040 54,096 18
1.1.7 Okra Powder 317 1,645 85,552 29
1.1.7 Green Leaves 849 10,114 525,918 177
1.1.8 Sugar 2874 210,987 10,971,334 3,692
1.1.8 Black mint 620 3,220 167,415 56
1.1.8 Chewing gum 699 5,892 306,372 103
1.1.8 Honey 196 7,652 397,892 134
1.1.8 Jam 25 802 41,679 14
1.1.8 Chocolate 121 3,297 171,435 58
1.1.8 Ice cream 150 7,419 385,814 130
1.1.8 Mint stick 891 7,005 364,272 123
1.1.9 Salt 2555 13,368 695,127 234
1.1.9 Garlic 1481 11,697 608,252 205
1.1.9 Maggi tube 2600 50,687 2,635,701 887
1.1.9 Small dry pepper 476 3,975 206,686 70
1.1.9 Locust beans(Neteetu) 1297 8,455 439,652 148
1.1.9 Chilli powder(black pepper) 1860 15,344 797,867 268
1.1.9 Vinegar 693 5,058 263,010 88
1.1.9 Powder Pepper 236 1,925 100,092 34
1.2 Non-alcoholic Beverages 2972 5,803,666 5,803,666 1,953
Group 1 total 56,981
2 ALCOHOLIC BEVERAGES, TOBACCO
2.1 Alcoholic Beverages 2972 387,164 387,164 130
2.2.0 Cigarette or other tobacco a 656 40,287 2,094,929 705
Group 2 total 835
3 CLOTHING AND FOOTWEAR
3.1.1 Cloth, thread, other sewing material 417 254,486 1,017,944 343
3.1.2 Infant Clothing 616 171,527 686,110 231
3.1.2 Baby nappies/diapers 547 113,237 452,948 152
3.1.2 Boy‟s trousers 804 197,566 790,265 266
3.1.2 Boy‟s shirts 830 151,510 606,042 204
3.1.2 Boy‟s jackets 61 8,426 33,705 11

Integrated Household Survey - Income and Expenditure Poverty Assessment, 2010 Page 66
Item
Code
ITEM CODE N Sum Yearly
Expenditure
Yearly
Exp Per
Hh
3.1.2 Boy‟s undergarments 380 26,067 104,269 35
3.1.2 Boy‟s other clothing 554 201,709 806,837 271
3.1.2 Men‟s trouser 512 125,926 503,702 169
3.1.2 Men‟s shirts 488 97,359 389,434 131
3.1.2 Men‟s jackets 34 5,730 22,919 8
3.1.2 Men‟s undergarments 212 20,052 80,206 27
3.1.2 Men‟s other clothing 466 247,114 988,456 333
3.1.2 Girl‟s blouse/shirt 506 129,606 518,425 174
3.1.2 Girl‟s dress/skirt 671 185,632 742,526 250
3.1.2 Girl‟s undergarments 509 40,617 162,467 55
3.1.2 Girl‟s other clothing 739 342,840 1,371,361 461
3.1.2 Lady‟s blouse/shirt 312 99,039 396,158 133
3.1.2 Lady‟s dress/skirt 373 193,757 775,028 261
3.1.2 Lady‟s undergarments 411 56,581 226,323 76
3.1.2 Lady‟s other clothing 1123 852,563 3,410,254 1,147
3.1.2 Uniforms and sports clothes 674 299,874 1,199,495 404
3.1.3 Tailoring charges 1178 696,720 8,360,638 2,813
3.1.4 Laundry, dry cleaning, tailoring fees 1424 1,079,743 4,318,973 1,453
3.2.1 Boy‟s shoes 1312 246,245 984,979 331
3.2.1 Men‟s shoes 960 161,284 645,136 217
3.2.1 Girl‟s shoes 1439 247,403 989,614 333
3.2.1 Lady‟s shoes 1663 295,177 1,180,709 397
Group 3 total 10,688
4 HOUSING,WATER, ELECTRICITY, GAS AND OTHER FUELS
4.3.0 Repairs and Maintenance to dwelling b 96 166,098 1,993,175 671
4.3.1 Paint, putty c 75 52,975 211,900 71
4.3.1 Building items – cement, bricks, timber,
iron sheets, tools, etc d
295 2252188 2252188 758
4.3.1 Wood poles d 3 2365 2365 1
4.3.1 Grass for thatching roof or other use d 4 3395 3395 1
4.5.1 Electricity (Cash power) a 896 175,084 9,104,361 3,063
4.5.2 Paraffin or Kerosene a 30 1,359 70,675 24
4.5.4 Charcoal a 2026 126,463 6,576,083 2,213
4.5.4 Firewood a 1450 135,566 7,049,410 2,372
Rent paid d 2894 11,754,262 11,754,262 3,955
Imputed Rent 2894 5,140,874 5,140,874 1,730
Group 4 total 14,858
5 FURNISHING,HOUSEHOLD EQUIPMENT AND ROUTINE HOUSEHOLD MAINTENANCE
5.1.1 Light bulbs b 381 15,002 180,018 61
5.1.1 Paraffin lamp (hurricane or pressure) c 6 666 2,662 1
5.1.1 Bulbs, Plugs, Wire c 467 32,794 131,177 44

Integrated Household Survey - Income and Expenditure Poverty Assessment, 2010 Page 67
Item
Code
ITEM CODE N Sum Yearly
Expenditure
Yearly
Exp Per
Hh
5.1.1 Mattress d 527 593555 593555 200
5.1.1 Bed d 541 3374849 3374849 1,136
5.1.1 Table d 704 439865 439865 148
5.1.1 Chair d 971 2214168 2214168 745
5.1.1 Upholstered chair, sofa set d 16 105400 105400 35
5.1.1 Coffee table (for sitting room) d 5 6960 6960 2
5.1.1 Cupboard, drawers, bureau d 20 71500 71500 24
5.1.1 Clock d 20 3025 3025 1
5.1.2 Carpet, rugs, drapes, curtains d 1341 890793 890793 300
5.1.2 Mat – sleeping or drying maize flour d 3008 88,247 88,247 30
5.2.0 Linen – towels, sheets, blankets 475 84243 84243 28
5.2.0 Mosquito net d 282 60540 60540 20
5.3.1 Fan d 731 536171 536171 180
5.3.1 Air conditioner d 11 44000 44000 15
5.3.1 Radio („wireless‟) d 1155 412455 412455 139
5.3.1 Tape or CD player, HiFi d 478 639401 639401 215
5.3.1 Television and VCR d 626 1667675 1667675 561
5.3.1 Sewing Machine d 37 257450 257450 87
5.3.1 Electronic or gas stove, hot plate d 223 116835 116835 39
5.3.1 Refrigerator d 364 1387520 1387520 467
5.3.1 Washing machine d 7 84000 84000 28
5.3.1 Iron (for pressing clothes d 25 4620 4620 2
5.3.3 Repairs to household and personal items
(radios, Watches etc) b
92 27,761 333,133 112
5.4.0 Bowls, glassware, plates, silverware etc c 254 70,986 283,944 96
5.4.0 Cooking utensils (cook pots, stirring
spoons etc) c
297 55,263 221,053 74
5.4.0 Kerosene/Paraffin stove d 10 4200 4200 1
5.4.1 Mortar/pestle d 556 105262 105262 35
5.5.1 Repairs to farm implements (seeders,
weeders power tillers, etc) d
3 286 3,437 1
5.5.1 Generator d 9 11400 11400 4
5.5.1 Seeder d 1 800 800 0
5.5.1 Weeder (Hoe machine) d 1 850 850 0
5.5.2 Torch/flashlight c 733 32,440 129,759 44
5.5.2 Needles, nuts, bolts, screw, nails c 238 9,717 38,870 13
5.5.2 Wheelbarrow d 10 12500 12500 4
5.5.2 Hand sprayer d 1 400 400 0
5.5.2 Hoe d 19 2630 2630 1
5.5.2 Axe d 19 2475 2475 1
5.6.1 Insecticides (mosquito coils, repellants,
sprays etc) a
1101 40,918 2,127,728 716
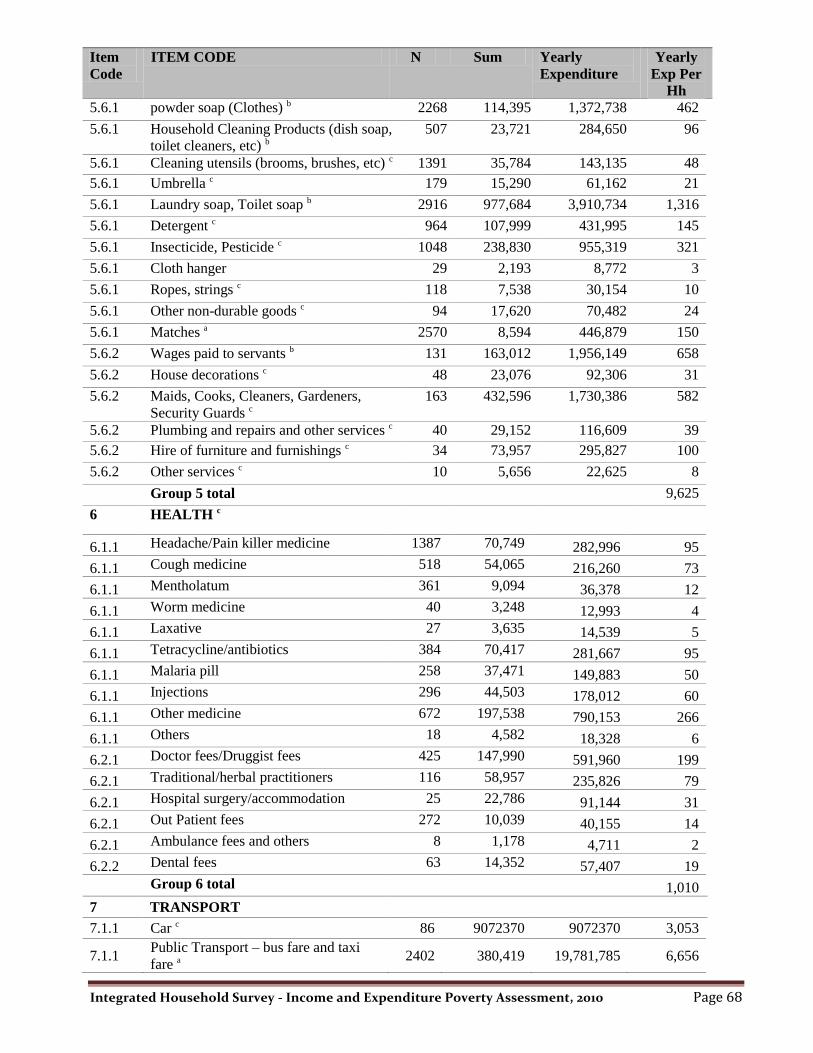
Integrated Household Survey - Income and Expenditure Poverty Assessment, 2010 Page 68
Item
Code
ITEM CODE N Sum Yearly
Expenditure
Yearly
Exp Per
Hh
5.6.1 powder soap (Clothes) b 2268 114,395 1,372,738 462
5.6.1 Household Cleaning Products (dish soap,
toilet cleaners, etc) b
507 23,721 284,650 96
5.6.1 Cleaning utensils (brooms, brushes, etc) c 1391 35,784 143,135 48
5.6.1 Umbrella c 179 15,290 61,162 21
5.6.1 Laundry soap, Toilet soap b 2916 977,684 3,910,734 1,316
5.6.1 Detergent c 964 107,999 431,995 145
5.6.1 Insecticide, Pesticide c 1048 238,830 955,319 321
5.6.1 Cloth hanger 29 2,193 8,772 3
5.6.1 Ropes, strings c 118 7,538 30,154 10
5.6.1 Other non-durable goods c 94 17,620 70,482 24
5.6.1 Matches a 2570 8,594 446,879 150
5.6.2 Wages paid to servants b 131 163,012 1,956,149 658
5.6.2 House decorations c 48 23,076 92,306 31
5.6.2 Maids, Cooks, Cleaners, Gardeners,
Security Guards c
163 432,596 1,730,386 582
5.6.2 Plumbing and repairs and other services c 40 29,152 116,609 39
5.6.2 Hire of furniture and furnishings c 34 73,957 295,827 100
5.6.2 Other services c 10 5,656 22,625 8
Group 5 total 9,625
6 HEALTH c
6.1.1 Headache/Pain killer medicine 1387 70,749 282,996 95
6.1.1 Cough medicine 518 54,065 216,260 73
6.1.1 Mentholatum 361 9,094 36,378 12
6.1.1 Worm medicine 40 3,248 12,993 4
6.1.1 Laxative 27 3,635 14,539 5
6.1.1 Tetracycline/antibiotics 384 70,417 281,667 95
6.1.1 Malaria pill 258 37,471 149,883 50
6.1.1 Injections 296 44,503 178,012 60
6.1.1 Other medicine 672 197,538 790,153 266
6.1.1 Others 18 4,582 18,328 6
6.2.1 Doctor fees/Druggist fees 425 147,990 591,960 199
6.2.1 Traditional/herbal practitioners 116 58,957 235,826 79
6.2.1 Hospital surgery/accommodation 25 22,786 91,144 31
6.2.1 Out Patient fees 272 10,039 40,155 14
6.2.1 Ambulance fees and others 8 1,178 4,711 2
6.2.2 Dental fees 63 14,352 57,407 19
Group 6 total 1,010
7 TRANSPORT
7.1.1 Car c 86 9072370 9072370 3,053
7.1.1 Public Transport – bus fare and taxi
fare a 2402 380,419 19,781,785 6,656

Integrated Household Survey - Income and Expenditure Poverty Assessment, 2010 Page 69
Item
Code
ITEM CODE N Sum Yearly
Expenditure
Yearly
Exp Per
Hh
7.1.2 Motorcycle/scooter c 30 410250 410250 138
7.1.3 Bicycle d 383 514400 514400 173
7.1.4 Donkey Cart d 1 1000 1000 0
7.2.1 Old tires/tubes/parts c 73 62,433 249,731 84
7.2.2 Petrol or Diesel b 309 470,416 5,644,996 1,899
7.2.3 Motor vehicle service, repair, or parts b 140 267,938 3,215,251 1,082
7.2.3 Bicycles service, repairs, or parts b 185 26,214 314,568 106
7.3.2 Inland water transport c 443 35,076 140,305 47
7.3.2 Car/motor cycle/bicycle/boat etc.c 106 187,269 749,077 252
7.3.2 Transport to and from school c 483 624,440 2,497,761 840
7.3.3 Air transport c 21 644,705 2,578,821 868
7.3.4 Ocean transport c 52 5,589 22,354 8
7.3.6 Other transport c 26 10,926 43,704 15
Group 7 total 15,221
8 COMMUNICATION
8.1.0 Postage stamps or other postal fees b 61 23,223 278,677 94
8.2.0 Mobile telephone d 3009 2,953,175 2,953,175 994
8.3.0 Mobile communication a 1967 101,709 5,288,870 1,780
8.3.0 Other communication services a 107 7,065 367,361 124
8.3.0 Fixed telephone line d 29 54410 54410 18
Group 8 total 3,009
9 RECREATION AND CULTURE
9.1.2 Film, film processing, camera d 51 63572 63572 21
9.1.3 Computer d 149 1167430 1167430 393
9.1.4 Cassette/DVD rental a 103 7,112 369,845 124
9.1.4 Music or video cassette or CD c 58 9,494 37,976 13
9.3.1 Sports and hobby equipment, musical
instruments, toys c 104 25570 25570 9
9.4.1 Football, cinema, video tickets &
charges a 126 7,826 93,918 32
9.4.1 Tickets for sports/entertainment events c 31 5,554 22,215 7
9.4.2 Tickets for clubs and other
entertainments b 68 5,423 282,021 95
9.4.2 Membership of sports/video societies &
other clubs b 18 5,961 71,531 24
9.5.1 Stationery supplies – writing pad, pens,
pencils, etc b 764 44,826 537,911 181
9.5.1 Books and magazines b 134 9,399 112,782 38
9.5.1 School books c 759 175,779 703,117 237
9.5.1 School supplies c 310 92,600 370,402 125
9.5.2 Newspapers b 116 17,500 209,995 71
9.5.4 Drawing equipment and accessories b 73 9,409 112,906 38

Integrated Household Survey - Income and Expenditure Poverty Assessment, 2010 Page 70
Item
Code
ITEM CODE N Sum Yearly
Expenditure
Yearly
Exp Per
Hh
9.5.4 Other items and repairs (writing and
drawing equipment and supplies) b 26 3,161 37,937 13
9.5.4 Stationery items (not for school) b 10 1,241 4,965 2
Group 9 total 1,421
10 EDUCATION c
10 School and registration fees 742 1,035,444 4,141,776 1,394
10 Examination fees 76 51,426 205,704 69
10 Private tuition 411 287,958 1,151,833 388
10 Other expenses, specify; 168 69,456 277,824 93
10 Contributions to parents association 152 18,105 72,420 24
10 Lunch and pocket money 1868 1,998,607 7,994,429 2,690
Group 10 total 4,658
11.2.0 Night‟s lodging in guest house or hotel 12 3,605 14,420 5
12.1.1 Toothpaste, Toothbrush/cosmetics b 1610 92,152 1,105,830 372
12.1.1 Glycerine, Vaseline, Skin creams b 1809 138,851 1,666,206 561
12.1.1
Other Personal Products (Shampoo,
Razor blades, Cosmetic, Hair Product
etc) b
1059 46,149 553,792 186
12.1.1 Barber, beauty saloon b 582 77,531 930,377 313
12.1.3 Shaving equipment/permanent wave set b 203 7,825 93,895 32
12.1 Other personal effects b 79 12,449 149,389 50
12.1.3 Toilet paper b 126 10,045 120,542 41
12.3.2 Mortgage – regular payment to purchase
house b 3 1,890 22,680 8
12.3.2 Other personal care services b 68 9,084 109,008 37
12.4.0 Donation – to mosque, church, charity,
beggar, etc b 1734 193,331 2,319,976 781
12.4.0 Council rates d 1116 1309545 1309545 441
12.5.3 Sickness insurance premia d 10 11,702 46,809 16
12.5.3 Accident insurance premia d 3 6,178 24,710 8
12.5.3 Other health related insurance premia d 8 11,682 46,729 16
12.5.3 Insurance – health, auto, home, life, etc d 161 301346 301346 101
12.7.0 Milling Fees, Grains b 307 13,214 158,568 53
12.7.0 Fines or legal fees d 2 1980 1980 1
12.7.0 Bride wealth or cost d 29 139,825 139,825 47
12.7.0 Marriage ceremony costs d 219 667,740 667,740 225
12.7.0 Funeral d 465 288,995 288,995 97
Group 12 total 3,389
Per
Household

Integrated Household Survey - Income and Expenditure Poverty Assessment, 2010 Page 71
Item
Code
ITEM CODE N Sum Yearly
Expenditure
Yearly
Exp Per
Hh
18,236
9,565
121,696
651 4,346

Integrated Household Survey - Income and Expenditure Poverty Assessment, 2010 Page 72
Annex 3: National Rural Households Consumption based on IHS2010. Item
Code
ITEM CODE
N Sum
Yearly
Expenditure
Yly Exp Per
Household
1.FOOD AND NON-ALCOHOLIC BEVERAGES a
1.1.1 Rice 1,742 413,457 21,499,758 11,813
1.1.1 Maize 196 6,317 328,508 180
1.1.1 Millet 530 15,927 828,225 455
1.1.1 Sorghum 69 3,864 200,938 110
1.1.1 Findi 11 534 27,793 15
1.1.1 Bread 1,262 87,804 4,565,825 2,509
1.1.1 Maize flour 27 539 28,051 15
1.1.1 Millet flour 20 35 1,794 1
1.1.1 Sorghum flour 25 307 15,959 9
1.1.2 Beef 473 73,499 3,821,955 2,100
1.1.2 Sheep/Goat meat (mutton) 127 19,053 990,774 544
1.1.2 Chicken 219 14,052 730,720 401
1.1.2 Pork 4 50 2,587 1
1.1.2 Canned meat 41 2,300 119,594 66
1.1.3 Fresh Bonga 1,520 84,790 4,409,058 2,423
1.1.3 Smoked Bonga 923 21,066 1,095,455 602
1.1.3 Cat Fish 123 4,897 254,664 140
1.1.3 Fresh Grouper/Ladyfish 282 19,070 991,616 545
1.1.3 Fresh Baracuda 31 1,957 101,754 56
1.1.3 Dried Couta/Tenny 49 781 40,588 22
1.1.3 Oyster 17 456 23,689 13
1.1.3 Dried fish 672 12,122 630,334 346
1.1.3 Shrimps 25 726 37,747 21
1.1.3 Snail fish 70 513 26,679 15
1.1.3 Saul fish 19 959 49,891 27
1.1.3 Tilapia 362 14,662 762,399 419
1.1.3 Crab 13 296 15,373 8
1.1.3 Tin Fish (Sardines) 91 3,220 167,465 92
1.1.4 Eggs 273 7,032 365,656 201
1.1.4 Fresh Milk 398 13,569 705,586 388
1.1.4 Sour Milk 406 13,436 698,696 384
1.1.4 Evaporated Milk 440 15,771 820,103 451
1.1.4 Powdered Milk 58 2,223 115,586 64 1.1.4 Cream 12 454 23,601 13 1.1.4 Vitalait 374 10,448 543,271 299
1.1.5 Groundnut oil 75 4,423 230,011 126
1.1.5 Palm oil 1,321 62,380 3,243,775 1,782
1.1.5 Margarine 103 2,450 127,394 70

Integrated Household Survey - Income and Expenditure Poverty Assessment, 2010 Page 73
Item
Code
ITEM CODE
N Sum
Yearly
Expenditure
Yly Exp Per
Household
1.1.5 Butter 308 5,779 300,530 165
1.1.5 Vegetable oil 1,565 83,433 4,338,532 2,384 1.1.5 Mayonnaise 286 7,078 368,036 202
1.1.5 Palm Kernels oil 35 991 51,543 28
1.1.5 Peanut butter 1,040 17,191 893,949 491
1.1.6 Coco nuts 93 2,377 123,616 68
1.1.6 Banana 278 7,908 411,225 226
1.1.6 Oranges 148 1,376 71,576 39
1.1.6 Mangoes 208 2,167 112,703 62
1.1.6 Lime 91 834 43,390 24
1.1.6 Apple 13 417 21,663 12
1.1.6 Baobab fruit 87 1,728 89,850 49
1.1.6 Palm nut (fruit kernels) 13 291 15,152 8
1.1.6 Daharr 153 1,062 55,209 30
1.1.6 Cashew 50 13 687 0
1.1.6 Paw - paw 36 305 15,883 9
1.1.6 Water melon 30 425 22,119 12
1.1.6 Ananas 2 24 1,232 1
1.1.6 Grapes 1 - - -
1.1.6 Cabaa 11 81 4,186 2
1.1.6 Groundnuts_Unshelled 1,820 1,134,229 1,134,229 623
1.1.6 Groundnuts_Shelled 1,820 839,668 839,668 461
1.1.6 Kolanuts 1,820 360,583 360,583 198
1.1.6 Plum (Saloum Plum) 9 179 9,286 5
1.1.7 Potatoes(Irish) 532 18,944 985,069 541
1.1.7 Potatoes(sweet) 379 8,385 436,021 240
1.1.7 Cassava 600 11,820 614,635 338
1.1.7 Dry Beans 218 5,468 284,317 156
1.1.7 Small Pepper-fresh 955 10,090 524,669 288
1.1.7 Tomatoes-fresh 917 17,007 884,341 486
1.1.7 Bitter Tomato 955 17,994 935,671 514
1.1.7 Garden eggs 689 9,703 504,564 277
1.1.7 Okra 595 8,242 428,570 235
1.1.7 Onion 1,669 64,316 3,344,424 1,838
1.1.7 Pumpkin 111 1,505 78,271 43
1.1.7 Big Red Pepper 950 15,682 815,468 448
1.1.7 Kren-Kren 189 1,602 83,316 46
1.1.7 Bisap 626 3,807 197,968 109
1.1.7 Cabbage 245 4,085 212,409 117
1.1.7 Lettuce(salad) 63 1,131 58,812 32
1.1.7 Tomato puree(paste) 1,526 39,725 2,065,693 1,135

Integrated Household Survey - Income and Expenditure Poverty Assessment, 2010 Page 74
Item
Code
ITEM CODE
N Sum
Yearly
Expenditure
Yly Exp Per
Household
1.1.7 Carrot 30 623 32,387 18
1.1.7 Cucumber 17 309 16,063 9
1.1.7 Onion Leaves 336 2,161 112,389 62
1.1.7 Green peas 6 40 2,072 1
1.1.7 Okra Powder 90 991 51,550 28
1.1.7 Green Leaves 236 2,431 126,434 69
1.1.8 Sugar 1,780 175,515 9,126,799 5,015
1.1.8 Black mint 486 3,138 163,166 90
1.1.8 Chewing gum 151 1,134 58,980 32
1.1.8 Honey 40 1,158 60,201 33
1.1.8 Chocolate 10 156 8,097 4
1.1.8 Ice cream 10 105 5,475 3
1.1.8 Mint stick 564 4,925 256,097 141
1.1.9 Salt 1,701 12,454 647,583 356
1.1.9 Garlic 356 2,620 136,224 75
1.1.9 Maggi tube 1,678 35,686 1,855,693 1,020
1.1.9 Small dry pepper 538 4,608 239,590 132
1.1.9 Locust beans(Neteetu) 651 5,425 282,089 155
1.1.9 Chilli powder(black pepper) 911 8,658 450,222 247
1.1.9 Vinegar 248 1,795 93,326 51
1.1.9 Powder Pepper 58 385 20,044 11
1.2 Non-alcoholic Beverages 1,820 2,588,413 2,588,413 1,422
Group 1 total 47,646
2. ALCOHOLIC BEVERAGES,TOBACCO
2.1 Alcoholic Beverages 1,820 172,674 172,674 95
2.2.0 Cigarette or other tobacco a 479 19,788 1,028,989 565
Group 2 total 660
3. CLOTHING, TEXTILES & FOOTWEAR
3.1.1 Cloth, thread, other sewing
material
268 48,752 195,010 107
3.1.2 Infant Clothing 473 87,038 348,153 191
3.1.2 Baby nappies/diapers 297 27,160 108,641 60
3.1.2 Boy‟s trousers 733 169,589 678,357 373
3.1.2 Boy‟s shirts 699 119,122 476,486 262
3.1.2 Boy‟s jackets 35 5,299 21,196 12
3.1.2 Boy‟s undergarments 312 15,052 60,210 33
3.1.2 Boy‟s other clothing 550 178,200 712,802 392
3.1.2 Men‟s trouser 364 75,689 302,755 166
3.1.2 Men‟s shirts 313 48,411 193,645 106
3.1.2 Men‟s jackets 15 1,676 6,703 4

Integrated Household Survey - Income and Expenditure Poverty Assessment, 2010 Page 75
Item
Code
ITEM CODE
N Sum
Yearly
Expenditure
Yly Exp Per
Household
3.1.2 Men‟s undergarments 199 12,366 49,462 27
3.1.2 Men‟s other clothing 408 149,175 596,701 328
3.1.2 Girl‟s blouse/shirt 385 70,381 281,525 155
3.1.2 Girl‟s dress/skirt 365 89,588 358,352 197
3.1.2 Girl‟s undergarments 385 22,303 89,213 49
3.1.2 Girl‟s other clothing 720 297,561 1,190,243 654
3.1.2 Lady‟s blouse/shirt 234 68,438 273,751 150
3.1.2 Lady‟s dress/skirt 231 59,214 236,855 130
3.1.2 Lady‟s undergarments 263 24,537 98,150 54
3.1.2 Lady‟s other clothing 882 580,924 2,323,695 1,277
3.1.2 School supplies 170 38,462 153,847 85
3.1.3 Tailoring charges 788 369,461 4,433,532 2,436
3.1.4 Laundry, dry cleaning,
tailoring fees
985 656,795 2,627,178 1,444
3.2.1 Boy‟s shoes 1,102 184,928 739,713 406
3.2.1 Men‟s shoes 781 96,214 384,858 211
3.2.1 Girl‟s shoes 1,133 158,312 633,250 348
3.2.1 Lady‟s shoes 1,203 170,321 681,286 374
Group 3 total 10,031
4. HOUSING,WATER,ELECTRICITY,GAS AND OTHER FUELS
4.3.0 Repairs and Maintenance to
dwelling b
31 30,904 370,848 204
4.3.1 Paint, putty c 17 3,747 14,990 8
4.3.1 Building items – cement,
bricks, timber, iron sheets,
tools, etc d
233 1,007,782 928,454 510
4.3.1 Wood poles d 10 5,810 5,810 3
4.3.1 Grass for thatching roof or
other use d
32 11,810 11,810 6
4.5.1 Electricity (Cash power) a 52 10,011 520,562 286
4.5.2 Paraffin or Kerosene a 20 947 49,244 27
4.5.4 Charcoal a 409 14,570 757,627 416
4.5.4 Firewood a 397 35,085 1,824,418 1,002
Rent paid d 1,889 418,602 418,602 230
Imputed Rent 1,889 1,111,410 1,111,410 611
Group 4 total 3,304
5 FURNISHING,HOUSEHOLD EQUIPMENT AND ROUTINE HOUSEHOLD
MAINTENANCE
5.1.1 Light bulbs b 43 2,018 24,219 13
5.1.1 Paraffin lamp (hurricane or
pressure) c
10 1,032 4,126 2

Integrated Household Survey - Income and Expenditure Poverty Assessment, 2010 Page 76
Item
Code
ITEM CODE
N Sum
Yearly
Expenditure
Yly Exp Per
Household
5.1.1 Bulbs, Plugs, Wire c 57 4,347 17,389 10
5.1.1 Mattress d 422 393,622 393,622 216
5.1.1 Bed d 271 1,405,234 2,581,334 1,418
5.1.1 Table d 350 132,500 132,500 73
5.1.1 Chair d 466 758,548 758,548 417
5.1.1 Cupboard, drawers, bureau d 1 2,500 2,500 1
5.1.1 Clock d 2 120 120 0
5.1.2 Carpet, rugs, drapes, curtains d 825 383,843 383,843 211
5.1.2 Mat – sleeping or drying
maize flour d
529 111,591 111,591 61
5.2.0 Linen – towels, sheets,
blankets d
1,027 383,942 383,942 211
5.2.0 Mosquito net d 295 64,725 64,725 36
5.3.1 Fan d 55 98,615 98,615 54
5.3.1 Air conditioner d 5 990 990 1
5.3.1 Radio („wireless‟) d 903 281,210 281,210 155
5.3.1 Tape or CD player, HiFi d 203 246,730 246,730 136
5.3.1 Television and VCR d 128 302,828 302,828 166
5.31 Electronic or gas stove, hot
plate d
12 10,980 10,980 6
5.3.1 Sewing Machine d 9 30,198 30,198 17
5.3.1 Kerosene/Paraffin stove d 7 3,870 3,870 2
5.3.1 Refrigerator d 31 204,900 204,900 113
5.3.1 Iron (for pressing clothes) d 2 175 175 0
5.3.3 Repairs to household and personal
items (radios, Watches etc) b
77 11,078 132,939 73
5.4.0 Bowls, glassware, plates,
silverware etc c
229 122,371 489,485 269
5.4.0 Cooking utensils (cook pots,
stirring spoons etc) c
222 65,790 263,159 145
5.4.1 Mortar/pestle d 393 185,504 185,504 102
5.5.1 Repairs to farm implements
(seeders, weeders power
tillers, etc) d
54 13,050 156,599 86
5.5.1 Generator d 2 3,200 4,731 3
5.5.1 Seeder d 1 2,000 42,579 23
5.5.2 Torch/flashlight c 860 51,320 205,279 113
5.5.2 Needles, nuts, bolts, screw,
nails c
404 9,402 37,608 21
5.5.2 Wheelbarrow d 1 1,100 1,100 1
5.5.2 Hoe d 25 6,260 6,260 3
5.5.2 Axe d 17 3,460 3,460 2

Integrated Household Survey - Income and Expenditure Poverty Assessment, 2010 Page 77
Item
Code
ITEM CODE
N Sum
Yearly
Expenditure
Yly Exp Per
Household
5.6.1 Insecticides (mosquito coils,
repellants, sprays etc) a
121 3,749 194,950 107
5.6.1 powder soap (Clothes) b 957 39,231 470,774 259
5.6.1 Household Cleaning Products
(dish soap, toilet cleaners, etc) b
76 2,920 35,046 19
5.6.1 Cleaning utensils (brooms,
brushes, etc) c
839 20,950 83,799 46
5.6.1 Umbrella c 117 10,371 41,485 23
5.6.1 Laundry soap, Toilet soap b 1,736 670,798 2,683,193 1,474
5.6.1 Detergent c 312 26,932 107,727 59
5.6.1 Insecticide, Pesticide c 82 13,713 54,851 30
5.6.1 Cloth hanger c 5 255 1,021 1
5.6.1 Ropes, strings c 235 24,207 96,829 53
5.6.1 Other non-durable goods c 36 13,976 55,904 31
5.6.1 Matches a 1,711 6,063 315,260 173
5.6.2 Wages paid to servants b 9 6,485 77,816 43
5.6.2 House decorations c 14 12,962 51,848 28
5.6.2 Maids, Cooks, Cleaners,
Gardeners, Security Guards c
13 12,306 49,224 27
5.6.2 Plumbing and repairs and
other services c
3 739 2,956 2
5.6.2 Hire of furniture and
furnishings c
5 8,216 32,864 18
5.6.2 Other services c 4 3,296 13,185 7
Group 5 total 6,558
6 HEALTH c
6.1.1 Headache/Pain killer medicine 1,122 52,605 210,419 116
6.1.1 Cough medicine 265 22,239 88,955 49
6.1.1 Mentholatum 357 7,742 30,968 17
6.1.1 Worm medicine 34 2,013 8,052 4
6.1.1 Laxative 14 950 3,801 2
6.1.1 Tetracycline/antibiotics 179 31,989 127,955 70
6.1.1 Malaria pill 126 10,203 40,814 22
6.1.1 Injections 151 18,672 74,687 41
6.1.1 Other medicine 279 51,623 206,491 113
6.1.1 Others 16 688 2,753 2
6.2.1 Doctor fees/Druggist fees 173 55,129 220,517 121
6.2.1 Traditional/herbal
practitioners
91 24,323 97,293 53
6.2.1 Hospital
surgery/accommodation
18 8,338 33,352 18
6.2.1 Out Patient fees 498 10,548 42,191 23
6.2.1 Ambulance fees and others 11 999 3,996 2

Integrated Household Survey - Income and Expenditure Poverty Assessment, 2010 Page 78
Item
Code
ITEM CODE
N Sum
Yearly
Expenditure
Yly Exp Per
Household
6.2.2 Dental fees 18 2,655 10,619 6
Group 6 total 661
7 TRANSPORT
7.1.1 Car c 1 6,900 6,900 4
7.1.1 Public Transport – bus fare and
taxi fare a
1,038 152,177 7,913,194 4,348
7.1.2 Motorcycle/scooter d 62 1,369,600 1,369,600 753
7.1.3 Bicycle d 315 460,615 460,615 253
7.1.4 Donkey Cart d 1 10,000 10,000 5
7.2.1 Old tyres/tubes/parts c 118 49,576 198,305 109
7.2.2 Petrol or Diesel b
141 130,635 1,567,614 861
7.2.3 Motor vehicle service,
repair, or parts b
43 60,827 729,924 401
7.2.3 Bicycles service, repairs, or
parts b
241 32,392 388,710 214
7.3.2 Inland water transport c 450 29,815 119,261 66
7.3.2 Car/motor
cycle/bicycle/boat etc. c
74 72,225 288,898 159
7.3.2 Transport to and from
school c
60 65,781 263,126 145
7.3.2 Air transport c 4 24,898 99,590 55
7.3.3 Ocean transport c 41 2,521 10,084 6
7.1.1 Boat or cane c 1 6,900 6,900 4
7.3.4 Other transport c 7 955 3,821 2
Group 7 total 7,564
8 COMMUNICATION
8.1.0 Postage stamps or other
postal fees d
35 1,553 18,641 10
8.3.0 Mobile telephone d 1,104 3,690,850 3,690,850 2,028
8.3.0 Mobile communication a 1,320 117,121 6,090,303 3,346
8.3.0 Other communication services a 17 1,126 58,549 32
8.3.0 Fixed telephone linen d
19 36,200 36,200 20
Group 8 total 5,437
9 RECREATION AND CULTURE
9.1.2 Film, film processing, camera d 41 11,420 11,420 6
9.1.3 Computer d 9 75,900 75,900 42
9.1.4 Cassette/DVD rental a 24 1,925 100,092 55
9.1.4 Music or video cassette or CD c 18 6,173 24,693 14
9.3.1 Sports and hobby equipment,
musical instruments, toys c b
146 10,345 10,345 6
9.4.1 Football, cinema, video tickets
& charges b
44 3,499 41,982 23
9.4.1 Tickets for sports/entertainment
events c
20 1,318 5,272 3
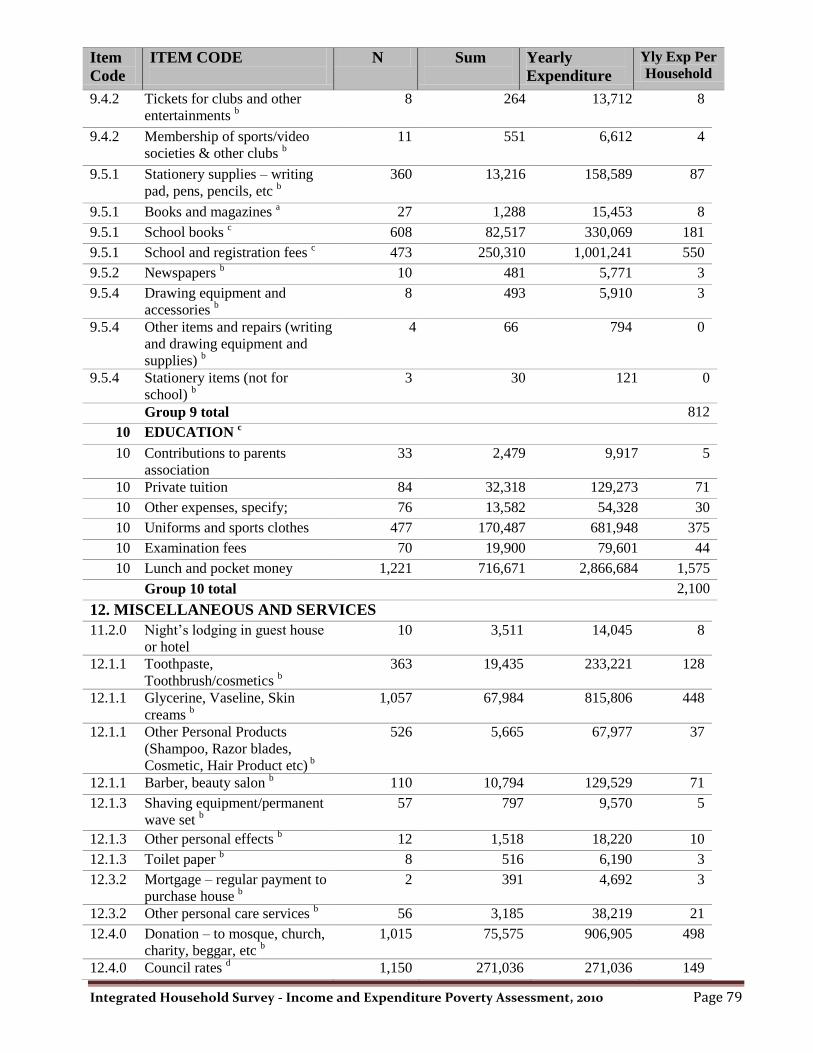
Integrated Household Survey - Income and Expenditure Poverty Assessment, 2010 Page 79
Item
Code
ITEM CODE
N Sum
Yearly
Expenditure
Yly Exp Per
Household
9.4.2 Tickets for clubs and other
entertainments b
8 264 13,712 8
9.4.2 Membership of sports/video
societies & other clubs b
11 551 6,612 4
9.5.1 Stationery supplies – writing
pad, pens, pencils, etc b
360 13,216 158,589 87
9.5.1 Books and magazines a 27 1,288 15,453 8
9.5.1 School books c 608 82,517 330,069 181
9.5.1 School and registration fees c 473 250,310 1,001,241 550
9.5.2 Newspapers b 10 481 5,771 3
9.5.4 Drawing equipment and
accessories b
8 493 5,910 3
9.5.4 Other items and repairs (writing
and drawing equipment and
supplies) b
4 66 794 0
9.5.4 Stationery items (not for
school) b
3 30 121 0
Group 9 total 812
10 EDUCATION c
10 Contributions to parents
association
33 2,479 9,917 5
10 Private tuition 84 32,318 129,273 71
10 Other expenses, specify; 76 13,582 54,328 30
10 Uniforms and sports clothes 477 170,487 681,948 375
10 Examination fees 70 19,900 79,601 44
10 Lunch and pocket money 1,221 716,671 2,866,684 1,575
Group 10 total 2,100
12. MISCELLANEOUS AND SERVICES
11.2.0 Night‟s lodging in guest house
or hotel
10 3,511 14,045 8
12.1.1 Toothpaste,
Toothbrush/cosmetics b
363 19,435 233,221 128
12.1.1 Glycerine, Vaseline, Skin
creams b
1,057 67,984 815,806 448
12.1.1 Other Personal Products
(Shampoo, Razor blades,
Cosmetic, Hair Product etc) b
526 5,665 67,977 37
12.1.1 Barber, beauty salon b 110 10,794 129,529 71
12.1.3 Shaving equipment/permanent
wave set b
57 797 9,570 5
12.1.3 Other personal effects b 12 1,518 18,220 10
12.1.3 Toilet paper b 8 516 6,190 3
12.3.2 Mortgage – regular payment to
purchase house b
2 391 4,692 3
12.3.2 Other personal care services b 56 3,185 38,219 21
12.4.0 Donation – to mosque, church,
charity, beggar, etc b
1,015 75,575 906,905 498
12.4.0 Council rates d 1,150 271,036 271,036 149

Integrated Household Survey - Income and Expenditure Poverty Assessment, 2010 Page 80
Item
Code
ITEM CODE
N Sum
Yearly
Expenditure
Yly Exp Per
Household
12.5.3 Sickness insurance premia d 1 15 59 0
12.5.3 Accident insurance premia d 3 1,489 5,957 3
12.5.3 Insurance – health, auto,
home, life, etc d
18 27,181 27,181 15
12.7.0 Milling Fees, Grains b 497 50,037 600,439 330
12.7.0 Fines or legal fees d 3 16,050 16,050 9
12.7.0 Bride wealth or cost d 29 306,975 306,975 169
12.7.0 Marriage ceremony costs d 349 534,785 534,785 294
12.7.0 Funeral d 498 180,763 180,763 99
Group 12 total 2,301
Total Rural Households consumption D158,473,520
Yearly Rural Households consumption per HH GMD87,077 $3,110
Per Capita per annum GMD8,664 $310

Integrated Household Survey - Income and Expenditure Poverty Assessment, 2010 Page 81
Gambia Bureau of Statistics
Kanifing Insutional Layout
Kanifing


![Gini Coefficient California pre-tax income, 2000, Gini=62.1%saez/course131/taxintro_ch17_new_attach.pdfFigure 1: Gini coefficient 6RXUFH .RSF]XN 6DH] 6RQJ4-( :DJHHDUQLQJVLQHTXDOLW\](https://img.pdfslide.us/doc/110x75/5f9d687763df8333422405c5/gini-coefficient-california-pre-tax-income-2000-gini621-saezcourse131taxintroch17newattachpdf.jpg)