Embed Size (px)
Citation preview

Publ ic Interest Energy Research (P IER) Program FINAL PROJECT REPORT
INTEGRATED GEOTHERMAL SYSTEMS SIMULATOR FOR THE ENHANCEMENT OF GEOTHERMAL STEAM PRODUCTION AT THE GEYSERS
JUNE 2010CEC ‐500 ‐2012 ‐006
Prepared for: California Energy Commission Prepared by: Northern California Power Agency

Prepared by: Primary Author(s): Murray Grande, Manager, Geothermal Facilities Steve Enedy, Superintendent, Steam Production John Counsil, Steam Field Engineer Northern California Power Agency 651 Commerce Drive Roseville, CA 95678-6411 Contract Number: PIR-04-001 Prepared for: California Energy Commission Pablo Gutierrez Project Manager Linda Spiegel Office Manager Energy Generation Research Office Laurie ten Hope Deputy Director RESEARCH AND DEVELOPMENT DIVISION Robert P. Oglesby Executive Director
DISCLAIMER This report was prepared as the result of work sponsored by the California Energy Commission. It does not necessarily represent the views of the Energy Commission, its employees or the State of California. The Energy Commission, the State of California, its employees, contractors and subcontractors make no warrant, express or implied, and assume no legal liability for the information in this report; nor does any party represent that the uses of this information will not infringe upon privately owned rights. This report has not been approved or disapproved by the California Energy Commission nor has the California Energy Commission passed upon the accuracy or adequacy of the information in this report.

i
Acknowledgements
The Northern California Power Agency appreciates the support of the California Energy Commission in providing funding for this study. Constructive comments from Pablo Gutierrez and the Commission staff have been very helpful during the course of the project. Part of this project involved cooperative work between NCPA and Calpine Corporation in developing a generic model of The Geysers field and we appreciate the work of Al Pingol in contributing data and comments. This study depended heavily on the diligent work of Stephen Butler of GeothermEx, John Doelzel of Doelzel and Associates and Kit Bloomfield of SAIC and we appreciate their contribution to the long term goal of achieving a balance between reservoir productivity and the surface generation facilities in geothermal energy production. Please cite the report as follows: Integrated Geothermal Systems Simulator for the Enhancement of Geothermal Steam Production at the Geysers, California Energy Commission, Geothermal Resources Development Account Program, CEC‐500‐2012‐006

ii
Table of Contents Executive Summary........................................................................................................................................ 1 Abstract .......................................................................................................................................................... 4 1. Introduction ............................................................................................................................................ 6 1.1. Background and Overview ................................................................................................................ 6 1.2. Project Objectives.............................................................................................................................. 8 2. Project Approach .................................................................................................................................... 9 2.1. Project start-up (Task 1) .................................................................................................................. 11 2.2. Technical Tasks (Task 2) ................................................................................................................ 11 2.3. Develop and benchmark simulations ............................................................................................... 13 2.4. Exercising Simulations to Identify and Prioritize Optimizations .................................................... 17 2.5. Evaluating and Documenting Geothermal Facility Improvements ................................................. 19 2.6. Reporting (Task 3)........................................................................................................................... 19 3. Project Outcomes .................................................................................................................................. 20 3.1. Technical Conclusions ................................................................................................................... 21 3.2. Economic Conclusions .................................................................................................................... 21 4. Recommendations ................................................................................................................................ 21 4.1. Technical Recommendations ........................................................................................................... 22 4.2. Economic Recommendations .......................................................................................................... 22 4.3. Public Benefits to California ........................................................................................................... 22 5. References ............................................................................................................................................ 25 6. Glossary ................................................................................................................................................ 26
List of Tables Table 1 Geothermal Reservoir, Well, and Pipeline Simulation Software Summary for NCPA Integrated Geothermal Systems Simulator Project………………………………29 Table 2 Geothermal Power Cycle Simulation Software Summary for NCPA Integrated Geothermal Systems Simulator Project………………………………………….………30

iii
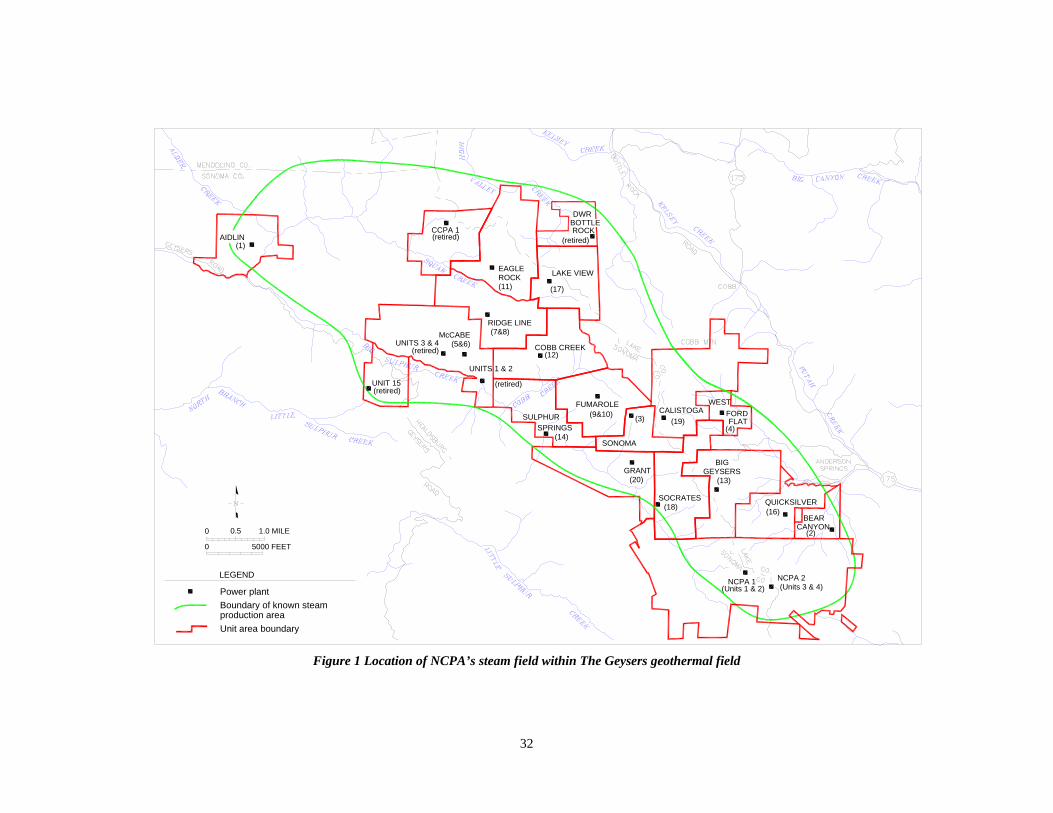
List of Figures Figure 1 Location of NCPA’s steam field within The Geysers geothermal field ............ 32 Figure 2 Monthly production and injection data for The Geysers from the California Division of Oil, Gas and Geothermal Resources .............................................................. 33 Figure 3 Schematic Diagram of the Geysers Geothermal Production and Injection process............................................................................................................................... 34 Figure 4 Geysers simulation grid used for the integrated reservoir-wellbore-pipeline model. Refined denser grid pattern in the southeast covers the NCPA portion of steamfield .......................................................................................................................... 35 Figure 5 Historical and forecast Geysers field-wide production and injection ................ 36 Figure 6 Observation well locations used for history matching in the integrated model 37 Figure 7 Observed and calculated reservoir pressures for well CA-1862 26-27 ............. 38 Figure 8 Power cycle forecasts for plant performance at 6% resource decline through 2025................................................................................................................................... 39 Figure 9 Power cycle forecasts for plant performance at 2% resource decline through 2025................................................................................................................................... 40 Figure 10 Power cycle forecasts for plant performance at 1% resource decline through 2025................................................................................................................................... 41 Figure 11 Incremental power generation trends forecast through 2025 .......................... 42

1
Executive Summary Integrated geothermal systems simulation funded in this grant study investigated improving the overall management of geothermal production to extend the life of a resource by maximizing available output for given generation and steam field conditions. The benefits of steam system management have been demonstrated for fossil and nuclear cycles through the successful effective application of heat balance codes. An integrated systems approach is timely and applicable because geothermal use at The Geysers has been affected by intense development, and managing all or parts of the system requires balancing the needs and capabilities of the reservoir, the surface steam gathering facilities, the generation facilities, and the injection array that returns fluid mass to the reservoir. Integrated Geothermal Systems Simulation is a primary tool to achieve a balance between reservoir productivity and the surface generation facilities. The Northern California Power Agency Integrated Geothermal Systems Simulation project did not attempt to manage all of The Geysers resource but the work within the Northern California Power Agency portion of the steamfield proves the viability of the techniques in multi‐unit systems and could potentially be applied to a variety of geothermal projects to improve efficiency and reliability. Optimizing the distribution of augmented injection throughout the field and making corresponding adjustments to plant and pipeline facilities is a complicated process with many interdependencies between reservoir/well, steam gathering/distribution, and power plant. Though efforts have been made to consider the effect of one component on operations of the other two in various geothermal fields in the past, frequently the optimization of each component was conducted independently. The thermal efficiency of a steam cycle strongly depends on the degree to which the turbine operates at its designed exhaust or backpressure. If the backpressure is higher than specified, thermal efficiency decreases. The Northern California Power Agency Integrated Geothermal Systems Simulation project addressed the complex interactions of many parts of the Northern California Power Agency portion of the geothermal production scheme from the reservoir to the wellhead, through the steam gathering system, into the turbine and through the injection system. Initial development of an integrated simulation involved selecting commercially available software, interactive software methodologies, baseline data collection and benchmark simulations. The final integrated reservoir‐wellbore‐pipeline model utilizes a simulation program called TAP that incorporates functionality from the PIPE simulation program (applied at Northern California Power Agency) and the TETRAD reservoir simulator commonly used in earlier reservoir evaluations at The Geysers. A highly refined grid was added to the Northern California Power Agency area to improve the model’s ability to match local reservoir conditions. In the integrated simulation, the wellbores and pipelines were modeled with standard pressure‐drop formulas, and the power plants are modeled with empirical curves relating flow rate to inlet pressure.

2
Once a representative model was calibrated, a field‐wide model was developed. Initial power cycle scenarios were based on a generic Geysers plant and modeled several different steam field decline scenarios that were based on field‐wide Geysers reservoir model output. Power cycle simulations considered system efficiency, steam path optimization, and incremental economic impacts. Forecasts for the Northern California Power Agency case used typical inlet conditions and assumed 1 percent, 2 percent and 6 percent mass flow declines and production inputs from Northern California Power Agency /GeothermEx Model –TAP reservoir simulation runs. Alternate power cycle configuration simulation runs for optimized inlet conditions include:
• Minimizing decline rates (6 percent to 1 percent and 6 percent to 2 percent). • Steam turbine/steam path optimization (high and low pressure stages). • Steam turbine inter‐stage separator/trap drain utilization. • Superheated throttle steam utilization. • Condenser cleanliness. • Cooling tower fan operations.
A series of performance tests were conducted June 8‐11, 2009 for Northern California Power Agency Units 1 and 4 that included development of an additional set of cooling tower curves to confirm actual fan power utilization. A direct result of the Northern California Power Agency Integrated Reservoir Simulation Projects is a $13,000,000 series of steam path modifications to repower Northern California Power Agency Plant 2 and improve future steam utilization and generation returns. The steam path improvement project will allow Northern California Power Agency to shut down Unit 3 and to direct all Unit 2 steam flow to Unit 4 maintaining full available load at the plant while reducing house load by 3 megawatts (2 megawatts parasitic load plus 1 megawatts auxillary steam) and directing 3 additional megawatts to Northern California Power Agency members. The project also reduces operations and maintenance costs for Unit 3 and eliminates the need to perform required, expensive repairs to the existing Ansaldo turbine rotors and the Unit 3 generator stator. During the 2010 repowering of Unit 4, Northern California Power Agency will also be replacing the turbine electro‐hydraulic control system including the hydraulic pump skid and valves, inlet piping to the turbine (24” to 36”) and the generator excitation control system. These modifications will ready Unit 4 for the next 25 years of reliable operation.

3

4
Abstract The Geysers geothermal field, located in Lake, Sonoma, and Mendocino Counties, California is the largest developed geothermal system in the world. The total installed capacity in the field peaked in 1989 at 2,043 MW but net mass withdrawals resulted in reservoir pressure declines, steam shortfalls and declining generation. Field operators modified pipelines and turbines for at lower system pressures and instituted an augmented injection program using large volumes of treated sewage effluent to manage the long‐term resource decline and bring injected mass into parity with mass produced mass. Research funded by the California Energy Commission (PIER Grant PIR‐04‐001) is the first practical demonstration of the combined use of steam reservoir simulation in conjunction with power cycle simulation to optimize and manage both steam and power generation from a given portion of a geothermal reservoir. Optimizing the distribution of augmented injection throughout the field and making corresponding adjustments to plant and pipeline facilities is a complicated process with many interdependencies between reservoir/well, steam gathering/distribution, and power plant. The final integrated reservoir‐wellbore‐pipeline model utilizes a simulation program called TAP that incorporates functionality from the PIPE simulation program (applied at NCPA) and the TETRAD reservoir simulator commonly used in earlier reservoir evaluations at The Geysers. Once a representative field‐wide model was calibrated field‐wide model was developed, a highly refined grid was added to the NCPA area to improve the model’s ability to match local reservoir conditions. In the integrated simulation, the wellbores and pipelines were modeled with standard pressure‐drop formulas, and the power plants are modeled with empirical curves relating flow rate to inlet pressure. As a direct result of this integrated geothermal systems simulator project, NCPA instigated a $13,000,000 steam path modification program to repower NCPA Plant 2 and improve future steam utilization and generation returns. The planned improvements will allow Unit 3 to be shut down and direct all Plant 2 steam to Unit 4, thereby maintaining full available load at the plant while reducing house load by 3 megawatts directing those additional megawatts directly to NCPA members. NCPA will also be replacing system components, enlarging the inlet piping to the Unit 4 turbine (24” to 36”) and altering the generator excitation control system to ready the plant for the next 25 years of reliable operation.

5

6
1. Introduction Integrated geothermal systems simulation funded in this grant study addresses power generation using geothermal energy. Specifically, the Integrated Geothermal Systems Simulation Project investigates improving the overall management of geothermal production to extend the life of a resource by maximizing available output for given generation and steam field conditions. An integrated systems approach is timely and applicable because geothermal utilization at The Geysers has been affected by intense development and managing all or parts of the system requires balancing the needs and capabilities or the reservoir, the surface steam gathering facilities, the generation facilities and the injection array that returns fluid mass to the reservoir. Integrated Geothermal Systems Simulation is a primary tool to achieve this balance. While this project did not attempt to manage all of The Geysers resource, the work within the NCPA portion of the steamfield (Figure 1) proves the viability of the techniques in multi‐unit systems and has potential applications in a variety of geothermal projects to improve efficiency and reliability. 1.1. Background and Overview The Northern California Power Agency (NCPA) was established in 1968 as a nonprofit California Joint Action Agency. For over three decades, NCPA has been devoted to the successful generation, purchase, transmission, pooling, and conservation of electric energy and capacity for its members. Membership is open to municipalities, rural electric cooperatives, irrigation districts, and other publicly owned entities interested in the management of electrical energy. NCPA owns and operates two geothermal power plants at The Geysers with a combined capacity of 228 megawatts (MW) or roughly 15 % of the current installed generation capacity of The Geysers. The power plants and the steam field facilities that supply them are owned by the cities of Santa Clara, Alameda, Lodi, Roseville, Ukiah, Healdsburg, Lompoc, Plumas Sierra, Gridley, Biggs, and by the Turlock Irrigation District. The first NCPA Geysers power plant began to operate in January 1983 and in 1985 NCPA purchased a BLM leasehold and the 20 steam wells that were then available to initially supply the initial power plant. NCPA immediately undertook an accelerated drilling and steam field expansion program similar to the rapid development of the rest of The Geysers resource that eventually led to the worlds’ largest installed geothermal generation capacity of 2000 MW(Grande and others, 2004). NCPA employed three drill rigs simultaneously to bring the first plant up to full capacity and to fully supply a second plant. The original 20 production wells were increased to 59 production wells within less than 3 years, and since then NCPA has drilled and completed 17 more wells, bringing the total to 76. The current production facilities are located in Sonoma and Lake Counties covering a productive area of 1,200 acres including 69 steam wells, 7

7
water injection wells, and 25 miles of steam transmission, water injection, and condensate collection pipelines. Reservoir pressures and productivity began to decline in The Geysers in the late 1980’s primarily because steam withdrawal exceeded the mass being returned into the reservoir (Sanyal, 2000; GRC, 1992) (Figure 2). As additional power plants began production, net mass withdrawal increased resulting in rapid declines in reservoir pressures and well productivities. Many make up wells were drilled in various parts of the field in an attempt to maintain generation capacity in the face of rapidly declining productivity causing excessive interference between wells and further reducing well productivity. Drilling additional make‐up wells became uneconomical by 1989, and the net generation capacity of the field was allowed to decline. The California Energy Commission funded an engineering study in 1992 in collaboration with Geysers operators and began to investigate options to mitigate the generation decline (Menzies and Pham, 1995). The numerical simulation from that study indicated that injection of water from outside sources was the most effective method of managing the decline in the resource. Geysers steamfield operators including NCPA also began making adjustments to the power plants and the surface pipeline network to optimize the use of the available steam (Stone and Webster, 1992). Injecting additional water to replace mass withdrawal was developed and pioneered in the south Geysers including NCPA’s facilities in the late 1990’s. NCPA operates its portion of the steam field under a protocol that specifies a variety of operating parameters, allowing the Agency to save or bank steam for future use to maximize average annual electrical generation. The protocol has been instrumental in reducing the annual progressive decline of reservoir pressure. Prior to 1999 the average annual pressure loss within the NCPA steam field was 12 psi per year. After initiating steam use protocols, the average annual reservoir pressure loss for 1999 was 2 psi and subsequent pressure declines have gradually increased to the current rate of 4 psi per year. NCPA identified the need to optimize and manage both steam and power generation from The Geysers reservoir to maximize sustainability in terms of flow, pressure and/or temperature while minimizing the impacts of declining productivity to sustain the productive life of the resource. Geothermal production at The Geysers consists of three distinct, yet dependent, components – reservoir, wells/steam gathering/distribution, and power plant (Figure 3). Though efforts have been made to consider the effect of one component on operations of the other two in various geothermal fields in the past, frequently the optimization of each component was conducted independently. Resource declines at The Geysers have increased the need to develop new resource optimization methods and have been the prime motive for the current work – integration of geothermal resource management tools.

8
The benefits of steam system management have been demonstrated for fossil and nuclear power cycles through the successful effective application of heat balance codes. The NCPA project within The Geysers is the first practical demonstration of the integrated use of steam reservoir simulation in conjunction with power cycle simulation in order to optimize and manage both steam and power generation from a given portion of a geothermal reservoir. 1.2. Project Objectives The NCPA Integrated Geothermal Systems Simulation for steam field management applied a steam cycle model to optimize component and systems selection in order to maximize generation for a given input. Specific research in applying a steam cycle model includes:
• Development and demonstration of an integrated simulation tool • Quantifying projected optimization benefits using measurements and trend
analysis • Using simulation to optimize steam reservoir management and power
production to extend reservoir life • Generating additional electricity from existing environmentally preferred
Geysers geothermal facilities • Transferring technology for general use by operators of other geothermal
facilities The demonstrable end product of this research is a $13,000,000 plan to improve steam utilization rates within the NCPA development area at The Geysers. The primary objective of the NCPA Integrated Geothermal Systems Simulation project is to improve overall resource management, and extend the life of the resource by maximizing the available output for a given operating and steam field conditions. None of the components of resource management is independent of others; their integration is essential for successful resource utilization. The geothermal reservoir management process includes a strategy that addresses resource sustainability, and an operating plan that carries out this strategy. Implementing and monitoring the plan, and evaluating the results are important for evaluating the economic health of the project and the resourceʹs ability to maintain a sustainable level of production. Resource management is a dynamic process, where, a management plan is refined and changes are implemented as additional data become available. While not specifically intended to improve the ability to dispatch Geysers generation, an integrated geothermal systems simulator can optimize routing, dispatch and scheduling by helping to maintain a higher average annual energy production.
1.1.1 Technical Objectives

9
i) Reduce net generation decline by 7.5 MW over a 15 year period based on
2009 net generation of about 118 MW. ii) Reduce parasitic load by 13,000 MWH over a 15 year period based on recent
parasitic load of about 12 MW. iii) Reduce reservoir pressure decline by 15 psi over a 15 year period based on
recent rate of pressure decline of about 4 psi per year.
2. Reduce steam flow rate decline by 1,050,000,000 pounds over a 15 year period based recent decline of about 800,000,000 pounds per year Incremental measurements of meeting these objectives are routinely collected and documented by NCPA in its net generation reports compiled on a monthly and annual basis for reporting to the California Energy Commission, the California Public Utilities Commission and the participating members of the Power Agency. 1.1.2 Economic Objectives
i) Reduce the cost of NCPA Member power purchases by $1,500,000 over a 15
year period (that is, power purchases not displaced by NCPA geothermal power generation) based on annual 2009 power and transmission purchase costs of about $50,000,000 per year.
ii) Reduce operating and maintenance costs by $750,000 over a 15 year period
based on controllable annual operating and maintenance costs of about $14,000,000 per year.
Incremental measurements of meeting these objectives are routinely collected and reported in NCPA financial statements and reports of costs and generation are compiled on a monthly and annual basis for reporting to the California Energy Commission, the California Public Utilities Commission and the participating members of the Power Agency.
2. Project Approach An integrated model that combines reservoir simulation with mathematical modeling of the wellbores, the pipelines, and the power plants to evaluate the interdependent complexities of the subsurface reservoir and the surface pipeline networks, and distribution of conventional and augmented injection throughout the field. Due to these

10
interdependencies, an integrated model has been developed that combines the reservoir simulation with mathematical modeling of the wellbores, the pipelines, and the power plants within the NCPA area of the field ( Figure 1). The NCPA Integrated Geothermal Systems Simulation project addressed the complex interactions of many parts of a NCPA portion of the geothermal production scheme (Figure 3) from the reservoir to the wellhead, through the steam gathering system, into the turbine and through the injection system. The thermal efficiency of a steam cycle strongly depends on the degree to which the turbine operates at its designed exhaust or backpressure. If the backpressure is higher than specified, thermal efficiency decreases. One of the unique challenges for geothermal cycle simulation includes managing the impurities found in the geothermal steam, especially CO2. Non‐condensable gases can make up as much as 2.3% by weight of the steam extracted from The Geysers. These gases migrate with the steam through the power cycle where they collect in the condenser. The total condenser pressure is the sum of the partial pressures of the water vapor and all other components (Dalton’s Law) therefore; any NCG contributes a partial pressure to the total condenser pressure. The resulting increase in total condenser pressure produces a corresponding increase in the turbine exhaust pressure. Consequently, the thermal efficiency of the power cycle is reduced because the enthalpy‐drop of the steam expanding through the turbine is degraded, isentropic turbine efficiency decreases, and power output declines. Non‐condensable gases also impede the condensation process after the steam has passed through the turbine. Exhaust steam condenses as it is drawn to the surface walls of (comparatively) cold tubes within the condenser unit and the NCG in the steam tends to accumulate at the vapor/liquid interface lowering the partial pressure of the water vapor on the walls requiring lower temperatures to continue condensation. With a lower potential for heat transfer, the total condenser pressure increases in order to condense a given steam flow. This rise in the partial pressure of the water restores the driving potential for heat transfer. Unless velocities are sufficiently high to keep the vapor well mixed, the NCG layer immediately adjacent to a tube wall acts as a barrier through which water vapor must diffuse. The rate of condensation is controlled by vapor diffusion through the NCG film in low steam velocity regions within the condenser, rather than by conductive and convective heat transfer. Single‐tube measurement studies suggest that 1% (vol) NCG reduces the heat transfer coefficient of the tube by 55% and 2% NCG results in a 68% reduction in overall heat transfer coefficient. Steam jet gas ejectors and/or liquid ring vacuum pumps are used to remove non‐condensable gases and raised pressures to atmospheric for treatment and release. The gas removal system is the single largest consumer of steam after the main turbine, using from 2% to 17% of that delivered to the cycle. Increased NCG rates demand correspondingly greater energy expenditures for gas removal; energy that could otherwise be used to deliver generated load to the market.

11
Interaction of these complex factors make integrated geothermal systems simulation a valuable tool in managing the total production process. The NCPA Integrated Geothermal Systems Simulation project approached this integrated resource management goal through incremental project tasks that included selecting simulation tools, acquiring data, developing and integrating baseline reservoir and power cycle simulations, forecasting optimal reservoir and power cycle scenarios and planning facility improvements.
2.1. Project start-up (Task 1)
During the start‐up phase of the Integrated Geothermal Systems Simulation project, NCPA organized and attended a kick‐off meeting on July 28, 2005 that included Project Manager Pablo Gutierrez and Joji Castillo from the California Energy Commission, Steve Enedy and John Counsil from NCPA. Previous documentation of matching funds was sent to the Energy Commission July 6, 2005 establishing that NCPA was committed to provide at least $345,336 in matching funds, including at least $166,546 in cash and at least $178,790 of in‐kind contributions. The documents included NCPA’s determinations that permits (BLM sundry notice and Northern Sonoma County Air Pollution Control District permit) would not be required to conduct this project. 2.2. Technical Tasks (Task 2) The Integrated Geothermal Systems Simulation project evaluated commercially available reservoir and power cycle simulation software to determine their capabilities in simulating the behavior of all parts of a geothermal production scheme including reservoir characteristics, steam production wells, pipeline/facility network gathering system, water injection and power plant processes. Because the project intended to demonstrate the concept rather than develop a new simulator, only commercially available software applications were considered that were easy to use and had favorable commercial terms (own vs. lease, maintenance agreement). Software packages were ranked for ease of use, integration (reservoir‐power cycle), support, and commercial availability.
2.2.1. Simulator selections Reservoir simulation software products from four vendors (Table 1) were evaluated based on the following modeling capabilities: • All significant reservoir characteristics and processes (steam, water, formation
permeability, relative permeability, porosity, fractures, boundary conditions, and changes over time).

12
• All significant wellbore, pipeline, and gathering system process equipment (variable casing and pipeline sizes, elbows/bends, heat loss, pipe insulation, elevation variations, rock catchers, separators, condensate removal using drip legs, valves, networked pipe systems, and changes over time).
• Producing design based/performance based models to simulate as‐tested conditions. • Evaluating optimum plant operating configurations for multiple generating units
that share facilities. • Interface with overall integrated simulator components including power cycle and
associated plant facility components which may be used in power plant simulation. The development of an integrated reservoir model began with the selection of a reservoir model using TETRAD, a commercially available geothermal simulator that had been used in past Geysers simulations. The final integrated reservoir‐wellbore‐pipeline model utilizes a simulation program called TAP. The TAP program incorporates functionality from the PIPE simulation program that has been used to model the pipeline network in the NCPA area and the TETRAD reservoir simulator. Power cycle simulation software products from four vendors (Table 2) were evaluated based on the following modeling capabilities: • All significant power/process cycle equipment (turbines, condensers, pumps, cooling
towers, hydrogen sulfide abatement, and non‐condensable gas systems). • Steam gathering/distribution network (aboveground piping network connecting
wellheads to each plant). • Producing design based/performance based models to simulate as‐tested conditions. • Evaluating optimum plant operating configurations for multiple generating units
that share facilities. • Interface with overall integrated simulator components including reservoir and
pipeline gathering system components.
Based on flexibility, application to a wide variety of power cycles, ease of use and custom modeling services, Thermo Flow’s ThermoFlex® software was selected for power cycle simulation
2.2.2. Data Acquisition The TAP reservoir/pipeline network simulator was purchased in April 2005 from vendor Kaz Vinsome at DYAD Engineering. Purchase approval was obtained prior to the Chevron acquisition of UNOCAL assets. Steve Butler (GeothermEx) helped identify TETRAD/TAP data requirements and began building the preliminary production and injection well data base for The Geysers reservoir model using NCPA data and open file data from the California Department of Conservation, Division of Oil, Gas, and Geothermal Resources (CDOGGR).

13
The ThermoFlex power plant simulator was purchased in late September 2005 from vendor Thermo flow. John Dolezal (Dolezal and Associates) helped identify ThermoFlex data requirements and began building a preliminary model for both the NCPA generating units and for a generic generating unit applicable to the entire Geysers geothermal field. Additional data requirements were identified and most of the required generating unit information was obtained directly from NCPA archived data, performance test files or previous consultant reports. Additional performance tests were recommended in the future to help fine tune specific elements of the plant model. 2.3. Develop and benchmark simulations Developing a reservoir model that only evaluated the NCPA area of The Geysers field was impractical because of the high permeabilities throughout entire producing area of the field (Butler et al, 2009). A generalized three‐dimensional, dual‐porosity field‐wide model was developed instead based on published and publicly available data. Once this field‐wide model was calibrated to represent the overall field response, a highly refined grid was added to the NCPA area to improve the model’s ability to match local reservoir conditions. In this way, the field‐wide model would be used to describe the pressure boundaries of the NCPA area over time. In the integrated model, the wellbores and pipelines were modeled with standard pressure‐drop formulas, and the power plants are modeled with empirical curves relating flow rate to inlet pressure.
2.3.1. Baseline reservoir simulation GeothermEx developed a reservoir simulation grid covering an area of nearly 80 square miles oriented NW‐SE parallel to the principal structural features or The Geysers (Figure 4). The rectangular outline of the base grid is approximately 6 miles long in the SW‐NE direction and 13 miles long in the NW‐SE direction, and it covers the entire active area of the field. The base grid blocks are all the same size, measuring 2,000 feet on each side. The model has 6 layers and extends from sea level to 12,000 feet below sea level. Each layer is 2,000 feet thick, and has 15 blocks in the SW‐NE direction and 32 blocks in the NW‐SE direction, for a total of 2,880 blocks. Based on geologic information and historic field response data, the reservoir is modeled using double‐porosity formulation based on the Warren and Root method (Butler et al, 2009) commonly used to represent reservoirs where fractures primarily control fluid flow and storage is primarily contained within the rock matrix. The grid system in layers 1 through 5 was refined (Figure 4) to improve the model’s ability to match individual well performance within the southeastern NCPA portion of the field. The wells in the reservoir model are assumed to be completed in the fracture blocks, while the matrix blocks provide the bulk of the reservoir storage capacity. Considering

14
the more than 700 wells drilled in the field and the limited well data outside of the NCPA area, production and injection wells were grouped by well pad. Locations of these pads were selected based on maps compiled by the California Division of Oil, Gas and Geothermal Resources (CDOGGR). In the base grid, production is derived from layers 1 and 2, and injection occurs in layers 2, 3 and 4. Within the refined grid, similar production and injection depths were utilized. Within the NCPA area, production and injection wells were defined using observed steam entry data provided by NCPA. A rotation‐translation program was developed to convert the location and depth of the steam entry zones to refined grid block locations. In some areas of the field, injection and production wells are located on the same pad, which would result in having production and injection within the same grid block. This potential problem of co‐located production and injection wells was resolved by specifying that injection occurs in a deeper layer, and production in a shallower layer. While some injection wells are completed at relatively shallow depths, it is generally accepted that the injection water sinks toward the bottom of the reservoir due to gravitational effects. The refined grid (Figure 4) enabled injection wells to be more accurately represented because of the smaller grid block dimensions. History matching is the initial stage in any simulation. The majority of the initial work on the integrated geothermal systems simulation project involved data input, successive simulation runs and evaluating simulation matches to develop baseline reservoir and power cycle simulations specifically for NCPA operations and more generally for generic Geysers production scheme. Model inputs included historical production and injection data (Section 2.1.2) and the reservoir simulation was allowed to run for the period from 1960 through the end of 2005. Reservoir pressures calculated by the model were then compared with observed pressures from the same time period (Figure 5). Steve Butler (GeothermEx) provided preliminary draft history match reservoir model runs using TETRAD by March 14, 2006. In the process, GeothermEx updated the production‐injection input files to:
• Reduce the NCPA area reservoir grid size from standard Geysers model 2000 foot grid blocks on each side to grid blocks 666 feet by 666 feet by 1000 feet thick. Incorporation of a refined grind increases the number of grid blocks (matrix and fracture) in the integrated model to 14,400.
• Incorporate well course and steam entry location data for each individual NCPA
well
• Update historical production and injection data using records from the CDOGGR.

15
• Reference NCPA wells as individual wells and the remaining Geysers wells referenced as pad groups.
Kit Bloomfield and David Faulder (SAIC) worked on advances beyond baseline simulation to future forecast runs and confirmed that the input file would execute using the version of TETRAD incorporated into TAP. Minor changes and adjustments over several quarters as part of the GeothermEx TETRAD 2000 to NCPA TAP model integration process. Important parameters of fracture porosity, fracture and matrix permeabilities and fracture spacing were adjusted on a trial‐and‐error basis until a good match was obtained between observed and calculated pressures. From ~1995 on in the later phase of the history match the amount of water‐in‐place (matrix porosity and the initial water saturation) were varied to obtain a match to observed data. Model output was compared to static reservoir pressure data (Figure 5) derived from the CDOGGR data from a number of shut‐in wells in stragtegic locations throughout the field (Figure 6) with relatively long wellhead pressure histories. A program was developed to convert wellhead pressures, using information on wellhead elevation and steam density, to absolute pressures at mean sea level (the top of the reservoir) enabling the model results (also interpolated to mean sea level by the simulation program) to be compared directly to the observed shut‐in wellhead pressure data. A match between modeled and observed pressures at well CA‐1862 26‐27 (Figure 7) demonstrates that the simulation predicts the sharp drop in reservoir pressure during the 1980s and the less pronounced pressure decline rates since the late 1990s.
2.3.2. Baseline power cycle simulation Using the spatial (x‐y‐z) location of the first steam entry and casing data provided by NCPA, directional wellbore descriptions were developed for each production well within the NCPA area. The elevations used in the reservoir‐to‐wellbore pressure drop equations for the NCPA wells were then modified to match the depth of the first steam entry zone. Consequently, the end of the reservoir inflow calculations end and the start of the wellbore‐pipeline calculations occur at the same physical location. Surface wellhead elevations were used for production wells (pads) outside of the NCPA area The pipeline network was added to the integrated model based on the individual diameters, length and elevation changes for NCPA’s pipeline system. In total, the wellbore and pipeline network added approximately 300 additional nodes to the model significantly increasing the complexity of the simulation because frictional wellbore and pipeline pressure drops are dependent on the square of the velocity, as opposed to the linear relationship in the reservoir. Pipeline section volumes are orders of magnitude smaller than within the reservoir grid blocks creating problems within the mass balance equations, resulting in shorter time steps being required for convergence. The coupled

16
reservoir‐wellbore‐pipeline model could increase the computer run times by a factor of 2‐10. John Dolezal (Dolezal and Associates) finished a baseline power cycle by February 27, 2007. The work summarized power plant model components for NCPA Unit 1, NCPA Unit 3, and a Geysers generic unit. At NCPA’s request, Thermo Flow worked with Dolezal to develop a new version of the ThermoFlex simulator to improve characterization of steam gas ejectors and NCG handling in geothermal power plants. Successive simulations identified additional data requirements, revised turbine stage detail, exhaust loss characteristics and condensate/cooling tower detail for NCPA Unit 1 and Unit 3. Results for each individual unit were used to evaluate simulator capabilities in replicating actual plant operations. Historical as‐tested operations at three match points correspond to NCPA’s plant performance tests. Units 2 and Unit 4 in NCPA’s section of the field were added to the simulation and variable weather conditions were integrated to improve simulation results. The turbine boundary condition for each NCPA generating unit was described in general form by a turbine inflow curve in the integrated model as a linear or power function of turbine steam flow. The properties of each generating unit were further refined by the addition of a valve‐wide‐open pressure drop at the governor valve and a fixed steam rate requirement for non‐condensable gas removal (ejector steam rate). The variables used to describe each generating unit were derived from current operating data or calculated for plant optimization scenarios utilizing the ThermoFlex power plant simulator used by NCPA. These variables provided a practical mechanism to couple the integrated reservoir/well/pipeline simulator to the ThermoFlex power plant simulator.
2.3.3. Integrated Baseline Simulation Steve Butler (GeothermEx) finalized the integrated NCPA baseline reservoir simulation by May 29, 2007. GeothermEx TETRAD 2000 files were converted to an NCPA TAP compatible file with some data input file structure changes and rate‐pressure constraints Several incremental updates to a preliminary pipeline network model were integrated with the reservoir model. Kit Bloomfield (SAIC) continually updated individual well detail in the reservoir model. Pressure oscillations and convergence problems caused a few delays when pipeline model and variable turbine pressure boundary conditions were implemented. Initial tests of integrated simulation included the baseline reservoir simulation case and some preliminary reservoir optimization runs to test the effects of potential operating pressure changes, injection variations and generating unit changes. A turbine back pressure deliverability curve was used to characterize the effect of power plant changes on flowing pressure.

17
2.4. Exercising Simulations to Identify and Prioritize Optimizations
The results of initial baseline and integrated simulation tests were used to identify and prioritize optimal combinations of typical resource scenarios and generic power cycle operating configurations that maximize energy production while minimizing resource degradation.
2.4.1. Forecasting Optimal Reservoir Scenarios Steam production rates for NCPA in 2008 were approximately 58% to 62 % of the highest rates of nearly 1,915,0000 pounds per hour reported in earlier production years. The NCPA/GeothermEx TAP simulation and the compiled production database were used to forecast reservoir performance characteristics using 1%, 2% and 6% production rate declines through 2025. The reservoir simulation included iterative constant steam declines that treated annual production as a step function to forecast specific steam turbine deliverability parameters for each of the potential decline rates. Essentially, the generic simulator was used to develop a turbine system curve by matching throttle pressure conditions to specific mass flow rates that an individual steam turbine could accept. Potential steam gathering system pressure drops between the well head and the inlet of the steam turbine were anticipated to range from 3 psi to more than 30 psi assuming minimal throttling conditions. System pressure drops can vary depending on the specific flowing well head pressures or the specific production gathering system configurations, relative lengths, and types and sizing of equipment in use. Periodic reservoir simulation updates were completed as the CDOGGR released additional data on reservoir performance. Proprietary NCPA generating unit steam flow rates were also provided to GeothermEx for comparison with model output. Additional reservoir simulation improvements included changes to the modeled reservoir model rock properties in the deepest simulation layers below the developed reservoir to reduce the simulated impact of water movement and apparent deep cooling and modify deep temperatures to accommodate less cooling over time. Past tracer test results indicate that not all of the injected water is recovered over a short time period, so a similar process is apparently occurring in the reservoir. The reservoir model accommodated this observed effect by assuming that not all of the injected water boils in the reservoir simulation and the remaining liquid accumulates in the bottom model layers providing pressure support, especially if injection into the shallower layers is reduced. The long‐term recovery of injectate through boiling of accumulated water in the deeper portions of the reservoir has an important effect on long‐term performance of The Geysers field but, the ultimate depth and recovery fraction of this residual water are unknown. Research on how injected water boils within the reservoir combined with

18
reservoir modeling to optimize the recovery of injected water as steam will be an important aspect of the long‐term management of The Geysers.
2.4.2. Forecasting Optimal Power Cycle Scenarios Initial power cycle scenarios were based on a generic Geysers plant and modeled several different steam field decline scenarios that were based on field‐wide Geysers reservoir model output. The generic power cycle simulations were based on steam inlet mass flow rates of approximately 1,120,000 pounds per hour or approximately 58.5% of the original full‐load turbine throttle mass flow rate. Power cycle simulations considered system efficiency, steam path optimization, and incremental economic impacts.
Power cycle performance forecasts for a generic power plant (Figures 8 through 10) fully integrated reservoir condition forecasts derived from the NCPA/GeothermEx TAP simulation. Power cycle simulation forecasts for the NCPA case used typical inlet conditions and assumed 1%, 2% and 6% mass flow declines and production inputs from NCPA/GeothermEx Model –TAP reservoir simulation runs. Geothermal power plant performance indicators include:
• Gross and net power production • Net heat rate and stem rate • Steam turbine throttle deliverability curves (pressure and mass flow rate) • Net plant electrical efficiency (%) and net fuel input (kBTU/hr).
Comparatively dramatic decline in power generation occurs at a 6% mass flow decline rate (Figure 8) resulting in a significant increase in net plant heat rate and net steam rate with a corresponding decrease in net plant electrical efficiency and net steam utilization. Based on a 6% resource decline, operating a large steam turbine would be impossible after 2020 ‐2022 without major mechanical modification or operational issues. Plant and field performance are more desirable at a lower 2% or 1% decline rates (Figures 9 and 10). Lower decline rates from successful resource stabilization and minimization would result in incremental power production improvement compared to a 6% resource decline over time (Figure 11) Alternate power cycle configuration simulation runs for optimized inlet conditions include:
• Minimizing decline rates (6% to 1% and 6% to 2%). • Steam turbine/steam path optimization (high and low pressure stages). • Steam turbine inter‐stage separator/trap drain utilization. • Superheated throttle steam utilization. • Condenser cleanliness. • Cooling tower fan operations.

19
A series of performance tests were conducted June 8‐11, 2009 for NCPA Units 1 and 4 that included development of an additional set of cooling tower curves to confirm actual fan power utilization. 2.5. Evaluating and Documenting Geothermal Facility
Improvements The integrated geothermal systems simulator project was publically documented in the SPE 121385 technical paper : Numerical Reservoir‐Wellbore‐Pipeline Simulation Model of The Geysers Geothermal Field, California, USA, by Steve Butler (GeothermEx), Steve Enedy (NCPA), Bill Smith (NCPA), Murray Grande (NCPA), John Counsil (NCPA), and Pablo Gutierrez (California Energy Commission). The paper was presented by Steve Butler at the 2009 Society of Petroleum Engineers (SPE) Western Regional Meeting held in San Jose, California on March 24‐26, 2009. 2.6. Reporting (Task 3) A total of nineteen (19) quarterly progress reports have been submitted during the nearly 5 year course of the integrated geothermal systems simulator project. The quarterly progress reports have documented simulation development and modifications as production data were compiled, benchmarks were developed and baseline simulations were completed. Progress reports on identifying and prioritizing optimizations were produced in later project phases. These included:
• Evaluation and Selection of a Power Cycle Simulation Tool for the NCPA Integrated Geothermal Systems Simulator submitted to the Geothermal Resources Council Bulletin and published November/December 2005 issue.
• Reservoir and Pipeline Simulator Selections, submitted to the Energy Commission
on February 27, 2007.
• Numerical Simulation of the NCPA Steam Field, by Steve Butler of GeothermEx submitted to the Energy Commission on May 29, 2007
• Integrated Simulator for the Enhancement of Geothermal Production at The Geysers by John Dolezal of Dolezal and Associates, Inc., submitted to the Energy Commission on April 2, 2008.
• Unit 4 Steam Path Replacement Project Awarded to TurboCare (Fulfillment of Task 2.4 Update and Document Geothermal Facility Improvements) submitted to the Energy Commission on July 15, 2009.

20
• Updated Numerical Simulation of the NCPA Steam Field, by Steve Butler of
GeothermEx submitted to the Energy Commission on November 28, 2009. Critical Project Reviews by the Energy Commission were held on August 8, 2006 and July 10, 2008. Final quarterly progress reports were submitted on January 25, 2010 and March 1, 2010 that included a Final Report Outline (Task 3.3.2.1). This Draft Final Report is submitted for review and comment (Task 3.3.2.2) prior to preparing and submitting a Final Report (Task 3.3.2.3) and holding a Final Meeting (Task 3.3.3) to discuss the results of the project. 3. Project Outcomes Integrated reservoir/power cycle forecasts and optimization runs were used to evaluate and plan a $13,000,000 series of steam path modifications to repower NCPA Plant 2 to improve future steam utilization and generation returns. The steam path improvement project was awarded to TurboCare. Steve Enedy and Murray Grande of NCPA worked closely with TurboCare on a turbine rotor design to accommodate specific operating conditions based on the integrated simulation results. The TurboCare contract calls for the existing NCPA spare Ansaldo turbine rotor to be re‐bladed with new, low pressure blades rated at 53 megawatts with inlet conditions of 63 psia at 326 °F (saturated steam) and a steam flow of 908,500 lbs/hr (17.1 lbs/kwhr gross steam rate). The existing blades will be removed and the wheels on stages 1 through 5 will be machined off. The forging will undergo a borosonic inspection of the forging bore as well as NDE inspection of the forging surface including the remaining sixth stage wheel. The forging will then be modified utilizing a 12 chrome alloy welding material to build up four new wheels that will be machined to hold four stages of low pressure blades. The existing sixth stage wheel will be used for the new, fifth stage low pressure blades. The modified five stage rotor will be designed to slightly offset the new rotating blades to fit with the new stationary blades that will be set in the existing case fits. The TurboCare contract also includes a spare rotor that will be delivered 5 months after the startup of the unit utilizing the turbine that is presently operating in Unit 4. The steam path replacement improvement project is a direct result of the integrated geothermal systems simulator project results and will allow Unit 3 to be shut down to direct all Plant 2 steam flow to Unit 4, thereby maintaining full available load at the plant while reducing house load by 3 MW (2 megawatts parasitic load plus 1 megawatts auxillary steam) and directing 3 additional megawatts to NCPA members. The project also reduces operations and maintenance costs for Unit 3 and eliminates the need to

21
perform required expensive repairs to the existing Ansaldo turbine rotors and the Unit 3 generator stator. During the 2010 repowering of Unit 4, NCPA will also be replacing the turbine electro‐hydraulic control system including the hydraulic pump skid and valves, inlet piping to the turbine (24” to 36”) and the generator excitation control system. These modifications will ready Unit 4 for the next 25 years of reliable operation. Construction of the planned steam path improvements are part of the repowering effort for Plant 2 scheduled for the second quarter of 2010. 3.1. Technical Conclusions Net generation decline trends have been be reduced using integrated modeling to improve field and plant operations. The planned stem path modifications b ased on the integrated model will reduce parasitic loads while increasing efficiency. Reservoir pressure decline trends have been and continue to be reduced using integrated modeling to improve field operations. Steam flow rate decline trends have been reduced using integrated modeling to improve field operations. 3.2. Economic Conclusions Through the use of integrated geothermal system models, geothermal power generation has been increased, royalty trickle down payments to the public can be increased, and the amount of high‐priced fossil fuel power purchases by NCPA member agencies can be reduced. Potentially, power sales profit can be increased for private power producers. Operating and maintenance costs can be reduced using integrated modeling as a guide to better allocate operating expense and capital investment expenditures and NCPA has already planned new capital investments in steam path improvements (Section 4.0 Project Outcomes). Integrated geothermal systems simulation represents a significant improvement in steam field management and utilization. Better utilization and resource management should extend and improve the operating life of the entire Geysers steam field. 4. Recommendations Integrated geothermal systems simulation should be generalized for application to other geothermal fields. Without better resource management, the balance of various elements of production and injection remain as isolated processes in a production scheme limiting the potential operating life of a steam field or any geothermal system.

22
4.1. Technical Recommendations
i. Improve reservoir model details and capabilities for Geysers application and for other geothermal fields
ii. Improve pipeline facility model details. These include: NCPA’s plan to
expand the Unit 4 inlet steam pipeline.
iii. Improve power plant facility/power cycle model details. These include NCPA’s plans to repair and upgrade the Unit 2 cooling towers.
4.2. Economic Recommendations
i. Use integrated geothermal simulation models on an ongoing basis at The
Geysers and in other geothermal fields allowing increased geothermal power generation resulting in improved royalty payments and reduction is fossil fuel power purchases by NCPA member agencies or other utilities.
ii. Use of integrated geothermal simulation models on an ongoing basis both at The Geysers and at other geothermal fields so operating and maintenance costs can be reduced using integrated modeling as a guide to better allocate operating expense and capital investment expenditures
The next logical advance in integrated geothermal simulations would involve extending the reservoir‐pipeline facility‐power cycle modeling to the entire Geysers steam field. An integrated system simulation approach should be generalized or adapted to optimize production from other geothermal settings such as water dominated systems or moderate temperature systems that utilize binary generation technologies. 4.3. Public Benefits to California Applying an integrated geothermal simulator approach within the NCPA portion of The Geysers geothermal field has successfully demonstrated the utility of integrated simulation to decrease the decline of at least a portion of the steam reservoir and improve utilization efficiency to potentially extend reservoir life. Optimizing steam reservoir management and sustaining steam utilization ensures that geothermal remains a viable renewable resource at The Geysers and elsewhere in California. The direct benefits to California from the work completed under this contract include sustaining clean geothermal power generation in both the short‐term and in the long‐term. Better resource management through integrated system simulation is projected to hold steam field pressure declines to the current rate of 4 psi per year. Stabilized pressures are projected to recover approximately 368,000 MW‐hours of Geysers energy production over the next 15 years. Further improvements in integrated system simulation can and

23
should reduce the rate of decline of decline by 50% to 2 psi per year recovering an additional 158,000 MW‐hours over 15 years. Managing water injection within The Geysers is the next logical use of integrated simulation to maximize injection‐derived steam production while minimizing non‐condensable gases. High non‐condensable gases increase turbine backpressure, reducing steam turbine performance and increasing the amount of steam flow (steam rate) required to produce a kWh of generation. Integrated simulation can also be applied to manage operating equipment to reducing the amount of redundant or over‐sized equipment in operation for a given steam field condition thereby reducing the steam rate required for parasitic load and increase net generation. Sustaining a 1% reduction in steam rate will increase the reservoir reserve capacity by 250,000 MWh (0.01 x 25 million MWh reserve capacity = 250,000 MWh). The integrated model was modified to evaluate potential increase in supplemental injection rates. Based on a 100% increase in supplemental injection rates (using the same general distribution per well), simulation results indicate that increased mass replenishment has had a beneficial effect on the The Geysers field. Field‐wide simulation results ( Figure 7) indicate that increasing the volume of water injected into the field could reduce the field‐wide decline by about half over the base case scenario. Applied systems simulation could result in an average annual 5 MW increase of electrical generation from The Geysers over the next 15 years. The added value of this amount of electricity is about $52 million (fixed 2009 price of $98/MWh). As a consequence of this project, the public power owners of these California facilities will be able to deliver the expected increase of 526,000 MWh over 15 years. Increases in electrical generation will also result in increased royalty payments that directly benefit Federal and State revenues NCPA pays an 11.5% royalty to the Federal Government on the value of the steam produced from this BLM land. Using the same fixed 2009 power price, the projected increase in energy recovery of 526,000 MWh through applied system simulation the estimated increase in royalty payments could approach $2.5 M. Half of all Federal royalty payments are returned to the State of California, with a portion of those funds redistributed to local County governments of the State’s share of Federal royalties, 30% is allocated to the State’s GRDA Account and 30% is distributed to the state’s Renewable Resources Investment Fund account. Based on the projected increase in Federal royalties from applied system simulation, the estimated fund increases for each of these two separate State accounts could be $371,000 and would then be available to be recycled into additional renewable energy development.

24
Extending the useful life of Geysers power plants also has a positive effect on the local economy and the local tax base. Continuing production maintains local jobs or extends current work opportunities. The remaining 40% of the one‐half of the increased royalty payments received by the State of California is redistributed to Lake and Sonoma Counties. Again, based on the generation improvements from applied system simulation, a projected County royalty share could be $500,000. Local property taxes also depend in part on maintaining or improving steam generation and NCPA pays $1.5 million in property taxes to local Counties based on electrical production.

25
5. References Geothermal Resources Council, 1992, Monograph on The Geysers Geothermal Field,
Special Report No. 17 (C. Stone ed.). Grande, M., Enedy, S., Smith, W., Counsil, J. and Jones, S., NCPA at The Geysers, GRC
Bulletin (July-August 2004) 155-161. Johnson E.A. 2007. Summary of Geothermal Operations. In California Division of Oil,
Gas, and Geothermal Resources, 2006 Annual Report, PR06 (9/07/OSP/1M), 251-267.
Menzies, A.J. and Pham, M. 1995. A Field-Wide Numerical Simulation Model of The
Geysers Geothermal Field, California, USA. Proc., World Geothermal Congress, Florence, 1697-1702.
Sanyal, S.J. 2000. Forty Years of Production History at The Geysers Geothermal Field,
California – The Lessons Learned. Vol. 24: 317-323; Trans., Geothermal Resource Transactions Council.
Sanyal, S.J. 2003. One Discipline, Two Arenas – Reservoir Engineering In Geothermal
and Petroleum Industries. Proc., Twenty-Eighth Workshop on Geothermal Reservoir Engineering, Stanford University, 1697-1702.
Stone & Webster Engineering Corporation. Geysers Field Steam Decline Study, Power
Plant Assessment Phase 1 Report, August 1992, p 2-16.

26
6. Glossary CDOGGR California Division of Oil, Gas and Geothermal Resources kBTU/hr thousand British Thermal Units per hour kW kilowatts (1,000 watts) kWh kilowatt hours lbs/kWh pounds per kilowatt hour MW megawatts (1,000, 000 watts) MWh megawatt hours NCPA Northern California Power Agency PIPE Pipeline simulation software code SPE Society of Petroleum Engineers TAP NCPA integrated simulation software code TETRAD Reservoir simulation software code ThermoFlex® Thermal process simulation software code licensed by Therm
Flow Inc.

27
LEGAL NOTICE This document was prepared as a result of work sponsored by the California Energy Commission. It does not necessarily represent the views of the Energy Commission, its employees, or the State of California. The Commission, the State of California, its employees, contractors, and subcontractors make no warranty, express or implied, and assume no legal liability for the information in this document; nor does any party represent that the use of this information will not infringe upon privately owned rights.

28
Tables

29
1 Disclaimer: Descriptions and opinions of software products are based on available information, criteria, and a screening process established by the authors for a specific purpose. These descriptions by no means shall be interpreted as a lack of capability of the software products in this or any other application by other users.
Table 1 Geothermal Reservoir, Well, and Pipeline Simulation Software Summary for NCPA Integrated Geothermal Systems Simulator Project1
Supplier DYAD (ADA, UNOCAL) LBNL (ESTSC) CMG Software TETRAD/PIPE/TAP TOUGH2V2 STARS
Brief Description Fully flexible, general-purpose tool. Numerical simulation of nonisothermal flow of multicomponent, multiphase fluids in three dimensions in porous and fractured media. Pipeline facility/turbine model PIPE is coupled to TETRAD to form TAP simulator.
Fully flexible, general-purpose tool. Numerical simulation of nonisothermal flow of multicomponent, multiphase fluids in three dimensions in porous and fractured media. Flexible Modular Structure. Utility programs may be downloaded free.
Fully flexible, general-purpose tool. Numerical simulation of nonisothermal flow of multicomponent, multiphase fluids in three dimensions in porous and fractured media.
User Friendliness Complex model requires experience and skill. Complex model requires experience and skill.Complex model requires experience and skill.
Difficulty to Learn Difficult Difficult Difficult
Manuals, Tutorials, etc. Detailed manual and sample problems are available. Source code not provided with TAP.
Detailed manual and sample problems are available. Source code provided. Need FORTRAN 77 compiler.
Detailed manual and sample problems are available. Source code not provided.
Support Services Limited telephone and email support Workshops for users. Limited telephone, email and internet support.
Telephone, email and internet support
Relative Number of Users Relatively small number of users. Moderate number of users. Relatively large number of users.
Industries Using the Software Primarily oil, natural gas, and geothermal reservoir development firms and consultants.
Primarily radioactive waste storage, environmental/groundwater, oil, natural gas, and geothermal reservoir research scientists, development firms, and consultants.
Primarily oil and natural gas reservoir development firms and consultants.
Output/Presentation of Results Standard output. GRIDVIEW and PETRASIM are available post-processing applications.
Standard output. EXT (free) and PETRASIM are available post-processing applications.
Standard output. RESULTS is a post-processing application.
Ease of Software Installation HASP required. Instructions available. Instructions available. Instructions available. Support available. General Impression of the Software Good simulator for geothermal reservoir and
steam pipeline/facility network Good simulator for geothermal reservoir Good simulator for geothermal reservoir
Cost (License) $25,000 and up for newer versions $2,260 ($670 if US government agency) $53,000/year or $132,000 + $23,800/year Term of License N/A N/A N/A Annual License Renewal Cost N/A N/A N/A Annual Maintenance Fee N/A N/A N/A Consulting Services Available Available in limited circumstances. Available
Interface with Other Software INTERSIM, GRIDVIEW, FPLOT, PETRASIM ELCON, EXT, PETRASIM BUILDER, RESULTS

30
2 Disclaimer: Descriptions and opinions of software products are based on available information, criteria, and a screening process established by the authors for a specific purpose. These descriptions by no means shall be interpreted as a lack of capability of the software products in this or any other application by other users.
Table 2 Geothermal Power Cycle Simulation Software Summary for NCPA Integrated Geothermal Systems Simulator Project2
Supplier ThermoFlow Aspen Technology Scientech GE Energy Services Software ThermoFlex AspenPlus PEPSE GateCycle
Brief Description Fully flexible, general-purpose tool. In principle, can model any system the user wishes.
Process modeling tool for Steady State simulation, design, performance Monitoring optimization and business planning
Steady-state energy balance program for electric generating plants
Fully Flexible heat and mass balance program for thermal power plants
User Friendliness Intuitive/easy to get started. More complex models require experience and skill.
Unknown at this time Numerous steps. Even with Windows based GUI, approach is batch process, build input deck, job file, output file, etc.
Intuitive- easy to get started. More complex models require experience and skill.
Difficulty to Learn Intuitive. Training and seminars available
Training seminars available. Training seminars available Training seminars available
Manuals, Tutorials, etc. Tutorials, samples and on-line help manual are extensive and easy to use.
Extensive documentation and numerous manuals.
Demonstration version provided no manuals, tutorials or help. Operating version has extensive manuals - four volumes.
Not Evaluated
Support Services ThermoFlow typically releases one or two major updates each year. Telephone and email support
New versions released yearly. User group holds annual meetings.Telephone, email and internet support
New versions released yearly. User group holds annual meetings. Telephone, email and internet support
Phone, email and Internet support
Number of Users Hundreds/thousands for Thermoflow products
Thousands for ASPEN Tech. products
Thousands, including 70 of the top US utility companies
N/A
Industries Using the Software Power project developers, consultants, A/E's, plant operators
Process project developers, consultants, A/E's, plant operators
Consultants, A/E's, utilities, plant operators
Power project developers, consultants, A/E's, plant operators
Accuracy of Results See Table 2 N/A See Table 2 See Table 2 Output/Presentation of Results Standard reports and graphical
output N/A Tabular reports, standard FORTRAN
output format. Heat Balance Diagrams can be generated.
N/A
Calculation (convergence) Time Typically 10 - 20 seconds N/A Typically 10 - 20 seconds Typically 10 - 20 seconds Ease of Software Installation Self installing N/A Self installing N/A General Impressions of the Software
Easy to use, powerful and adaptable. Powerful & adaptable (per literature)
Powerful for fossil fueled plants, not user-friendly
Powerful for fossil fueled plants
First Time Cost (License) $9,700 (1-year), $16,800 (multi-year) N/A $13,700 N/A Term of License Annual Renewal Annual renewal N/A N/A Annual License Renewal Cost $3,900 N/A None N/A Annual Maintenance Fee Included in Annual Renewal -- $2,000 -- Consulting Services Custom modeling services,
WiseBook applications, "Value-Added" Resellers
Custom modeling services Custom modeling services Custom modeling services via "Value-Added" resellers
Interface with Other Software Elink Utility OSE N/A CycleLink Utility

31
Figures
32
Figure 1 Location of NCPA’s steam field within The Geysers geothermal field
1.0 MILE0.5
LEGEND
Boundary of known steamproduction areaUnit area boundary
0
0 5000 FEET
Power plant
UNIT 15(retired)
McCABE(5&6)
UNITS 1 & 2
(retired)
UNITS 3 & 4(retired)
RIDGE LINE(7&8)
EAGLEROCK LAKE VIEW
(17)
(12)
CCPA 1AIDLIN
DWRBOTTLE
(retired)
FUMAROLE(9&10)
GRANT(20)
SONOMA
SOCRATES(18)
GEYSERS(13)
QUICKSILVER(16)
NCPA 1(Units 1 & 2)
NCPA 2(Units 3 & 4)
BEARCANYON
CALISTOGAWEST
FORDFLATSULPHUR
SPRINGS
(11)
COBB CREEK
(14)
BIG
(19)(4)
(2)
(3)
(1)
ROCK(retired)

33
Figure 2 Monthly production and injection data for The Geysers from the California Division of Oil, Gas and Geothermal Resources
0
2,000,000
4,000,000
6,000,000
8,000,000
10,000,000
12,000,000
Mon
thly
Pro
duct
ion
(kg
*100
0)
0
2,000,000
4,000,000
6,000,000
8,000,000
Mon
thly
Inje
ctio
n(k
g *1
000)
1960 1965 1970 1975 1980 1985 1990 1995 2000 2005 20100
20
40
60
80
100
120
140
Inje
ctio
n to
Pro
duct
ion
Rat
io, %
Monthly field-wide production and injection totals from CDOGGR

34
Figure 3 Schematic Diagram of the Geysers Geothermal Production and Injection process

35
Figure 4 Geysers simulation grid used for the integrated reservoir-wellbore-pipeline model. Refined denser grid pattern in the southeast covers the NCPA portion of steamfield

36
Figure 5 Historical and forecast Geysers field-wide production and injection
0
2,000,000
4,000,000
6,000,000
8,000,000
10,000,000
12,000,000M
onth
ly P
rodu
ctio
n(k
g *1
000)
Production data from CDOGGR databaseIntegrated Reservoir Model6% Decline curve2% Decline curve (starting in 1998)
1960 1965 1970 1975 1980 1985 1990 1995 2000 2005 2010 2015 20200
1,000,000
2,000,000
3,000,000
4,000,000
5,000,000
6,000,000
7,000,000
Mon
thly
Inje
ctio
n(k
g *1
000)
Injection data from CDOGGR databaseIntegrated Reservoir Model

37
Figure 6 Observation well locations used for history matching in the integrated model
Prati
SB-25
Lf-15
Ca 186
2
DX 4596-5
GDC 72-30
DE-1
26-27

38
Figure 7Observed and calculated reservoir pressures for well CA-1862 26-27
1980 1985 1990 1995 2000 20050
50
100
150
200
250
300
350
400
450
500
550
600
Pres
sure
(psi
a@m
sl)
Data from CDOGGR databaseSimulation Results

39
Figure 8 Power cycle forecasts for plant performance at 6% resource decline through 2025.

40
Figure 9 Power cycle forecasts for plant performance at 2% resource decline through 2025

41
Figure 10 Power cycle forecasts for plant performance at 1% resource decline through 2025.

42
Figure 11 Incremental power generation trends forecast through 2025


![An efficient numerical simulator for geothermal simulation A … · Geothermal reservoir simulation entails the solution of mass and energy governing equations [3,4]. Due to the tight](https://img.pdfslide.us/doc/110x75/61356eb5dfd10f4dd73c5e88/an-efficient-numerical-simulator-for-geothermal-simulation-a-geothermal-reservoir.jpg)