Embed Size (px)
Citation preview
ARTICLEdoi:10.1038/nature10166
Integrated genomic analyses of ovariancarcinomaThe Cancer Genome Atlas Research Network*
A catalogue of molecular aberrations that cause ovarian cancer is critical for developing and deploying therapies that willimprove patients’ lives. The Cancer Genome Atlas project has analysed messenger RNA expression, microRNAexpression, promoter methylation and DNA copy number in 489 high-grade serous ovarian adenocarcinomas and theDNA sequences of exons from coding genes in 316 of these tumours. Here we report that high-grade serous ovariancancer is characterized by TP53 mutations in almost all tumours (96%); low prevalence but statistically recurrentsomatic mutations in nine further genes including NF1, BRCA1, BRCA2, RB1 and CDK12; 113 significant focal DNAcopy number aberrations; and promoter methylation events involving 168 genes. Analyses delineated four ovariancancer transcriptional subtypes, three microRNA subtypes, four promoter methylation subtypes and a transcriptionalsignature associated with survival duration, and shed new light on the impact that tumours with BRCA1/2 (BRCA1 orBRCA2) and CCNE1 aberrations have on survival. Pathway analyses suggested that homologous recombination isdefective in about half of the tumours analysed, and that NOTCH and FOXM1 signalling are involved in serous ovariancancer pathophysiology.
Ovarian cancer is the fifth-leading cause of cancer death amongwomen in the United States; 21,880 new cases and 13,850 deaths wereestimated to have occurred in 20101. Most deaths (,70%) are ofpatients presenting with advanced-stage, high-grade serous ovariancancer2,3 (HGS-OvCa). The standard treatment is aggressive surgeryfollowed by platinum–taxane chemotherapy. After therapy, platinum-resistant cancer recurs in approximately 25% of patients within sixmonths4, and the overall five-year survival probability is 31% (ref. 5).Approximately 13% of HGS-OvCa is attributable to germline muta-tions in BRCA1/2 (refs 6, 7), and a smaller percentage can be accountedfor by other germline mutations. However, most ovarian cancer can beattributed to a growing number of somatic aberrations8.
The lack of successful treatment strategies led the Cancer GenomeAtlas (TCGA) researchers to measure comprehensively genomic andepigenomic abnormalities on clinically annotated HGS-OvCa samplesto identify molecular abnormalities that influence pathophysiology,affect outcome and constitute therapeutic targets. Microarray analysesproduced high-resolution measurements of mRNA expression,microRNA (miRNA) expression, DNA copy number and DNA pro-moter methylation for 489 HGS-OvCa tumours, and massively parallelsequencing coupled with hybrid affinity capture9,10 provided whole-exome DNA sequence information for 316 of these samples.
Samples and clinical dataThis Article reports the analysis of 489 clinically annotated stage-II–IV HGS-OvCa samples and corresponding normal DNA (Sup-plementary Methods, section 1, and Supplementary Table 1.1).Patients reflected the age at diagnosis, stage, tumour grade and sur-gical outcome of individuals typically diagnosed with HGS-OvCa.Clinical data were current as of 25 August 2010. HGS-OvCa speci-mens were surgically resected before systemic treatment but allpatients received a platinum agent and 94% received a taxane. Themedian progression-free survival and overall survival of the cohort aresimilar to those in previously published trials11,12. Twenty-five percent of the patients remained free from disease and 45% were alive
at the time of last follow-up, whereas 31% experienced disease pro-gression within six months of completing platinum-based therapy.The median follow-up time was 30 months (range, 0–179 months).Samples for TCGA analysis were selected to have .70% tumour cellnuclei and ,20% necrosis.
Coordinated molecular analyses using multiple molecular assays atindependent sites were carried out as listed in Table 1. The data setanalysed here is available at the TCGA website (http://tcga-data.nci.nih.gov/docs/publications/ov_2011), in two tiers: open access andcontrolled access. Open-access data sets are publicly available,whereas controlled-access data sets, which include clinical or genomicinformation that could identify an individual, require user certifica-tion as described on the aforementioned website.
*Lists of participants and their affiliations appear at the end of the paper.
Table 1 | Characterization platforms used and data producedData type Platforms Cases Data access
DNA sequence of exome Illumina GAIIx*{ 236 ControlledABI SOLiD{ 80 Controlled
Mutations present in exome 316 OpenDNA copy number/genotype Agilent 244K1I 97 Open
Agilent 415K1 304 OpenAgilent 1MI 539 Open
Illumina 1MDUO" 535 ControlledAffymetrix SNP6* 514 Controlled
mRNA expression profiling Affymetrix U133A* 516 OpenAffymetrix Exon# 517 ControlledAgilent 244K** 540 Open
Integrated mRNA expression 489 OpenmiRNA expression profiling Agilent** 541 OpenCpG DNA methylation Illumina 27K{{ 519 OpenIntegrative analysis 489 OpenIntegrative analysis withmutations
309 Open
Production centres: *Broad Institute, {Washington University School of Medicine, {Baylor College ofMedicine, 1Harvard Medical School, IMemorial Sloan-Kettering Cancer Center, "HudsonAlphaInstitute for Biotechnology, #Lawrence Berkeley National Laboratory, **University of North Carolina atChapel Hill, {{University of Southern California. Extra data are available for many of these data types atthe TCGA data coordinating centre.
3 0 J U N E 2 0 1 1 | V O L 4 7 4 | N A T U R E | 6 0 9
Macmillan Publishers Limited. All rights reserved©2011

Mutation analysisWe performed exome capture and sequencing on DNA isolated from316 HGS-OvCa samples and from matched normal samples for eachindividual (Supplementary Methods, section 2). Capture reagentstargeted ,180,000 exons from ,18,500 genes totalling ,33 mega-bases of non-redundant sequence. Massively parallel sequencing onthe Illumina GAIIx platform (236 sample pairs) or ABI SOLiD 3platform (80 sample pairs) yielded ,14 gigabases per sample(,9 3 1012 bases in total). On average, 76% of coding bases werecovered in sufficient depth in both the tumour and the matchednormal samples to allow confident mutation detection (Supplemen-tary Methods, section 2, and Supplementary Fig. 2.1). We annotated19,356 somatic mutations (,61 per tumour); these are classified inSupplementary Table 2.1. Mutations that may be important in HGS-OvCa pathophysiology were identified by searching for non-synonymous or splice site mutations present at significantly increasedfrequencies relative to background, by comparing mutations in thisstudy to those in the Catalogue of Somatic Mutations in Cancer andOnline Mendelian Inheritance in Man, and by predicting the muta-tions’ impacts on protein function.
Two different algorithms (Supplementary Methods, section 2)identified nine genes (Table 2) for which the number of non-synonymous or splice site mutations was significantly more than thatexpected on the basis of mutation distribution models. Consistentwith published results13, TP53 was mutated in 303 of 316 samples(283 by automated methods and 20 after manual review), andBRCA1 and BRCA2 had germline mutations in 9% and 8% of cases,respectively, and showed somatic mutations in a further 3% of cases.We identified six other statistically recurrently mutated genes: RB1,NF1, FAT3, CSMD3, GABRA6 and CDK12. CDK12 is involved inRNA splicing regulation14 and was previously implicated in lungand large-intestine tumours15,16. Five of the nine CDK12 mutationswere either nonsense or indel, suggesting potential loss of function,and the four missense mutations (Arg882Leu, Tyr901Cys, Lys975Gluand Leu996Phe) were clustered in its protein kinase domain. GABRA6and FAT3 both appeared as significantly mutated but did not seem tobe expressed in HGS-OvCa (Supplementary Fig. 2.1) or fallopian tubetissue, so it is less likely that mutation of these genes has a significantrole in HGS-OvCa.
We compared mutations from this study with mutations in theCatalogue of Somatic Mutations in Cancer17 and Online MendelianInheritance in Man18 databases to identify more HGS-OvCa genes thatare less commonly mutated. These comparisons yielded 477 and 211matches, respectively (Supplementary Table 2.4), including mutationsin BRAF (Asn581Ser), PIK3CA (Glu545Lys and His1047Arg), KRAS(Gly12Asp) and NRAS (Gln61Arg). These mutations have been shownto have transforming activity, so we believe that these mutations arerare but important drivers in HGS-OvCa.
We combined evolutionary information from sequence alignmentsof protein families and whole vertebrate genomes, predicted localprotein structure and selected human SwissProt protein features
(Supplementary Methods, section 3) to identify putative driver muta-tions using CHASM19,20 after training on mutations in known onco-genes and tumour suppressors. CHASM identified 122 missensemutations predicted to be oncogenic (Supplementary Table 3.1).Mutation-driven changes in protein function were deduced fromevolutionary information for all confirmed somatic missense muta-tions by comparing protein family sequence alignments and residueplacement in known or homology-based three-dimensional proteinstructures using MutationAssessor (Supplementary Methods, section4). Twenty-seven per cent of missense mutations were predicted toaffect protein function (Supplementary Table 2.1).
Copy number analysisSomatic copy number alterations (SCNAs) present in the 489 HGS-OvCa genomes were identified and compared with glioblastoma mul-tiforme data (Fig. 1a). SCNAs were divided into regional aberrationsthat affected extended chromosome regions and smaller focal aberra-tions (Supplementary Methods, section 5). A statistical analysis ofregional aberrations21 (Supplementary Methods, section 5) identifiedeight recurrent gains and 22 losses, all of which have been reportedpreviously22 (Fig. 1b and Supplementary Table 5.1). Five of the gainsand 18 of the losses occurred in more than 50% of the tumours.
We used GISTIC21,23 (Supplementary Methods, section 5) toidentify recurrent focal SCNAs. This yielded 63 regions of focal amp-lification (Fig. 1c; Supplementary Methods, section 5; and Sup-plementary Table 5.2), including 26 that encoded eight or fewer genes.The most common focal amplifications encoded CCNE1, MYC andMECOM (Fig. 1c; Supplementary Methods, section 5; and Sup-plementary Table 5.2), each of which was highly amplified in morethan 20% of tumours. New tightly localized amplification peaks inHGS-OvCa encoded the receptor for activated C-kinase, ZMYND8;the p53 target gene IRF2BP2; the DNA-binding protein inhibitor ID4;the embryonic development gene PAX8; and the telomerase catalyticsubunit, TERT. Three data sources—Ingenuity Systems (http://www.ingenuity.com/), ClinicalTrials.gov (http://clinicaltrials.gov) andDrugBank (http://www.drugbank.ca)—were used to identify possibletherapeutic inhibitors of amplified, overexpressed genes. From thissearch, we found that 22 genes that are therapeutic targets, includingMECOM, MAPK1, CCNE1 and KRAS, are amplified in at least 10% ofthe cases (Supplementary Table 5.3).
GISTIC also identified 50 focal deletions (Fig. 1c). The knowntumour suppressor genes PTEN, RB1 and NF1 were in regions ofhomozygous deletions in at least 2% of the tumours. Notably, RB1and NF1 also were among the significantly mutated genes. One dele-tion contained only three genes, including the essential cell cyclecontrol gene CREBBP, which has five non-synonymous and two read-ing frame shift mutations.
mRNA and miRNA expression and DNA methylationanalysisWe combined expression measurements for 11,864 genes from threedifferent platforms (Agilent, Affymetrix HuEx and Affymetrix U133A)for subtype identification and outcome prediction. Individual platformmeasurements suffered from limited, but statistically significant, batcheffects, whereas the combined data set did not (SupplementaryMethods, section 11, and Supplementary Fig. 11.1). Analysis of thecombined data set identified ,1,500 intrinsically variable genes24
(Supplementary Methods, section 6) that were used for non-negativematrix factorization consensus clustering. This analysis yielded fourclusters (Fig. 2a and Supplementary Methods, section 6). The sameanalytic approach applied to a publicly available data set from ref. 25also yielded four clusters. Comparison of these two sets of four clustersshowed a clear correlation (Supplementary Methods, section 6, andSupplementary Fig. 6.3). We therefore conclude that at least fourrobust expression subtypes exist in HGS-OvCa.
Table 2 | Significantly mutated genes in HGS-OvCaGene No. of mutations No. validated No. unvalidated
TP53 302 294 8BRCA1 11 10 1CSMD3 19 19 0NF1 13 13 0CDK12 9 9 0FAT3 19 18 1GABRA6 6 6 0BRCA2 10 10 0RB1 6 6 0
Validated mutations are those that have been confirmed with an independent assay. Most of them arevalidated using a second independent whole-genome-amplification sample from the same tumour.Unvalidated mutations have not been independently confirmed but have a high likelihood to be truemutations. An extra 25 mutations in TP53 were observed by hand curation.
RESEARCH ARTICLE
6 1 0 | N A T U R E | V O L 4 7 4 | 3 0 J U N E 2 0 1 1
Macmillan Publishers Limited. All rights reserved©2011

We termed the four HGS-OvCa subtypes ‘immunoreactive’, ‘dif-ferentiated’, ‘proliferative’ and ‘mesenchymal’ on the basis of genecontent in the clusters (Supplementary Methods, section 6) and pre-vious observations25. T-cell chemokine ligands CXCL11 and CXCL10and the receptor CXCR3 characterized the immunoreactive subtype.High expression of transcription factors such as HMGA2 and SOX11,low expression of ovarian tumour markers (MUC1 and MUC16) andhigh expression of proliferation markers such as MCM2 and PCNAdefined the proliferative subtype. The differentiated subtype wasassociated with high expression of MUC16 and MUC1 and withexpression of the secretory fallopian tube maker SLPI, suggesting amore mature stage of development. High expression of HOX genesand markers suggestive of increased stromal components such as formyofibroblasts (FAP) and microvascular pericytes (ANGPTL2 andANGPTL1) characterized the mesenchymal subtype.
Increased DNA methylation and reduced tumour expressionimplicated 168 genes as epigenetically silenced in HGS-OvCa samplescompared with fallopian tube controls26. DNA methylation wascorrelated with reduced gene expression across all samples (Sup-plementary Methods, section 7). AMT, CCL21 and SPARCL1 werenoteworthy because they showed promoter hypermethylation in thevast majority of the tumours. Unexpectedly, RAB25, previouslyreported to be amplified and overexpressed in ovarian cancer27, alsoseemed to be epigenetically silenced in a subset of tumours. TheBRCA1 promoter was hypermethylated and silenced in 56 of 489(11.5%) tumours, as previously reported28 (Supplementary Fig. 7.1).
Consensus clustering of variable DNA methylation across tumoursidentified four subtypes (Supplementary Methods, section 7, andSupplementary Fig. 7.2) that were significantly associated with differ-ences in age, BRCA inactivation events and survival (SupplementaryMethods, section 7). However, the clusters demonstrated only modeststability.
Survival duration did not differ significantly for transcriptional sub-types in the TCGA data set. The proliferative group showed a decreasein the rate of MYC amplification and RB1 deletion, whereas the immu-noreactive subtype showed an increased frequency of 3q26.2(MECOM) amplification (Supplementary Table 6.2 and Supplemen-tary Fig. 6.4). A moderate, but significant, overlap between the DNAmethylation clusters and gene expression subtypes was noted(P , 2.2 3 10216, chi-squared test, adjusted Rand index of 0.07;Supplementary Methods, section 7, and Supplementary Table 7.6).
A 193-gene transcriptional signature predictive of overall survivalwas defined using the integrated expression data set from 215 samples.After univariate Cox regression analysis, we found that 108 genes werecorrelated with poor survival and that 85 were correlated with goodsurvival (P-value cut-off of 0.01; Supplementary Methods, section 6,and Supplementary Table 6.4). We validated the predictive power ofthis gene expression signature on an independent set of 255 TCGAsamples (Fig. 2b) as well as on three independent expression datasets25,29,30. Each of the validation samples was assigned a prognosticgene score, reflecting the similarity between its expression profile andthe prognostic gene signature31 (Supplementary Methods, section 6).
HGS-OvCa
0.25 10–20
10–4010–2010–1010–5.50.25
10–40 10–60 10–80
10–80
FDR Q value FDR Q value
AmplificationNeutralDeletion
10–60 10–40 10–20 10–40 10–20 10–10 0.2510–5.50.25
GBM
1p36.33
1p34.2
1q21.2
4q13.3
5p15.33
6p22.3
5p13.2
8p11.21
DEPTOR
12q13.2
12q15
14q11.2 (METTL17)
14q32.33
a
c
b
Figure 1 | Genome copy number abnormalities. a, Copy number profiles of489 HGS-OvCa, compared with profiles of 197 glioblastoma multiforme(GBM) tumours47. Copy number increases (red) and decreases (blue) areplotted as a function of distance along the normal genome (vertical axis, dividedinto chromosomes). b, Significant, focally amplified (red) and deleted (blue)regions are plotted along the genome. Annotations include the 20 most
significant amplified and deleted regions, well-localized regions with eight orfewer genes, and regions with known cancer genes or genes identified bygenome-wide loss-of-function screens. The number of genes included in eachregion is given in brackets. FDR, false-discovery rate. c, Significantly amplified(red) and deleted (blue) chromosome arms.
ARTICLE RESEARCH
3 0 J U N E 2 0 1 1 | V O L 4 7 4 | N A T U R E | 6 1 1
Macmillan Publishers Limited. All rights reserved©2011

Kaplan–Meier survival analysis of this signature showed statisticallysignificant association with survival in all validation data sets (Fig. 2cand Supplementary Methods, section 6).
Non-negative matrix factorization consensus clustering of miRNAexpression data identified three subtypes (Supplementary Fig. 6.5).Notably, miRNA subtype 1 overlapped the mRNA proliferative sub-type and miRNA subtype 2 overlapped the mRNA mesenchymalsubtype (Fig. 2d). Survival duration differed significantly betweenmiRNA subtypes: patients with miRNA subtype-1 tumours survivedsignificantly longer (Fig. 2e).
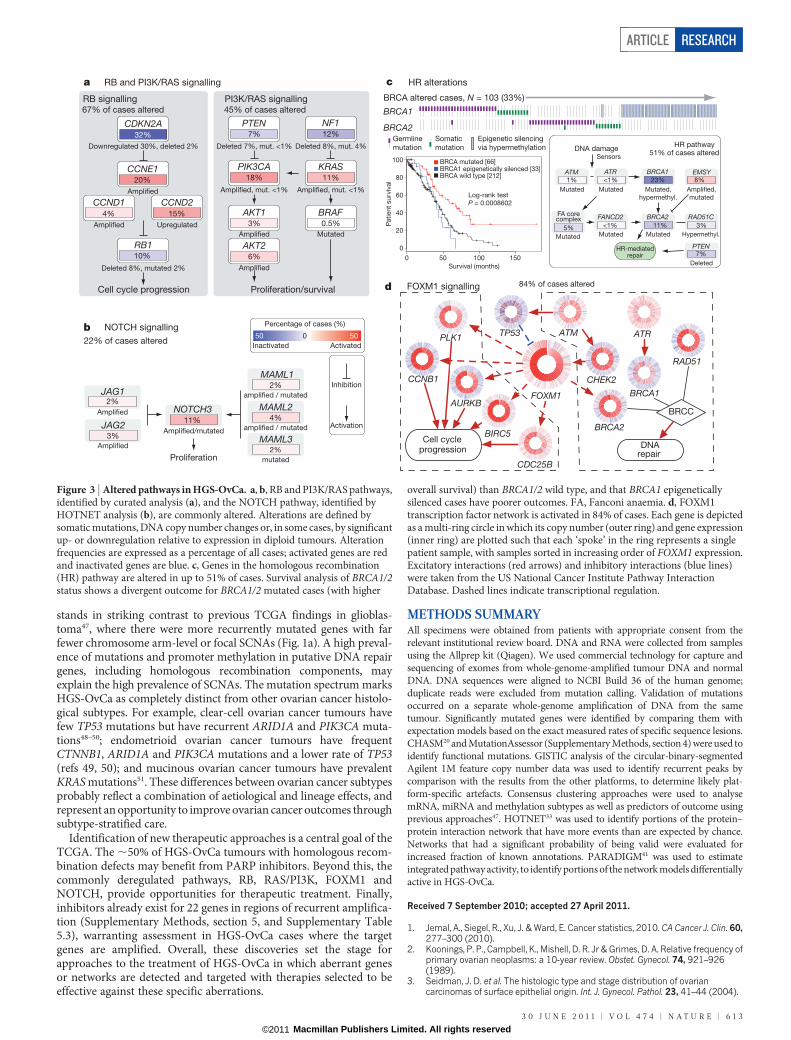
Pathways influencing diseaseSeveral analyses integrated data from the 316 fully analysed cases toidentify biology that contributes to HGS-OvCa. Analysis of the fre-quency with which known cancer-associated pathways harbouredone or more mutations, copy number changes or changes in geneexpression showed that the RB1 and PI3K/RAS pathways werederegulated in 67% and 45% of cases, respectively (Fig. 3a and Sup-plementary Methods, section 8). A search for altered subnetworks in alarge protein–protein interaction network32 using HOTNET33 iden-tified several known pathways (Supplementary Methods, section 9)
including the NOTCH signalling pathway, which was altered in 22%of HGS-OvCa samples34 (Fig. 3b).
Published studies have shown that cells with mutated or methylatedBRCA1 or mutated BRCA2 have defective homologous recombinationand are highly responsive to PARP inhibitors35–38. Fig. 3c shows that 20%of our studied HGS-OvCa samples had germline or somatic mutations inBRCA1/2, that 11% lost BRCA1 expression through DNA hypermethy-lation and that epigenetic silencing of BRCA1 was mutually exclusive ofBRCA1/2 mutations (P 5 4.4 3 1024, Fisher’s exact test). Univariate sur-vival analysis of BRCA1/2 status (Fig. 3c) showed better overall survivalfor BRCA1/2 mutated cases than BRCA1/2 wild-type cases. Notably,epigenetically silenced BRCA1 cases had survival similar to BRCA1/2wild-type HGS-OvCa tumours (respective median overall survivals of41.5 and 41.9 months, P 5 0.69, log-rank test; Supplementary Methods,section 8, and Supplementary Fig. 8.13b). This suggests that BRCA1 isinactivated by mutually exclusive genomic and epigenomic mechanismsand that patient survival depends on the mechanism of inactivation.Genomic alterations in other homologous recombination genes thatmight render cells sensitive to PARP inhibitors39 discovered in this study(Supplementary Methods, section 8, and Supplementary Fig. 8.12)include amplification or mutation of EMSY (also known as C11orf30)(8%), focal deletion or mutation of PTEN (7%), hypermethylation ofRAD51C (3%), mutation of ATM or ATR (2%), and mutation ofFanconi anaemia genes (5%). Overall, homologous recombinationdefects may be present in approximately half of all HGS-OvCa cases,providing a rationale for clinical trials of PARP inhibitors targetingtumours with these homologous-recombination-related aberrations.
Comparison between the complete set of BRCA inactivation eventsand all recurrently altered copy number peaks revealed an unexpectedlylow frequency of CCNE1 amplification in cases with BRCA inactivation(8% of BRCA altered cases had CCNE1 amplification whereas 26% ofBRCA wild-type cases did; Q 5 0.0048, adjusted for false-discoveryrate). As previously reported40, overall survival tended to be lower forpatients with CCNE1 amplification than for patients in all other cases(P 5 0.072, log-rank test; Supplementary Methods, section 8, andSupplementary Fig. 8.14a). However, no survival disadvantage forCCNE1-amplified cases (P 5 0.24, log-rank test; SupplementaryMethods, section 8, and Supplementary Fig. 8.14b) was apparent whenlooking only at BRCA wild-type cases, suggesting that the previouslyreported CCNE1 survival difference can be explained by the highersurvival of BRCA-mutated cases.
Finally, we used a probabilistic graphical model (PARADIGM41) tosearch for altered pathways in the US National Cancer InstitutePathway Interaction Database42, and found that the FOXM1 tran-scription factor network (Fig. 3d) is significantly altered in 87% ofcases (Supplementary Methods, section 10, and Supplementary Figs10.1–10.3). FOXM1 and its proliferation-related target genes, AurB(AURKB), CCNB1, BIRC5, CDC25 and PLK1, were consistently over-expressed but not altered by DNA copy number changes, indicative oftranscriptional regulation. TP53 represses FOXM1 after DNA damage43,suggesting that the high rate of TP53 mutation in HGS-OvCa contri-butes to FOXM1 overexpression. In other data sets, the FOXM1 path-way is significantly activated in tumours relative to adjacent epithelialtissue44–46 (Supplementary Methods, section 10, and Supplementary Fig.10.4) and is associated with HGS-OvCa22 (Supplementary Methods,section 10, and Supplementary Fig. 10.5).
DiscussionThis TCGA study provides a large-scale integrative view of the aberra-tions in HGS-OvCa. Overall, the mutational spectrum was surprisinglysimple. Mutations in TP53 predominated, occurring in at least 96% ofHGS-OvCa samples; and BRCA1 and BRCA2 were mutated in 22% oftumours, owing to a combination of germline and somatic mutations.Seven other significantly mutated genes were identified, but only in2–6% of HGS-OvCa samples. By contrast, HGS-OvCa demonstrates aremarkable degree of genomic disarray. The frequency of SCNAs
TCGA training set(Batches 9–15; 215 tumors)
TCGA test set(Batches 17–24; 255 tumors)
Poor prognosis
genes (107)
Good prognosis
genes (85)
Death event (red)
0
10
–10
Prognostic
gene score
b
c
HighLow
Gene expression
Differentiated
Immunoreactive
Mesenchymal
Proliferative
Tumour/gene groups
TCGA Ref. 25
Ref. 25
Ref. 29 Ref. 30
489 tumours 245 tumours
1,0
00 g
enes
a
Lower risk Higher risk Higher riskLower risk
0
0.2
0.4
0.6
0.8
1
0
0.2
0.4
0.6
0.8
1
0
0.2
0.4
0.6
0.8
1
0
0.2
0.4
0.6
0.8
1
Overall survival (months) Overall survival (months)
Overall survival (months) Overall survival (months)
TCGA test set
N = 255 N = 237
N = 169 N = 118
Log-rank P = 0.005 Cox P = 0.02
Log-rank P = 0.001 Cox P = 0.0002
Log-rank P = 0.0002 Cox P = 8 × 10⁻⁵
Log-rank P = 0.02 Cox P = 0.02
20 40 600 20 40 600
20 40 600 20 40 600
D I M P
Gene clusterd
miRNAcluster
e
0Su
rviv
al p
rob
ab
ility
Su
rviv
al p
rob
ab
ility
Su
rviv
al p
rob
ab
ility
0.2
0.4
0.6
0.8
1
Overall survival (months)
TCGA
20 40 600
C1
C2
C3
55
40
39
48
21
37
15
51
43
89
29
20
C1C2
Log-rank P = 0.007
C3
N = 480
Figure 2 | Gene and miRNA expression patterns of molecular subtype andoutcome prediction in HGS-OvCa. a, Tumours from TCGA and ref. 25separated into four clusters on the basis of gene expression. b, Using a trainingdata set, a prognostic gene signature was defined and applied to a test data set.c, Kaplan–Meier analysis of four independent expression profile data sets,comparing survival for predicted higher-risk patients versus lower-riskpatients. Univariate Cox P value for risk index included. d, Tumours separatedinto three clusters on the basis of miRNA expression, overlapping with gene-based clusters as indicated. D, differentiated; I, immunoreactive; M,mesenchymal; P, proliferative (red font indicates high degree of overlap).e, Differences in patient survival among the three miRNA-based clusters.
RESEARCH ARTICLE
6 1 2 | N A T U R E | V O L 4 7 4 | 3 0 J U N E 2 0 1 1
Macmillan Publishers Limited. All rights reserved©2011
stands in striking contrast to previous TCGA findings in glioblas-toma47, where there were more recurrently mutated genes with farfewer chromosome arm-level or focal SCNAs (Fig. 1a). A high preval-ence of mutations and promoter methylation in putative DNA repairgenes, including homologous recombination components, mayexplain the high prevalence of SCNAs. The mutation spectrum marksHGS-OvCa as completely distinct from other ovarian cancer histolo-gical subtypes. For example, clear-cell ovarian cancer tumours havefew TP53 mutations but have recurrent ARID1A and PIK3CA muta-tions48–50; endometrioid ovarian cancer tumours have frequentCTNNB1, ARID1A and PIK3CA mutations and a lower rate of TP53(refs 49, 50); and mucinous ovarian cancer tumours have prevalentKRAS mutations51. These differences between ovarian cancer subtypesprobably reflect a combination of aetiological and lineage effects, andrepresent an opportunity to improve ovarian cancer outcomes throughsubtype-stratified care.
Identification of new therapeutic approaches is a central goal of theTCGA. The ,50% of HGS-OvCa tumours with homologous recom-bination defects may benefit from PARP inhibitors. Beyond this, thecommonly deregulated pathways, RB, RAS/PI3K, FOXM1 andNOTCH, provide opportunities for therapeutic treatment. Finally,inhibitors already exist for 22 genes in regions of recurrent amplifica-tion (Supplementary Methods, section 5, and Supplementary Table5.3), warranting assessment in HGS-OvCa cases where the targetgenes are amplified. Overall, these discoveries set the stage forapproaches to the treatment of HGS-OvCa in which aberrant genesor networks are detected and targeted with therapies selected to beeffective against these specific aberrations.
METHODS SUMMARYAll specimens were obtained from patients with appropriate consent from therelevant institutional review board. DNA and RNA were collected from samplesusing the Allprep kit (Qiagen). We used commercial technology for capture andsequencing of exomes from whole-genome-amplified tumour DNA and normalDNA. DNA sequences were aligned to NCBI Build 36 of the human genome;duplicate reads were excluded from mutation calling. Validation of mutationsoccurred on a separate whole-genome amplification of DNA from the sametumour. Significantly mutated genes were identified by comparing them withexpectation models based on the exact measured rates of specific sequence lesions.CHASM20 and MutationAssessor (Supplementary Methods, section 4) were used toidentify functional mutations. GISTIC analysis of the circular-binary-segmentedAgilent 1M feature copy number data was used to identify recurrent peaks bycomparison with the results from the other platforms, to determine likely plat-form-specific artefacts. Consensus clustering approaches were used to analysemRNA, miRNA and methylation subtypes as well as predictors of outcome usingprevious approaches47. HOTNET33 was used to identify portions of the protein–protein interaction network that have more events than are expected by chance.Networks that had a significant probability of being valid were evaluated forincreased fraction of known annotations. PARADIGM41 was used to estimateintegrated pathway activity, to identify portions of the network models differentiallyactive in HGS-OvCa.
Received 7 September 2010; accepted 27 April 2011.
1. Jemal, A., Siegel, R., Xu, J. & Ward, E. Cancer statistics, 2010. CA Cancer J. Clin. 60,277–300 (2010).
2. Koonings, P. P., Campbell, K., Mishell, D. R. Jr & Grimes, D. A. Relative frequency ofprimary ovarian neoplasms: a 10-year review. Obstet. Gynecol. 74, 921–926(1989).
3. Seidman, J. D. et al. The histologic type and stage distribution of ovariancarcinomas of surface epithelial origin. Int. J. Gynecol. Pathol. 23, 41–44 (2004).
a
Cell cycle progression
RB signalling67% of cases altered
PI3K/RAS signalling
Percentage of cases (%)
Inactivated
050 50
Activated
45% of cases altered
Deleted 8%, mut. 4%
Amplified, mut. <1%
Mutated
Downregulated 30%, deleted 2%
Amplified Upregulated
Deleted 8%, mutated 2%
Deleted 7%, mut. <1%
Amplified, mut. <1%
Amplified
Amplified
22% of cases altered
NOTCH311%
Amplified/mutated
Amplified
JAG12%
Amplified
JAG23%
Proliferation/survival d
mutated
MAML32%
amplified / mutated
MAML12%
amplified / mutated
MAML24%
Inhibition
Activation
Proliferation
b NOTCH signalling
RB and PI3K/RAS signalling
CCNE120%
Amplified
CDKN2A32%
CCND215%
CCND14%
NF112%
KRAS11%
BRAF0.5%
PTEN7%
PIK3CA18%
AKT13%
AKT26%
RB110%
84% of cases alteredFOXM1 signalling
TP53
FOXM1
ATR
CHEK2
BRCA1
BRCA2
RAD51
BIRC5Cell cycle
progression
BRCC
DNArepair
CDC25B
ATM
HR alterationscBRCA altered cases, N = 103 (33%)
BRCA1
BRCA2
PLK1
CCNB1
AURKB
Epigenetic silencing
via hypermethylation
Somatic
mutation
Germline
mutation DNA damage
ATM1%
ATR<1%
FA corecomplex
5%
FANCD2<1%
BRCA123%
BRCA211%
EMSY8%
RAD51C3%
Mutated Mutated Mutated,
hypermethyl.
Mutated Hypermethyl.Mutated
Amplified,
mutated
Mutated
Sensors
HR-mediatedrepair
PTEN7%
Deleted
HR pathway51% of cases altered
0
20
40
60
80
100 BRCA mutated [66]BRCA1 epigenetically silenced [33]BRCA wild type [212]
Patien
t su
rviv
al
Log-rank test
P = 0.0008602
0 50 100 150
Survival (months)
Figure 3 | Altered pathways in HGS-OvCa. a, b, RB and PI3K/RAS pathways,identified by curated analysis (a), and the NOTCH pathway, identified byHOTNET analysis (b), are commonly altered. Alterations are defined bysomatic mutations, DNA copy number changes or, in some cases, by significantup- or downregulation relative to expression in diploid tumours. Alterationfrequencies are expressed as a percentage of all cases; activated genes are redand inactivated genes are blue. c, Genes in the homologous recombination(HR) pathway are altered in up to 51% of cases. Survival analysis of BRCA1/2status shows a divergent outcome for BRCA1/2 mutated cases (with higher
overall survival) than BRCA1/2 wild type, and that BRCA1 epigeneticallysilenced cases have poorer outcomes. FA, Fanconi anaemia. d, FOXM1transcription factor network is activated in 84% of cases. Each gene is depictedas a multi-ring circle in which its copy number (outer ring) and gene expression(inner ring) are plotted such that each ‘spoke’ in the ring represents a singlepatient sample, with samples sorted in increasing order of FOXM1 expression.Excitatory interactions (red arrows) and inhibitory interactions (blue lines)were taken from the US National Cancer Institute Pathway InteractionDatabase. Dashed lines indicate transcriptional regulation.
ARTICLE RESEARCH
3 0 J U N E 2 0 1 1 | V O L 4 7 4 | N A T U R E | 6 1 3
Macmillan Publishers Limited. All rights reserved©2011

4. Miller, D. S. et al. Phase II evaluation of pemetrexed in the treatment of recurrent orpersistent platinum-resistant ovarian or primary peritoneal carcinoma: a study ofthe Gynecologic Oncology Group. J. Clin. Oncol. 27, 2686–2691 (2009).
5. Jemal, A. et al. Cancer statistics, 2009. CA Cancer J. Clin. 59, 225–249 (2009).6. Pal, T. et al. BRCA1 and BRCA2 mutations account for a large proportion of ovarian
carcinoma cases. Cancer 104, 2807–2816 (2005).7. Risch, H. A. et al. Population BRCA1 and BRCA2 mutation frequencies and cancer
penetrances: a kin-cohort study in Ontario, Canada. J. Natl Cancer Inst. 98,1694–1706 (2006).
8. Bast, R. C. Jr, Hennessy, B. & Mills, G. B. The biology of ovarian cancer: newopportunities for translation. Nature Rev. Cancer 9, 415–428 (2009).
9. Gnirke, A. et al. Solution hybrid selection with ultra-long oligonucleotides formassively parallel targeted sequencing. Nature Biotechnol. 27, 182–189 (2009).
10. Hodges, E. et al. Hybrid selection of discrete genomic intervals on custom-designed microarrays for massively parallel sequencing. Nature Protocols 4,960–974 (2009).
11. Bookman, M. A. et al. Evaluation of new platinum-based treatment regimens inadvanced-stage ovarian cancer: a phase III trial of the Gynecologic CancerIntergroup. J. Clin. Oncol. 27, 1419–1425 (2009).
12. Muggia, F. M. et al. Phase III randomized study of cisplatin versus paclitaxel versuscisplatin and paclitaxel in patients with suboptimal stage III or IV ovarian cancer: agynecologic oncology group study. J. Clin. Oncol. 18, 106–115 (2000).
13. Ahmed, A. A. et al. Driver mutations in TP53 are ubiquitous in high grade serouscarcinoma of the ovary. J. Pathol. 221, 49–56 (2010).
14. Chen, H. H., Wang, Y. C. & Fann, M. J. Identification and characterization of theCDK12/cyclinL1 complex involved inalternative splicing regulation. Mol. Cell. Biol.26, 2736–2745 (2006).
15. Ding, L. et al. Somatic mutations affect key pathways in lung adenocarcinoma.Nature 455, 1069–1075 (2008).
16. Aldred, M. A. & Trembath, R. C. Activating and inactivating mutations in the humanGNAS1 gene. Hum. Mutat. 16, 183–189 (2000).
17. Forbes, S. A. et al. in Current Protocols in Human Genetics (eds Haines, J. L. et al.) Ch.10, Unit 10.11 (Wiley, 2008).
18. McKusick, V. A. Mendelian Inheritance in Man and its online version, OMIM. Am. J.Hum. Genet. 80, 588–604 (2007).
19. Carter, H. et al. Cancer-specific high-throughput annotation of somatic mutations:computational prediction of driver missense mutations. Cancer Res. 69,6660–6667 (2009).
20. Carter, H., Samayoa, J., Hruban, R.H.& Karchin,R.Prioritization ofdrivermutationsin pancreatic cancer using cancer-specific high-throughput annotation of somaticmutations (CHASM). Cancer Biol. Ther. 10, 582–587 (2010).
21. Beroukhim, R. et al. The landscape of somatic copy-number alteration acrosshuman cancers. Nature 463, 899–905 (2010).
22. Etemadmoghadam, D. et al. Integrated genome-wide DNA copy number andexpression analysis identifies distinct mechanisms of primary chemoresistance inovarian carcinomas. Clin. Cancer Res. 15, 1417–1427 (2009).
23. Beroukhim, R. et al. Assessing the significance of chromosomal aberrations incancer: methodology and application to glioma. Proc. Natl Acad. Sci. USA 104,20007–20012 (2007).
24. Verhaak, R. G. et al. Integrated genomic analysis identifies clinically relevantsubtypes of glioblastoma characterized by abnormalities in PDGFRA, IDH1, EGFR,and NF1. Cancer Cell 17, 98–110 (2010).
25. Tothill, R. W. et al. Novel molecular subtypes of serous and endometrioid ovariancancer linked to clinical outcome. Clin. Cancer Res. 14, 5198–5208 (2008).
26. Dubeau, L. The cell of origin of ovarian epithelial tumours. Lancet Oncol. 9,1191–1197 (2008).
27. Cheng, K. W. et al. The RAB25 small GTPase determines aggressiveness of ovarianand breast cancers. Nature Med. 10, 1251–1256 (2004).
28. Esteller, M. et al. Promoter hypermethylation and BRCA1 inactivation in sporadicbreast and ovarian tumors. J. Natl. Cancer Inst. 92, 564–569 (2000).
29. Bonome, T. et al. A gene signature predicting for survival in suboptimally debulkedpatients with ovarian cancer. Cancer Res. 68, 5478–5486 (2008).
30. Dressman, H. K. et al. An integrated genomic-based approach to individualizedtreatment of patients with advanced-stage ovarian cancer. J. Clin. Oncol. 25,517–525 (2007).
31. Creighton, C. J. et al. Insulin-like growth factor-I activates gene transcriptionprograms strongly associated with poor breast cancer prognosis. J. Clin. Oncol. 26,4078–4085 (2008).
32. Keshava Prasad, T. S. et al. Human Protein Reference Database–2009 update.Nucleic Acids Res. 37, D767–D772 (2009).
33. Vandin, F., Upfal, E. & Raphael, B. J. in Proc. 14th Internat. Conf. Res. Comput. Mol.Biol. (ed. Berger, B.) 506–521 (Springer, 2010).
34. Choi, J. H. et al. Jagged-1 and Notch3 juxtacrine loop regulates ovarian tumorgrowth and adhesion. Cancer Res. 68, 5716–5723 (2008).
35. Farmer, H. et al. Targeting the DNA repair defect in BRCA mutant cells as atherapeutic strategy. Nature 434, 917–921 (2005).
36. Fong, P. C. et al. Inhibition of poly(ADP-ribose) polymerase in tumors from BRCAmutation carriers. N. Engl. J. Med. 361, 123–134 (2009).
37. Veeck, J. et al. BRCA1 CpG island hypermethylation predicts sensitivity topoly(adenosine diphosphate)-ribose polymerase inhibitors. J. Clin. Oncol. 28,e563–e564 (2010).
38. Yap, T. A, et al. Reply to J. Veeck et al. J. Clin. Oncol. 10, e565–e566 (2010).39. Mendes-Pereira, A. M. et al. Synthetic lethal targeting of PTEN mutant cells with
PARP inhibitors. EMBO Mol. Med. 1, 315–322 (2009).40. Nakayama, N. et al. Gene amplification CCNE1 is related to poor survival and
potential therapeutic target in ovarian cancer. Cancer 116, 2621–2634 (2010).
41. Vaske, C. J. et al. Inference of patient-specific pathway activities from multi-dimensional cancer genomics data using PARADIGM. Bioinformatics 26,i237–i245 (2010).
42. Schaefer, C. F. et al. PID: the Pathway Interaction Database. Nucleic Acids Res. 37,D674–D679 (2009).
43. Barsotti, A. M. & Prives, C. Pro-proliferative FoxM1 is a target of p53-mediatedrepression. Oncogene 28, 4295–4305 (2009).
44. Tone, A. A. et al. Gene expression profiles of luteal phase fallopian tube epitheliumfrom BRCA mutation carriers resemble high-grade serous carcinoma. Clin. CancerRes. 14, 4067–4078 (2008).
45. Myatt, S. S. & Lam, E. W. The emerging roles of forkhead box (Fox) proteins incancer. Nature Rev. Cancer 7, 847–859 (2007).
46. Wang, I. C. et al. Deletion of Forkhead Box M1 transcription factor from respiratoryepithelial cells inhibits pulmonary tumorigenesis. PLoS ONE 4, e6609 (2009).
47. The Cancer Genome Atlas Research Network. Comprehensive genomiccharacterization defines human glioblastoma genes and core pathways. Nature455, 1061–1068 (2008).
48. Ho, E. S.-C. et al. p53 mutation is infrequent in clear cell carcinoma of the ovary.Gynecol. Oncol. 80, 189–193 (2001).
49. Wiegand, K. C. et al. ARID1A mutations in endometriosis-associated ovariancarcinomas. N. Engl. J. Med. 363, 1532–1543 (2010).
50. Kuo, K. T. et al. Frequent activating mutations of PIK3CA in ovarian clear cellcarcinoma. Am. J. Pathol. 174, 1597–1601 (2009).
51. Cuatrecasas, M., Villanueva, A., Matias-Guiu, X. & Prat, J. K-ras mutations inmucinous ovarian tumors: a clinicopathologic and molecular study of 95 cases.Cancer 79, 1581–1586 (1997).
Supplementary Information is linked to the online version of the paper atwww.nature.com/nature.
Acknowledgements We thank J. Palchik, A. Mirick and Julia Zhang for administrativecoordination of TCGA activities. This work was supported by the following grants fromthe USA National Institutes of Health: U54HG003067, U54HG003079,U54HG003273, U24CA126543, U24CA126544, U24CA126546, U24CA126551,U24CA126554, U24CA126561, U24CA126563, U24CA143840, U24CA143882,U24CA143731, U24CA143835, U24CA143845, U24CA143858, U24CA144025,U24CA143882, U24CA143866, U24CA143867, U24CA143848, U24CA143843 andR21CA135877.
Author Contributions The TCGA research network contributed collectively to thisstudy. Biospecimens were provided by the tissue source sites and processed by thebiospecimen core resource. Data generation and analyses were performed by thegenome sequencing centres, cancer genome characterization centres and genomedata analysis centres. All data were released through the data coordinating centre.Project activities were coordinated by the NCI and NHGRI project teams. We alsoacknowledge the following TCGA investigators who contributed substantively to thewriting of this manuscript: P.T.S. (project leader); S.G., G.G., J.W.G. and E.R.M. (writingteam); A.K. (databases); L.D., K.C., D.A.W., M.D.M., M.S.L., G.G., D.C.K., A.S., C. Sougnez,N.D., Q.Z., C.K., M.C.W., B.R., R.K., H.C., D.V., Jinghui Zhang., J.W.W., D.K. and G.B.M.(mutations); G.G., C.H.M., M.I., A.H.R., W.W., J. Zhu, H.B., J.L., S.L.C., M.S.L., N.S., A.O.,B.A.W., J.W.G. and M.M. (copy number); P.W.L., H.S. and D.J.W. (methylation); R.G.W.V.,C.J.C., H.Z., D.A.L., V.W., K.A.H., J.N.W., E.P., A.B. and M.B. (expression); D.N.H., S.M., Y.D.,P.H.G., D.A.L., N.S., R.S. and A.K.S. (miRNA); C. Sander, E.C., N.S., G.C., B.S.T., D.A.L., Y.X.,D.H., J.M.S., C.J.V., S.C.B., B.J.R., F.V., P.W.L. and H.S. (pathways); S.B.B., L.C., R.A.G., R.K.,M.L., E.S.L., M.M., R.M.M., C.M.P. and R.K.W. (general).
Author Information Sequence information reported here has been submitted todbGaPunder accessionnumberPHS000178. Reprints andpermissions information isavailable at www.nature.com/reprints. The authors declare no competing financialinterests. Readers are welcome to comment on the online version of this article atwww.nature.com/nature. Correspondence and requests for materials should beaddressed to P.T.S. ([email protected]).
The Cancer Genome Atlas Research Network (Participants are arranged by area ofcontribution and then by institution.)
Disease working group and tissue source sites D. Bell1, A. Berchuck2,3, M. Birrer4,5, J.Chien6, D. W. Cramer7, F. Dao8, R. Dhir9, P. DiSaia10, H. Gabra11, P. Glenn12, A. K.Godwin13, J. Gross14, L. Hartmann15, M. Huang16, D. G. Huntsman17, M. Iacocca18, M.Imielinski5, S. Kalloger17, B. Y.Karlan14,19, D.A. Levine8,G.B.Mills20, 21, C.Morrison22,23,D. Mutch24, N. Olvera8, S. Orsulic14, K. Park25, N. Petrelli26, B. Rabeno18, J. S. Rader27, B.I. Sikic28, K. Smith-McCune12, A. K. Sood29,30, D. Bowtell31, R. Penny32, J. R. Testa33
Genome sequencing centres: Baylor College of Medicine K. Chang34, H. H. Dinh34, J.A. Drummond34, G. Fowler34, P. Gunaratne34, A. C. Hawes34, C. L. Kovar34, L. R. Lewis34,M.B.Morgan34, I. F.Newsham34, J. Santibanez34, J.G.Reid34, L.R. Trevino34, Y.-Q.Wu34,M. Wang34, D. M. Muzny34, D. A. Wheeler34, R. A. Gibbs34; Broad Institute G. Getz35, M.S. Lawrence35, K. Cibulskis35,36, A. Y. Sivachenko35, C. Sougnez37, D. Voet35, J.Wilkinson38, T. Bloom39, K. Ardlie35, T. Fennell40, J. Baldwin38, S. Gabriel41, E. S.Lander35,42,43; Washington University in St Louis L. Ding44, R. S. Fulton44, D. C.Koboldt44, M. D. McLellan44, T. Wylie44, J. Walker44, M. O’Laughlin44, D. J. Dooling44, L.Fulton44, R. Abbott44, N. D. Dees44, Q. Zhang44, C. Kandoth44, M. Wendl44, W.Schierding44, D. Shen44, C. C. Harris44, H. Schmidt44, J. Kalicki44, K. D. Delehaunty44, C.C. Fronick44, R. Demeter44, L. Cook44, J. W. Wallis44, L. Lin44, V. J. Magrini44, J. S.
RESEARCH ARTICLE
6 1 4 | N A T U R E | V O L 4 7 4 | 3 0 J U N E 2 0 1 1
Macmillan Publishers Limited. All rights reserved©2011
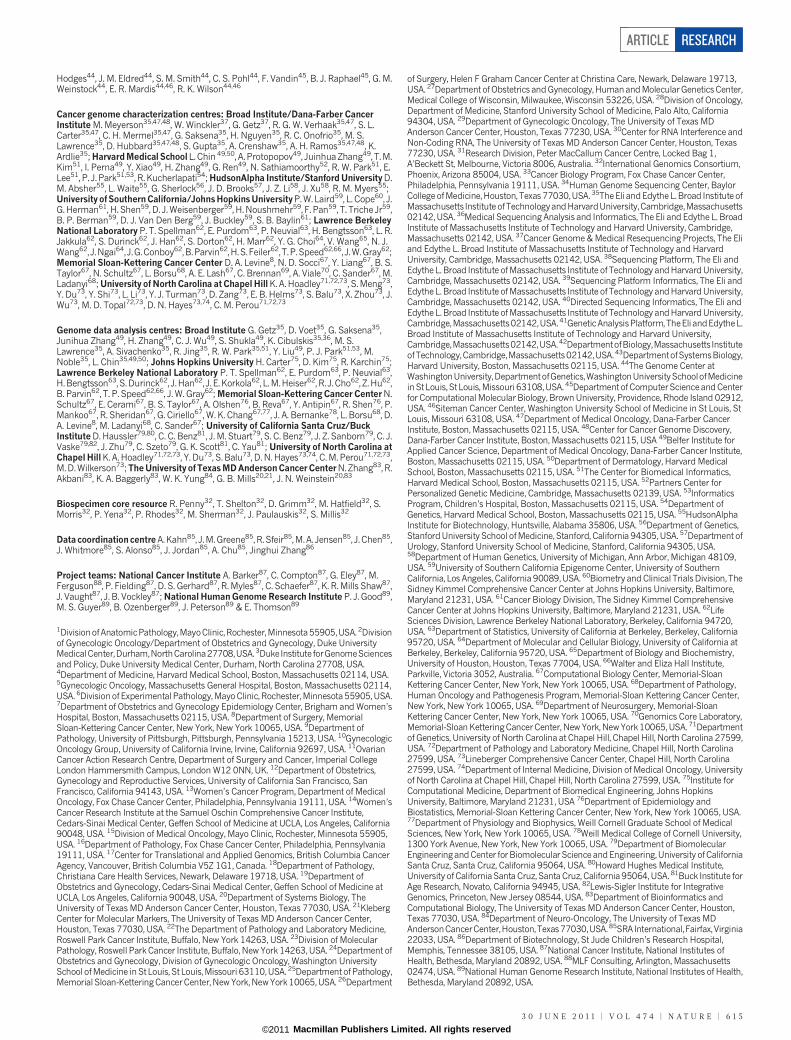
Hodges44, J. M. Eldred44, S. M. Smith44, C. S. Pohl44, F. Vandin45, B. J. Raphael45, G. M.Weinstock44, E. R. Mardis44,46, R. K. Wilson44,46
Cancer genome characterization centres: Broad Institute/Dana-Farber CancerInstitute M. Meyerson35,47,48, W. Winckler37, G. Getz37, R. G. W. Verhaak35,47, S. L.Carter35,47, C. H. Mermel35,47, G. Saksena35, H. Nguyen35, R. C. Onofrio35, M. S.Lawrence35, D. Hubbard35,47,48, S. Gupta35, A. Crenshaw35, A. H. Ramos35,47,48, K.Ardlie35; Harvard Medical School L. Chin 49,50, A. Protopopov49, Juinhua Zhang49, T. M.Kim51, I. Perna49, Y. Xiao49, H. Zhang49, G. Ren49, N. Sathiamoorthy52, R. W. Park51, E.Lee51, P. J. Park51,53, R. Kucherlapati54; HudsonAlpha Institute/Stanford University D.M. Absher55, L. Waite55, G. Sherlock56, J. D. Brooks57, J. Z. Li58, J. Xu58, R. M. Myers55;University of Southern California/Johns Hopkins University P.W. Laird59, L. Cope60, J.G. Herman61, H. Shen59, D. J. Weisenberger59, H. Noushmehr59, F. Pan59, T. Triche Jr59,B. P. Berman59, D. J. Van Den Berg59, J. Buckley59, S. B. Baylin61; Lawrence BerkeleyNational Laboratory P. T. Spellman62, E. Purdom63, P. Neuvial63, H. Bengtsson63, L. R.Jakkula62, S. Durinck62, J. Han62, S. Dorton62, H. Marr62, Y. G. Choi64, V. Wang65, N. J.Wang62, J.Ngai64, J.G.Conboy62,B.Parvin62,H.S.Feiler62,T.P.Speed62,66, J.W.Gray62;Memorial Sloan-Kettering Cancer Center D. A. Levine8, N. D. Socci67, Y. Liang67, B. S.Taylor67, N. Schultz67, L. Borsu68, A. E. Lash67, C. Brennan69, A. Viale70, C. Sander67, M.Ladanyi68; University of North Carolina at Chapel Hill K. A. Hoadley71,72,73, S. Meng73,Y. Du73, Y. Shi73, L. Li73, Y. J. Turman73, D. Zang73, E. B. Helms73, S. Balu73, X. Zhou73, J.Wu73, M. D. Topal72,73, D. N. Hayes73,74, C. M. Perou71,72,73
Genome data analysis centres: Broad Institute G. Getz35, D. Voet35, G. Saksena35,Junihua Zhang49, H. Zhang49, C. J. Wu49, S. Shukla49, K. Cibulskis35,36, M. S.Lawrence35, A. Sivachenko35, R. Jing35, R. W. Park35,51, Y. Liu49, P. J. Park51,53, M.Noble35, L. Chin35,49,50; Johns Hopkins University H. Carter75, D. Kim75, R. Karchin75;Lawrence Berkeley National Laboratory P. T. Spellman62, E. Purdom63, P. Neuvial63,H.Bengtsson63, S.Durinck62, J.Han62, J. E. Korkola62, L. M.Heiser62, R. J.Cho62, Z. Hu62,B. Parvin62, T. P. Speed62,66, J. W. Gray62; Memorial Sloan-Kettering Cancer Center N.Schultz67, E. Cerami67, B. S. Taylor67, A. Olshen76, B. Reva67, Y. Antipin67, R. Shen76, P.Mankoo67, R. Sheridan67, G. Ciriello67, W. K. Chang67,77, J. A. Bernanke78, L. Borsu68, D.A. Levine8, M. Ladanyi68, C. Sander67; University of California Santa Cruz/BuckInstitute D. Haussler79,80, C. C. Benz81, J. M. Stuart79, S. C. Benz79, J. Z. Sanborn79, C. J.Vaske79,82, J. Zhu79, C. Szeto79, G. K. Scott81, C. Yau81; University of North Carolina atChapel Hill K. A. Hoadley71,72,73, Y. Du73, S. Balu73, D. N. Hayes73,74, C. M. Perou71,72,73,M.D. Wilkerson73; The University of Texas MD Anderson Cancer Center N. Zhang83, R.Akbani83, K. A. Baggerly83, W. K. Yung84, G. B. Mills20,21, J. N. Weinstein20,83
Biospecimen core resource R. Penny32, T. Shelton32, D. Grimm32, M. Hatfield32, S.Morris32, P. Yena32, P. Rhodes32, M. Sherman32, J. Paulauskis32, S. Millis32
Data coordination centre A.Kahn85, J.M. Greene85, R. Sfeir85, M.A. Jensen85, J. Chen85,J. Whitmore85, S. Alonso85, J. Jordan85, A. Chu85, Jinghui Zhang86
Project teams: National Cancer Institute A. Barker87, C. Compton87, G. Eley87, M.Ferguson88, P. Fielding87, D. S. Gerhard87, R. Myles87, C. Schaefer87, K. R. Mills Shaw87,J. Vaught87, J. B. Vockley87; National Human Genome Research Institute P. J. Good89,M. S. Guyer89, B. Ozenberger89, J. Peterson89 & E. Thomson89
1DivisionofAnatomicPathology,MayoClinic, Rochester,Minnesota55905,USA. 2Divisionof Gynecologic Oncology/Department of Obstetrics and Gynecology, Duke UniversityMedicalCenter,Durham,NorthCarolina27708,USA.3Duke Institute forGenomeSciencesand Policy, Duke University Medical Center, Durham, North Carolina 27708, USA.4Department of Medicine, Harvard Medical School, Boston, Massachusetts 02114, USA.5Gynecologic Oncology, Massachusetts General Hospital, Boston, Massachusetts 02114,USA. 6Division of Experimental Pathology, Mayo Clinic, Rochester, Minnesota 55905, USA.7Department of Obstetrics and Gynecology Epidemiology Center, Brigham and Women’sHospital, Boston, Massachusetts 02115, USA. 8Department of Surgery, MemorialSloan-Kettering Cancer Center, New York, New York 10065, USA. 9Department ofPathology, University of Pittsburgh, Pittsburgh, Pennsylvania 15213, USA. 10GynecologicOncology Group, University of California Irvine, Irvine, California 92697, USA. 11OvarianCancer Action Research Centre, Department of Surgery and Cancer, Imperial CollegeLondon Hammersmith Campus, London W12 0NN, UK. 12Department of Obstetrics,Gynecology and Reproductive Services, University of California San Francisco, SanFrancisco, California 94143, USA. 13Women’s Cancer Program, Department of MedicalOncology, Fox Chase Cancer Center, Philadelphia, Pennsylvania 19111, USA. 14Women’sCancer Research Institute at the Samuel Oschin Comprehensive Cancer Institute,Cedars-Sinai Medical Center, Geffen School of Medicine at UCLA, Los Angeles, California90048, USA. 15Division of Medical Oncology, Mayo Clinic, Rochester, Minnesota 55905,USA. 16Department of Pathology, Fox Chase Cancer Center, Philadelphia, Pennsylvania19111, USA. 17Center for Translational and Applied Genomics, British Columbia CancerAgency, Vancouver, British Columbia V5Z 1G1, Canada. 18Department of Pathology,Christiana Care Health Services, Newark, Delaware 19718, USA. 19Department ofObstetrics and Gynecology, Cedars-Sinai Medical Center, Geffen School of Medicine atUCLA, Los Angeles, California 90048, USA. 20Department of Systems Biology, TheUniversity of Texas MD Anderson Cancer Center, Houston, Texas 77030, USA. 21KlebergCenter for Molecular Markers, The University of Texas MD Anderson Cancer Center,Houston, Texas 77030, USA. 22The Department of Pathology and Laboratory Medicine,Roswell Park Cancer Institute, Buffalo, New York 14263, USA. 23Division of MolecularPathology, Roswell Park Cancer Institute, Buffalo, New York 14263, USA. 24Department ofObstetrics and Gynecology, Division of Gynecologic Oncology, Washington UniversitySchool of Medicine in St Louis, St Louis, Missouri 63110, USA. 25Department of Pathology,Memorial Sloan-Kettering Cancer Center, New York, New York 10065, USA. 26Department
of Surgery, Helen F Graham Cancer Center at Christina Care, Newark, Delaware 19713,USA. 27Department of Obstetrics and Gynecology, Human and Molecular GeneticsCenter,Medical College of Wisconsin, Milwaukee, Wisconsin 53226, USA. 28Division of Oncology,Department of Medicine, Stanford University School of Medicine, Palo Alto, California94304, USA. 29Department of Gynecologic Oncology, The University of Texas MDAnderson Cancer Center, Houston, Texas 77230, USA. 30Center for RNA Interference andNon-Coding RNA, The University of Texas MD Anderson Cancer Center, Houston, Texas77230, USA. 31Research Division, Peter MacCallum Cancer Centre, Locked Bag 1,A’Beckett St, Melbourne, Victoria 8006, Australia. 32International Genomics Consortium,Phoenix, Arizona 85004, USA. 33Cancer Biology Program, Fox Chase Cancer Center,Philadelphia, Pennsylvania 19111, USA. 34Human Genome Sequencing Center, BaylorCollege of Medicine, Houston, Texas 77030,USA. 35The Eli andEdytheL. Broad Institute ofMassachusetts Institute ofTechnologyandHarvardUniversity,Cambridge,Massachusetts02142, USA. 36Medical Sequencing Analysis and Informatics, The Eli and Edythe L. BroadInstitute of Massachusetts Institute of Technology and Harvard University, Cambridge,Massachusetts 02142, USA. 37Cancer Genome & Medical Resequencing Projects, The Eliand Edythe L. Broad Institute of Massachusetts Institute of Technology and HarvardUniversity, Cambridge, Massachusetts 02142, USA. 38Sequencing Platform, The Eli andEdythe L. Broad Institute of Massachusetts Institute of Technology and Harvard University,Cambridge, Massachusetts 02142, USA. 39Sequencing Platform Informatics, The Eli andEdythe L. Broad Institute of Massachusetts Institute of Technology and Harvard University,Cambridge, Massachusetts 02142, USA. 40Directed Sequencing Informatics, The Eli andEdythe L. Broad Institute of Massachusetts Institute of Technology and Harvard University,Cambridge,Massachusetts02142,USA. 41GeneticAnalysisPlatform,TheEli andEdytheL.Broad Institute of Massachusetts Institute of Technology and Harvard University,Cambridge,Massachusetts02142,USA.42DepartmentofBiology,Massachusetts InstituteofTechnology,Cambridge,Massachusetts02142,USA. 43DepartmentofSystemsBiology,Harvard University, Boston, Massachusetts 02115, USA. 44The Genome Center atWashingtonUniversity,DepartmentofGenetics,WashingtonUniversitySchoolofMedicinein St Louis, St Louis, Missouri 63108,USA. 45Department of Computer Science and Centerfor Computational Molecular Biology, Brown University, Providence, Rhode Island 02912,USA. 46Siteman Cancer Center, Washington University School of Medicine in St Louis, StLouis, Missouri 63108, USA. 47Department of Medical Oncology, Dana-Farber CancerInstitute, Boston, Massachusetts 02115, USA. 48Center for Cancer Genome Discovery,Dana-Farber Cancer Institute, Boston, Massachusetts 02115, USA 49Belfer Institute forApplied Cancer Science, Department of Medical Oncology, Dana-Farber Cancer Institute,Boston, Massachusetts 02115, USA. 50Department of Dermatology, Harvard MedicalSchool, Boston, Massachusetts 02115, USA. 51The Center for Biomedical Informatics,Harvard Medical School, Boston, Massachusetts 02115, USA. 52Partners Center forPersonalized Genetic Medicine, Cambridge, Massachusetts 02139, USA. 53InformaticsProgram, Children’s Hospital, Boston, Massachusetts 02115, USA. 54Department ofGenetics, Harvard Medical School, Boston, Massachusetts 02115, USA. 55HudsonAlphaInstitute for Biotechnology, Huntsville, Alabama 35806, USA. 56Department of Genetics,Stanford University School of Medicine, Stanford, California 94305, USA. 57Department ofUrology, Stanford University School of Medicine, Stanford, California 94305, USA.58Department of Human Genetics, University of Michigan, Ann Arbor, Michigan 48109,USA. 59University of Southern California Epigenome Center, University of SouthernCalifornia, Los Angeles, California 90089, USA. 60Biometry and Clinical Trials Division, TheSidney Kimmel Comprehensive Cancer Center at Johns Hopkins University, Baltimore,Maryland 21231, USA. 61Cancer Biology Division, The Sidney Kimmel ComprehensiveCancer Center at Johns Hopkins University, Baltimore, Maryland 21231, USA. 62LifeSciences Division, Lawrence Berkeley National Laboratory, Berkeley, California 94720,USA. 63Department of Statistics, University of California at Berkeley, Berkeley, California95720, USA. 64Department of Molecular and Cellular Biology, University of California atBerkeley, Berkeley, California 95720, USA. 65Department of Biology and Biochemistry,University of Houston, Houston, Texas 77004, USA. 66Walter and Eliza Hall Institute,Parkville, Victoria 3052, Australia. 67Computational Biology Center, Memorial-SloanKettering Cancer Center, New York, New York 10065, USA. 68Department of Pathology,Human Oncology and Pathogenesis Program, Memorial-Sloan Kettering Cancer Center,New York, New York 10065, USA. 69Department of Neurosurgery, Memorial-SloanKettering Cancer Center, New York, New York 10065, USA. 70Genomics Core Laboratory,Memorial-Sloan Kettering Cancer Center, New York, New York 10065, USA. 71Departmentof Genetics, University of North Carolina at Chapel Hill, Chapel Hill, North Carolina 27599,USA. 72Department of Pathology and Laboratory Medicine, Chapel Hill, North Carolina27599, USA. 73Lineberger Comprehensive Cancer Center, Chapel Hill, North Carolina27599, USA. 74Department of Internal Medicine, Division of Medical Oncology, Universityof North Carolina at Chapel Hill, Chapel Hill, North Carolina 27599, USA. 75Institute forComputational Medicine, Department of Biomedical Engineering, Johns HopkinsUniversity, Baltimore, Maryland 21231, USA 76Department of Epidemiology andBiostatistics, Memorial-Sloan Kettering Cancer Center, New York, New York 10065, USA.77Department of Physiology and Biophysics, Weill Cornell Graduate School of MedicalSciences, New York, New York 10065, USA. 78Weill Medical College of Cornell University,1300 York Avenue, New York, New York 10065, USA. 79Department of BiomolecularEngineeringand Center for Biomolecular Science and Engineering,University ofCaliforniaSanta Cruz, Santa Cruz, California 95064, USA. 80Howard Hughes Medical Institute,University of California Santa Cruz, Santa Cruz, California 95064, USA. 81Buck Institute forAge Research, Novato, California 94945, USA. 82Lewis-Sigler Institute for IntegrativeGenomics, Princeton, New Jersey 08544, USA. 83Department of Bioinformatics andComputational Biology, The University of Texas MD Anderson Cancer Center, Houston,Texas 77030, USA. 84Department of Neuro-Oncology, The University of Texas MDAndersonCancerCenter,Houston,Texas77030,USA.85SRA International,Fairfax, Virginia22033, USA. 86Department of Biotechnology, St Jude Children’s Research Hospital,Memphis, Tennessee 38105, USA. 87National Cancer Institute, National Institutes ofHealth, Bethesda, Maryland 20892, USA. 88MLF Consulting, Arlington, Massachusetts02474, USA. 89National Human Genome Research Institute, National Institutes of Health,Bethesda, Maryland 20892, USA.
ARTICLE RESEARCH
3 0 J U N E 2 0 1 1 | V O L 4 7 4 | N A T U R E | 6 1 5
Macmillan Publishers Limited. All rights reserved©2011


![Inflammation and cancer: How hot is the link? · carcinoma [30], colon carcinoma, lung carcinoma, squamous cell carcinoma, pancreatic cancer [31,32], ovarian carcinoma biochemical](https://img.pdfslide.us/doc/110x75/5fcdd6c81c76a34db570e7e6/iniammation-and-cancer-how-hot-is-the-link-carcinoma-30-colon-carcinoma.jpg)