Embed Size (px)
Citation preview

Integrated Exploration Platform: Software Tools for Multidata Visualisation and
Integrated Interpretation.
The Centre for Exploration Targeting (CET) (Jason C. Wong, Eun-Jung Holden, Peter Kovesi, David Nathan, Daniel Wedge)
The Geological Survey of Western Australia (GSWA) (Ian Tyler, Klaus Gessner, Ruth Murdie)

Talk Outline
i. Launch: Integrated Exploration Platform. ii. Overview of the IEP. Multidata Visualisation Tools Feature Evidence Feedback Tools
iii. ArcGIS Workflow with the IEP. iv. On-going Work. v. Questions.

The Launch of the IEP First Public Version - Free
The first public version of the IEP is available today http://www.WAExplorationPlatform.com (Geolocked to datasets within WA).
Software toolset for ArcGIS with a novel computer-assisted and interpreter-driven approach to integrated multidata interpretation.
Will continue to evolve based on industry feedback and suggestions, in order to continue in adapting to the needs of the industry.
Sponsored by the Geological Survey of WA (GSWA) in the Exploration Incentive Scheme (EIS), and Australian Research Council (ARC) linkage grant (LP140100267).

1. Visualisation tools to support multiple 2D and 3D data (A suite of blenders).
2. Intelligent interpretation support tools (feature evidence toward quantifying confidence).
Thomas, J., Cook, K.: Illuminating the Path: Research and Development Agenda for Visual Analytics. IEEE-Press (2005)
The Integrated Exploration Platform
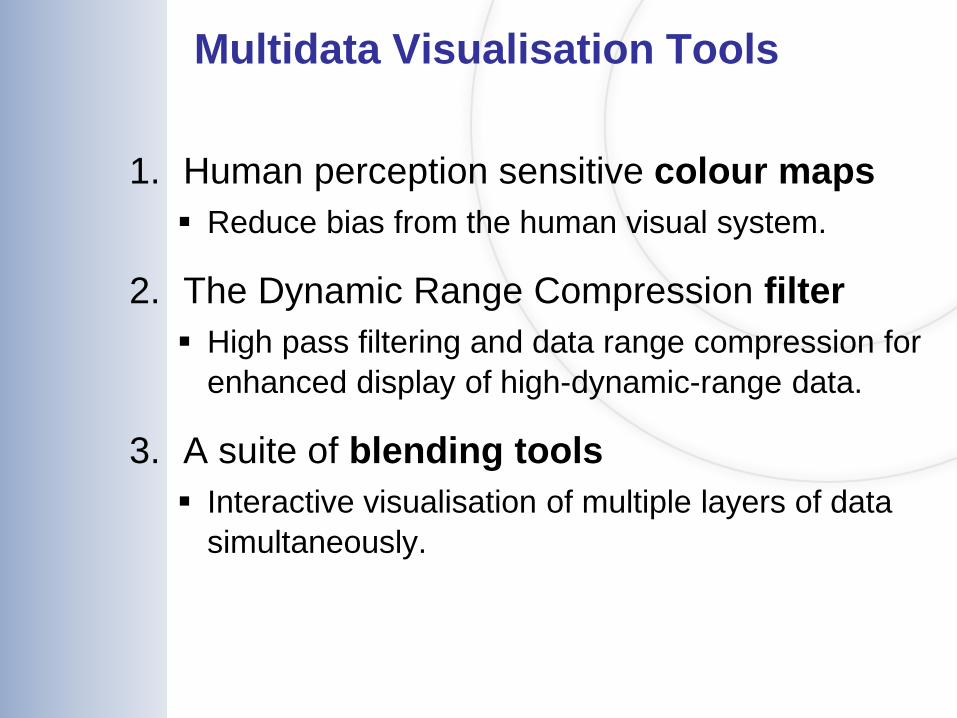
Multidata Visualisation Tools
1. Human perception sensitive colour maps Reduce bias from the human visual system.
2. The Dynamic Range Compression filter High pass filtering and data range compression for
enhanced display of high-dynamic-range data.
3. A suite of blending tools Interactive visualisation of multiple layers of data
simultaneously.

1. Visualisation Tools in the IEP Human Perception Sensitive Colour Maps
A default rainbow colour map Vs Perceptually uniform map
Kovesi, P. 2015. [Good Colour Maps: How to Design them]

Linear Normalisation Histogram Equalisation
2. Visualisation: Working with Signal Compression
Geophysical data (e.g. magnetic data), can have a large range of values that cannot be displayed natively on computer screens – Signal Compression.

Dynamic Range Compression (Kovesi, P. 2012)
Histogram Equalisation
2. Visualisation: Working with Signal Compression

Kovesi, P. 2012. [Phase Preserving Tone Mapping of Non-Photographic High Dynamic Range Images]
Frequency Cut-off

frequencies
Magnetic Data Gravity Data Magnetic data courtesy of Fugro Airborne Surveys Pty Ltd.
3. Visualisation Tools in the IEP Blending DRC Filter Results

Barycentric Triangle Blender
Circle Blender Clique Blender
Linear Blender
Bilinear Blender
3. Visualisation Tools in the IEP 2D Data Blenders
Kovesi et al. 2014. [Interactive Multi-Image Blending for Visualization and Interpretation]

3. IEP 2D Data Blenders

Single Volume Blender: Sphere Data Mode
Dual Volume Blender: Slice Similarity Mode
Cross-section Data Blender
3. Visualisation Tools in the IEP 3D Data Blenders
3. IEP 3D Data Blenders

1. Visualisation tools to support multiple 2D and 3D data (A suite of blenders).
2. Intelligent interpretation support tools (feature evidence toward quantifying confidence).
Thomas, J., Cook, K.: Illuminating the Path: Research and Development Agenda for Visual Analytics. IEEE-Press (2005)
The Integrated Exploration Platform
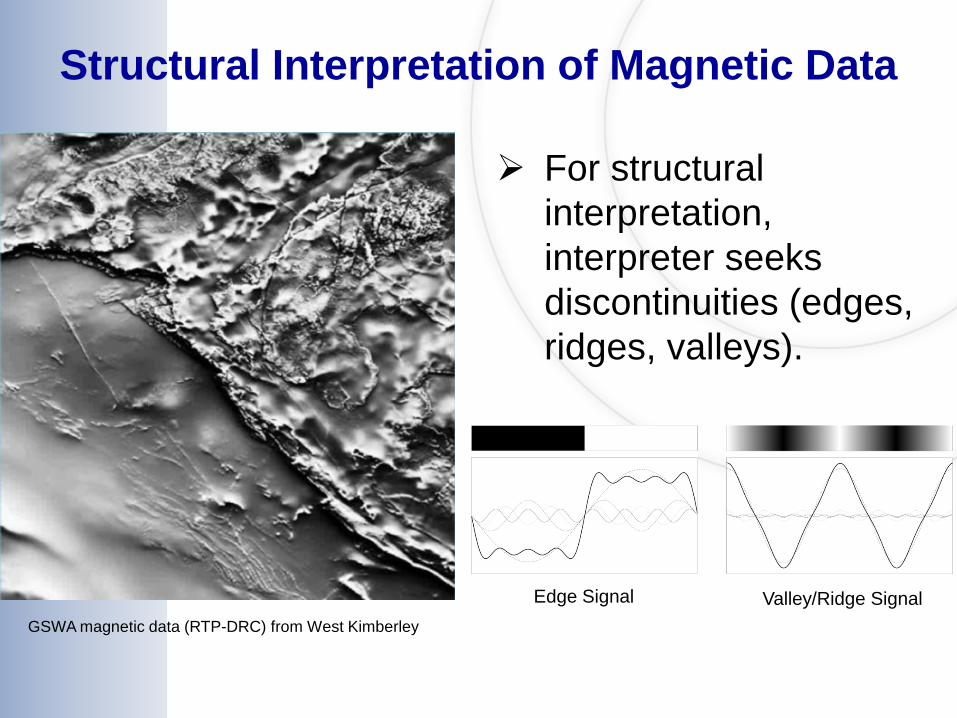
Structural Interpretation of Magnetic Data
GSWA magnetic data (RTP-DRC) from West Kimberley
For structural interpretation, interpreter seeks discontinuities (edges, ridges, valleys).
Edge Signal Valley/Ridge Signal

Ridge strength map (+ve Phase Symmetry)
Magnetic data
CET Grid Analysis Extension (for Geosoft Oasis Montaj) http://www.geosoft.com/pinfo/partners/CETgridanalysis.asp
Feature Evidence Tools in the IEP
Valley strength map (-ve Phase Symmetry)
Edge strength map (Phase Congruency)

A spell-checker equivalent for interpretation. Visual feedback on data evidence. Quantitative measure of feature evidence.
Feature Evidence Tools in the IEP Visualising Evidence
Holden et al. 2016. [Improving assessment of geological structure interpretation of magnetic data: An advanced data analytics approach]

IEP Feature Evidence Tools

Feature Evidence Tools in the IEP Using Evidence
An example of using multidata evidence to realign (in yellow) one of the original structural interpretation (red dashed lines).

ArcGIS Workflow with the IEP
Export Blends as GeoTIFFs Save Interpretations as
Shapefiles
Load GeoTIFF and grid datasets Load Interpretation Shapefiles
ArcMap
IEP

On-going Work
Improving the interface for better useability and flexibility to different workflows.
Next phase of interpretation support tools. Lithology and texture analysis.
More advanced tools dealing with 2D and 3D datasets (for example): Exporting voxel subsets. Importing 3D surfaces. Custom colour maps. Custom data stretches.

The Integrated Exploration Platform
Register and download the IEP at http://www.WAExplorationPlatform.com
Demo space with the IEP on the show floor.
Two posters on the IEP tools for visualisation and feature evidence.
Thank you.
Questions?
Special thanks to Jon Hronsky and to all Beta testers, especially: Vaclav Metelka, Mark Armstrong, Mark Lindsay. De Beers Canada. Southern Geoscience Consultants. Anglo American Canada. Rio Tinto Australia.